Embed Size (px)
Citation preview
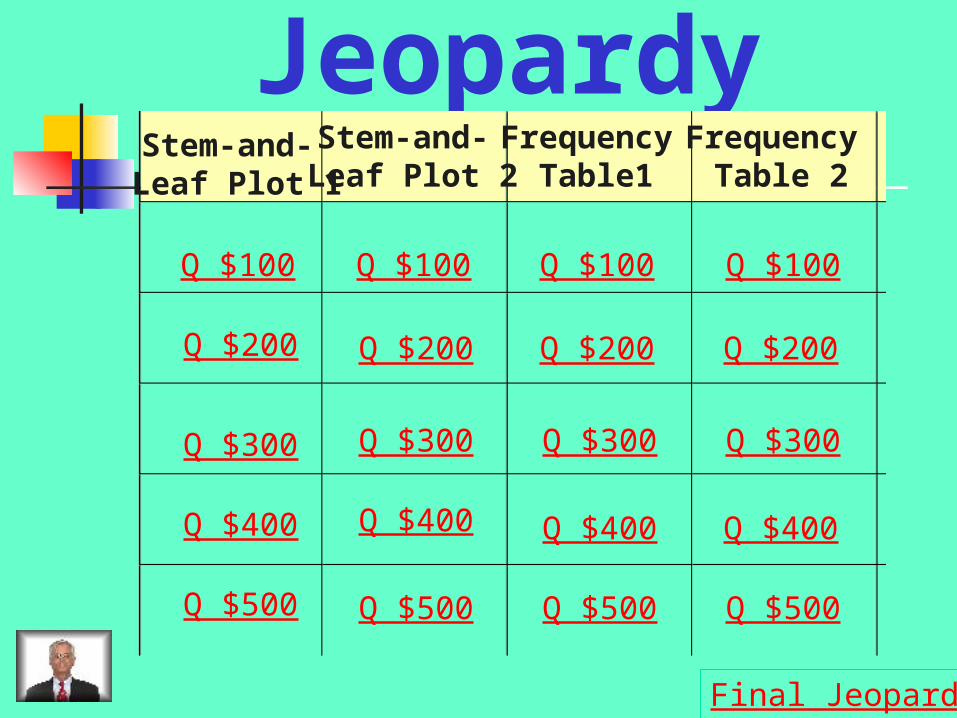
JeopardyStem-and- Leaf Plot 1
Q $100
Q $200
Q $300
Q $400
Q $500
Q $100 Q $100Q $100
Q $200 Q $200 Q $200
Q $300 Q $300 Q $300
Q $400 Q $400 Q $400
Q $500 Q $500 Q $500
Final Jeopardy
Stem-and- Leaf Plot 2
Frequency Table1
Frequency Table 2
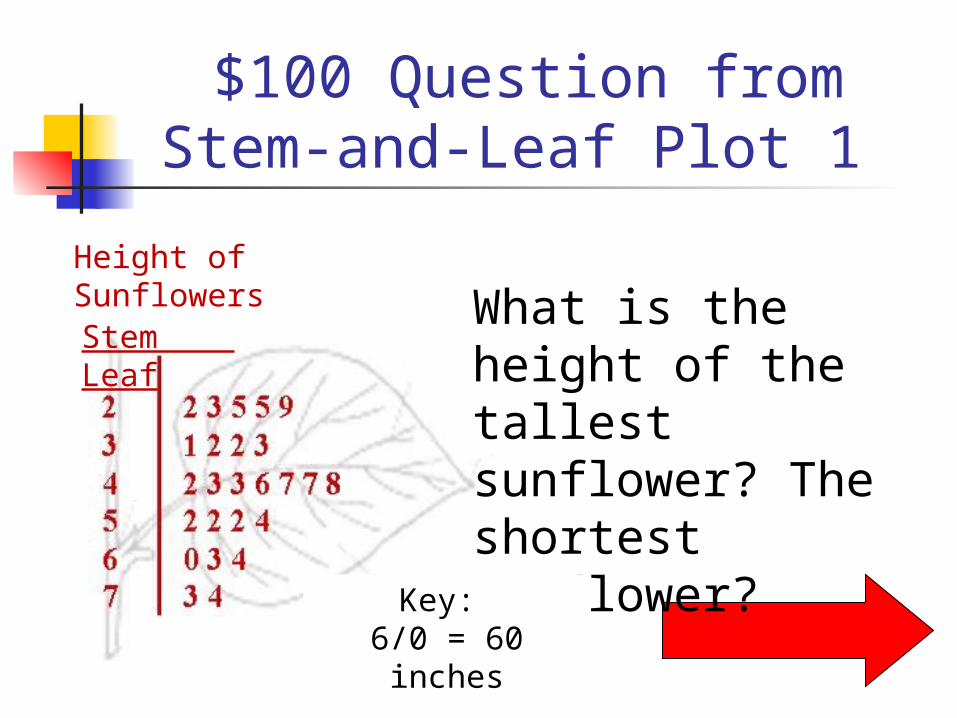
$100 Question from Stem-and-Leaf Plot 1
Stem Leaf
Height of Sunflowers
What is the height of the tallest sunflower? The shortest sunflower?
Key: 6/0 = 60 inches
$100 Answer Stem-and-Leaf Plot 1 .
Tallest = 22
Shortest = 74
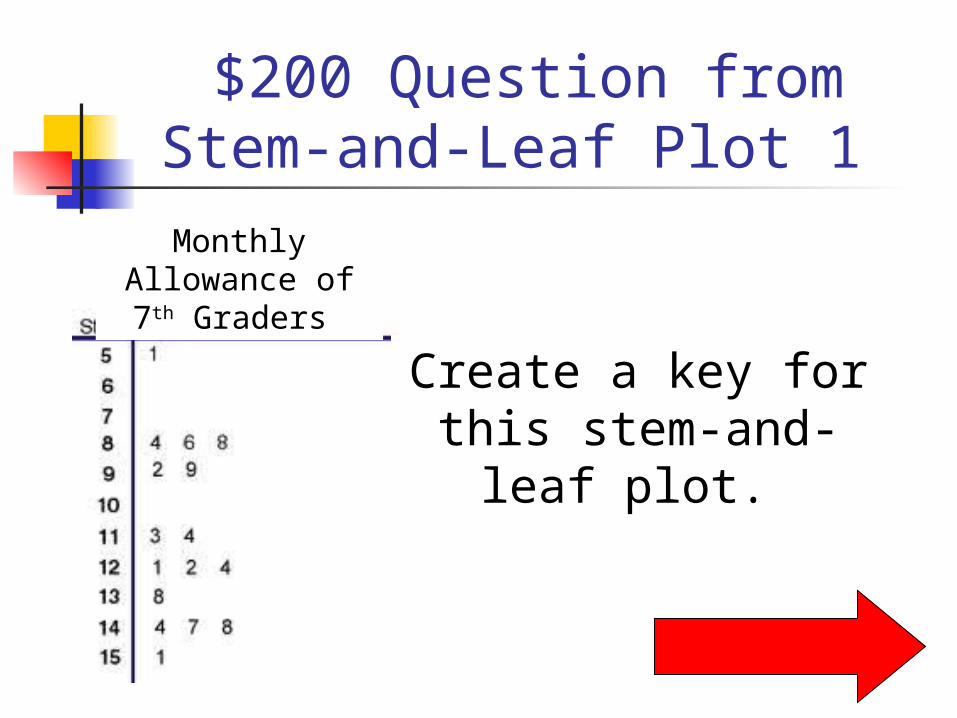
$200 Question from Stem-and-Leaf Plot 1
Monthly Allowance of 7th
Graders
Create a key for this stem-and-leaf
plot.
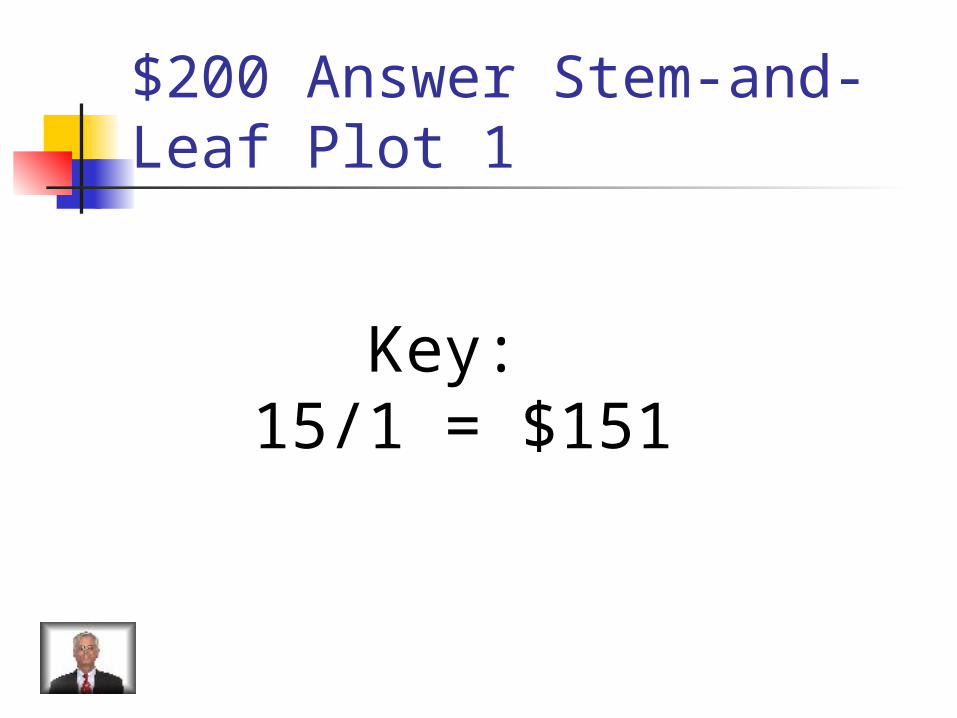
$200 Answer Stem-and-Leaf Plot 1
Key: 15/1 = $151
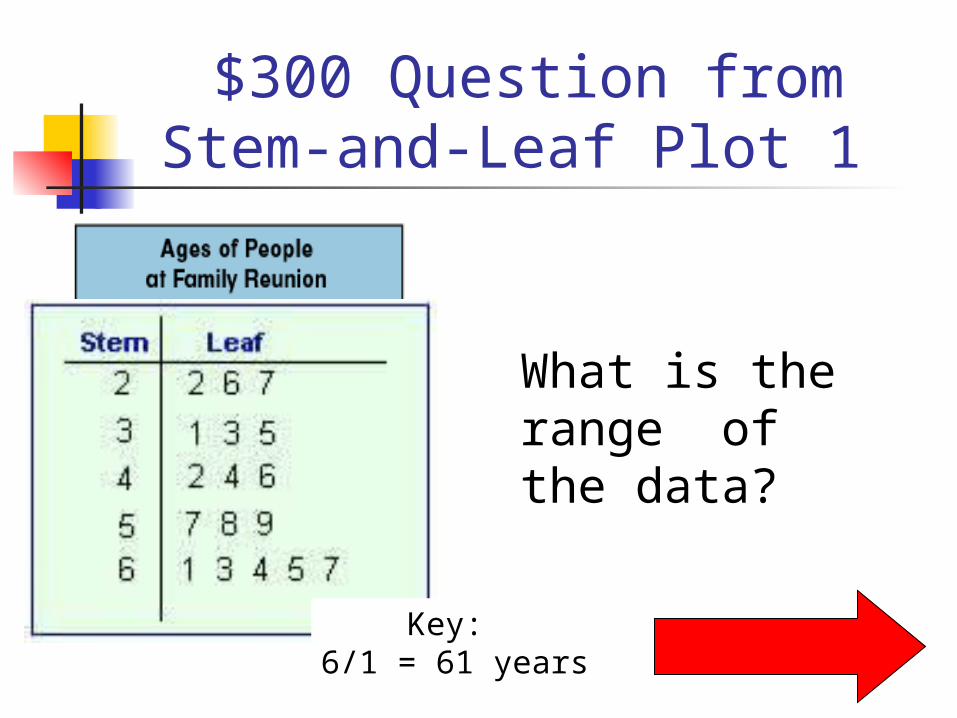
$300 Question from Stem-and-Leaf Plot 1
What is the range of the data?
Key: 6/1 = 61 years
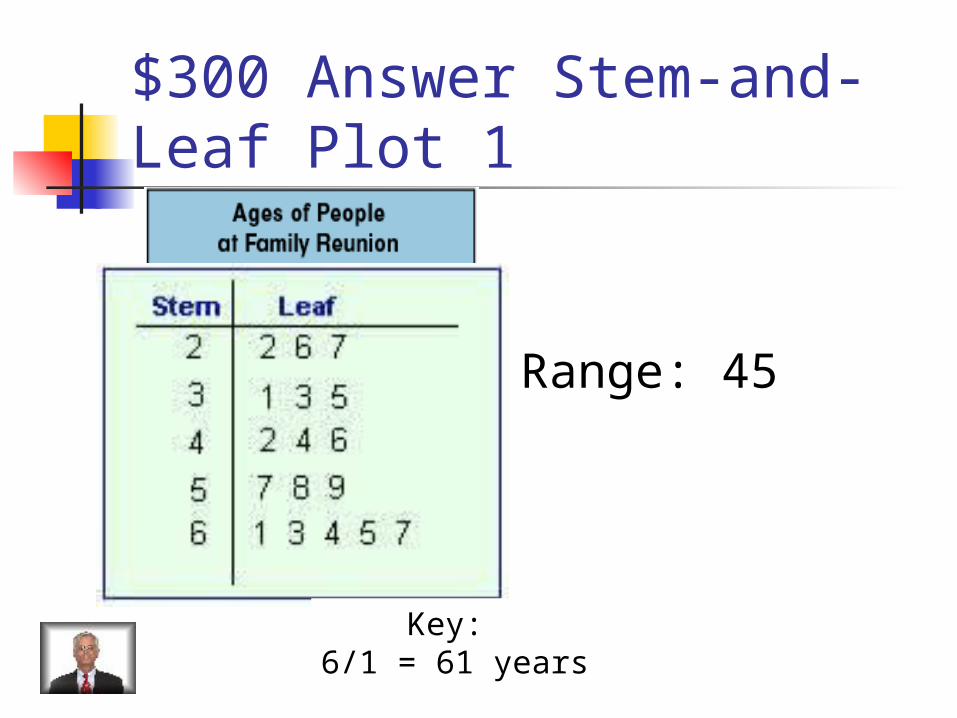
$300 Answer Stem-and-Leaf Plot 1
Range: 45
Key: 6/1 = 61 years
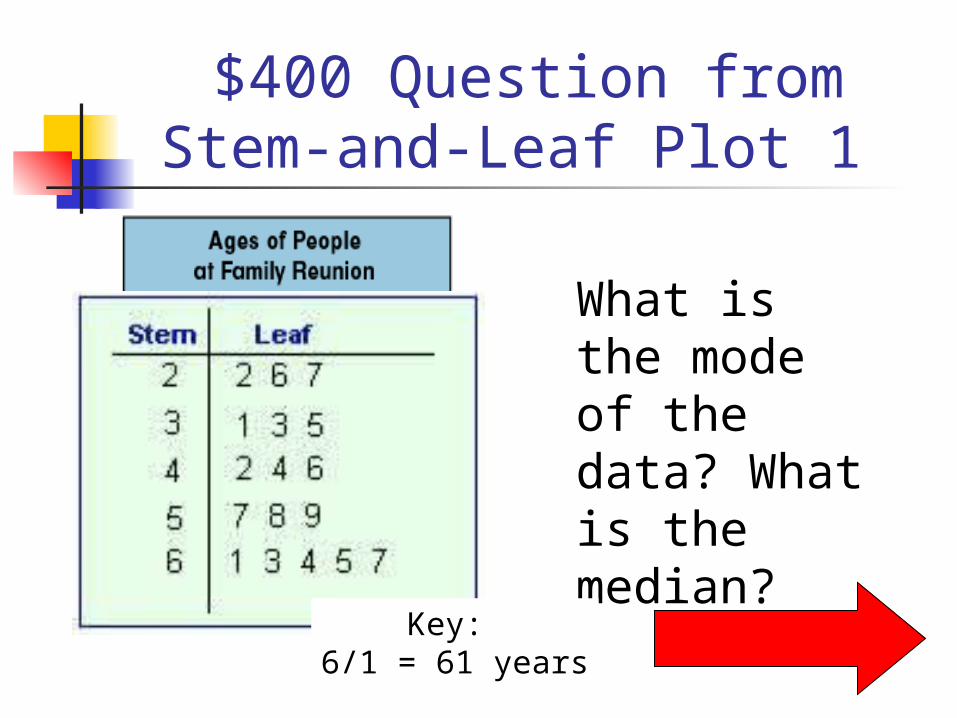
$400 Question from Stem-and-Leaf Plot 1
What is the mode of the data? What is the median?
Key: 6/1 = 61 years
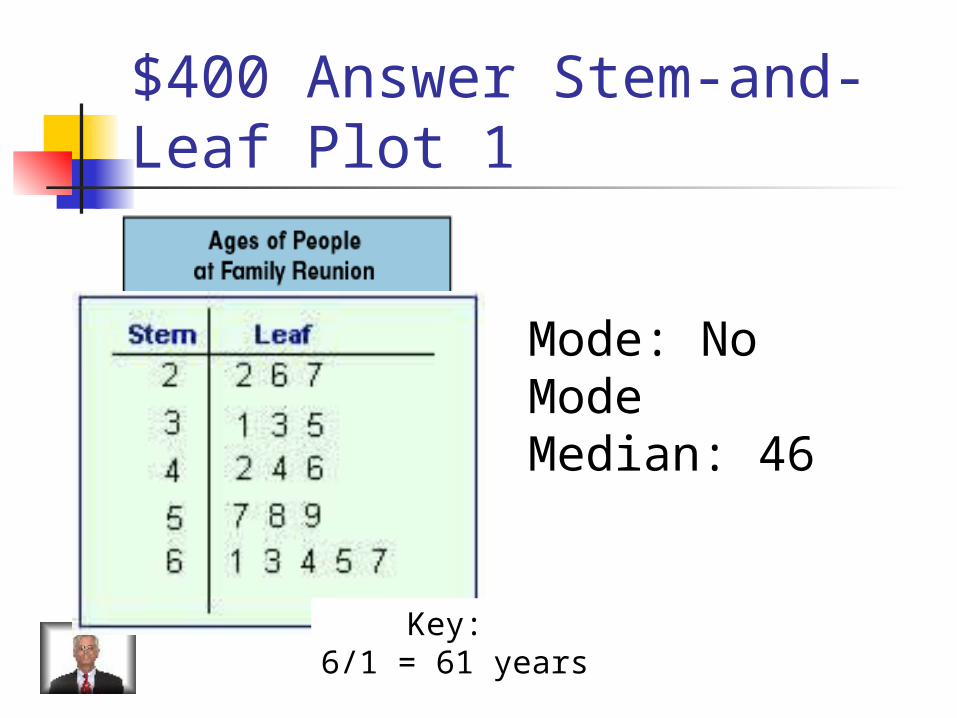
$400 Answer Stem-and-Leaf Plot 1
Mode: No ModeMedian: 46
Key: 6/1 = 61 years
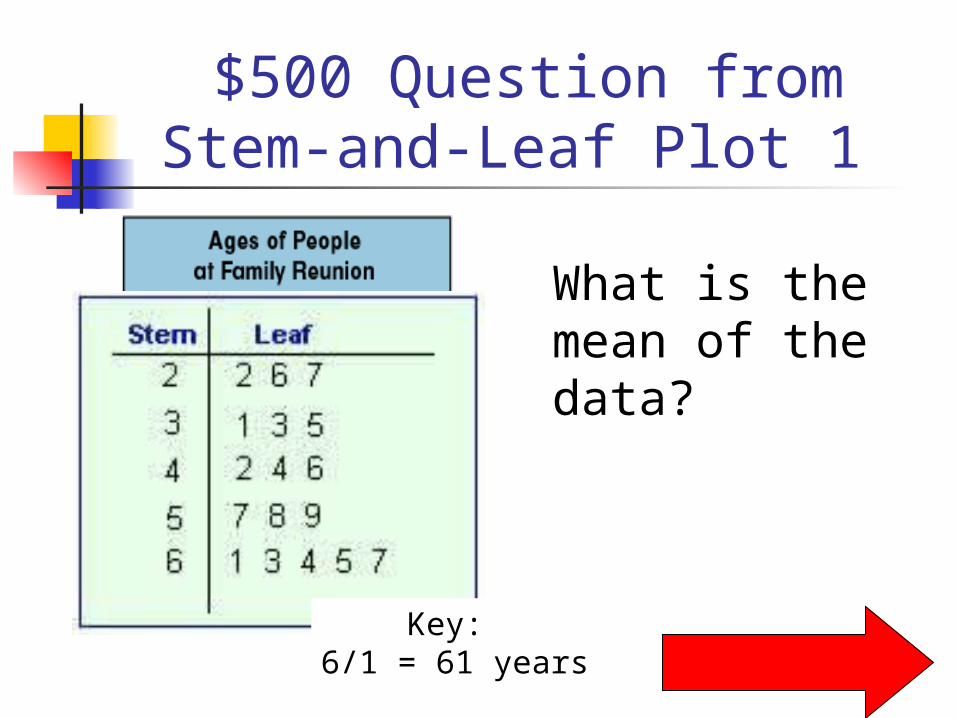
$500 Question from Stem-and-Leaf Plot 1
What is the mean of the data?
Key: 6/1 = 61 years
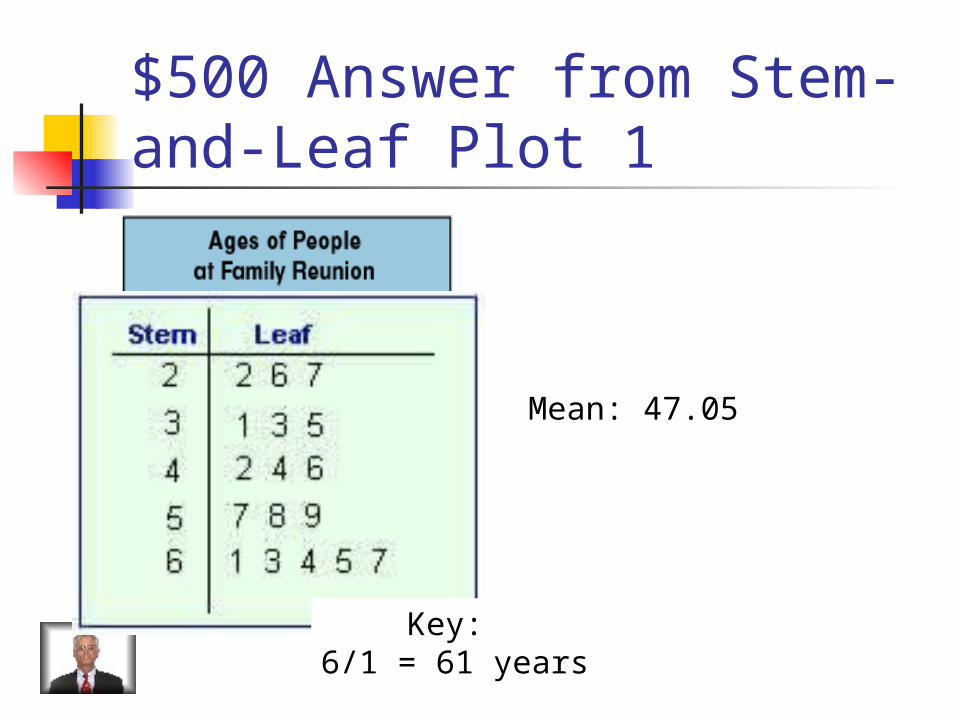
$500 Answer from Stem-and-Leaf Plot 1
Mean: 47.05
Key: 6/1 = 61 years
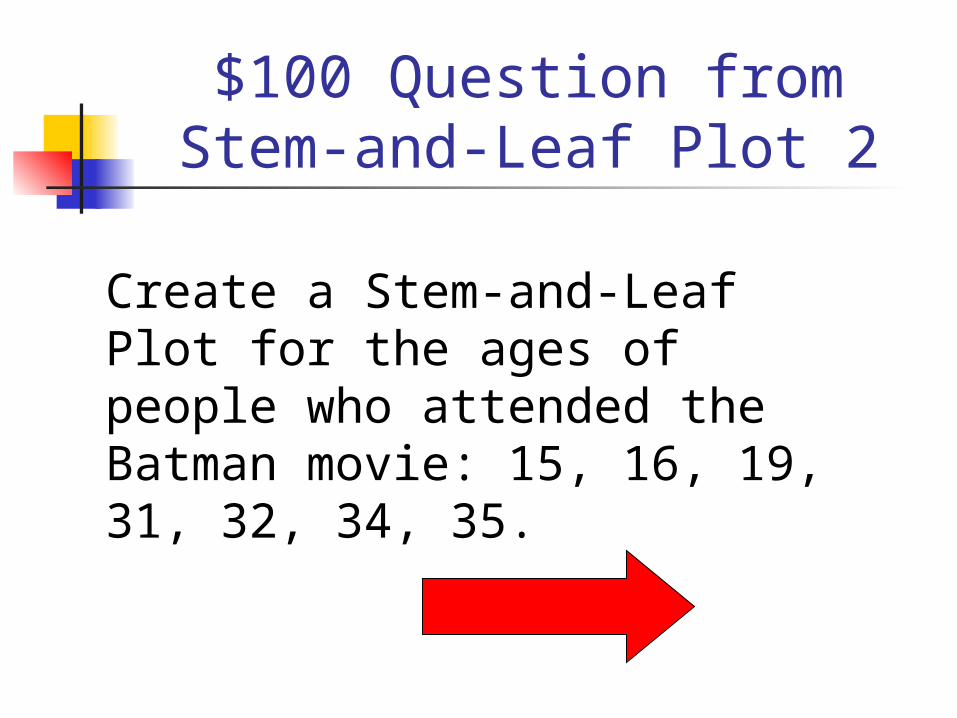
$100 Question from Stem-and-Leaf Plot 2
Create a Stem-and-Leaf Plot for the ages of people who attended the Batman movie: 15, 16, 19, 31, 32, 34, 35.
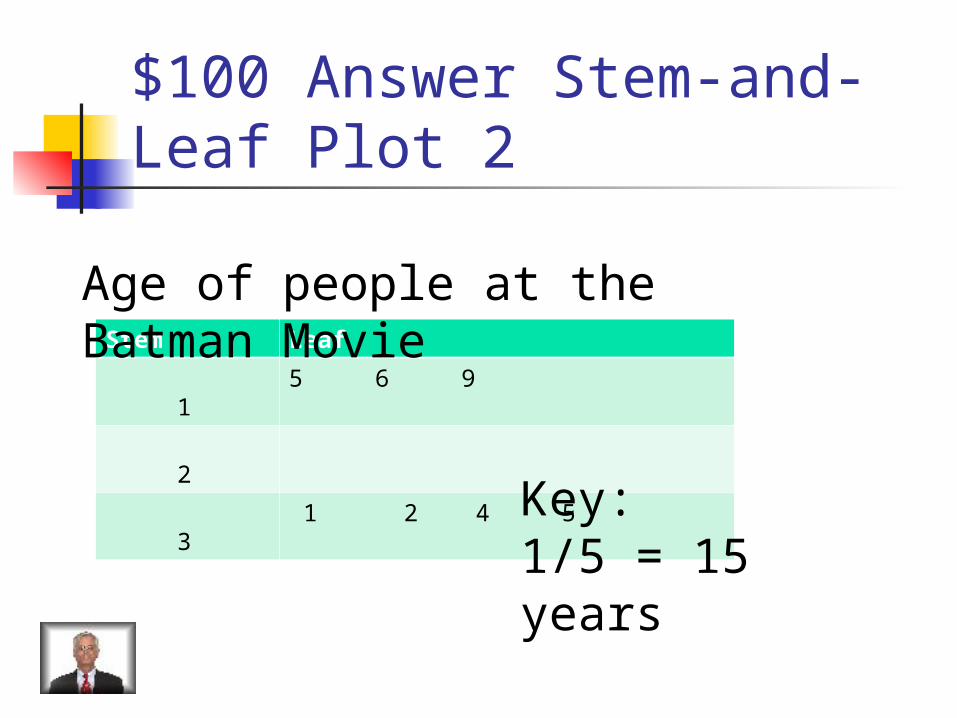
$100 Answer Stem-and-Leaf Plot 2
Stem Leaf
1 5 6 9
2
3 1 2 4 5
Age of people at the Batman Movie
Key: 1/5 = 15 years
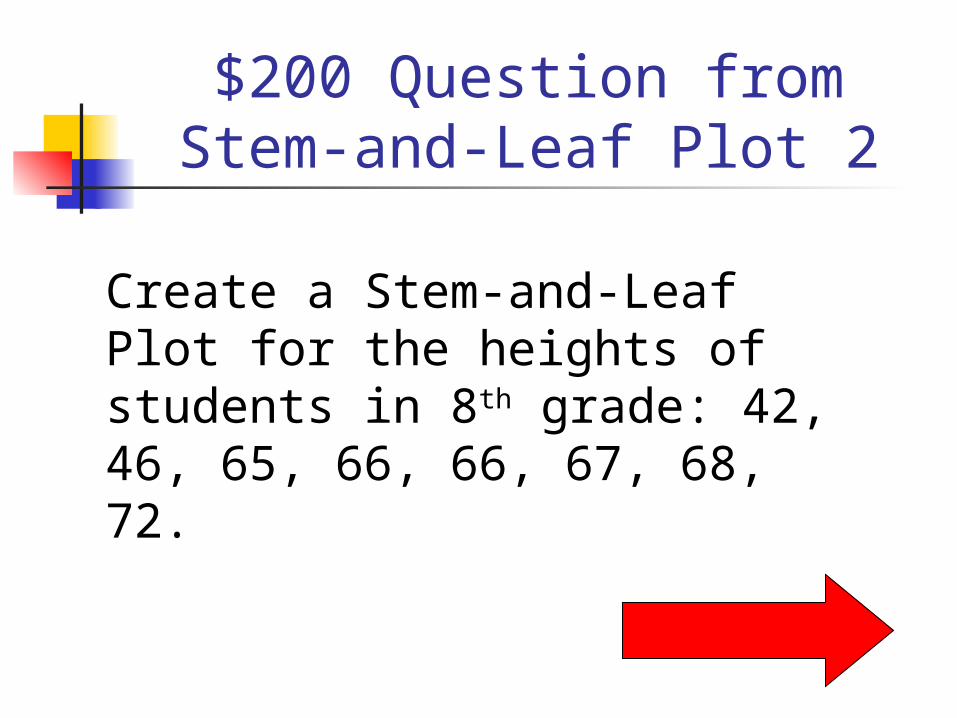
$200 Question from Stem-and-Leaf Plot 2
Create a Stem-and-Leaf Plot for the heights of students in 8th grade: 42, 46, 65, 66, 66, 67, 68, 72.
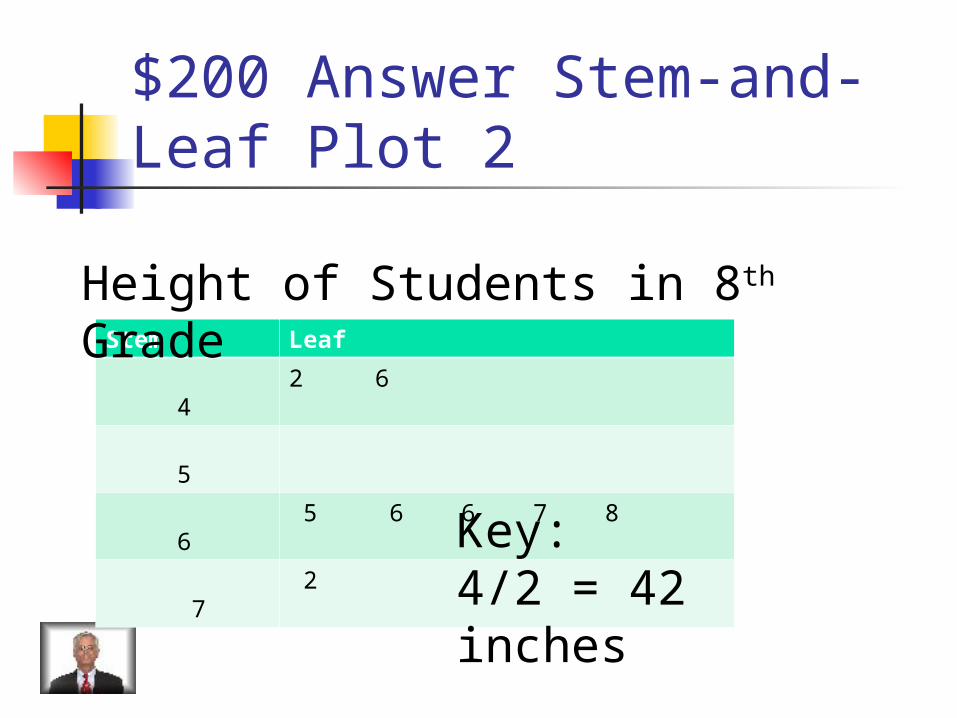
$200 Answer Stem-and-Leaf Plot 2
Stem Leaf
4 2 6
5
6 5 6 6 7 8
7 2
Height of Students in 8th Grade
Key: 4/2 = 42 inches
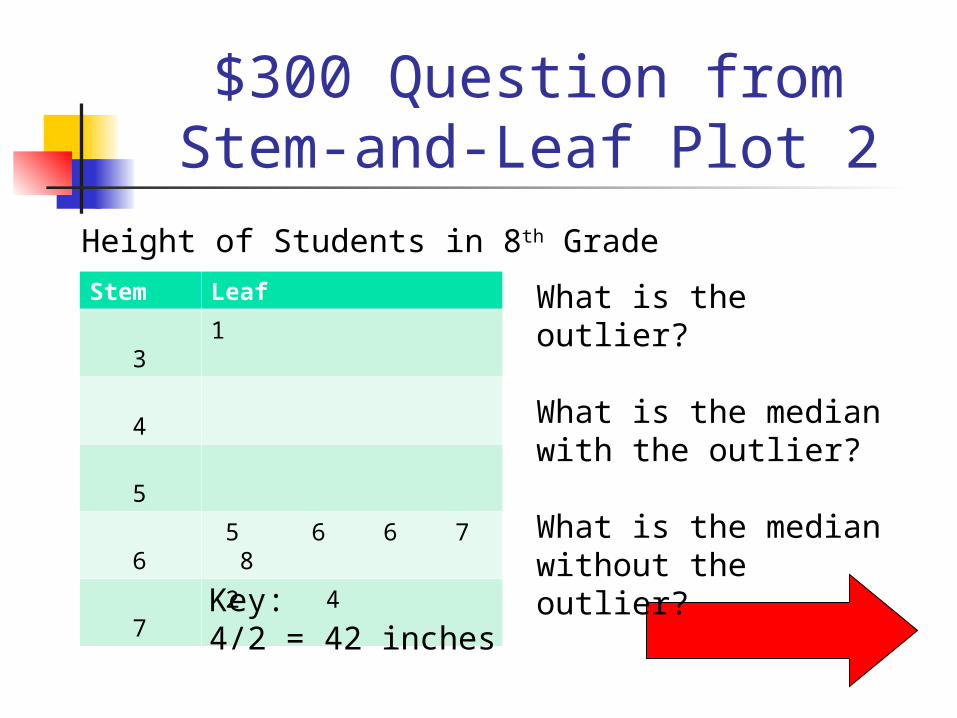
$300 Question from Stem-and-Leaf Plot 2
What is the outlier?
What is the median with the outlier?
What is the median without the outlier?
Stem Leaf
3 1
4
5
6 5 6 6 7 8
7 2 4
Height of Students in 8th Grade
Key: 4/2 = 42 inches
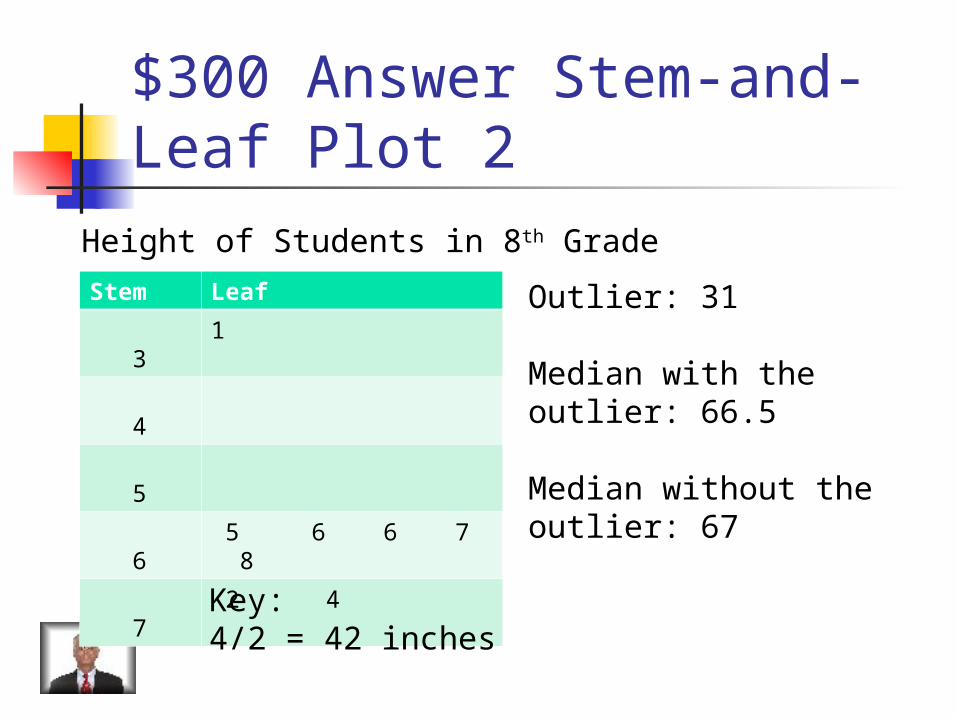
$300 Answer Stem-and-Leaf Plot 2
Outlier: 31
Median with the outlier: 66.5
Median without the outlier: 67
Stem Leaf
3 1
4
5
6 5 6 6 7 8
7 2 4
Height of Students in 8th Grade
Key: 4/2 = 42 inches
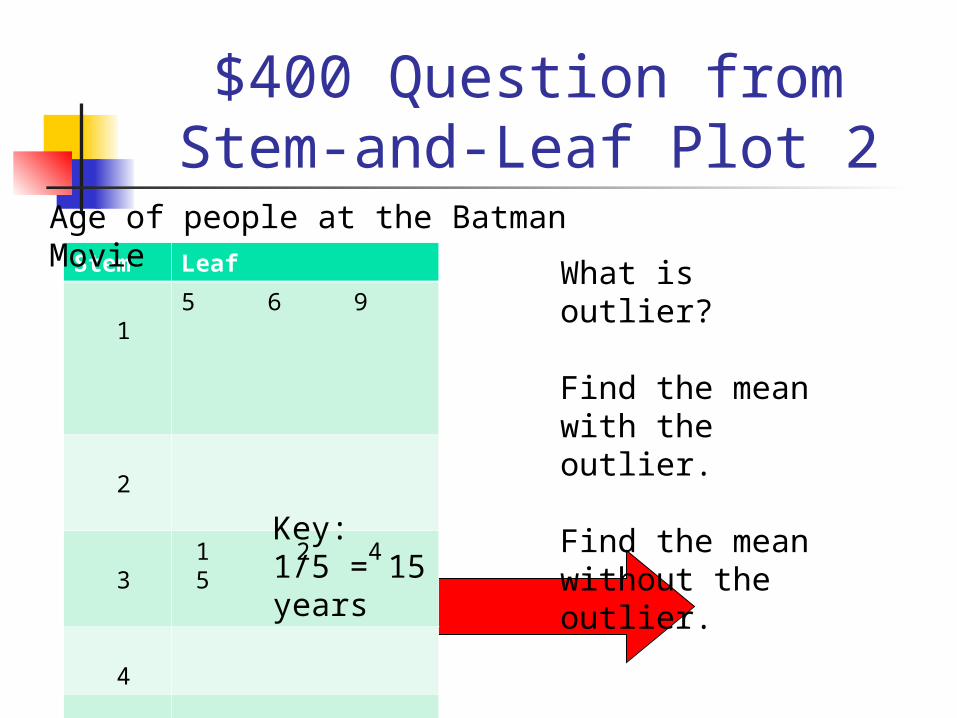
$400 Question from Stem-and-Leaf Plot 2
What is outlier?
Find the mean with the outlier.
Find the mean without the outlier.
Stem Leaf
1
5 6 9
2
3
1 2 4 5
4
5
6
7
8
4
Age of people at the Batman Movie
Key: 1/5 = 15 years
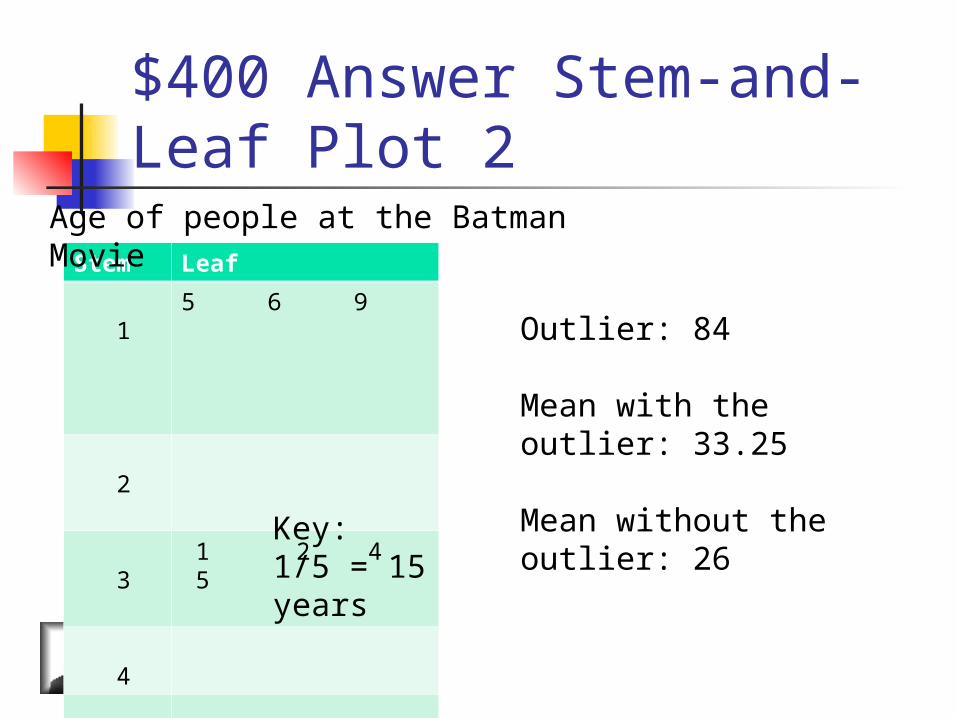
$400 Answer Stem-and-Leaf Plot 2
Outlier: 84
Mean with the outlier: 33.25
Mean without the outlier: 26
Stem Leaf
1
5 6 9
2
3
1 2 4 5
4
5
6
7
8
4
Age of people at the Batman Movie
Key: 1/5 = 15 years
$500 Question from Stem-and-Leaf Plot 2
Which measure of central tendency does an outlier affect the most? (mean, median, mode) How?
$500 Answer Stem-and-Leaf Plot 2
Mean- it is an extreme value that pulls the mean up (if a larger outlier) or down (if a small outlier)
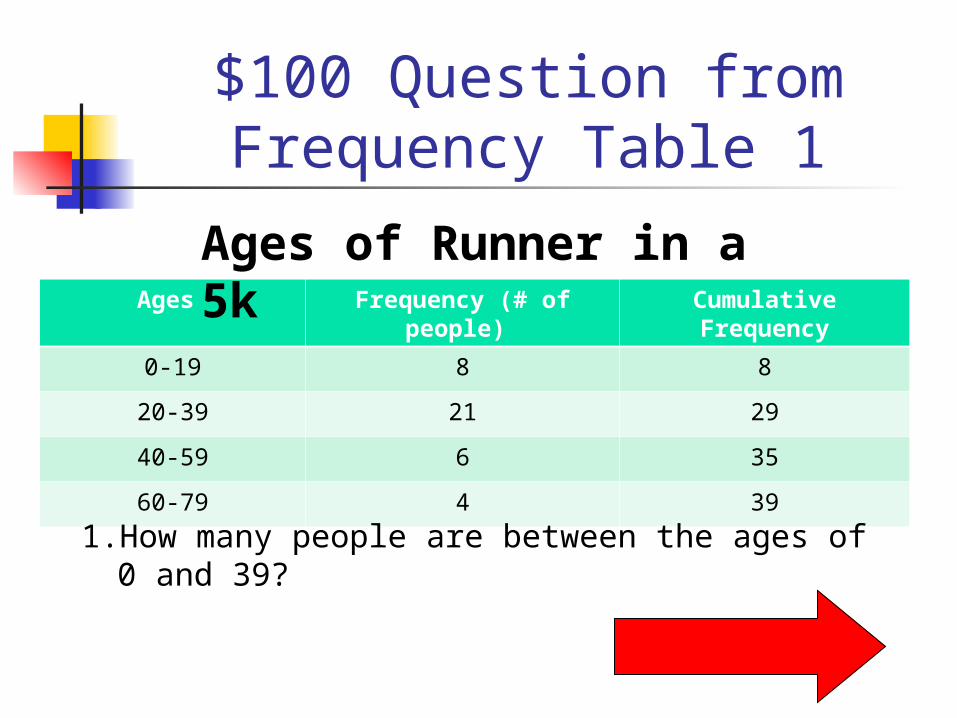
$100 Question from Frequency Table 1
Ages Frequency (# of people)
Cumulative Frequency
0-19 8 8
20-39 21 29
40-59 6 35
60-79 4 39
1. How many people are between the ages of 0 and 39?
Ages of Runner in a 5k
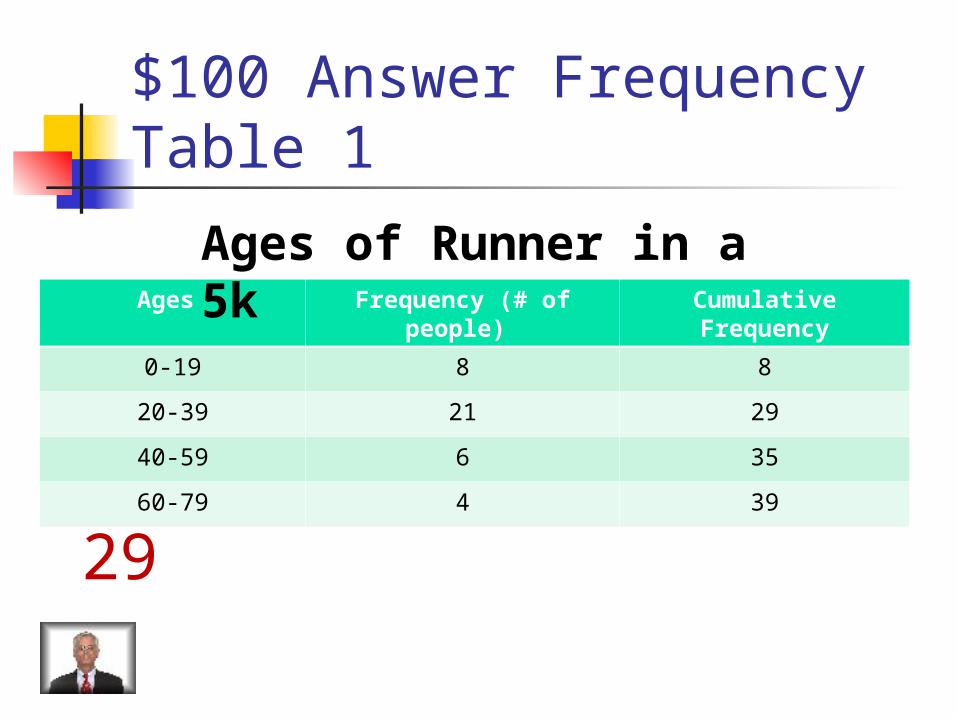
$100 Answer Frequency Table 1
Ages Frequency (# of people)
Cumulative Frequency
0-19 8 8
20-39 21 29
40-59 6 35
60-79 4 39
29
Ages of Runner in a 5k
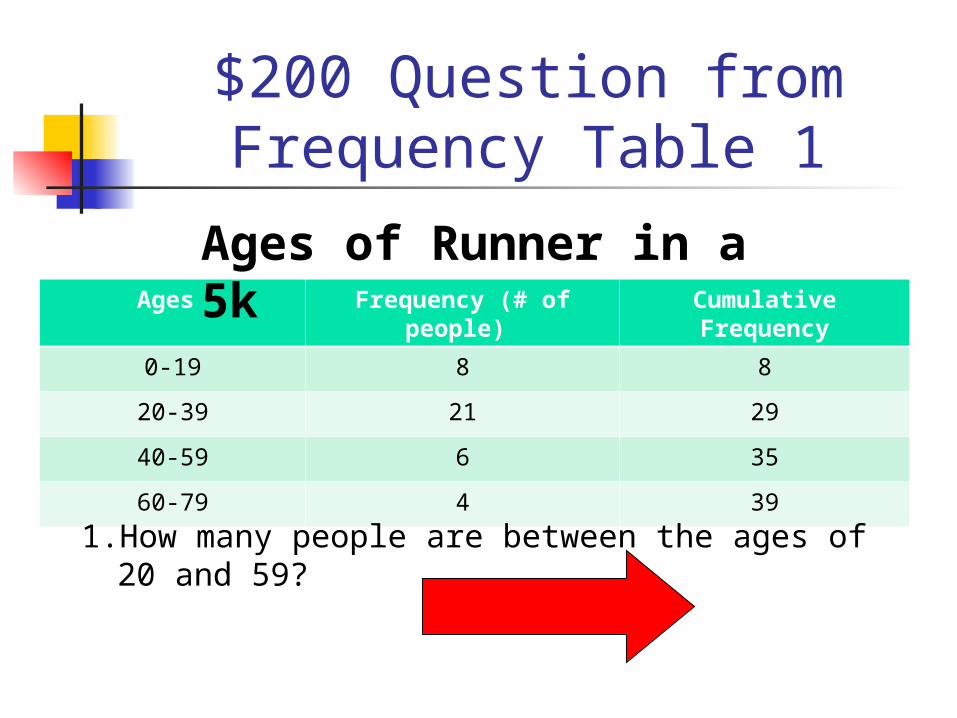
$200 Question from Frequency Table 1
Ages Frequency (# of people)
Cumulative Frequency
0-19 8 8
20-39 21 29
40-59 6 35
60-79 4 39
1. How many people are between the ages of 20 and 59?
Ages of Runner in a 5k

$200 Answer Frequency Table 1
Ages Frequency (# of people)
Cumulative Frequency
0-19 8 8
20-39 21 29
40-59 6 35
60-79 4 39
27
Ages of Runner in a 5k
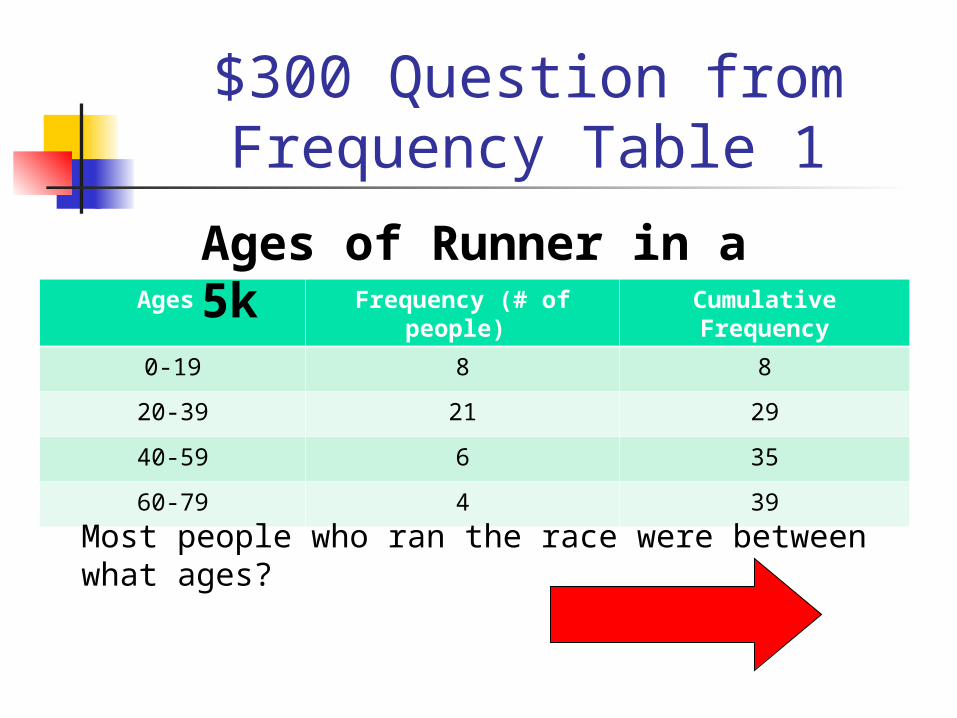
$300 Question from Frequency Table 1
Ages Frequency (# of people)
Cumulative Frequency
0-19 8 8
20-39 21 29
40-59 6 35
60-79 4 39
Most people who ran the race were between what ages?
Ages of Runner in a 5k
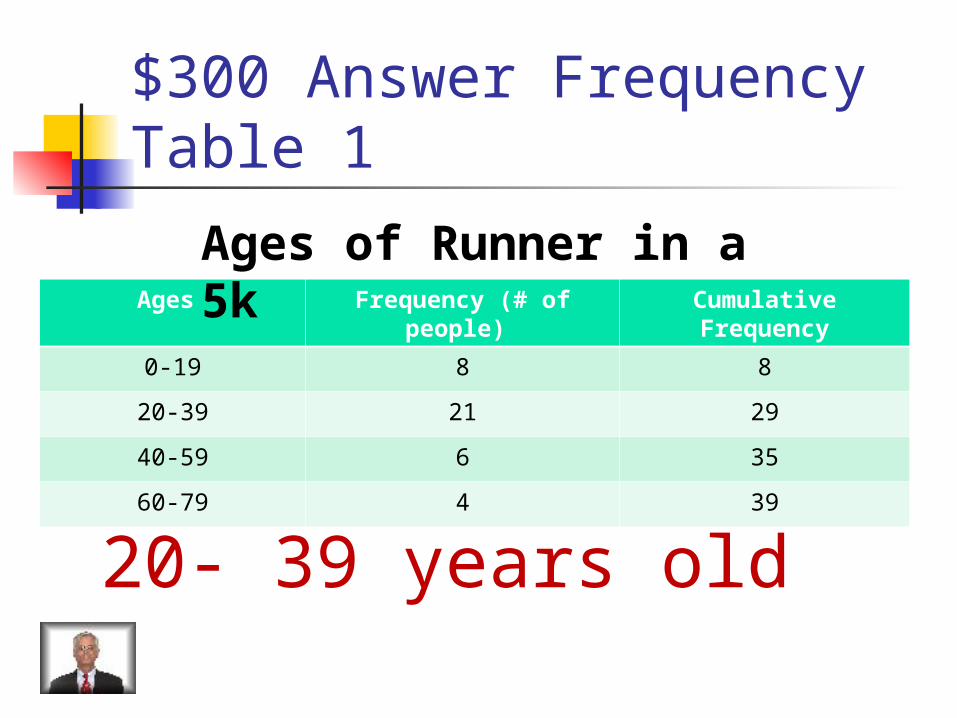
$300 Answer Frequency Table 1
Ages Frequency (# of people)
Cumulative Frequency
0-19 8 8
20-39 21 29
40-59 6 35
60-79 4 39
20- 39 years old
Ages of Runner in a 5k
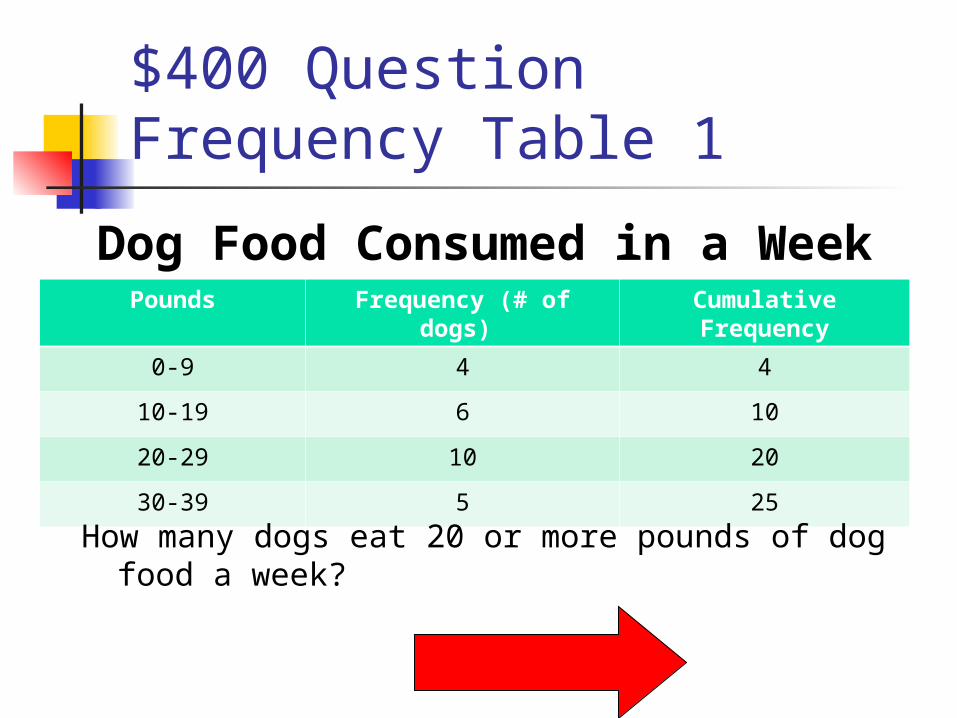
$400 Question Frequency Table 1
Pounds Frequency (# of dogs)
Cumulative Frequency
0-9 4 4
10-19 6 10
20-29 10 20
30-39 5 25
How many dogs eat 20 or more pounds of dog food a week?
Dog Food Consumed in a Week
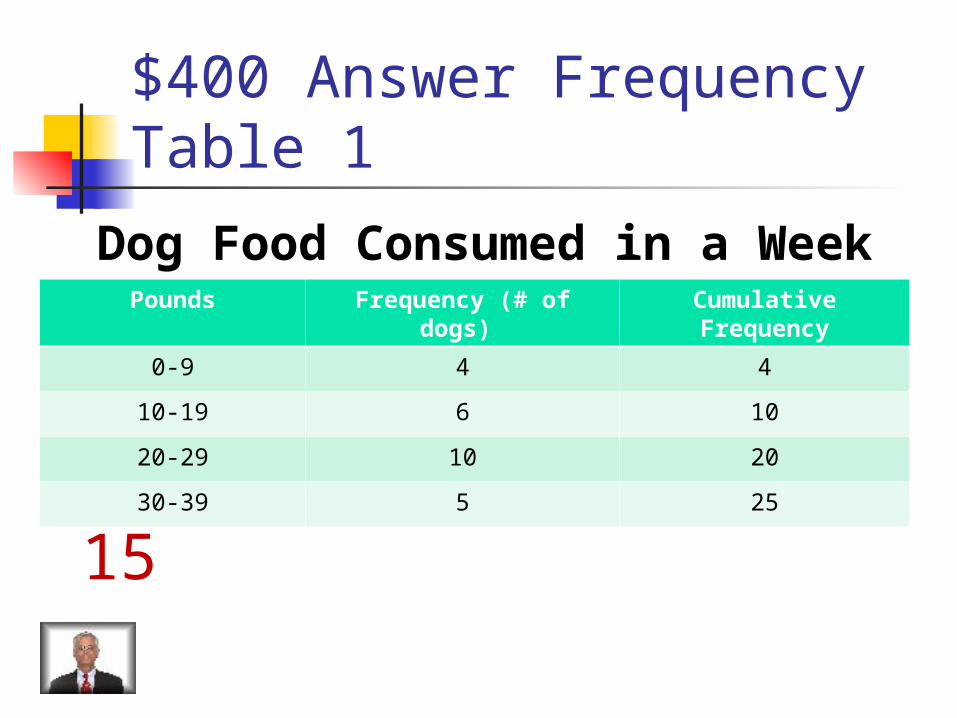
$400 Answer Frequency Table 1
Pounds Frequency (# of dogs)
Cumulative Frequency
0-9 4 4
10-19 6 10
20-29 10 20
30-39 5 25
15
Dog Food Consumed in a Week
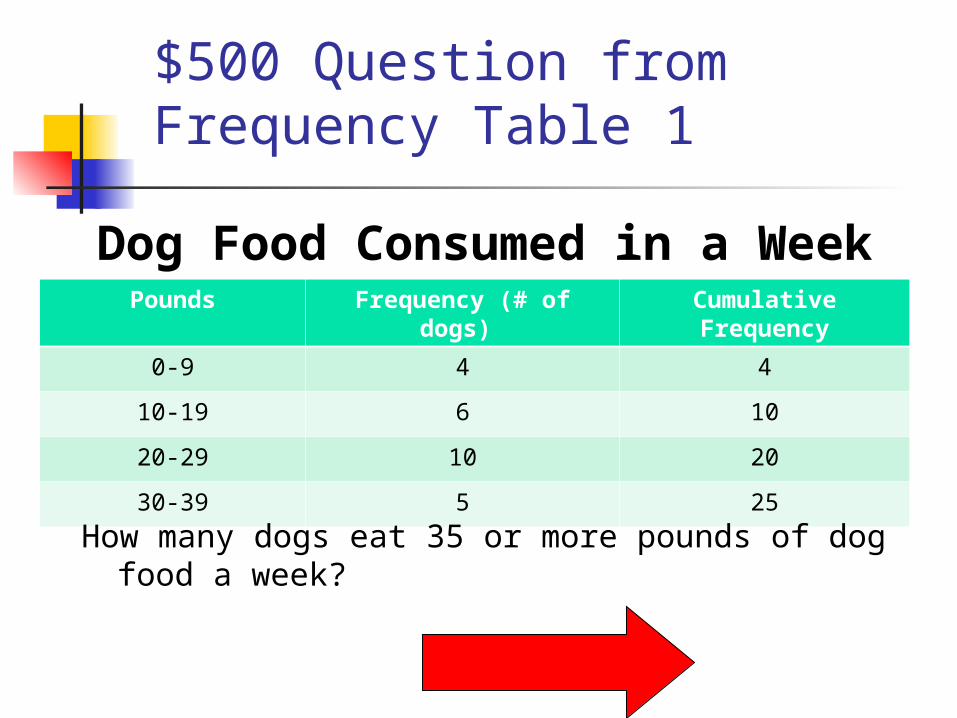
$500 Question from Frequency Table 1
Pounds Frequency (# of dogs)
Cumulative Frequency
0-9 4 4
10-19 6 10
20-29 10 20
30-39 5 25
How many dogs eat 35 or more pounds of dog food a week?
Dog Food Consumed in a Week
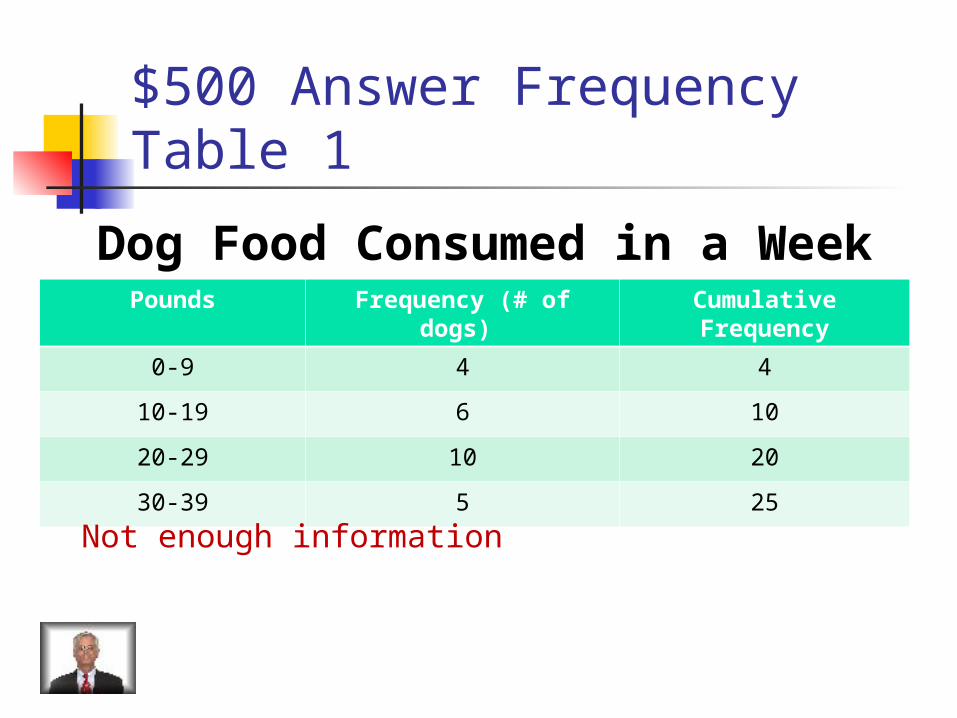
$500 Answer Frequency Table 1
Pounds Frequency (# of dogs)
Cumulative Frequency
0-9 4 4
10-19 6 10
20-29 10 20
30-39 5 25
Not enough information
Dog Food Consumed in a Week
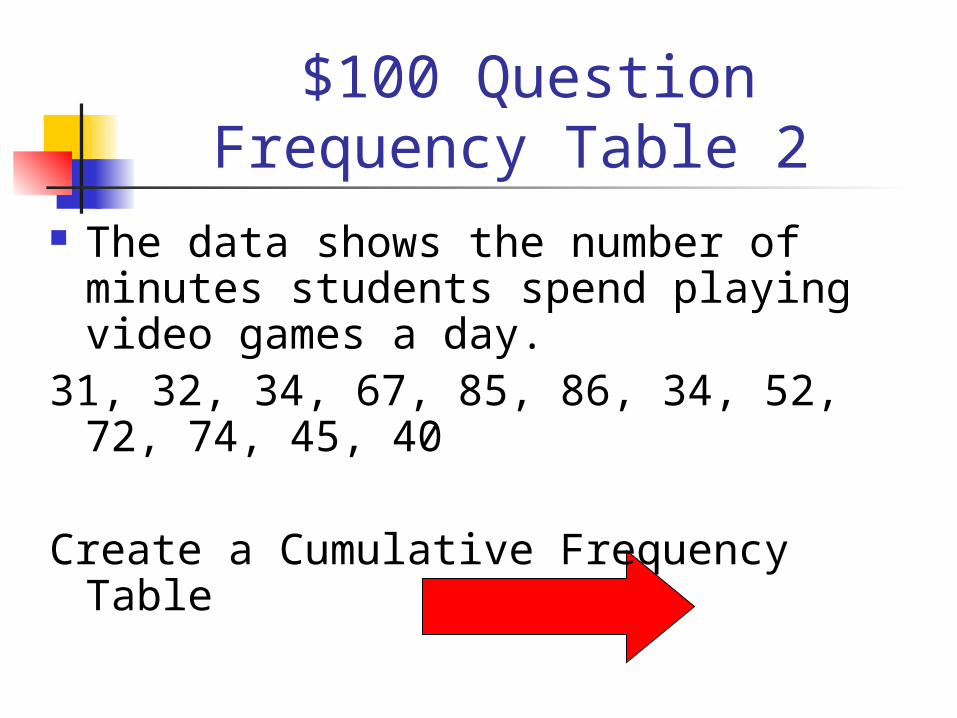
$100 Question Frequency Table 2
The data shows the number of minutes students spend playing video games a day.
31, 32, 34, 67, 85, 86, 34, 52, 72, 74, 45, 40
Create a Cumulative Frequency Table
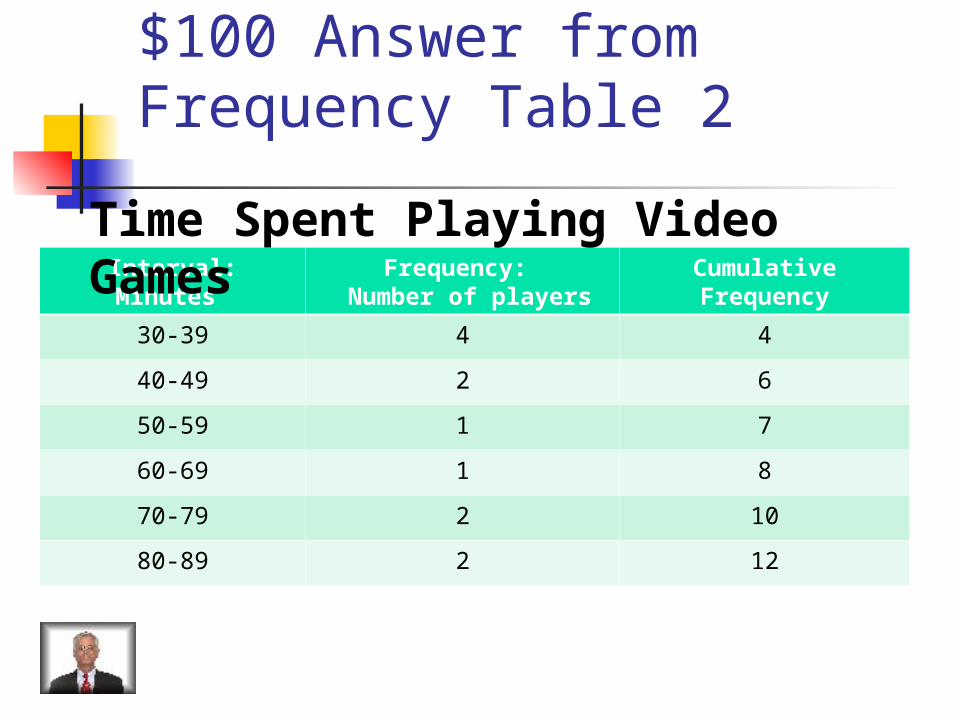
$100 Answer from Frequency Table 2
Interval:Minutes
Frequency: Number of players
Cumulative Frequency
30-39 4 4
40-49 2 6
50-59 1 7
60-69 1 8
70-79 2 10
80-89 2 12
Time Spent Playing Video Games
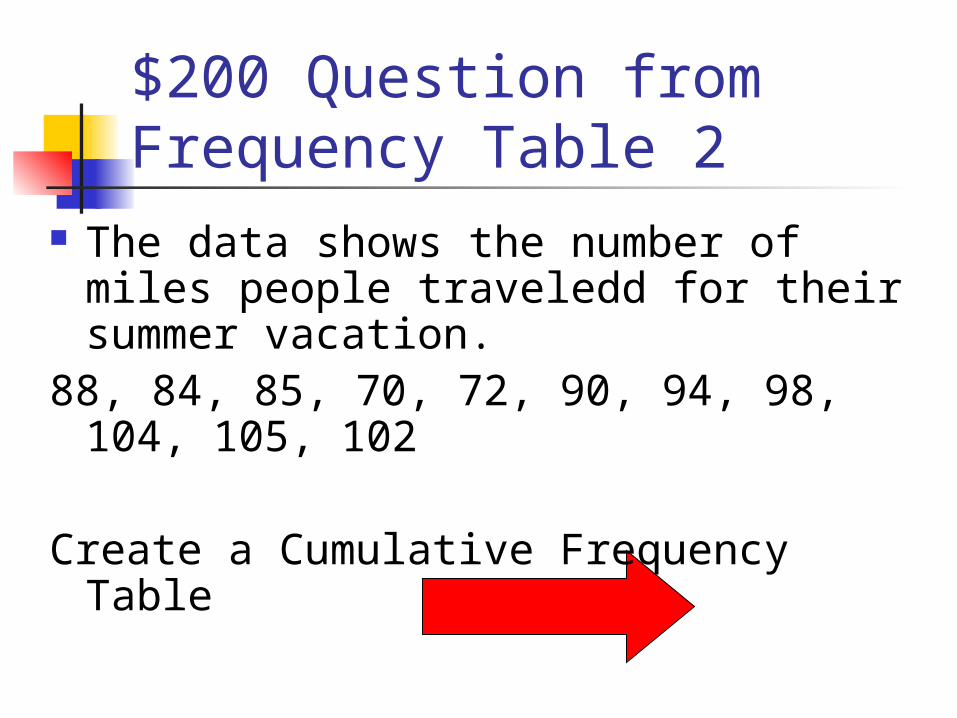
$200 Question from Frequency Table 2
The data shows the number of miles people traveledd for their summer vacation.
88, 84, 85, 70, 72, 90, 94, 98, 104, 105, 102
Create a Cumulative Frequency Table
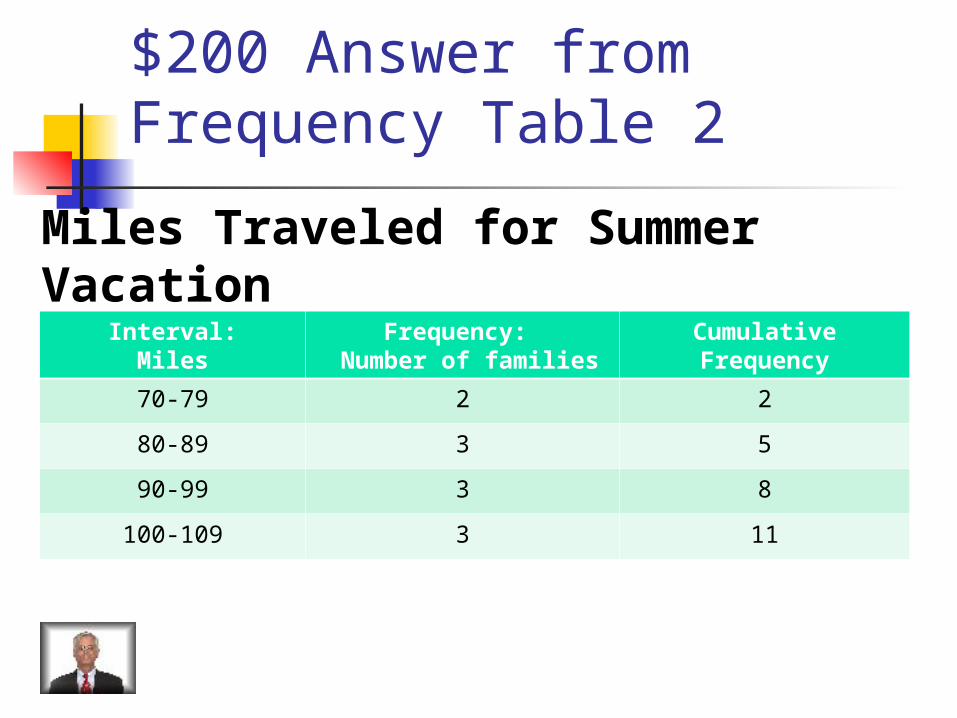
$200 Answer from Frequency Table 2
Interval:Miles
Frequency: Number of families
Cumulative Frequency
70-79 2 2
80-89 3 5
90-99 3 8
100-109 3 11
Miles Traveled for Summer Vacation
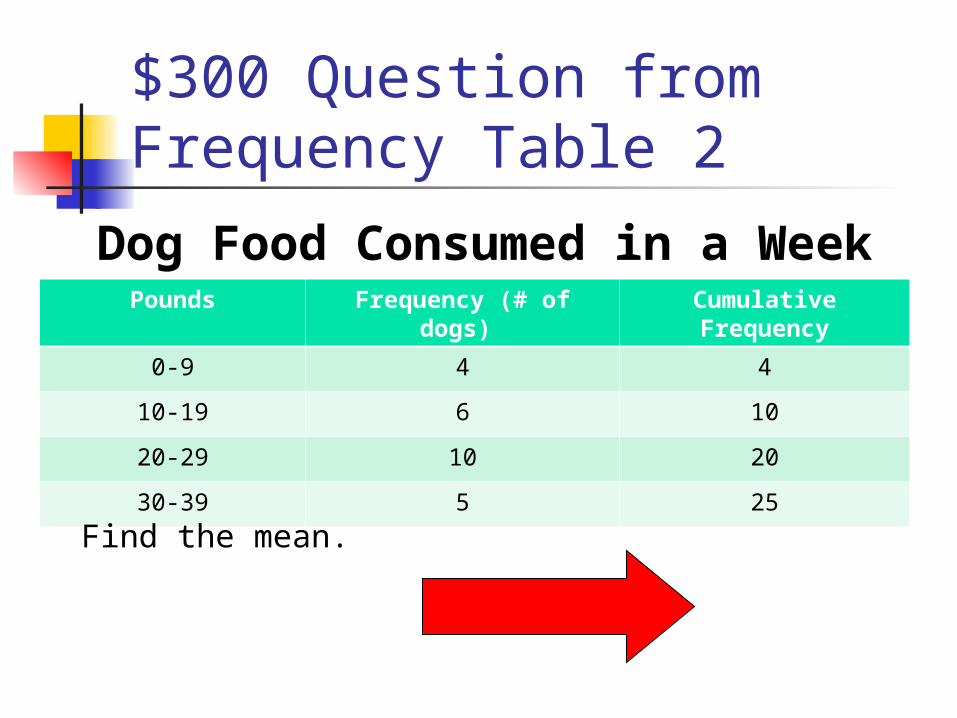
$300 Question from Frequency Table 2
Pounds Frequency (# of dogs)
Cumulative Frequency
0-9 4 4
10-19 6 10
20-29 10 20
30-39 5 25
Find the mean.
Dog Food Consumed in a Week

$300 Answer from Frequency Table 2
Pounds Frequency (# of dogs)
Cumulative Frequency
0-9 4 4
10-19 6 10
20-29 10 20
30-39 5 25
Not enough information
Dog Food Consumed in a Week
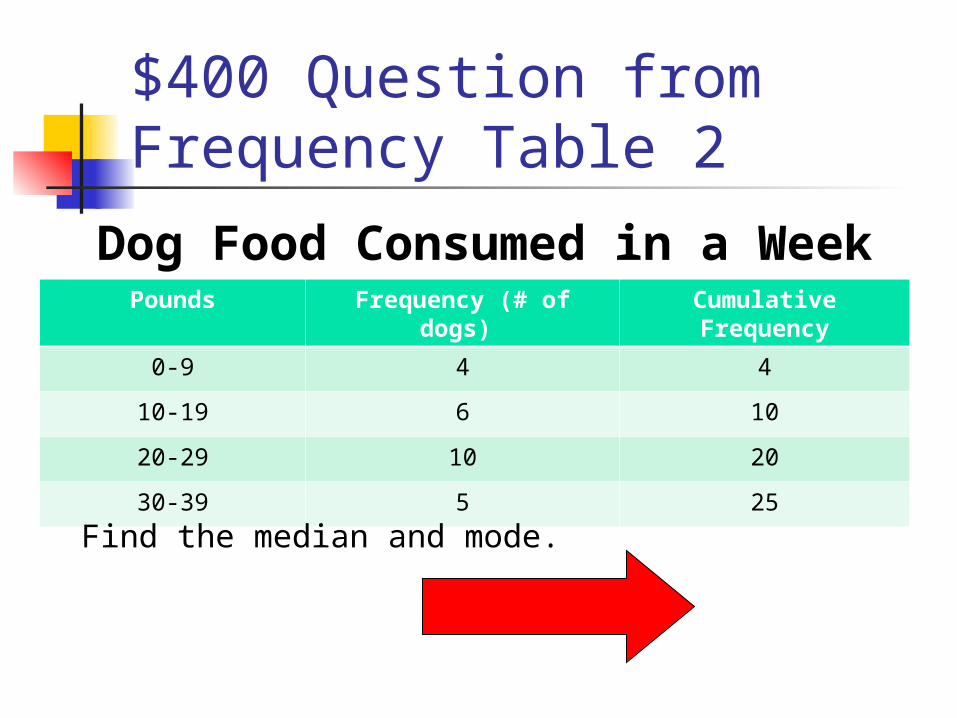
$400 Question from Frequency Table 2
Pounds Frequency (# of dogs)
Cumulative Frequency
0-9 4 4
10-19 6 10
20-29 10 20
30-39 5 25
Find the median and mode.
Dog Food Consumed in a Week

$400 Answer from Frequency Table 2
Pounds Frequency (# of dogs)
Cumulative Frequency
0-9 4 4
10-19 6 10
20-29 10 20
30-39 5 25
Not enough information
Dog Food Consumed in a Week

$500 Question from Frequency Table 2
Pounds Frequency (# of dogs)
Cumulative Frequency
0-9 4 4
10-19 6 10
20-29 10 20
30-39 5 25
Find the range.
Dog Food Consumed in a Week
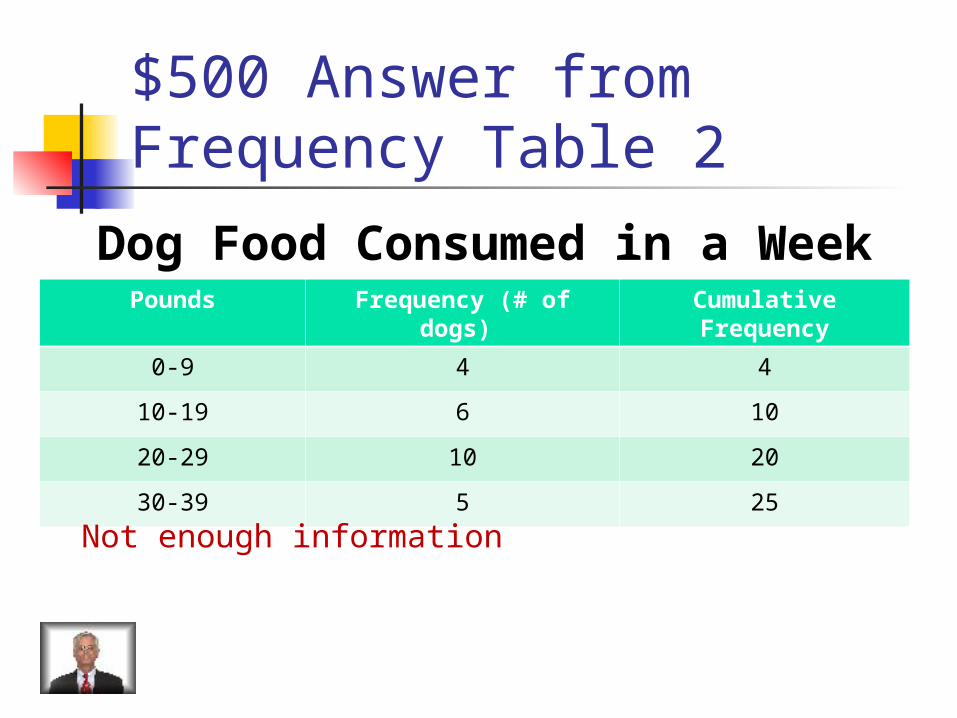
$500 Answer from Frequency Table 2
Pounds Frequency (# of dogs)
Cumulative Frequency
0-9 4 4
10-19 6 10
20-29 10 20
30-39 5 25
Not enough information
Dog Food Consumed in a Week
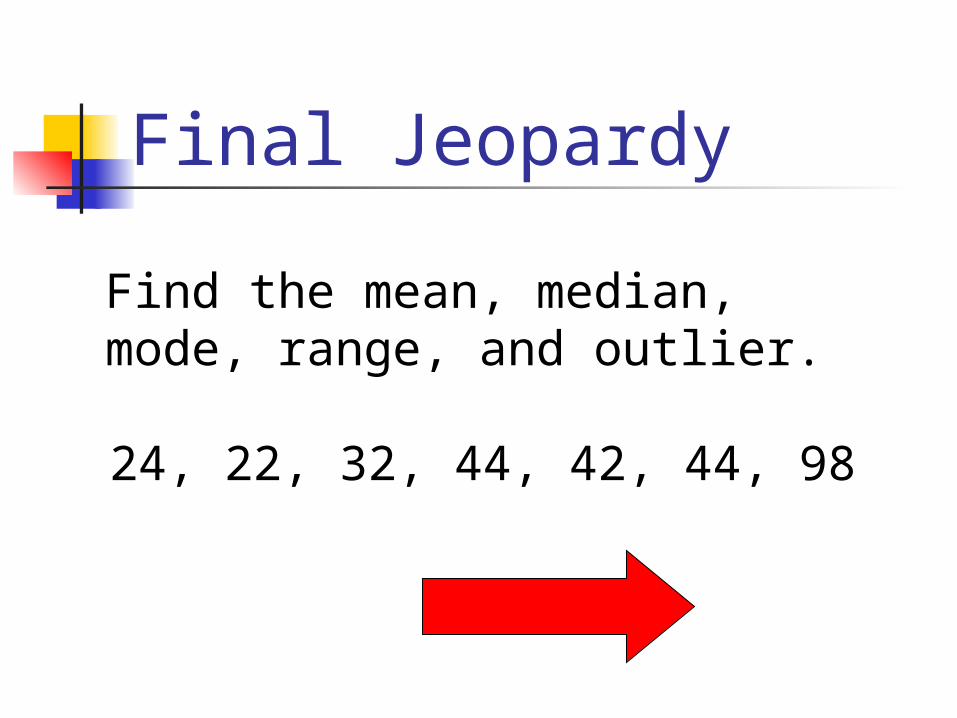
Final Jeopardy
Find the mean, median, mode, range, and outlier.
24, 22, 32, 44, 42, 44, 98
Final Jeopardy Answer
Mean: 43.7Median: 44Mode: 44Range: 76Outlier: 98