Embed Size (px)
DESCRIPTION
Assessing Southeast Europe’s Competitiveness in an International Context Based on the results of The Global Competitiveness Report 2007-2008. Presented at the 3rd Regional Competitiveness Conference in Southeast Europe. Jennifer Blanke Director, Senior Economist World Economic Forum - PowerPoint PPT Presentation
Citation preview

Jennifer Blanke
Director, Senior Economist
World Economic ForumMontenegro | 20 May, 2008
Assessing Southeast Assessing Southeast Europe’s Competitiveness in Europe’s Competitiveness in an International Contextan International ContextBased on the results of The Global Based on the results of The Global Competitiveness Report 2007-2008Competitiveness Report 2007-2008
Presented at the 3rd Regional Competitiveness
Conference in Southeast Europe
2Assessin
g S
ou
theast
Eu
rop
e’s
C
om
peti
tiven
ess i
n a
n I
nte
rnati
on
al
Con
text
|Ju
ne,
20
08
The Global Competitiveness Report.
The Global Competitiveness Index (GCI)
Southeast Europe’s comparative performance in the
GCI rankings
Outline

3Assessin
g S
ou
theast
Eu
rop
e’s
C
om
peti
tiven
ess i
n a
n I
nte
rnati
on
al
Con
text
|Ju
ne,
20
08
Global Competitiveness Report
Flagship product: Global Competitiveness Report: launched
in 1979 covering 16 countries; The Report has since
expanded its coverage to 131 countries.
Co-editors: Professors Michael Porter, Xavier Sala-i-Martin
and Klaus Schwab
Our goal: to provide a benchmarking tool for policymakers
and business leaders

4Assessin
g S
ou
theast
Eu
rop
e’s
C
om
peti
tiven
ess i
n a
n I
nte
rnati
on
al
Con
text
|Ju
ne,
20
08
The Global Competitiveness Network
Regional and special topic reports recently released:
Gender Gap Study 2007
Arab World Competitiveness Report 2007
Africa Competitiveness Report 2007
Travel and Tourism Competitiveness Report 2008
Global Information Technology Report 2007-2008
The Mexico Competitiveness Report 2008

5Assessin
g S
ou
theast
Eu
rop
e’s
C
om
peti
tiven
ess i
n a
n I
nte
rnati
on
al
Con
text
|Ju
ne,
20
08
The Global Competitiveness Report 2007-2008 What are we trying to measure?
GDP per capita 1980-2008 (PPP in international dollars)
Source: International Monetary Fund, World Economic Outlook, October 2007
0
5,000
10,000
15,000
20,000
25,000
30,000
35,000
40,000
1980
1982
1984
1986
1988
1990
1992
1994
1996
1998
2000
2002
2004
2006
2008
Slovenia BulgariaGermany KoreaAlbania
6Assessin
g S
ou
theast
Eu
rop
e’s
C
om
peti
tiven
ess i
n a
n I
nte
rnati
on
al
Con
text
|Ju
ne,
20
08
The Global Competitiveness Report 2007-2008
The most comprehensive data set on competitiveness
Assesses the comparative strengths and weakness of a
large number of economies
Produced in collaboration with leading academics
worldwide and a global network of partner (research)
institutes
7Assessin
g S
ou
theast
Eu
rop
e’s
C
om
peti
tiven
ess i
n a
n I
nte
rnati
on
al
Con
text
|Ju
ne,
20
08
Use of “hard data” (publicly available information) and
survey data (from the Executive Opinion Survey)
The Survey records the perspectives of business leaders
around the world; Survey data is indispensable, particularly
for variables where no reliable hard data sources exist
The Global Competitiveness Report 2007-2008 Data

8Assessin
g S
ou
theast
Eu
rop
e’s
C
om
peti
tiven
ess i
n a
n I
nte
rnati
on
al
Con
text
|Ju
ne,
20
08
The Global Competitiveness Report 2007-2008Country coverage

9Assessin
g S
ou
theast
Eu
rop
e’s
C
om
peti
tiven
ess i
n a
n I
nte
rnati
on
al
Con
text
|Ju
ne,
20
08
How we do not define competitiveness: “a country’s share of
the world market for its products” This view implies a zero-sum game - one country’s gain
comes at the expense of others
How we do define competitiveness: “the set of institutions,
policies, and factors that determine the level of productivity of
a country.” The level of productivity, in turn, sets the sustainable
level of prosperity that can be earned by an economy.
The Global Competitiveness IndexDefinition

10Assessin
g S
ou
theast
Eu
rop
e’s
C
om
peti
tiven
ess i
n a
n I
nte
rnati
on
al
Con
text
|Ju
ne,
20
08
The process of economic development evolves in stages as
captured by the model:
1. “Factor-driven stage”
Firms compete in prices, taking advantage of cheap
factors
2. “Efficiency-driven stage”
Efficient production practices to increase productivity
3. “Innovation-driven stage”
Economies need to produce innovative products using
sophisticated production methods
The Global Competitiveness IndexStages of Development

11Assessin
g S
ou
theast
Eu
rop
e’s
C
om
peti
tiven
ess i
n a
n I
nte
rnati
on
al
Con
text
|Ju
ne,
20
08
Global Competitiveness Index 2007-2008The Framework
Key for
efficiency-driven economies
Key for
factor-driven economies
1. Institutions
2. Infrastructure
3. Macroeconomic stability
4. Health and primary education
5. Higher education and training
6. Goods market efficiency
7. Labor market efficiency
8. Financial market sophistication
9. Technological Readiness
10. Market size
11. Business sophistication
12. Innovation
Key for
innovation-driven economies
BASIC REQUIREMENTS
EFFICIENCY ENHANCERS
INNOVATION & SOPHISTICATIONS FACTORS
12Assessin
g S
ou
theast
Eu
rop
e’s
C
om
peti
tiven
ess i
n a
n I
nte
rnati
on
al
Con
text
|Ju
ne,
20
08
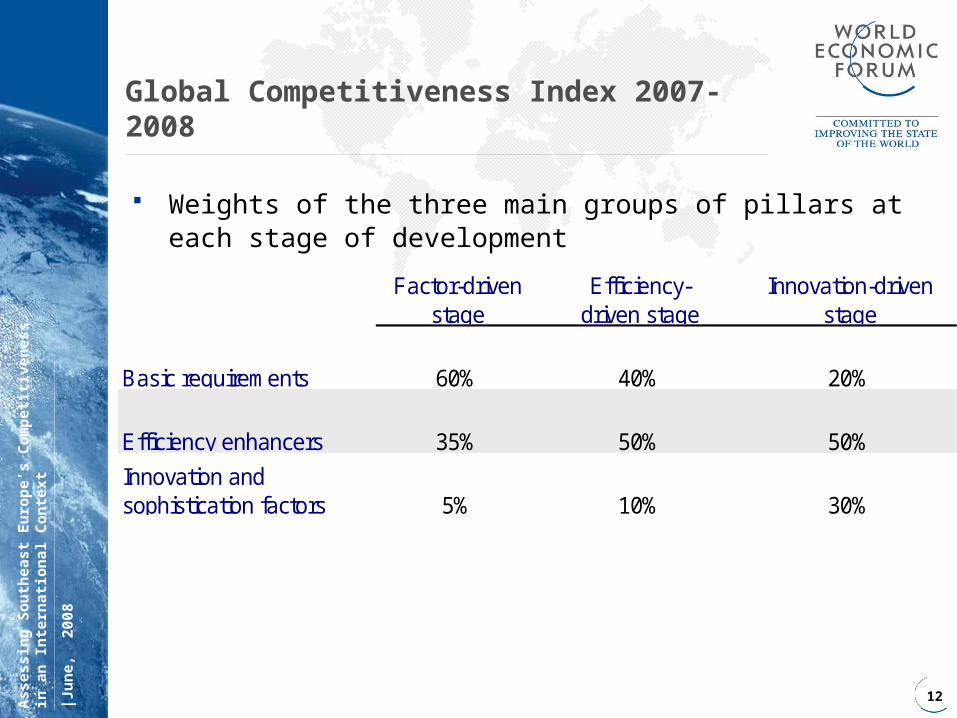
Global Competitiveness Index 2007-2008
Weights of the three main groups of pillars at each stage of development
Factor-driven stage
Efficiency-driven stage
Innovation-driven stage
Basic requirements 60% 40% 20%
Efficiency enhancers 35% 50% 50%
Innovation and sophistication factors 5% 10% 30%
13Assessin
g S
ou
theast
Eu
rop
e’s
C
om
peti
tiven
ess i
n a
n I
nte
rnati
on
al
Con
text
|Ju
ne,
20
08
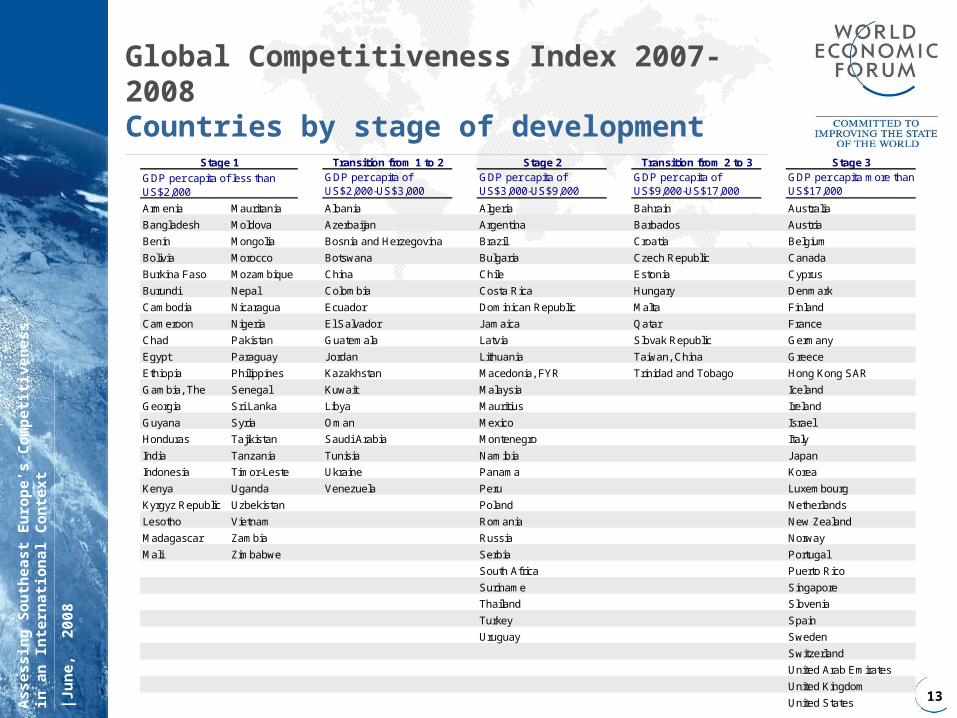
Global Competitiveness Index 2007-2008Countries by stage of development
Transition from 1 to 2 Stage 2 Transition from 2 to 3 Stage 3GDP per capita of US$2,000-US$3,000
GDP per capita of US$3,000-US$9,000
GDP per capita of US$9,000-US$17,000
GDP per capita more than US$17,000
Armenia Mauritania Albania Algeria Bahrain Australia
Bangladesh Moldova Azerbaijan Argentina Barbados Austria
Benin Mongolia Bosnia and Herzegovina Brazil Croatia Belgium
Bolivia Morocco Botswana Bulgaria Czech Republic Canada
Burkina Faso Mozambique China Chile Estonia Cyprus
Burundi Nepal Colombia Costa Rica Hungary Denmark
Cambodia Nicaragua Ecuador Dominican Republic Malta Finland
Cameroon Nigeria El Salvador Jamaica Qatar France
Chad Pakistan Guatemala Latvia Slovak Republic Germany
Egypt Paraguay Jordan Lithuania Taiwan, China Greece
Ethiopia Philippines Kazakhstan Macedonia, FYR Trinidad and Tobago Hong Kong SAR
Gambia, The Senegal Kuwait Malaysia Iceland
Georgia Sri Lanka Libya Mauritius Ireland
Guyana Syria Oman Mexico Israel
Honduras Tajikistan Saudi Arabia Montenegro Italy
India Tanzania Tunisia Namibia Japan
Indonesia Timor-Leste Ukraine Panama Korea
Kenya Uganda Venezuela Peru Luxembourg
Kyrgyz Republic Uzbekistan Poland Netherlands
Lesotho Vietnam Romania New Zealand
Madagascar Zambia Russia Norway
Mali Zimbabwe Serbia Portugal
South Africa Puerto Rico
Suriname Singapore
Thailand Slovenia
Turkey Spain
Uruguay Sweden
Switzerland
United Arab Emirates
United Kingdom
United States
GDP per capita of less than US$2,000
Stage 1

14Assessin
g S
ou
theast
Eu
rop
e’s
C
om
peti
tiven
ess i
n a
n I
nte
rnati
on
al
Con
text
|Ju
ne,
20
08
Global Competitiveness Index 2007-2008Top 20 and selected economies
Rank Economy Score Rank Economy Score
1 United States 5.67 26 Chile 4.77
2 Switzerland 5.62 28 Thailand 4.70
3 Denmark 5.55 29 Spain 4.66
4 Sweden 5.54 34 China 4.575 Germany 5.51 39 Slovenia 4.48
6 Finland 5.49 46 Italy 4.36
7 Singapore 5.45 47 Hungary 4.35
8 Japan 5.43 48 India 4.339 United Kingdom 5.41 53 Turkey 4.25
10 Netherlands 5.40 57 Croatia 4.20
11 Korea 5.40 58 Russia 4.19
12 Hong Kong SAR 5.37 65 Greece 4.08
13 Canada 5.34 66 Azerbaijan 4.07
14 Taiwan, China 5.25 68 Vietnam 4.04
15 Austria 5.23 72 Brazil 3.99
16 Norway 5.20 73 Ukraine 3.98
17 Israel 5.20 77 Egypt 3.96
18 France 5.18 90 Georgia 3.83
19 Australia 5.17 93 Armenia 3.76
20 Belgium 5.10 129 Zimbabwe 2.88
15Assessin
g S
ou
theast
Eu
rop
e’s
C
om
peti
tiven
ess i
n a
n I
nte
rnati
on
al
Con
text
|Ju
ne,
20
08
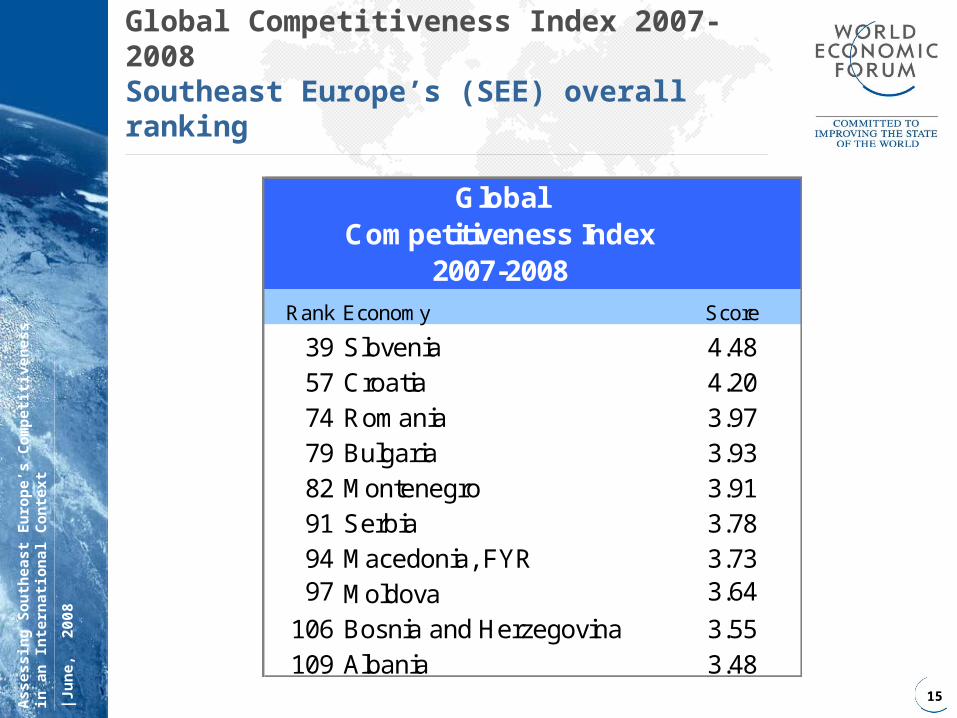
Global Competitiveness Index 2007-2008Southeast Europe’s (SEE) overall ranking
Global Competitiveness Index
2007-2008
Rank Economy Score
39 Slovenia 4.4857 Croatia 4.2074 Romania 3.9779 Bulgaria 3.9382 Montenegro 3.9191 Serbia 3.7894 Macedonia, FYR 3.7397 Moldova 3.64
106 Bosnia and Herzegovina 3.55109 Albania 3.48
16Assessin
g S
ou
theast
Eu
rop
e’s
C
om
peti
tiven
ess i
n a
n I
nte
rnati
on
al
Con
text
|Ju
ne,
20
08
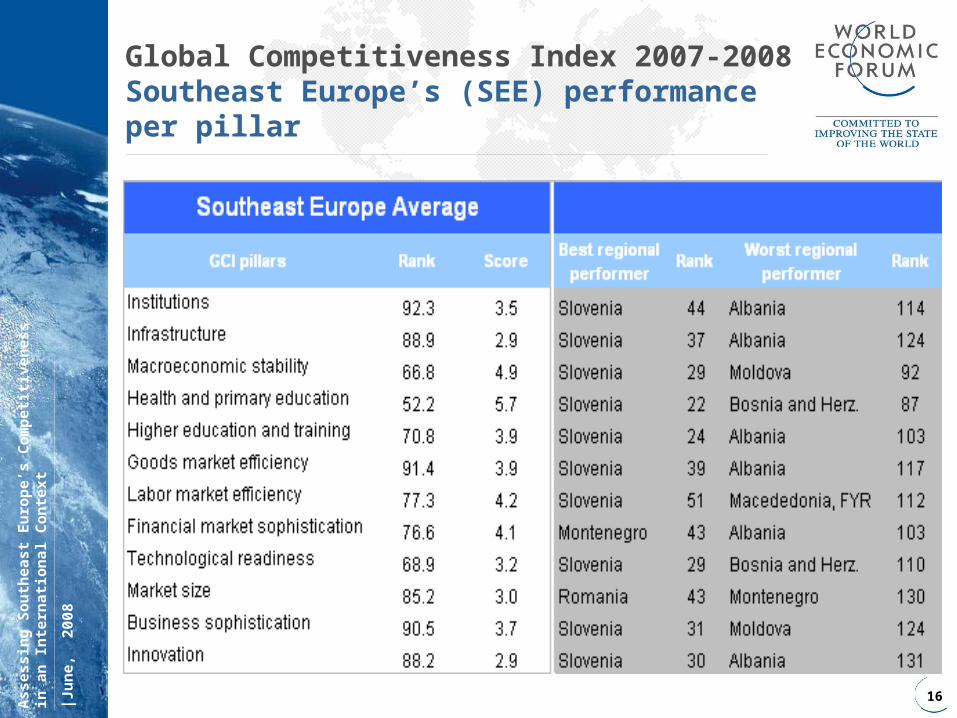
Global Competitiveness Index 2007-2008Southeast Europe’s (SEE) performance per pillar
17Assessin
g S
ou
theast
Eu
rop
e’s
C
om
peti
tiven
ess i
n a
n I
nte
rnati
on
al
Con
text
|Ju
ne,
20
08
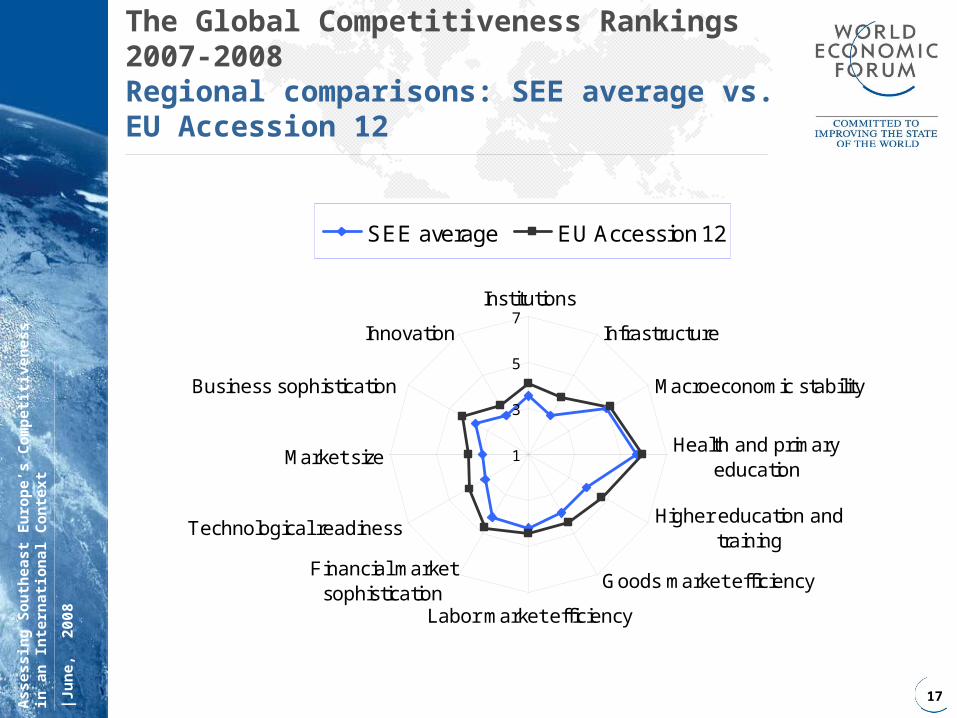
The Global Competitiveness Rankings 2007-2008 Regional comparisons: SEE average vs. EU Accession 12
1
3
5
7Institutions
Infrastructure
Macroeconomic stability
Health and primaryeducation
Higher education andtraining
Goods market efficiency
Labor market efficiency
Financial marketsophistication
Technological readiness
Market size
Business sophistication
Innovation
SEE average EU Accession 12

18Assessin
g S
ou
theast
Eu
rop
e’s
C
om
peti
tiven
ess i
n a
n I
nte
rnati
on
al
Con
text
|Ju
ne,
20
08
The Global Competitiveness Rankings 2007-2008 Regional comparisons: SEE average vs. EU 25
1
3
5
7Institutions
Infrastructure
Macroeconomic stability
Health and primaryeducation
Higher education andtraining
Goods market efficiency
Labor market efficiency
Financial marketsophistication
Technological readiness
Market size
Business sophistication
Innovation
SEE average Average EU 25

19Assessin
g S
ou
theast
Eu
rop
e’s
C
om
peti
tiven
ess i
n a
n I
nte
rnati
on
al
Con
text
|Ju
ne,
20
08
The Global Competitiveness Rankings 2007-2008 Regional comparisons: SEE average vs. EU 15
1
3
5
7Institutions
Infrastructure
Macroeconomic stability
Health and primaryeducation
Higher education andtraining
Goods market efficiency
Labor market efficiency
Financial marketsophistication
Technological readiness
Market size
Business sophistication
Innovation
SEE average EU 15
20Assessin
g S
ou
theast
Eu
rop
e’s
C
om
peti
tiven
ess i
n a
n I
nte
rnati
on
al
Con
text
|Ju
ne,
20
08
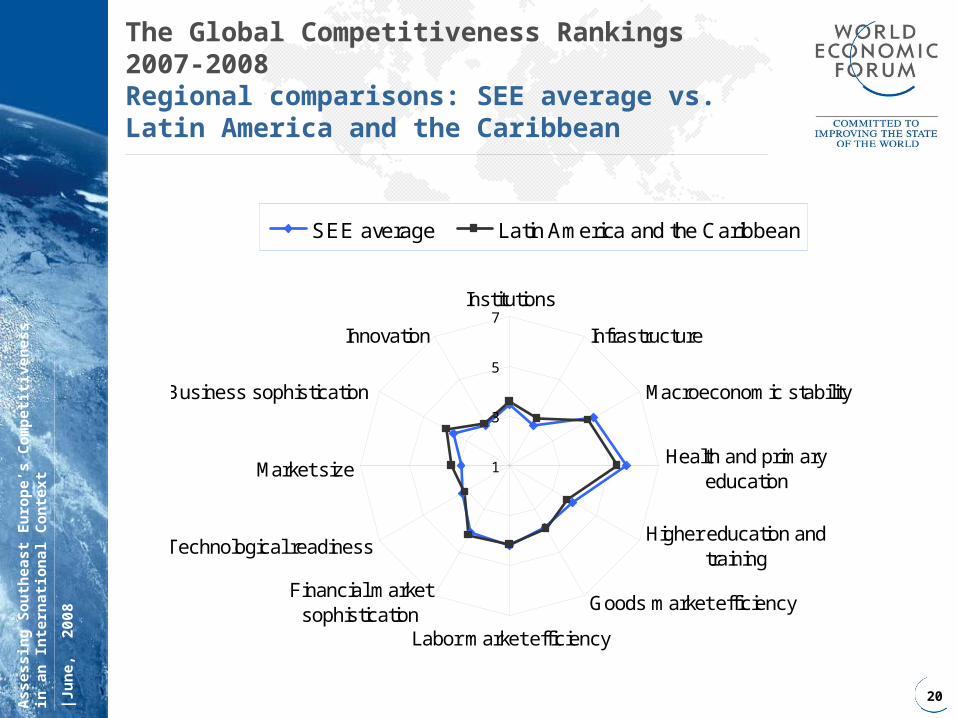
The Global Competitiveness Rankings 2007-2008 Regional comparisons: SEE average vs. Latin America and the Caribbean
1
3
5
7Institutions
Infrastructure
Macroeconomic stability
Health and primaryeducation
Higher education andtraining
Goods market efficiency
Labor market efficiency
Financial marketsophistication
Technological readiness
Market size
Business sophistication
Innovation
SEE average Latin America and the Caribbean

21Assessin
g S
ou
theast
Eu
rop
e’s
C
om
peti
tiven
ess i
n a
n I
nte
rnati
on
al
Con
text
|Ju
ne,
20
08
The Global Competitiveness Rankings 2007-2008 Regional comparisons: SEE average vs. East Asian NICs average (Hong Kong, South Korea,
Singapore, and Taiwan)
1
3
5
7Institutions
Infrastructure
Macroeconomic stability
Health and primaryeducation
Higher education andtraining
Goods market efficiency
Labor market efficiency
Financial marketsophistication
Technological readiness
Market size
Business sophistication
Innovation
SEE averageEast Asian NICs average

22Assessin
g S
ou
theast
Eu
rop
e’s
C
om
peti
tiven
ess i
n a
n I
nte
rnati
on
al
Con
text
|Ju
ne,
20
08
The Global Competitiveness Rankings 2007-2008 SEE and selected comparators (scores on a scale of 1 to 7)

23Assessin
g S
ou
theast
Eu
rop
e’s
C
om
peti
tiven
ess i
n a
n I
nte
rnati
on
al
Con
text
|Ju
ne,
20
08
The Global Competitiveness Rankings 2007-2008 Case study: Montenegro’s overall performance

24Assessin
g S
ou
theast
Eu
rop
e’s
C
om
peti
tiven
ess i
n a
n I
nte
rnati
on
al
Con
text
|Ju
ne,
20
08
The Global Competitiveness Rankings 2007-2008 Case study: Montenegro’s comparative advantages

25Assessin
g S
ou
theast
Eu
rop
e’s
C
om
peti
tiven
ess i
n a
n I
nte
rnati
on
al
Con
text
|Ju
ne,
20
08
The Global Competitiveness Rankings 2007-2008 Case study: Montenegro’s comparative disadvantages

26Assessin
g S
ou
theast
Eu
rop
e’s
C
om
peti
tiven
ess i
n a
n I
nte
rnati
on
al
Con
text
|Ju
ne,
20
08
The Global Competitiveness Rankings 2007-2008 Montenegro vs. EU 27
1
3
5
7Institutions
Infrastructure
Macroeconomic stability
Health and primary education
Higher education and training
Goods market efficiency
Labor market efficiency
Financial market sophistication
Technological readiness
Market size
Business sophistication
Innovation
Montenegro EU 27

27Assessin
g S
ou
theast
Eu
rop
e’s
C
om
peti
tiven
ess i
n a
n I
nte
rnati
on
al
Con
text
|Ju
ne,
20
08
The Global Competitiveness Rankings 2007-2008 Montenegro vs. EU Accession 12
1
3
5
7Institutions
Infrastructure
Macroeconomic stability
Health and primary education
Higher education and training
Goods market efficiency
Labor market efficiency
Financial market sophistication
Technological readiness
Market size
Business sophistication
Innovation
Montenegro EU Accession 12

28Assessin
g S
ou
theast
Eu
rop
e’s
C
om
peti
tiven
ess i
n a
n I
nte
rnati
on
al
Con
text
|Ju
ne,
20
08
Conclusions
Competitiveness is a complex process, requiring countries to address issues on many fronts
Several countries in the Southeast Europe region have a number of competitive strengths, especially regarding the quality of basic human capital and macroeconomic stability
But to provide an environment in which its businesses can thrive, and thus improve its competitive position, improvements must be made in a number of critical areas (e.g. institutions, infrastructure, market efficiency)
29Assessin
g S
ou
theast
Eu
rop
e’s
C
om
peti
tiven
ess i
n a
n I
nte
rnati
on
al
Con
text
|Ju
ne,
20
08
The Global Competitiveness ReportHow to obtain more information
Please visit our website for further information and to download most sections of the Report:
www.weforum.org


![[Spycob] Montenegro](https://img.pdfslide.us/doc/110x75/55d59e79bb61eb85778b4618/spycob-montenegro.jpg)