Embed Size (px)
Citation preview
Computing with Neural Spikes
Jennie Si, ProfessorSchool of Electrical, Computer and
Energy EngineeringArizona State University
September 14, 2012University of Cyprus
What is the neural code?
• Of all the objects in the universe, the human brain is the most complex - the brain, the final frontier. “How is information coded in neural activity?” is listed on top of the “10 Unsolved Mysteries of the Brain” (Eagleman, 2007).
• Is it possible to decipher the syntax or set of rules that transform electrical pulses coursing through the brain into perceptions, decisions, memories, emotions
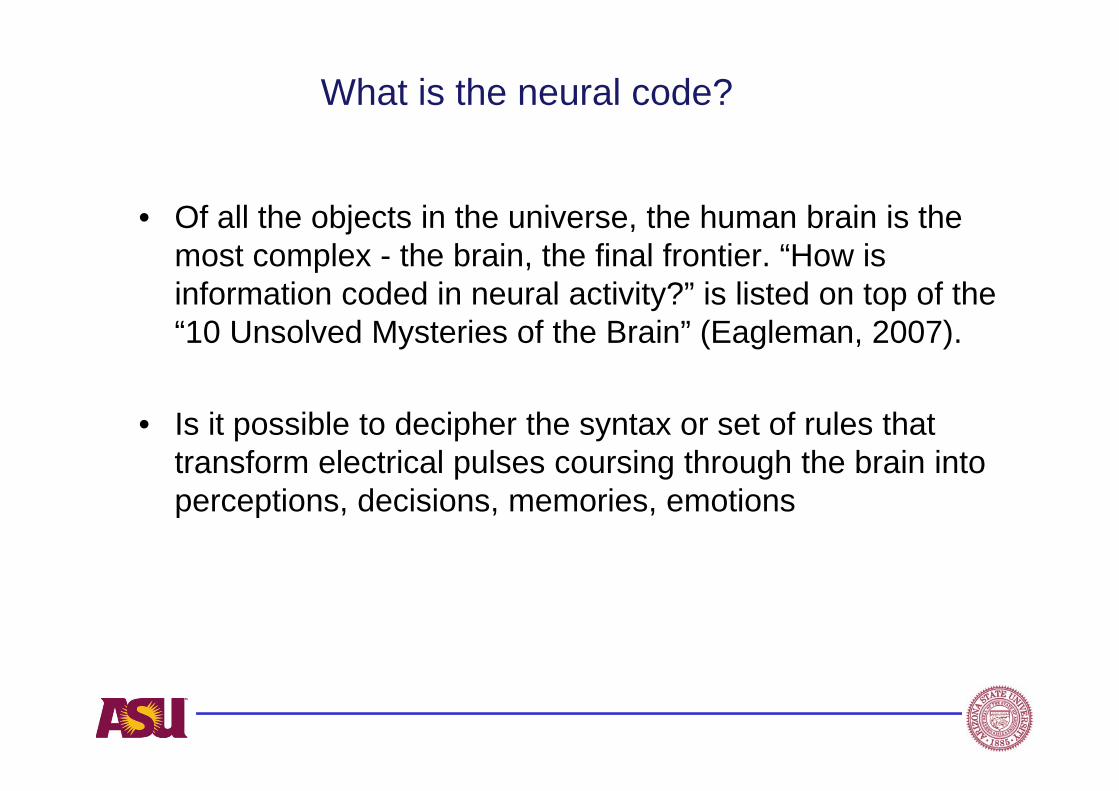
What is the neural code – One step at a time
• Neural coding for the understanding of the frontal cortical areas associated with decision and control
Neural
Behavioral
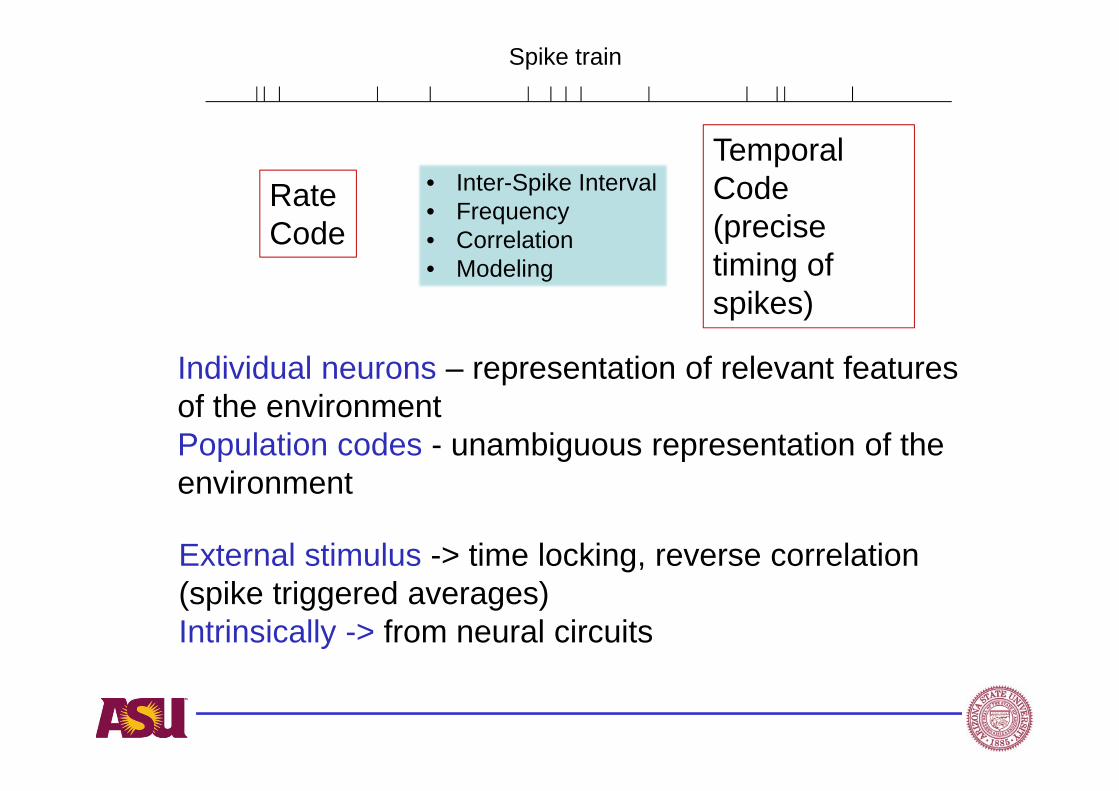
RateCode
TemporalCode(precise timing of spikes)
• Inter-Spike Interval• Frequency• Correlation• Modeling
Individual neurons – representation of relevant features of the environmentPopulation codes - unambiguous representation of the environment
External stimulus -> time locking, reverse correlation (spike triggered averages)Intrinsically -> from neural circuits
Spike train
Examples of rate code
The rate code - the average number of action potentials/spikes per unit time
In motor neurons, the strength of an innervated muscle flexion depends solely on the firing rate
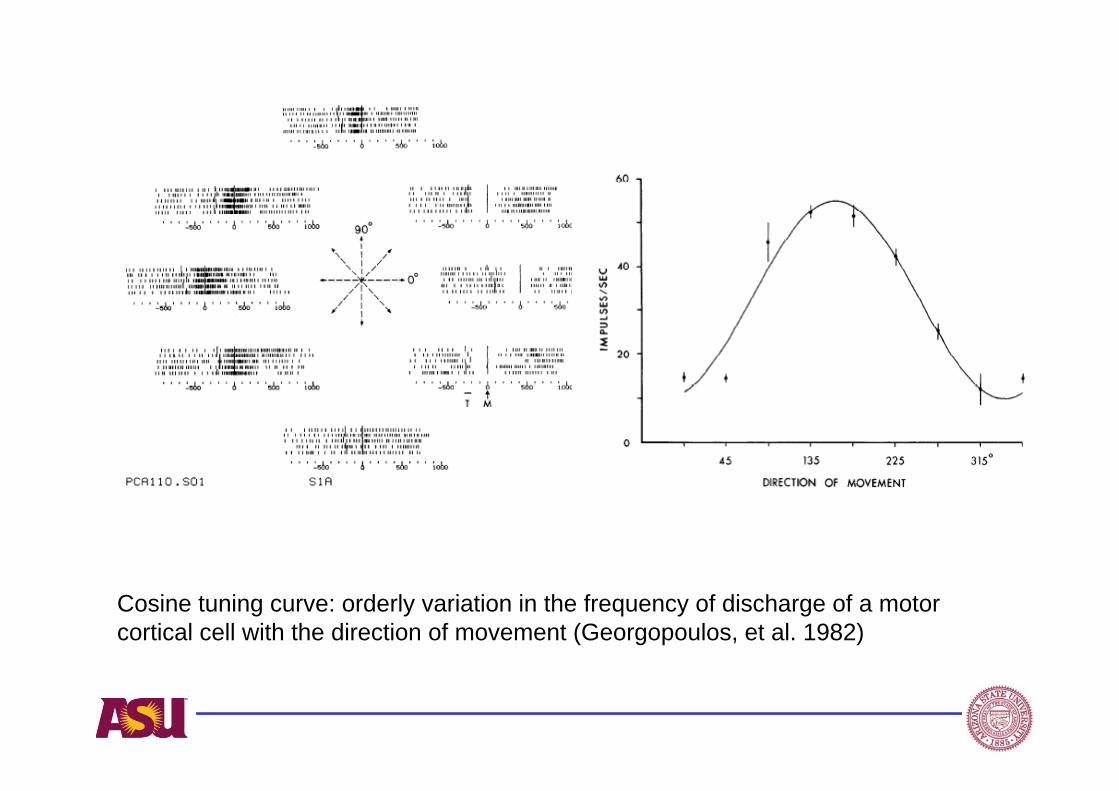
Cosine tuning curve: orderly variation in the frequency of discharge of a motor cortical cell with the direction of movement (Georgopoulos, et al. 1982)
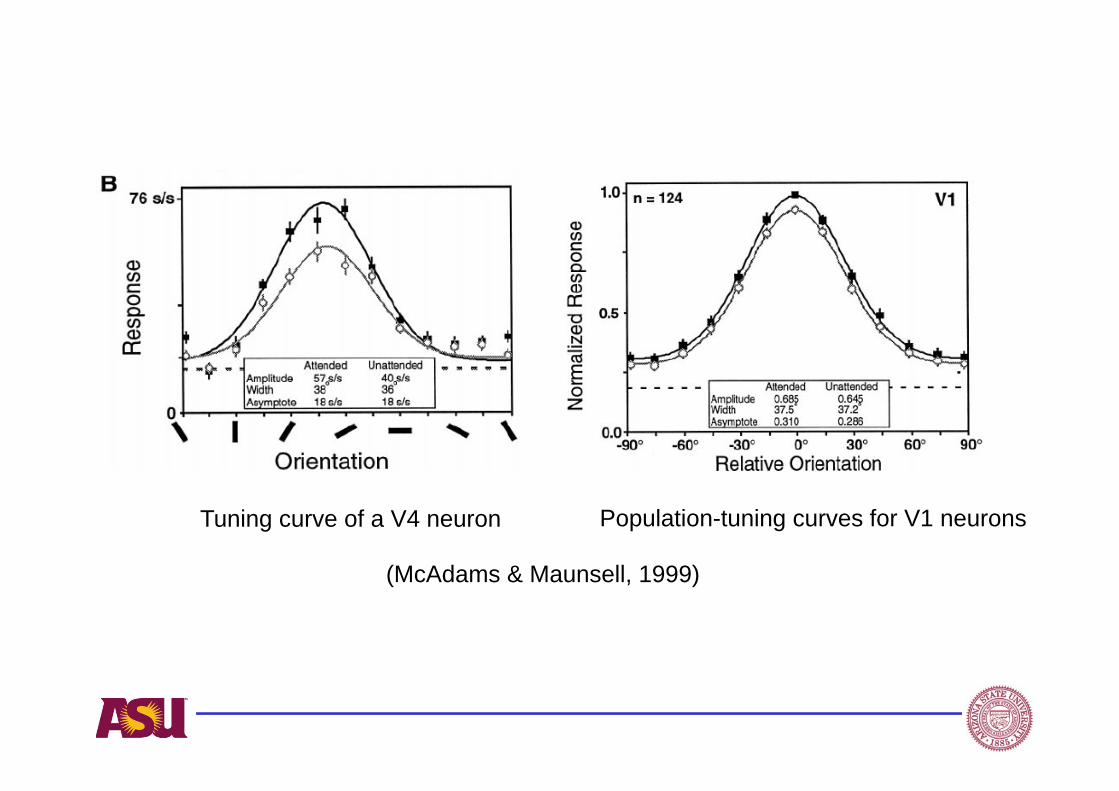
(McAdams & Maunsell, 1999)
Population-tuning curves for V1 neuronsTuning curve of a V4 neuron
Examples of temporal code
• Neurons of the cat visual cortex oscillate in range 40-60 Hz in synchrony in response to visual stimulus
• Such oscillation is tightly correlated with the phase and amplitude of an oscillatory local field potential
• The oscillatory responses may provide a general mechanism by which activity patterns in spatially separate regions of the cortex are temporally coordinated.
(Gray & Singer, 1989)
In most sensory systems, the firing rate increases, generally non-linearly, with increasing stimulus intensity
Rapid changing stimuli tend to generate precisely timed spikes and rapidly changing firing rates no matter what neural coding strategy is being used
It is commonly accepted that …
How neurons encode information
• What is the neural code for intrinsic brain states involved in complex behavioral process beyond laboratory designed sensory stimulus, e.g., perception, cognition, decision.
• Difficult problem, especially in the frontal cortex - many kind of cells, inter-mixed/ intertwined
• The frontal cortex plays a crucial role in working memory, it is thus of particular interest when studying trial and error learning.
• The PM and M1 areas receive information from striate, parietal, and prefrontal and thalamic structures (Markowitsch et al., 1987). Also, they send information to subcortical structures and spinal cord.
• The PFC (Roesch & Olson, 2003), anterior cingulate cortex ACC (Carter et al., 1998), basal ganglia (Falkenstein et al., 2001), all are related with performance monitoring, are in connection with PM and M1.
• The PMv is involved in sensory transformations for visually guided actions and in perceptual decisions, connected with sensory, motor, and high-level cognitive areas related to performance monitoring. The site for representing sensory perception for action and for evaluating the decision consequences. (Vazquez et al, 2008).
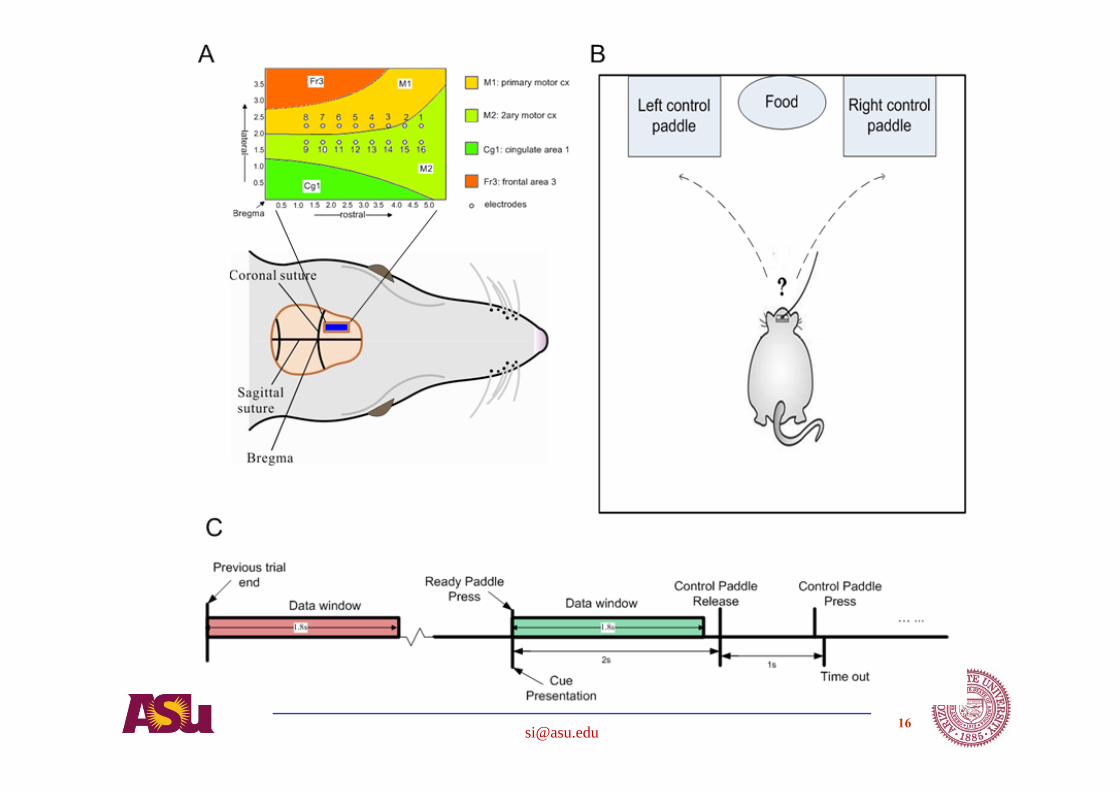
Cortical areas under study
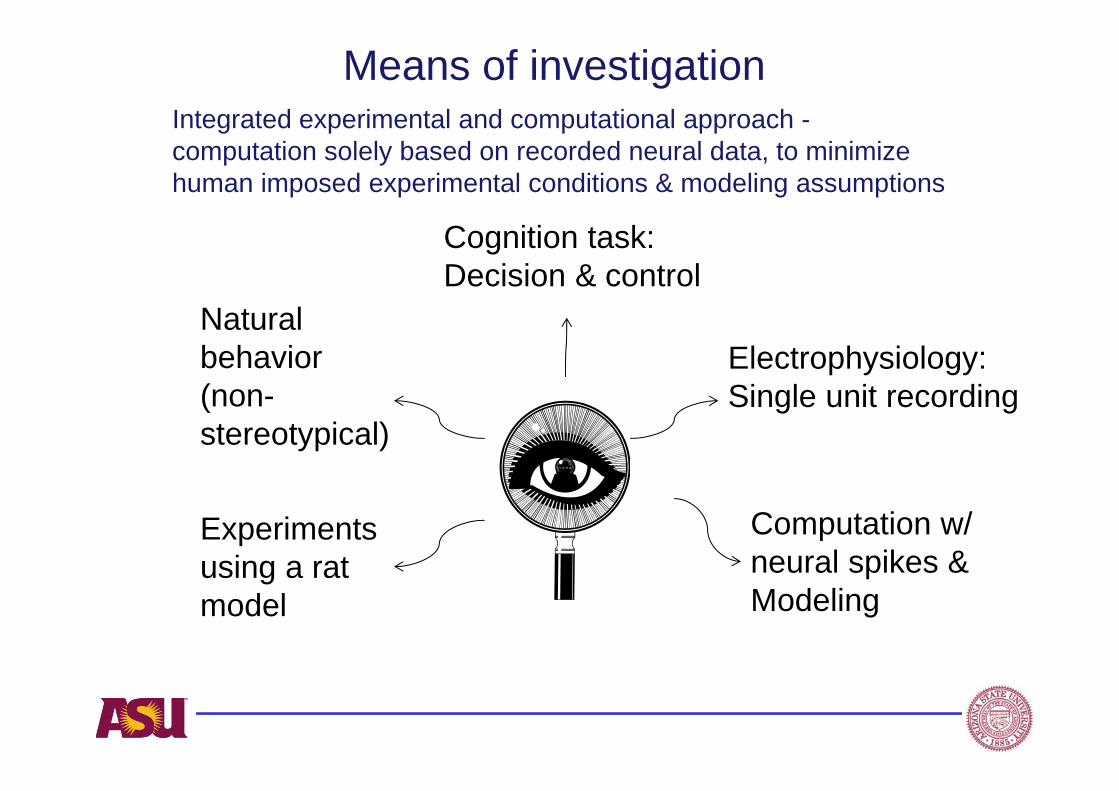
Means of investigation
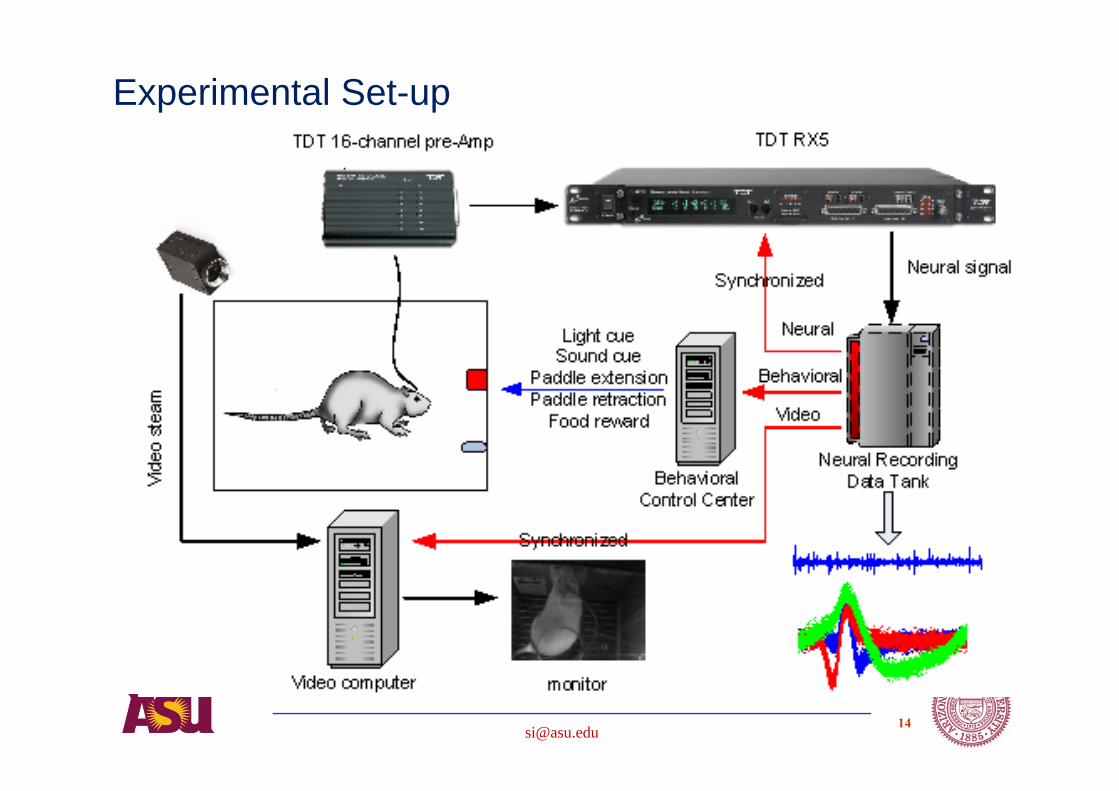
Experiments using a rat model
Natural behavior (non-stereotypical)
Cognition task:Decision & control
Electrophysiology:Single unit recording
Computation w/ neural spikes &Modeling
Integrated experimental and computational approach -computation solely based on recorded neural data, to minimize human imposed experimental conditions & modeling assumptions
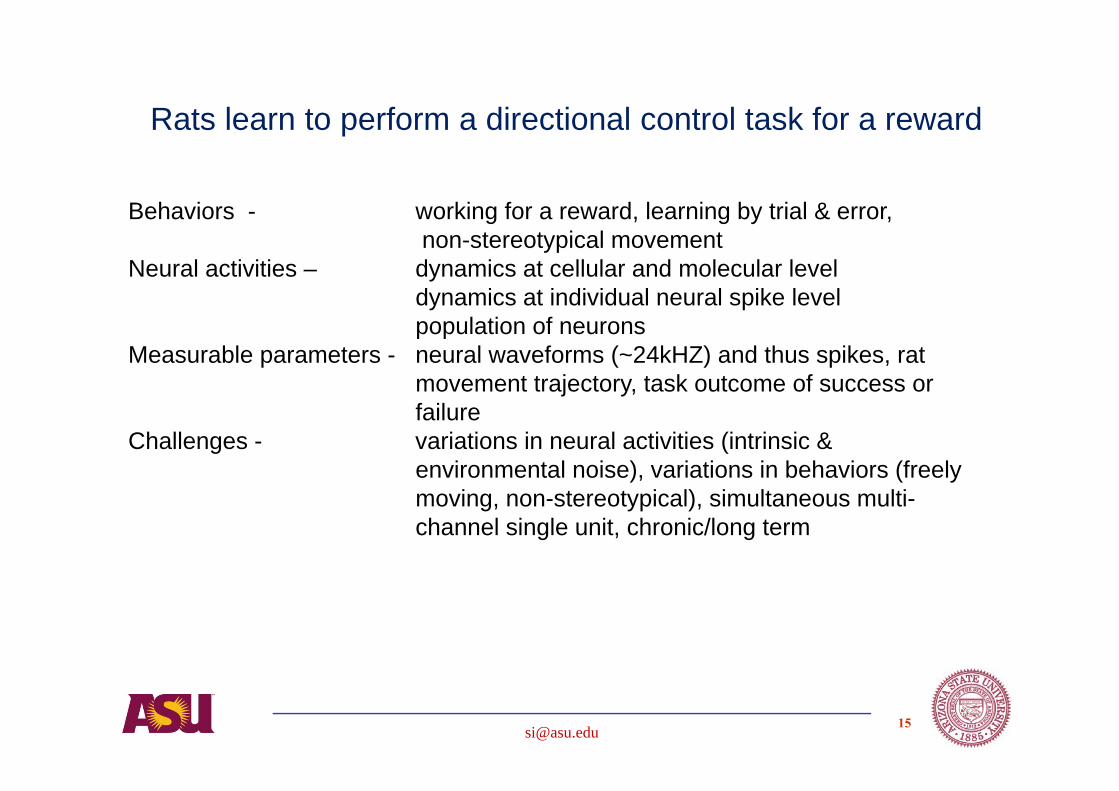
Behaviors - working for a reward, learning by trial & error,non-stereotypical movement
Neural activities – dynamics at cellular and molecular leveldynamics at individual neural spike levelpopulation of neurons
Measurable parameters - neural waveforms (~24kHZ) and thus spikes, ratmovement trajectory, task outcome of success or failure
Challenges - variations in neural activities (intrinsic & environmental noise), variations in behaviors (freely moving, non-stereotypical), simultaneous multi-channel single unit, chronic/long term
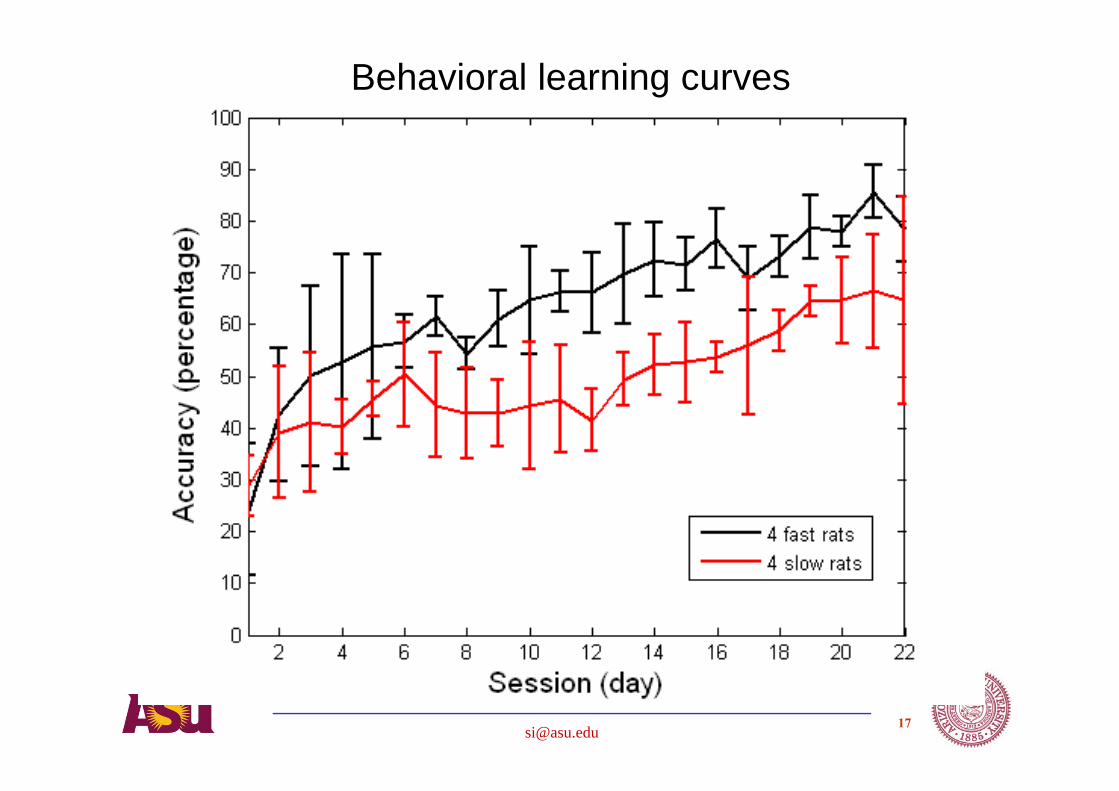
Rats learn to perform a directional control task for a reward
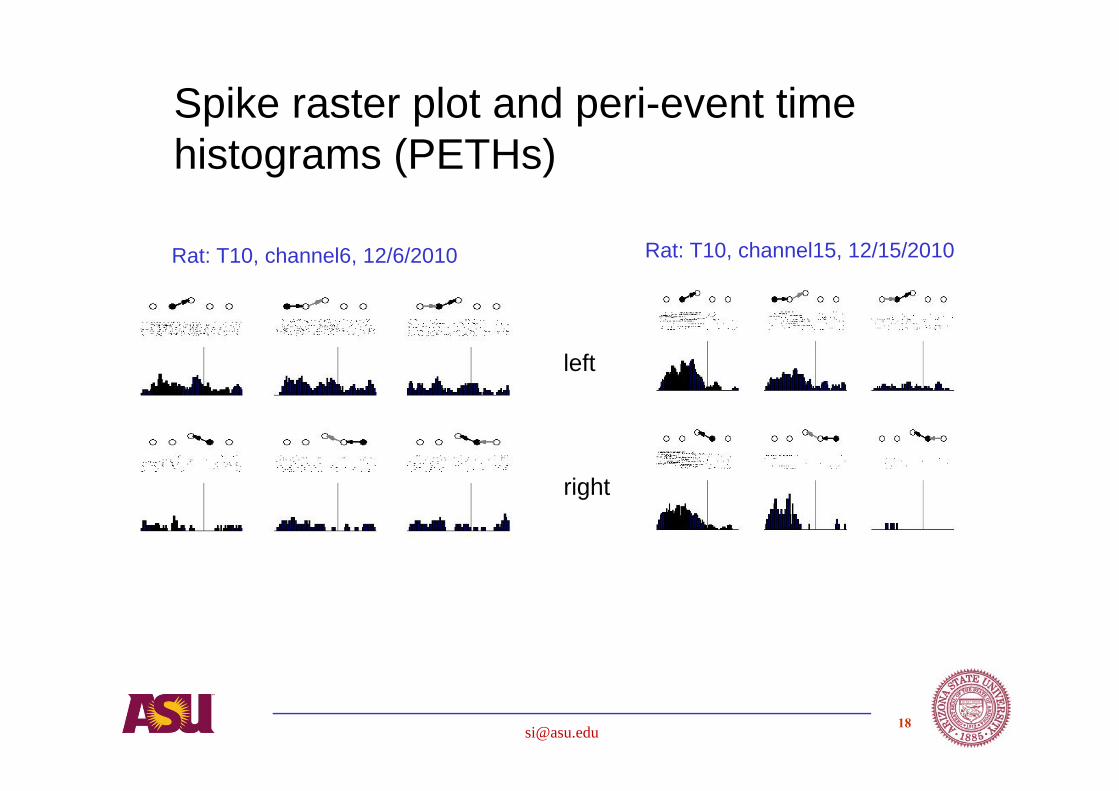
Rat: T10, channel6, 12/6/2010 Rat: T10, channel15, 12/15/2010
Spike raster plot and peri-event time histograms (PETHs)
left
right
Analysis based on hypothesis driven studies of
• Spike firing rates
• Spike timing
• Statistical properties
• Neural network properties – predictive, dynamic model
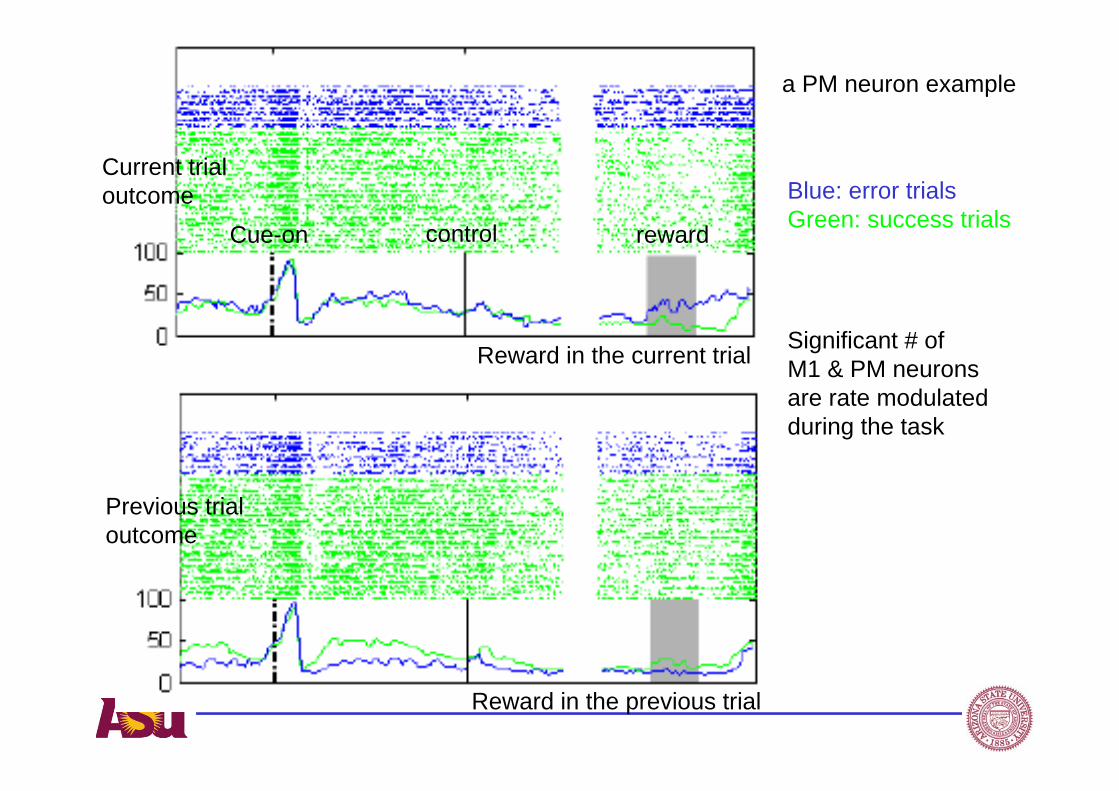
Blue: error trialsGreen: success trials
Reward in the current trial
Reward in the previous trial
Significant # of M1 & PM neurons are rate modulated during the task
Cue-on control reward
Current trial outcome
Previous trial outcome
a PM neuron example
What do we learn from a rate code during a cognitive control task?
• Insight on trial and error learning at single unit level, which was not available before, despite large body of literature on behavior studies, fMRI and EEG studies based on single session recordings
• Within a single session: rat cognitive dynamics may be used to simulate a human learning dynamics based on similar working memory load, attention levels
• Rats provided opportunity to provide long term neural data which gives us a slow motion picture of brain activities during trial and error learning.
Spike timing reveals strong correlation of neural activity with a trial start, over different phases of learning
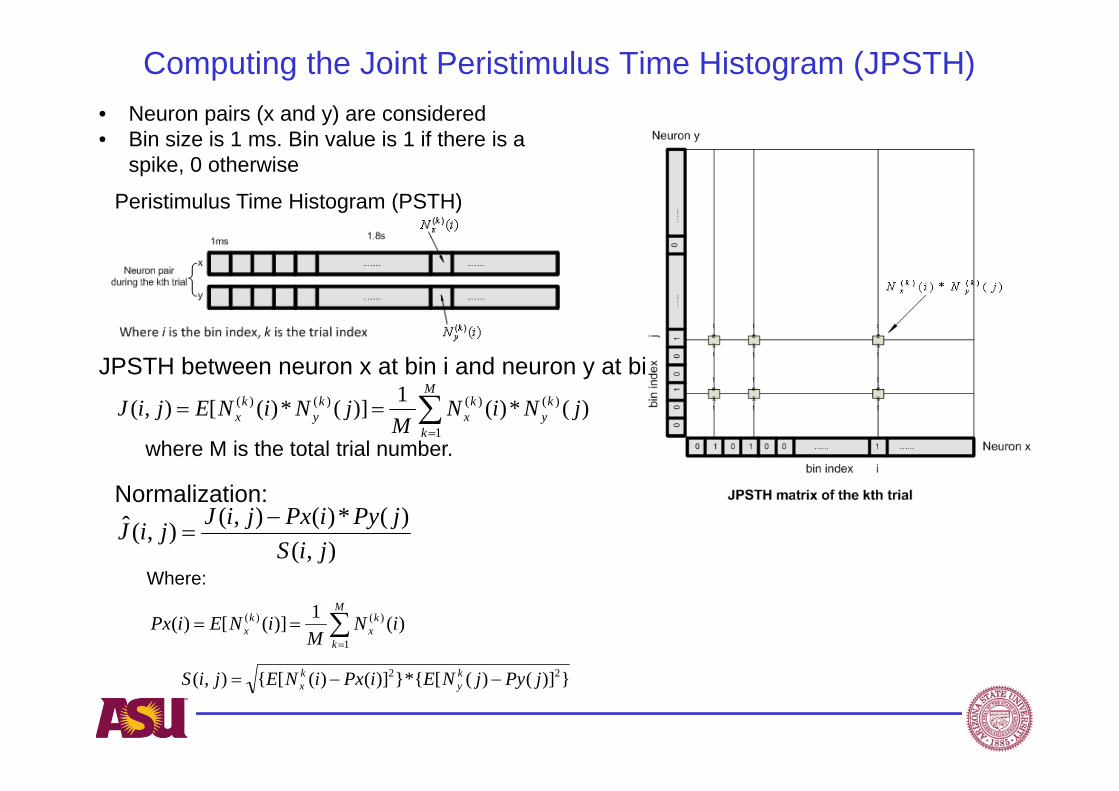
Computing the Joint Peristimulus Time Histogram (JPSTH)
Peristimulus Time Histogram (PSTH)
M
k
kx
kx iN
MiNEiPx
1
)()( )(1)]([)(
M
k
ky
kx
ky
kx jNiN
MjNiNEjiJ
1
)()()()( )(*)(1)](*)([),(
})]()([{*})]()([{),( 22 jPyjNEiPxiNEjiS ky
kx
JPSTH between neuron x at bin i and neuron y at bin j:
Normalization:
• Neuron pairs (x and y) are considered • Bin size is 1 ms. Bin value is 1 if there is a
spike, 0 otherwise
where M is the total trial number.
Where:),(
)(*)(),(),(ˆjiS
jPyiPxjiJjiJ
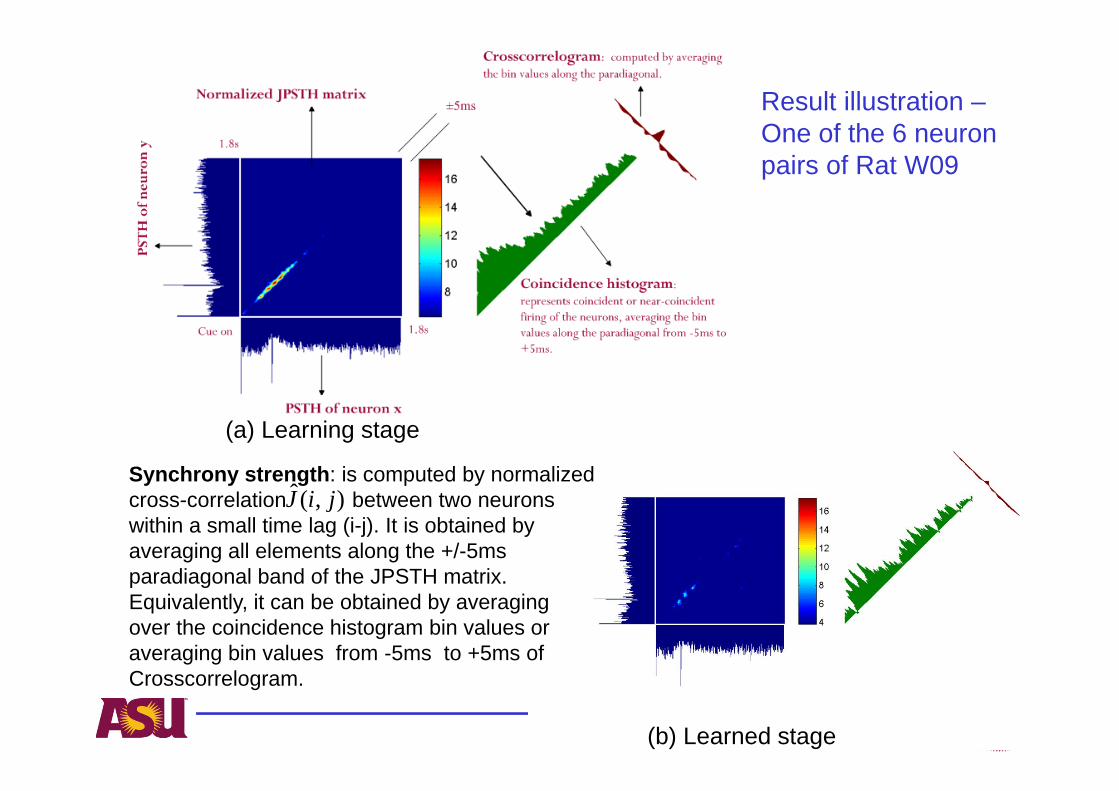
Result illustration –One of the 6 neuron pairs of Rat W09
(a) Learning stage
(b) Learned stage
Synchrony strength: is computed by normalized cross-correlation between two neurons within a small time lag (i-j). It is obtained by averaging all elements along the +/-5ms paradiagonal band of the JPSTH matrix. Equivalently, it can be obtained by averaging over the coincidence histogram bin values or averaging bin values from -5ms to +5ms of Crosscorrelogram.
),(ˆ jiJ
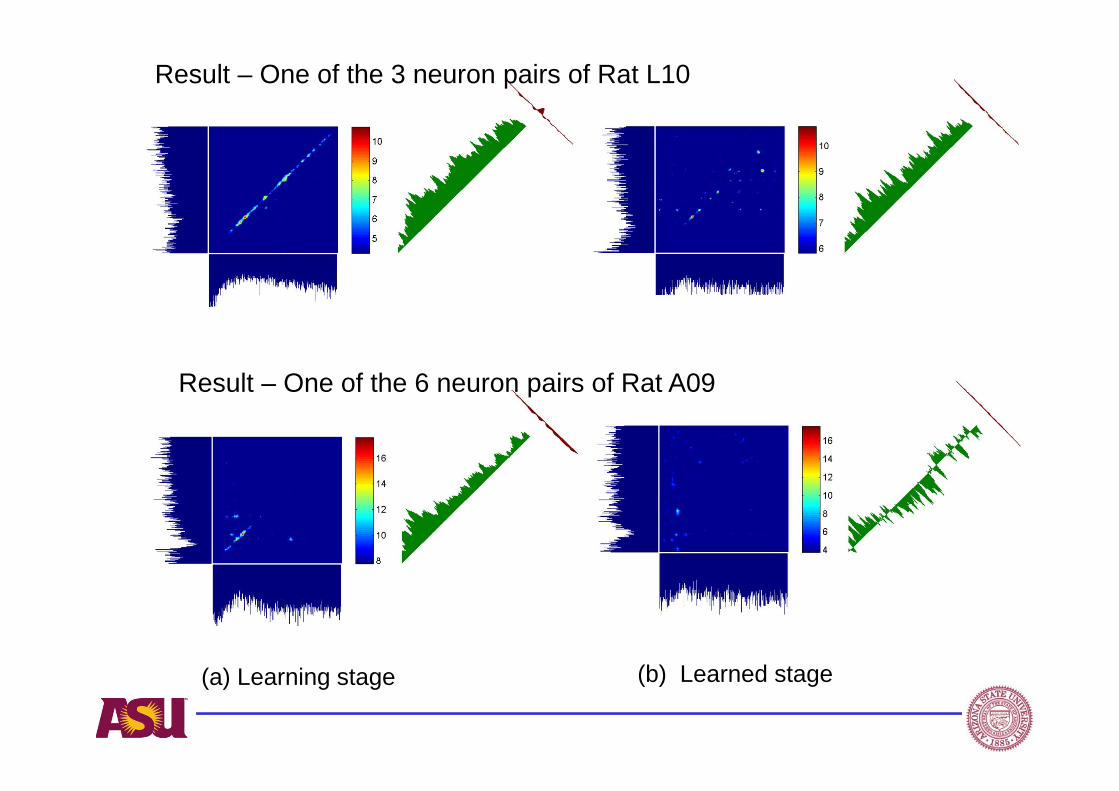
Result – One of the 3 neuron pairs of Rat L10
Result – One of the 6 neuron pairs of Rat A09
(a) Learning stage (b) Learned stage
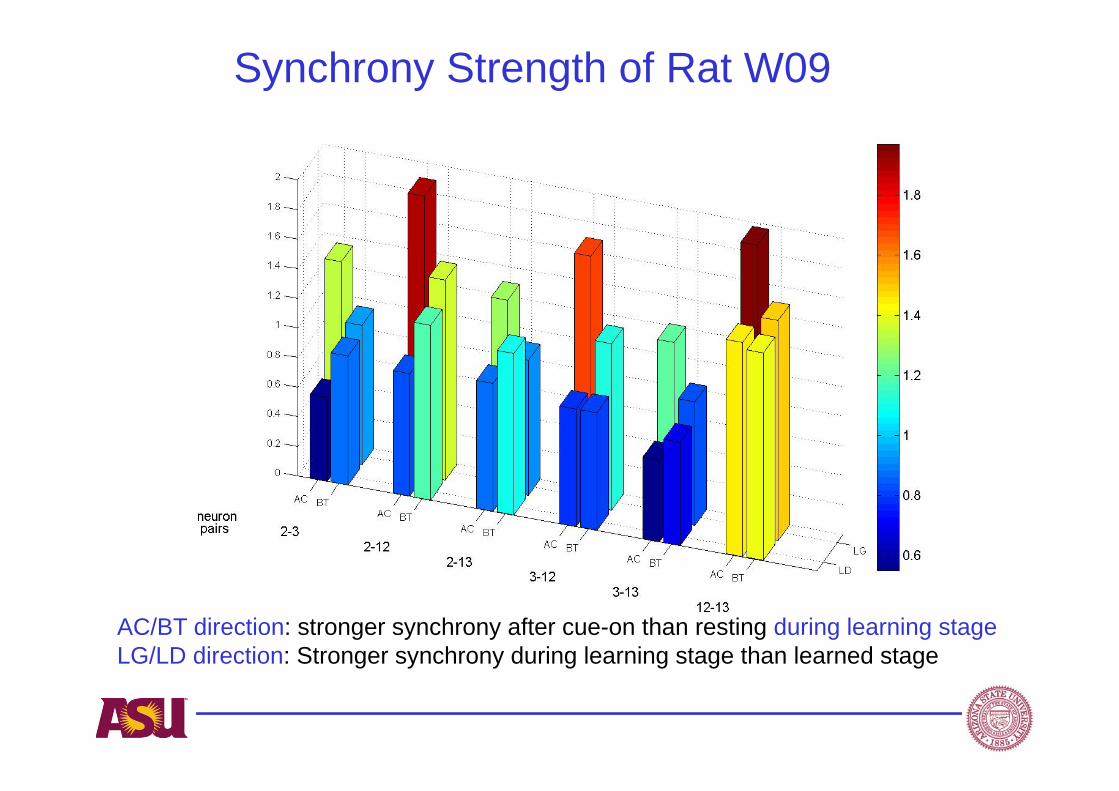
Synchrony Strength of Rat W09
AC/BT direction: stronger synchrony after cue-on than resting during learning stageLG/LD direction: Stronger synchrony during learning stage than learned stage
Network connectivity reveals functional synaptic plasticity between neurons over the course of learning
Synaptic efficacy • Any significant and consistent synaptic connections among neurons are
expected to result in significant neural spiking dependency among neurons.
• Spike-timing-dependent plasticity (STDP) - a biological process that adjusts the connection strengths based on the relative spike timing of an input neuron and a target neuron. if an input spike to a neuron tends, on average, to occur immediately before that neuron's output spike, then that particular input is made somewhat stronger. If an input spike tends, on average, to occur immediately after an output spike, then that particular input is made somewhat weaker
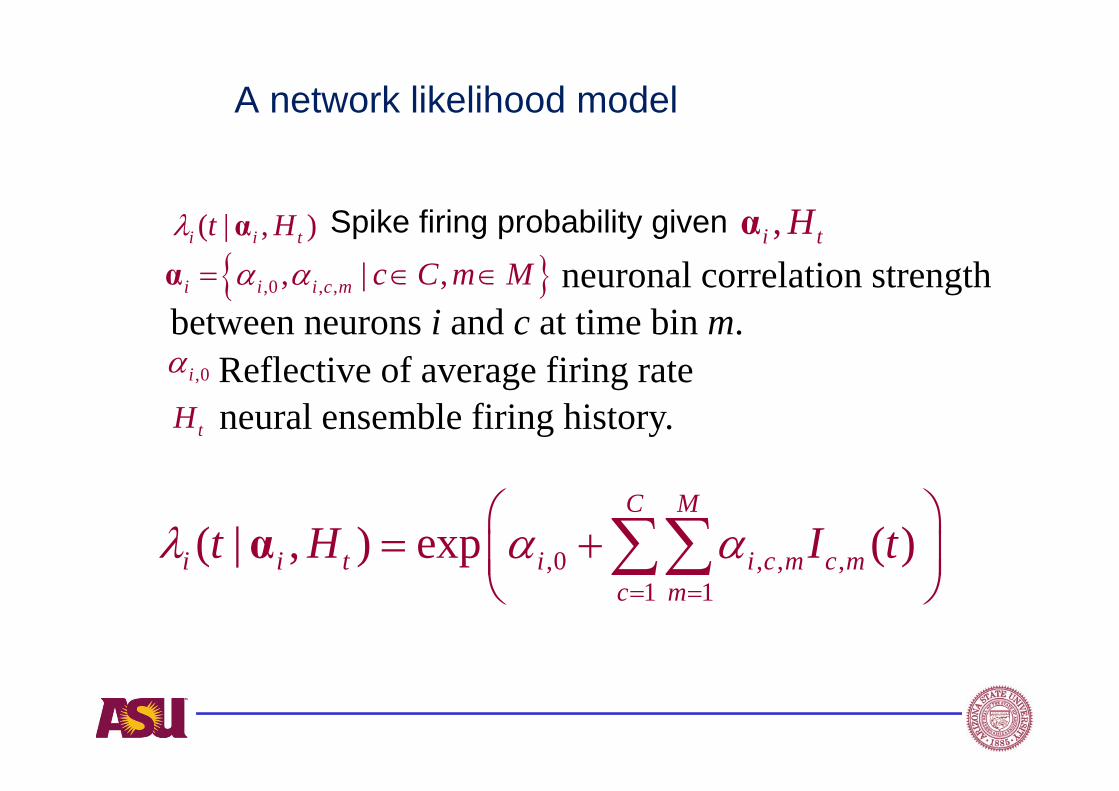
A network likelihood model
,0 , , ,1 1
( | , ) exp ( )C M
i i t i i c m c mc m
t H I t
α
( | , )i i tt H α ,i tHα ,0 , ,, | ,i i i c m c C m M α
tH,0i
Spike firing probability given
neuronal correlation strengthbetween neurons i and c at time bin m.
Reflective of average firing rateneural ensemble firing history.
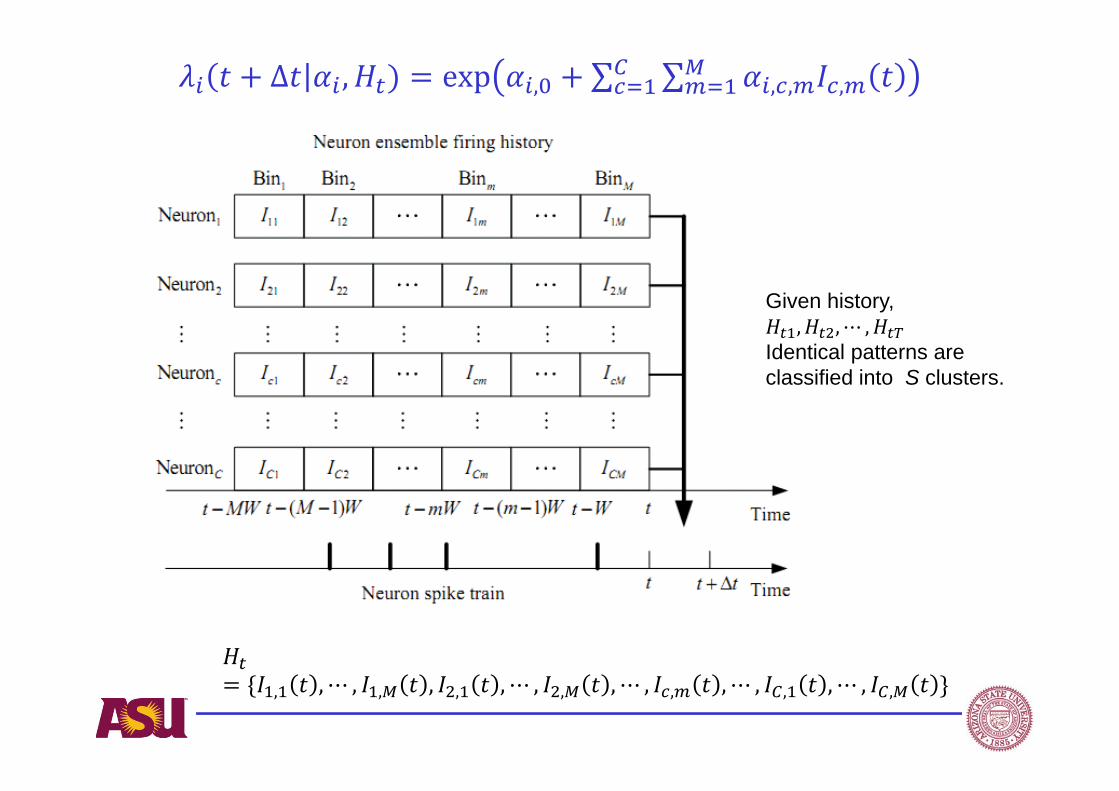
Δ , exp , ∑ ∑ , , ,
Given history, , , ⋯ ,
Identical patterns are classified into S clusters.
, , ⋯ , , , , , ⋯ , , , ⋯ , , , ⋯ , , , ⋯ , ,
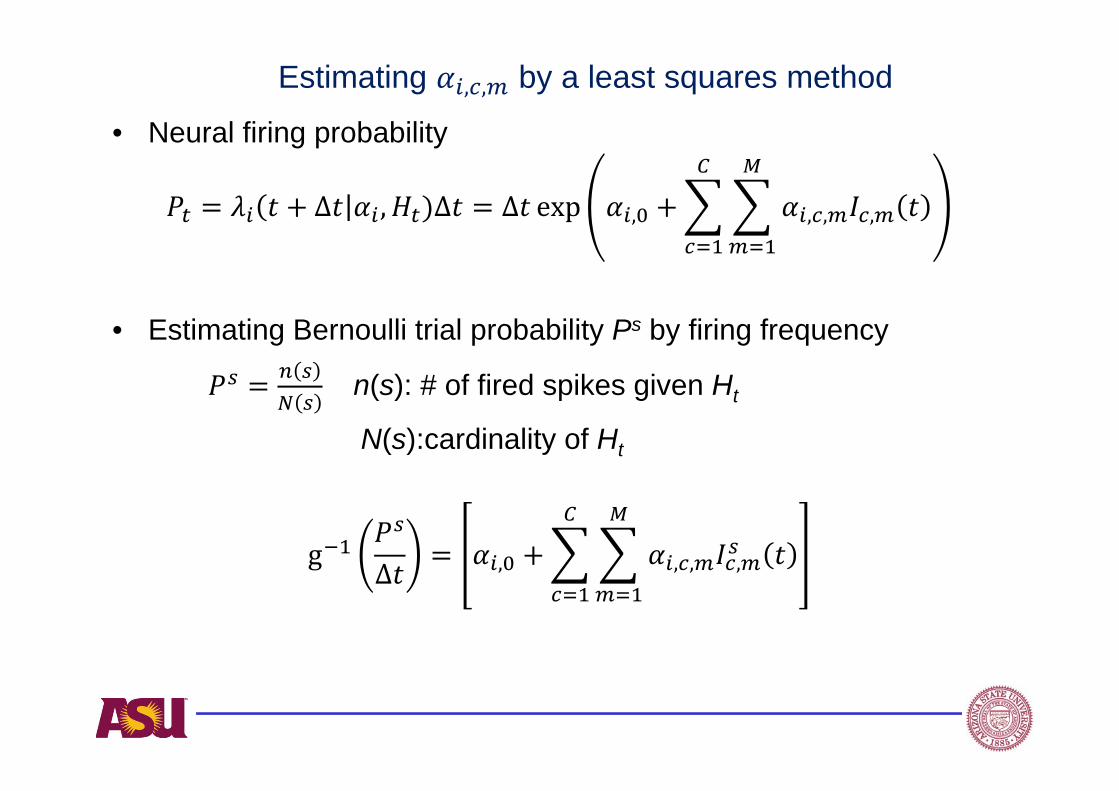
Estimating , , by a least squares method
• Neural firing probability
Δ , Δ Δ exp , , , ,
• Estimating Bernoulli trial probability Ps by firing frequency
n(s): # of fired spikes given Ht
N(s):cardinality of Ht
g Δ , , , ,
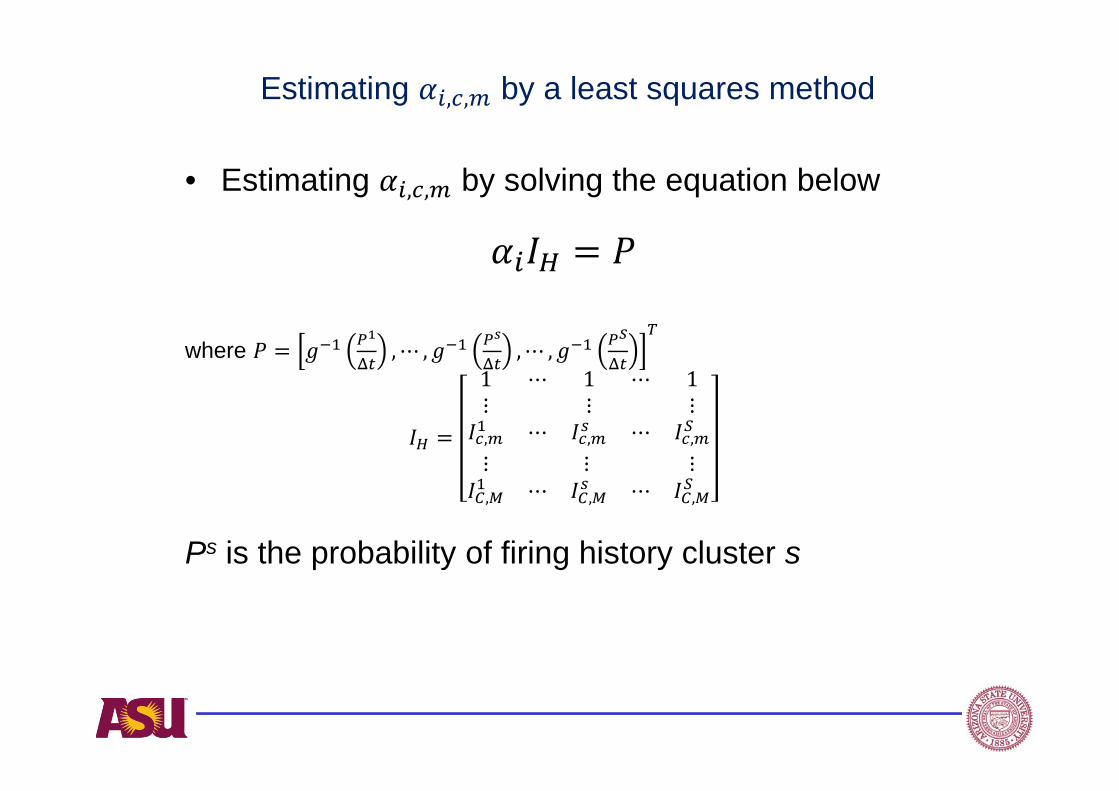
Estimating , , by a least squares method
• Estimating , , by solving the equation below
where , ⋯ , ,⋯ ,1 ⋯ 1 ⋯ 1⋮ ⋮ ⋮, ⋯ , ⋯ ,⋮ ⋮ ⋮, ⋯ , ⋯ ,
Ps is the probability of firing history cluster s
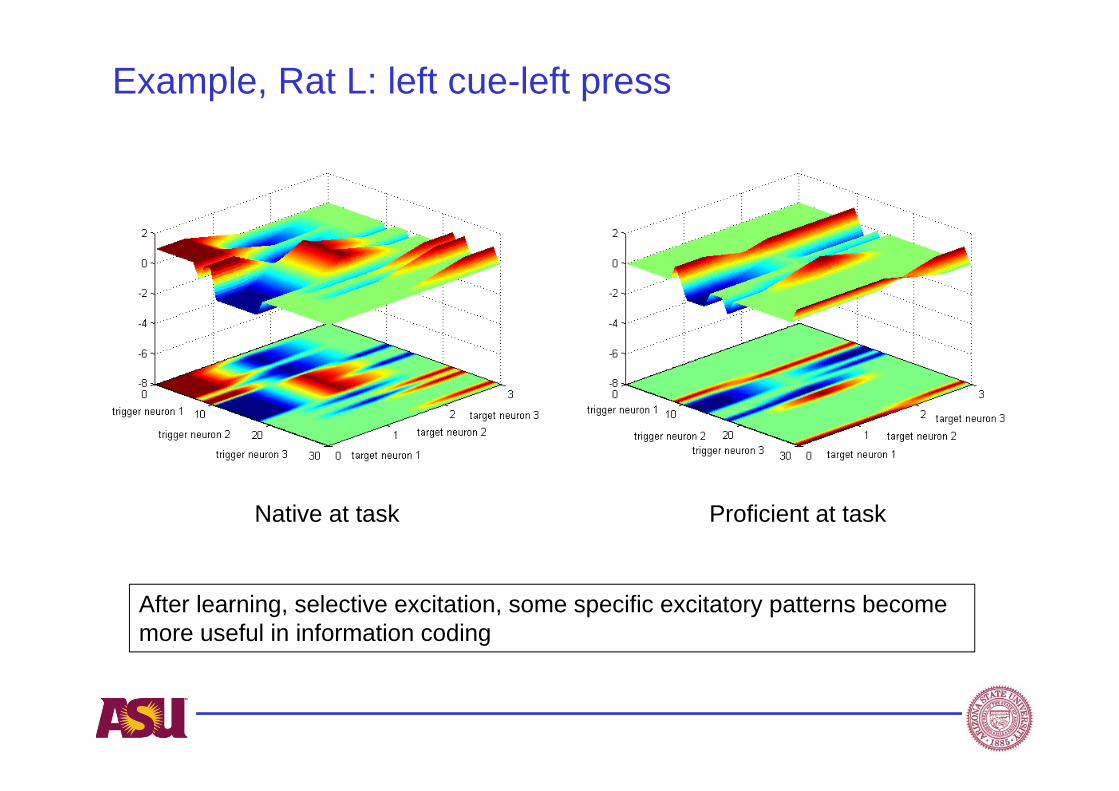
Example, Rat L: left cue-left press
Native at task Proficient at task
After learning, selective excitation, some specific excitatory patterns become more useful in information coding
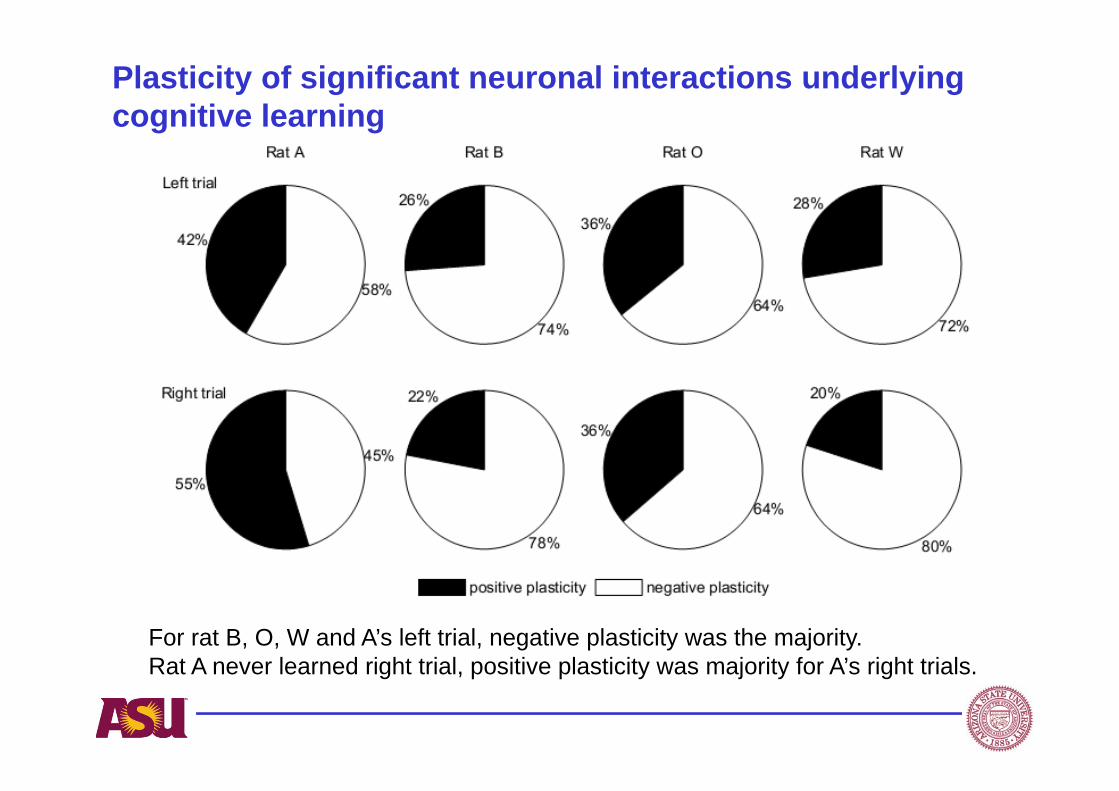
Plasticity of significant neuronal interactions underlying cognitive learning
For rat B, O, W and A’s left trial, negative plasticity was the majority. Rat A never learned right trial, positive plasticity was majority for A’s right trials.
Conclusions
1) Neural activities become organized as subjects perform voluntary and goal-directed tasks. This cortical re-organization seems to involve both spatial and temporal features, and additional properties such as plasticity.
2) More organized neural firing activities may lead to more clear and accurate predictions of the rat’s control decisions (a hypothesis).

Chenhui Yang Yuan Yuan Bing Cheng Hongwei Mao
Jacqueline Huynh Rachel AustinAmmer Dbeis
Amelia SpinradSarah Toews
Michelle Arnold
Acknowledgement
Research supported in part by NSF under grants ECS-0702057 and ECS-1002391, and ASU start-up special funds