Embed Size (px)
Citation preview

Jeffrey T. Kushner University of Pennsylvania Department of Chemistry Chem 636 Catalytic Activity
Since the initial discussions and meetings regarding the Pennsylvania State
Standardized Assessments in the spring 2000, I have ignored the various
administrators and presenters who said that the high school sciences would soon be
evaluated. I have never attempted to develop or utilize standard specific
performance tasks in any of my science classes. After recent professional
development sessions and curriculum meetings, I realize that, for the meantime,
Science PSSA’s are a current place in education and I need to amend my current
teaching practices to incorporate a more detailed description of PA Science
Standards and utilization of performance tasks to better prepare my current
students for the science PSSA. With the Science PSSA sample test coming in the
spring of 2007 and the implementation of the Science PSSA in the spring of 2008,
our Science department has decided to take a proactive role by providing students
an opportunity to become accustom to answering open-ended questions and writing
prompts dealing with the many different standards covered in the Science PSSA.
Through discussion with the new Science Curriculum Coordinator and the
High School Science Department Chair of the Upper Merion School District, I
developed a PSSA Performance Task Manual for the 9th grade Science curriculum.
Each performance task was developed from the Shell Representation Model
(Solano-Flores, et. al., 1999) and the Pennsylvania Science Item and Scoring
Sampler for grades 8 and 11 (Science, 2006). The Performance Task Manual for
the 9th grade Science students consists of 10 performance tasks covering a variety
of Assessment Anchors developed by the Pennsylvania Department of Education.
This manual provides one performance task to be administered for each month of
the school year along with a few extras developed for teacher preference.
The Performance Task manual was completed for review by the end of
December. In cooperation with the High School Science Department Chair, the
Science Curriculum Coordinator, and various members of the Science department,
the 9th Grade Performance Task Manual was supposed to be reviewed, discussed,

and edited to meet the expectations of the department. Unfortunately, only the
High School Science Curriculum coordinator provided me with written feedback in
regards to the PSSA Performance Task Manual. Selected tasks were sampled by
my 9th grade classes in February and March. Student responses were scored by the
students then discussed in an open discussion format to allow for questions and
feedback.
The development of this manual will not only help my current teaching, but
also the teaching of my fellow 9th grade science teachers. It will give us the
opportunity to modify our current strategies to better meet the assessment anchors
developed by the Pennsylvania Department of Education. It will also allow us to
align our current curriculum with the Pennsylvania State Science Standards.
Students sampling these performance tasks will benefit by having experienced a
variety of performance objectives and grading formats prior to their junior year
when they will complete the Science PSSA. Current research confirms that
students who are exposed to performance assessments and are familiar with
performance assessment grading practices have a greater capacity to demonstrate
their knowledge and ability on such tasks (Fuchs, et. al., 2000).
This manual will hopefully be incorporated into the 9th grade curriculum for
the 2007-08 school years. Each 9th grade teacher will administer the performance
task during one class period a month. After completion of the performance task,
students will be allowed to peer review other students work and discuss the
performance task with the teacher for better understanding of a proficient answer.
Student scores on these performance tasks will be entered into the Upper Merion
High School Performance Tracker® Program. This program will allow all science
teachers to view current class rosters and scores to identify individual strengths and
weaknesses in regards to the different Assessment Anchors of the PSSA.

High School Science Performance Task Manual
Upper Merion Area School District
Written by: Jeffrey T. Kushner
#1
Science Performance Task – S11.C.2.1.3; M11.E.4.1.1(1)
Name:______________________
Directions: Using the information provided, answer the questions below. For full credit, you must do the following:
1. Answer each part using clear, concise sentences with proper sentence and paragraph structure.
2. Write explanations which provide detail to the best of your ability stating the reason(s), example(s), or description(s) of the scenario.
A pendulum is a simple device where a weight is hung from a string. The weight is then pulled to the side and length released allowing the weight to swing back and forth. mass displacement Two students are conducting a pendulum lab and collect data about the time it takes a pendulum to swing back and forth. This time is known as the period of a pendulum. The following three graphs below show the results from the experiment. Using the data in the graphs,
A. What can you conclude about the effect of displacement on the period of a simple pendulum? Support your conclusion with information from the graph.
Period vs. displacement
0
0.5
1
1.5
2
0 10 20 30 40 50 60
Displacement (degrees)
Peri
od
(seco
nd
s)

#1
Science Performance Task – S11.C.2.1.3; M11.E.4.1.1(1)
Period vs Mass
0
0.2
0.4
0.6
0.8
1
1.2
1.4
1.6
1.8
0 1 2 3 4 5 6 7
Mass (kg)
Peri
od (s)
B. What can you conclude about the effect of length on the period of a simple pendulum? Support your conclusion with information from the graph.
C. What can you conclude about the effect of mass on the period of a simple pendulum? Support your conclusion with information from the graph.
D. When setting up a pendulum, what variable(s) are important to consider in order to control the period?
Period vs. Length
0
0.5
1
1.5
2
2.5
3
3.5
0 0.5 1 1.5 2 2.5 3
Length (meters)
Peri
od (seconds)

#1
Science Performance Task – S11.C.2.1.3; M11.E.4.1.1(1)
Rubric Part A (3 pts) 1 point for accurate interpretation of the trend 1 point for describing the trend quantitatively
1 point for accurately relating the trend back to the relevant variables
Part B (3 pts) 1 point for accurate interpretation of the trend 1 point for describing the trend quantitatively
1 point for accurately relating the trend back to the relevant variables
Part C (3 pts) 1 point for accurate interpretation of the trend 1 point for describing the trend quantitatively
1 point for accurately relating the trend back to the relevant variables
Part D (2 pts) 1 point for a correct answer based on answers to Parts A, B, & C.
1 point for adequately supporting the answer Advanced 10 pts to 11 pts Proficient 7 pts to 9 pts Basic 4 pt to 6 pts Below Basic 0 pts to 3 pts
#2
Science Performance Task – S11.A.2.1.3; M11.E.4.1.1(1)
BATCH 2
0
2
4
6
8
10
12
14
16
1 3 5 7 9 11 13 15 17 19
Diameter of Cookie
Num
ber of C
ookie
s
BATCH 3
0
5
10
15
20
25
30
35
40
45
1 2 3 4 5 6 7 8 9 10 11 1213 14 15 161718 19 20
Diameter of Cookie
Num
ber of C
ookie
s
BATCH 1
0
5
10
15
20
25
30
35
40
45
1 3 5 7 9 11 13 15 17 19
Diameter of Cookie
Num
ber of C
ookie
s
Name:______________________
Directions: Using the information provided, answer the questions below. For full credit, you must do the following:
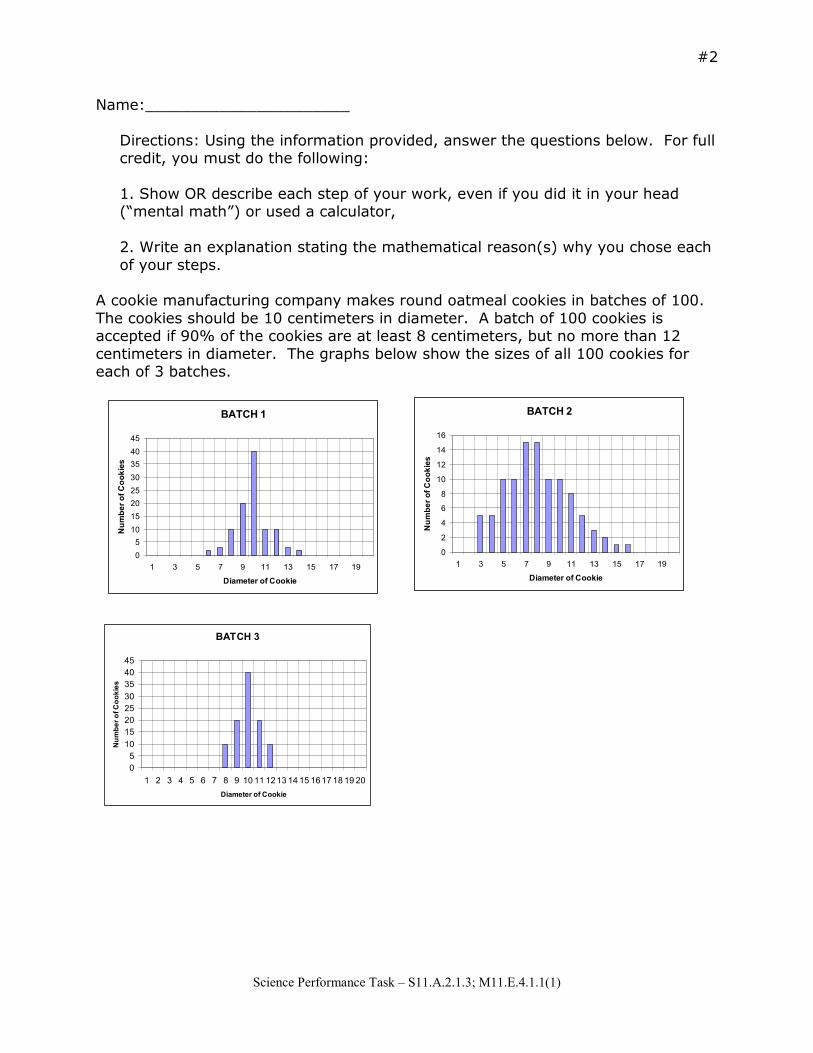
1. Show OR describe each step of your work, even if you did it in your head (“mental math”) or used a calculator,
2. Write an explanation stating the mathematical reason(s) why you chose each of your steps.
A cookie manufacturing company makes round oatmeal cookies in batches of 100. The cookies should be 10 centimeters in diameter. A batch of 100 cookies is accepted if 90% of the cookies are at least 8 centimeters, but no more than 12 centimeters in diameter. The graphs below show the sizes of all 100 cookies for each of 3 batches.

#2
Science Performance Task – S11.A.2.1.3; M11.E.4.1.1(1)
A. Analyze the sizes of the cookies in each batch and decide which batches (if any) should be accepted. Support your answer with percentage values.
.
B. It is too time-consuming to measure every cookie. Based on the data, how many cookies would you measure in each batch to decide if the entire batch of 100 should be accepted or rejected? State your answer as a recommendation to the cookie company and explain how you arrived at your recommendation.

#2
Science Performance Task – S11.A.2.1.3; M11.E.4.1.1(1)
Rubric
Part A (3 pts) 1 point for correct answer (accepted/rejected) 1 point for correct calculations 1 point for proper support with percentages Part B (6 pts) 1 point for choosing a number less than 100
2 points for connecting the recommendation to the data given for the three batches 1 point for discussing the relative advantages and disadvantages of the recommendation
1 point for directing the answer toward the cookie company 1 point for making recommendations beyond the parameters of the problem, for example: recommending testing of more batches, or evaluation of manufacturing process control
Advanced 8 pts to 9 pts Proficient 5 pts to 7 pts Basic 3 pts to 4 pts Below Basic 0 pts to 2 pts
#2
Science Performance Task – S11.A.2.1.3; M11.E.4.1.1(1)
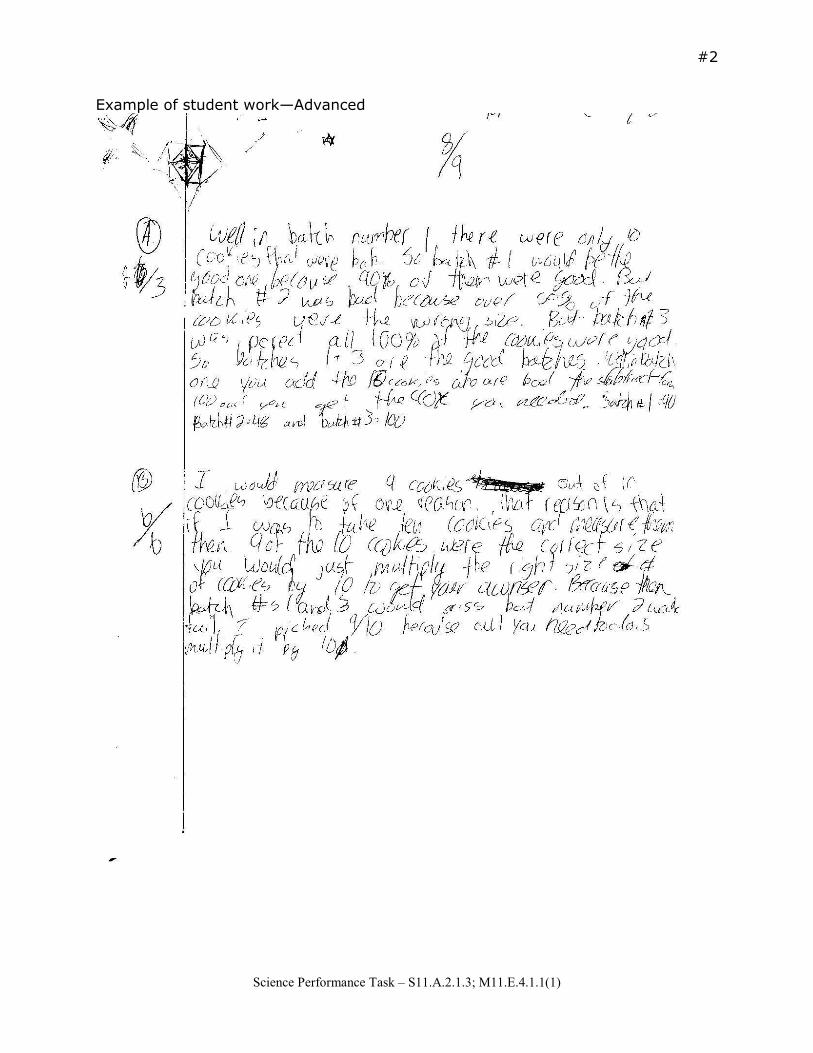
Example of student work—Advanced

#2
Science Performance Task – S11.A.2.1.3; M11.E.4.1.1(1)
Example of student work—Proficient

#2
Science Performance Task – S11.A.2.1.3; M11.E.4.1.1(1)
Example of student work—Below Basic

#3
Science Performance Task – S11.A.2.1.2; S11.C.1.1.2; S11.C.2.1.3
Name:______________________
Directions: Using the information provided, answer the questions below. For full credit, you must do the following:
1. Answer each part using clear, concise sentences with proper sentence and paragraph structure.
2. Write explanations which provide detail to the best of your ability stating the reason(s), example(s), or description(s) of the scenario.
Two cubes were heated in an oven until each cube reached 250 degrees Celsius (482 degrees F). The cubes were immediately placed in beakers that contained 50mL of room temperature water; cube X was placed in beaker 1 and cube Y was placed in beaker 2. The maximum temperature of the water in each beaker was recorded. A. Describe how the water in each beaker will be affected when the metal is inserted into the container. B. Describe how the water in each beaker will be affected over a duration of 10 minutes when each metal is inserted into the container.

#3
Science Performance Task – S11.A.2.1.2; S11.C.1.1.2; S11.C.2.1.3
Aluminum is generally a cheaper metal than iron, costing about $.05 less per gram. C. Which material would you choose to construct a container to carry hot liquids? Please explain your reasoning. D. Which material would you choose to construct a new grate that would be used over a propane grill? Please explain your reasoning.
#3
Science Performance Task – S11.A.2.1.2; S11.C.1.1.2; S11.C.2.1.3
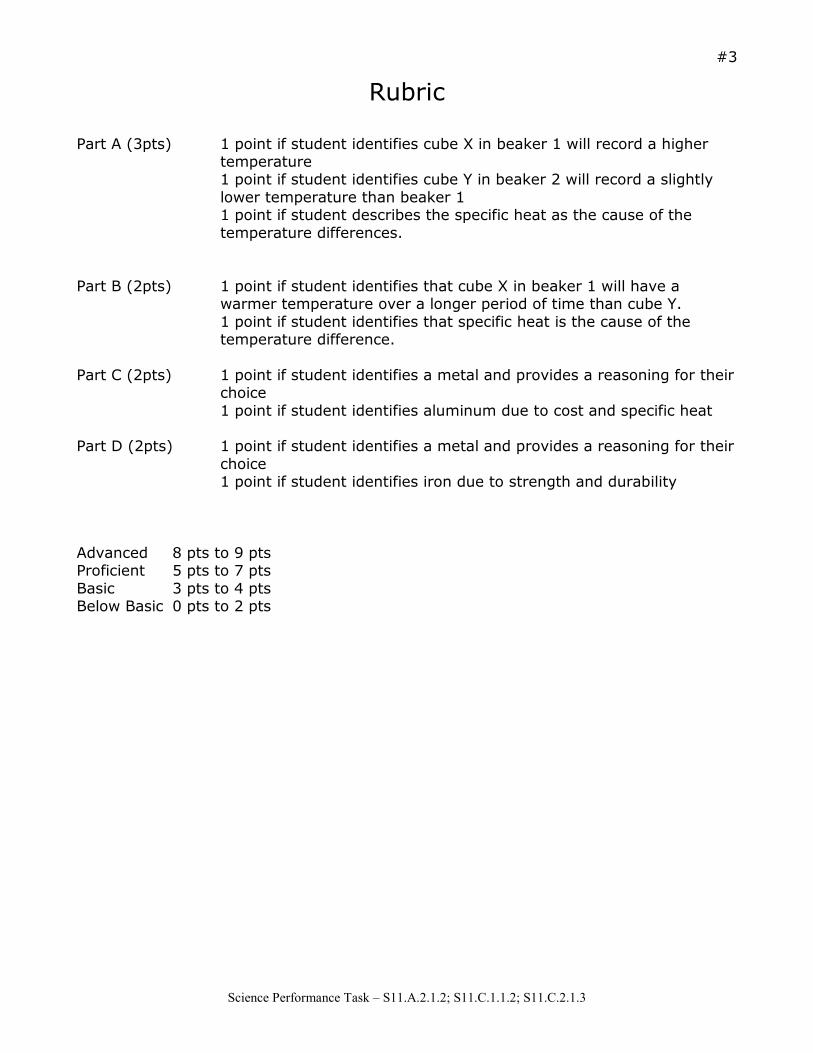
Rubric
Part A (3pts) 1 point if student identifies cube X in beaker 1 will record a higher temperature 1 point if student identifies cube Y in beaker 2 will record a slightly lower temperature than beaker 1 1 point if student describes the specific heat as the cause of the temperature differences.
Part B (2pts) 1 point if student identifies that cube X in beaker 1 will have a
warmer temperature over a longer period of time than cube Y. 1 point if student identifies that specific heat is the cause of the temperature difference.
Part C (2pts) 1 point if student identifies a metal and provides a reasoning for their
choice 1 point if student identifies aluminum due to cost and specific heat
Part D (2pts) 1 point if student identifies a metal and provides a reasoning for their
choice 1 point if student identifies iron due to strength and durability
Advanced 8 pts to 9 pts Proficient 5 pts to 7 pts Basic 3 pts to 4 pts Below Basic 0 pts to 2 pts

#3
Science Performance Task – S11.A.2.1.2; S11.C.1.1.2; S11.C.2.1.3
Example of student work—Advanced

#4
Science Performance Task – S11.C.3.1.1
Example of student work—Proficient
#4
Science Performance Task – S11.C.3.1.1
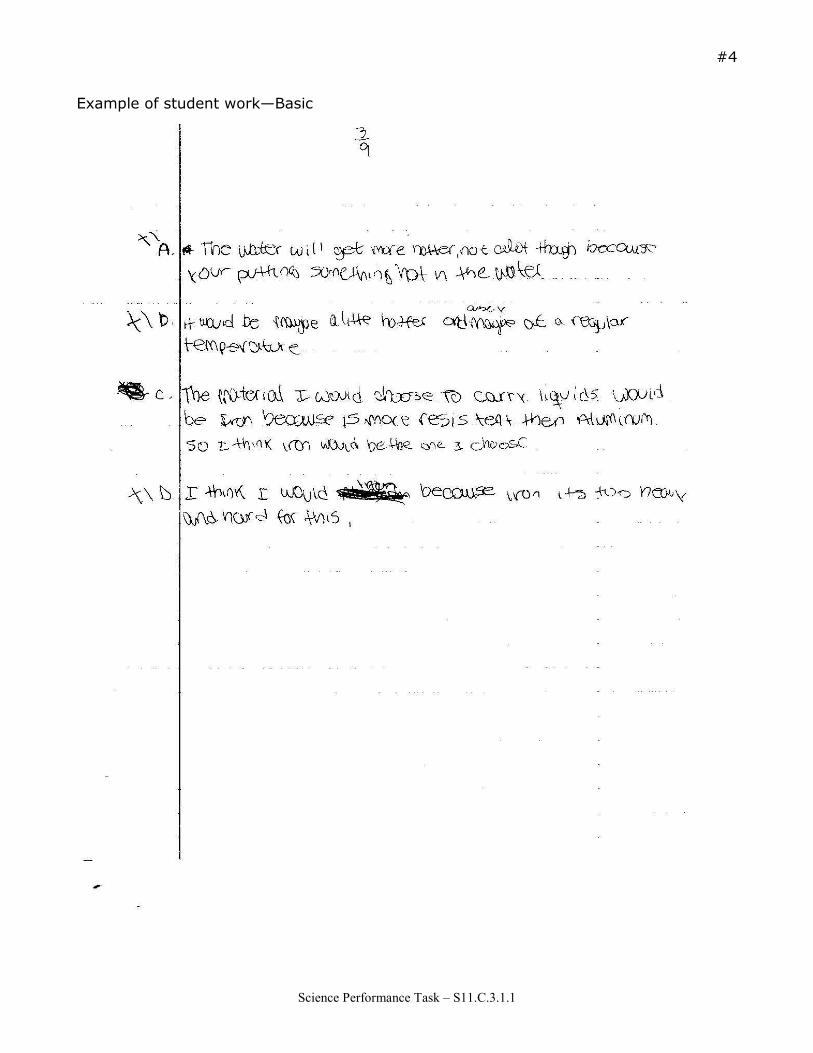
Example of student work—Basic
#4
Science Performance Task – S11.C.3.1.1
Name:______________________
Directions: Using the information provided, answer the questions below. For full credit, you must do the following:
1. Answer each part using clear, concise sentences with proper sentence and paragraph structure.
2. Write explanations which provide detail to the best of your ability stating the reason(s), example(s), or description(s) of the scenario.
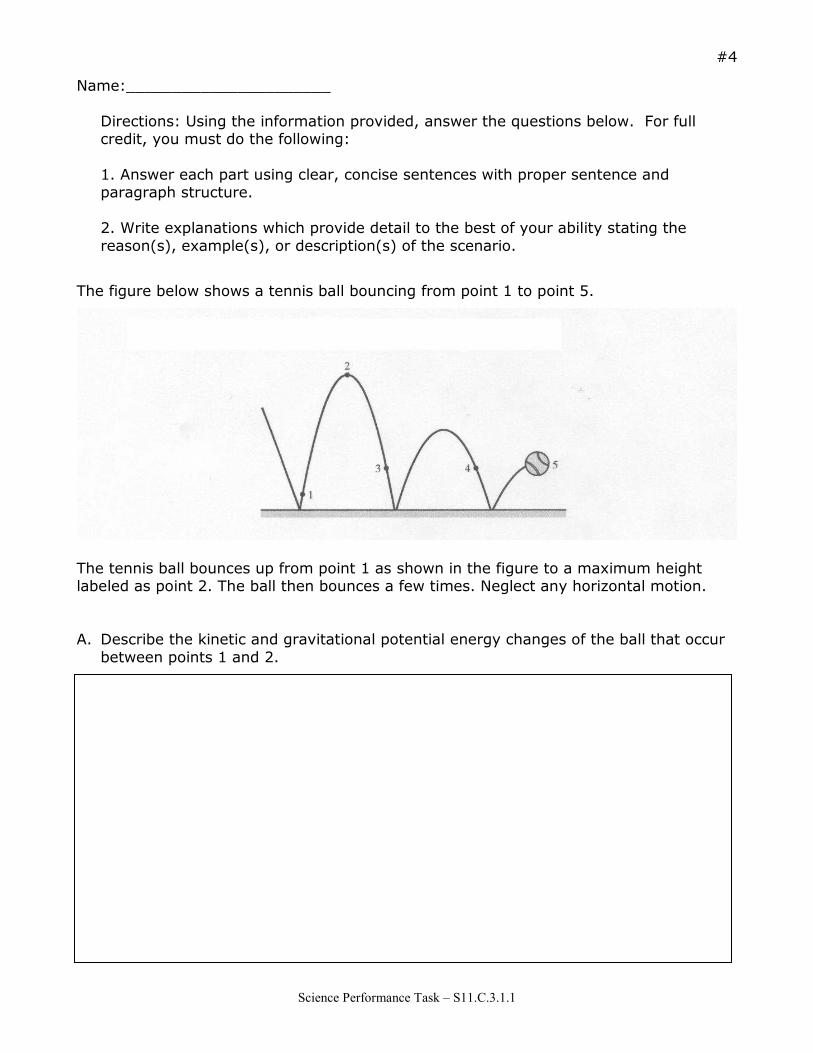
The figure below shows a tennis ball bouncing from point 1 to point 5.
The tennis ball bounces up from point 1 as shown in the figure to a maximum height labeled as point 2. The ball then bounces a few times. Neglect any horizontal motion. A. Describe the kinetic and gravitational potential energy changes of the ball that occur
between points 1 and 2.

#4
Science Performance Task – S11.C.3.1.1
B. Describe the kinetic and gravitational potential energy changes of the ball that occur
between points 2 and 3. C. Compare the kinetic energy of the ball at points 3 and 4. D. The tennis ball has less energy at point 5 than it had at point 3. Explain what
happened to the energy the ball had at point 3.

#4
Science Performance Task – S11.C.3.1.1
Rubric
Part A (2pts) 1 point if student identifies that gravitational energy increases from point 1 to point 2. 1 point if student identifies that kinetic energy decreases from point 1 to point 2.
Part B (2pts) 1 point if student identifies that gravitational energy decreases from
point 2 to point 3. 1 point if student identifies that kinetic energy increases from point 2 to point 3.
Part C (2pts) 1 point if student identifies that point 3 will have a greater kinetic
energy because if fell from a greater height at point 2. 1 point if student identifies that point 4 will have a lesser kinetic energy because it fell from a lower height between points 3 and 4.
Part D (3pts) 1 point if student identifies the greater height at point 2 contributing
to the greater energy at point 3. 1 point if student identifies the lower kinetic energy at point 5 due to the greater gravitational energy at point 5. 1 point if student describes forces such as friction or gravity which contribute to the loss of energy.
Advanced 8 pts to 9 pts Proficient 5 pts to 7 pts Basic 3 pts to 4 pts Below Basic 0 pts to 2 pts

#5
Science Performance Task – S11.A.1.3.1; S11.A.2.1.3; S11.B.3.1.2
Name:______________________
Directions: Using the information provided, answer the questions below. For full credit, you must do the following:
1. Answer each part using clear, concise sentences with proper sentence and paragraph structure.
2. Write explanations which provide detail to the best of your ability stating the reason(s), example(s), or description(s) of the scenario.
The box below shows a list of supplies that are available in a laboratory.
The class sets up an experiment with the four flasks as shown.
Flask 1: 100 mL water, 1 mL bromthymol blue, plant
Flask 2: 100 mL water, 1 mL bromthymol blue, 2 small fish
Flask 3: 100 mL water, 1 mL bromthymol blue, 2 small fish, plant
Flask 4: 100 mL water, 1 mL bromthymol blue
All four flasks are stoppered and placed under the floodlight.
• four flasks with stoppers
• floodlight
• tap water
• graduated cylinders
• small aquarium plants
• four small fish
• bromthymol blue (a chemical indicator that changes color from blue to yellow as the level of carbon dioxide in a solution increases)

#5
Science Performance Task – S11.A.1.3.1; S11.A.2.1.3; S11.B.3.1.2
A. Write a hypothesis about this experiment. Give a reasoning to support your hypothesis.
B. What color would the solution in each flask be after a few hours?
C. Explain how the processes that have occurred in each flask result in the observed color of the
bromthymol blue solutions.

#5
Science Performance Task – S11.A.1.3.1; S11.A.2.1.3; S11.B.3.1.2
Rubric
Part A (2pts) 1 point if student identifies a hypothesis pertaining to the colors of the four flasks. 1 point if student describes their hypothesis.
Part B (4pts) 1 point if student identifies flask 1 will stay blue; no change in color.
1 point if student identifies flask 2 will turn yellow; a change in color. 1 point if student identifies flask 3 will stay blue or turn a lighter shade of blue; no change to slight change in color. 1 point if student identifies flask 4 will stay blue; no change in color.
Part C (3pts) 1 point if student identifies that no chemical process occurs in flasks
1 and 4 to change the color of the indicator. 2 point if student describes that respiration of the fish in flasks 2 (and possibly 3) lead to the increase in carbon dioxide which turned the indicator yellow.
Advanced 8 pts to 9 pts Proficient 5 pts to 7 pts Basic 3 pts to 4 pts Below Basic 0 pts to 2 pts

#6
Science Performance Task – S11.A.1.3.2; S11.B.3.1.2; S11.D.2.1.1
Name:______________________
Directions: Using the information provided, answer the questions below. For full credit, you must do the following:
1. Answer each part using clear, concise sentences with proper sentence and paragraph structure.
2. Write explanations which provide detail to the best of your ability stating the reason(s), example(s), or description(s) of the scenario.
Carbon is found in many of the molecules that make up living organisms. The atmosphere contains an abundance of carbon in the form of carbon dioxide (CO2). The activities of living organisms are an essential part of the carbon cycle shown below. The level of CO2 present in the atmosphere has increased to the point where it traps heat energy. This increase in atmospheric CO2 has been suggested as one cause of the greenhouse effect that leads to global warming.

#6
Science Performance Task – S11.A.1.3.2; S11.B.3.1.2; S11.D.2.1.1
A. Name one group of organisms from the diagram and describe how it is able to remove CO2 from the environment. B. State one possible negative effect a warming trend would have on Earth. Specify how this effect will have a negative impact on the living environment. C. It has been suggested that the two actions listed below might help reduce the amount of CO2 in the atmosphere. Identify and explain how each may or may not contribute to reducing the CO2 level of the atmosphere.
a. Increase the number of trees through reforestation. b. Increase the number of animals through wildlife preservation.

#6
Science Performance Task – S11.A.1.3.2; S11.B.3.1.2; S11.D.2.1.1
Rubric
Part A (3pts) 1 point if student identifies a group of plants or algae that are able to remove carbon dioxide. 1 point if student describes that the process of photosynthesis removes carbon dioxide from the environment.
Part B (2pts) 1 point if student identifies a negative impact of global warming.
1 point if student describes how the negative impact of global warming can affect the living environment.
Part C (5pts) 1 point if student identifies that increased reforestation efforts could
help reduce global warming. 1 point if student describes that increased reforestation helps remove carbon dioxide from the atmosphere. 1 point if student identifies that increasing the number of animals on wildlife preservations will not affect a reduction in global warming. 1 point if student describes that increasing animals on wildlife preservations will not aid in a decline of carbon dioxide in the atmosphere. 1 point if student identifies another effort to help reduce global warming.
Advanced 8 pts to 9 pts Proficient 5 pts to 7 pts Basic 3 pts to 4 pts Below Basic 0 pts to 2 pts

#7
Science Performance Task – S11.A.3.3.3; S11.D.2.1.3; S11.D.2.1.4
Name:______________________
Directions: Using the information provided, answer the questions below. For full credit, you must do the following:
1. Answer each part using clear, concise sentences with proper sentence and paragraph structure.
2. Write explanations which provide detail to the best of your ability stating the reason(s), example(s), or description(s) of the scenario.
Base your answers to questions A and B on the map below, which represents a satellite image of Hurricane Gilbert in the Gulf of Mexico. Each X represents the position of the center of the storm on the date indicated.
A. Describe one threat to human life and property that could have been caused by the
arrival of Hurricane Gilbert along the coastline at the Texas-Mexico border. [1]

#7
Science Performance Task – S11.A.3.3.3; S11.D.2.1.3; S11.D.2.1.4
B. Provide one reason and explanation why Hurricane Gilbert weakened between
September 16 and September 18. C. A student, who just recently moved to the Dallas, Texas area, read an article in the
local newspaper stating that another major hurricane can be expected to affect this region within the next year. The student s family plans to stay in this region. As a result, the student decides to help prepare her home and family for this expected hurricane. State three specific actions the student could take to increase safety or reduce injury or damage from a hurricane.
D. Describe how the life of you and your family, living in Pennsylvania, could be
impacted by a hurricane in the Gulf of Mexico.

#7
Science Performance Task – S11.A.3.3.3; S11.D.2.1.3; S11.D.2.1.4
Rubric
Part A (2pts) 1 point if student identifies one threat to humans and property as a result of the hurricane. 1 point if student describes the one threat to humans and property as a result of the hurricane.
Part B (2pts) 1 point if student identifies one reason that hurricane Gilbert
weakened between September 16 and September 18. 1 point if student describes one reason that hurricane Gilbert weakened between September 16 and September 18.
Part C (2pts) 1 point if student identifies one action to increase safety and reduce
injury. 1 point if student identifies a second action to increase safety and reduce injury. 1 point if student identifies a third action to increase safety and reduce injury.
Part D (2pts) 1 point if student identifies one way their life could be impacted from
a hurricane in the Gulf of Mexico. 1 point if student describes one way their life could be impacted from a hurricane in the Gulf of Mexico.
Advanced 8 pts to 9 pts Proficient 5 pts to 7 pts Basic 3 pts to 4 pts Below Basic 0 pts to 2 pts

#8
Science Performance Task – S11.A.1.3.1; S11.A.2.1.3; S11.B.3.1.3; S11.B.3.2.1
Name:______________________
Directions: Using the information provided, answer the questions below. For full credit, you must do the following:
1. Answer each part using clear, concise sentences with proper sentence and paragraph structure.
2. Write explanations which provide detail to the best of your ability stating the reason(s), example(s), or description(s) of the scenario.
A tenth-grade class was interested in how the population of two types of plants had changed during the past eight years. The table below shows the estimated population size of these two types of plants in one county in Pennsylvania.
Estimated Population (by Year)
1996 1997 1998 1999 2000 2001 2002 2003
Penstemon
barbatus 21,000 16,500 15,000 12,000 10,000 16,000 20,000 22,000
Penstemon
palmeri 5000 7500 8000 11,000 11,000 16,000 18,000 20,000
A. On the grid below, plot the information from the table as a line graph.

#8
Science Performance Task – S11.A.1.3.1; S11.A.2.1.3; S11.B.3.1.3; S11.B.3.2.1
B. Using the trends from the data, hypothesize what the populations of these two plant may be for the next five years. Use a dashed line for Penstemon barbatus and a starred line for Penstemon palmeri.
C. Some of the students wanted to know if the increase in the population of Penstemon palmeri was due to the decreasing amount of water in the soil between 1996 and 2003. Write a hypothesis for the study.
D. Write two variables that must be kept constant in the students' experiment using the Penstemon palmeri.

#8
Science Performance Task – S11.A.1.3.1; S11.A.2.1.3; S11.B.3.1.3; S11.B.3.2.1
Rubric
Part A (3pts) 1 point if student identifies the y-axis label as 1 point if student identifies the x-axis label as 1 point if student draws an accurate line graph.
Part B (2pts) 1 point if student identifies an accurate five year estimate for
Penstemon barbatus. 1 point if student identifies an accurate five year estimate for Penstemon palmeri.
Part C (2pts) 1 point if student writes a hypothesis pertaining to Penstemon
palmeri. 1 point if student identifies deceased amounts of water and soil lead to an increase in population.
Part D (2pts) 1 point if student identifies one independent variable in this
experiment. 1 point if student identifies a second independent variable in this experiment.
Advanced 8 pts to 9 pts Proficient 5 pts to 7 pts Basic 3 pts to 4 pts Below Basic 0 pts to 2 pts
#9
Science Performance Task – S11.A.1.3.2; S11.D.1.1.3
Name:______________________
Directions: Using the information provided, answer the questions below. For full credit, you must do the following:
1. Answer each part using clear, concise sentences with proper sentence and paragraph structure.
2. Write explanations which provide detail to the best of your ability stating the reason(s), example(s), or description(s) of the scenario.
Soil erosion can cause problems during road construction, housing development, and farming. A. Describe two different ways that soil can be eroded. Describe how each situation,
road construction, housing development, and farming can be affected. B. Propose two models that would demonstrate different ways to prevent soil erosion. C. Explain how one model works and describe a test to evaluate the effectiveness of this
model.

#9
Science Performance Task – S11.A.1.3.2; S11.D.1.1.3
Rubric
Part A (5pts) 1 point if student identifies one way that soil can be eroded.
1 point if student identifies a second way that soil can be eroded. 1 point if student describes the effect of soil erosion on road construction. 1 point if student describes the effect of soil erosion on housing development. 1 point if student describes the effect of soil erosion on farming.
Part B (2pts) 1 point if student identifies one model to prevent soil erosion.
1 point if student identifies a second model to prevent soil erosion. Part C (2pts) 1 point if student explains the utility of the prevention model.
1 point if student develops an evaluation to test the effectiveness of the model.
Advanced 8 pts to 9 pts Proficient 5 pts to 7 pts Basic 3 pts to 4 pts Below Basic 0 pts to 2 pts

#10
Science Performance Task – S11.A.1.3.2; S11.B.3.1.1; S11.B.3.1.2; S11.B.3.1.3; S11.C.2.2.3
Name:______________________
Directions: Using the information provided, answer the questions below. For full credit, you must do the following:
1. Answer each part using clear, concise sentences with proper sentence and paragraph structure.
2. Write explanations which provide detail to the best of your ability stating the reason(s), example(s), or description(s) of the scenario.
Base your answers to the next set of questions using the woodland and pond ecosystems illustrated below. The members of these ecosystems interact with one another as well as with the nonliving environment.
A. What is the primary energy source for these ecosystems? Explain your reasoning
for your answer.

#10
Science Performance Task – S11.A.1.3.2; S11.B.3.1.1; S11.B.3.1.2; S11.B.3.1.3; S11.C.2.2.3
B. Describe how one consumer in the pond ecosystem is dependent on the primary
energy source.
C. The human who was fishing accidentally spill a large of amount of home heating oil when attempting to fill the oil tank to his nearby cabin. How could this oil spill affect members of both the pond and woodland ecosystem?
D. Describe how the pond ecosystem is likely to change after many years.
#10
Science Performance Task – S11.A.1.3.2; S11.B.3.1.1; S11.B.3.1.2; S11.B.3.1.3; S11.C.2.2.3
Rubric
Part A (3pts) 1 point if student identifies the sun as the primary energy source.
1 point if student describes why the sun is an important source of energy for the ecosystems.
Part B (2pts) 1 point if student identifies a consumer in the pond ecosystem.
1 point if student describes how the consumer is indirectly dependent on the sun for energy.
Part C (2pts) 1 point if student describes water pollution affecting many organisms. 1 point if student describes soil pollution affecting many organisms. 1 point if student describes how population sizes many decrease because of death or migration to different areas to avoid the pollution.
Part D (2pts) 1 point if student identifies that succession of the lake may take place
due to erosion. 1 point if student identifies that mud and sand many increase in the lake which would limit the size of the lake and amount of living organisms in the lake.
Advanced 8 pts to 9 pts Proficient 5 pts to 7 pts Basic 3 pts to 4 pts Below Basic 0 pts to 2 pts

Survey
Complete the following questions using the scoring rubric below.
Agree Disagree 4 3 2 1
1. The Performance Task provided an opportunity to demonstrate knowledge on this Science anchor
Agree Disagree 4 3 2 1
2. The Performance Task allowed answers to be completed in a variety of ways. Agree Disagree
4 3 2 1
3. The Performance Task provided opportunities to creativity display answers. Agree Disagree
4 3 2 1
4. The Performance Task provided opportunities for a variety learning abilities. Agree Disagree
4 3 2 1 5. The Performance Task provided opportunities for a variety of learning styles.
Agree Disagree 4 3 2 1
6. Something I liked about the Performance Task was…
7. Something I disliked about the Performance Task was…
8. Something I would like to see improved/changed about the Performance Task is…

REFERENCES 2005-2006 CSAP Demonstration Packet; Science Grade 10. Colorado Department of Education Unit of Student Assessment. 2005. http://www.cde.state.co.us/ (accessed: 12/21/06)
XIV. Introductory Physics, Grade 9/10. Massachusetts Comprehensive Assessment System; Release of Spring 2005 Test Items. Massachusetts Department of Education. http://www.doe.mass.edu/mcas/2005/release/ (accessed: 12/20/06)
Fuchs, D., Fuchs, L.S., Karns, K., Hamlett, L.C., Dutka, S., and Katzaroff, M. The importance of providing background information on the structure and scoring of performance assessments. Applied Measurements in Education. 200 12(1), 1-34 Ohio Ninth Grade Proficiency Test; Practice Test. Ohio Department of Education. Columbus, Ohio. 1995. http://www.ode.state.oh.us (accessed: 12/20/06) Physical Setting/Earth Science Reagents Examination; Test Sampler Draft 2000. New York State Education Department. http://emsc32.nysed.gov/osa/ (accessed: 12/20/06) Science item and scoring sampler; Grade 8. Pennsylvania Department of Education Bureau of Assessment and Accountability 2005-2006. http://www.pde.state.pa.us (accessed: 12/21/06) Science item and scoring sampler; Grade 11. Pennsylvania Department of Education Bureau of Assessment and Accountability 2005-2006. http://www.pde.state.pa.us (accessed: 12/21/06) Science Grade 11 Assessment Anchors and Eligible Content. Pennsylvania Department of Education Bureau of Assessment and Accountability 2005-2006. http://www.pde.state.pa.us (accessed: 12/21/06) Solano-Flores, Guillermo, Jovanovic, Jasna, Savelson, Richard J. Bachman, Marilyn. On the development and evaluation of a shell for generating science performance assessments. Int. J. Sci. Educ, 1999 21(3) 293-315. Zhai, Lijuan. Developing and conducting a student satisfaction survey. iJournal, n4, Mar, 2003.