Embed Size (px)
Citation preview

Jefferies Global Health Care
Conference
June 3, 2014
Health care is too important to stay the same.TM
Marc Naughton Executive Vice President and Chief Financial Officer

© 2014 Cerner Corporation. All rights reserved. This document contains Cerner confidential and/or proprietary information which may not be reproduced or transmitted without the express written consent of Cerner. 2
Safe Harbor Statement
This presentation may contain forward-looking statements, including without limitation, those regarding
projections of future revenues or earnings, operating margins, operating expenses, product development
and new markets or prospects for the Company’s solutions. Actual results may differ materially from
those expressed in such forward-looking statements. Factors that could cause or contribute to such
differences include, but are not limited to: (a) the possibility of product-related liabilities; (b) potential claims for system errors and warranties; (c) the possibility of interruption at our data
centers or client support facilities; (d) our proprietary technology may be subject to claims for infringement or misappropriation of intellectual
property rights of others, or may be infringed or misappropriated by others; (e) risks associated with our non-U.S. operations; (f) risks associated
with our ability to effectively hedge exposure to fluctuations in foreign currency exchange rates; (g) the potential for tax legislation initiatives
that could adversely affect our tax position and/or challenges to our tax positions in the United States and non-U.S. countries; (h) risks
associated with our recruitment and retention of key personnel; (i) risks related to our dependence on third party suppliers; (j) risks inherent
with business acquisitions and combinations; (k) the potential for losses resulting from asset impairment charges; (l) risks associated with
volatility and disruption resulting from global economic conditions; (m) managing growth in the new markets in which we offer solutions, health
care devices and services, (n) changing political, economic, regulatory and judicial influences; (o) government regulation; (p) significant
competition and market changes; (q) variations in our quarterly operating results; (r) potential inconsistencies in our sales forecasts compared
to actual sales; (s) volatility in the trading price of our common stock and the timing and volume of market activity; (t) our directors’ authority to
issue preferred stock and the anti-takeover provisions in our corporate governance documents; and (u) material adverse resolution of legal
proceedings.
Additional discussion of these and other risks, uncertainties and factors affecting the Company's business
is contained in the Company's periodic filings with the Securities and Exchange Commission. The reader
should not place undue reliance on forward-looking statements, since the statements speak only as of the
date that they are made. The Company undertakes no obligation to update forward-looking statements to
reflect changed assumptions, the occurrence of unanticipated events or changes in future operating
results, financial condition or business over time.
A reconciliation of non-GAAP financial measures discussed in this presentation can be found in the
Appendix to this presentation and the Company’s most recent earnings release that was furnished to the
SEC and posted on the investor section of Cerner.com.
© 2014 Cerner Corporation. All rights reserved. This document contains Cerner confidential and/or proprietary information which may not be reproduced or transmitted without the express written consent of Cerner. 3
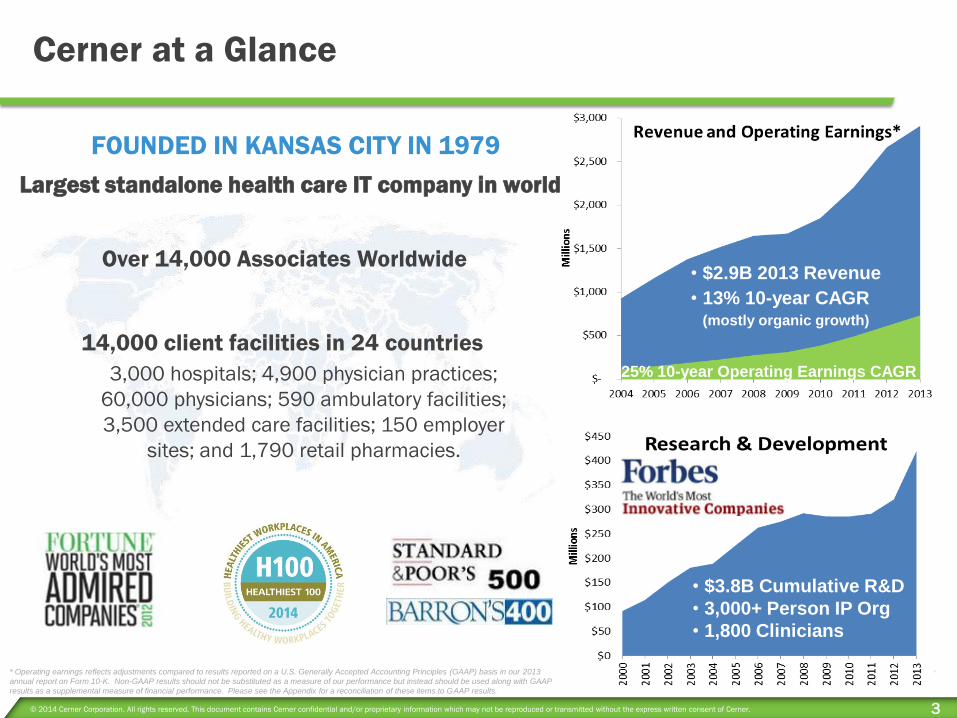
Cerner at a Glance
Over 14,000 Associates Worldwide
* Operating earnings reflects adjustments compared to results reported on a U.S. Generally Accepted Accounting Principles (GAAP) basis in our 2013
annual report on Form 10-K. Non-GAAP results should not be substituted as a measure of our performance but instead should be used along with GAAP
results as a supplemental measure of financial performance. Please see the Appendix for a reconciliation of these items to GAAP results.
• $3.8B Cumulative R&D
• 3,000+ Person IP Org
• 1,800 Clinicians
25% 10-year Operating Earnings CAGR
• $2.9B 2013 Revenue
• 13% 10-year CAGR (mostly organic growth)
14,000 client facilities in 24 countries
3,000 hospitals; 4,900 physician practices;
60,000 physicians; 590 ambulatory facilities;
3,500 extended care facilities; 150 employer
sites; and 1,790 retail pharmacies.
Largest standalone health care IT company in world
FOUNDED IN KANSAS CITY IN 1979
© 2014 Cerner Corporation. All rights reserved. This document contains Cerner confidential and/or proprietary information which may not be reproduced or transmitted without the express written consent of Cerner. 4
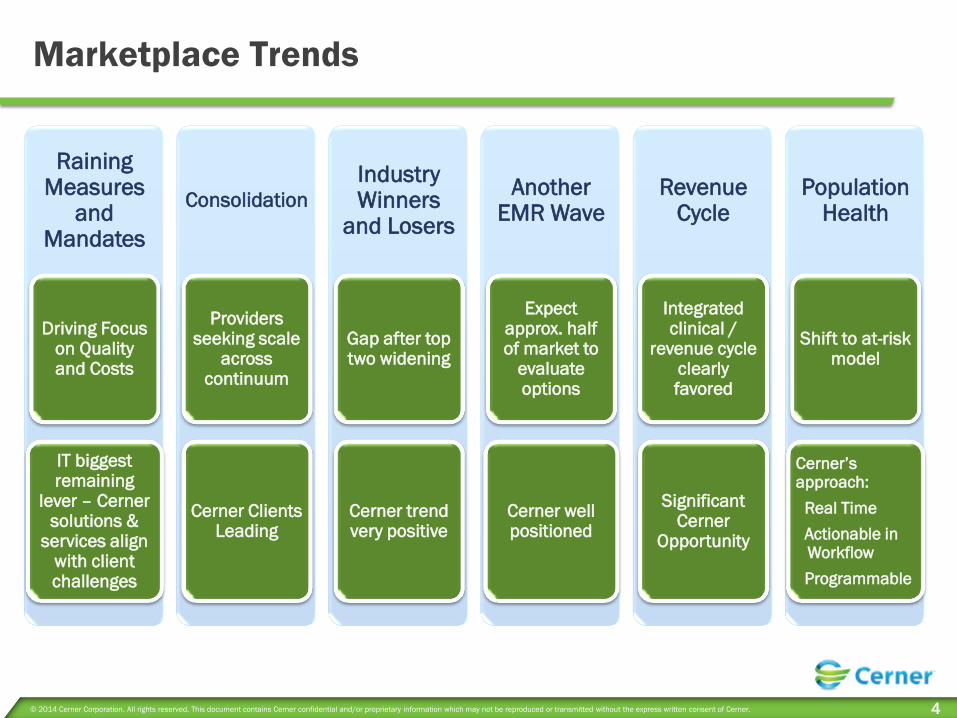
Marketplace Trends
Raining Measures
and Mandates
Driving Focus on Quality and Costs
IT biggest remaining
lever – Cerner solutions &
services align with client challenges
Consolidation
Providers seeking scale
across continuum
Cerner Clients Leading
Industry Winners
and Losers
Gap after top two widening
Cerner trend very positive
Another EMR Wave
Expect approx. half of market to
evaluate options
Cerner well positioned
Revenue Cycle
Integrated clinical /
revenue cycle clearly favored
Significant Cerner
Opportunity
Population Health
Shift to at-risk model
Cerner’s approach:
Real Time
Actionable in Workflow
Programmable

© 2014 Cerner Corporation. All rights reserved. This document contains Cerner confidential and/or proprietary information which may not be reproduced or transmitted without the express written consent of Cerner. 5
EHR Incentive Program
ICD-10 Value-Based Purchasing
Readmission Reduction Program
New Electronic Claims Submission Rules
Increased Quality Metrics
Raining Measures & Mandates
Driving focus on Quality and Costs
IT biggest remaining lever

© 2013 Cerner Corporation. All rights reserved. This document contains Cerner confidential and/or proprietary information which may not be reproduced or transmitted without the express written consent of Cerner. 6
-30
-10
10
30
50
70
90
110
130128
26 23
12
2 6
116
24 18
-12 -13
-25
104
11
-7
Acq
uir
ed H
osp
ita
ls
Potential HIT impact of Hospital M&A 2013 Cumulative Year
MEDITECH
Cerner clients accounted for 61% of buying activity
*Total Acquisitions – Total acquisitions by clients
**Potential Losses – Total acquisitions by competitors clients
Source: HIMSS Analytics 2013
**
*
EMR footprint in 17 of top 30
U.S. Health Systems
7 © Cerner Corporation. All rights reserved. This document contains Cerner confidential and/or proprietary information belonging to Cerner and/or its related affiliates which may not be reproduced or transmitted in any form or by any means without the express written consent of Cerner.
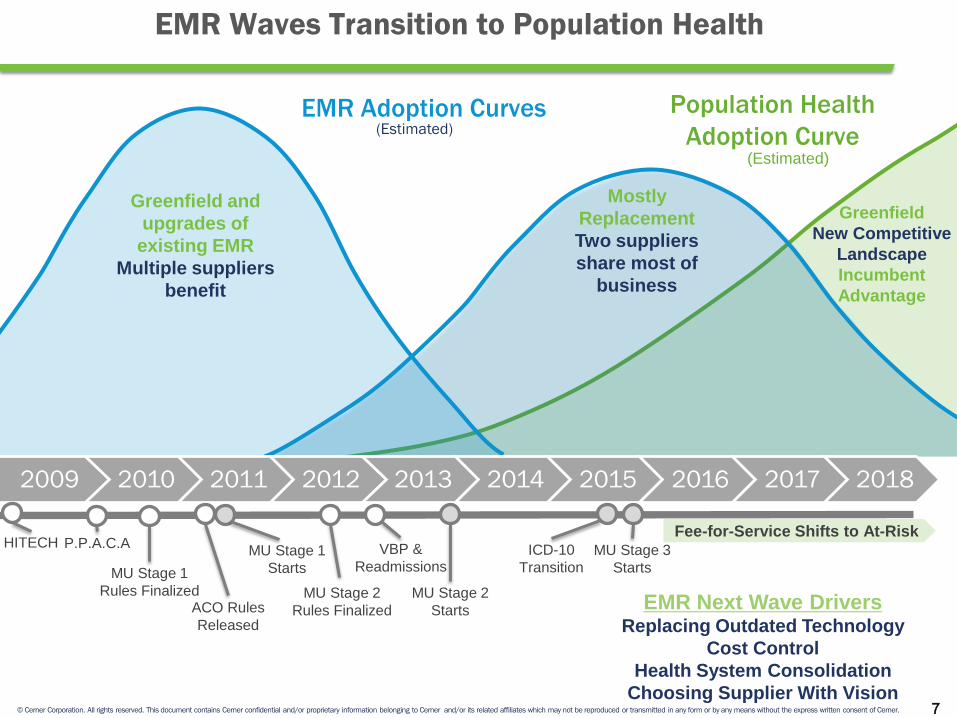
EMR Waves Transition to Population Health
2009 2010 2011 2012 2013 2014 2015 2016 2017 2018
HITECH MU Stage 1
Starts
VBP &
Readmissions
MU Stage 2
Starts
ICD-10
Transition
MU Stage 3
Starts
P.P.A.C.A
MU Stage 1
Rules Finalized MU Stage 2
Rules Finalized ACO Rules
Released
Population Health
Adoption Curve (Estimated)
EMR Adoption Curves (Estimated)
EMR Next Wave Drivers Replacing Outdated Technology
Cost Control
Health System Consolidation
Choosing Supplier With Vision
Fee-for-Service Shifts to At-Risk
Mostly
Replacement
Two suppliers
share most of
business
Greenfield and
upgrades of
existing EMR
Multiple suppliers
benefit
Greenfield
New Competitive
Landscape
Incumbent
Advantage

© 2014 Cerner Corporation. All rights reserved. This document contains Cerner confidential and/or proprietary information which may not be reproduced or transmitted without the express written consent of Cerner. 8
Revenue Cycle
•Revenue up 51% to $156M in 2013
•Strength across all revenue cycle solutions and services
•Delivering Patient Accounting
•Over 900 live sites
•150 hospitals; 800 clinics
•Significant demand for fully integrated platform
Strong Growth &
Operational Progress
•Partner with client to manage revenue cycle operations
•Modernize revenue cycle by innovating real time – remove human intervention
•Focus on controlling cost to collect
•Preparing for future reimbursement models
RevWorks

© 2014 Cerner Corporation. All rights reserved. This document contains Cerner confidential and/or proprietary information which may not be reproduced or transmitted without the express written consent of Cerner. 9
Population Health
Market Trends
•Fee-for-service models going away
•Providers will be accountable for health, not just care
•Will assume financial risk for defined population
•Market size estimates $10B-$50B+
•Competition
•No comprehensive approach, most rely on latent data
•Similar to failed strategy of 80s and 90s clinical solutions
Cerner’s Approach
•Healthe Intent Cloud Platform
•Facilitate optimal care and workflow across all stakeholders
•Real-time, Actionable in Workflow, Programmable
•Partnership with Advocate Heath Care
•Joint development of sophisticated predictive models
•Automating population health workflow across ACO
•Foundational Offerings (~$370M revenue)
•Interoperability and HIE offerings
•Enterprise Data Warehousing & Quality solutions
•Patient portal platform and PHR solutions
•Employer, Home Health, Long-term Care, Retail Pharmacy
“In every briefing I had with a purported PHM
solution provider I asked a simple question: What is
your process map to enable a client to effectively
move to a PHM model of care across the
community they serve with your solution suite?
Only one vendor, Cerner, was able to
articulate such a process map, everyone
else just sort of waved their hands about and spoke
of ‘high-level this, high-level that.’”
-Chilmark Research

Cerner Millennium® localized in four
languages: English, Spanish, French, German
Stage 7 Clients: Spain: Hospital Marina Salud de Dénia
Stage 6 Clients: UAE: Al Ain Hospital //Al Rahba Hospital// Madinat Zayed - Al Gharbia Hospitals// Corniche Hospital// Tawam Hospital //
Chile: Clínica las Condes
France: Centre Hospitalier de Belfort Montbéliard // Centre Hospitalier de Valenciennes //
Saudi Arabia: King Faisal Specialist Hospital & Research Center, Riyadh and Jeddah
Canada: North York General Hospital
Malaysia: Prince Court Medical Centre
2,000 Associates
Live and work outside the US
400+ Millennium facilities outside the USA
USA
1979
Saudi
Arabia
1991 Germany
1992
Malaysia
1996
Australia
1991
Spain
2005 Ireland
2005
Egypt
2005
Chile
2008
Qatar
2008
France
2005
Canada
1985
24 Total
Countries
United Arab
Emirates
2004 India
2004
Argentina
2000
Austria
1999
Switzerland
2002
Cayman Islands
2002
Singapore
1990
UK
1987
Aruba
2008 Morocco
2005
Mexico
2012
Unmatched Global Experience
$0
$50
$100
$150
$200
$250
$300
$350
$400
'04 '05 '06 '07 '08 '09 '10 '11 '12 '13
Mil
lio
ns
Global Revenue
Brazil
2013
Financial Highlights and Quantifying Long-Term
Growth Opportunities

© 2014 Cerner Corporation. All rights reserved. This document contains Cerner confidential and/or proprietary information which may not be reproduced or transmitted without the express written consent of Cerner. 12
Financial Highlights
Income statement
•Bookings
•2013: up 20% to $3.8B
•Q114: up 14% to $910M
•Revenue
•2013: up 9% to $2.9B
•Q114: Up 15% to $785M
•Adjusted Operating Margin*
•2013: up 220 basis points to 25.1%
•Q114: 24.6% (down 10 bp YoY)
•Adjusted Diluted EPS*
•2013: up 18% to $1.41
•Q114: up 12% to $0.37
•Met or exceeded guidance 56 / 57 quarters
Balance Sheet and Cash Flow – Q114
•$1.5B cash and investments
•$161M debt
•Expect strong increase in free cash flow in 2014
•Cash Deployment
•Investments in R&D and infrastructure
•$317M repurchase program
•Strategic Acquisitions
$0
$100
$200
$300
$400
$500
$600
$700
$800
2004 2005 2006 2007 2008 2009 2010 2011 2012 2013
$’s
in
Mil
lio
ns
Operating Cash Flow
Free Cash Flow*
*FCF = Operating CF less Capital Expenditures and
Capitalized Software
* Adjusted operating margin, adjusted diluted earnings per share and free cash flow reflect adjustments compared to results reported on a U.S. Generally Accepted Accounting Principles
(GAAP) basis in our 2013 annual report on Form 10-K and most recent Form 10-Q. Non-GAAP results should not be substituted as a measure of our performance but instead should be used
along with GAAP results as a supplemental measure of financial performance. Please see the Appendix for a reconciliation of these items to GAAP results.
$0.00
$0.20
$0.40
$0.60
$0.80
$1.00
$1.20
$1.40
$1.60
$0
$300
$600
$900
$1,200
$1,500
$1,800
$2,100
$2,400
$2,700
$3,000
'04 '05 '06 '07 '08 '09 '10 '11 '12 '13
EP
S
Reven
ue
($ M
illi
on
s)
Revenue
Earnings Per Share
© 2014 Cerner Corporation. All rights reserved. This document contains Cerner confidential and/or proprietary information which may not be reproduced or transmitted without the express written consent of Cerner. 13
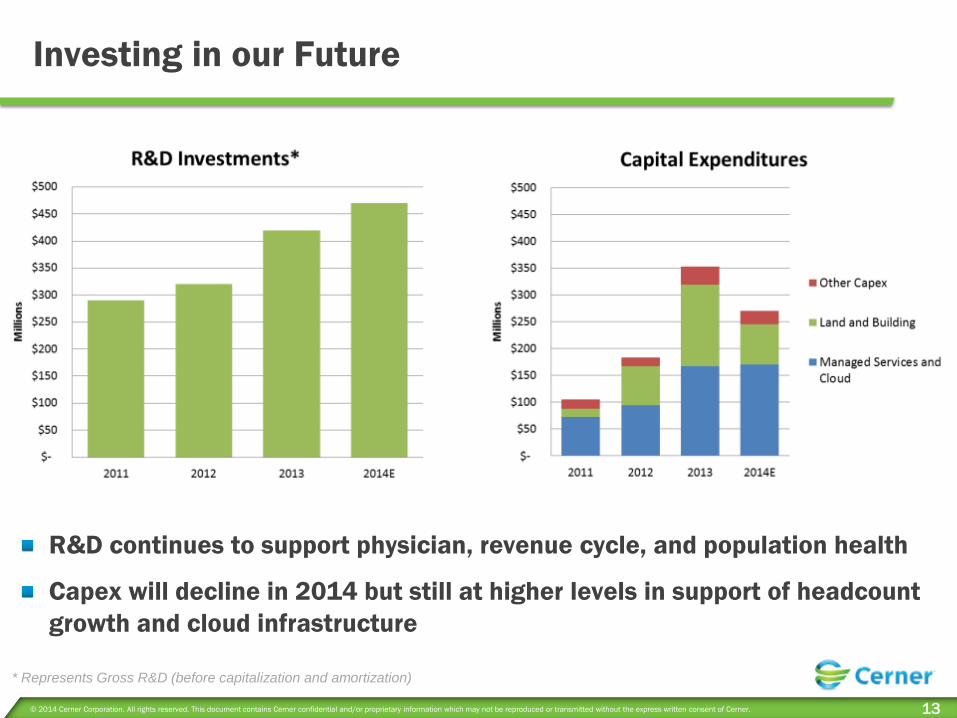
Investing in our Future
* Represents Gross R&D (before capitalization and amortization)
R&D continues to support physician, revenue cycle, and population health
Capex will decline in 2014 but still at higher levels in support of headcount
growth and cloud infrastructure

Bookings
$3,772
Cerner 2013 Business Model Sales Pipeline
Contract Backlog
$8,128
Support Contracts
and Backlog
$786
(Dollars in Millions)
* Operating margin reflects adjustments compared to
results reported on a GAAP basis in our 2013 Form
10-K. Non-GAAP results should not be substituted as
a measure of our performance but instead should be
used along with GAAP results as a supplemental
measure of financial performance. Non-GAAP
results are used by management along with GAAP
results to analyze our business, make strategic
decisions, assess long-term trends on a comparable
basis, and for management compensation purposes.
Revenue Streams Revenue
Contribution
Margin %
Contribution
Margin $
Licensed Software $388 89% $347
Technology Resale $263 18% $47
Subscription / Transaction $197 60% $119
Professional Services $851 31% $267
Managed Services $480 34% $162
Support & Maintenance $662 75% $497
Reimbursed Travel $70 0% $0
Totals $2,911 49% $1,439
Indirect Expenses
Research and Development -11% ($328)
Selling, General and Administrative -13% ($380)
Operating Margin* 25% $731
Net Other Income
Taxes -8% ($245)
Net Other Income 0.4% $12
Net Earnings 17% $498
Shares Outstanding 352.3
Diluted EPS $1.41
System
Sales
Support,
Maintenance
and Services
© 2014 Cerner Corporation. All rights reserved. This document contains Cerner confidential and/or proprietary information which may not be reproduced or transmitted without the express written consent of Cerner. 15
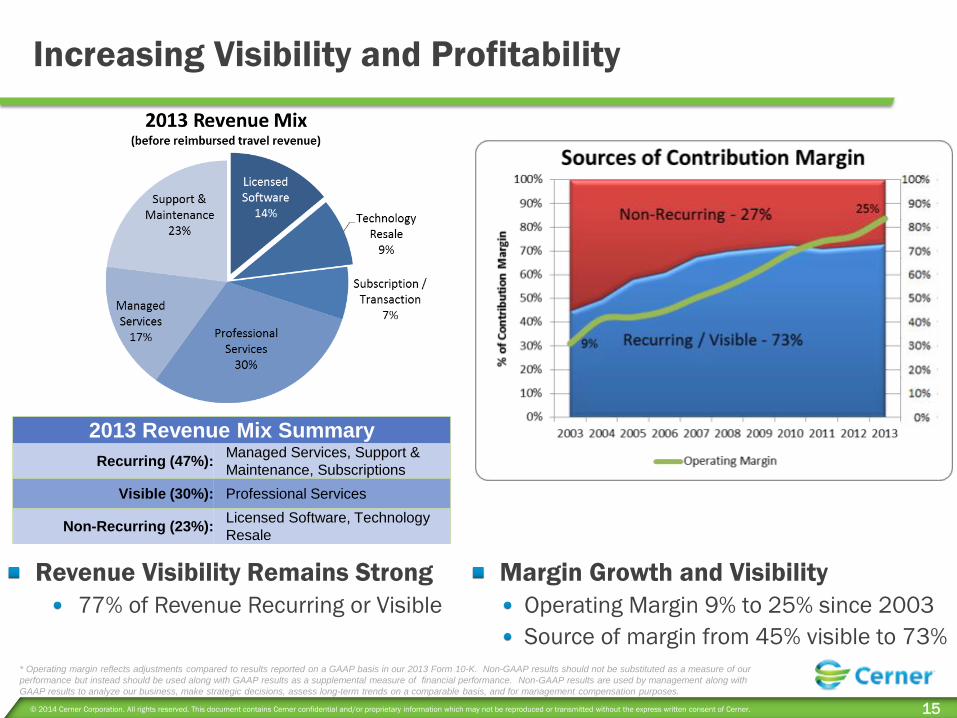
Increasing Visibility and Profitability
2013 Revenue Mix Summary
Recurring (47%): Managed Services, Support &
Maintenance, Subscriptions
Visible (30%): Professional Services
Non-Recurring (23%): Licensed Software, Technology
Resale
* Operating margin reflects adjustments compared to results reported on a GAAP basis in our 2013 Form 10-K. Non-GAAP results should not be substituted as a measure of our
performance but instead should be used along with GAAP results as a supplemental measure of financial performance. Non-GAAP results are used by management along with
GAAP results to analyze our business, make strategic decisions, assess long-term trends on a comparable basis, and for management compensation purposes.
Margin Growth and Visibility
Operating Margin 9% to 25% since 2003
Source of margin from 45% visible to 73%
Revenue Visibility Remains Strong
77% of Revenue Recurring or Visible

© 2014 Cerner Corporation. All rights reserved. This document contains Cerner confidential and/or proprietary information which may not be reproduced or transmitted without the express written consent of Cerner. 16
Growth Initiatives Support Strong Growth
Growth scenarios do
not represent formal
financial guidance.

© 2014 Cerner Corporation. All rights reserved. This document contains Cerner confidential and/or proprietary information which may not be reproduced or transmitted without the express written consent of Cerner. 17
Guidance as of April 24, 2014
Reg FD Disclaimer – This slide reflects guidance provided in the most recent earnings press release and
does not imply a reiteration or update of guidance.
Metric Q214 2014
Revenue $770M - $810M $3.25B - $3.4B
Adjusted Diluted Earnings Per Share $0.39 - $0.40 $1.63 - $1.67
New Business Bookings $1.00B - $1.06B
Share-based Compensation Expense $0.03 $0.11 - $0.12
* Adjusted Diluted Earnings Per Share reflects adjustments compared to results reported on a U.S. Generally Accepted Accounting Principles (GAAP) basis in our 2013 annual report on Form
10-K and most recent Form 10-Q. Non-GAAP results should not be substituted as a measure of our performance but instead should be used along with GAAP results as a supplemental
measure of financial performance. Please see the Appendix for a reconciliation of these items to GAAP results.

Health care is too important to stay the same.TM
© 2014 Cerner Corporation. All rights reserved. This document contains Cerner confidential and/or proprietary information which may not be reproduced or transmitted without the express written consent of Cerner. 19
Appendix - Non-GAAP Financial Measures
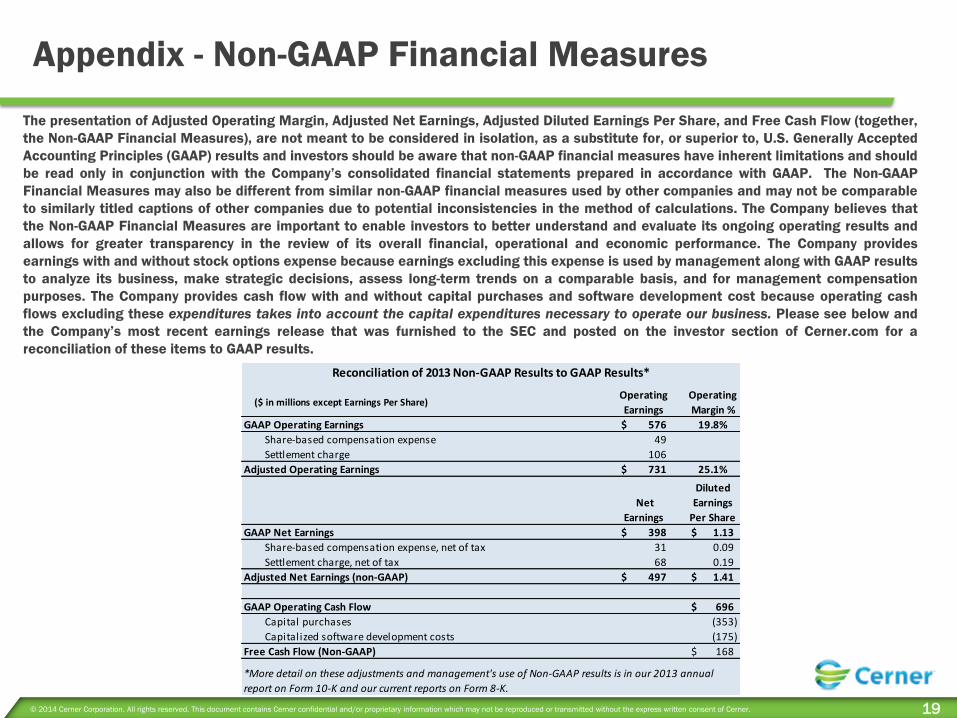
The presentation of Adjusted Operating Margin, Adjusted Net Earnings, Adjusted Diluted Earnings Per Share, and Free Cash Flow (together,
the Non-GAAP Financial Measures), are not meant to be considered in isolation, as a substitute for, or superior to, U.S. Generally Accepted
Accounting Principles (GAAP) results and investors should be aware that non-GAAP financial measures have inherent limitations and should
be read only in conjunction with the Company’s consolidated financial statements prepared in accordance with GAAP. The Non-GAAP
Financial Measures may also be different from similar non-GAAP financial measures used by other companies and may not be comparable
to similarly titled captions of other companies due to potential inconsistencies in the method of calculations. The Company believes that
the Non-GAAP Financial Measures are important to enable investors to better understand and evaluate its ongoing operating results and
allows for greater transparency in the review of its overall financial, operational and economic performance. The Company provides
earnings with and without stock options expense because earnings excluding this expense is used by management along with GAAP results
to analyze its business, make strategic decisions, assess long-term trends on a comparable basis, and for management compensation
purposes. The Company provides cash flow with and without capital purchases and software development cost because operating cash
flows excluding these expenditures takes into account the capital expenditures necessary to operate our business. Please see below and
the Company’s most recent earnings release that was furnished to the SEC and posted on the investor section of Cerner.com for a
reconciliation of these items to GAAP results.
($ in millions except Earnings Per Share)Operating
Earnings
Operating
Margin %
GAAP Operating Earnings 576$ 19.8%
Share-based compensation expense 49
Settlement charge 106
Adjusted Operating Earnings 731$ 25.1%
Net
Earnings
Diluted
Earnings
Per Share
GAAP Net Earnings 398$ 1.13$
Share-based compensation expense, net of tax 31 0.09
Settlement charge, net of tax 68 0.19
Adjusted Net Earnings (non-GAAP) 497$ 1.41$
GAAP Operating Cash Flow 696$
Capital purchases (353)
Capitalized software development costs (175)
Free Cash Flow (Non-GAAP) 168$
Reconciliation of 2013 Non-GAAP Results to GAAP Results*
*More detail on these adjustments and management's use of Non-GAAP results is in our 2013 annual
report on Form 10-K and our current reports on Form 8-K.