Embed Size (px)
Citation preview

Sergey Vasnetsov Sr. Vice President Strategic Planning & Transactions August 2012
Jefferies 2012 Global Industrial and A&D Conference
lyondellbasell.com
Cautionary Statement
The information in this presentation includes forward-looking statements. These statements relate to future events, such as anticipated revenues, earnings, business strategies, competitive position or other aspects of our operations or operating results. Actual outcomes and results may differ materially from what is expressed or forecast in such forward‐looking statements. These statements are not guarantees of future performance and involve certain risks, uncertainties and assumptions that are difficult to predict. Factors that could cause actual results to differ from forward-looking statements include, but are not limited to, availability, cost and price volatility of raw materials and utilities; supply/demand balances; industry production capacities and operating rates; uncertainties associated with worldwide economies; legal, tax and environmental proceedings; cyclical nature of the chemical and refining industries; operating interruptions; current and potential governmental regulatory actions; terrorist acts; international political unrest; competitive products and pricing; technological developments; the ability to comply with the terms of our credit facilities and other financing arrangements; the ability to implement business strategies; and other factors affecting our business generally as set forth in the “Risk Factors” section of our Form 10-K for the year ended December 31, 2011, which can be found at www.lyondellbasell.com on the Investor Relations page and on the Securities and Exchange Commission’s website at www.sec.gov.
This presentation contains time sensitive information that is accurate only as of the date hereof. Information contained in this presentation is unaudited and is subject to change. We undertake no obligation to update the information presented herein except as required by law.
2
lyondellbasell.com
Information Related to Financial Measures
We have included EBITDA in this presentation, which is a non-GAAP measure, as we believe that EBITDA is a measure commonly used by investors. However, EBITDA, as presented herein, may not be comparable to a similarly titled measure reported by other companies due to differences in the way the measure is calculated. For purposes of this presentation, EBITDA means earnings before interest, taxes, depreciation and amortization, as adjusted for other items management does not believe are indicative of the Company’s underlying results of operations such as impairment charges, reorganization items, the effect of mark-to-market accounting on our warrants. EBITDA also includes dividends from joint ventures. EBITDA should not be considered an alternative to profit or operating profit for any period as an indicator of our performance, or as an alternative to operating cash flows as a measure of our liquidity. See Table 9 of our accompanying earnings release for reconciliations of EBITDA to net income. While we also believe that net debt is a measure commonly used by investors, net debt, as presented herein, may not be comparable to a similarly titled measure reported by other companies due to differences in the way the measure is calculated. For purposes of this presentation, net debt means short-term debt plus current maturities of long-term debt plus long-term debt minus cash and cash equivalents and minus restricted cash.
3
lyondellbasell.com
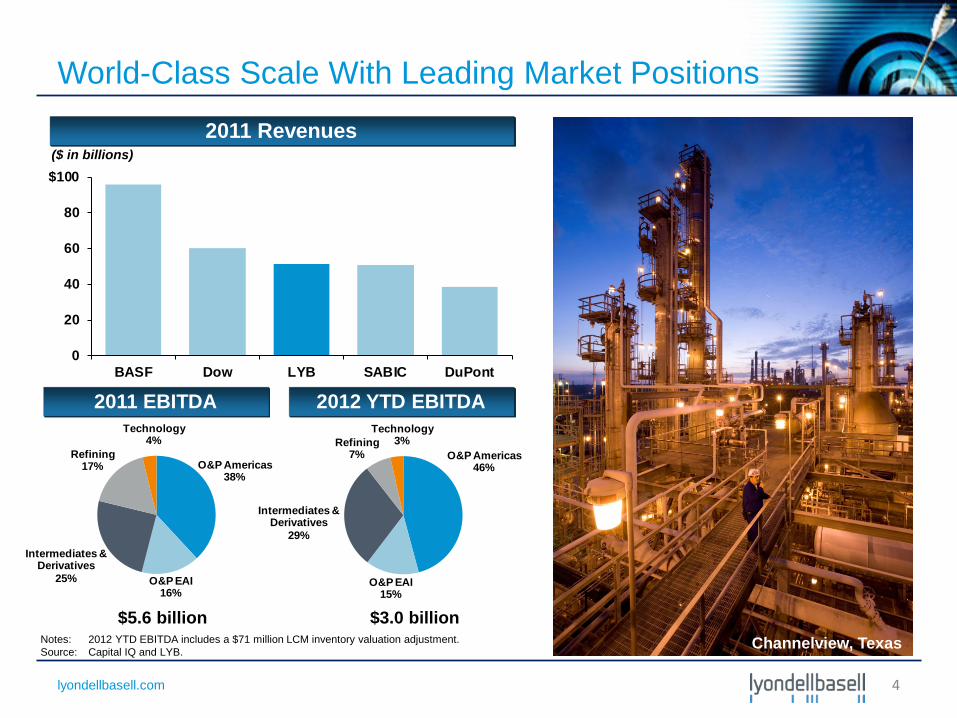
O&P Americas38%
O&P EAI16%
Intermediates & Derivatives
25%
Refining17%
Technology4%
O&P Americas46%
O&P EAI15%
Intermediates & Derivatives
29%
Refining7%
Technology3%
World-Class Scale With Leading Market Positions
$3.0 billion
Notes: 2012 YTD EBITDA includes a $71 million LCM inventory valuation adjustment. Source: Capital IQ and LYB.
2011 Revenues
2012 YTD EBITDA
($ in billions)
Channelview, Texas
4
0
20
40
60
80
$100
BASF Dow LYB SABIC DuPont
2011 EBITDA
$5.6 billion

lyondellbasell.com
500
1,000
1,500
$2,000
1Q'11 2Q'11 3Q'11 4Q'11 1Q'12 2Q'12
Strong Financial Performance Continues
Quarterly EBITDA
Quarterly EBITDA increase of 44% from 1Q’12
($ in millions)
5
($ in millions, except per share data) (1) 2Q'12 1Q'12 2Q'11
EBITDA $1,774 $1,228 $1,593
Income from Continuing Operations $768 $594 $851
Diluted Earnings ($ / share) from Continuing Operations $1.33 $1.03 $1.46
Net Debt / LTM EBITDA 0.4x 0.4x NA
(1) EBITDA, Income and EPS for the second quarter 2012 include a $71 million Lower of Cost or Market inventory valuation adjustment charge. Discontinued operations had no impact on the second quarter 2012 earnings.
lyondellbasell.com
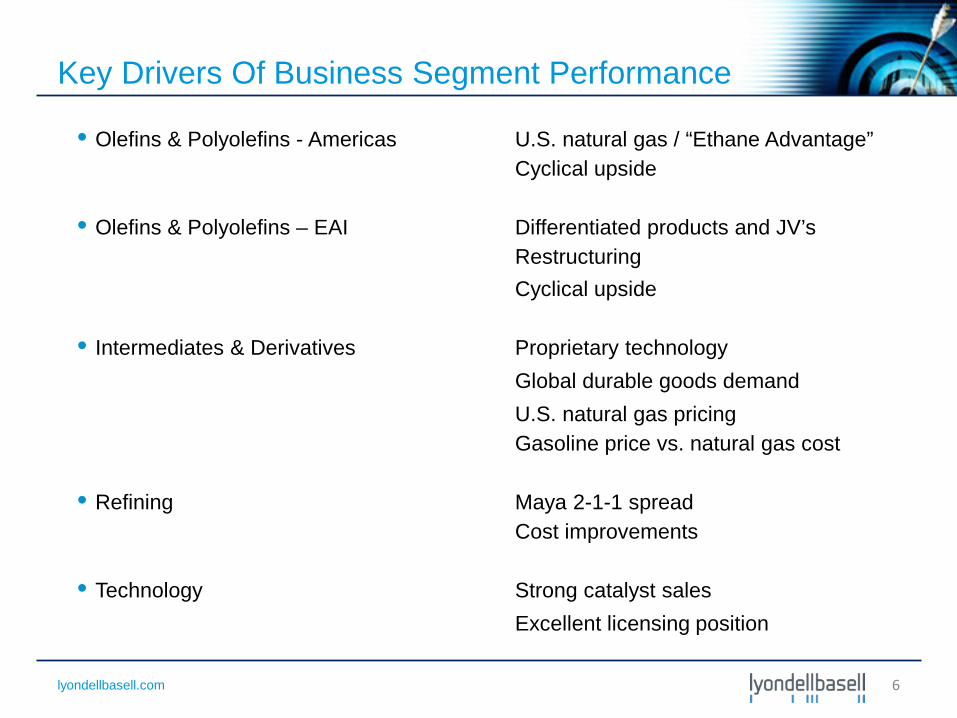
• Olefins & Polyolefins - Americas U.S. natural gas / “Ethane Advantage” Cyclical upside
• Olefins & Polyolefins – EAI Differentiated products and JV’s Restructuring Cyclical upside
• Intermediates & Derivatives Proprietary technology Global durable goods demand U.S. natural gas pricing
Gasoline price vs. natural gas cost
• Refining Maya 2-1-1 spread Cost improvements
• Technology Strong catalyst sales Excellent licensing position
Key Drivers Of Business Segment Performance
6
lyondellbasell.com
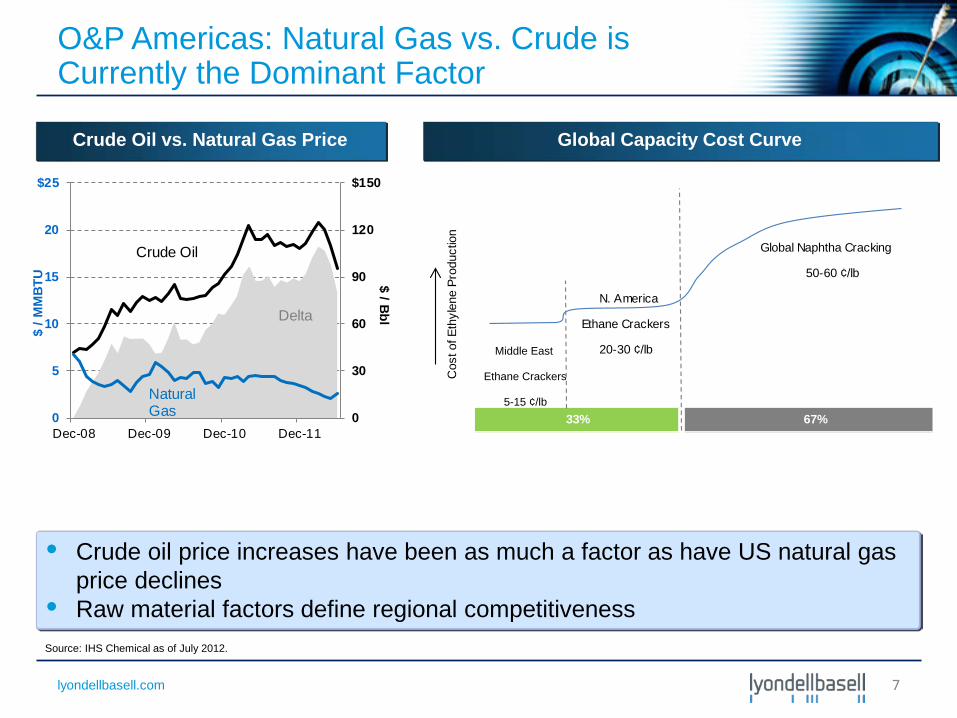
• Crude oil price increases have been as much a factor as have US natural gas price declines
• Raw material factors define regional competitiveness
Crude Oil vs. Natural Gas Price Global Capacity Cost Curve
Source: IHS Chemical as of July 2012.
67%33%
Cos
t of E
thyl
ene
Prod
uctio
n
Global Naphtha Cracking
50-60 ¢/lb
Middle East
Ethane Crackers
5-15 ¢/lb
N. America
Ethane Crackers
20-30 ¢/lb
O&P Americas: Natural Gas vs. Crude is Currently the Dominant Factor
7
0
30
60
90
120
$150
0
5
10
15
20
$25
Dec-08 Dec-09 Dec-10 Dec-11
$ / Bbl
$ / M
MBT
U
Crude Oil
Natural Gas
Delta
lyondellbasell.com
0
20
40
60
80
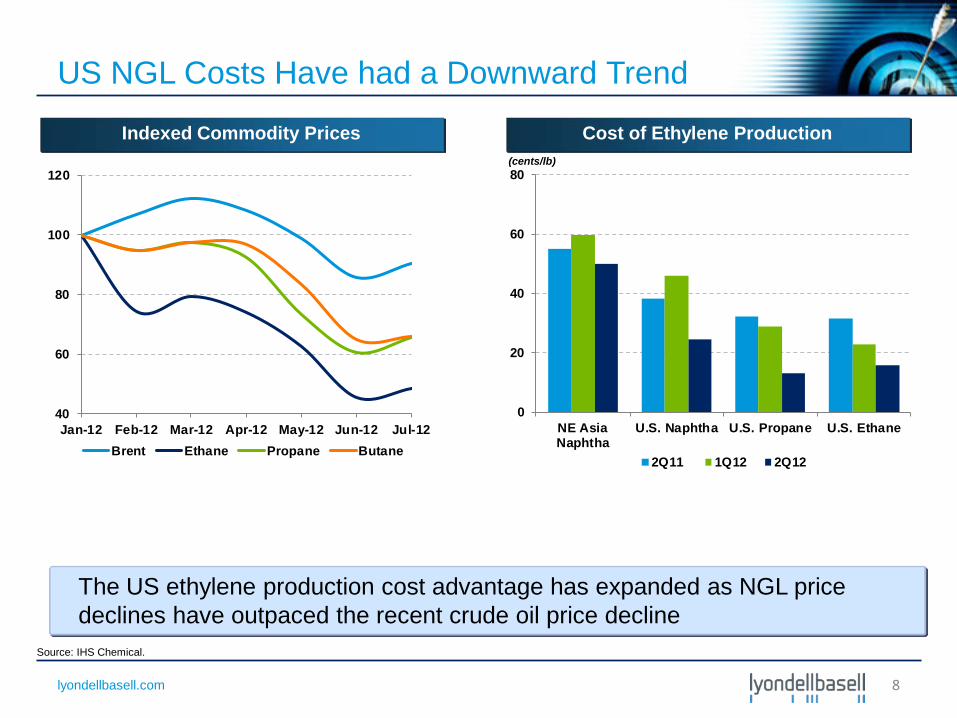
NE AsiaNaphtha
U.S. Naphtha U.S. Propane U.S. Ethane
2Q11 1Q12 2Q12
Indexed Commodity Prices Cost of Ethylene Production
Source: IHS Chemical.
8
US NGL Costs Have had a Downward Trend
The US ethylene production cost advantage has expanded as NGL price declines have outpaced the recent crude oil price decline
40
60
80
100
120
Jan-12 Feb-12 Mar-12 Apr-12 May-12 Jun-12 Jul-12Brent Ethane Propane Butane
(cents/lb)
lyondellbasell.com
0
1
2
3
4
5
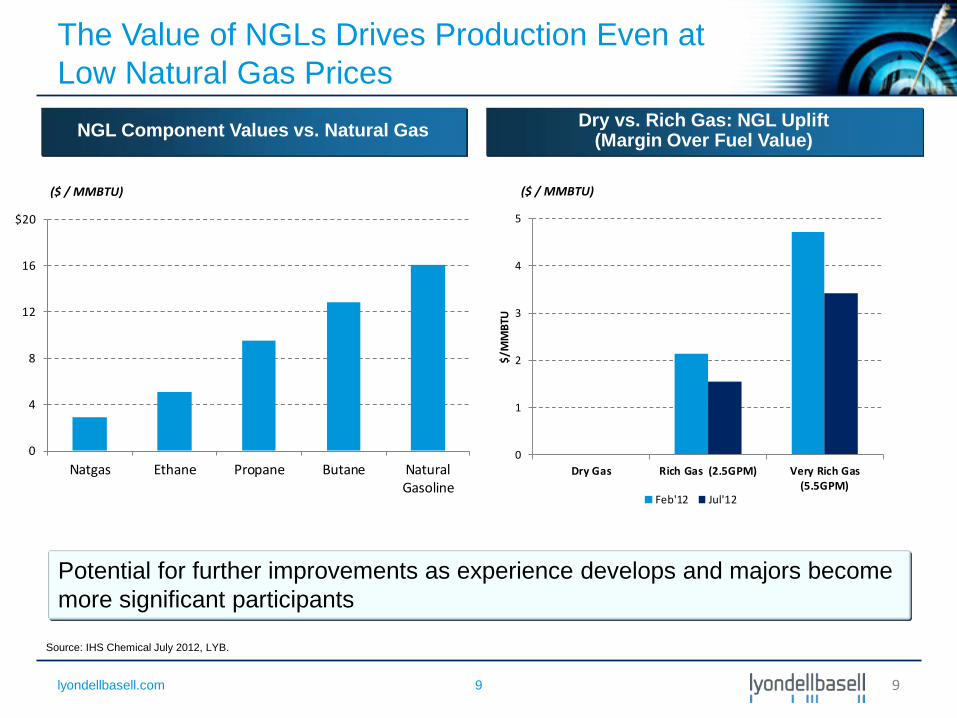
Dry Gas Rich Gas (2.5GPM) Very Rich Gas(5.5GPM)
$/M
MBT
UFeb'12 Jul'12
The Value of NGLs Drives Production Even at Low Natural Gas Prices
9
Dry vs. Rich Gas: NGL Uplift (Margin Over Fuel Value) NGL Component Values vs. Natural Gas
Potential for further improvements as experience develops and majors become more significant participants
Source: IHS Chemical July 2012, LYB.
9
($ / MMBTU) ($ / MMBTU)
0
4
8
12
16
$20
Natgas Ethane Propane Butane NaturalGasoline
lyondellbasell.com
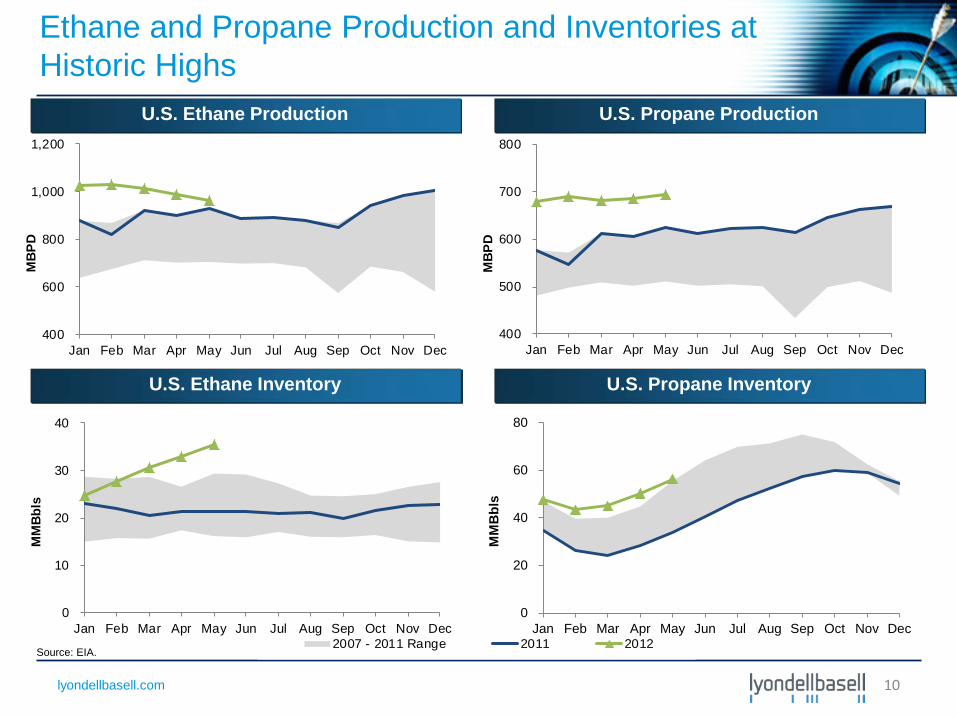
Ethane and Propane Production and Inventories at Historic Highs
U.S. Ethane Production U.S. Propane Production
2007 - 2011 Range 2011 2012
U.S. Ethane Inventory U.S. Propane Inventory
Source: EIA.
10
400
600
800
1,000
1,200
Jan Feb Mar Apr May Jun Jul Aug Sep Oct Nov Dec
MBP
D
400
500
600
700
800
Jan Feb Mar Apr May Jun Jul Aug Sep Oct Nov Dec
MBP
D
0
10
20
30
40
Jan Feb Mar Apr May Jun Jul Aug Sep Oct Nov Dec
MM
Bbls
0
20
40
60
80
Jan Feb Mar Apr May Jun Jul Aug Sep Oct Nov Dec
MM
Bbl
s
lyondellbasell.com
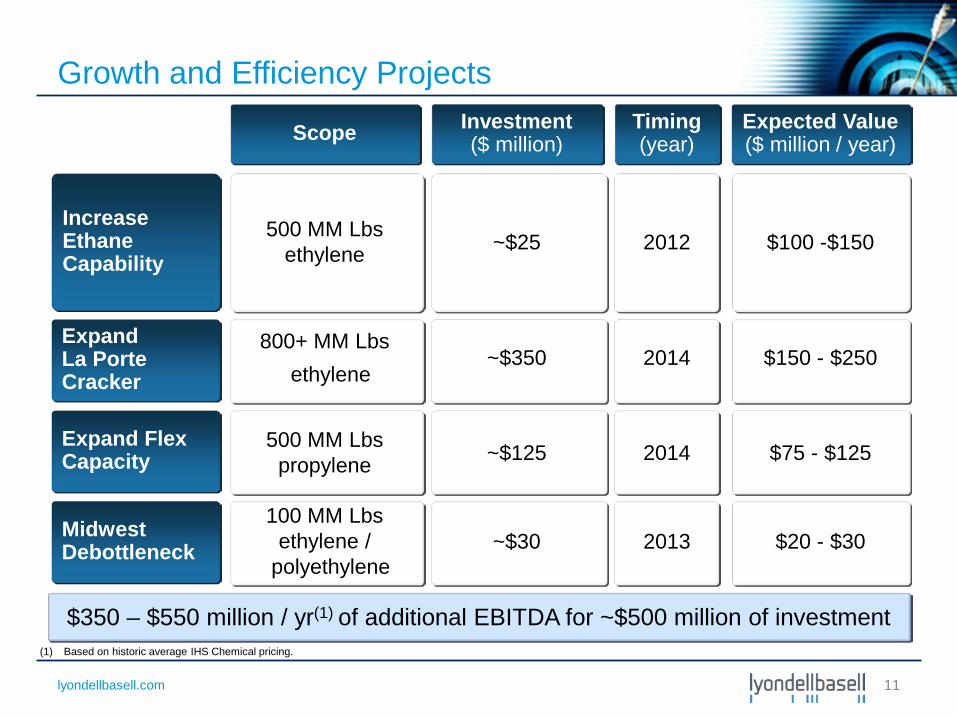
Growth and Efficiency Projects
Increase Ethane Capability
Expand La Porte Cracker
Scope
Expand Flex Capacity
500 MM Lbs ethylene
Investment ($ million)
Timing (year)
Expected Value ($ million / year)
800+ MM Lbs ethylene
100 MM Lbs ethylene /
polyethylene
Midwest Debottleneck
500 MM Lbs propylene
~$25
~$350
~$30
~$125
2012
2014
2013
2014
$100 -$150
$150 - $250
$20 - $30
$75 - $125
$350 – $550 million / yr(1) of additional EBITDA for ~$500 million of investment (1) Based on historic average IHS Chemical pricing.
11
lyondellbasell.com
----
300
600
900
1,200
1,500
2012 2013 2014 2015
U.S. LYB
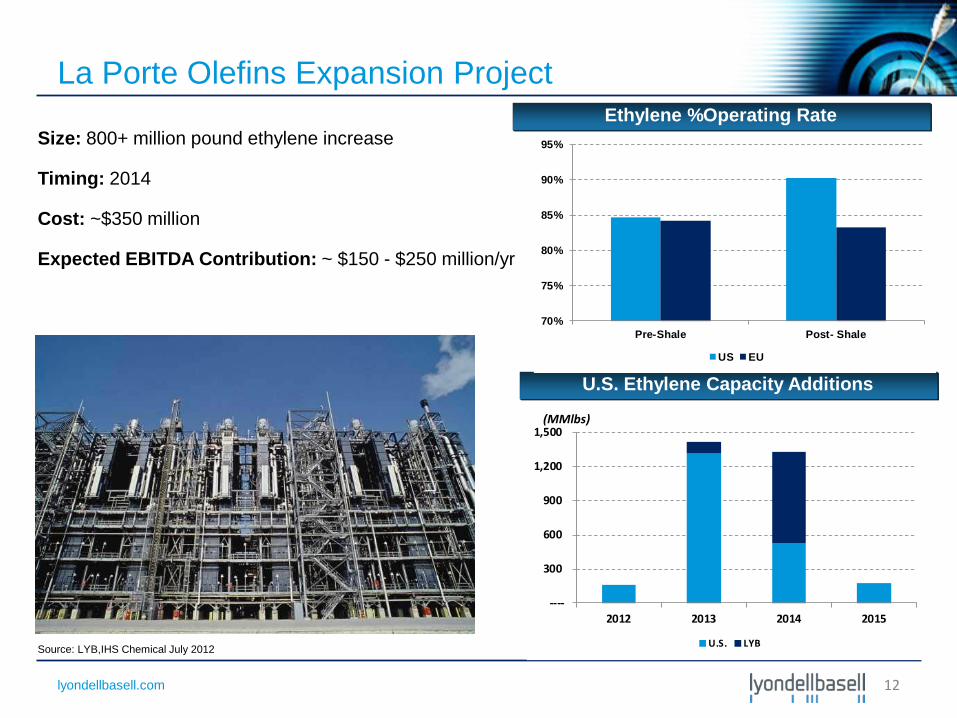
La Porte Olefins Expansion Project
12
Size: 800+ million pound ethylene increase Timing: 2014 Cost: ~$350 million Expected EBITDA Contribution: ~ $150 - $250 million/yr
La Porte, Texas Source: LYB,IHS Chemical July 2012
Ethylene %Operating Rate
U.S. Ethylene Capacity Additions
(MMlbs)
70%
75%
80%
85%
90%
95%
Pre-Shale Post- Shale
US EU
lyondellbasell.com
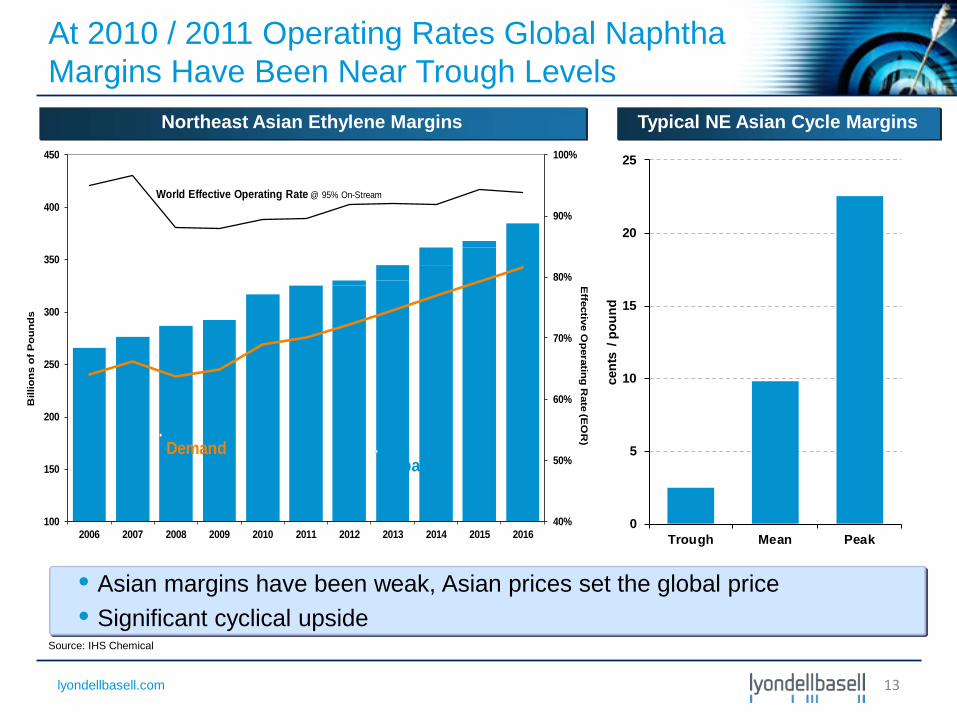
At 2010 / 2011 Operating Rates Global Naphtha Margins Have Been Near Trough Levels
Typical NE Asian Cycle Margins Northeast Asian Ethylene Margins
Source: IHS Chemical
• Asian margins have been weak, Asian prices set the global price • Significant cyclical upside
0
5
10
15
20
25
Trough Mean Peak
cent
s / p
ound
13
40%
50%
60%
70%
80%
90%
100%
100
150
200
250
300
350
400
450
2006 2007 2008 2009 2010 2011 2012 2013 2014 2015 2016
Effective O
perating Rate (E
OR
)
Bill
ions
of P
ound
s
DemandCapacity
World Effective Operating Rate @ 95% On-Stream
lyondellbasell.com
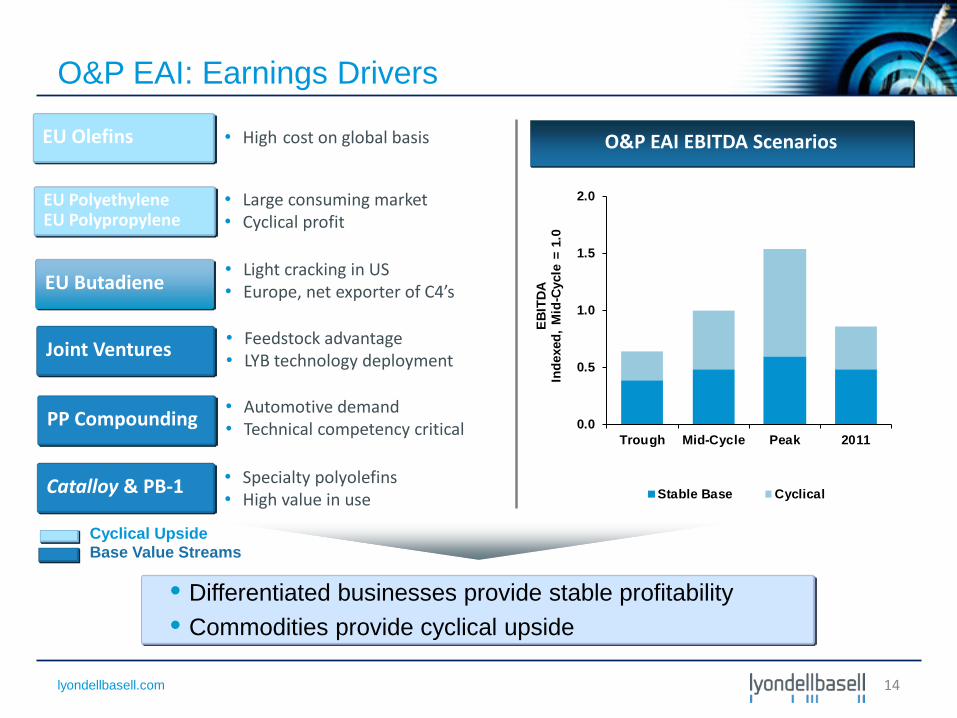
O&P EAI: Earnings Drivers
• Differentiated businesses provide stable profitability • Commodities provide cyclical upside
• High cost on global basis EU Olefins
• Specialty polyolefins • High value in use
Joint Ventures • Feedstock advantage • LYB technology deployment
Catalloy & PB-1
PP Compounding • Automotive demand • Technical competency critical
EU Polyethylene EU Polypropylene
• Large consuming market • Cyclical profit
Base Value Streams Cyclical Upside
O&P EAI EBITDA Scenarios
EU Butadiene • Light cracking in US • Europe, net exporter of C4’s
0.0
0.5
1.0
1.5
2.0
Trough Mid-Cycle Peak 2011
EBIT
DA
Inde
xed,
Mid
-Cyc
le =
1.0
Stable Base Cyclical
14
lyondellbasell.com
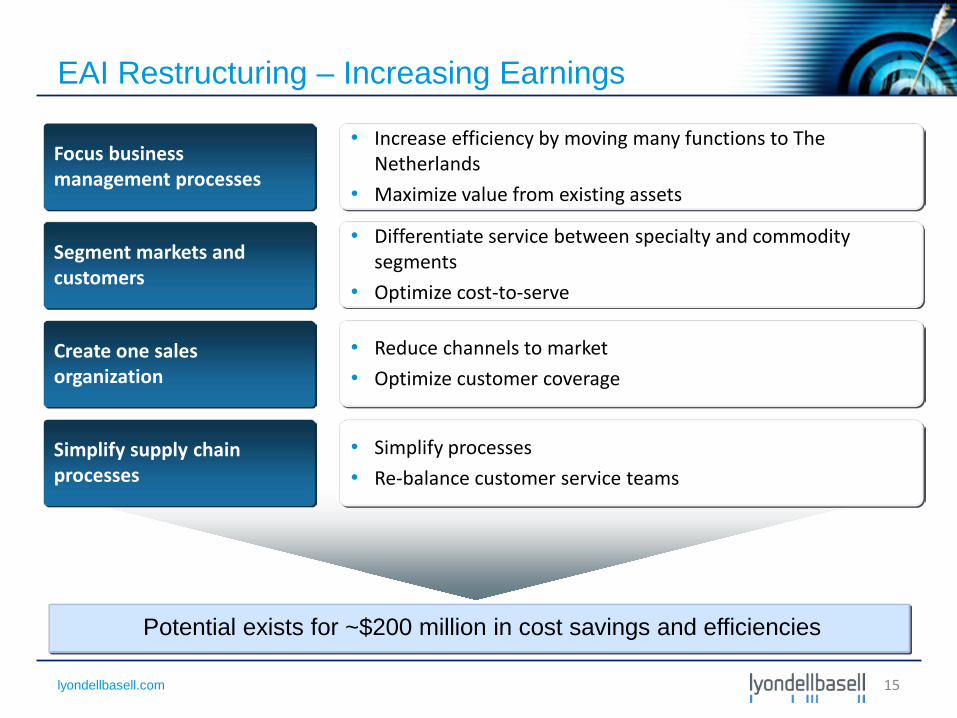
EAI Restructuring – Increasing Earnings
Potential exists for ~$200 million in cost savings and efficiencies
Focus business management processes
Segment markets and customers
Create one sales organization
Simplify supply chain processes
• Increase efficiency by moving many functions to The Netherlands
• Maximize value from existing assets
• Differentiate service between specialty and commodity segments
• Optimize cost-to-serve
• Reduce channels to market • Optimize customer coverage
• Simplify processes • Re-balance customer service teams
15
lyondellbasell.com
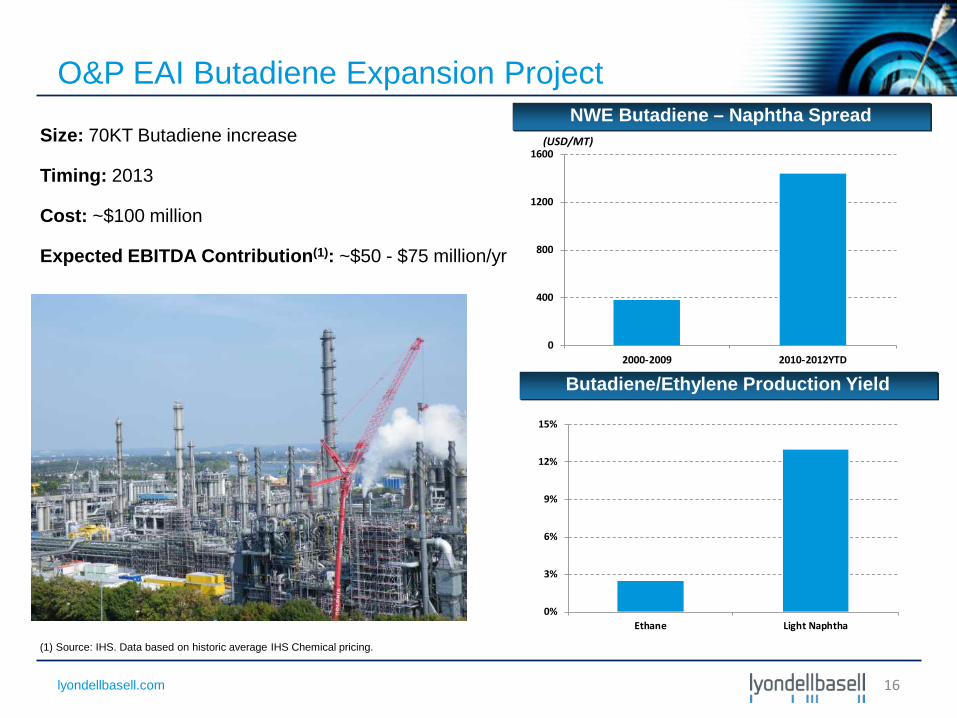
O&P EAI Butadiene Expansion Project
(1) Source: IHS. Data based on historic average IHS Chemical pricing.
16
Size: 70KT Butadiene increase Timing: 2013 Cost: ~$100 million Expected EBITDA Contribution(1): ~$50 - $75 million/yr
0
400
800
1200
1600
2000-2009 2010-2012YTD
NWE Butadiene – Naphtha Spread (USD/MT)
Butadiene/Ethylene Production Yield
0%
3%
6%
9%
12%
15%
Ethane Light Naphtha
lyondellbasell.com
Propylene Oxide& Derivatives
TBA &Intermediates
Acetyls
Ethylene Oxide /Glycol
Styrene
I&D Wtd. Average
'05-'11E cycle average
Propylene Oxide & Derivatives
TBA & Intermediates
Acetyls
Ethylene Oxide / Glycol
Styrene
I&D Wtd. Average
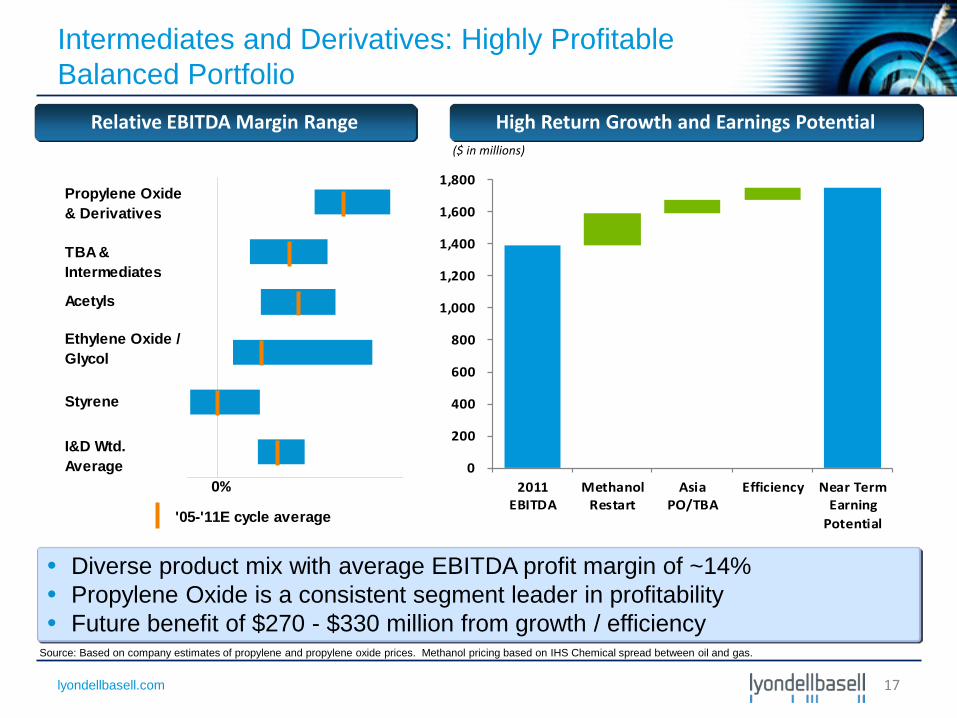
Intermediates and Derivatives: Highly Profitable Balanced Portfolio
• Diverse product mix with average EBITDA profit margin of ~14% • Propylene Oxide is a consistent segment leader in profitability • Future benefit of $270 - $330 million from growth / efficiency
High Return Growth and Earnings Potential Relative EBITDA Margin Range
0%
Source: Based on company estimates of propylene and propylene oxide prices. Methanol pricing based on IHS Chemical spread between oil and gas.
($ in millions)
17
0
200
400
600
800
1,000
1,200
1,400
1,600
1,800
2011EBITDA
MethanolRestart
AsiaPO/TBA
Efficiency Near TermEarning
Potential
lyondellbasell.com
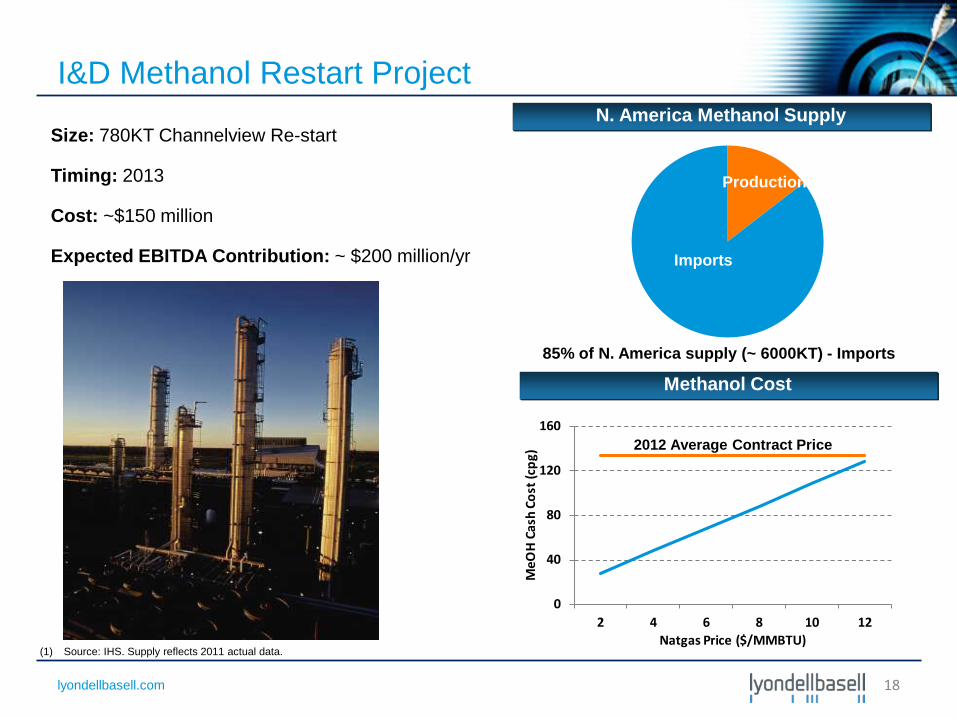
I&D Methanol Restart Project
(1) Source: IHS. Supply reflects 2011 actual data.
18
Size: 780KT Channelview Re-start Timing: 2013 Cost: ~$150 million Expected EBITDA Contribution: ~ $200 million/yr
N. America Methanol Supply
Methanol Cost
0
40
80
120
160
2 4 6 8 10 12
MeO
H C
ash
Cost
(cpg
)
Natgas Price ($/MMBTU)
85% of N. America supply (~ 6000KT) - Imports
Imports
2012 Average Contract Price
Production
lyondellbasell.com
0
50
100
150
200
250
300
2008 2009 2010 2011 2012 YTD
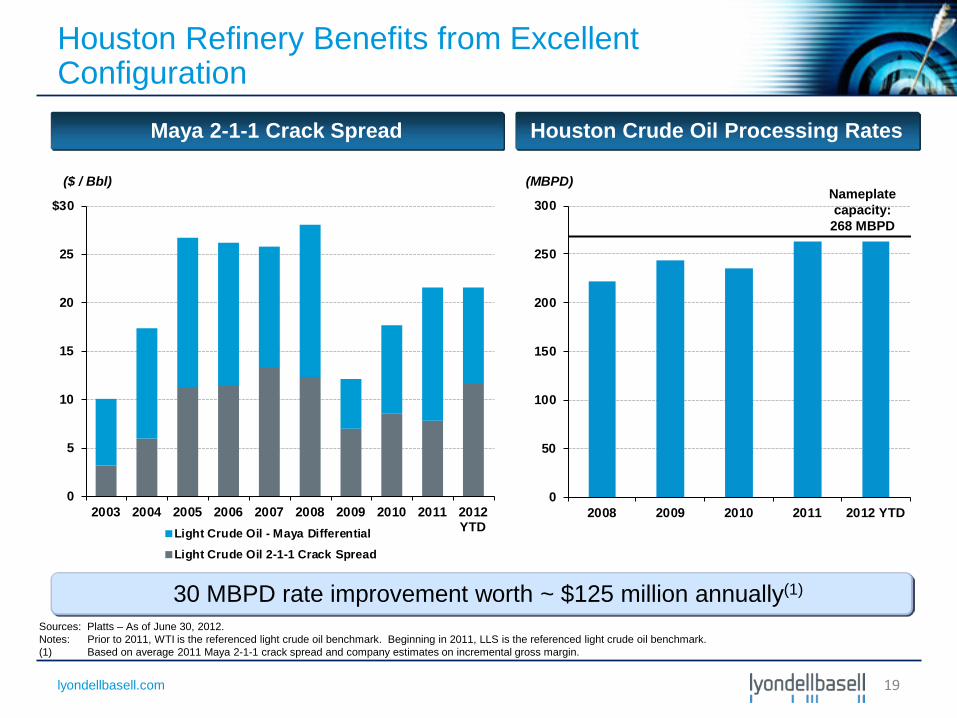
Sources: Platts – As of June 30, 2012. Notes: Prior to 2011, WTI is the referenced light crude oil benchmark. Beginning in 2011, LLS is the referenced light crude oil benchmark. (1) Based on average 2011 Maya 2-1-1 crack spread and company estimates on incremental gross margin.
30 MBPD rate improvement worth ~ $125 million annually(1)
Houston Crude Oil Processing Rates
(MBPD)
Maya 2-1-1 Crack Spread
($ / Bbl) Nameplate capacity:
268 MBPD
19
Houston Refinery Benefits from Excellent Configuration
0
5
10
15
20
25
$30
2003 2004 2005 2006 2007 2008 2009 2010 2011 2012YTDLight Crude Oil - Maya Differential
Light Crude Oil 2-1-1 Crack Spread
lyondellbasell.com
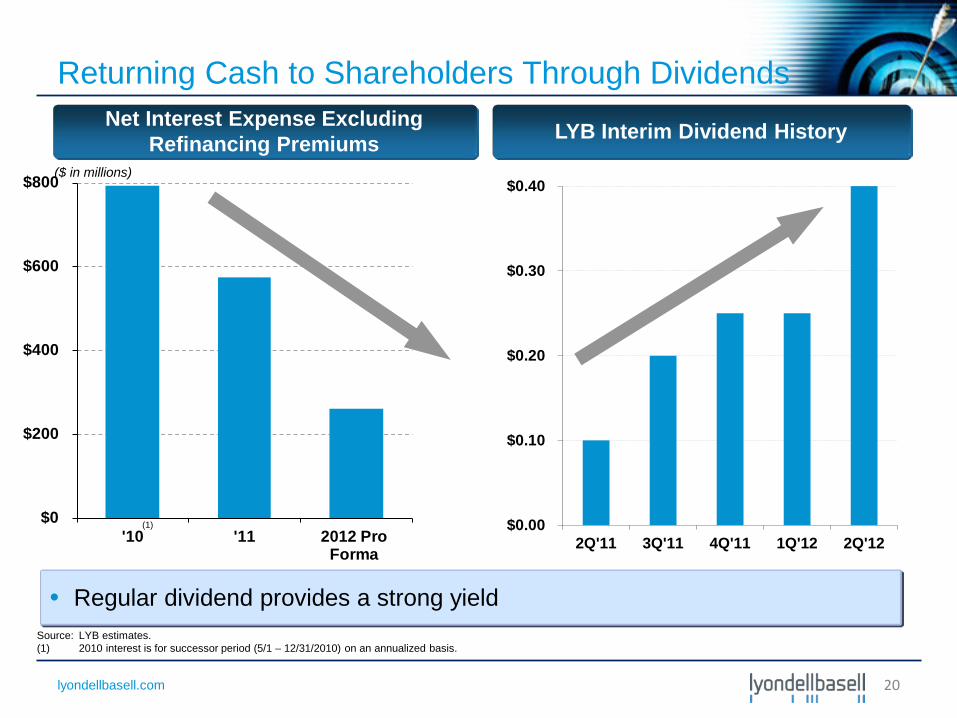
$0
$200
$400
$600
$800
'10 '11 2012 ProForma
Returning Cash to Shareholders Through Dividends
• Regular dividend provides a strong yield
LYB Interim Dividend History Net Interest Expense Excluding Refinancing Premiums
Source: LYB estimates. (1) 2010 interest is for successor period (5/1 – 12/31/2010) on an annualized basis.
20
($ in millions)
(1) $0.00
$0.10
$0.20
$0.30
$0.40
2Q'11 3Q'11 4Q'11 1Q'12 2Q'12
lyondellbasell.com
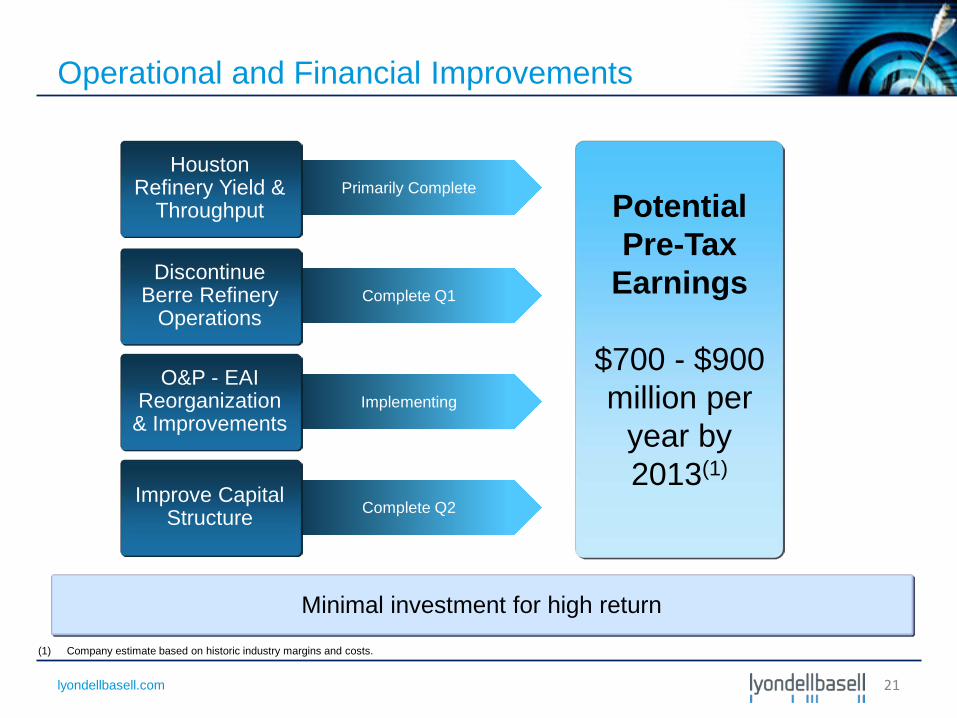
Primarily Complete
Complete Q1
Implementing
Complete Q2
Operational and Financial Improvements
Houston Refinery Yield &
Throughput
Discontinue Berre Refinery
Operations
O&P - EAI Reorganization
& Improvements
Improve Capital Structure
Minimal investment for high return
Potential Pre-Tax
Earnings
$700 - $900 million per
year by 2013(1)
(1) Company estimate based on historic industry margins and costs.
21
lyondellbasell.com
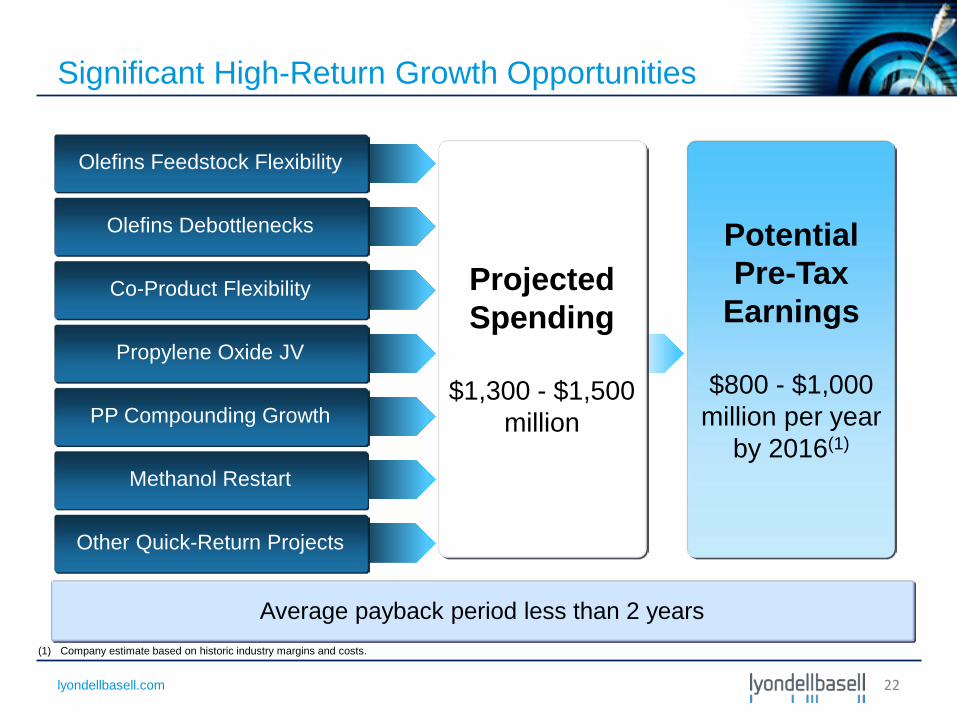
Significant High-Return Growth Opportunities
Other Quick-Return Projects
Olefins Feedstock Flexibility
Olefins Debottlenecks
Co-Product Flexibility
Average payback period less than 2 years
Propylene Oxide JV
PP Compounding Growth
Methanol Restart
Projected Spending
$1,300 - $1,500
million
Potential Pre-Tax
Earnings
$800 - $1,000 million per year
by 2016(1)
(1) Company estimate based on historic industry margins and costs.
22
lyondellbasell.com
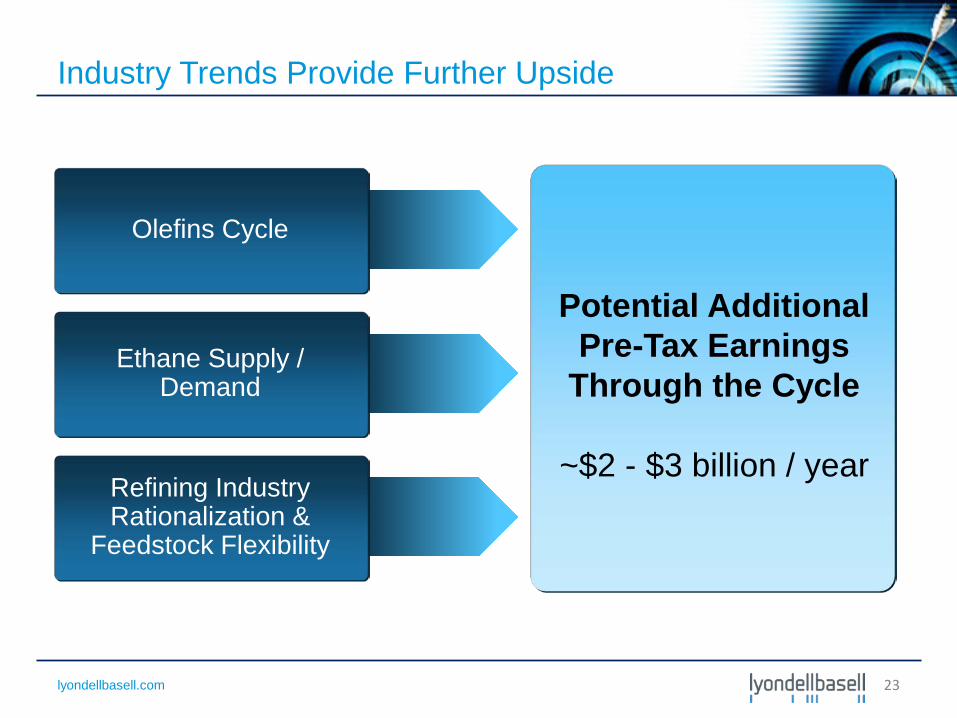
Industry Trends Provide Further Upside
Olefins Cycle
Ethane Supply / Demand
Refining Industry Rationalization &
Feedstock Flexibility
Potential Additional Pre-Tax Earnings
Through the Cycle
~$2 - $3 billion / year
23
lyondellbasell.com
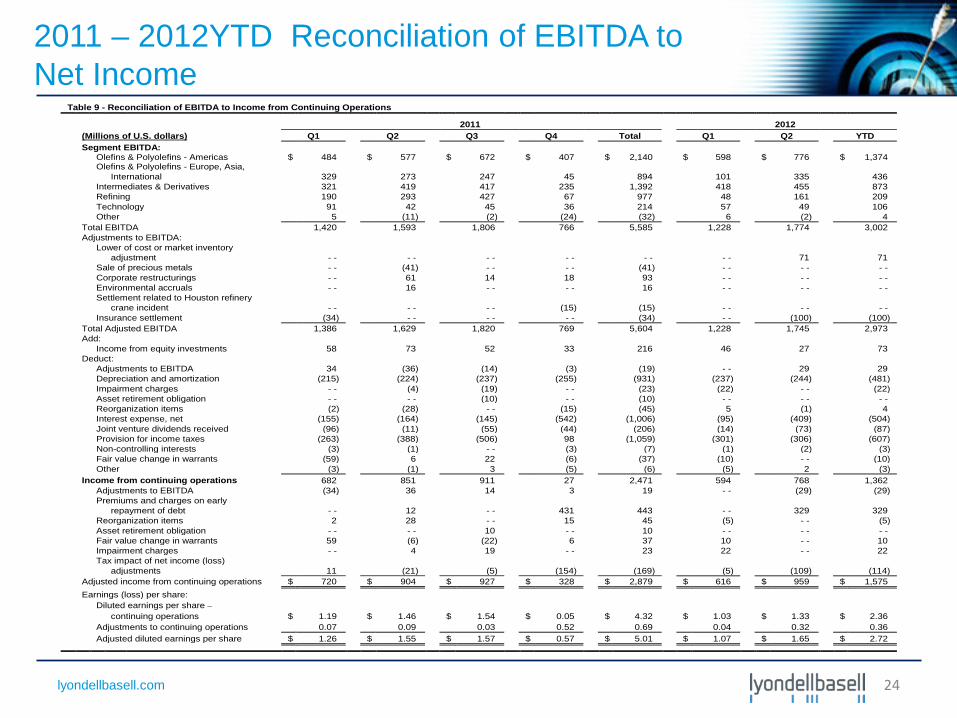
2011 – 2012YTD Reconciliation of EBITDA to Net Income
24
Table 9 - Reconciliation of EBITDA to Income from Continuing Operations 2011 2012 (Millions of U.S. dollars) Q1 Q2 Q3 Q4 Total Q1 Q2 YTD Segment EBITDA: Olefins & Polyolefins - Americas $ 484 $ 577 $ 672 $ 407 $ 2,140 $ 598 $ 776 $ 1,374 Olefins & Polyolefins - Europe, Asia, International 329 273 247 45 894 101 335 436 Intermediates & Derivatives 321 419 417 235 1,392 418 455 873 Refining 190 293 427 67 977 48 161 209 Technology 91 42 45 36 214 57 49 106 Other 5 (11) (2) (24) (32) 6 (2) 4 Total EBITDA 1,420 1,593 1,806 766 5,585 1,228 1,774 3,002 Adjustments to EBITDA: Lower of cost or market inventory adjustment - - - - - - - - - - - - 71 71 Sale of precious metals - - (41) - - - - (41) - - - - - - Corporate restructurings - - 61 14 18 93 - - - - - - Environmental accruals - - 16 - - - - 16 - - - - - - Settlement related to Houston refinery crane incident - - - - - - (15) (15) - - - - - - Insurance settlement (34) - - - - - - (34) - - (100) (100) Total Adjusted EBITDA 1,386 1,629 1,820 769 5,604 1,228 1,745 2,973 Add: Income from equity investments 58 73 52 33 216 46 27 73 Deduct: Adjustments to EBITDA 34 (36) (14) (3) (19) - - 29 29 Depreciation and amortization (215) (224) (237) (255) (931) (237) (244) (481) Impairment charges - - (4) (19) - - (23) (22) - - (22) Asset retirement obligation - - - - (10) - - (10) - - - - - - Reorganization items (2) (28) - - (15) (45) 5 (1) 4 Interest expense, net (155) (164) (145) (542) (1,006) (95) (409) (504) Joint venture dividends received (96) (11) (55) (44) (206) (14) (73) (87) Provision for income taxes (263) (388) (506) 98 (1,059) (301) (306) (607) Non-controlling interests (3) (1) - - (3) (7) (1) (2) (3) Fair value change in warrants (59) 6 22 (6) (37) (10) - - (10) Other (3) (1) 3 (5) (6) (5) 2 (3) Income from continuing operations 682 851 911 27 2,471 594 768 1,362 Adjustments to EBITDA (34) 36 14 3 19 - - (29) (29) Premiums and charges on early repayment of debt - - 12 - - 431 443 - - 329 329 Reorganization items 2 28 - - 15 45 (5) - - (5) Asset retirement obligation - - - - 10 - - 10 - - - - - - Fair value change in warrants 59 (6) (22) 6 37 10 - - 10 Impairment charges - - 4 19 - - 23 22 - - 22 Tax impact of net income (loss) adjustments 11 (21) (5) (154) (169) (5) (109) (114) Adjusted income from continuing operations $ 720 $ 904 $ 927 $ 328 $ 2,879 $ 616 $ 959 $ 1,575 Earnings (loss) per share: Diluted earnings per share – continuing operations $ 1.19 $ 1.46 $ 1.54 $ 0.05 $ 4.32 $ 1.03 $ 1.33 $ 2.36 Adjustments to continuing operations 0.07 0.09 0.03 0.52 0.69 0.04 0.32 0.36 Adjusted diluted earnings per share $ 1.26 $ 1.55 $ 1.57 $ 0.57 $ 5.01 $ 1.07 $ 1.65 $ 2.72
lyondellbasell.com
Back-up
25

lyondellbasell.com
Jim Gallogly, Chief Executive Officer Karyn Ovelmen, Chief Financial Officer Sergey Vasnetsov, SVP - Strategic Planning and Transactions Doug Pike, VP - Investor Relations July 27, 2012
Second-Quarter 2012 Earnings

lyondellbasell.com
Cautionary Statement
The information in this presentation includes forward-looking statements. These statements relate to future events, such as anticipated revenues, earnings, business strategies, competitive position or other aspects of our operations or operating results. Actual outcomes and results may differ materially from what is expressed or forecast in such forward‐looking statements. These statements are not guarantees of future performance and involve certain risks, uncertainties and assumptions that are difficult to predict. Factors that could cause actual results to differ from forward-looking statements include, but are not limited to, availability, cost and price volatility of raw materials and utilities; supply/demand balances; industry production capacities and operating rates; uncertainties associated with worldwide economies; legal, tax and environmental proceedings; cyclical nature of the chemical and refining industries; operating interruptions; current and potential governmental regulatory actions; terrorist acts; international political unrest; competitive products and pricing; technological developments; the ability to comply with the terms of our credit facilities and other financing arrangements; the ability to implement business strategies; and other factors affecting our business generally as set forth in the “Risk Factors” section of our Form 10-K for the year ended December 31, 2011, which can be found at www.lyondellbasell.com on the Investor Relations page and on the Securities and Exchange Commission’s website at www.sec.gov.
This presentation contains time sensitive information that is accurate only as of the date hereof. Information contained in this presentation is unaudited and is subject to change. We undertake no obligation to update the information presented herein except as required by law.
27

lyondellbasell.com
Information Related to Financial Measures
We have included EBITDA in this presentation, which is a non-GAAP measure, as we believe that EBITDA is a measure commonly used by investors. However, EBITDA, as presented herein, may not be comparable to a similarly titled measure reported by other companies due to differences in the way the measure is calculated. For purposes of this presentation, EBITDA means earnings before interest, taxes, depreciation and amortization, as adjusted for other items management does not believe are indicative of the Company’s underlying results of operations such as impairment charges, reorganization items, the effect of mark-to-market accounting on our warrants. EBITDA also includes dividends from joint ventures. EBITDA should not be considered an alternative to profit or operating profit for any period as an indicator of our performance, or as an alternative to operating cash flows as a measure of our liquidity. See Table 9 of our accompanying earnings release for reconciliations of EBITDA to net income. While we also believe that net debt is a measure commonly used by investors, net debt, as presented herein, may not be comparable to a similarly titled measure reported by other companies due to differences in the way the measure is calculated. For purposes of this presentation, net debt means short-term debt plus current maturities of long-term debt plus long-term debt minus cash and cash equivalents and minus restricted cash.
28
lyondellbasell.com
500
1,000
1,500
$2,000
1Q'11 2Q'11 3Q'11 4Q'11 1Q'12 2Q'12
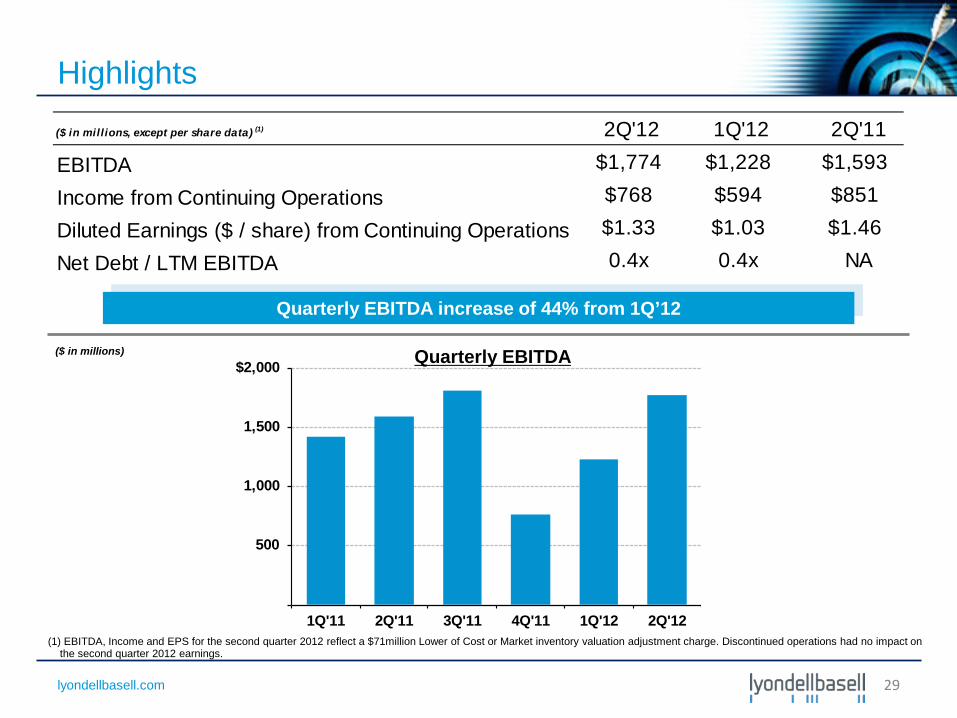
Highlights
Quarterly EBITDA
Quarterly EBITDA increase of 44% from 1Q’12
($ in millions)
29
($ in millions, except per share data) (1) 2Q'12 1Q'12 2Q'11
EBITDA $1,774 $1,228 $1,593
Income from Continuing Operations $768 $594 $851
Diluted Earnings ($ / share) from Continuing Operations $1.33 $1.03 $1.46
Net Debt / LTM EBITDA 0.4x 0.4x NA
(1) EBITDA, Income and EPS for the second quarter 2012 reflect a $71million Lower of Cost or Market inventory valuation adjustment charge. Discontinued operations had no impact on the second quarter 2012 earnings.
lyondellbasell.com
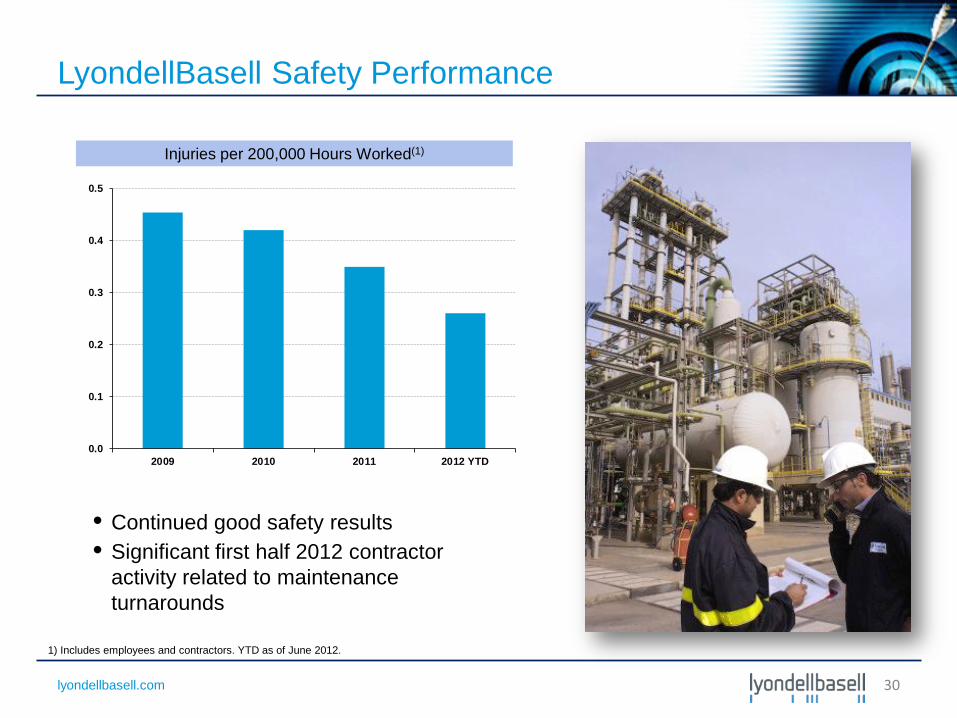
LyondellBasell Safety Performance
• Continued good safety results • Significant first half 2012 contractor
activity related to maintenance turnarounds
Injuries per 200,000 Hours Worked(1)
1) Includes employees and contractors. YTD as of June 2012.
30
0.0
0.1
0.2
0.3
0.4
0.5
2009 2010 2011 2012 YTD
lyondellbasell.com
500
1,000
1,500
2,000
2,500
$3,000
Olefins &Polyolefins -
Americas
Olefins &Polyolefins -
EAI
Intermediates& Derivatives
Refining Technology
150
300
450
600
750
$900
Olefins &Polyolefins -
Americas
Olefins &Polyolefins -
EAI
Intermediates& Derivatives
Refining Technology
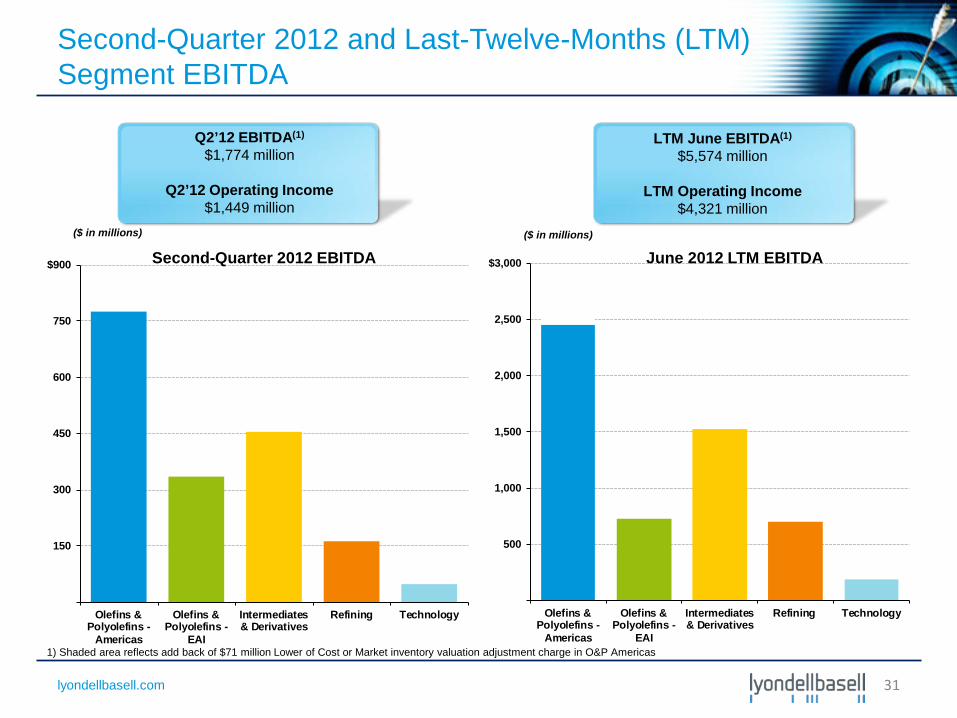
June 2012 LTM EBITDA
LTM June EBITDA(1)
$5,574 million
LTM Operating Income $4,321 million
Q2’12 EBITDA(1)
$1,774 million
Q2’12 Operating Income
$1,449 million
Second-Quarter 2012 and Last-Twelve-Months (LTM) Segment EBITDA
Second-Quarter 2012 EBITDA ($ in millions) ($ in millions)
31
1) Shaded area reflects add back of $71 million Lower of Cost or Market inventory valuation adjustment charge in O&P Americas
lyondellbasell.com
$4,937
$1,964
0
2,500
5,000
7,500
$10,000
Q3'11Begin.Cash
Balance
CF fromOperations
excl.WorkingCapital
WorkingCapital
Changes
Capex Dividends Net DebtRepayment
Other Q2'12EndingCash
Balance
$1,679
$1,964
0
750
1,500
2,250
$3,000
Q2'12Beginning
CashBalance
CF fromOperations
excl.WorkingCapital
WorkingCapital
Changes
Capex Dividends Net DebtRepayment
Other Q2'12EndingCash
Balance
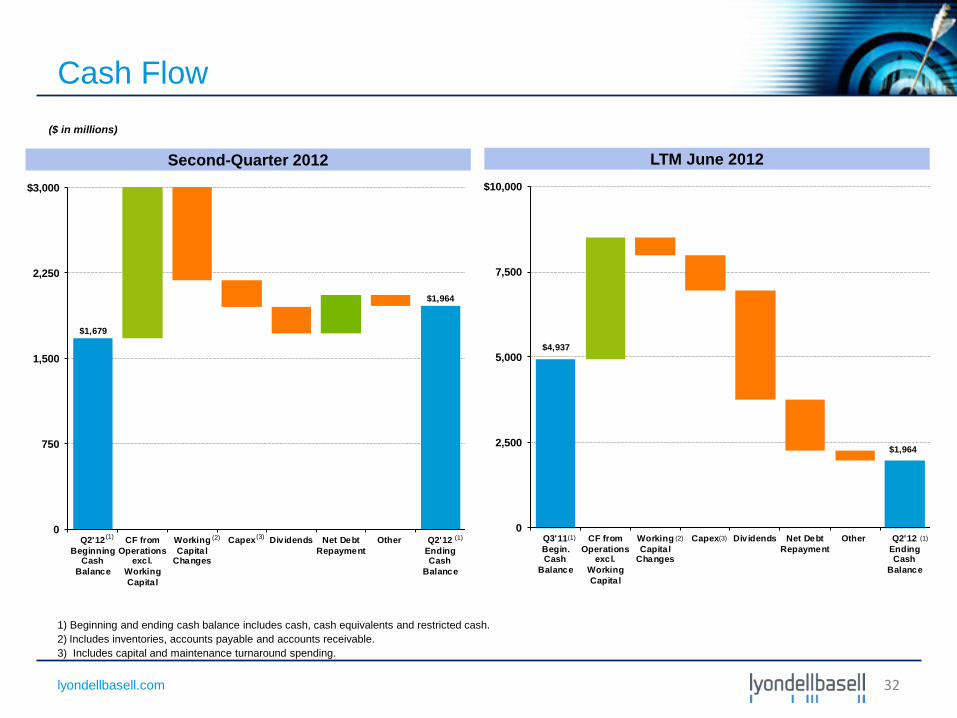
Cash Flow
1) Beginning and ending cash balance includes cash, cash equivalents and restricted cash. 2) Includes inventories, accounts payable and accounts receivable. 3) Includes capital and maintenance turnaround spending.
(3) (2) (1)
($ in millions)
(2) (1)
Second-Quarter 2012 LTM June 2012
(3) (1)
32
(1)
lyondellbasell.com
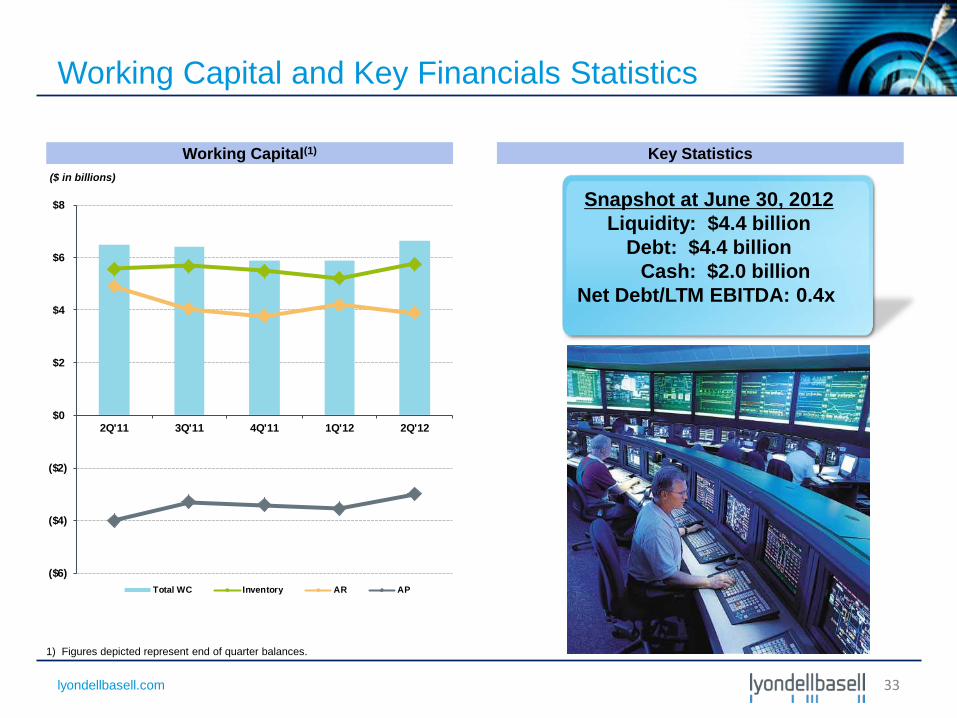
Working Capital and Key Financials Statistics
Snapshot at June 30, 2012 Liquidity: $4.4 billion
Debt: $4.4 billion Cash: $2.0 billion
Net Debt/LTM EBITDA: 0.4x
1) Figures depicted represent end of quarter balances.
($ in billions)
Working Capital(1) Key Statistics
33
($6)
($4)
($2)
$0
$2
$4
$6
$8
2Q'11 3Q'11 4Q'11 1Q'12 2Q'12
Total WC Inventory AR AP
lyondellbasell.com
(10)
0
10
20
30
40
50
Ethane Margin Naphtha Margin HDPE Margin Ethylene/HDPE Chain
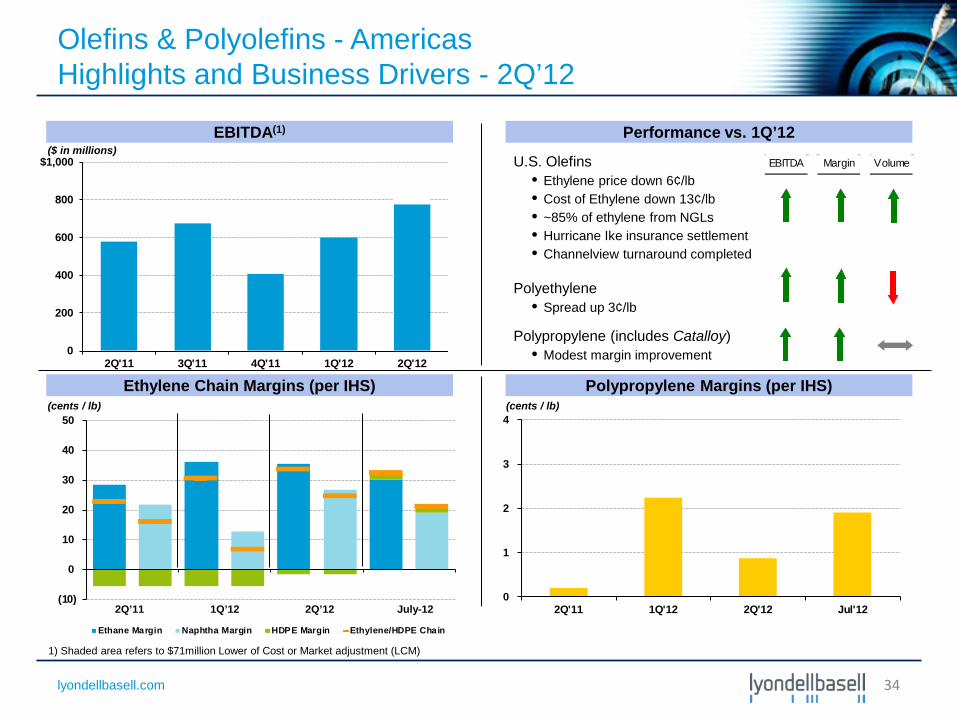
Olefins & Polyolefins - Americas Highlights and Business Drivers - 2Q’12
U.S. Olefins • Ethylene price down 6¢/lb • Cost of Ethylene down 13¢/lb • ~85% of ethylene from NGLs • Hurricane Ike insurance settlement • Channelview turnaround completed
Polyethylene • Spread up 3¢/lb
Polypropylene (includes Catalloy)
• Modest margin improvement
Ethylene Chain Margins (per IHS)
EBITDA(1) Performance vs. 1Q’12
Polypropylene Margins (per IHS)
EBITDA Margin Volume($ in millions)
(cents / lb) (cents / lb)
2Q’11 1Q’12 2Q’12 July-12
0
200
400
600
800
$1,000
2Q'11 3Q'11 4Q'11 1Q'12 2Q'12
34
0
1
2
3
4
2Q'11 1Q'12 2Q'12 Jul'12
1) Shaded area refers to $71million Lower of Cost or Market adjustment (LCM)
lyondellbasell.com
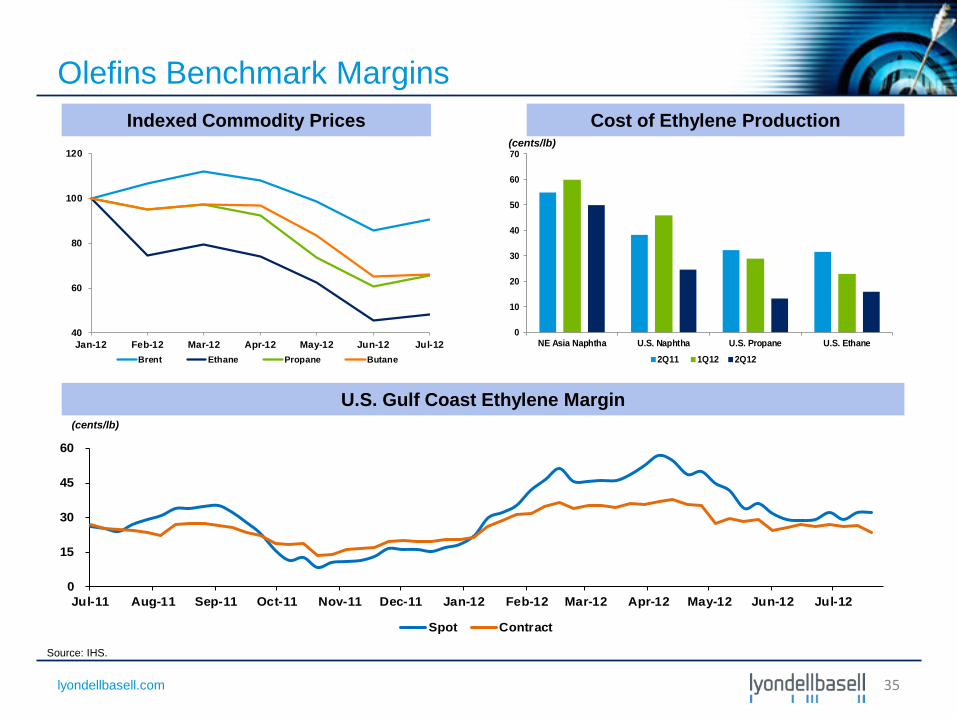
Olefins Benchmark Margins
U.S. Gulf Coast Ethylene Margin
(cents/lb)
Source: IHS.
35
0
15
30
45
60
Jul-11 Aug-11 Sep-11 Oct-11 Nov-11 Dec-11 Jan-12 Feb-12 Mar-12 Apr-12 May-12 Jun-12 Jul-12
Spot Contract
40
60
80
100
120
Jan-12 Feb-12 Mar-12 Apr-12 May-12 Jun-12 Jul-12Brent Ethane Propane Butane
0
10
20
30
40
50
60
70
NE Asia Naphtha U.S. Naphtha U.S. Propane U.S. Ethane
2Q11 1Q12 2Q12
Indexed Commodity Prices Cost of Ethylene Production
(cents/lb)
lyondellbasell.com
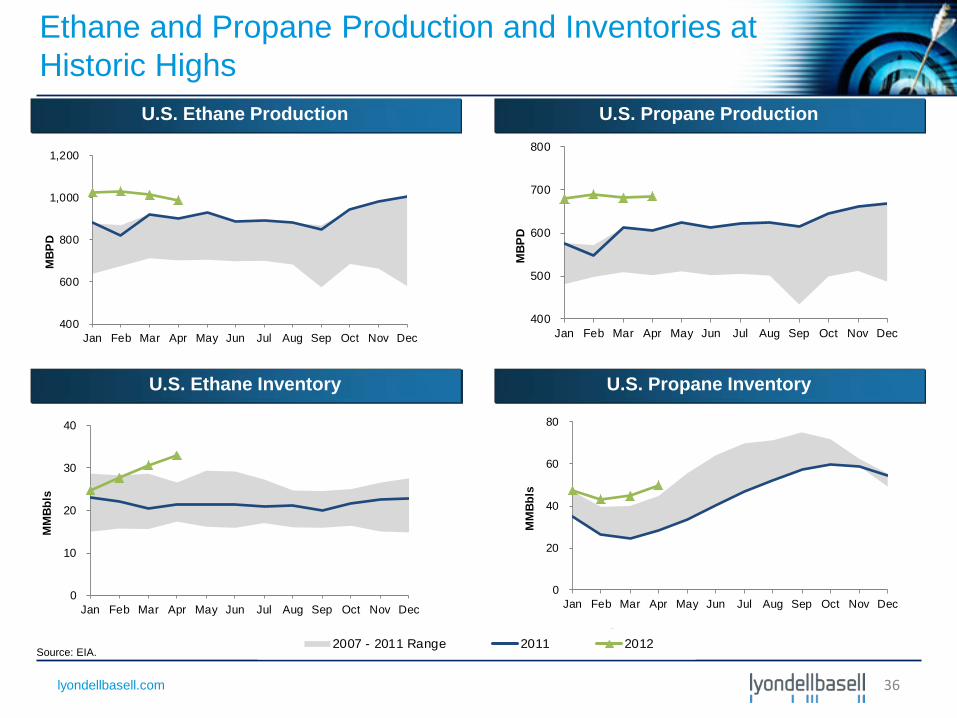
Ethane and Propane Production and Inventories at Historic Highs
U.S. Ethane Production U.S. Propane Production
2007 - 2011 Range 2011 2012
U.S. Ethane Inventory U.S. Propane Inventory
Source: EIA.
36
400
600
800
1,000
1,200
Jan Feb Mar Apr May Jun Jul Aug Sep Oct Nov Dec
MBP
D
400
500
600
700
800
Jan Feb Mar Apr May Jun Jul Aug Sep Oct Nov Dec
MBP
D
0
10
20
30
40
Jan Feb Mar Apr May Jun Jul Aug Sep Oct Nov Dec
MM
Bbls
0
20
40
60
80
Jan Feb Mar Apr May Jun Jul Aug Sep Oct Nov Dec
MM
Bbls
lyondellbasell.com
(10)
0
10
20
30
40
50
2Q'11 1Q'12 2Q'12 Jul' 12
HDPE Margin Naphtha Margin Ethylene/HDPE Chain
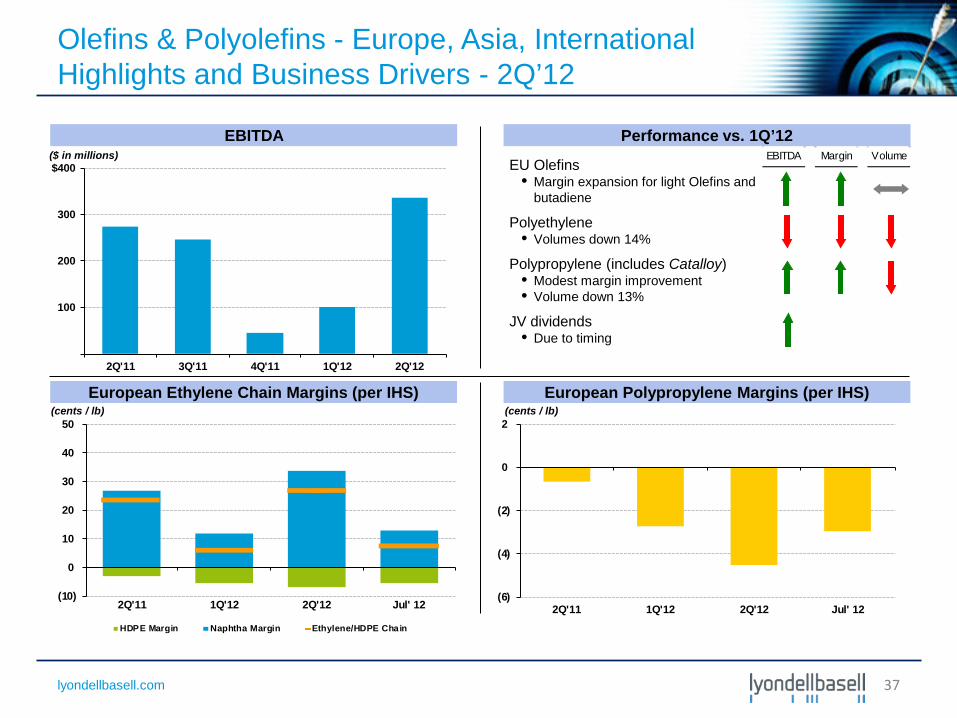
Olefins & Polyolefins - Europe, Asia, International Highlights and Business Drivers - 2Q’12
EU Olefins • Margin expansion for light Olefins and
butadiene
Polyethylene • Volumes down 14%
Polypropylene (includes Catalloy)
• Modest margin improvement • Volume down 13%
JV dividends • Due to timing
European Ethylene Chain Margins (per IHS)
EBITDA Performance vs. 1Q’12
European Polypropylene Margins (per IHS)
EBITDA Margin Volume($ in millions)
(cents / lb) (cents / lb)
100
200
300
$400
2Q'11 3Q'11 4Q'11 1Q'12 2Q'12
37
(6)
(4)
(2)
0
2
2Q'11 1Q'12 2Q'12 Jul' 12
lyondellbasell.com
0
15
30
45
2Q11 1Q12 2Q12 3Q12 E
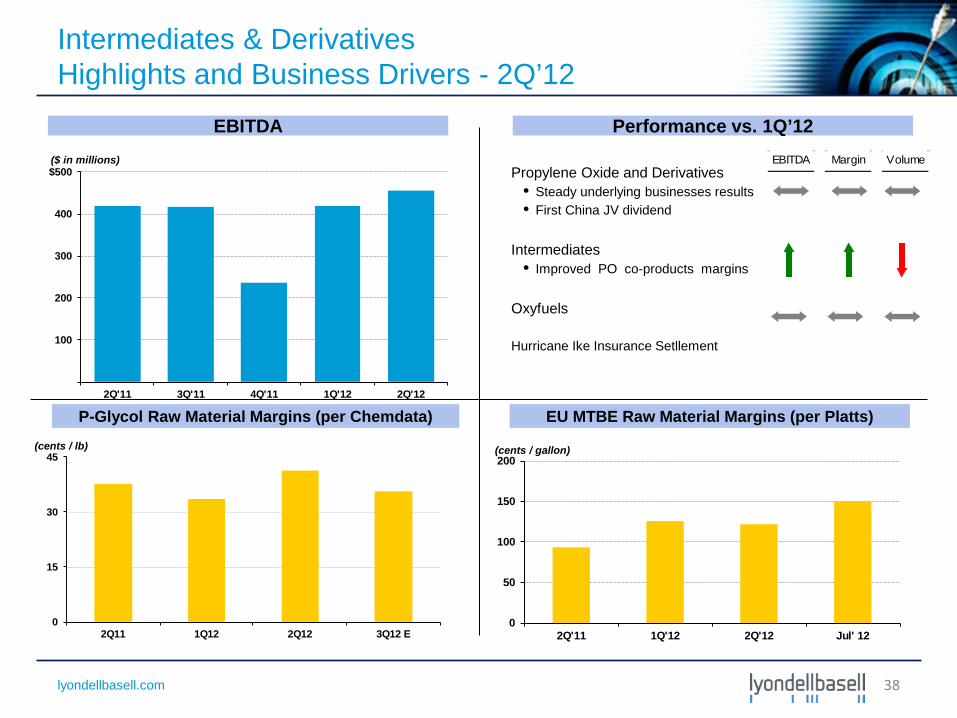
Intermediates & Derivatives Highlights and Business Drivers - 2Q’12
EBITDA
Propylene Oxide and Derivatives • Steady underlying businesses results • First China JV dividend
Intermediates
• Improved PO co-products margins Oxyfuels
Hurricane Ike Insurance Setllement
EBITDA Margin Volume
Performance vs. 1Q’12 ($ in millions)
38
EU MTBE Raw Material Margins (per Platts)
(cents / gallon)
0
50
100
150
200
2Q'11 1Q'12 2Q'12 Jul' 12
P-Glycol Raw Material Margins (per Chemdata)
(cents / lb)
100
200
300
400
$500
2Q'11 3Q'11 4Q'11 1Q'12 2Q'12
lyondellbasell.com
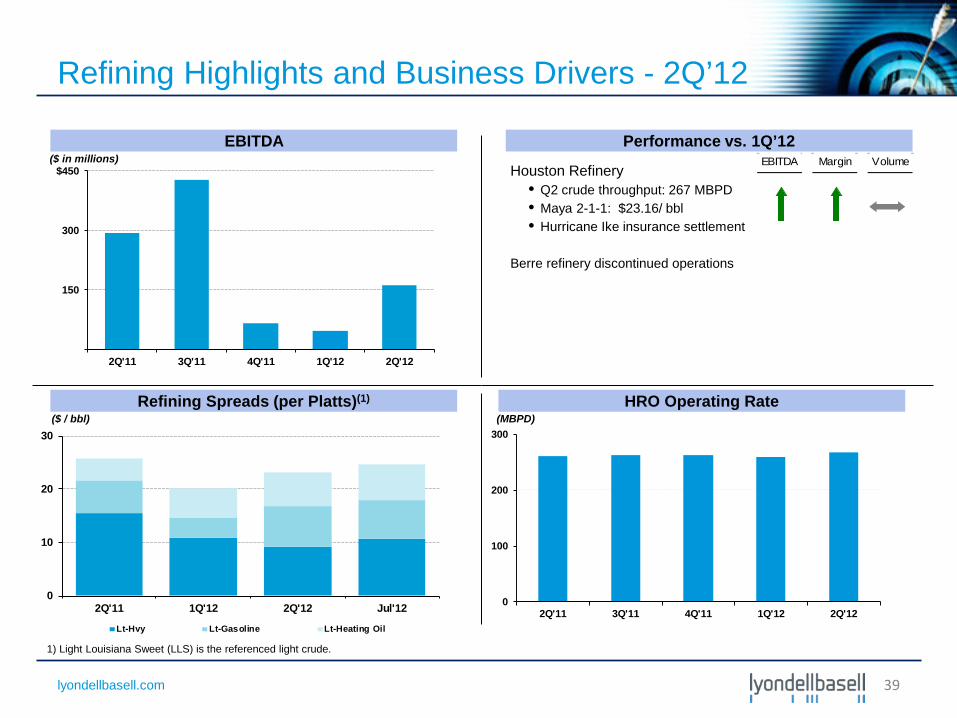
Refining Highlights and Business Drivers - 2Q’12
Houston Refinery • Q2 crude throughput: 267 MBPD • Maya 2-1-1: $23.16/ bbl • Hurricane Ike insurance settlement
Berre refinery discontinued operations
Refining Spreads (per Platts)(1)
EBITDA Performance vs. 1Q’12 EBITDA Margin Volume($ in millions)
($ / bbl)
1) Light Louisiana Sweet (LLS) is the referenced light crude.
39
0
10
20
30
2Q'11 1Q'12 2Q'12 Jul'12
Lt-Hvy Lt-Gasoline Lt-Heating Oil
HRO Operating Rate
0
100
200
300
2Q'11 3Q'11 4Q'11 1Q'12 2Q'12
150
300
$450
2Q'11 3Q'11 4Q'11 1Q'12 2Q'12
(MBPD)
lyondellbasell.com
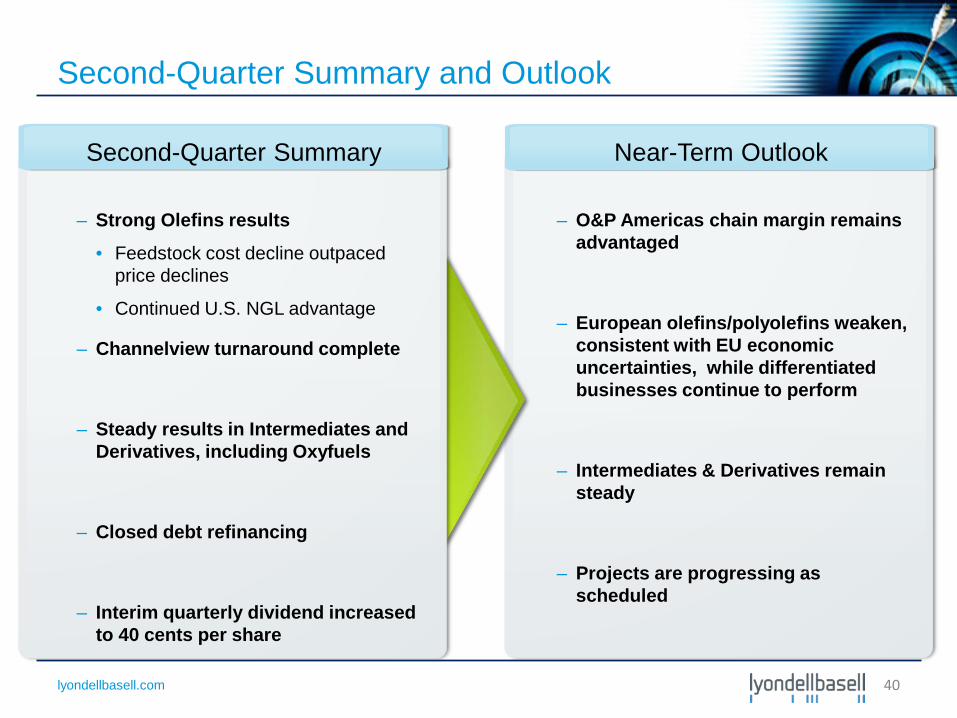
– O&P Americas chain margin remains advantaged
– European olefins/polyolefins weaken, consistent with EU economic uncertainties, while differentiated businesses continue to perform
– Intermediates & Derivatives remain steady
– Projects are progressing as scheduled
Second-Quarter Summary and Outlook
– Strong Olefins results
• Feedstock cost decline outpaced price declines
• Continued U.S. NGL advantage
– Channelview turnaround complete
– Steady results in Intermediates and Derivatives, including Oxyfuels
– Closed debt refinancing
– Interim quarterly dividend increased to 40 cents per share
Second-Quarter Summary Near-Term Outlook
40