Embed Size (px)
Citation preview

US Multifamily Strategy & 2016 Outlook
Jeff AdlerVice President, Matrix
Jack KernDirector, Research and Publications
Spring 2016

2
ALTHOUGH EVERY EFFORT IS MADE TO ENSURE THE ACCURACY, TIMELINESS AND COMPLETENESS OF THE INFORMATION PROVIDED IN THIS PUBLICATION, THE INFORMATION IS PROVIDED “AS IS” AND YARDI MATRIX DOES NOT GUARANTEE, WARRANT, REPRESENT OR UNDERTAKE THAT THE INFORMATION PROVIDED IS CORRECT, ACCURATE, CURRENT OR COMPLETE. YARDI MATRIX IS NOT LIABLE FOR ANY LOSS, CLAIM, OR DEMAND ARISING DIRECTLY OR INDIRECTLY FROM ANY USE OR RELIANCE UPON THE INFORMATION CONTAINED HEREIN.
Disclaimer
3
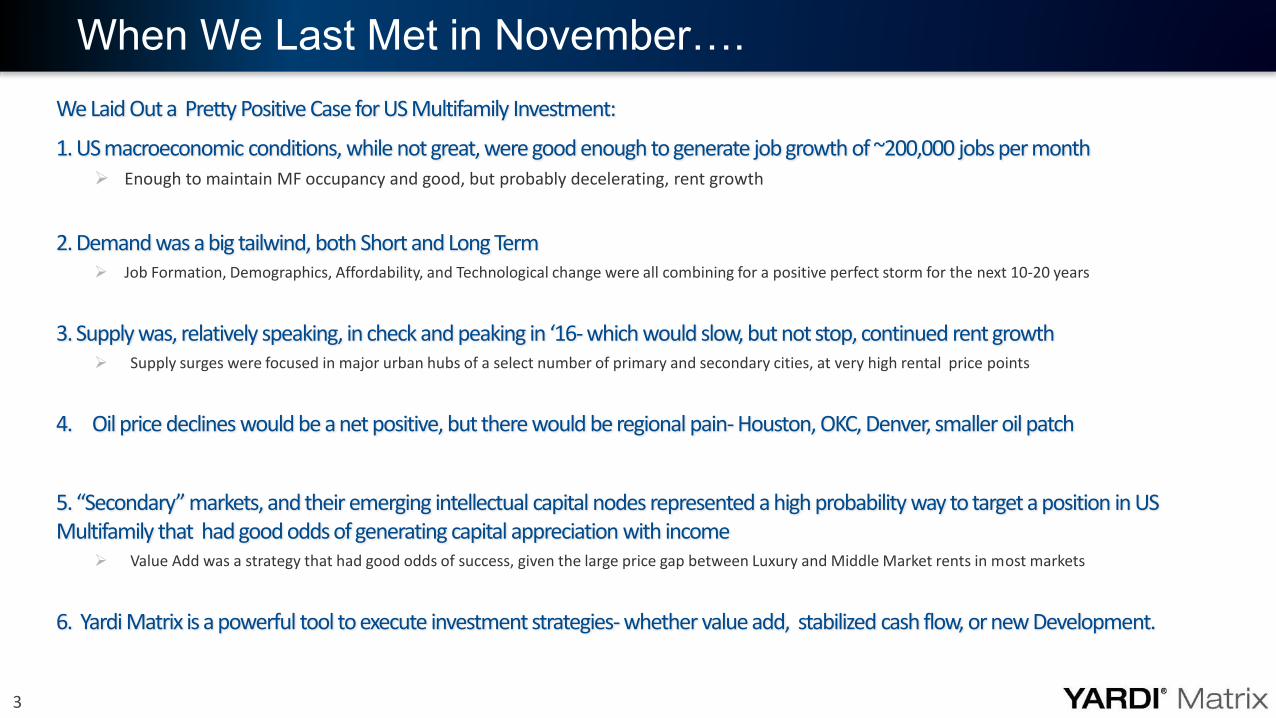
We Laid Out a Pretty Positive Case for US Multifamily Investment:
1. US macroeconomic conditions, while not great, were good enough to generate job growth of ~200,000 jobs per month Enough to maintain MF occupancy and good, but probably decelerating, rent growth
2. Demand was a big tailwind, both Short and Long Term Job Formation, Demographics, Affordability, and Technological change were all combining for a positive perfect storm for the next 10-20 years
3. Supply was, relatively speaking, in check and peaking in ‘16- which would slow, but not stop, continued rent growth Supply surges were focused in major urban hubs of a select number of primary and secondary cities, at very high rental price points
4. Oil price declines would be a net positive, but there would be regional pain- Houston, OKC, Denver, smaller oil patch
5. “Secondary” markets, and their emerging intellectual capital nodes represented a high probability way to target a position in US Multifamily that had good odds of generating capital appreciation with income
Value Add was a strategy that had good odds of success, given the large price gap between Luxury and Middle Market rents in most markets
6. Yardi Matrix is a powerful tool to execute investment strategies- whether value add, stabilized cash flow, or new Development.
When We Last Met in November….
4
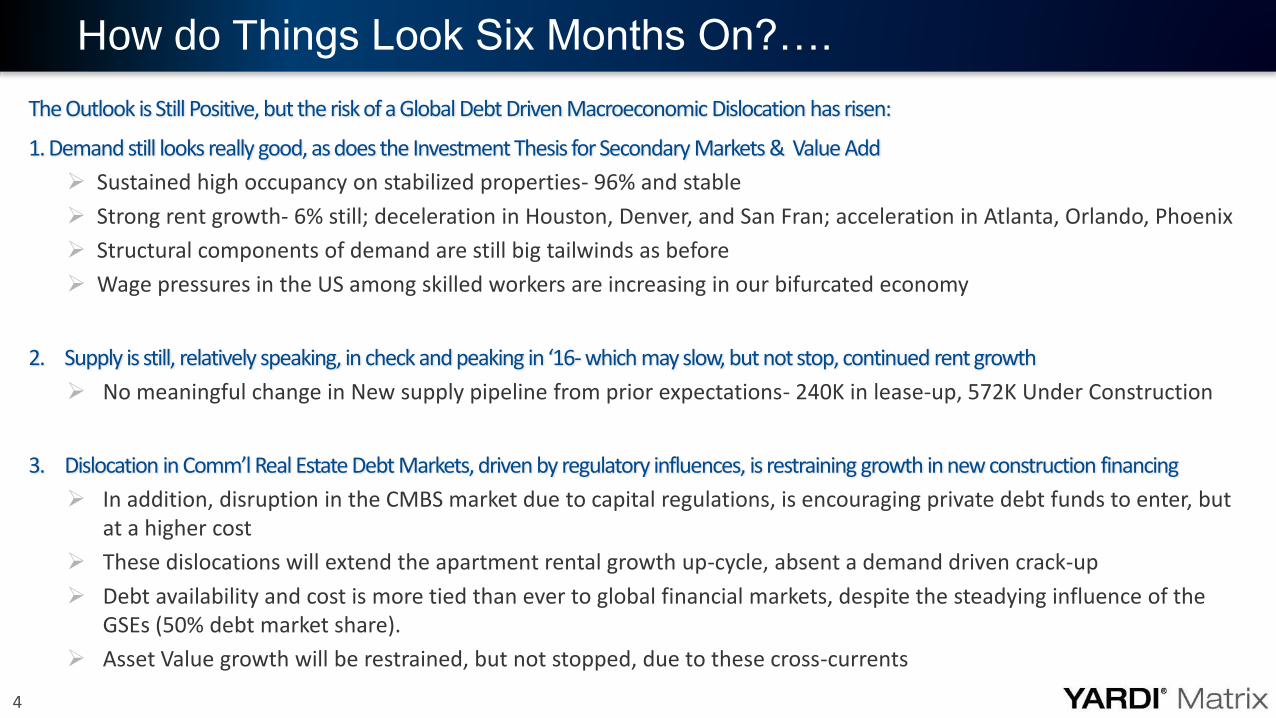
The Outlook is Still Positive, but the risk of a Global Debt Driven Macroeconomic Dislocation has risen:
1. Demand still looks really good, as does the Investment Thesis for Secondary Markets & Value Add
Sustained high occupancy on stabilized properties- 96% and stable
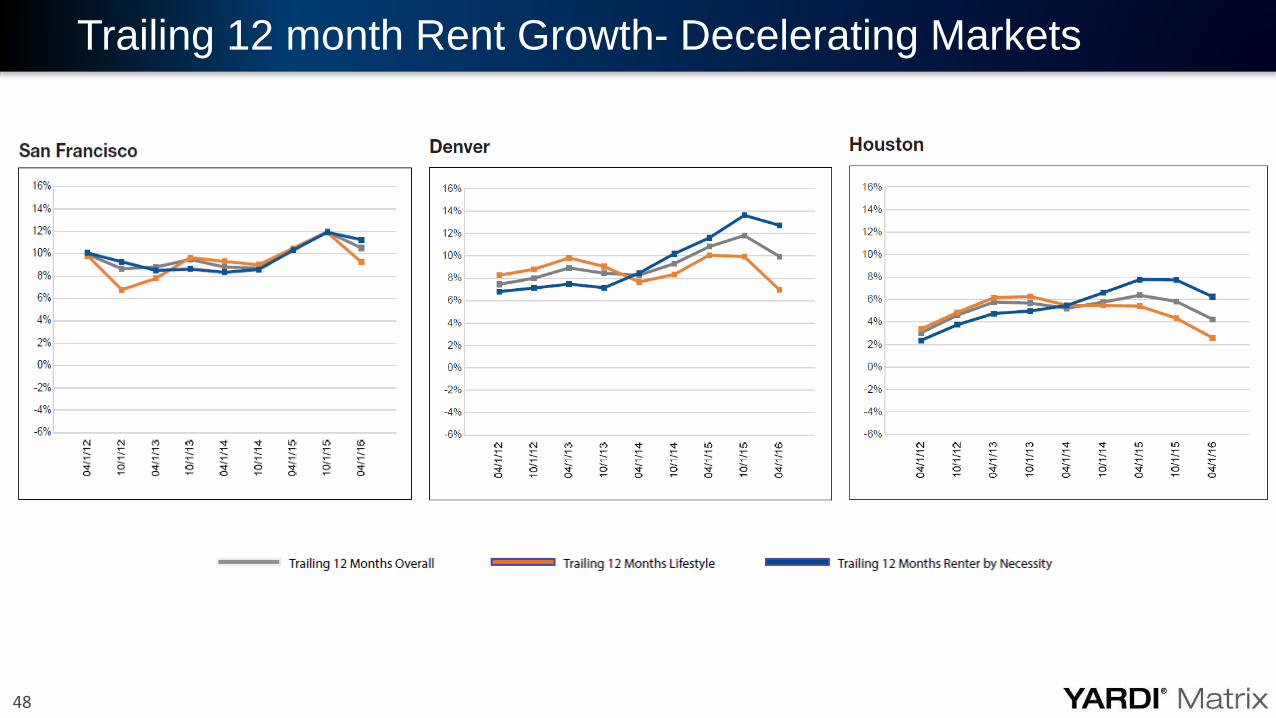
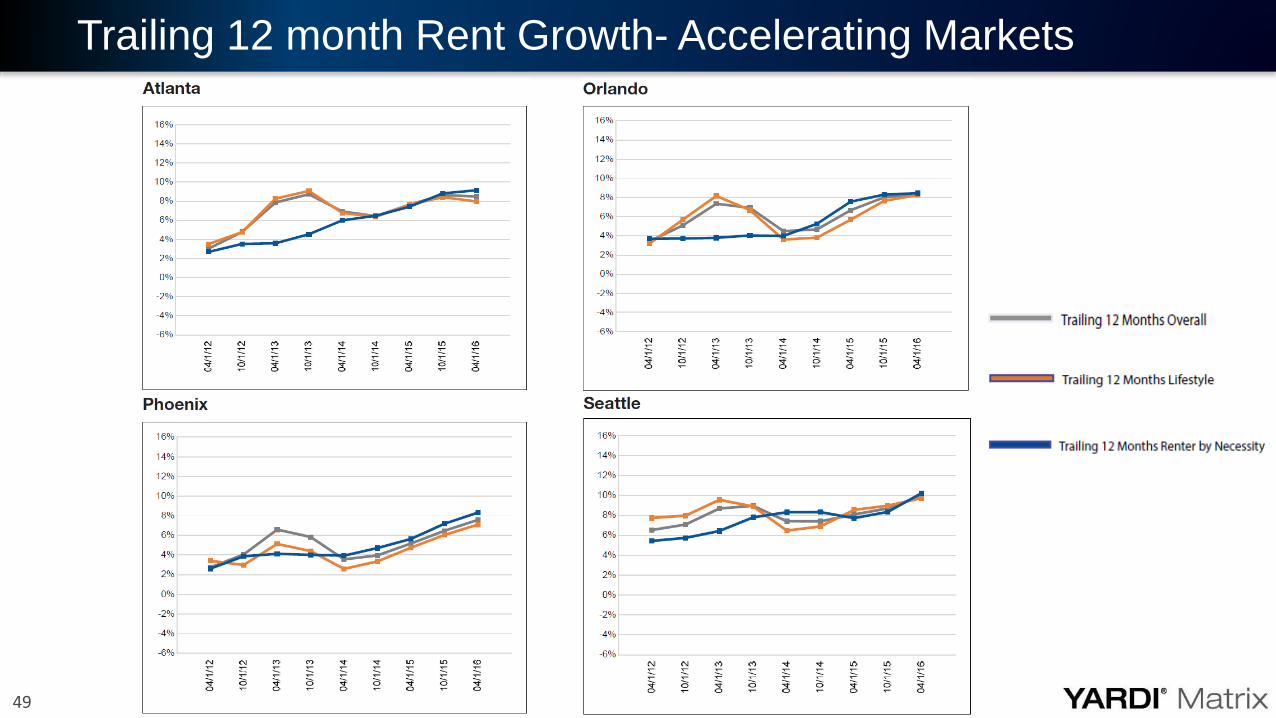
Strong rent growth- 6% still; deceleration in Houston, Denver, and San Fran; acceleration in Atlanta, Orlando, Phoenix
Structural components of demand are still big tailwinds as before
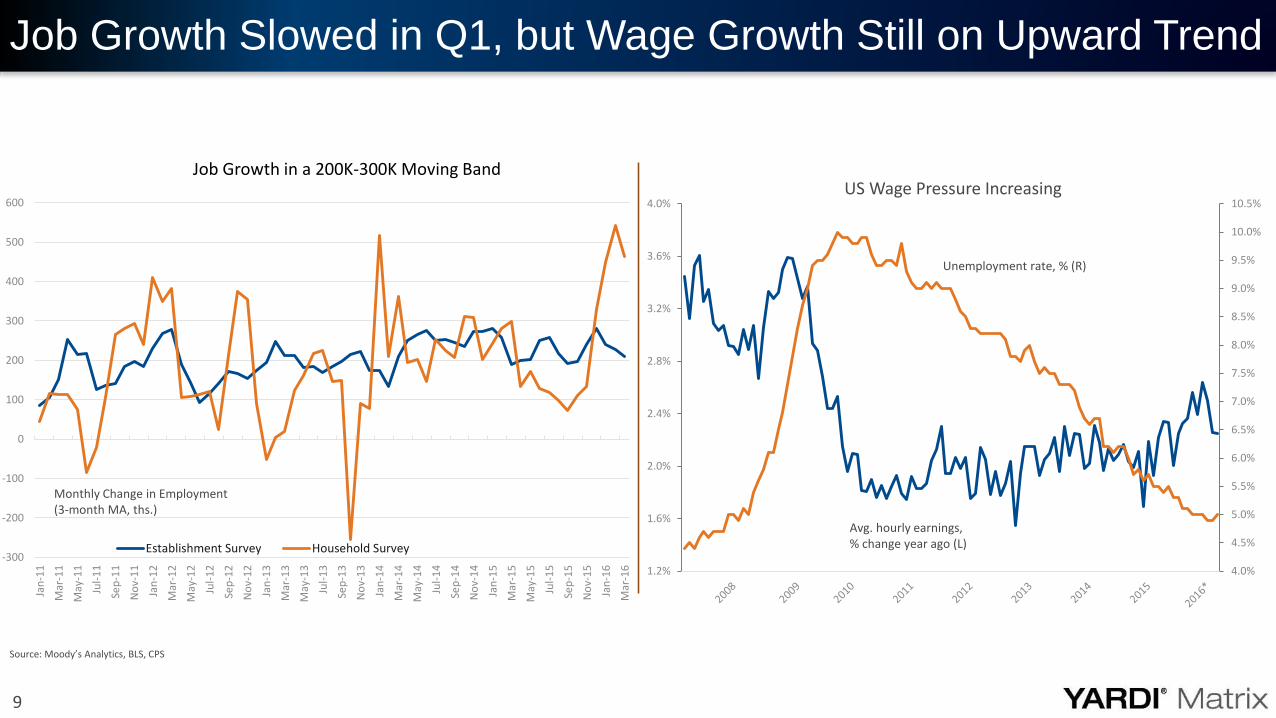
Wage pressures in the US among skilled workers are increasing in our bifurcated economy
2. Supply is still, relatively speaking, in check and peaking in ‘16- which may slow, but not stop, continued rent growth
No meaningful change in New supply pipeline from prior expectations- 240K in lease-up, 572K Under Construction
3. Dislocation in Comm’l Real Estate Debt Markets, driven by regulatory influences, is restraining growth in new construction financing
In addition, disruption in the CMBS market due to capital regulations, is encouraging private debt funds to enter, but at a higher cost
These dislocations will extend the apartment rental growth up-cycle, absent a demand driven crack-up
Debt availability and cost is more tied than ever to global financial markets, despite the steadying influence of the GSEs (50% debt market share).
Asset Value growth will be restrained, but not stopped, due to these cross-currents
How do Things Look Six Months On?….
5
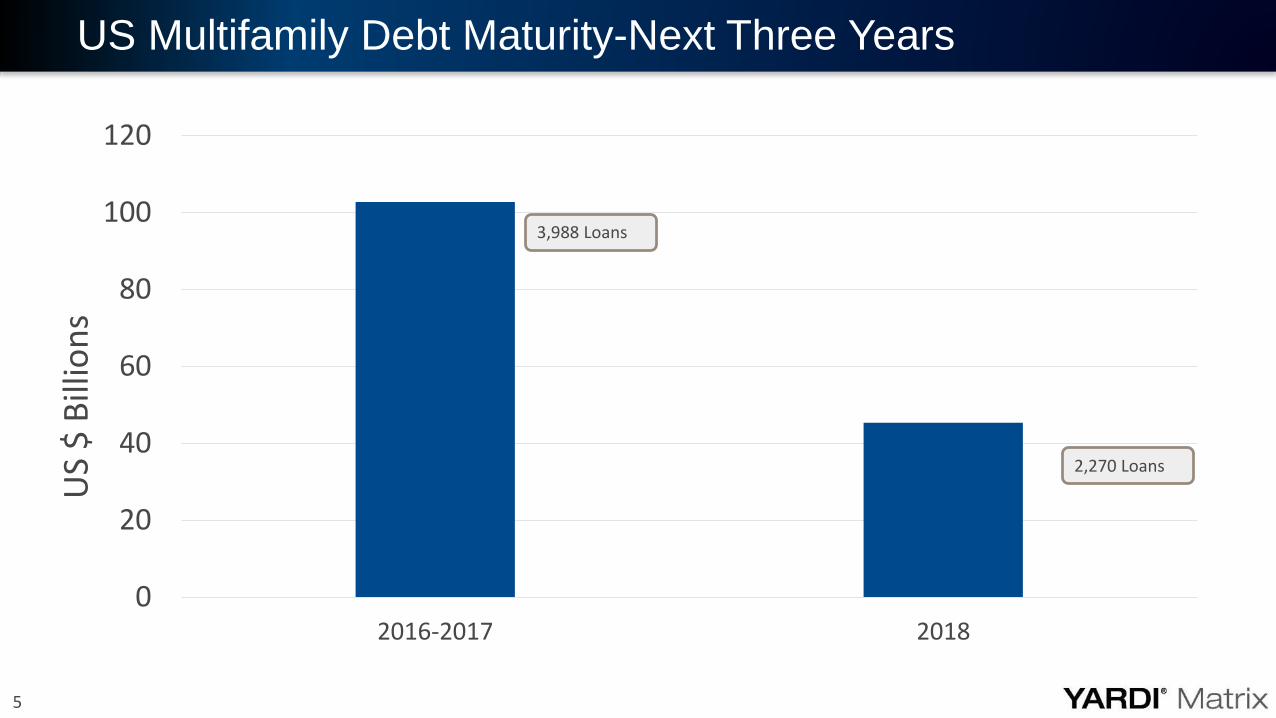
US Multifamily Debt Maturity-Next Three Years
0
20
40
60
80
100
120
2016-2017 2018
US
$ B
illio
ns
2,270 Loans
3,988 Loans

6
The Outlook is Still Positive, but the risk of a Global Debt Driven Macroeconomic Dislocation has risen:
4. Global Macroeconomic concerns and slow US GDP growth in Q1 (0.5%), along with stretched equity market valuations, and coincident probable equity market volatility, are the chief reasons driving near term caution
US economy is the relative “one-eyed” man among the land of the blind- Europe, Japan, and a transforming China
Interest rate increases in 2016 are very unlikely
Monetary Policy, and the Debt Surge it has engendered in the Govt & Corporate Sector, has reached its limits (or very near its limits)—
Pro-Growth Structural Government Policies are Needed, but is unlikely.
US Multifamily is still the place to be, even if the ride is at risk of a few potential transitory bumps in the road
5. Yardi Matrix is still a powerful tool to execute investment strategies- whether value add, stabilized cash flow, or new Development.
How do Things Look Six Months On?….

Macroeconomic Outlook
8
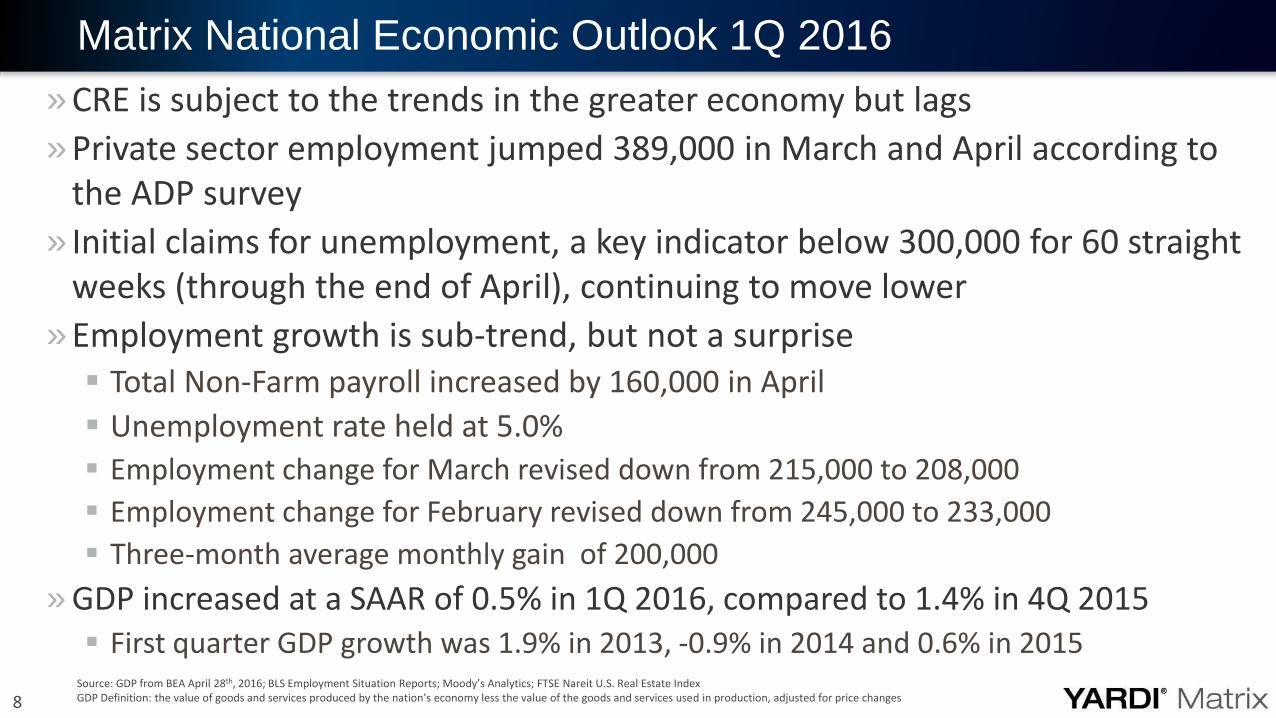
» CRE is subject to the trends in the greater economy but lags
» Private sector employment jumped 389,000 in March and April according to the ADP survey
» Initial claims for unemployment, a key indicator below 300,000 for 60 straight weeks (through the end of April), continuing to move lower
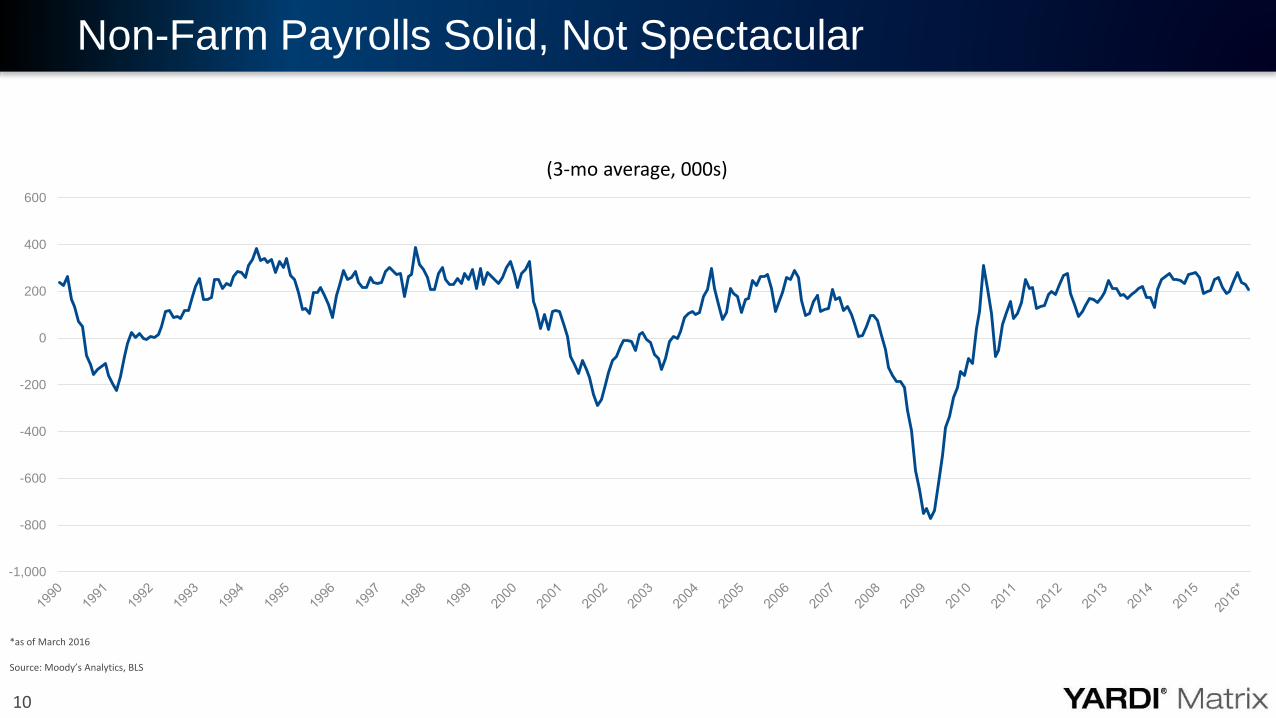
» Employment growth is sub-trend, but not a surprise Total Non-Farm payroll increased by 160,000 in April
Unemployment rate held at 5.0%
Employment change for March revised down from 215,000 to 208,000
Employment change for February revised down from 245,000 to 233,000
Three-month average monthly gain of 200,000
» GDP increased at a SAAR of 0.5% in 1Q 2016, compared to 1.4% in 4Q 2015 First quarter GDP growth was 1.9% in 2013, -0.9% in 2014 and 0.6% in 2015
Matrix National Economic Outlook 1Q 2016
Source: GDP from BEA April 28th, 2016; BLS Employment Situation Reports; Moody’s Analytics; FTSE Nareit U.S. Real Estate Index GDP Definition: the value of goods and services produced by the nation’s economy less the value of the goods and services used in production, adjusted for price changes
9
Job Growth Slowed in Q1, but Wage Growth Still on Upward Trend
Source: Moody’s Analytics, BLS, CPS
Monthly Change in Employment(3-month MA, ths.)
-300
-200
-100
0
100
200
300
400
500
600
Jan
-11
Mar
-11
May
-11
Jul-
11
Sep
-11
No
v-1
1
Jan
-12
Mar
-12
May
-12
Jul-
12
Sep
-12
No
v-1
2
Jan
-13
Mar
-13
May
-13
Jul-
13
Sep
-13
No
v-1
3
Jan
-14
Mar
-14
May
-14
Jul-
14
Sep
-14
No
v-1
4
Jan
-15
Mar
-15
May
-15
Jul-
15
Sep
-15
No
v-1
5
Jan
-16
Mar
-16
Job Growth in a 200K-300K Moving Band
Establishment Survey Household Survey
4.0%
4.5%
5.0%
5.5%
6.0%
6.5%
7.0%
7.5%
8.0%
8.5%
9.0%
9.5%
10.0%
10.5%
1.2%
1.6%
2.0%
2.4%
2.8%
3.2%
3.6%
4.0%US Wage Pressure Increasing
Unemployment rate, % (R)
Avg. hourly earnings,% change year ago (L)
10
Non-Farm Payrolls Solid, Not Spectacular
-1,000
-800
-600
-400
-200
0
200
400
600
(3-mo average, 000s)
*as of March 2016
Source: Moody’s Analytics, BLS
11
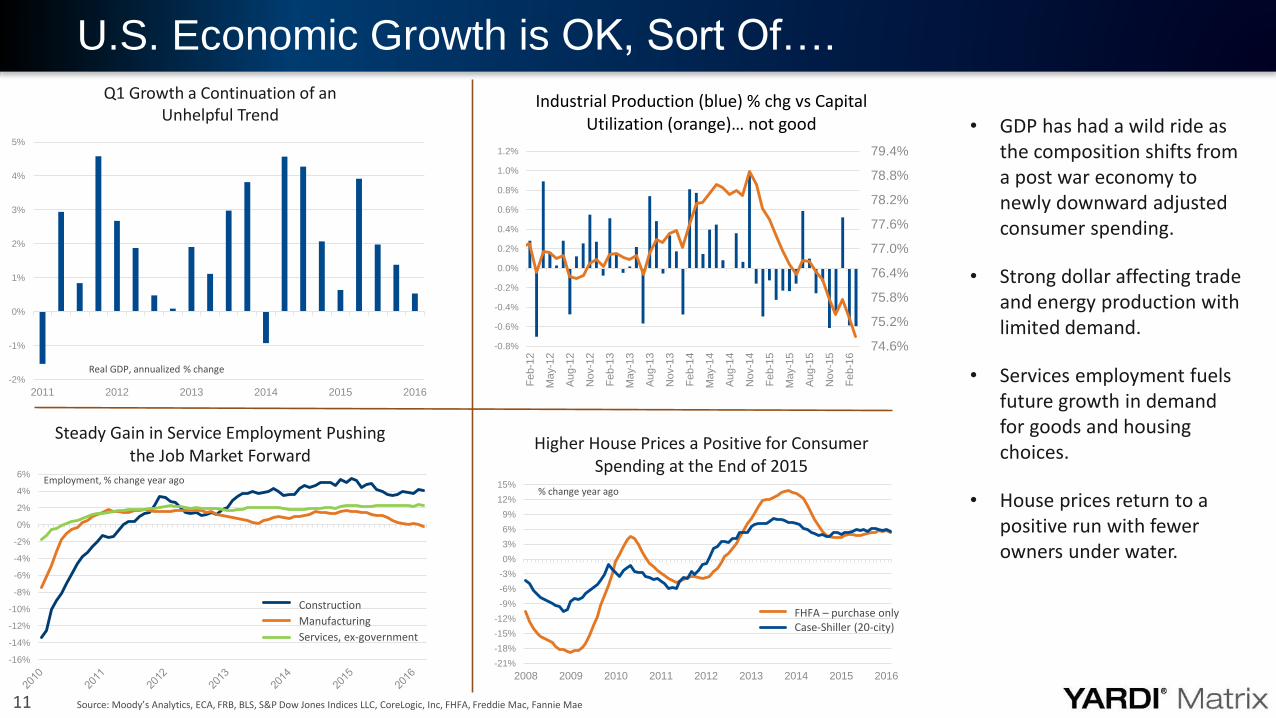
• GDP has had a wild ride as the composition shifts from a post war economy to newly downward adjusted consumer spending.
• Strong dollar affecting trade and energy production with limited demand.
• Services employment fuels future growth in demand for goods and housing choices.
• House prices return to a positive run with fewer owners under water.
U.S. Economic Growth is OK, Sort Of….
-2%
-1%
0%
1%
2%
3%
4%
5%
2011 2012 2013 2014 2015 2016
Q1 Growth a Continuation of an Unhelpful Trend
-16%
-14%
-12%
-10%
-8%
-6%
-4%
-2%
0%
2%
4%
6%
Steady Gain in Service Employment Pushing the Job Market Forward
Employment, % change year ago
Construction
Manufacturing
Services, ex-government
74.6%
75.2%
75.8%
76.4%
77.0%
77.6%
78.2%
78.8%
79.4%
-0.8%
-0.6%
-0.4%
-0.2%
0.0%
0.2%
0.4%
0.6%
0.8%
1.0%
1.2%
Fe
b-1
2
Ma
y-1
2
Au
g-1
2
Nov-1
2
Fe
b-1
3
Ma
y-1
3
Au
g-1
3
Nov-1
3
Fe
b-1
4
Ma
y-1
4
Au
g-1
4
Nov-1
4
Fe
b-1
5
Ma
y-1
5
Au
g-1
5
Nov-1
5
Fe
b-1
6
Industrial Production (blue) % chg vs Capital Utilization (orange)… not good
-21%
-18%
-15%
-12%
-9%
-6%
-3%
0%
3%
6%
9%
12%
15%
2008 2009 2010 2011 2012 2013 2014 2015 2016
Higher House Prices a Positive for Consumer Spending at the End of 2015
FHFA – purchase onlyCase-Shiller (20-city)
Source: Moody’s Analytics, ECA, FRB, BLS, S&P Dow Jones Indices LLC, CoreLogic, Inc, FHFA, Freddie Mac, Fannie Mae
Real GDP, annualized % change
% change year ago
12
» Household spending fueled by modest income gains (2%) and drop in oil/energy prices, gains in apparel and restaurant receipts
» Light vehicle sales at 17.4 million units (SAAR) in March, a year-over year growth of 1.68%
» Consumer Confidence Index at 96.11 in March, slightly below pre-recessionary levels
» March retail* sales holds steady in early 2016, and grew 1.73% year-over-year
» No inflation issue, but deflation watch
» Federal Reserve reticent on rate increases, even if warranted
Fed had limited options and unattractive choices going forward
» Current oil price opened at $45.43 compared to $38.00 three months ago
One year ago, oil prices about $64/barrel
Baker-Hughes U.S. oil rig count down by 11 to 332 from a high over 1,600
Household Spending, Income and Oil
Source: Moody’s Analytics, The Conference Board, AutoData, U.S. Census, Monthly Retail Trade and Food Services, FOMC, WTI (NYMEX)*Retail sales and food services, excludes motor vehicle and parts
13
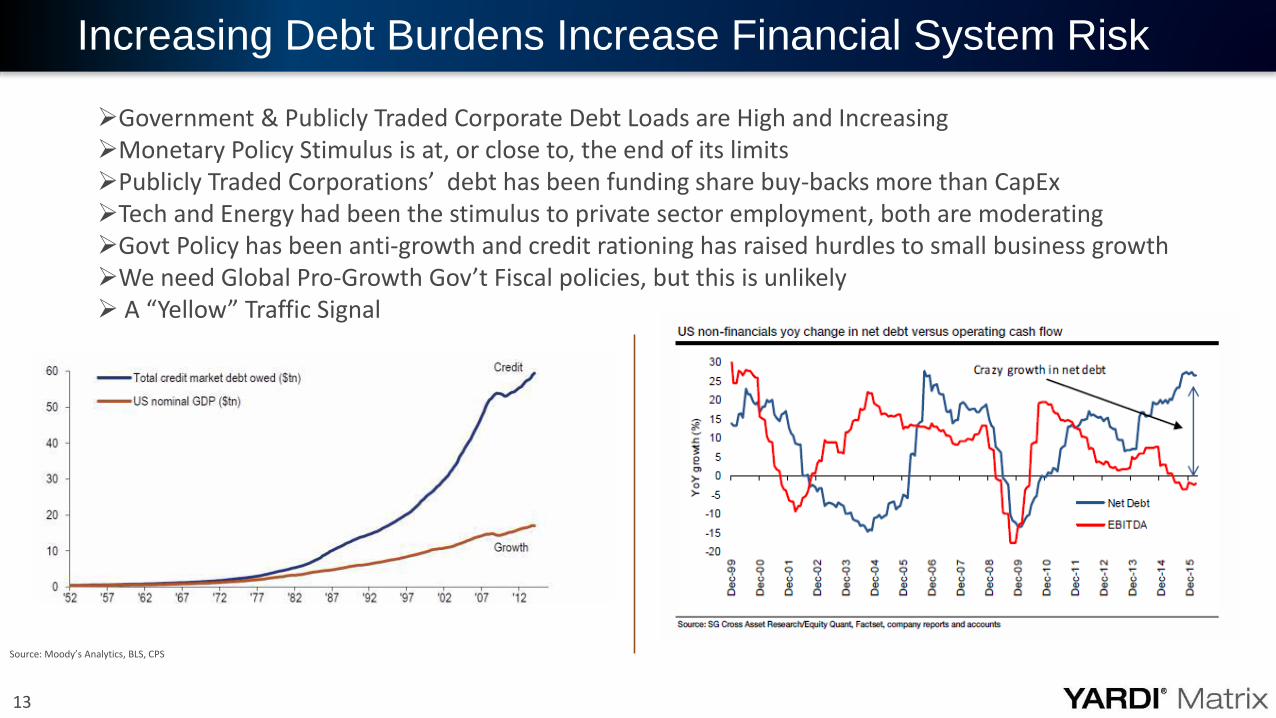
Increasing Debt Burdens Increase Financial System Risk
Source: Moody’s Analytics, BLS, CPS
Government & Publicly Traded Corporate Debt Loads are High and IncreasingMonetary Policy Stimulus is at, or close to, the end of its limitsPublicly Traded Corporations’ debt has been funding share buy-backs more than CapExTech and Energy had been the stimulus to private sector employment, both are moderatingGovt Policy has been anti-growth and credit rationing has raised hurdles to small business growthWe need Global Pro-Growth Gov’t Fiscal policies, but this is unlikely A “Yellow” Traffic Signal
14
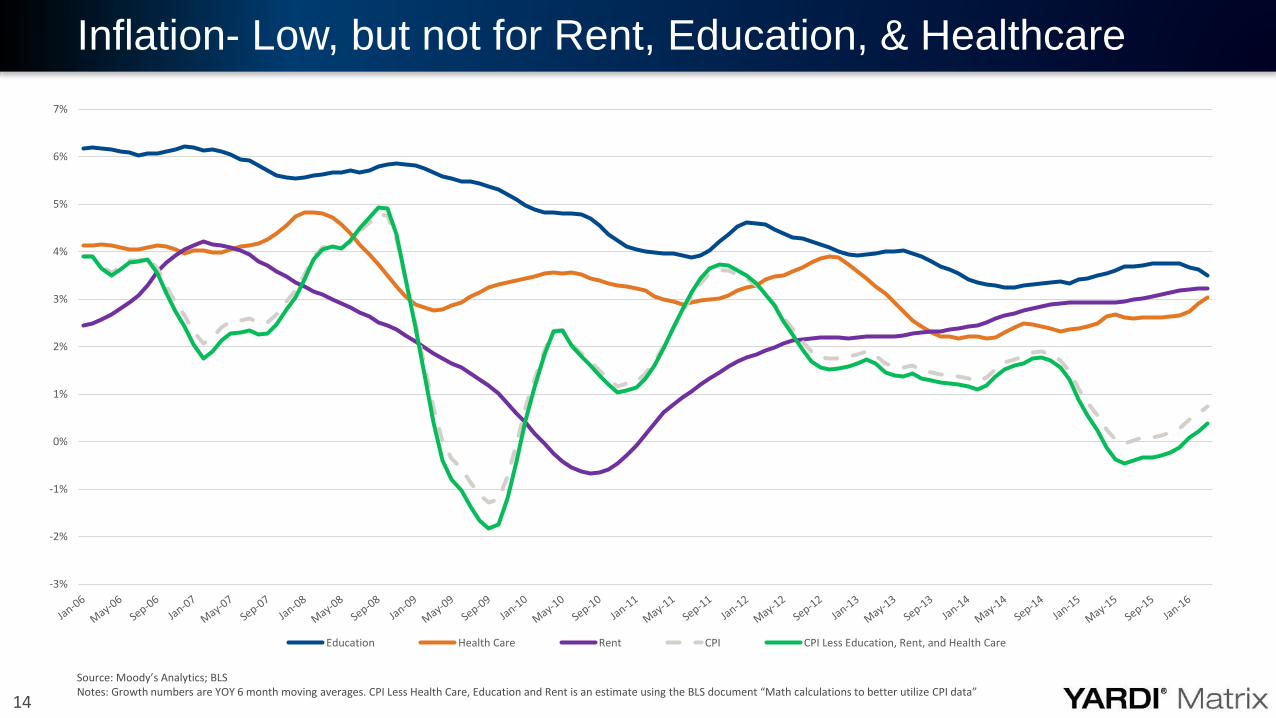
Inflation- Low, but not for Rent, Education, & Healthcare
Source: Moody’s Analytics; BLSNotes: Growth numbers are YOY 6 month moving averages. CPI Less Health Care, Education and Rent is an estimate using the BLS document “Math calculations to better utilize CPI data”
-3%
-2%
-1%
0%
1%
2%
3%
4%
5%
6%
7%
Education Health Care Rent CPI CPI Less Education, Rent, and Health Care

Demographics & Real Estate Fundamentals
16
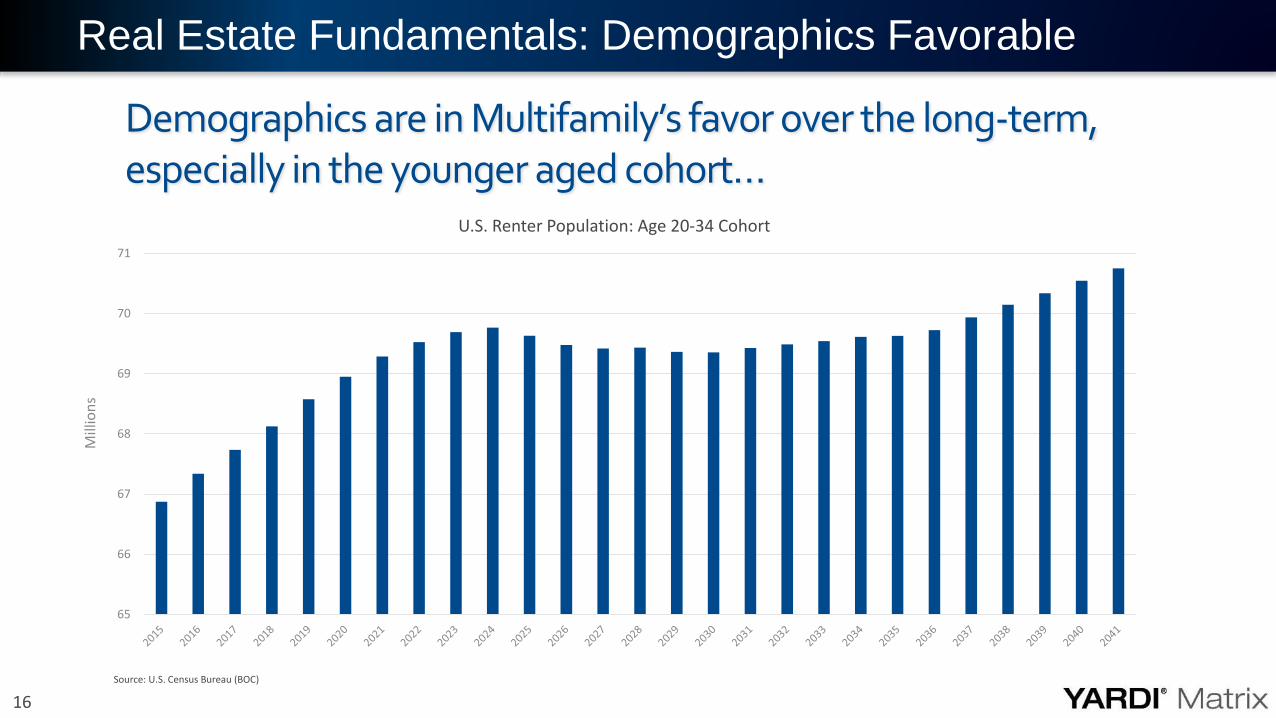
Demographics are in Multifamily’s favor over the long-term, especially in the younger aged cohort…
Real Estate Fundamentals: Demographics Favorable
65
66
67
68
69
70
71
Mill
ion
s
U.S. Renter Population: Age 20-34 Cohort
Source: U.S. Census Bureau (BOC)
17
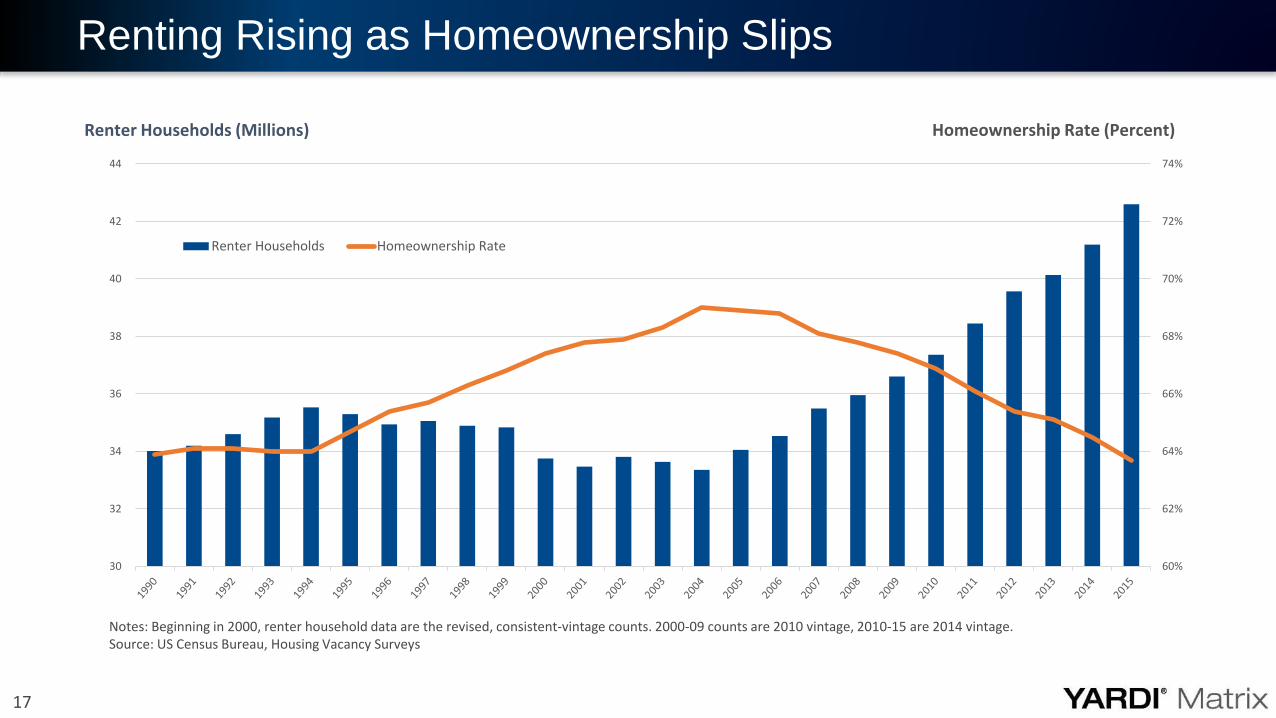
Notes: Beginning in 2000, renter household data are the revised, consistent-vintage counts. 2000-09 counts are 2010 vintage, 2010-15 are 2014 vintage.Source: US Census Bureau, Housing Vacancy Surveys
Renting Rising as Homeownership Slips
60%
62%
64%
66%
68%
70%
72%
74%
30
32
34
36
38
40
42
44
Renter Households Homeownership Rate
Renter Households (Millions) Homeownership Rate (Percent)
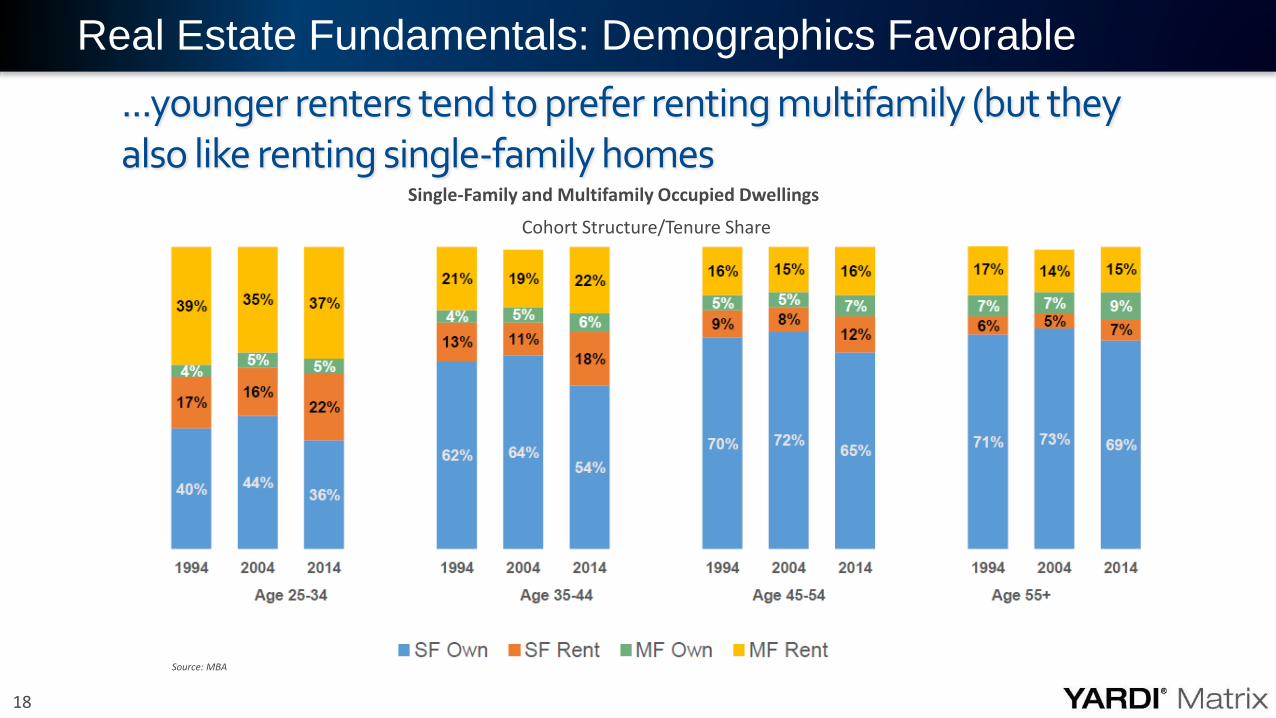
18
...younger renters tend to prefer renting multifamily (but they also like renting single-family homes
Real Estate Fundamentals: Demographics Favorable
Single-Family and Multifamily Occupied Dwellings
Cohort Structure/Tenure Share
Source: MBA
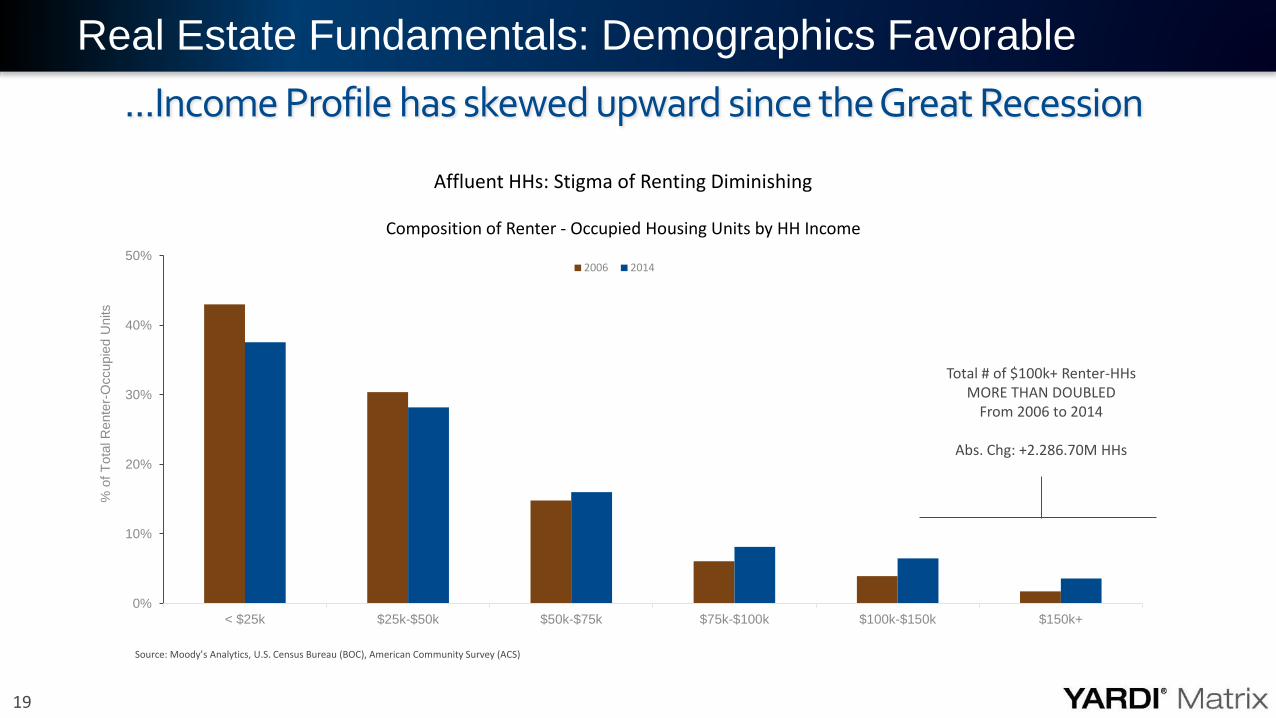
19
...Income Profile has skewed upward since the Great Recession
Real Estate Fundamentals: Demographics Favorable
0%
10%
20%
30%
40%
50%
< $25k $25k-$50k $50k-$75k $75k-$100k $100k-$150k $150k+
% o
f T
ota
l R
ente
r-O
ccupie
d U
nits
Affluent HHs: Stigma of Renting Diminishing
Composition of Renter - Occupied Housing Units by HH Income
2006 2014
Total # of $100k+ Renter-HHsMORE THAN DOUBLED
From 2006 to 2014
Abs. Chg: +2.286.70M HHs
Source: Moody’s Analytics, U.S. Census Bureau (BOC), American Community Survey (ACS)
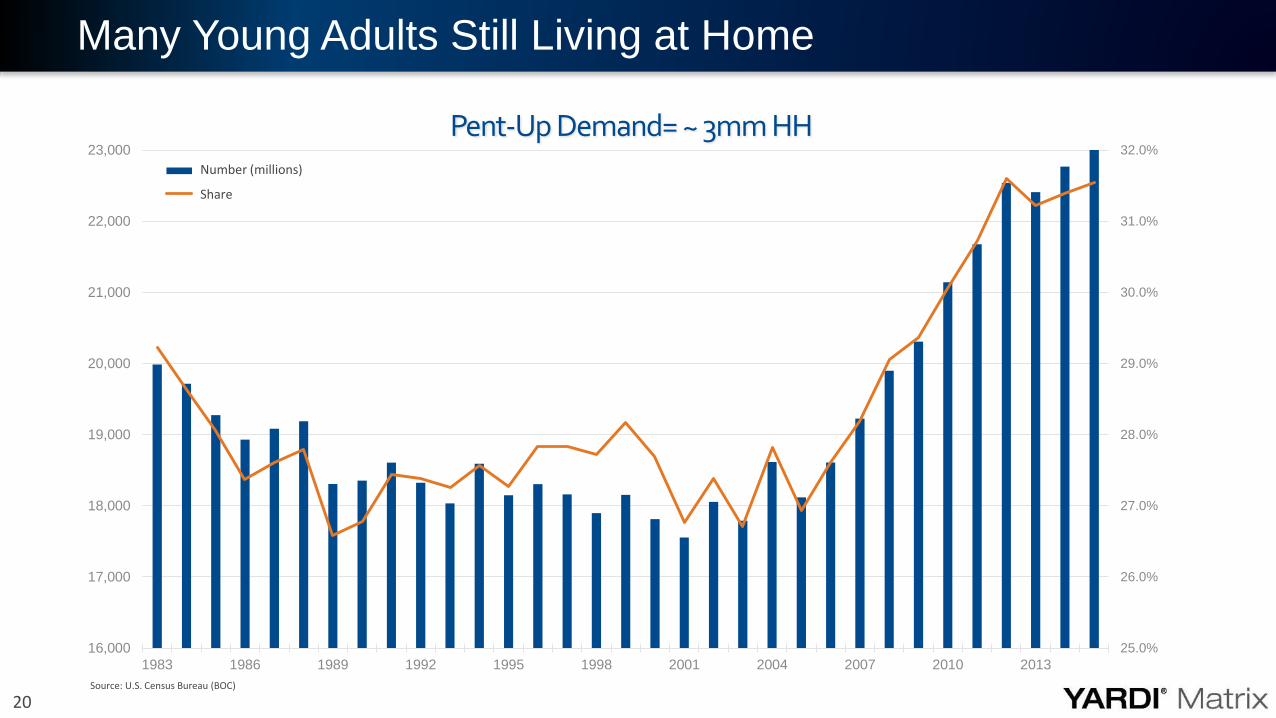
20
Many Young Adults Still Living at Home
25.0%
26.0%
27.0%
28.0%
29.0%
30.0%
31.0%
32.0%
16,000
17,000
18,000
19,000
20,000
21,000
22,000
23,000
1983 1986 1989 1992 1995 1998 2001 2004 2007 2010 2013
Pent-Up Demand= ~ 3mm HHNumber (millions)
Share
Source: U.S. Census Bureau (BOC)
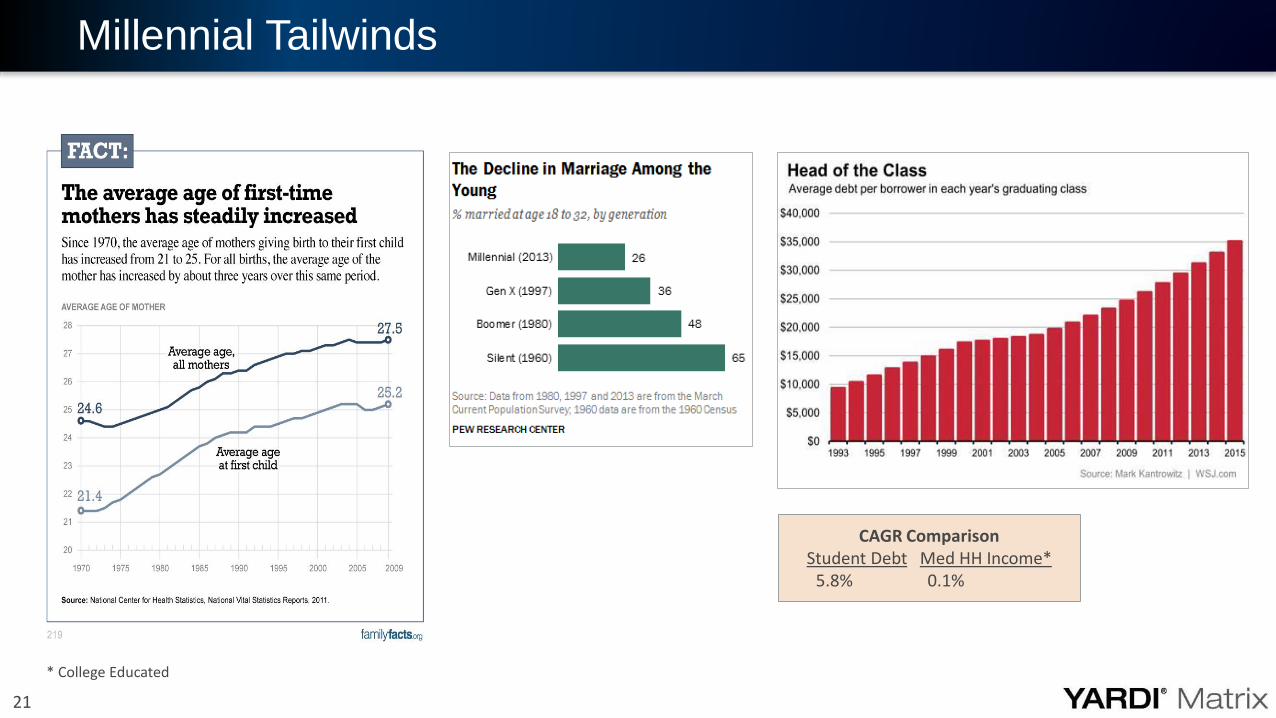
21
Millennial Tailwinds
CAGR ComparisonStudent Debt Med HH Income*
5.8% 0.1%
* College Educated
22
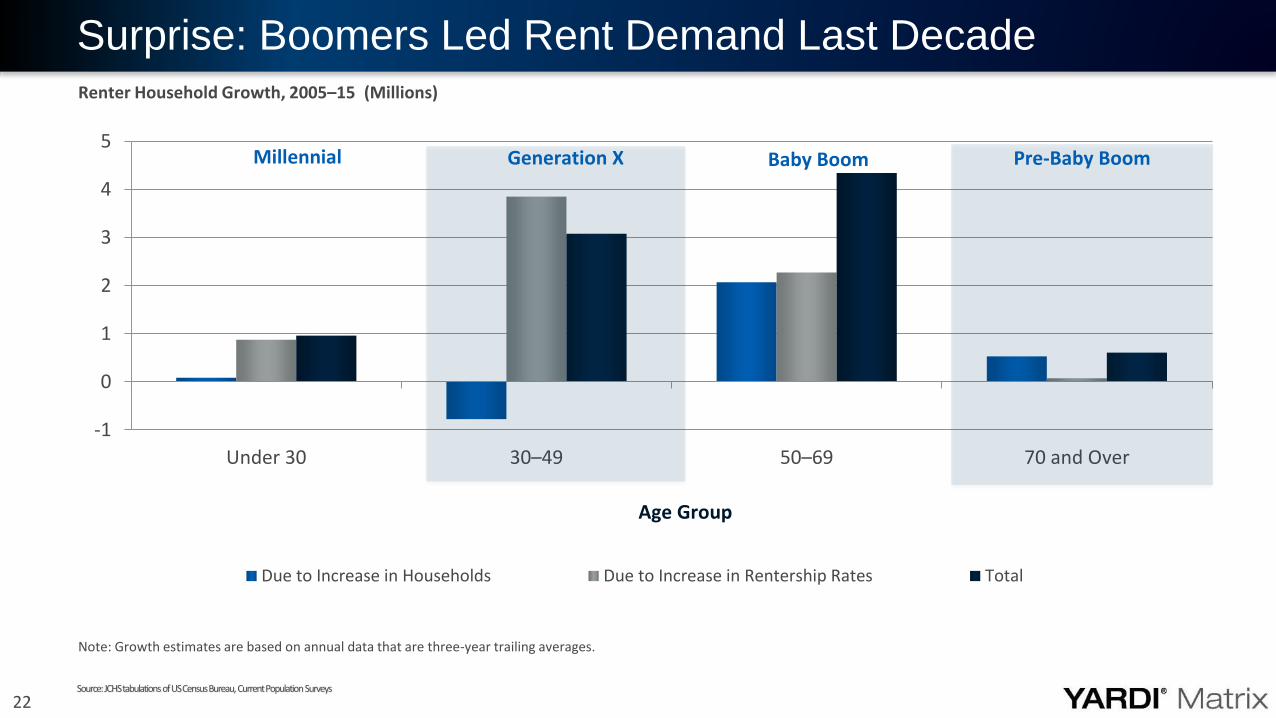
Surprise: Boomers Led Rent Demand Last Decade
-1
0
1
2
3
4
5
Under 30 30–49 50–69 70 and Over
Due to Increase in Households Due to Increase in Rentership Rates Total
Renter Household Growth, 2005–15 (Millions)
Age Group
Generation X Baby BoomMillennial Pre-Baby Boom
Note: Growth estimates are based on annual data that are three-year trailing averages.
Source: JCHS tabulations of US Census Bureau, Current Population Surveys
23
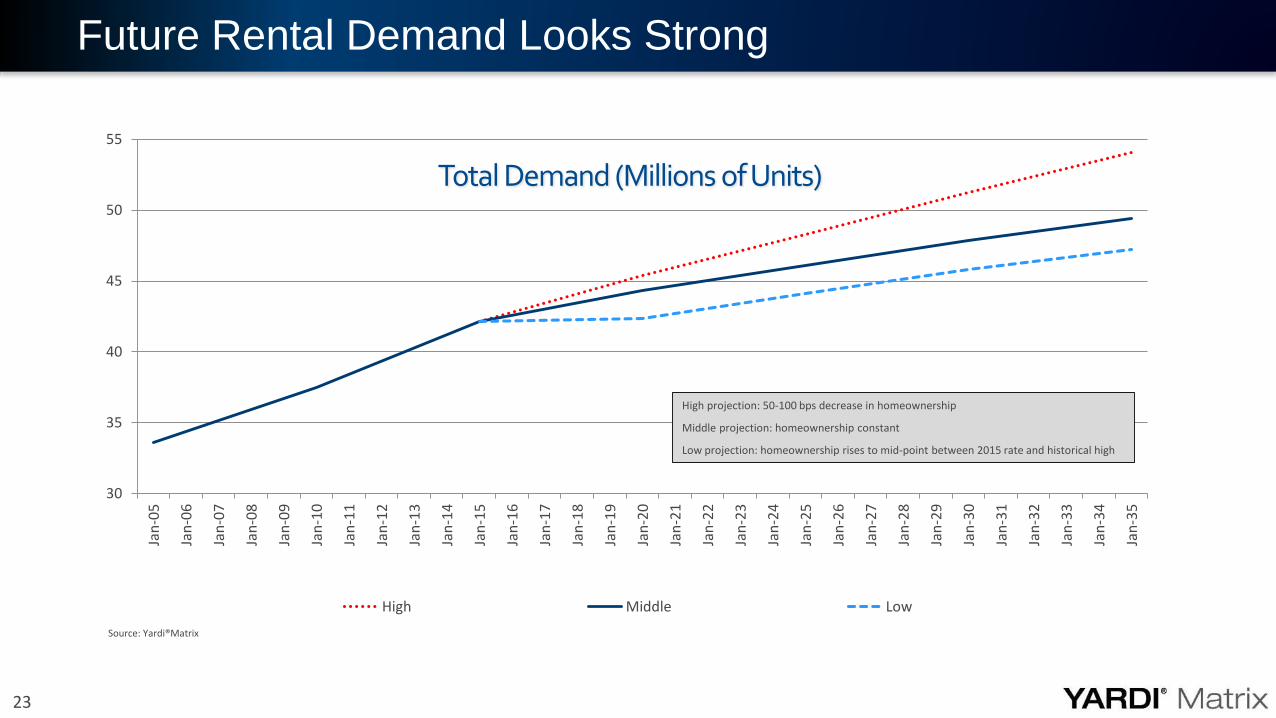
Future Rental Demand Looks Strong
Source: Yardi®Matrix
30
35
40
45
50
55Ja
n-0
5
Jan
-06
Jan
-07
Jan
-08
Jan
-09
Jan
-10
Jan
-11
Jan
-12
Jan
-13
Jan
-14
Jan
-15
Jan
-16
Jan
-17
Jan
-18
Jan
-19
Jan
-20
Jan
-21
Jan
-22
Jan
-23
Jan
-24
Jan
-25
Jan
-26
Jan
-27
Jan
-28
Jan
-29
Jan
-30
Jan
-31
Jan
-32
Jan
-33
Jan
-34
Jan
-35
Total Demand (Millions of Units)
High Middle Low
High projection: 50-100 bps decrease in homeownership
Middle projection: homeownership constant
Low projection: homeownership rises to mid-point between 2015 rate and historical high
24
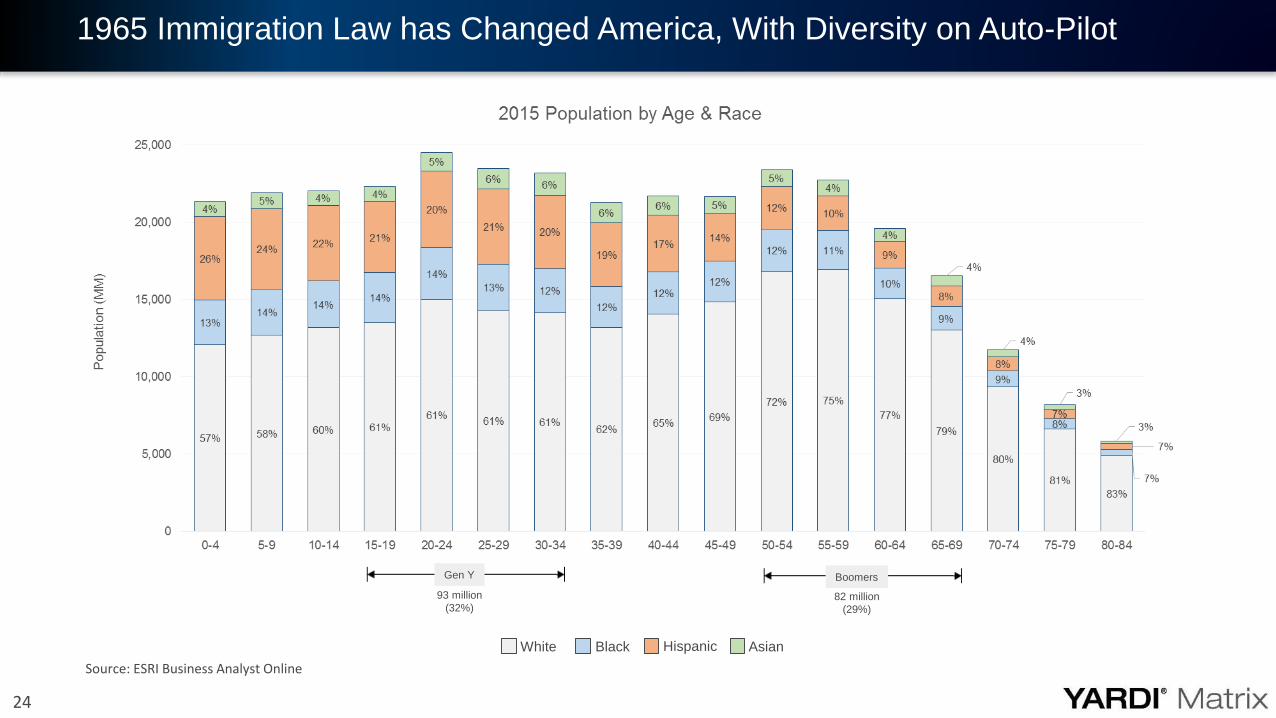
1965 Immigration Law has Changed America, With Diversity on Auto-Pilot
Gen Y
93 million
(32%)
Boomers
82 million
(29%)
Hispanic AsianBlackWhite
Source: ESRI Business Analyst Online
25
Radical Mobility
The Internet of Things
Collaborative Economy
Autonomous Vehicles
3D Printing
Major Technology Trends Driving Down Costs
26
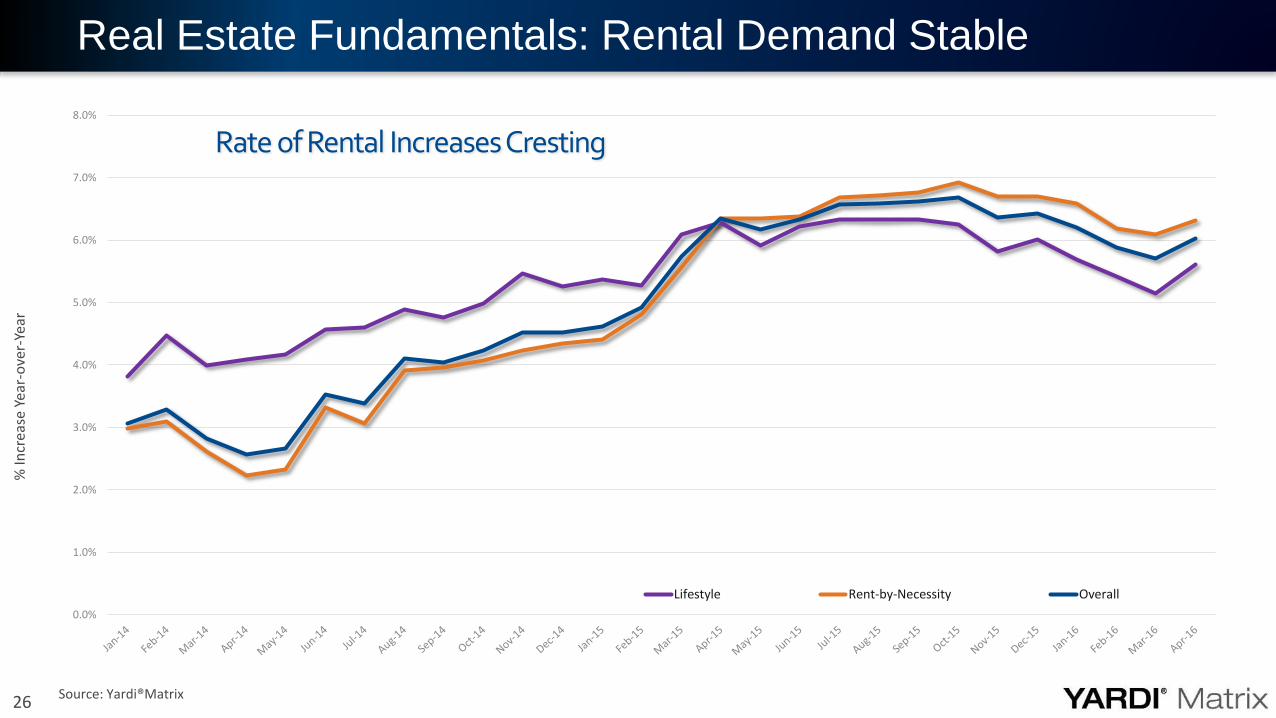
Real Estate Fundamentals: Rental Demand Stable%
Incr
ease
Yea
r-o
ver-
Year
Source: Yardi®Matrix
Rate of Rental Increases Cresting
0.0%
1.0%
2.0%
3.0%
4.0%
5.0%
6.0%
7.0%
8.0%
Lifestyle Rent-by-Necessity Overall
27
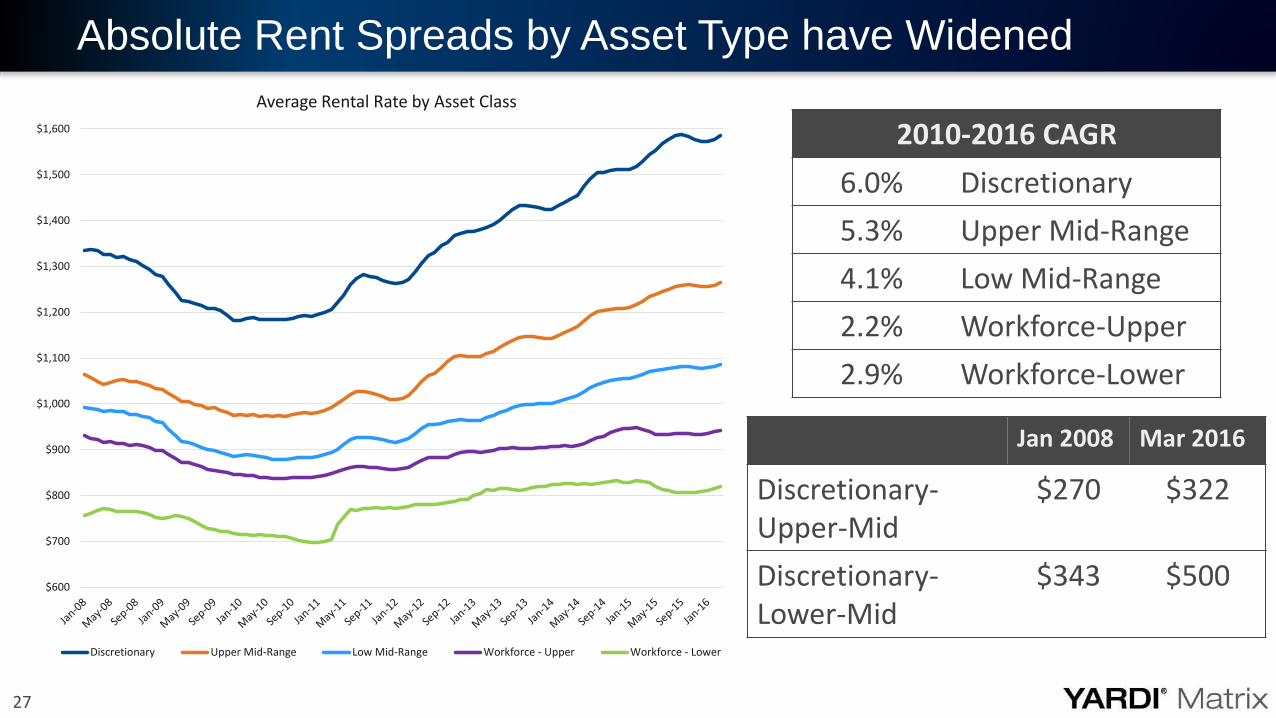
Absolute Rent Spreads by Asset Type have Widened
$600
$700
$800
$900
$1,000
$1,100
$1,200
$1,300
$1,400
$1,500
$1,600
Average Rental Rate by Asset Class
Discretionary Upper Mid-Range Low Mid-Range Workforce - Upper Workforce - Lower
2010-2016 CAGR
6.0% Discretionary
5.3% Upper Mid-Range
4.1% Low Mid-Range
2.2% Workforce-Upper
2.9% Workforce-Lower
Jan 2008 Mar 2016
Discretionary-Upper-Mid
$270 $322
Discretionary-Lower-Mid
$343 $500
28
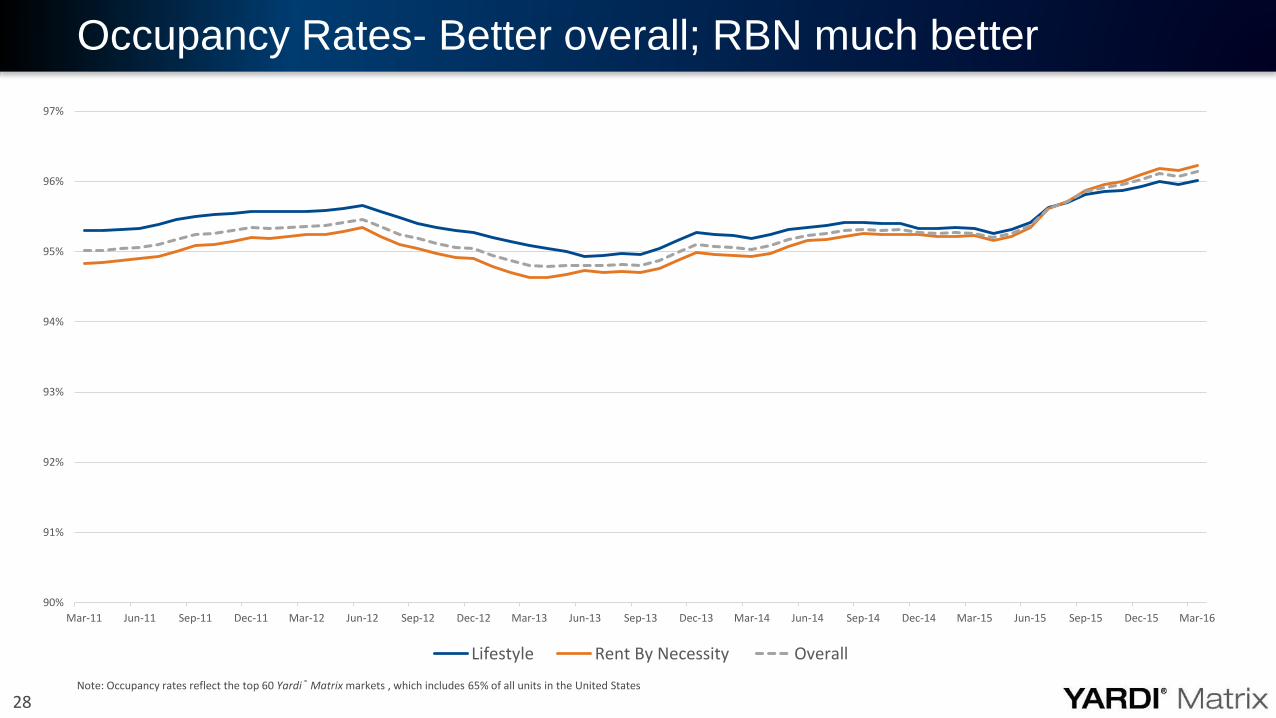
Occupancy Rates- Better overall; RBN much better
90%
91%
92%
93%
94%
95%
96%
97%
Mar-11 Jun-11 Sep-11 Dec-11 Mar-12 Jun-12 Sep-12 Dec-12 Mar-13 Jun-13 Sep-13 Dec-13 Mar-14 Jun-14 Sep-14 Dec-14 Mar-15 Jun-15 Sep-15 Dec-15 Mar-16
Lifestyle Rent By Necessity Overall
Note: Occupancy rates reflect the top 60 Yardi® Matrix markets , which includes 65% of all units in the United States
29
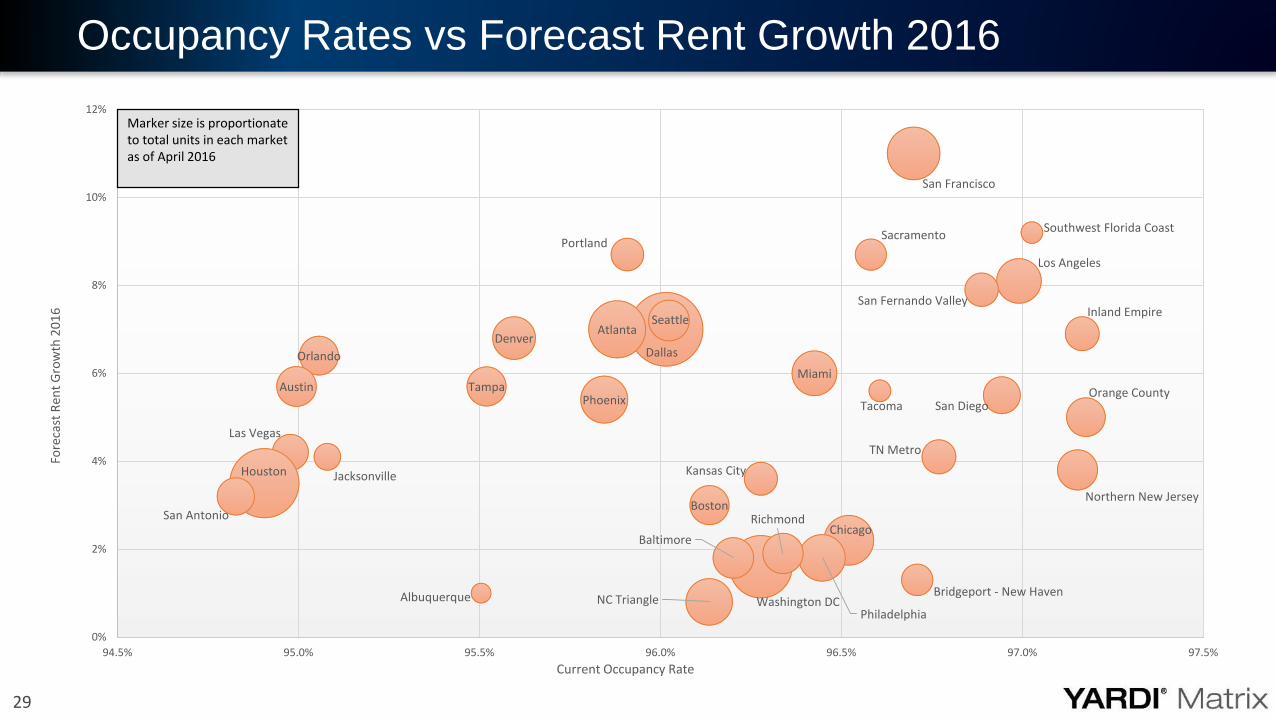
Occupancy Rates vs Forecast Rent Growth 2016
Orange County
Inland Empire
Northern New Jersey
Southwest Florida Coast
Los Angeles
San Diego
San Fernando Valley
TN Metro
Bridgeport - New Haven
San Francisco
Tacoma
Sacramento
Chicago
Philadelphia
Miami
Kansas City
Washington DC
Richmond
Baltimore
Boston
Dallas
NC Triangle
Seattle
Portland
Atlanta
Phoenix
Denver
Tampa
Albuquerque
Jacksonville
Orlando
Austin
Las Vegas
Houston
San Antonio
0%
2%
4%
6%
8%
10%
12%
94.5% 95.0% 95.5% 96.0% 96.5% 97.0% 97.5%
Fore
cast
Ren
t G
row
th 2
01
6
Current Occupancy Rate
Marker size is proportionate to total units in each market as of April 2016
30
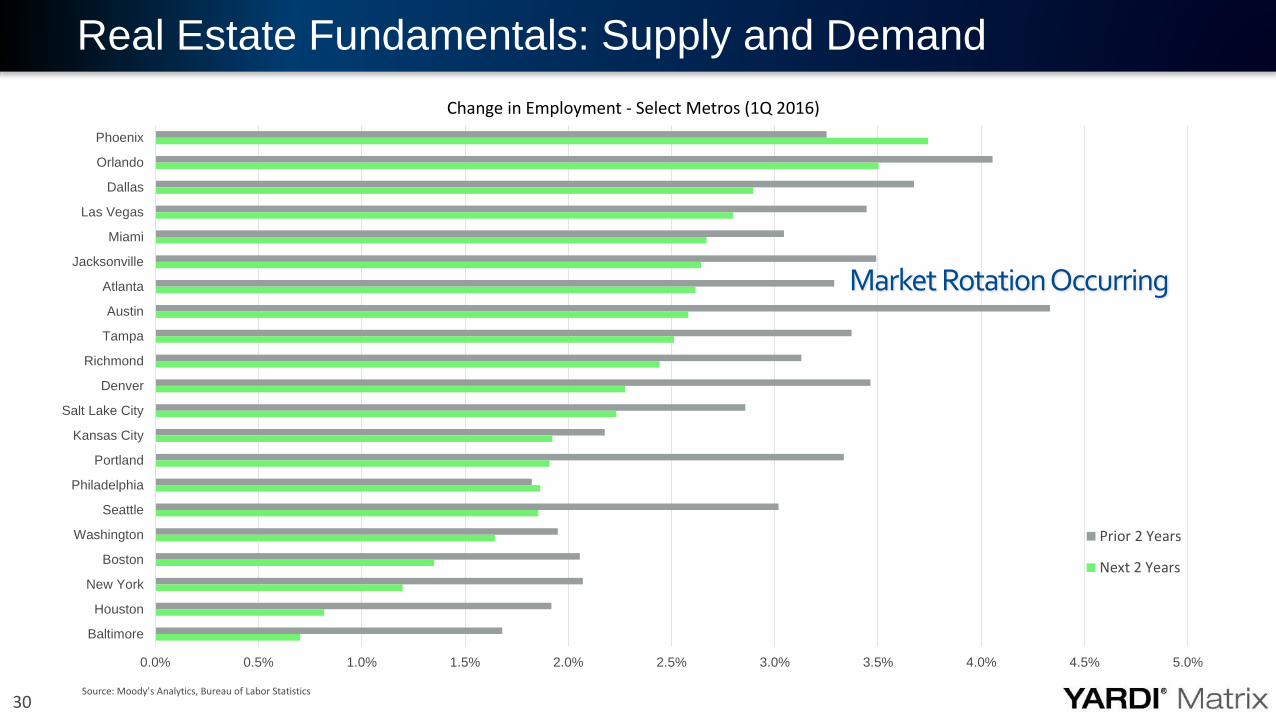
Real Estate Fundamentals: Supply and Demand
0.0% 0.5% 1.0% 1.5% 2.0% 2.5% 3.0% 3.5% 4.0% 4.5% 5.0%
Phoenix
Orlando
Dallas
Las Vegas
Miami
Jacksonville
Atlanta
Austin
Tampa
Richmond
Denver
Salt Lake City
Kansas City
Portland
Philadelphia
Seattle
Washington
Boston
New York
Houston
Baltimore
Change in Employment - Select Metros (1Q 2016)
Prior 2 Years
Next 2 Years
Source: Moody’s Analytics, Bureau of Labor Statistics
Market Rotation Occurring
31
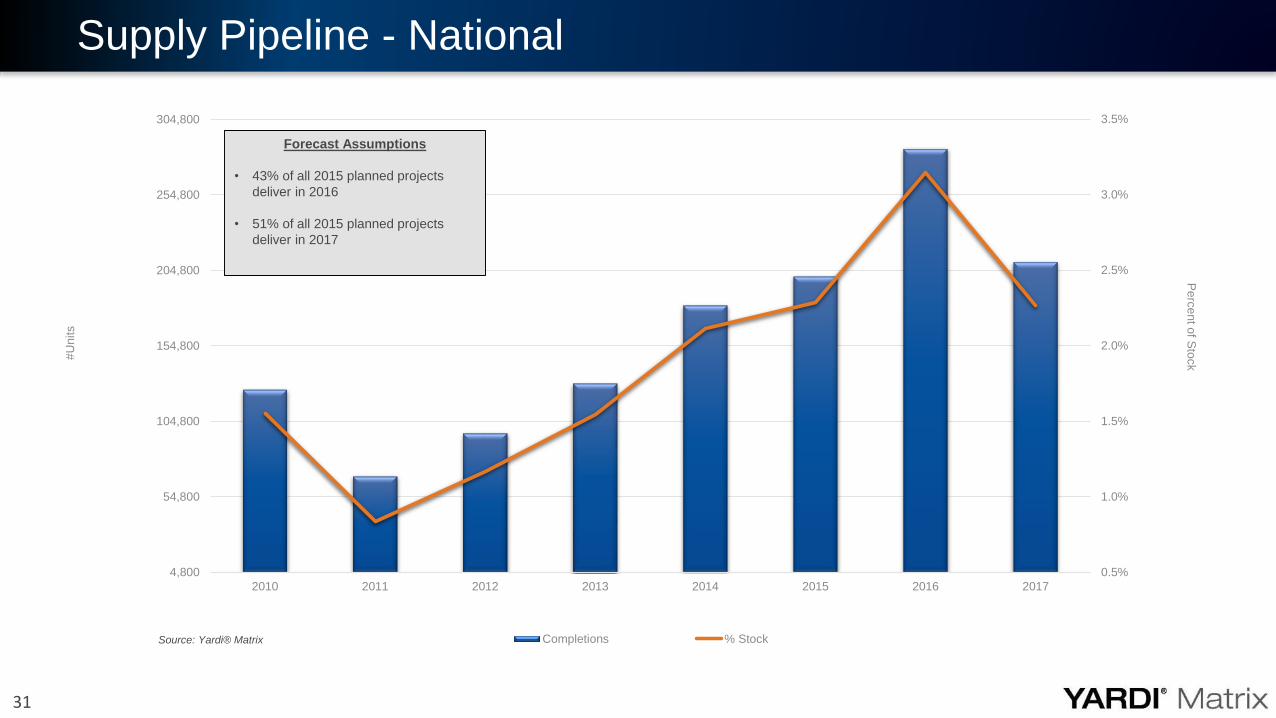
0.5%
1.0%
1.5%
2.0%
2.5%
3.0%
3.5%
4,800
54,800
104,800
154,800
204,800
254,800
304,800
2010 2011 2012 2013 2014 2015 2016 2017
Pe
rce
nt o
f Sto
ck#U
nits
Completions % Stock
Forecast Assumptions
• 43% of all 2015 planned projects
deliver in 2016
• 51% of all 2015 planned projects
deliver in 2017
Source: Yardi® Matrix
Supply Pipeline - National
32
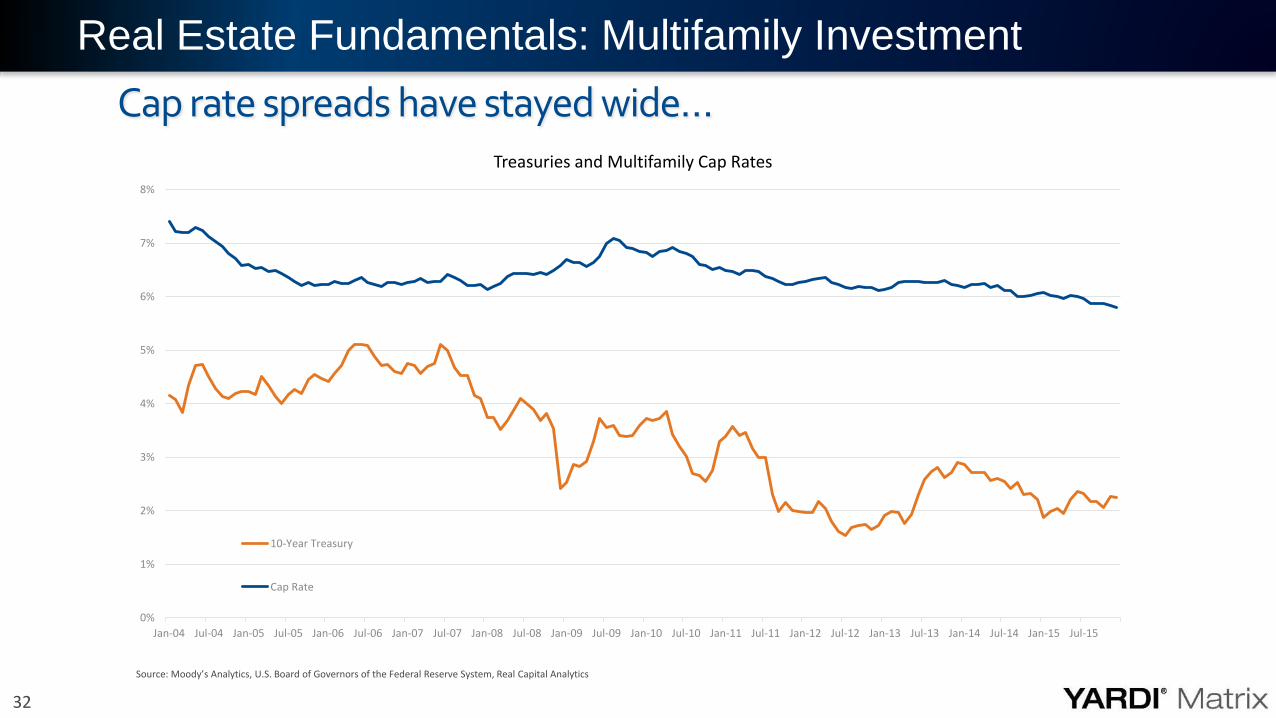
Cap rate spreads have stayed wide…
Real Estate Fundamentals: Multifamily Investment
0%
1%
2%
3%
4%
5%
6%
7%
8%
Jan-04 Jul-04 Jan-05 Jul-05 Jan-06 Jul-06 Jan-07 Jul-07 Jan-08 Jul-08 Jan-09 Jul-09 Jan-10 Jul-10 Jan-11 Jul-11 Jan-12 Jul-12 Jan-13 Jul-13 Jan-14 Jul-14 Jan-15 Jul-15
Treasuries and Multifamily Cap Rates
10-Year Treasury
Cap Rate
Source: Moody’s Analytics, U.S. Board of Governors of the Federal Reserve System, Real Capital Analytics
33
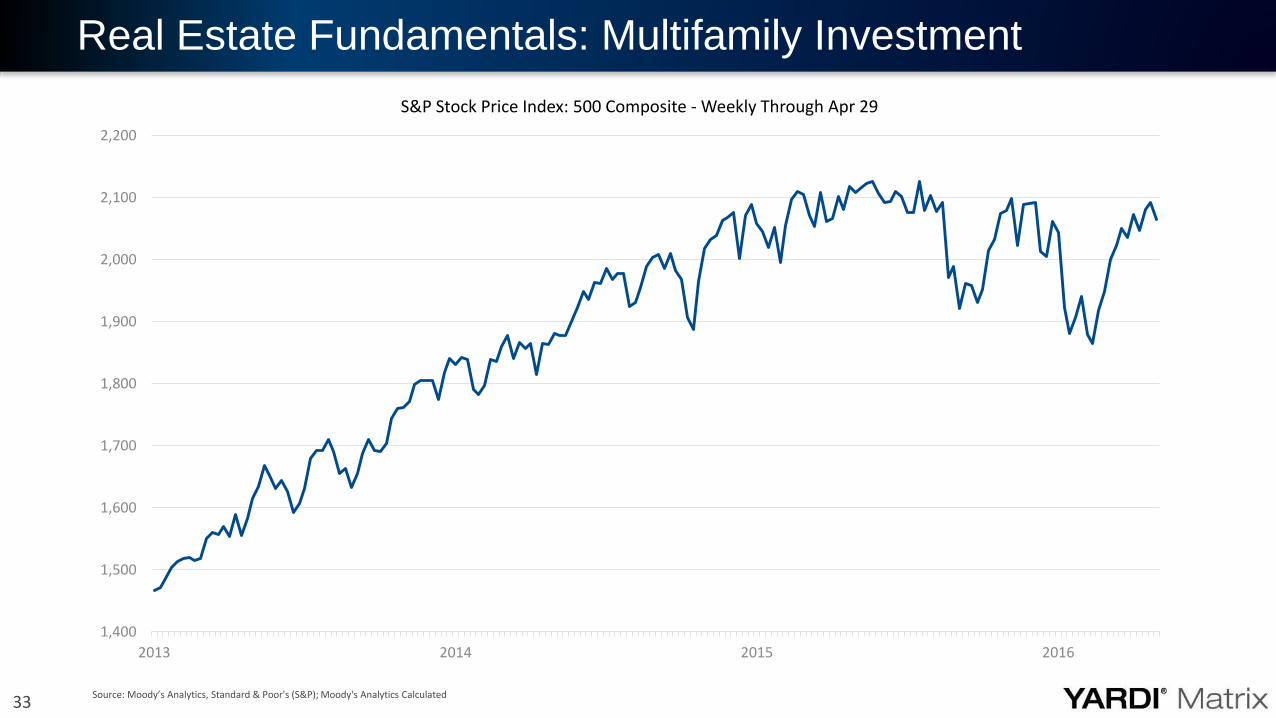
Real Estate Fundamentals: Multifamily Investment
1,400
1,500
1,600
1,700
1,800
1,900
2,000
2,100
2,200
2013 2014 2015 2016
S&P Stock Price Index: 500 Composite - Weekly Through Apr 29
Source: Moody’s Analytics, Standard & Poor's (S&P); Moody's Analytics Calculated
34
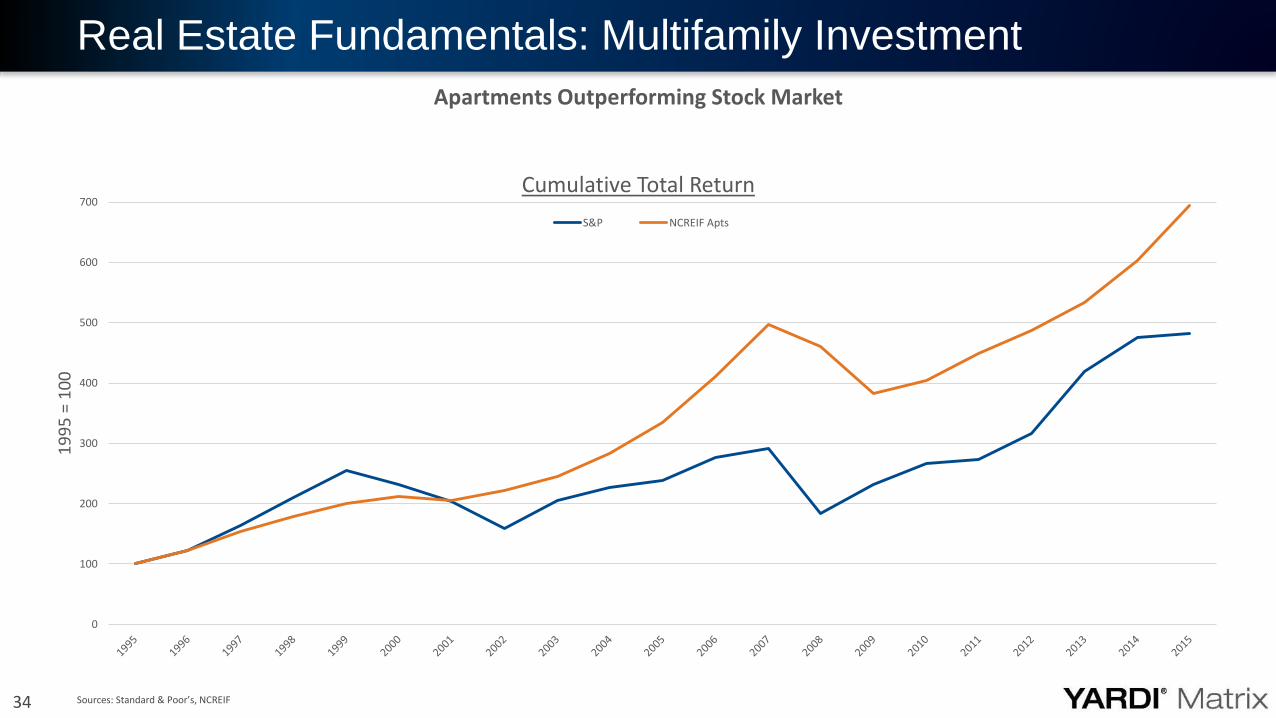
Real Estate Fundamentals: Multifamily Investment
Sources: Standard & Poor’s, NCREIF
0
100
200
300
400
500
600
700
19
95
= 1
00
Apartments Outperforming Stock Market
Cumulative Total Return
S&P NCREIF Apts

Secondary Investment Grade Market Selection
Jeff AdlerVice President, Matrix
36
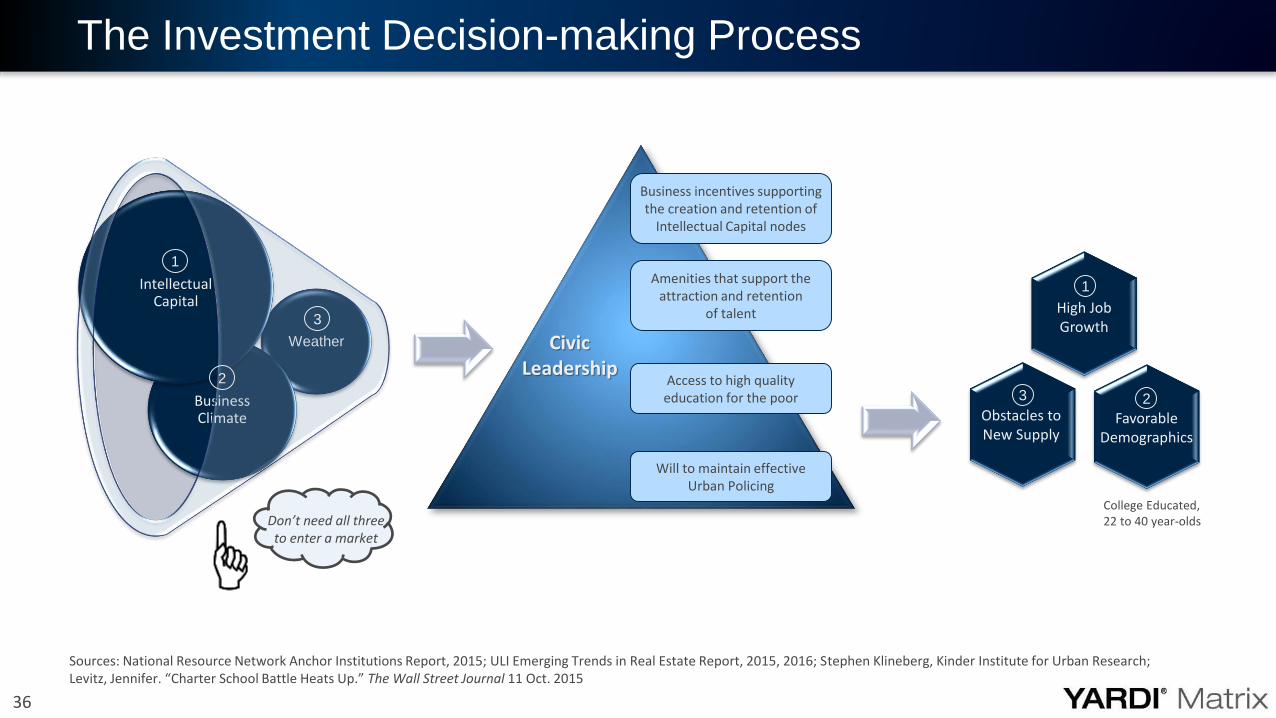
The Investment Decision-making Process
Don’t need all three to enter a market
Weather
Business Climate
IntellectualCapital
1
3
2 Access to high quality education for the poor
Amenities that support the attraction and retention
of talent
Business incentives supporting the creation and retention of
Intellectual Capital nodes
Civic Leadership
High Job Growth
1
College Educated, 22 to 40 year-olds
Favorable Demographics
2Obstacles toNew Supply
3
Will to maintain effective Urban Policing
Sources: National Resource Network Anchor Institutions Report, 2015; ULI Emerging Trends in Real Estate Report, 2015, 2016; Stephen Klineberg, Kinder Institute for Urban Research;Levitz, Jennifer. “Charter School Battle Heats Up.” The Wall Street Journal 11 Oct. 2015
37
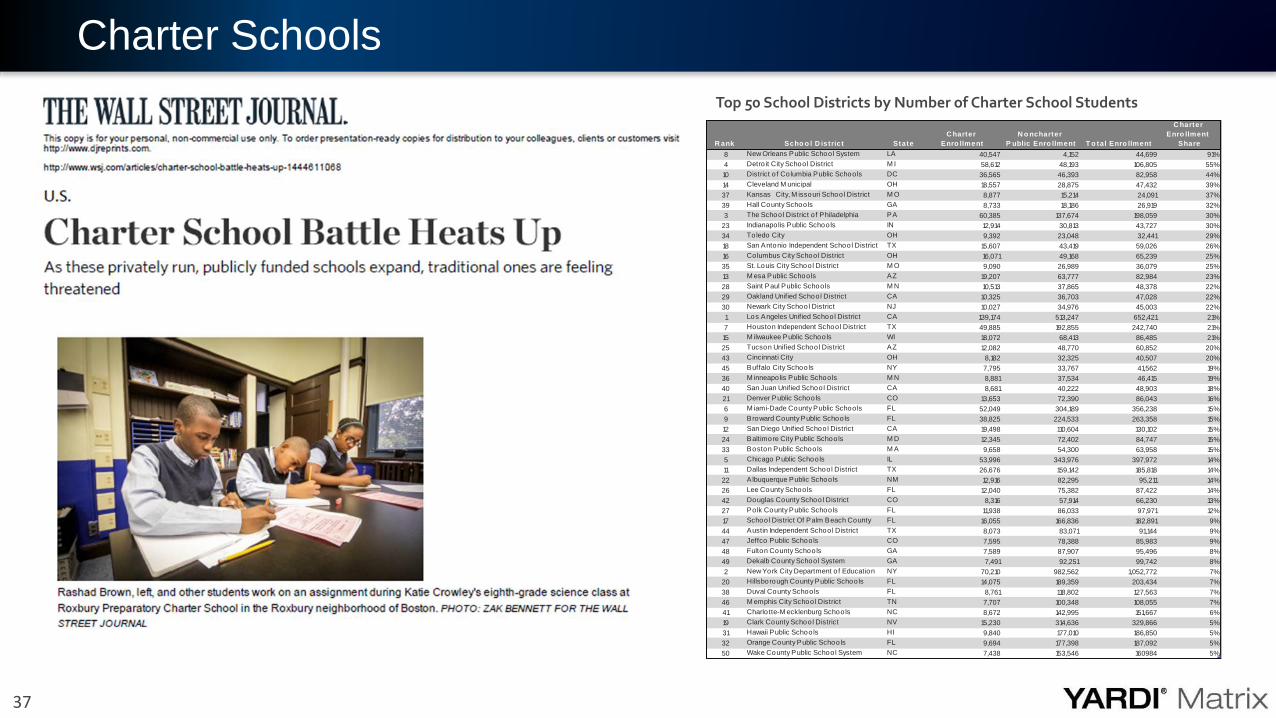
Charter Schools
R ank Scho o l D istrict State
C harter
Enro llment
N o ncharter
P ublic Enro llment T o tal Enro llment
C harter
Enro llment
Share
8 New Orleans Public School System LA 40,547 4,152 44,699 91%
4 Detro it City School District M I 58,612 48,193 106,805 55%
10 District o f Columbia Public Schools DC 36,565 46,393 82,958 44%
14 Cleveland M unicipal OH 18,557 28,875 47,432 39%
37 Kansas City, M issouri School District M O 8,877 15,214 24,091 37%
39 Hall County Schools GA 8,733 18,186 26,919 32%
3 The School District o f Philadelphia PA 60,385 137,674 198,059 30%
23 Indianapolis Public Schools IN 12,914 30,813 43,727 30%
34 Toledo City OH 9,392 23,048 32,441 29%
18 San Antonio Independent School District TX 15,607 43,419 59,026 26%
16 Columbus City School District OH 16,071 49,168 65,239 25%
35 St. Louis City School District M O 9,090 26,989 36,079 25%
13 M esa Public Schools AZ 19,207 63,777 82,984 23%
28 Saint Paul Public Schools M N 10,513 37,865 48,378 22%
29 Oakland Unified School District CA 10,325 36,703 47,028 22%
30 Newark City School District NJ 10,027 34,976 45,003 22%
1 Los Angeles Unified School District CA 139,174 513,247 652,421 21%
7 Houston Independent School District TX 49,885 192,855 242,740 21%
15 M ilwaukee Public Schools WI 18,072 68,413 86,485 21%
25 Tucson Unified School District AZ 12,082 48,770 60,852 20%
43 Cincinnati City OH 8,182 32,325 40,507 20%
45 Buffalo City Schools NY 7,795 33,767 41,562 19%
36 M inneapolis Public Schools M N 8,881 37,534 46,415 19%
40 San Juan Unified School District CA 8,681 40,222 48,903 18%
21 Denver Public Schools CO 13,653 72,390 86,043 16%
6 M iami-Dade County Public Schools FL 52,049 304,189 356,238 15%
9 Broward County Public Schools FL 38,825 224,533 263,358 15%
12 San Diego Unified School District CA 19,498 110,604 130,102 15%
24 Baltimore City Public Schools M D 12,345 72,402 84,747 15%
33 Boston Public Schools M A 9,658 54,300 63,958 15%
5 Chicago Public Schools IL 53,996 343,976 397,972 14%
11 Dallas Independent School District TX 26,676 159,142 185,818 14%
22 Albuquerque Public Schools NM 12,916 82,295 95,211 14%
26 Lee County Schools FL 12,040 75,382 87,422 14%
42 Douglas County School District CO 8,316 57,914 66,230 13%
27 Polk County Public Schools FL 11,938 86,033 97,971 12%
17 School District Of Palm Beach County FL 16,055 166,836 182,891 9%
44 Austin Independent School District TX 8,073 83,071 91,144 9%
47 Jeffco Public Schools CO 7,595 78,388 85,983 9%
48 Fulton County Schools GA 7,589 87,907 95,496 8%
49 Dekalb County School System GA 7,491 92,251 99,742 8%
2 New York City Department o f Education NY 70,210 982,562 1,052,772 7%
20 Hillsborough County Public Schools FL 14,075 189,359 203,434 7%
38 Duval County Schools FL 8,761 118,802 127,563 7%
46 M emphis City School District TN 7,707 100,348 108,055 7%
41 Charlo tte-M ecklenburg Schools NC 8,672 142,995 151,667 6%
19 Clark County School District NV 15,230 314,636 329,866 5%
31 Hawaii Public Schools HI 9,840 177,010 186,850 5%
32 Orange County Public Schools FL 9,694 177,398 187,092 5%
50 Wake County Public School System NC 7,438 153,546 160984 5%
Top 50 School Districts by Number of Charter School Students
38
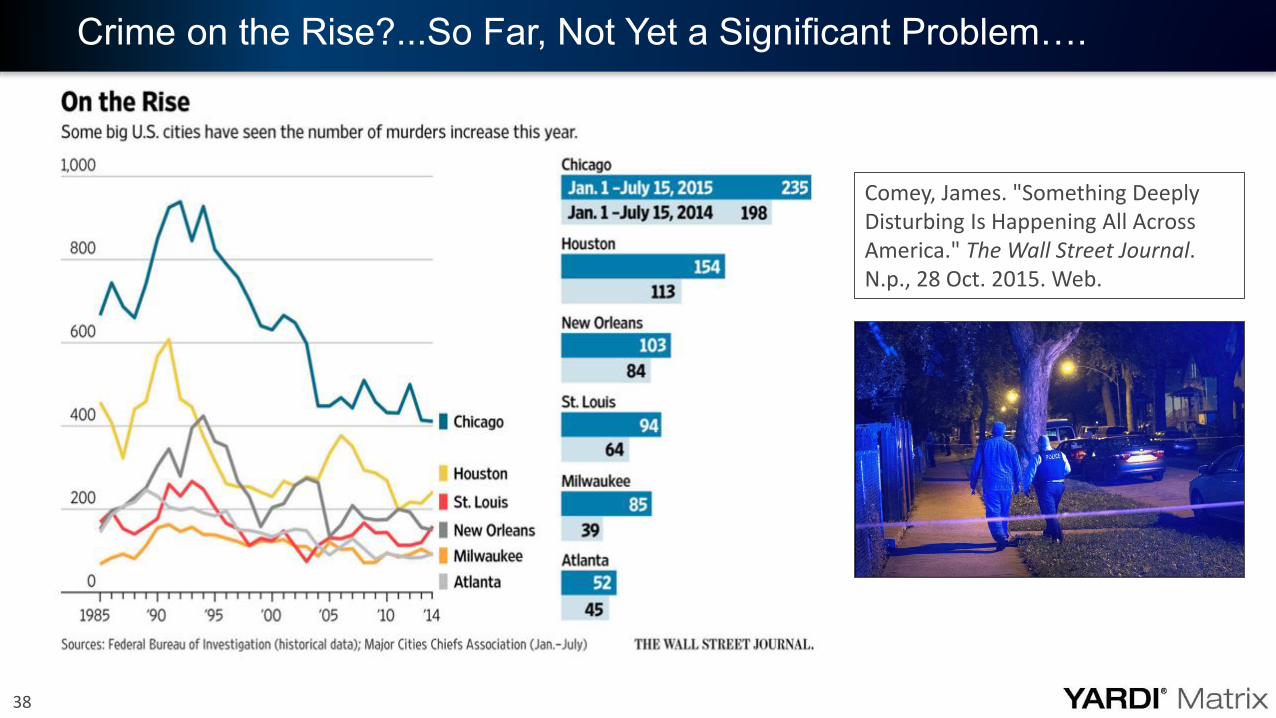
Crime on the Rise?...So Far, Not Yet a Significant Problem….
Comey, James. "Something Deeply Disturbing Is Happening All Across America." The Wall Street Journal. N.p., 28 Oct. 2015. Web.
39
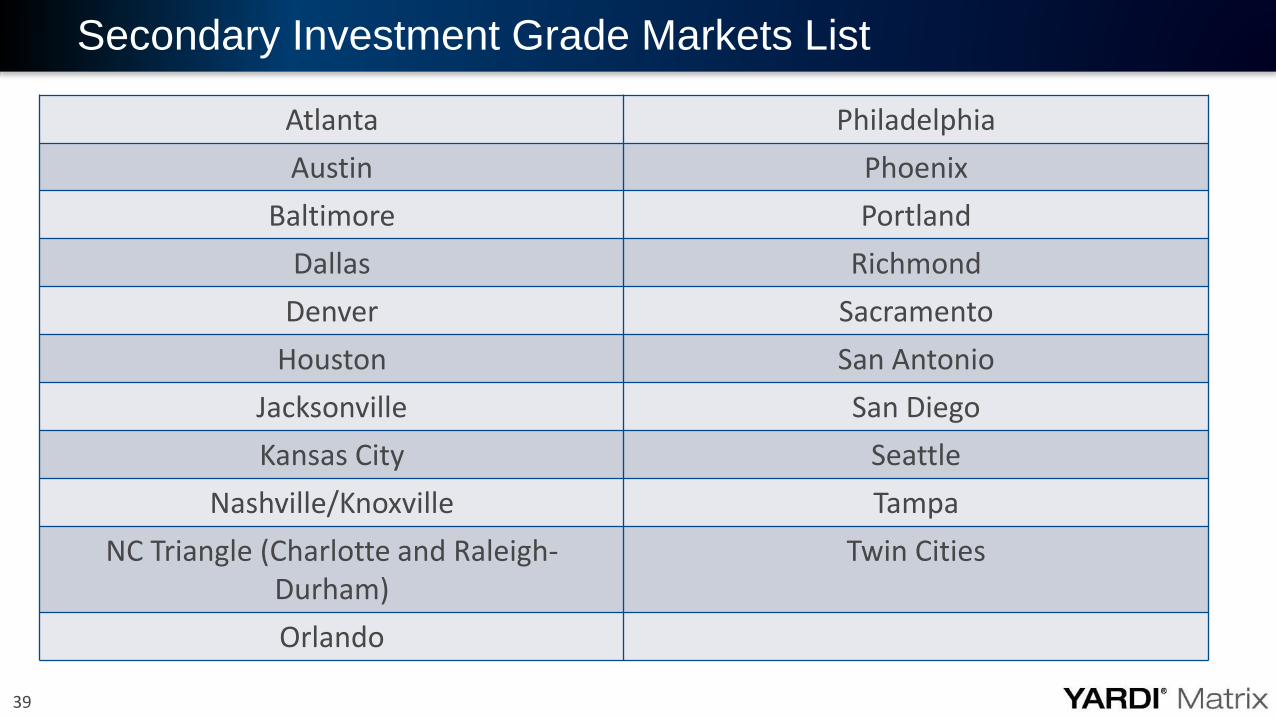
Secondary Investment Grade Markets List
Atlanta Philadelphia
Austin Phoenix
Baltimore Portland
Dallas Richmond
Denver Sacramento
Houston San Antonio
Jacksonville San Diego
Kansas City Seattle
Nashville/Knoxville Tampa
NC Triangle (Charlotte and Raleigh-Durham)
Twin Cities
Orlando
40
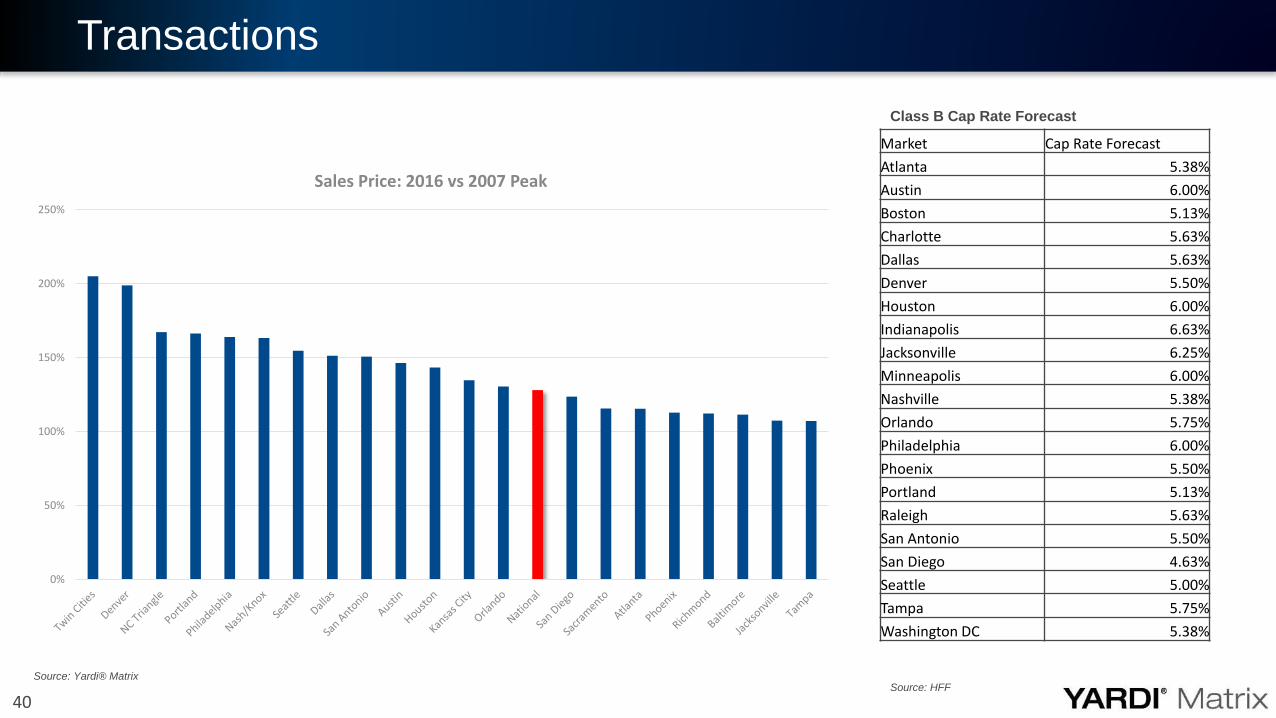
Transactions
Source: Yardi® Matrix
Market Cap Rate Forecast
Atlanta 5.38%
Austin 6.00%
Boston 5.13%
Charlotte 5.63%
Dallas 5.63%
Denver 5.50%
Houston 6.00%
Indianapolis 6.63%
Jacksonville 6.25%
Minneapolis 6.00%
Nashville 5.38%
Orlando 5.75%
Philadelphia 6.00%
Phoenix 5.50%
Portland 5.13%
Raleigh 5.63%
San Antonio 5.50%
San Diego 4.63%
Seattle 5.00%
Tampa 5.75%
Washington DC 5.38%
Class B Cap Rate Forecast
Source: HFF
0%
50%
100%
150%
200%
250%
Sales Price: 2016 vs 2007 Peak
41
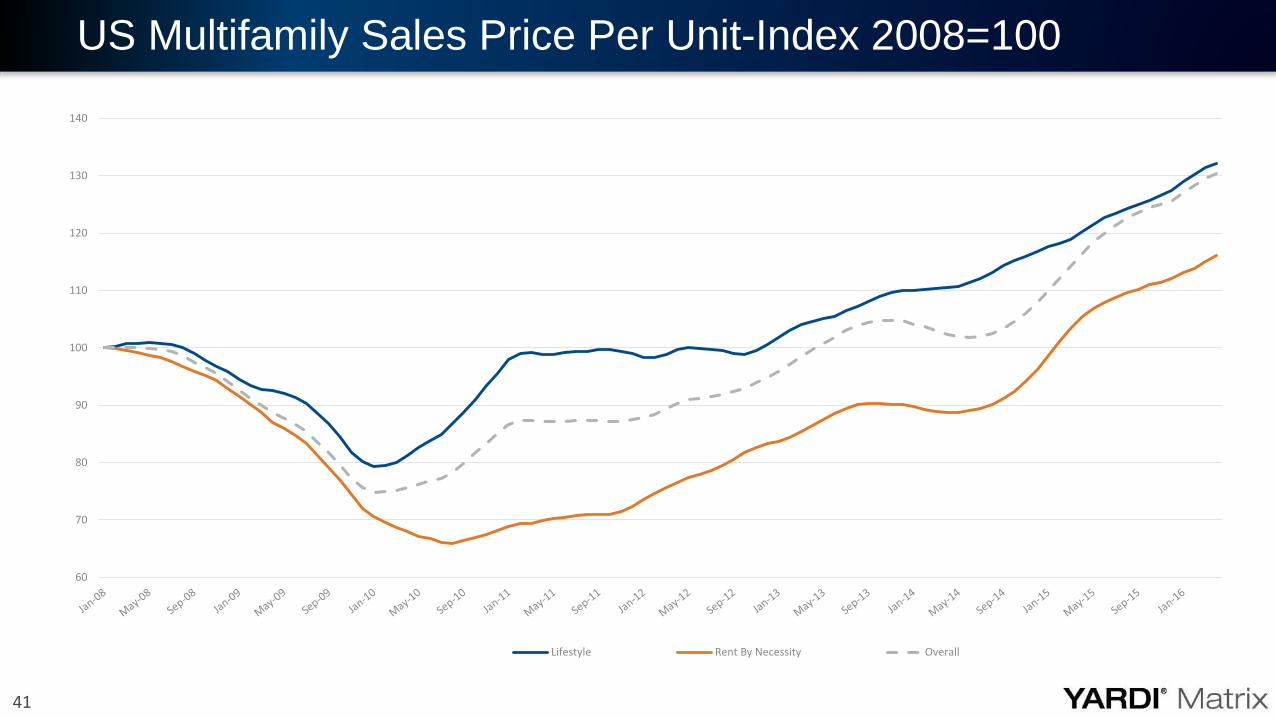
US Multifamily Sales Price Per Unit-Index 2008=100
60
70
80
90
100
110
120
130
140
Lifestyle Rent By Necessity Overall
42
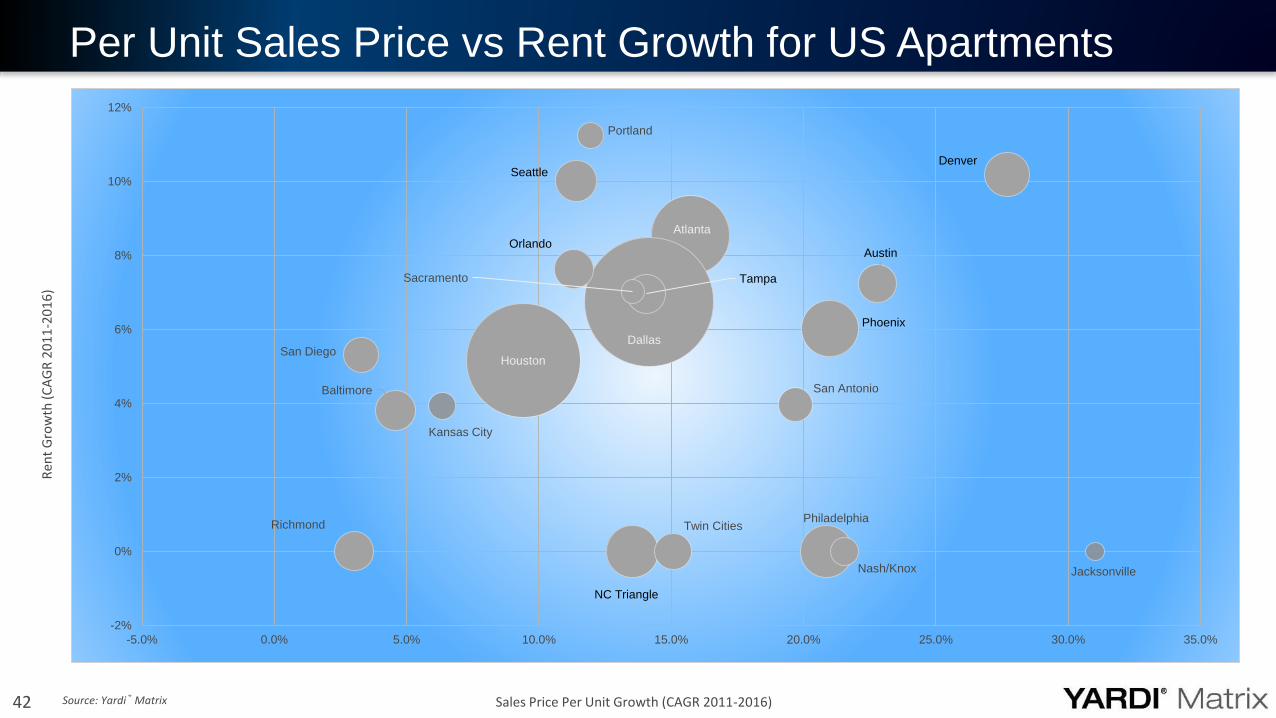
Per Unit Sales Price vs Rent Growth for US Apartments
Source: Yardi® Matrix Sales Price Per Unit Growth (CAGR 2011-2016)
Ren
t G
row
th (
CA
GR
20
11
-20
16
)
Atlanta
Austin
Baltimore
Dallas
Denver
Houston
Jacksonville
Kansas City
NC Triangle
Orlando
Philadelphia
Phoenix
Portland
Richmond
TampaSacramento
San Antonio
San Diego
Seattle
Nash/Knox
Twin Cities
-2%
0%
2%
4%
6%
8%
10%
12%
-5.0% 0.0% 5.0% 10.0% 15.0% 20.0% 25.0% 30.0% 35.0%
43
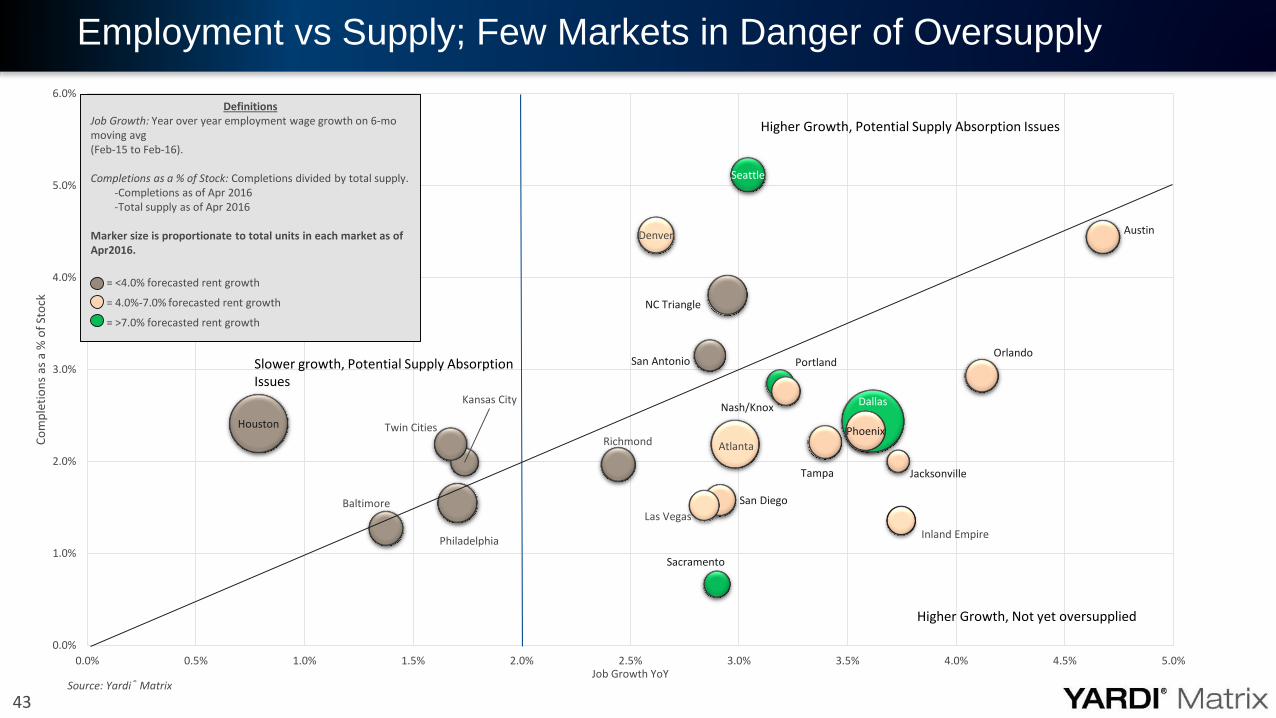
Employment vs Supply; Few Markets in Danger of Oversupply
Source: Yardi® Matrix
Portland
Denver
Sacramento
Seattle
Atlanta
San Diego
Orlando
Dallas
Houston
Austin
Nash/Knox
Phoenix
Tampa
Kansas City
NC Triangle
Jacksonville
San Antonio
Twin Cities
Philadelphia
Baltimore
Richmond
Inland Empire
Las Vegas
0.0%
1.0%
2.0%
3.0%
4.0%
5.0%
6.0%
0.0% 0.5% 1.0% 1.5% 2.0% 2.5% 3.0% 3.5% 4.0% 4.5% 5.0%
Co
mp
leti
on
s as
a %
of
Sto
ck
Job Growth YoY
DefinitionsJob Growth: Year over year employment wage growth on 6-mo moving avg(Feb-15 to Feb-16).
Completions as a % of Stock: Completions divided by total supply.-Completions as of Apr 2016-Total supply as of Apr 2016
Marker size is proportionate to total units in each market as of Apr2016.
= <4.0% forecasted rent growth
= 4.0%-7.0% forecasted rent growth
= >7.0% forecasted rent growth
Slower growth, Potential Supply Absorption Issues
Higher Growth, Potential Supply Absorption Issues
Higher Growth, Not yet oversupplied
44
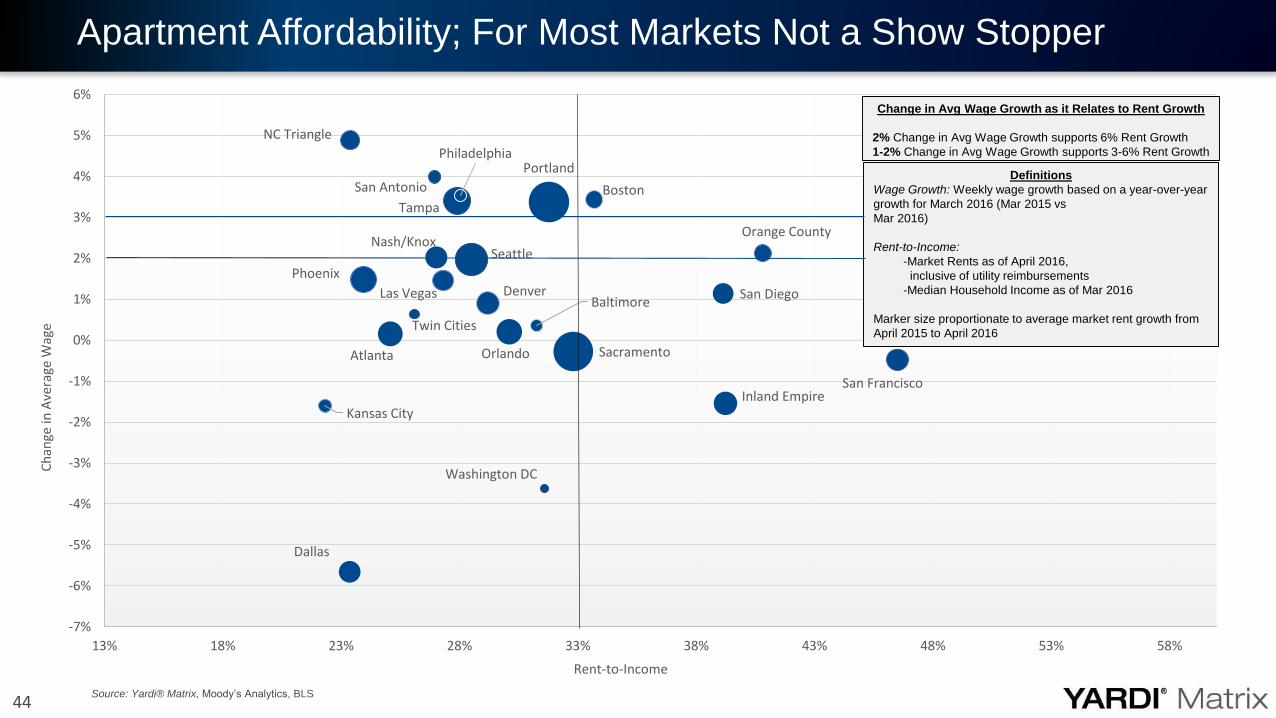
Apartment Affordability; For Most Markets Not a Show Stopper
Source: Yardi® Matrix, Moody’s Analytics, BLS
OrlandoAtlanta
Baltimore
Boston
Dallas
Denver
Inland EmpireKansas City
Nash/Knox
NC Triangle
Tampa
Philadelphia
Orange County
Phoenix
San Antonio
San Diego
San Francisco
Seattle
Twin Cities
Washington DC
Las Vegas
Portland
Sacramento
-7%
-6%
-5%
-4%
-3%
-2%
-1%
0%
1%
2%
3%
4%
5%
6%
13% 18% 23% 28% 33% 38% 43% 48% 53% 58%
Ch
ange
in A
vera
ge W
age
Rent-to-Income
Definitions
Wage Growth: Weekly wage growth based on a year-over-year
growth for March 2016 (Mar 2015 vs
Mar 2016)
Rent-to-Income:
-Market Rents as of April 2016,
inclusive of utility reimbursements
-Median Household Income as of Mar 2016
Marker size proportionate to average market rent growth from
April 2015 to April 2016
Change in Avg Wage Growth as it Relates to Rent Growth
2% Change in Avg Wage Growth supports 6% Rent Growth
1-2% Change in Avg Wage Growth supports 3-6% Rent Growth
45
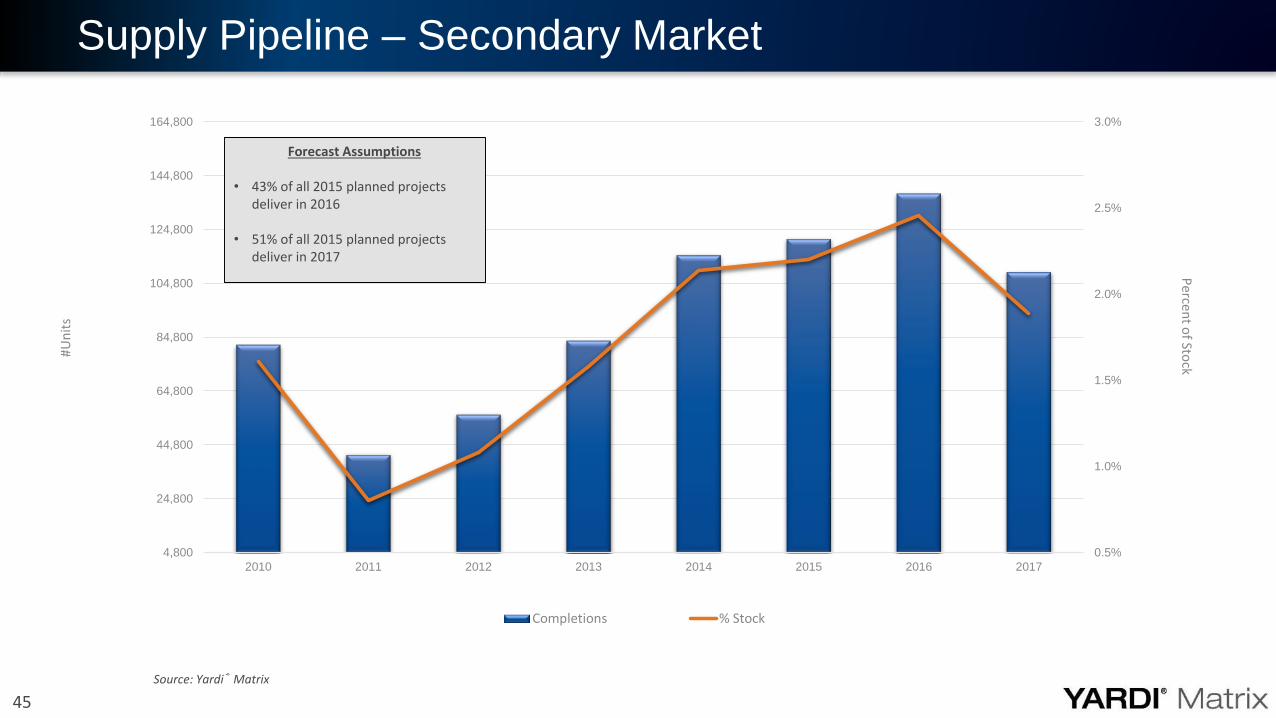
Supply Pipeline – Secondary Market
0.5%
1.0%
1.5%
2.0%
2.5%
3.0%
4,800
24,800
44,800
64,800
84,800
104,800
124,800
144,800
164,800
2010 2011 2012 2013 2014 2015 2016 2017
Perce
nt o
f Stock
#Un
its
Completions % Stock
Forecast Assumptions
• 43% of all 2015 planned projects deliver in 2016
• 51% of all 2015 planned projects deliver in 2017
Source: Yardi® Matrix
46
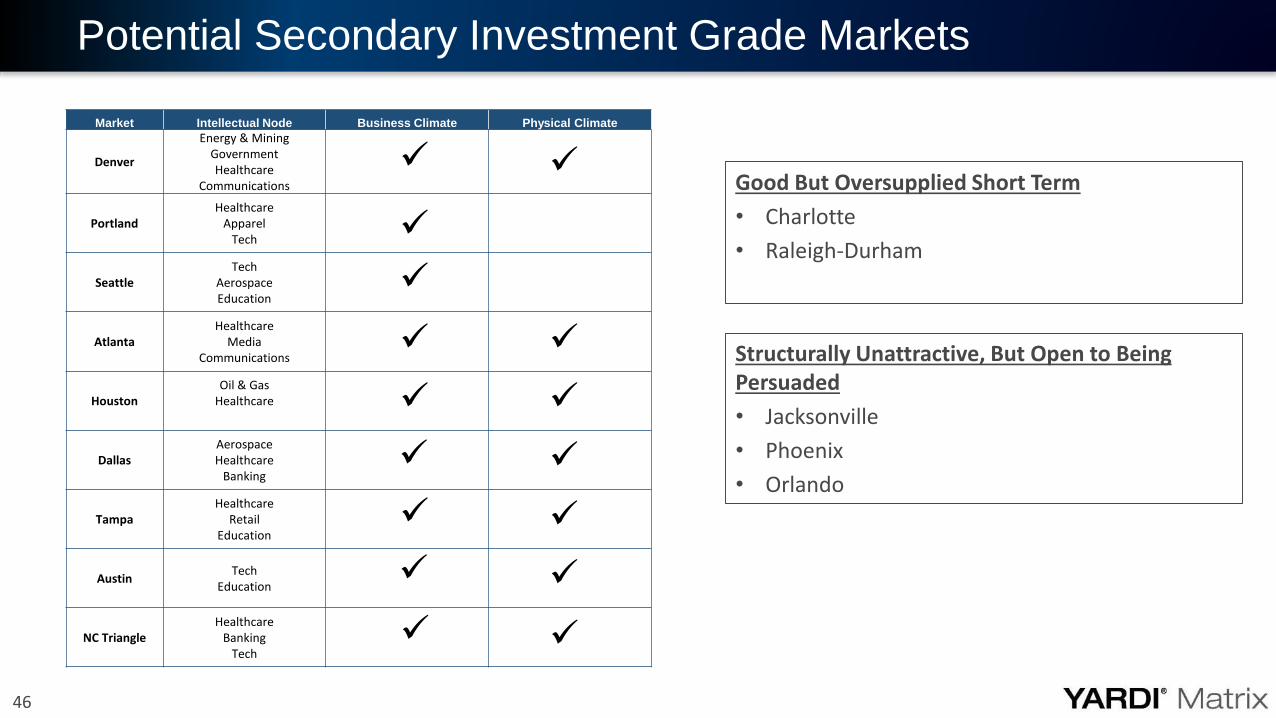
Potential Secondary Investment Grade Markets
Market Intellectual Node Business Climate Physical Climate
Denver
Energy & MiningGovernmentHealthcare
Communications
PortlandHealthcare
ApparelTech
SeattleTech
AerospaceEducation
AtlantaHealthcare
MediaCommunications
HoustonOil & Gas
Healthcare
DallasAerospaceHealthcare
Banking
TampaHealthcare
RetailEducation
AustinTech
Education
NC TriangleHealthcare
BankingTech
Good But Oversupplied Short Term
• Charlotte
• Raleigh-Durham
Structurally Unattractive, But Open to Being Persuaded
• Jacksonville
• Phoenix
• Orlando
47
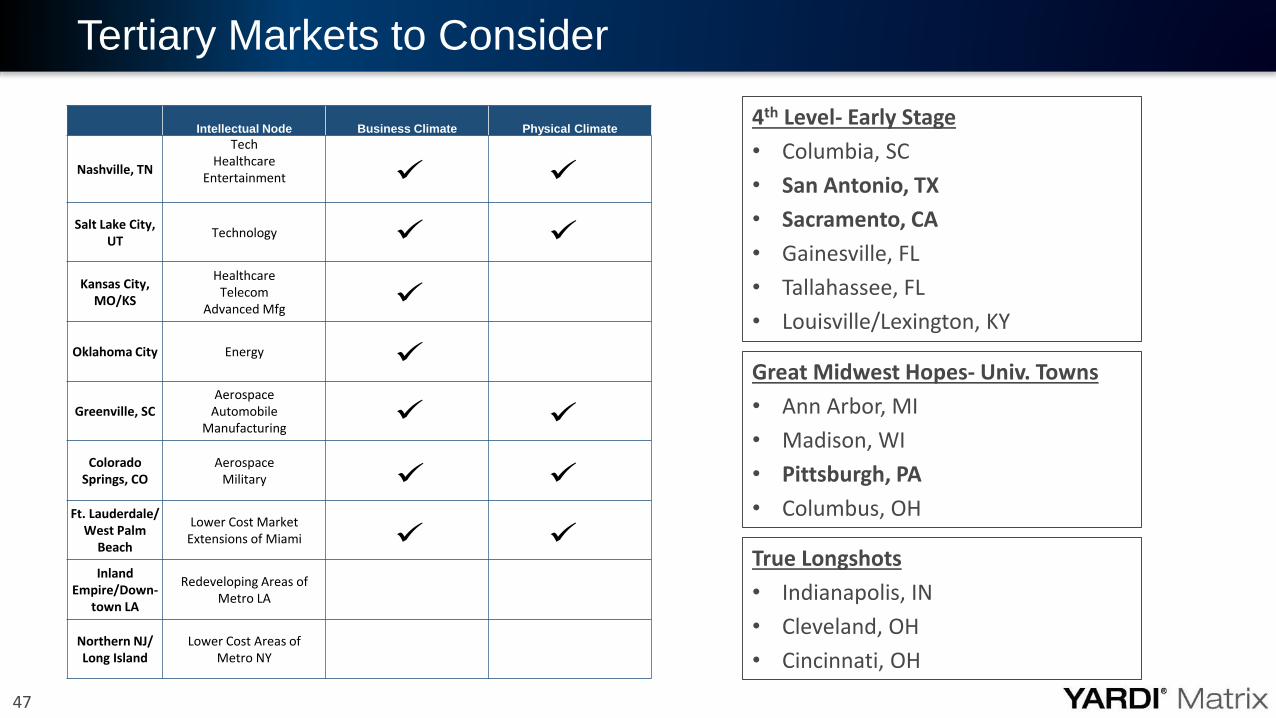
Tertiary Markets to Consider
Intellectual Node Business Climate Physical Climate
Nashville, TN
TechHealthcare
Entertainment
Salt Lake City, UT
Technology
Kansas City, MO/KS
Healthcare Telecom
Advanced Mfg
Oklahoma City Energy
Greenville, SCAerospace
AutomobileManufacturing
Colorado Springs, CO
AerospaceMilitary
Ft. Lauderdale/ West Palm
Beach
Lower Cost Market Extensions of Miami
Inland Empire/Down-
town LA
Redeveloping Areas of Metro LA
Northern NJ/ Long Island
Lower Cost Areas of Metro NY
4th Level- Early Stage
• Columbia, SC
• San Antonio, TX
• Sacramento, CA
• Gainesville, FL
• Tallahassee, FL
• Louisville/Lexington, KY
Great Midwest Hopes- Univ. Towns
• Ann Arbor, MI
• Madison, WI
• Pittsburgh, PA
• Columbus, OH
True Longshots
• Indianapolis, IN
• Cleveland, OH
• Cincinnati, OH
48
Trailing 12 month Rent Growth- Decelerating Markets
49
Trailing 12 month Rent Growth- Accelerating Markets
50
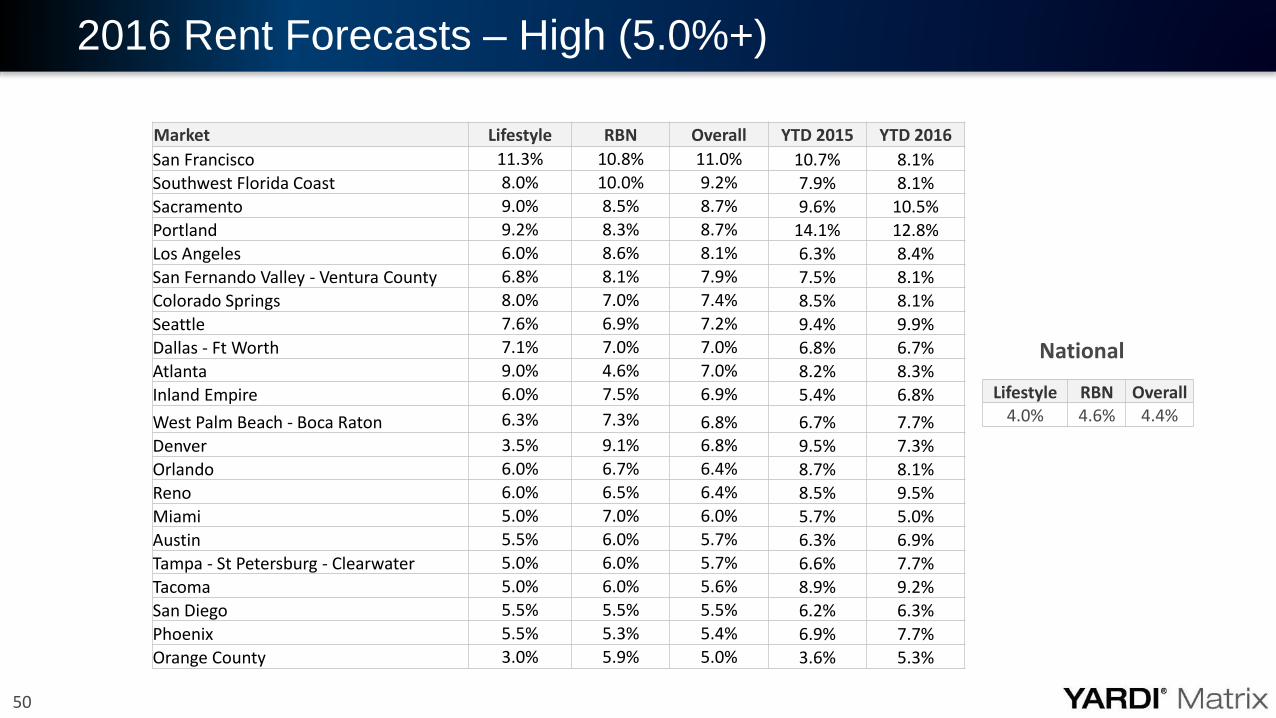
2016 Rent Forecasts – High (5.0%+)
Market Lifestyle RBN Overall YTD 2015 YTD 2016
San Francisco 11.3% 10.8% 11.0% 10.7% 8.1%
Southwest Florida Coast 8.0% 10.0% 9.2% 7.9% 8.1%
Sacramento 9.0% 8.5% 8.7% 9.6% 10.5%
Portland 9.2% 8.3% 8.7% 14.1% 12.8%
Los Angeles 6.0% 8.6% 8.1% 6.3% 8.4%
San Fernando Valley - Ventura County 6.8% 8.1% 7.9% 7.5% 8.1%
Colorado Springs 8.0% 7.0% 7.4% 8.5% 8.1%
Seattle 7.6% 6.9% 7.2% 9.4% 9.9%
Dallas - Ft Worth 7.1% 7.0% 7.0% 6.8% 6.7%
Atlanta 9.0% 4.6% 7.0% 8.2% 8.3%
Inland Empire 6.0% 7.5% 6.9% 5.4% 6.8%
West Palm Beach - Boca Raton 6.3% 7.3% 6.8% 6.7% 7.7%
Denver 3.5% 9.1% 6.8% 9.5% 7.3%
Orlando 6.0% 6.7% 6.4% 8.7% 8.1%
Reno 6.0% 6.5% 6.4% 8.5% 9.5%
Miami 5.0% 7.0% 6.0% 5.7% 5.0%
Austin 5.5% 6.0% 5.7% 6.3% 6.9%
Tampa - St Petersburg - Clearwater 5.0% 6.0% 5.7% 6.6% 7.7%
Tacoma 5.0% 6.0% 5.6% 8.9% 9.2%
San Diego 5.5% 5.5% 5.5% 6.2% 6.3%
Phoenix 5.5% 5.3% 5.4% 6.9% 7.7%
Orange County 3.0% 5.9% 5.0% 3.6% 5.3%
National
Lifestyle RBN Overall4.0% 4.6% 4.4%
51
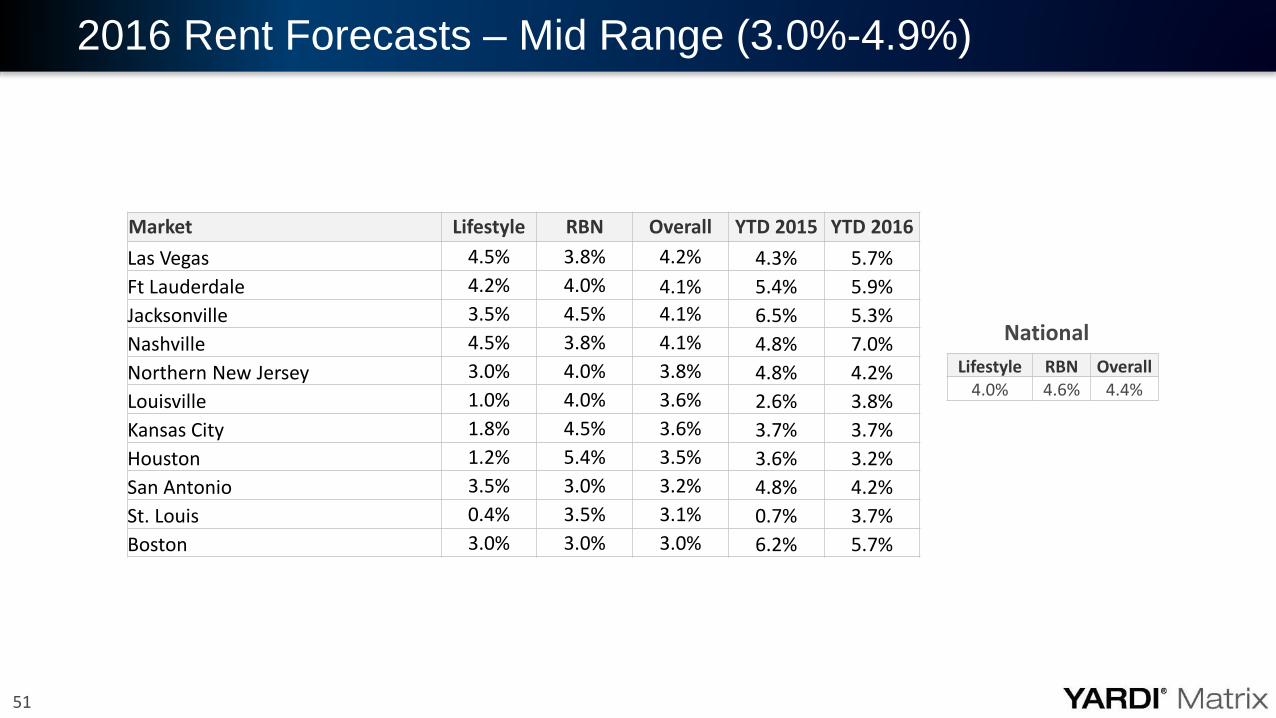
2016 Rent Forecasts – Mid Range (3.0%-4.9%)
Market Lifestyle RBN Overall YTD 2015 YTD 2016
Las Vegas 4.5% 3.8% 4.2% 4.3% 5.7%
Ft Lauderdale 4.2% 4.0% 4.1% 5.4% 5.9%
Jacksonville 3.5% 4.5% 4.1% 6.5% 5.3%
Nashville 4.5% 3.8% 4.1% 4.8% 7.0%
Northern New Jersey 3.0% 4.0% 3.8% 4.8% 4.2%
Louisville 1.0% 4.0% 3.6% 2.6% 3.8%
Kansas City 1.8% 4.5% 3.6% 3.7% 3.7%
Houston 1.2% 5.4% 3.5% 3.6% 3.2%
San Antonio 3.5% 3.0% 3.2% 4.8% 4.2%
St. Louis 0.4% 3.5% 3.1% 0.7% 3.7%
Boston 3.0% 3.0% 3.0% 6.2% 5.7%
National
Lifestyle RBN Overall4.0% 4.6% 4.4%
52
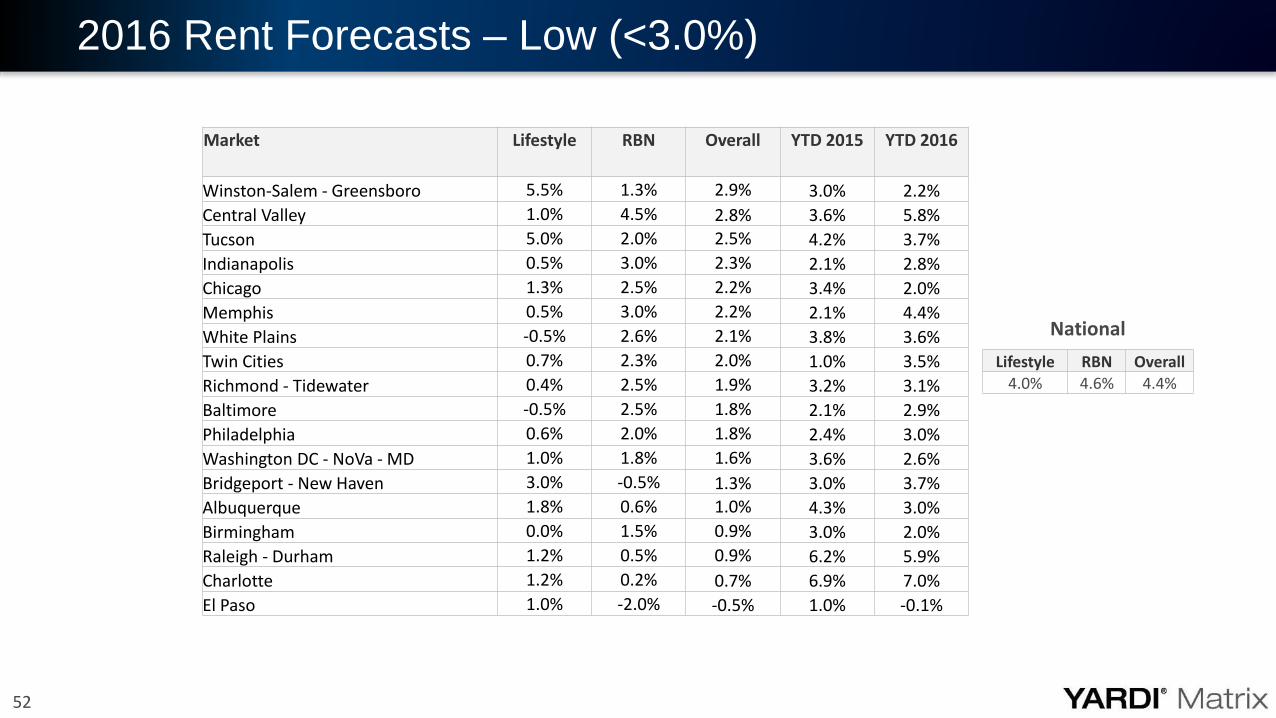
2016 Rent Forecasts – Low (<3.0%)
Market Lifestyle RBN Overall YTD 2015 YTD 2016
Winston-Salem - Greensboro 5.5% 1.3% 2.9% 3.0% 2.2%
Central Valley 1.0% 4.5% 2.8% 3.6% 5.8%
Tucson 5.0% 2.0% 2.5% 4.2% 3.7%
Indianapolis 0.5% 3.0% 2.3% 2.1% 2.8%
Chicago 1.3% 2.5% 2.2% 3.4% 2.0%
Memphis 0.5% 3.0% 2.2% 2.1% 4.4%
White Plains -0.5% 2.6% 2.1% 3.8% 3.6%
Twin Cities 0.7% 2.3% 2.0% 1.0% 3.5%
Richmond - Tidewater 0.4% 2.5% 1.9% 3.2% 3.1%
Baltimore -0.5% 2.5% 1.8% 2.1% 2.9%
Philadelphia 0.6% 2.0% 1.8% 2.4% 3.0%
Washington DC - NoVa - MD 1.0% 1.8% 1.6% 3.6% 2.6%
Bridgeport - New Haven 3.0% -0.5% 1.3% 3.0% 3.7%
Albuquerque 1.8% 0.6% 1.0% 4.3% 3.0%
Birmingham 0.0% 1.5% 0.9% 3.0% 2.0%
Raleigh - Durham 1.2% 0.5% 0.9% 6.2% 5.9%
Charlotte 1.2% 0.2% 0.7% 6.9% 7.0%
El Paso 1.0% -2.0% -0.5% 1.0% -0.1%
National
Lifestyle RBN Overall
4.0% 4.6% 4.4%

Submarket Selection
Jeff AdlerVice President, Matrix
54
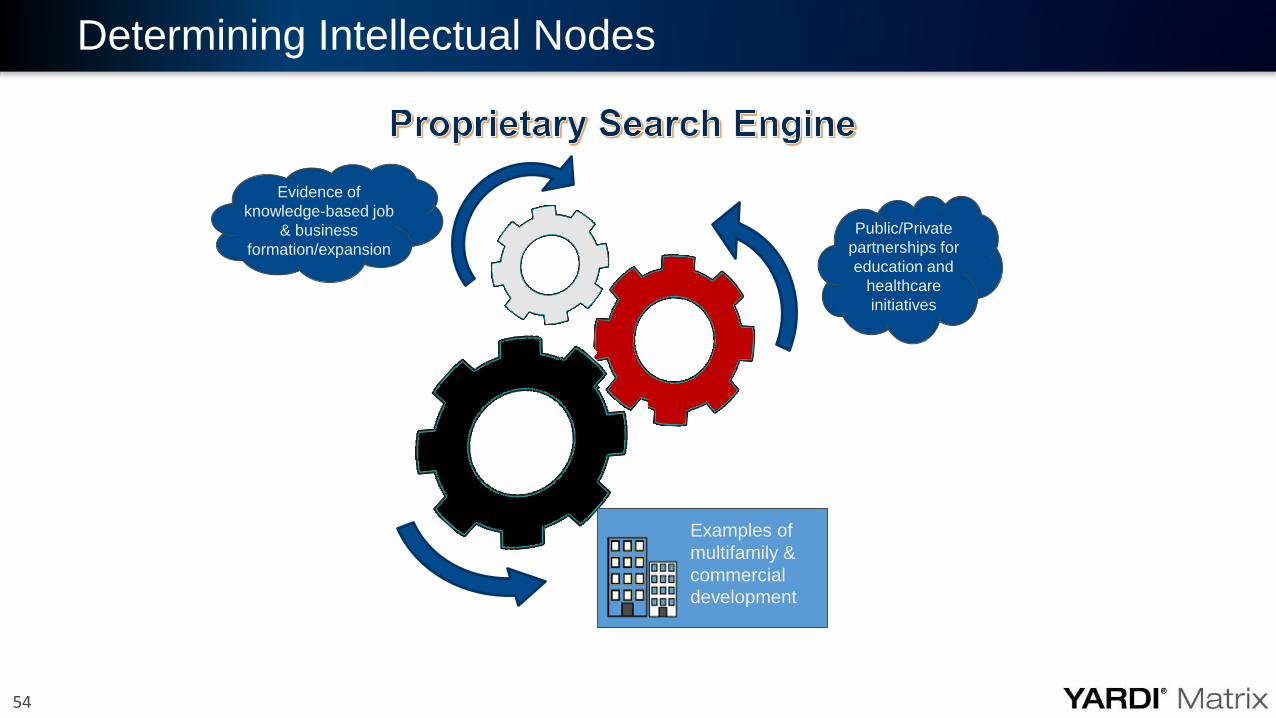
Determining Intellectual Nodes
Evidence of
knowledge-based job
& business
formation/expansion
Public/Private
partnerships for
education and
healthcare
initiatives
Examples of
multifamily &
commercial development

55
Connect Intellectual Capital Nodes Connected by Expanding Transit Lines
• Emerging nodes Broomfield and Aurora situated along planned 2016 light rail expansion.
• Several new lines will soon connect Broomfield Corridor to Downtown Denver, Boulder and Longmont.
• New lines will connect Aurora to International Airport and Denver Tech Center and Downtown.
• Existing rail service allows easy access to Denver Tech Center and will soon extend farther south, promoting future multifamily & commercial development.
Office Development
Multifamily Development
New Light Rail Line
Existing Light Rail Line
56
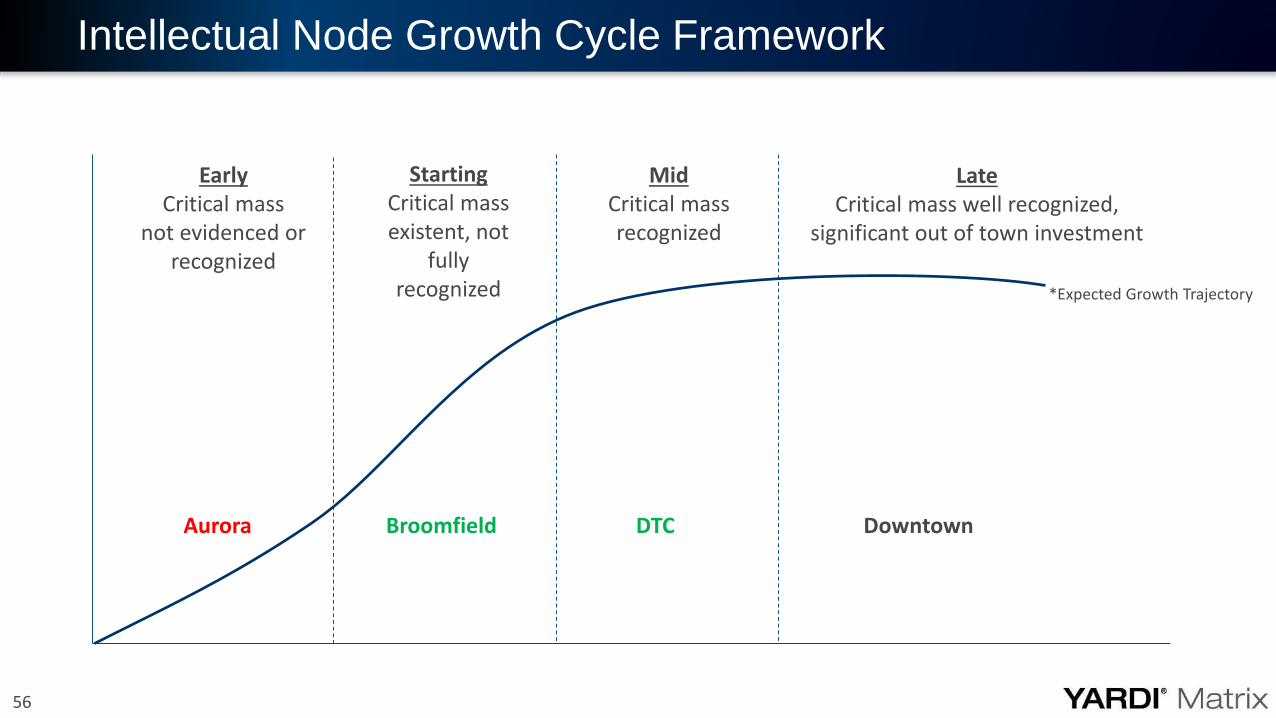
Intellectual Node Growth Cycle Framework
EarlyCritical mass
not evidenced or recognized
StartingCritical mass existent, not
fully recognized
MidCritical mass recognized
LateCritical mass well recognized,
significant out of town investment
Aurora Broomfield DTC Downtown
*Expected Growth Trajectory
57
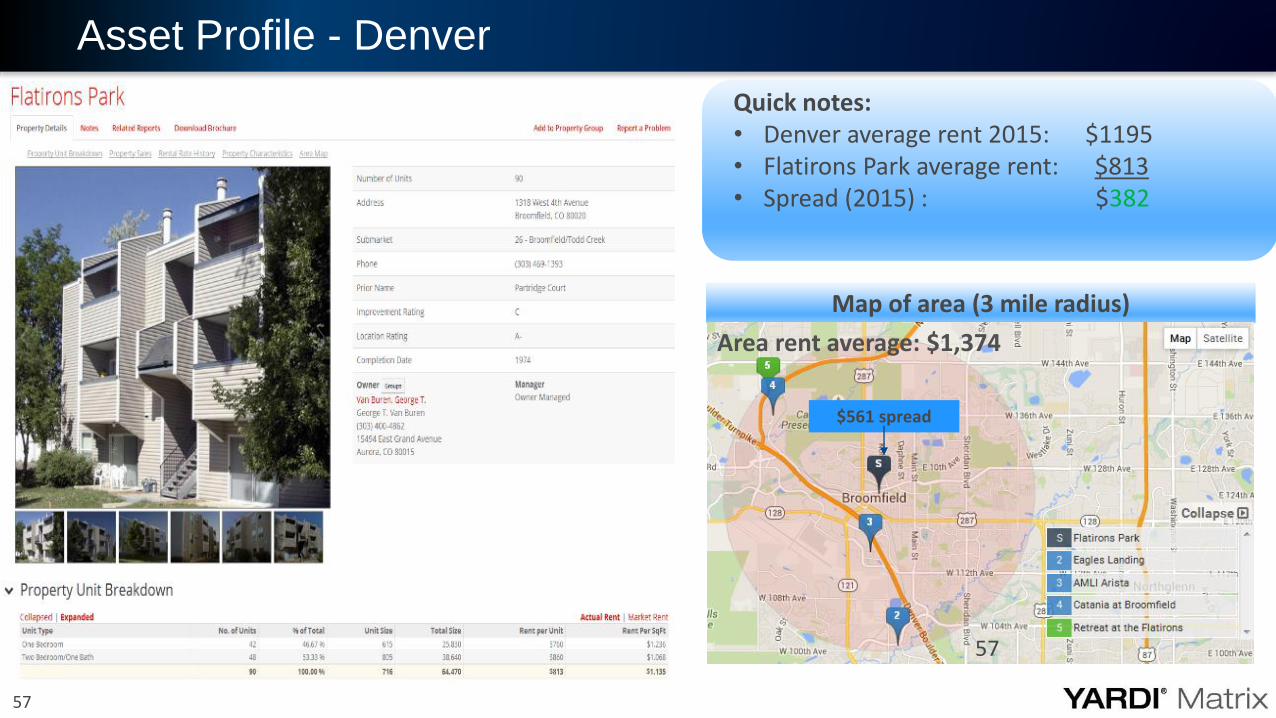
Asset Profile - Denver
Quick notes:• Denver average rent 2015: $1195• Flatirons Park average rent: $813• Spread (2015) : $382
Map of area (3 mile radius)
Area rent average: $1,345
$403 spread$561 spread
Area rent average: $1,374
57
58
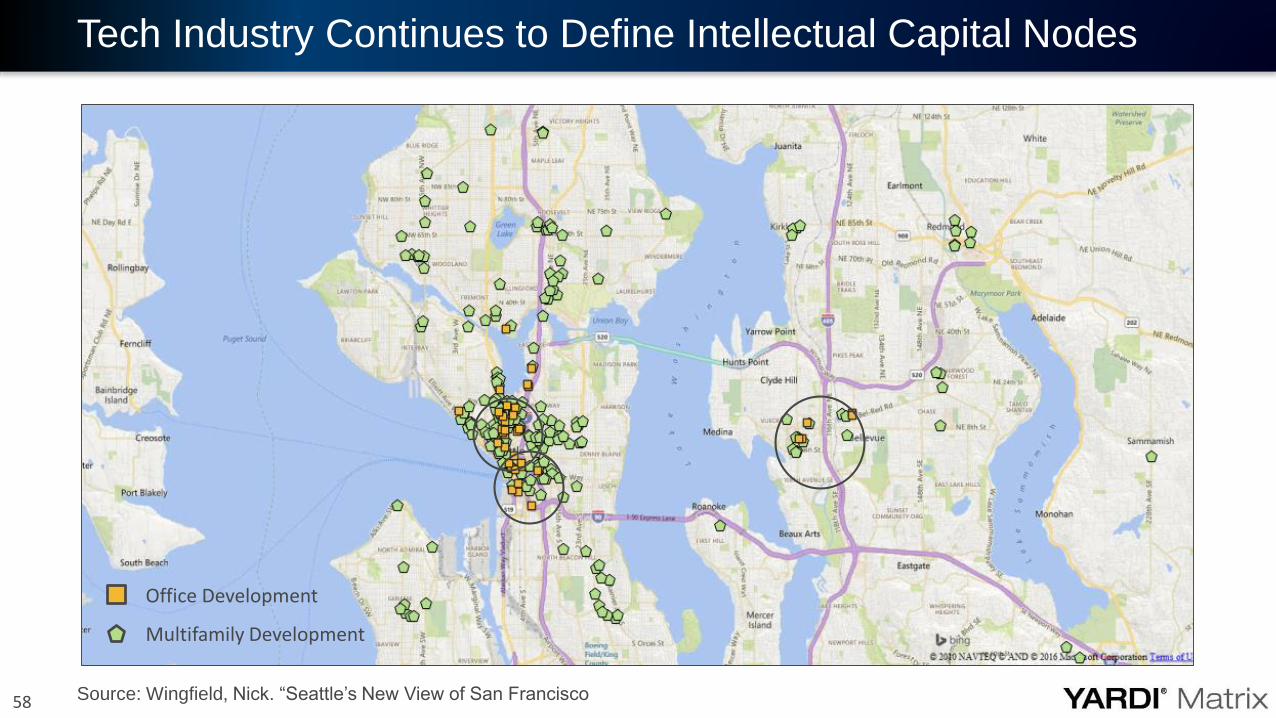
Tech Industry Continues to Define Intellectual Capital Nodes
Office Development
Multifamily Development
Source: Wingfield, Nick. “Seattle’s New View of San Francisco
59
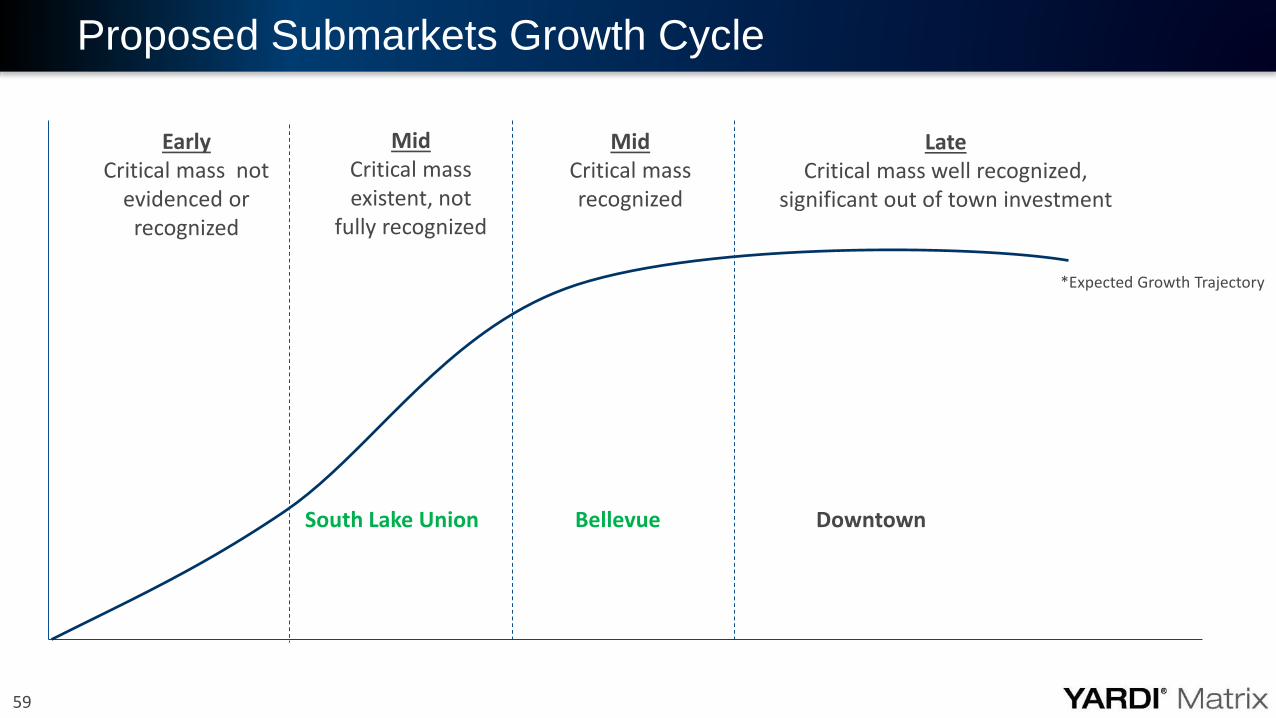
Proposed Submarkets Growth Cycle
EarlyCritical mass not
evidenced or recognized
Mid Critical mass existent, not
fully recognized
MidCritical mass recognized
LateCritical mass well recognized,
significant out of town investment
South Lake Union Bellevue Downtown
*Expected Growth Trajectory
60
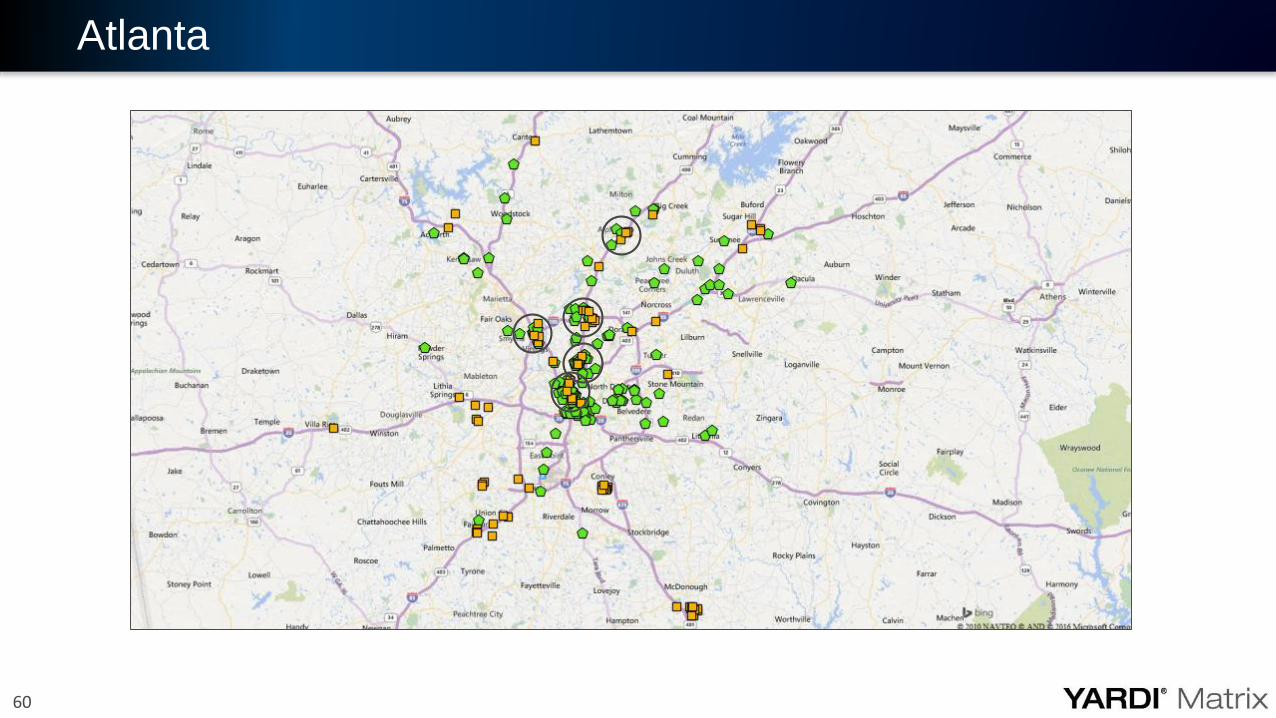
Atlanta
61
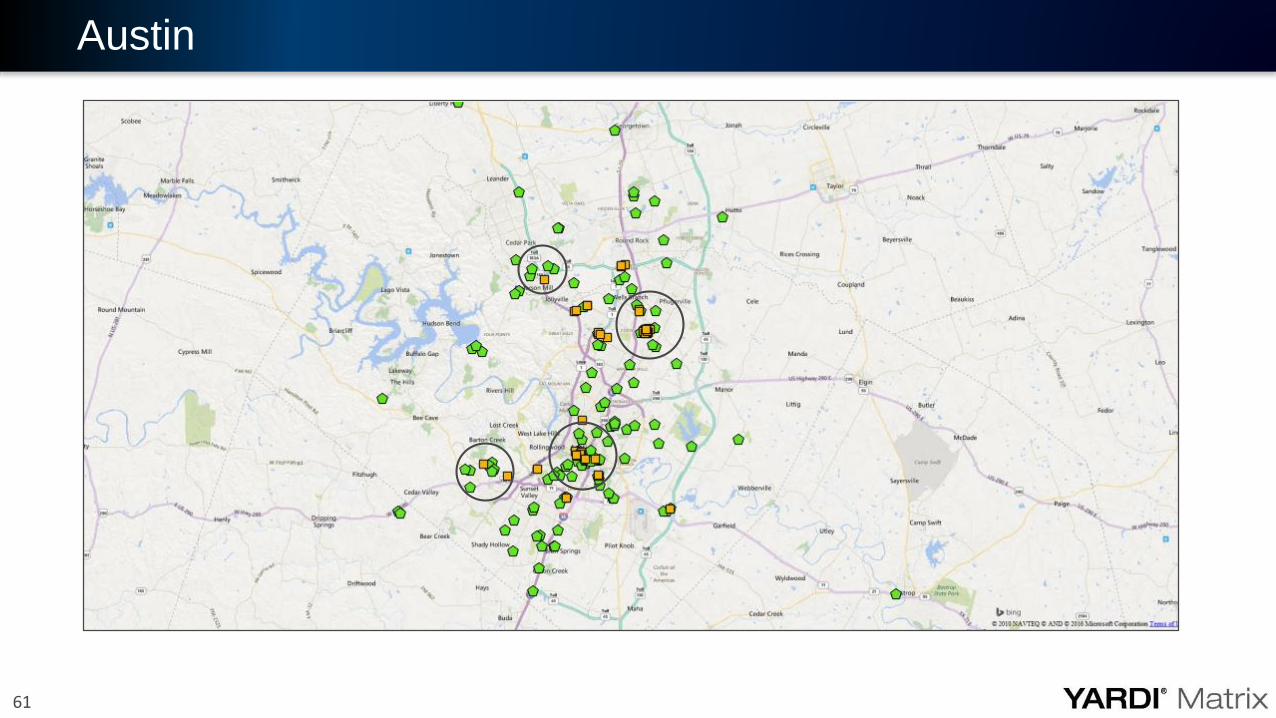
Austin
62
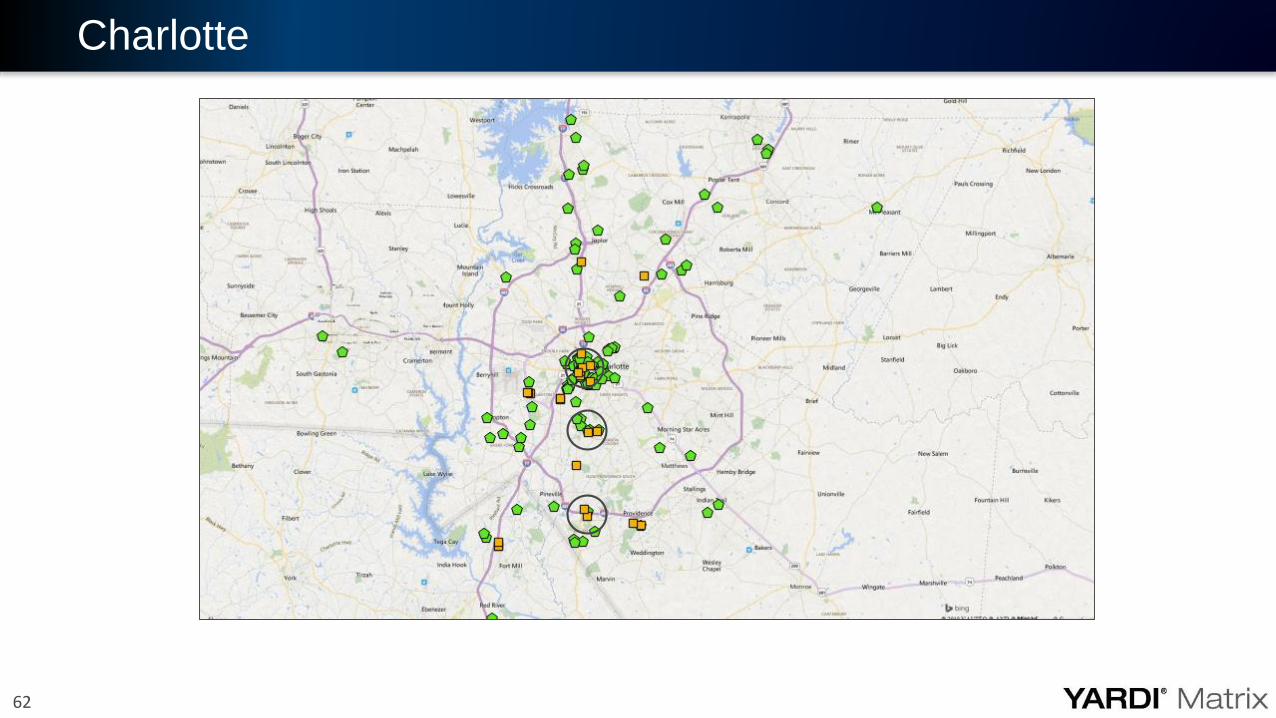
Charlotte
63
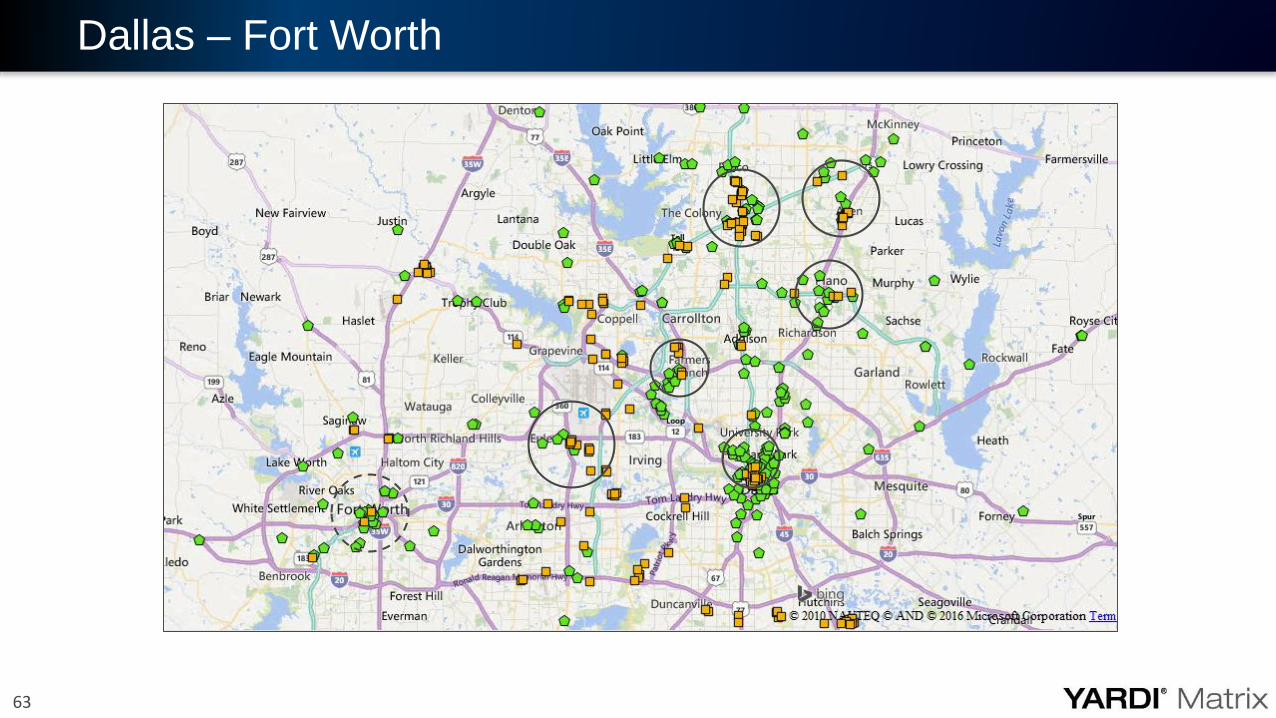
Dallas – Fort Worth
64
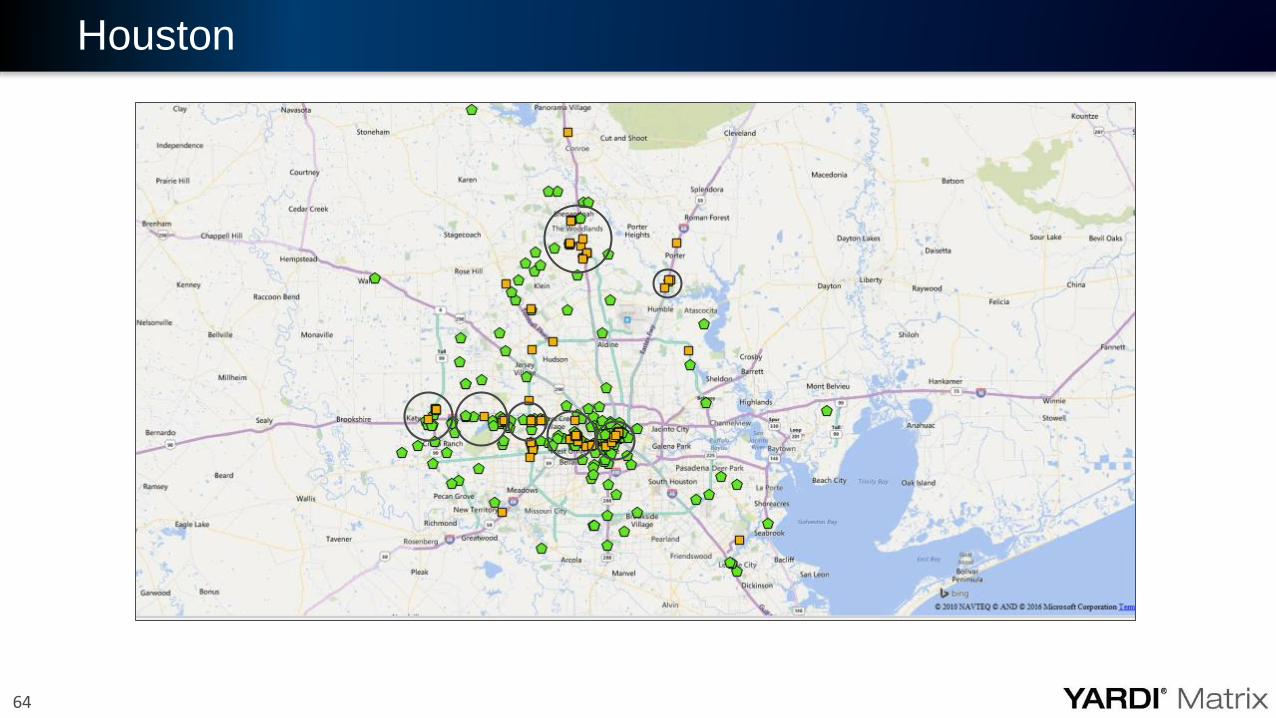
Houston
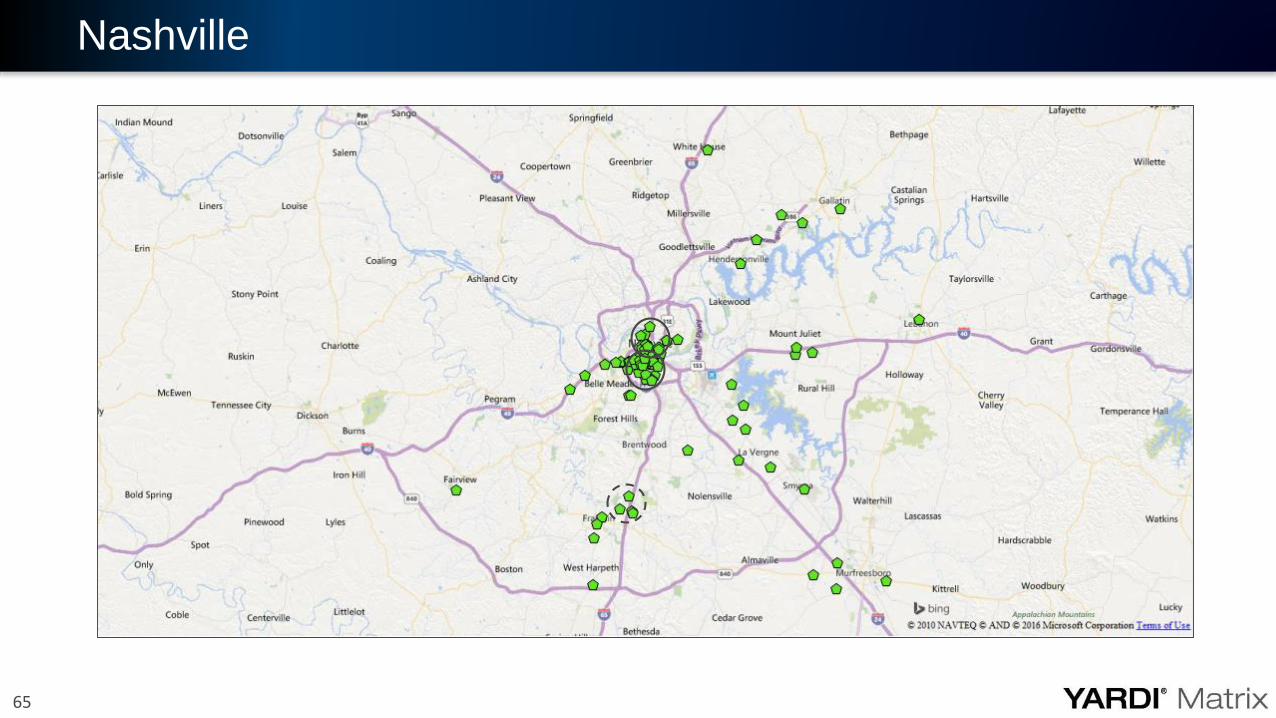
65
Nashville
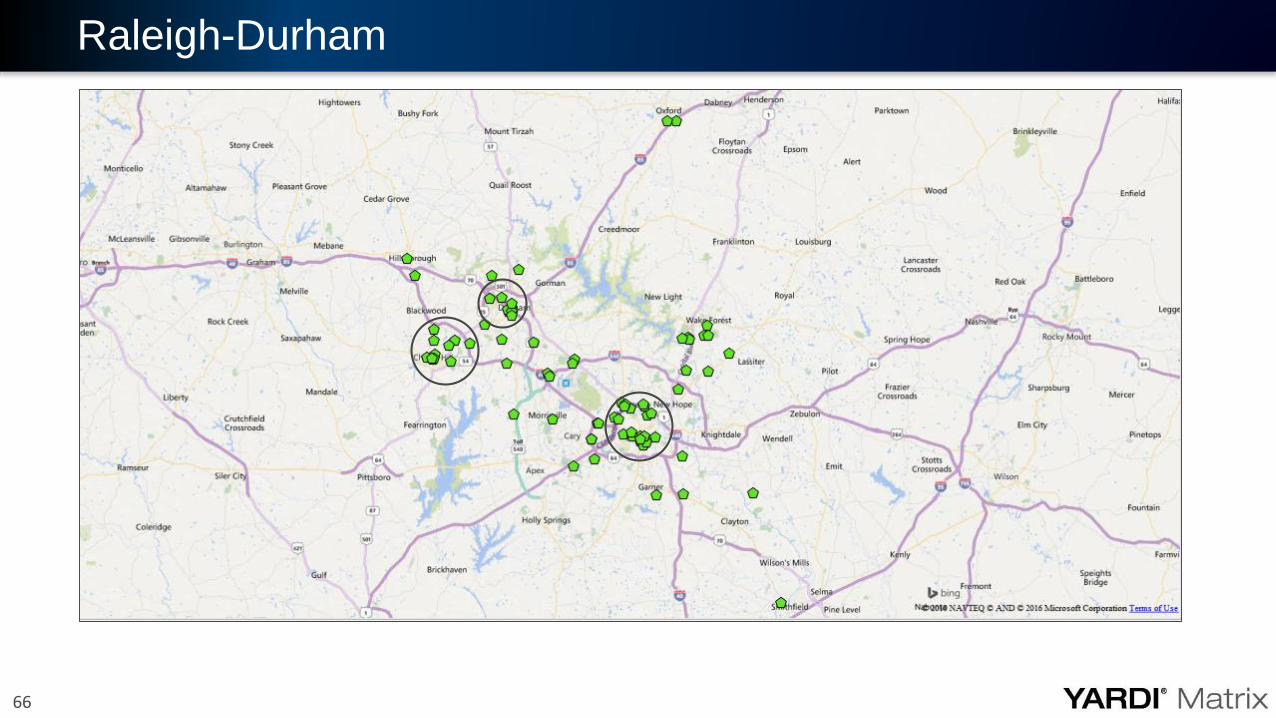
66
Raleigh-Durham
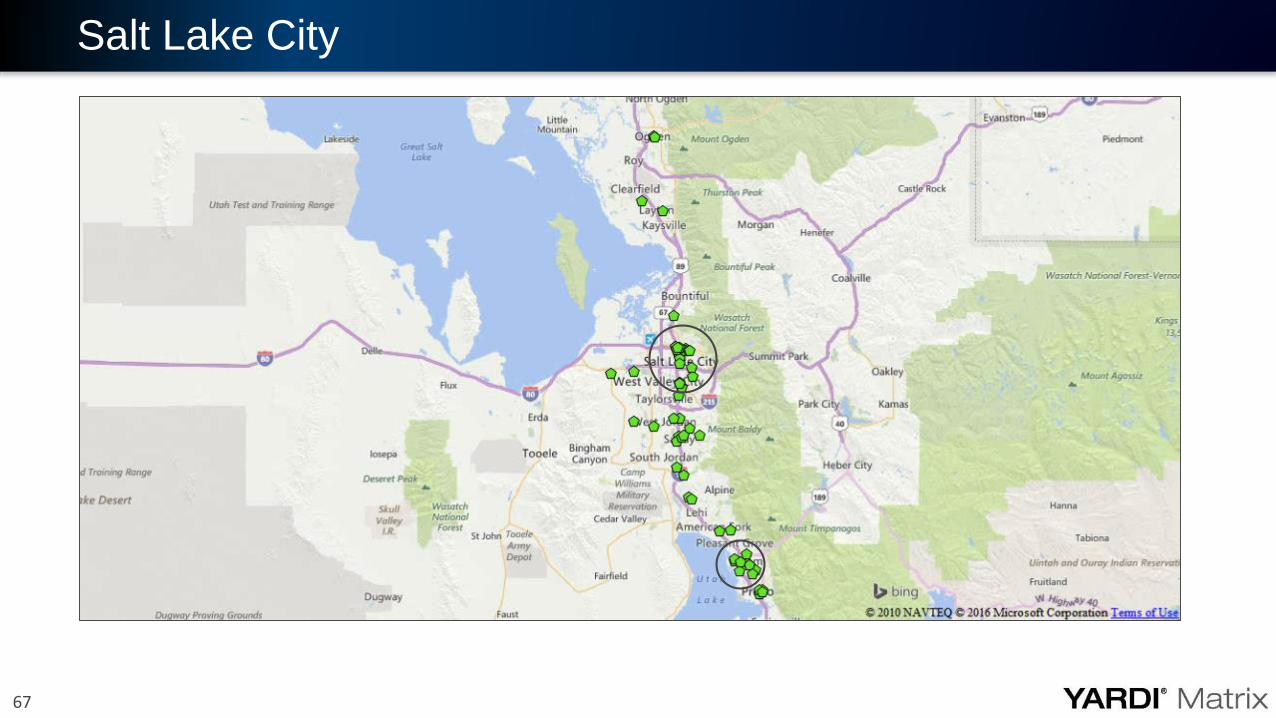
67
Salt Lake City
68
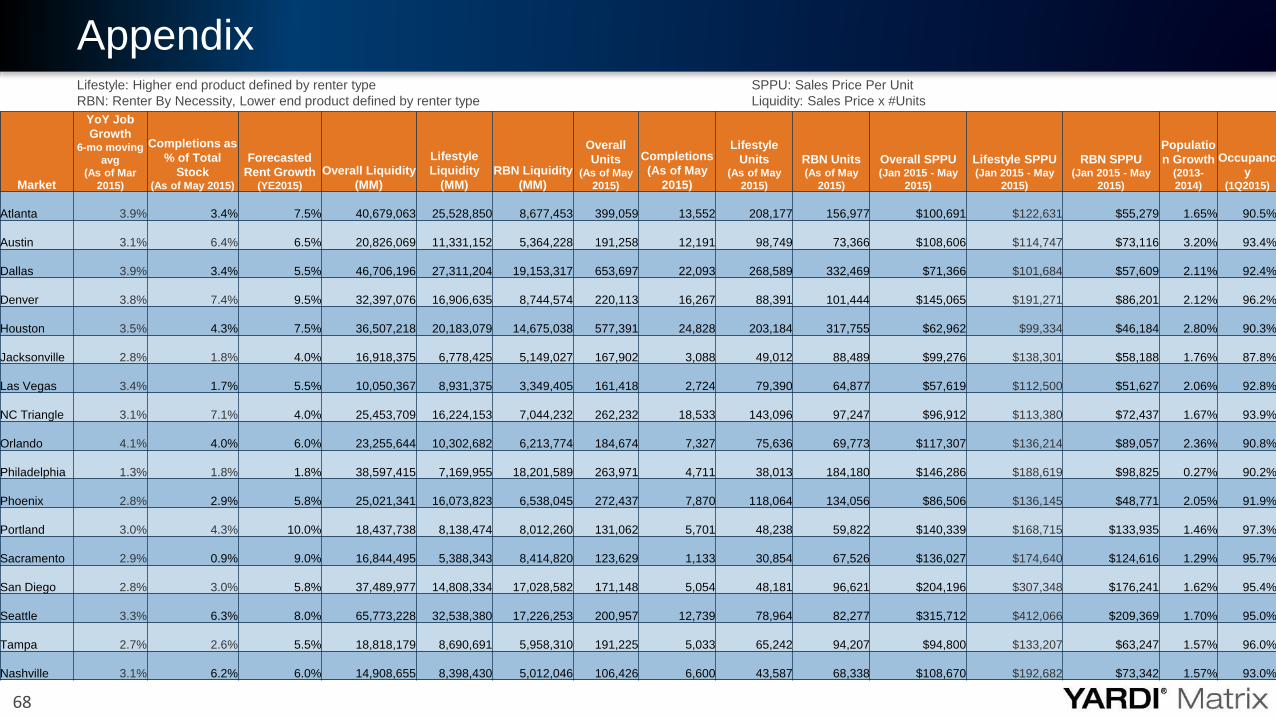
Appendix
Appendix
Market
YoY Job
Growth6-mo moving
avg
(As of Mar
2015)
Completions as
% of Total
Stock (As of May 2015)
Forecasted
Rent Growth (YE2015)
Overall Liquidity
(MM)
Lifestyle
Liquidity
(MM)
RBN Liquidity
(MM)
Overall
Units(As of May
2015)
Completions
(As of May
2015)
Lifestyle
Units(As of May
2015)
RBN Units(As of May
2015)
Overall SPPU(Jan 2015 - May
2015)
Lifestyle SPPU(Jan 2015 - May
2015)
RBN SPPU(Jan 2015 - May
2015)
Populatio
n Growth(2013-
2014)
Occupanc
y(1Q2015)
Atlanta 3.9% 3.4% 7.5% 40,679,063 25,528,850 8,677,453 399,059 13,552 208,177 156,977 $100,691 $122,631 $55,279 1.65% 90.5%
Austin 3.1% 6.4% 6.5% 20,826,069 11,331,152 5,364,228 191,258 12,191 98,749 73,366 $108,606 $114,747 $73,116 3.20% 93.4%
Dallas 3.9% 3.4% 5.5% 46,706,196 27,311,204 19,153,317 653,697 22,093 268,589 332,469 $71,366 $101,684 $57,609 2.11% 92.4%
Denver 3.8% 7.4% 9.5% 32,397,076 16,906,635 8,744,574 220,113 16,267 88,391 101,444 $145,065 $191,271 $86,201 2.12% 96.2%
Houston 3.5% 4.3% 7.5% 36,507,218 20,183,079 14,675,038 577,391 24,828 203,184 317,755 $62,962 $99,334 $46,184 2.80% 90.3%
Jacksonville 2.8% 1.8% 4.0% 16,918,375 6,778,425 5,149,027 167,902 3,088 49,012 88,489 $99,276 $138,301 $58,188 1.76% 87.8%
Las Vegas 3.4% 1.7% 5.5% 10,050,367 8,931,375 3,349,405 161,418 2,724 79,390 64,877 $57,619 $112,500 $51,627 2.06% 92.8%
NC Triangle 3.1% 7.1% 4.0% 25,453,709 16,224,153 7,044,232 262,232 18,533 143,096 97,247 $96,912 $113,380 $72,437 1.67% 93.9%
Orlando 4.1% 4.0% 6.0% 23,255,644 10,302,682 6,213,774 184,674 7,327 75,636 69,773 $117,307 $136,214 $89,057 2.36% 90.8%
Philadelphia 1.3% 1.8% 1.8% 38,597,415 7,169,955 18,201,589 263,971 4,711 38,013 184,180 $146,286 $188,619 $98,825 0.27% 90.2%
Phoenix 2.8% 2.9% 5.8% 25,021,341 16,073,823 6,538,045 272,437 7,870 118,064 134,056 $86,506 $136,145 $48,771 2.05% 91.9%
Portland 3.0% 4.3% 10.0% 18,437,738 8,138,474 8,012,260 131,062 5,701 48,238 59,822 $140,339 $168,715 $133,935 1.46% 97.3%
Sacramento 2.9% 0.9% 9.0% 16,844,495 5,388,343 8,414,820 123,629 1,133 30,854 67,526 $136,027 $174,640 $124,616 1.29% 95.7%
San Diego 2.8% 3.0% 5.8% 37,489,977 14,808,334 17,028,582 171,148 5,054 48,181 96,621 $204,196 $307,348 $176,241 1.62% 95.4%
Seattle 3.3% 6.3% 8.0% 65,773,228 32,538,380 17,226,253 200,957 12,739 78,964 82,277 $315,712 $412,066 $209,369 1.70% 95.0%
Tampa 2.7% 2.6% 5.5% 18,818,179 8,690,691 5,958,310 191,225 5,033 65,242 94,207 $94,800 $133,207 $63,247 1.57% 96.0%
Nashville 3.1% 6.2% 6.0% 14,908,655 8,398,430 5,012,046 106,426 6,600 43,587 68,338 $108,670 $192,682 $73,342 1.57% 93.0%
Lifestyle: Higher end product defined by renter type
RBN: Renter By Necessity, Lower end product defined by renter type
SPPU: Sales Price Per Unit
Liquidity: Sales Price x #Units
69
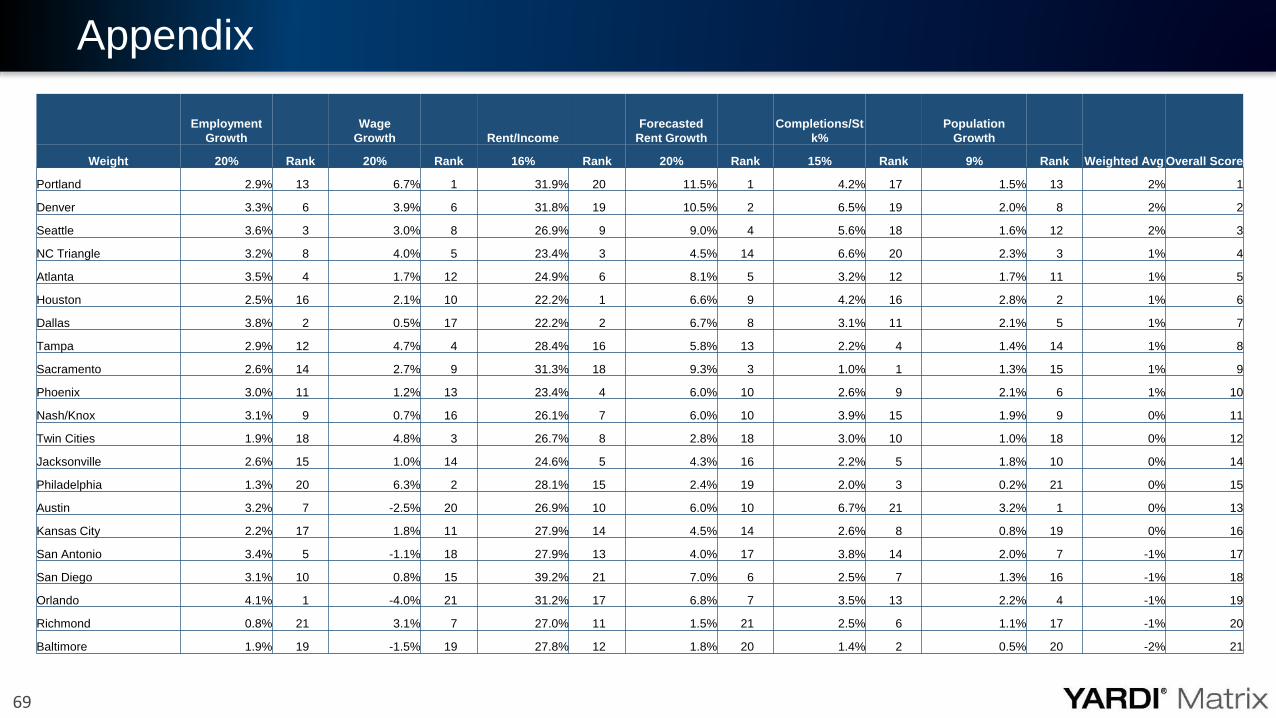
Appendix
Employment
Growth
Wage
Growth Rent/Income
Forecasted
Rent Growth
Completions/St
k%
Population
Growth
Weighted Avg Overall ScoreWeight 20% Rank 20% Rank 16% Rank 20% Rank 15% Rank 9% Rank
Portland 2.9% 13 6.7% 1 31.9% 20 11.5% 1 4.2% 17 1.5% 13 2% 1
Denver 3.3% 6 3.9% 6 31.8% 19 10.5% 2 6.5% 19 2.0% 8 2% 2
Seattle 3.6% 3 3.0% 8 26.9% 9 9.0% 4 5.6% 18 1.6% 12 2% 3
NC Triangle 3.2% 8 4.0% 5 23.4% 3 4.5% 14 6.6% 20 2.3% 3 1% 4
Atlanta 3.5% 4 1.7% 12 24.9% 6 8.1% 5 3.2% 12 1.7% 11 1% 5
Houston 2.5% 16 2.1% 10 22.2% 1 6.6% 9 4.2% 16 2.8% 2 1% 6
Dallas 3.8% 2 0.5% 17 22.2% 2 6.7% 8 3.1% 11 2.1% 5 1% 7
Tampa 2.9% 12 4.7% 4 28.4% 16 5.8% 13 2.2% 4 1.4% 14 1% 8
Sacramento 2.6% 14 2.7% 9 31.3% 18 9.3% 3 1.0% 1 1.3% 15 1% 9
Phoenix 3.0% 11 1.2% 13 23.4% 4 6.0% 10 2.6% 9 2.1% 6 1% 10
Nash/Knox 3.1% 9 0.7% 16 26.1% 7 6.0% 10 3.9% 15 1.9% 9 0% 11
Twin Cities 1.9% 18 4.8% 3 26.7% 8 2.8% 18 3.0% 10 1.0% 18 0% 12
Jacksonville 2.6% 15 1.0% 14 24.6% 5 4.3% 16 2.2% 5 1.8% 10 0% 14
Philadelphia 1.3% 20 6.3% 2 28.1% 15 2.4% 19 2.0% 3 0.2% 21 0% 15
Austin 3.2% 7 -2.5% 20 26.9% 10 6.0% 10 6.7% 21 3.2% 1 0% 13
Kansas City 2.2% 17 1.8% 11 27.9% 14 4.5% 14 2.6% 8 0.8% 19 0% 16
San Antonio 3.4% 5 -1.1% 18 27.9% 13 4.0% 17 3.8% 14 2.0% 7 -1% 17
San Diego 3.1% 10 0.8% 15 39.2% 21 7.0% 6 2.5% 7 1.3% 16 -1% 18
Orlando 4.1% 1 -4.0% 21 31.2% 17 6.8% 7 3.5% 13 2.2% 4 -1% 19
Richmond 0.8% 21 3.1% 7 27.0% 11 1.5% 21 2.5% 6 1.1% 17 -1% 20
Baltimore 1.9% 19 -1.5% 19 27.8% 12 1.8% 20 1.4% 2 0.5% 20 -2% 21

70
»Jeff Adler, Vice President & General Manager of Yardi Matrix
[email protected], 1-800-866-1124 x2403
»Jack Kern, Director of Research and Publications
[email protected], 1-800-866-1124 x2444
Contact Information
Source: GDP from BEA April 28th, 2016; BLS Employment Situation Reports; Moody’s Analytics; FTSE Nareit U.S. Real Estate Index GDP Definition: the value of goods and services produced by the nation’s economy less the value of the goods and services used in production, adjusted for price changes