Embed Size (px)
Citation preview

BullionGold
Silver
Base Metal
Copper
Zinc
Lead
Aluminium
Nickel
EnergyCrude Oil
Natural Gas
AgroJeera
Chana
14thDec 2018

Gold
MCX Gold price has drifted into negativeterritory for second consecutive sessionas equity market has performed well andinvestors are cautious ahead of FOMCstatement later in the week. On the dailychart, Gold has settled above 61.8%retracement levels but found theresistance at upper Bollinger bandformation. Moreover, COMEX price hassustained above 200 days SMA on thedaily chart. A momentum indicator RSI(14) has shown positive crossover on aweekly chart. So based on the abovetechnical structure; we expect bullishmomentum in the prices for near term.
MCX Silver price has traded in narrowrange on Thursday. On the daily chart,price has sustained above 61.8%retracement levels. Moreover, pricehas shifted above falling trend lineand 21 days SMA. Furthermore, amomentum indicator RSI (14) andMACD has pulled back from negativezone with positive crossover on thedaily chart. which points out reversalin the prices for near term. So basedon the above technical studies; weexpect bullish momentum in theprices for the day.
Feb Silver Mar
Bullish
38500/38700
38000
31532
Bullish
31650/31750
31450
Gold 31233 31359 31445 31571 31657 31783 32122
Silver 37917 38071 38215 38369 38513 38667 39118
38340
MCX Copper prices traded lower on
Thursday and settled at flat note. On
the daily chart, price has given falling
channel breakout on upside and
sustained above it but on the other
hand, price has been finding a
resistance at 50% retracement levels
and upper Bollinger band.
Furthermore, a momentum indicator
RSI (14) and MACD has shown positive
crossover on the daily chart. Hence, we
expect range bound to bearish
movement in the prices for near term.
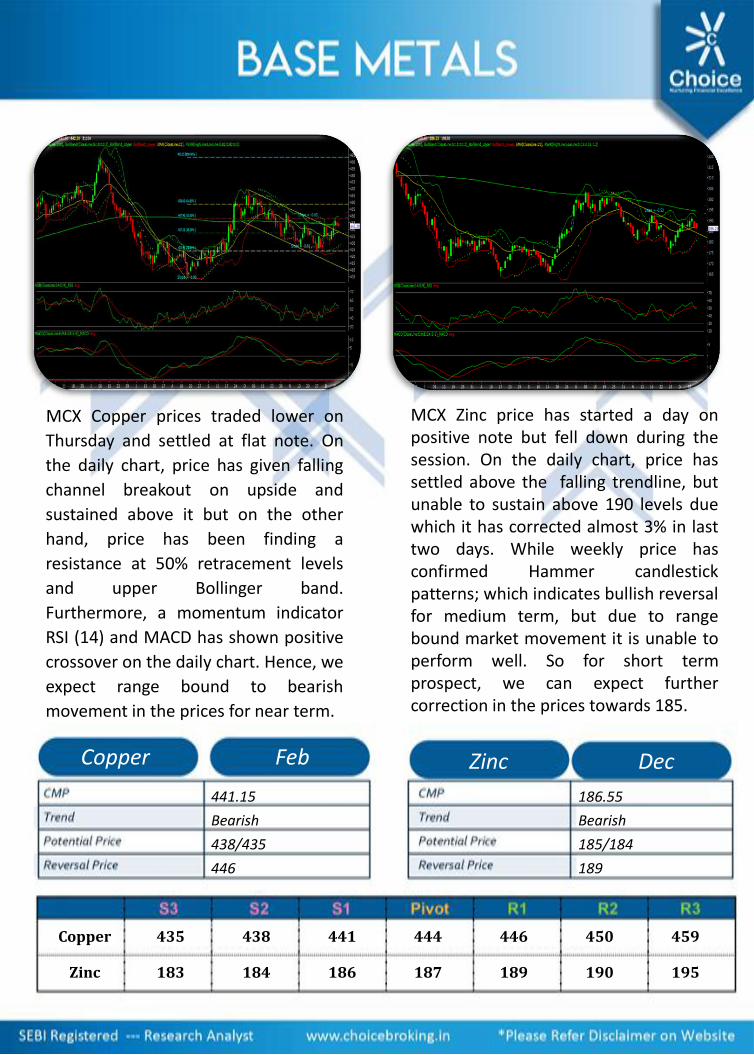
MCX Zinc price has started a day onpositive note but fell down during thesession. On the daily chart, price hassettled above the falling trendline, butunable to sustain above 190 levels duewhich it has corrected almost 3% in lasttwo days. While weekly price hasconfirmed Hammer candlestickpatterns; which indicates bullish reversalfor medium term, but due to rangebound market movement it is unable toperform well. So for short termprospect, we can expect furthercorrection in the prices towards 185.
Copper Feb Zinc Dec
441.15
Bearish
438/435
446
186.55
Bearish
185/184
189
Copper 435 438 441 444 446 450 459
Zinc 183 184 186 187 189 190 195

Oil prices rose on Thursday as theInternational Energy Agency forecastthat the market would rebalance fasterthan it originally thought. On the dailychart, MCX Crude prices are unable tosustain at higher levels and finding amajor resistance around 3870 as pricesare getting reverse from that level only.So bullish rally do not confirm until priceget settle above 3870 levels. Moreover,NYMEX Oil prices are also not in favor ofbullish mode. Hence, we expect bearishmove in the prices for the day.
MCX Natural Gas prices moved downby almost 1% on Thursday. Overall,price has been getting highly volatilefrom last couple of week. On the dailychart, price has given Pennant patternbreakout and breached the previouslevels of 328 but still it is unable tosustain above that level. Whichconfirms negative biasness among thetraders. However, a momentumindicator RSI and MACD are stillshowing indecisiveness in the prices.Hence, we expect sideways to bearishmovement in the prices.
Crude Oil Dec Natural Gas Dec
3723
Bearish
3800
298.5
Bearish
294/290
308
Crude 3537 3576 3653 3692 3769 3808 3964
Natural Gas
272 281 289 299 307 316 344
3650/3600

NCDEX Chana has traded at flat noteon Thursday. On the daily chart, pricehas sustained above 38.2%retracement levels and 50 days SMA;which suggest bullish trend in thecounter. Furthermore, a momentumindicator RSI and MACD moved higherwith positive crossover. On the otherhand, fundamental outlook is bullishfor Chana in near term because of lessproduction figure and higher demand.So based on the above analysis, weexpect bullish trend for the day.
NCDEX Jeera prices fell down almost1% on Thursday session. On the dailychart, price has given rising trendlinebreakdown and sustained below it;which indicates bearish trend in thecounter. Moreover price has movedbelow 100*50 days SMA on the dailychart; which confirms bearishness fornear term. Furthermore, a momentumindicator RSI and MACD traded atlower levels with negative crossover. Sobased on the above analysis, we expectbearish trend in the counter for theday.
Chana Jan Jeera Jan
Bullish
4650/4690
4570
18365
Bearish
18100/18000
18500
Jeera 17815 18045 18205 18435 18595 18825 19445
Chana 4460 4520 4563 4623 4666 4726 4889
4606

07:00PM Core Retail Sales m/m 0.7% 0.2%
07:00PM Retail Sales m/m 0.8% 0.1%
Gold 1246
Silver 14.78
Crude Oil WTI 52.50
Brent Crude Oil 61.10
Natural Gas 4.077
USD / INR 71.74
Dollar Index 97.13
EUR / USD 1.1359
CRB Index* 183.03
Copper 6132
Aluminum 1928
Zinc 2554
Lead 1948
Nickel 10817
Copper 49070
Aluminum 13540
Zinc 21445
Lead 18690
13.12.18
13.12.18

S3 S2 S1 Pivot R1 R2 R3
Copper 435 438 441 444 446 450 459
Aluminum 134 145 137 138 139 141 146
Lead 136 138 139 141 142 143 148
Nickel 759 765 770 776 782 787 804
Zinc 183 184 186 187 189 190 195
Natural Gas 272 281 289 299 307 316 344
RM Seed 3951 3978 3993 4020 4035 4062 4131
Soybean 3325 3347 3360 3382 3395 3417 3474
RSO 728 732 735 739 742 746 758
Jeera 17815 18045 18205 18435 18595 18825 19445
TMC 6288 6384 6574 6670 6860 6956 7338
Guar Seed 4363 4388 4403 4428 4443 4468 4534
Dhaniya 6482 6554 6607 6679 6732 6804 7001
Castor Seed 5333 5375 5413 5455 5493 5535 5658
PIVOT TABLE