Embed Size (px)
Citation preview
Open Transport Map: open, harmonized dataset or road network Karel Jedlička, Pavel Hájek, Jan Ježek, František Kolovský, Tomáš Mildorf, Karel Charvát, Dmitrii Kozhukh, Jan Martolos, Jan Šťastný, Daniel Beran
ABSTRACT: This contribution presents the Open Transport Map (OTM). The OTM is a web based map, portraying the road network of the Europe. The road network is derived from OpenStreetMap (OSM) but the data are stored in the INSPIRE Transport Network compatible data scheme. OTM is topologically clean dataset suitable for routing and other network analyses. A calculation of time related traffic volumes is one of them. This calculation uses demographic data and a road network to create a traffic model which can simulate traffic volume changes in the network in time. These traffic volumes are calculated for the pilot regions (Antwerpen, Birmingham, Issy-les-Moulineaux and Liberec region) and visualized in the OTM, which is developer in the European project OpenTransportNet and used also in projects SDI4Apps and FOODIE.
KEYWORDS: transport, transport network, traffic volume, open data, map, geographical information system
Introduction The issues of road transportation, which deal with traffic delays and consequently traffic jams, are an everyday reality for many people living in large cities and conurbation areas. Using geoinformation technologies for decision support can be helpful in this case. Such technologies can be used for finding alternative ways to avoid a traffic delay, not only using the nearest detour path, but also information about a traffic flow on road segments during a day, a month or over a year could be taken into consideration. Such an information about the detour path and traffic flow should be delivered to a user by an appropriate visualization technique. The visualization should be performed by a particularly technique which can visualize traffic flows, traffic volumes and their relation to the roads’ maximum capacity for an easy readability of visualized information (see chapter Related works in Jedlička et al. (2015a) for further information about visualization techniques for a spatial-temporal phenomenon). Therefore a convenient support instrument for decision making about a route in the road network, which is called Open Transport Map (OTM) is described further. It combines the advantages of using methods of traffic volumes calculation together with theirs’ predictions and the appropriate visualization form of traffic intensities on a map.
The objective of this paper is to effectively plan a road transportation in an area of interest. For such a decision the eligible information is needed. Open Transport Map (OTM) can serve as such a source of information. As described in Open Transport Map (2015), OTM is derived from the most popular open spatial dataset – OpenStreetMap. For the information about the OpenStreetMap see reference About OSM (2015). The Open Transport Map can serve as a map itself as well as a layer embedded in your map and it is accessible via both GUI and API (the OTM itself is distributed under the ODbL license). To stress the most important ability of this map, the OTM allows routing
72
(on contrary of OpenStreetMap) and dynamic visualization of traffic volumes. The examples of both abilities are given further, see especially chapter Methods and Results. The OTM also offers many other ways of innovative exploitation. You can access the OTM through the web site www.opentransportmap.info. The OTM is developed and used within the European project called OpenTransportNet and it is also used in two other European projects: SDI4Apps and Foodie on the base of Memorandum of Understanding among these projects. Objective of the OpenTransportNet project is to create virtual hubs aggregating, harmonizing and visualizing transport related data in order to make it easier for innovators to create services and applications. The SDI4Apps project draws along the lines of INSPIRE, Copernicus and GEOSS and aspires to build a WIN-WIN strategy for building a successful business for hundreds of SMEs on the basis of European spatial data infrastructures. The key point of FOODIE (Farm-Oriented Open Data In Europe) project is creating a platform hub on the cloud where spatial and non-spatial data related to agricultural sector are available for agri-food stakeholders groups and interoperable. This study has already been presented and published at the IST Africa 2016 conference, see Jedlička et al. (2016).
Methods The workflow of the creation of Open Transport Map can be described as a sequence of the following steps:
• OpenStreetMap to Open Transport Map conversion.
• Traffic volumes and capacity calculation.
• Open Transport Map visualization.
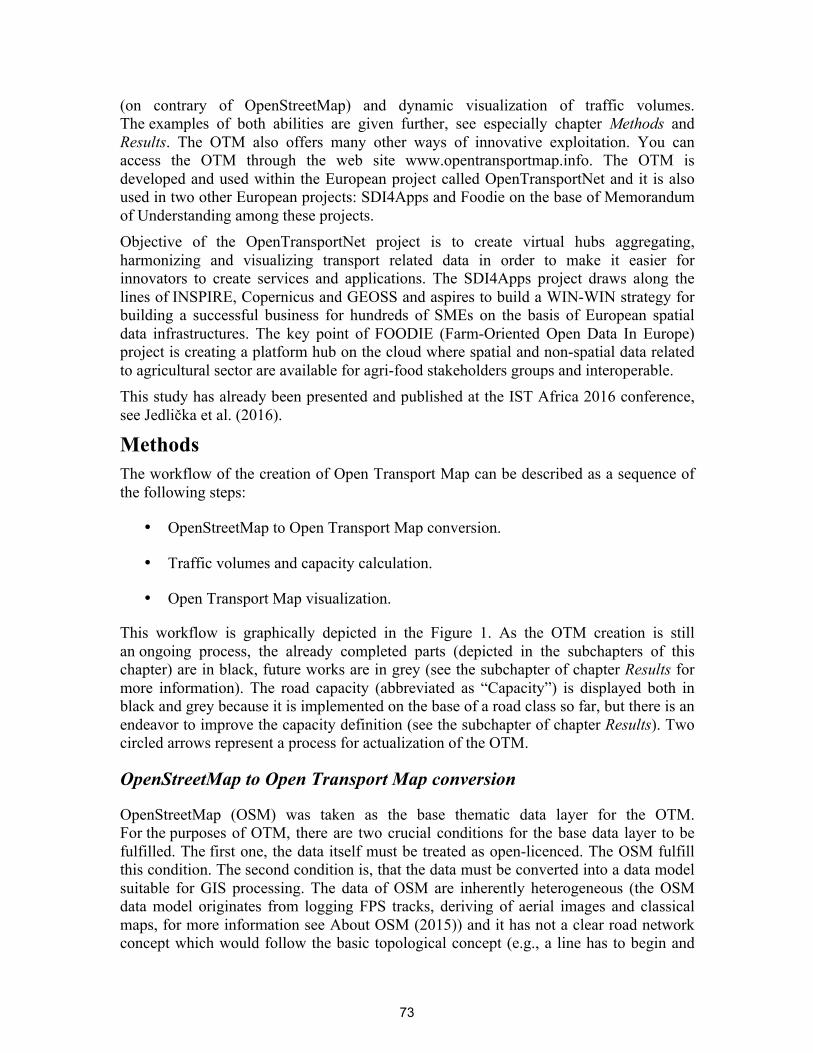
This workflow is graphically depicted in the Figure 1. As the OTM creation is still an ongoing process, the already completed parts (depicted in the subchapters of this chapter) are in black, future works are in grey (see the subchapter of chapter Results for more information). The road capacity (abbreviated as “Capacity”) is displayed both in black and grey because it is implemented on the base of a road class so far, but there is an endeavor to improve the capacity definition (see the subchapter of chapter Results). Two circled arrows represent a process for actualization of the OTM.
OpenStreetMap to Open Transport Map conversion
OpenStreetMap (OSM) was taken as the base thematic data layer for the OTM. For the purposes of OTM, there are two crucial conditions for the base data layer to be fulfilled. The first one, the data itself must be treated as open-licenced. The OSM fulfill this condition. The second condition is, that the data must be converted into a data model suitable for GIS processing. The data of OSM are inherently heterogeneous (the OSM data model originates from logging FPS tracks, deriving of aerial images and classical maps, for more information see About OSM (2015)) and it has not a clear road network concept which would follow the basic topological concept (e.g., a line has to begin and
73
end in a node). This causes that the OSM itself is not routable and is not ready to use for analytical task (see further information about this topic in Veeckman et al. (2015)) and thus the data needs to be converted into a harmonized state. The INSPIRE Transport Network compatible data model (which stores data in topologically correct form and thus the data are suitable for network analysis) has been chosen in this case as the targeting data model.
Figure 1: The workflow of the OTM creation.
Talking about the used technology (already depicted at Figure 1), the PL/SQL script for importing data into a PostgreSQL database (called ImpOSM, see ImpOSM (2016) for further information about this tool) and one for making the data topologically clean (called OSM2PO, see OSM2PO (2015) for further information about this tool) are used to produce the INSPIRE compatible routable OTM data source.
An attribute and geometry mapping in between OpenStreetMap and INSPIRE Transport Network compatible data model uses a harmonization workflow which is depicted in detail in Veeckman et al. (2015) and consists of 4 steps:
• Understanding source data – OpenStreetMap (in this case).
• Understanding target data – INSPIRE Transport Network compatible data model.
• Definition of attribute and geometry mapping steps.
• Practical realization of the defined steps.
74
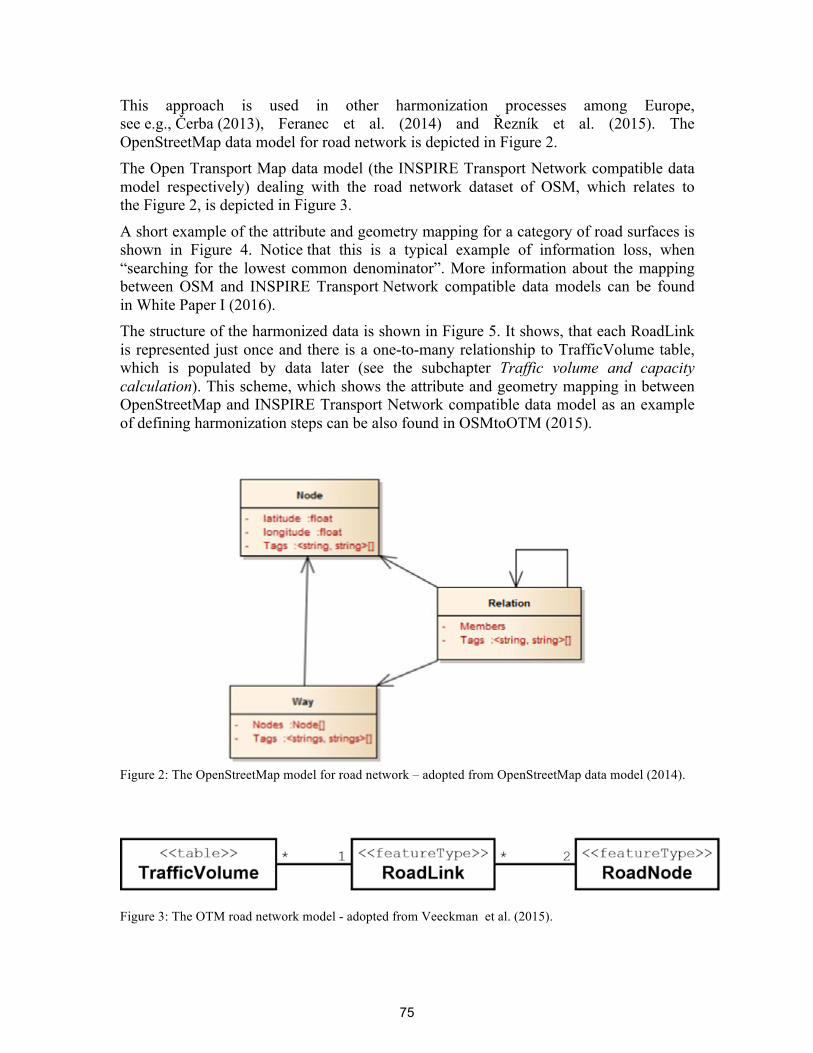
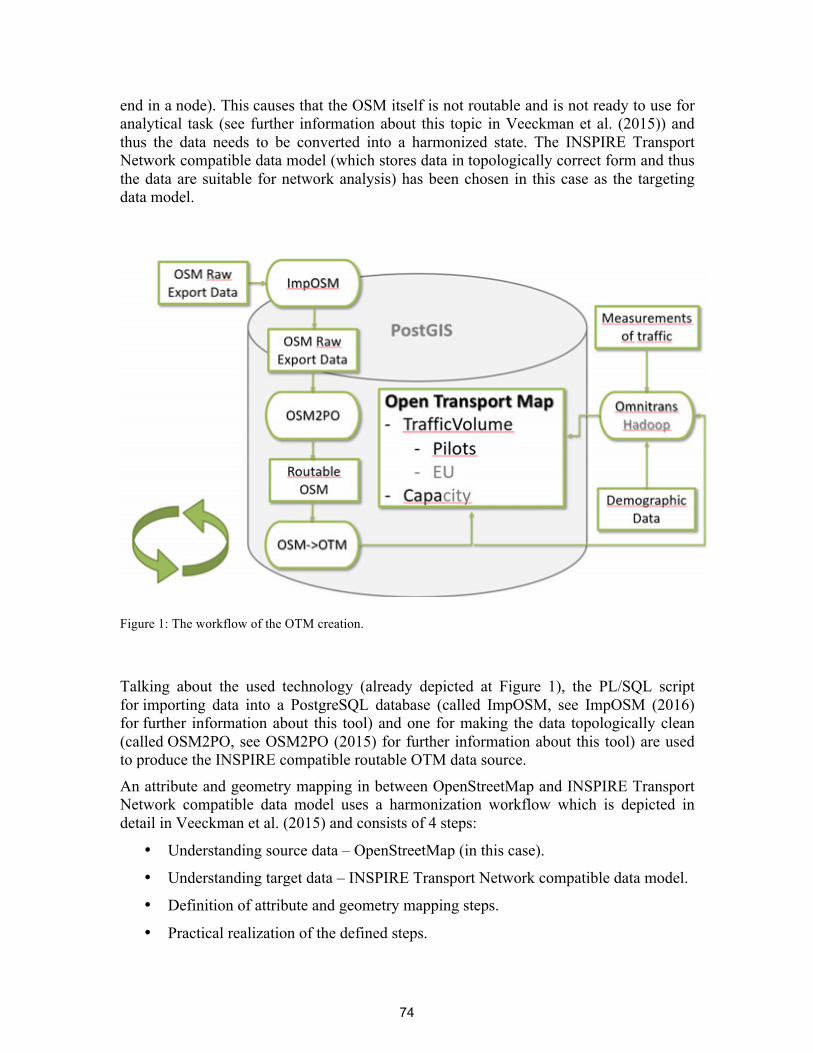
This approach is used in other harmonization processes among Europe, see e.g., Čerba (2013), Feranec et al. (2014) and Řezník et al. (2015). The OpenStreetMap data model for road network is depicted in Figure 2. The Open Transport Map data model (the INSPIRE Transport Network compatible data model respectively) dealing with the road network dataset of OSM, which relates to the Figure 2, is depicted in Figure 3.
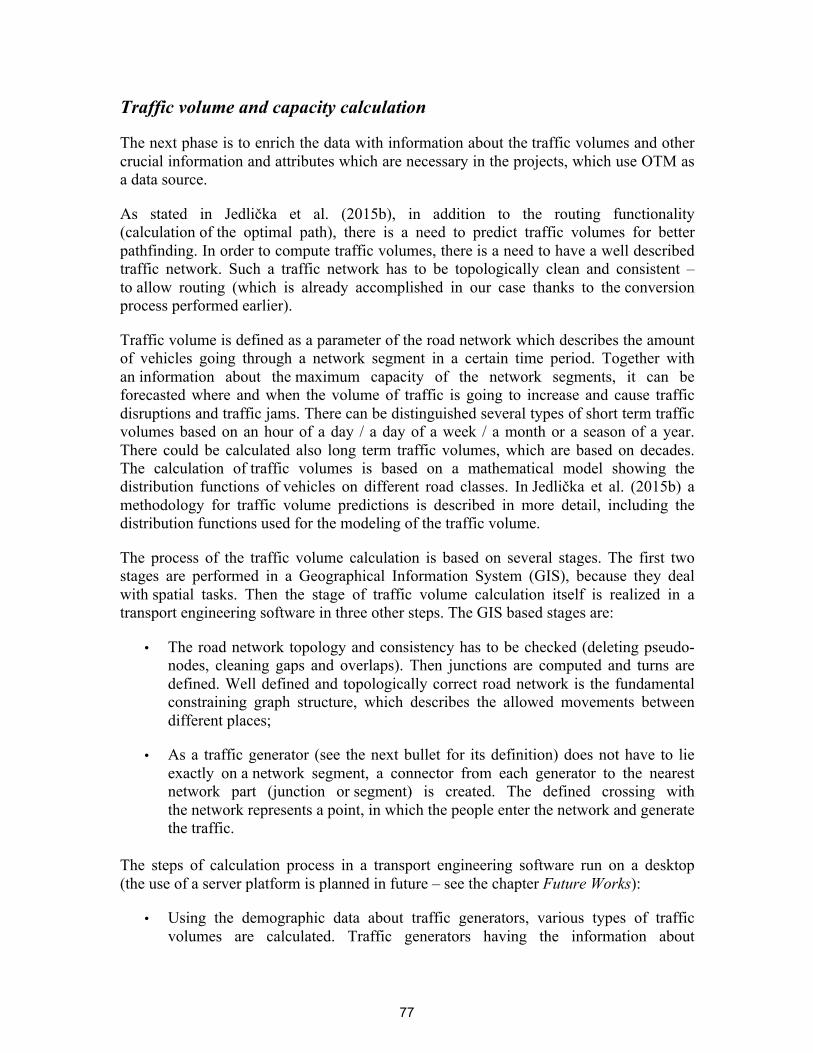
A short example of the attribute and geometry mapping for a category of road surfaces is shown in Figure 4. Notice that this is a typical example of information loss, when “searching for the lowest common denominator”. More information about the mapping between OSM and INSPIRE Transport Network compatible data models can be found in White Paper I (2016). The structure of the harmonized data is shown in Figure 5. It shows, that each RoadLink is represented just once and there is a one-to-many relationship to TrafficVolume table, which is populated by data later (see the subchapter Traffic volume and capacity calculation). This scheme, which shows the attribute and geometry mapping in between OpenStreetMap and INSPIRE Transport Network compatible data model as an example of defining harmonization steps can be also found in OSMtoOTM (2015).
Figure 2: The OpenStreetMap model for road network – adopted from OpenStreetMap data model (2014).
Figure 3: The OTM road network model - adopted from Veeckman et al. (2015).
75
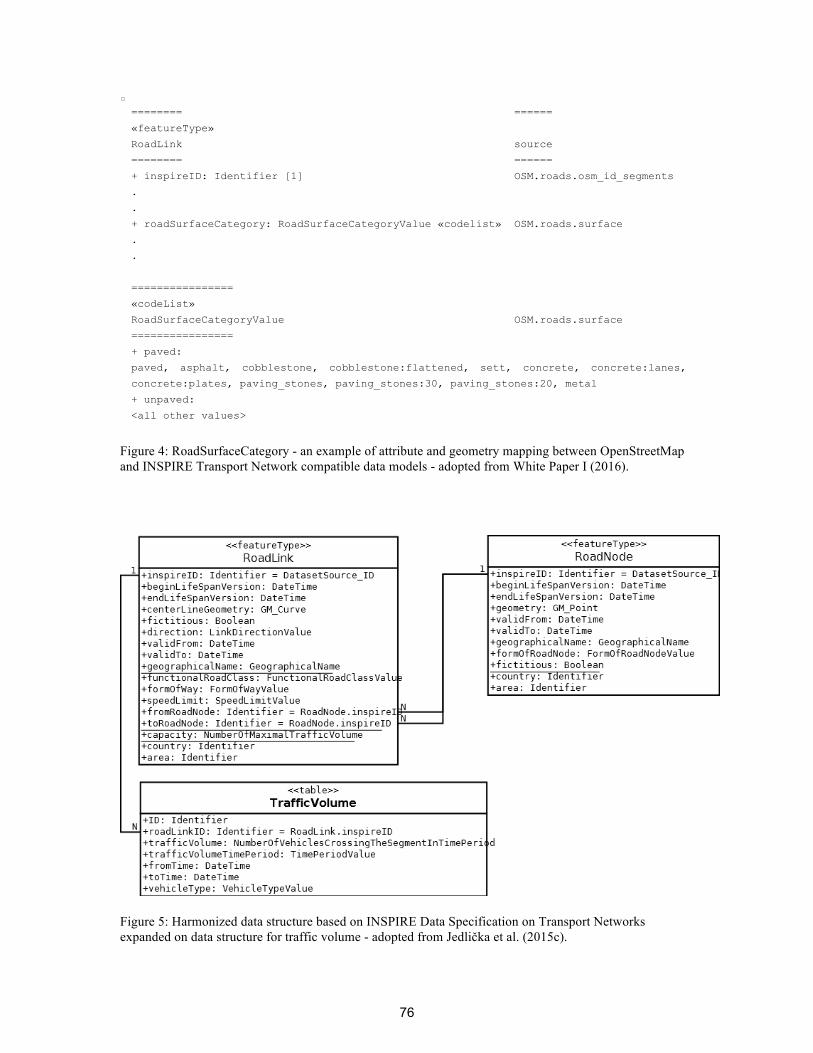
Figure 4: RoadSurfaceCategory - an example of attribute and geometry mapping between OpenStreetMap and INSPIRE Transport Network compatible data models - adopted from White Paper I (2016).
Figure 5: Harmonized data structure based on INSPIRE Data Specification on Transport Networks expanded on data structure for traffic volume - adopted from Jedlička et al. (2015c).
======== ====== «featureType» RoadLink source ======== ====== + inspireID: Identifier [1] OSM.roads.osm_id_segments . . + roadSurfaceCategory: RoadSurfaceCategoryValue «codelist» OSM.roads.surface . . ================ «codeList» RoadSurfaceCategoryValue OSM.roads.surface ================ + paved: paved, asphalt, cobblestone, cobblestone:flattened, sett, concrete, concrete:lanes,
concrete:plates, paving_stones, paving_stones:30, paving_stones:20, metal + unpaved: <all other values>
76
Traffic volume and capacity calculation
The next phase is to enrich the data with information about the traffic volumes and other crucial information and attributes which are necessary in the projects, which use OTM as a data source.
As stated in Jedlička et al. (2015b), in addition to the routing functionality (calculation of the optimal path), there is a need to predict traffic volumes for better pathfinding. In order to compute traffic volumes, there is a need to have a well described traffic network. Such a traffic network has to be topologically clean and consistent – to allow routing (which is already accomplished in our case thanks to the conversion process performed earlier).
Traffic volume is defined as a parameter of the road network which describes the amount of vehicles going through a network segment in a certain time period. Together with an information about the maximum capacity of the network segments, it can be forecasted where and when the volume of traffic is going to increase and cause traffic disruptions and traffic jams. There can be distinguished several types of short term traffic volumes based on an hour of a day / a day of a week / a month or a season of a year. There could be calculated also long term traffic volumes, which are based on decades. The calculation of traffic volumes is based on a mathematical model showing the distribution functions of vehicles on different road classes. In Jedlička et al. (2015b) a methodology for traffic volume predictions is described in more detail, including the distribution functions used for the modeling of the traffic volume.
The process of the traffic volume calculation is based on several stages. The first two stages are performed in a Geographical Information System (GIS), because they deal with spatial tasks. Then the stage of traffic volume calculation itself is realized in a transport engineering software in three other steps. The GIS based stages are:
• The road network topology and consistency has to be checked (deleting pseudo-nodes, cleaning gaps and overlaps). Then junctions are computed and turns are defined. Well defined and topologically correct road network is the fundamental constraining graph structure, which describes the allowed movements between different places;
• As a traffic generator (see the next bullet for its definition) does not have to lie exactly on a network segment, a connector from each generator to the nearest network part (junction or segment) is created. The defined crossing with the network represents a point, in which the people enter the network and generate the traffic.
The steps of calculation process in a transport engineering software run on a desktop (the use of a server platform is planned in future – see the chapter Future Works):
• Using the demographic data about traffic generators, various types of traffic volumes are calculated. Traffic generators having the information about
77
the demographic data of a certain area are usually represented as points. These points represent cities, city districts or building blocks – it depends on the granularity of the data and the desired level of detail. The data are used for estimation of traffic flows in the network, based on the process of people moving among the traffic generators (i.e., commuting to the work, going shopping and so on). This step produces relative volumes – it can be visualized which road segment has higher traffic volume than the other;
• Afterwards, those relative volumes are calibrated on absolute values from traffic censuses, i.e. the physical measurements of traffic volumes at particular spots of the traffic network are used for calibration of relative volumes;
• The final step is an export from a transportation software to a GIS, where the data can be visualized or used for further research.
As stated in Jedlička et al. (2015) three profound types of traffic volumes are mainly used and distinguished:
• Annual average of daily traffic volume (AADT);
• Daily traffic volume (different for each day from Monday to Sunday);
• Hourly variations of traffic volume (incl. peak hour traffic volume – in the busiest hour of the day).
Also a long term predictions can be made (using a mathematical traffic model) calculating the traffic volumes 10, 20 or even 30 years into the future. See more in EDIP (2012) or Kozhukh et al. (2015).
The transport engineering software OmniTrans was used for the calculation of the traffic volumes, see OmniTRANS (2015) for more information about this software. This software is able to calculate data of the smaller area (such a small country), but it is not suitable for larger area (such as the whole Europe) because this is a desktop application and the computing speed is limited by the specifications of the computing PC. More information about the process of calculation can be found in Jedlička et al. (2015b).
Another incorporated information in the OTM is the information about the capacity of a road segment. This capacity is based on the class of a road at the moment. Clearly, a road of a higher road class (e.g., highway) has higher capacity than a road of a lower road class (e.g., fourth class road). The further development in the estimation of roads’ capacity will be in an incorporation of other variables than just the road class one. These variables could be a curvature of a road segment, a number of lines, a width of lines and so on.
The visualization of traffic volumes together with the capacity of a road segment is described in the next chapter.
78
Open Transport Map visualization
The visualization of traffic volumes, respectively traffic flows, is based on the essentiality of the data, because the temporal aspects of spatial data need to be shown. The research on this topic is mentioned in chapter 2 of Jedlička et al. (2015) in detail. In chapter 6 of Jedlička et al. (2015) are also described two porotypes of traffic volume visualization based on WebGL library for a map rendering and on KML format and its styles options.
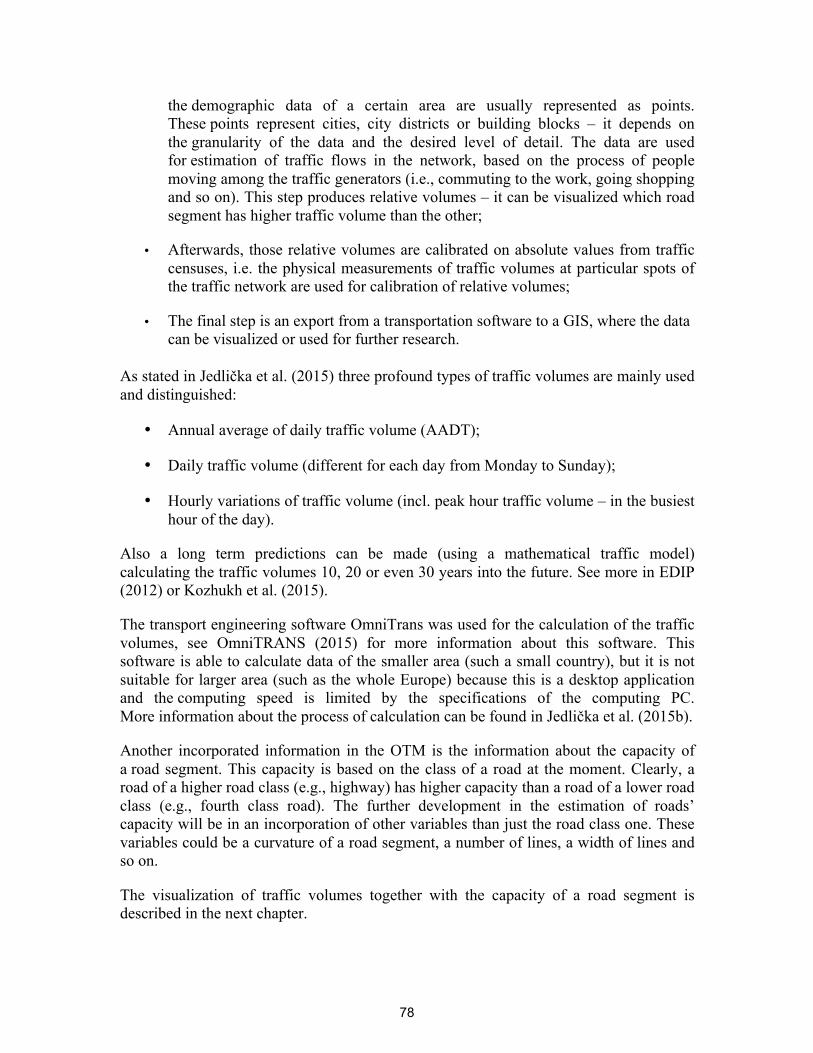
The contemporary visualization used in OTM is based on traffic flow parameters (such as road capacity, volume of traffic or traffic flow speed), see Veeckman et al. (2015) for more information. Their dependence and the visualization of such a dependence is shown in Figure 6.
Figure 6: Visualizing on the base of traffic flow parameters relation in a graph – adopted from Jedlička et al. (2015d).
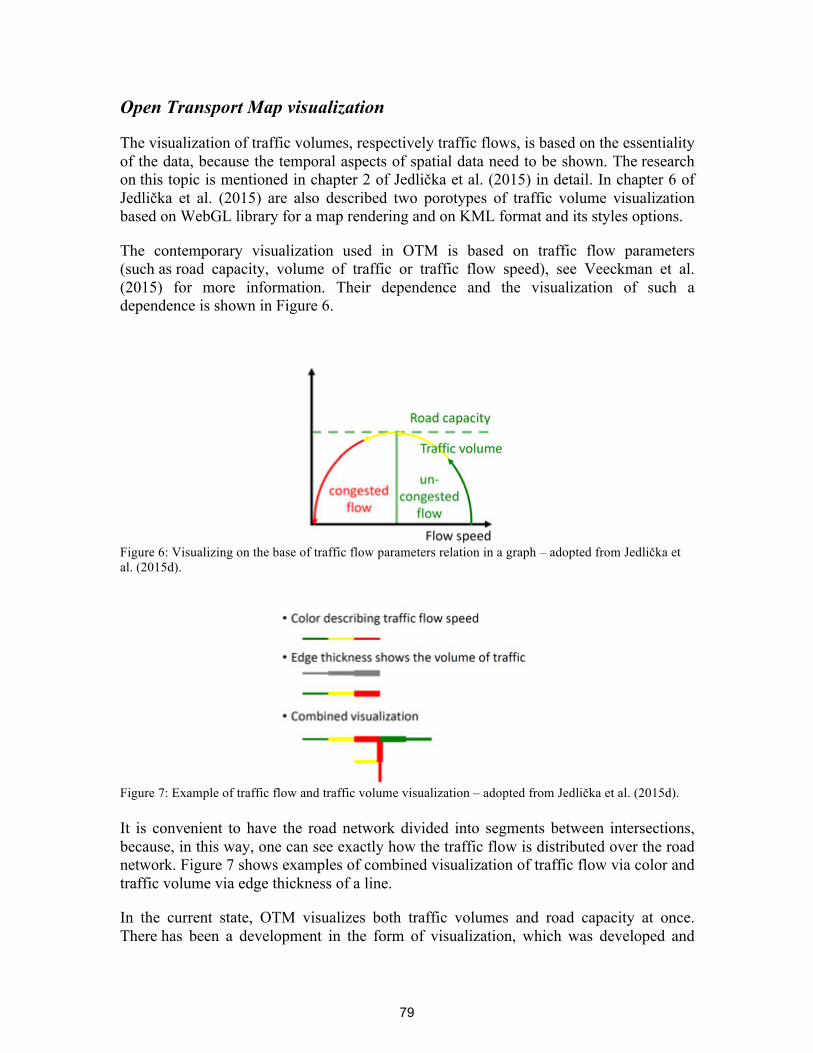
Figure 7: Example of traffic flow and traffic volume visualization – adopted from Jedlička et al. (2015d). It is convenient to have the road network divided into segments between intersections, because, in this way, one can see exactly how the traffic flow is distributed over the road network. Figure 7 shows examples of combined visualization of traffic flow via color and traffic volume via edge thickness of a line.
In the current state, OTM visualizes both traffic volumes and road capacity at once. There has been a development in the form of visualization, which was developed and
79
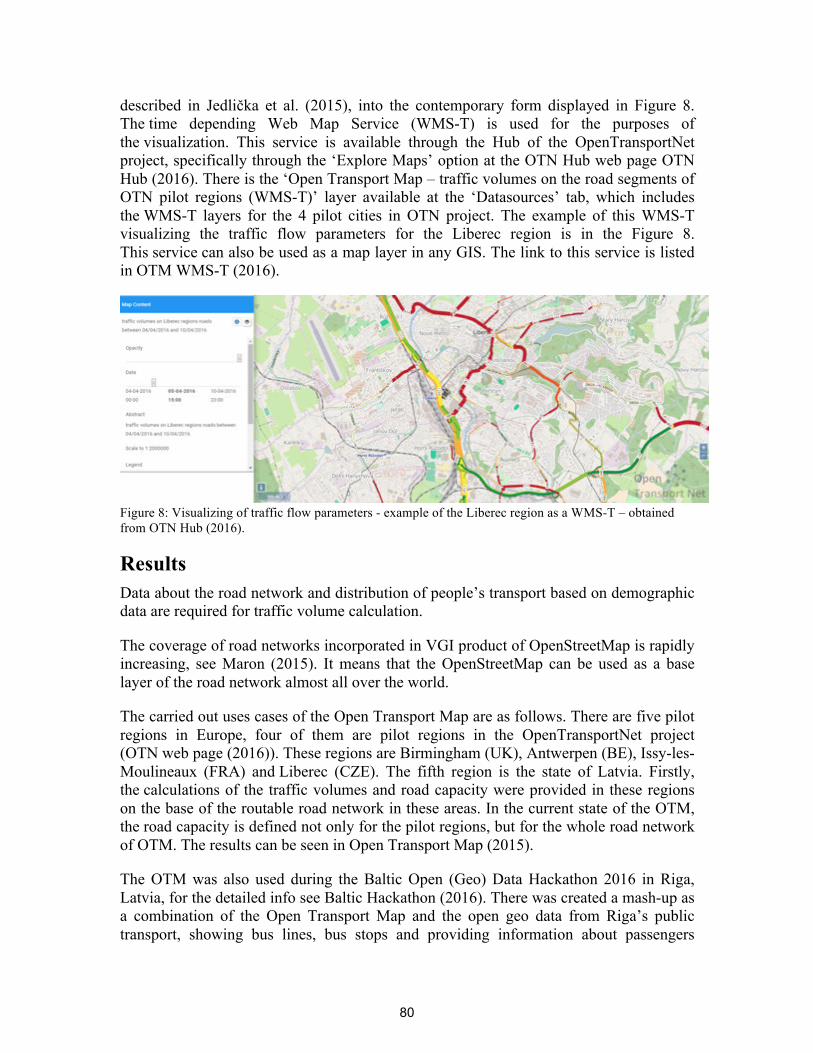
described in Jedlička et al. (2015), into the contemporary form displayed in Figure 8. The time depending Web Map Service (WMS-T) is used for the purposes of the visualization. This service is available through the Hub of the OpenTransportNet project, specifically through the ‘Explore Maps’ option at the OTN Hub web page OTN Hub (2016). There is the ‘Open Transport Map – traffic volumes on the road segments of OTN pilot regions (WMS-T)’ layer available at the ‘Datasources’ tab, which includes the WMS-T layers for the 4 pilot cities in OTN project. The example of this WMS-T visualizing the traffic flow parameters for the Liberec region is in the Figure 8. This service can also be used as a map layer in any GIS. The link to this service is listed in OTM WMS-T (2016).
Figure 8: Visualizing of traffic flow parameters - example of the Liberec region as a WMS-T – obtained from OTN Hub (2016).
Results Data about the road network and distribution of people’s transport based on demographic data are required for traffic volume calculation.
The coverage of road networks incorporated in VGI product of OpenStreetMap is rapidly increasing, see Maron (2015). It means that the OpenStreetMap can be used as a base layer of the road network almost all over the world.
The carried out uses cases of the Open Transport Map are as follows. There are five pilot regions in Europe, four of them are pilot regions in the OpenTransportNet project (OTN web page (2016)). These regions are Birmingham (UK), Antwerpen (BE), Issy-les-Moulineaux (FRA) and Liberec (CZE). The fifth region is the state of Latvia. Firstly, the calculations of the traffic volumes and road capacity were provided in these regions on the base of the routable road network in these areas. In the current state of the OTM, the road capacity is defined not only for the pilot regions, but for the whole road network of OTM. The results can be seen in Open Transport Map (2015).
The OTM was also used during the Baltic Open (Geo) Data Hackathon 2016 in Riga, Latvia, for the detailed info see Baltic Hackathon (2016). There was created a mash-up as a combination of the Open Transport Map and the open geo data from Riga’s public transport, showing bus lines, bus stops and providing information about passengers
80
taking on the buses during a day. The OTM will be also provided for the MEDHackathon in Patras (Greece) in July this year.
The future works
In the current state of the Open Transport Map development, 5 regions in Europe were used as a sample for the traffic volume calculation. To the already mentioned 4 pilot cities from the OTN project, Republic of Latvia (EU Member State) was added during this year to the OTM as a region with the calculated traffic volumes. Those pilot regions of the OTN are high in density of the road network and the area of them is relatively small. The calculation of traffic volumes on the network with less density but covering larger area was performed on the case of Latvia. Anyway, in the next step of the development, using the opportunities of the Hadoop project is going to be deployed. The Apache Hadoop software library is a framework that allows distributed processing of large data sets across clusters of computers using simple programming models. More information can be found in Apache Software Foundation (2014) . Using the cluster of computers will allow to compute the large datasets in a reasonable time and that is a precondition for almost-real time calculating of the traffic volumes based on changing traffic conditions. Anyway, the preliminary tests indicate that the calculation time for the whole European road network takes hours or rather days.
Another variable which is related to the traffic volume, particularly to the road network, is the capacity of a road segment. The capacity of the road segment is not standardized across the Europe or around the World in general. Roads of the same category can vary at the wide of the lanes and number of the lanes. Nevertheless, a value of the capacity of a road segment is already implemented in the calculation. That capacity is based on the class of a road and it is set as a constant value for a road class across the whole used road network. Further, more precise capacity estimation can be derived from the curvature of a road segment, number of lanes, width of lanes, top speed on the road and so on.
Another issue that need to be solved, is the actualization of the OTM. The source data of OpenStreetMap was downloaded at a certain point in time showing the current situation of the data at that time. But the source dataset is continuously under the development. Nevertheless, the process of road building and dismantling is not a matter of weeks, rather months or years, therefore a frequency of the actualization might be set as once per year so far. This is issue of the road network dataset. Another issue is the actualization of demographic data for the calculation of traffic volumes. For the pilot cities are used the latest values of demographic data from 2015 provided by the local governments. But for the whole Europe, the data from Eurostat will be used, rather than obtaining data from each country one by one. The last whole Europe demographic census took a place in 2011, therefore the data are already obsolete, but still useable for our purposes. There is not a rapid changing in demographic situation in Europe so far, thus the data are still relevant. But when the data changes, its actualization should be taken into consideration as well. On the base of these two issues, the recalculation of traffic volumes should be done periodically at a certain point in time.
81
Conclusions The objective of this paper was to introduce the Open Transport Map as an eligible source of information for road transport planning. The possibilities of OpenStreetMap as a source data layer were inspected. Then the open INSPIRE compatible routable data layer of the road network of Europe – OTM – was created on the base of OpenStreetMap. The way of a proper traffic volume calculations were examined as well as the possible forms of traffic volume visualization.
The Open Transport Map is now freely, under Open Data Commons Open Database License (ODbL), available at Open Transport Map (2015). In the current state, it shows the routable road network of the whole Europe with the defined capacity of the all road segments. In the pilot cities of the OpenTransportNet project (Birmingham, Antwerpen, Issy-les-Moulineaux and Liberec) and in the Latvia region, the visualization of traffic volumes based on a color and width of a line describing the traffic flow speed. The further works take a place mainly in further capacity estimation, incorporating other road networks and in the cluster computing of traffic volumes for the larger areas. Another task to be solved is the actualization of the OTM dealing with the spatial and the attribute component of the data.
Acknowledgement This contribution was supported by:
• European project LO1506 of the Czech Ministry of Education, Youth and Sports;
• European project OTN-Open Transport Data CIP-ICT-PSP-PB 620533;
• Project SGS-2016-004 Využití matematiky a informatiky v geomatice III. (Application of Mathematics and Informatics in Geomatics III.).
References About OSM (2015) About the OpenStreetMap (2015) contributors of OpenStreetMap, available
at <http://www.openstreetmap.org/about>
Apache Software Foundation (2014) The Apache Software Foundation (2014) Apache™ Hadoop® web page, available at <https://hadoop.apache.org/>
Baltic Hackathon (2016) Baltic Open (Geo) Data Hackathon 2016, Riga, Latvia, 16–18 March 2016 – convention of programmers or data specialists, more information available at < http://sdi4apps.eu/baltic-open-geo-data-hackathon-2016/>
Čerba (2013) Information Around Us: Questions Connected to Information and Data Heterogeneities in Planning Activities. In Tagungsband / Proceedings Real CORP 2013. Schwechat: www.corp.at,. s. 1-5. ISBN: 978-3-9503110-4-4.
EDIP (2012) TP 189 Stanovení intenzit automobilové dopravy, [Determination of automobile volume of traffic], 2012, ISBN: 978-80-87394-06-9
Feranec et al. (2014) Feranec, J., Solin, L., Kopecka, M., Otahel, J., Kupkova, L., Stych, P.,
82
Bicik, I., Kolar, J., Cerba, O., Soukup, T., Brodsky, L. Analysis and expert assessment of the semantic similarity between land cover classes. In Progress in Physical Geography 2014 vol. 38 (3), p. 301-327. DOI: 10.1177/0309133314532001. (IF = 3,885)
ImpOSM (2016) Imports OpenStreetMap data into PostgreSQL/PostGIS databases, by Omniscale, available at < http://imposm.org/>
Jedlička, K., Ježek, J., Kepka, M., Hájek, P., Mildorf, T., Kolovský, F., Beran, D. (2015a) Dynamic Visualization of Volume of Traffic. In Papers ICC 2015. Brasil: ICA,p. 1-13. ISBN: 978-85-88783-11-9
Jedlička et al. (2015b) Jedlička, K., Mildorf, T., Charvát, K.,Kozhukh, D., Charvát Jr., K., Martolos, J., Šťastný, J. (2015) Benefits of Using Traffic Volumes Described on Examples in the Open Transport Net Project Pilot Regions, In AGRIS Online - Papers in Economics and Informatics, ISSN 1804-1930, VII, 2015, 2, p. 39-46
Jedlička, K., Ježek, J., Mildorf, T. (2015c) OTN D4.4 Data harmonization and integration. OpenTransportNet – Spatially Referenced Data Hubs for Innovation in the Transport. Section. CIP-ICT-PSP-PB 620533. On-line: http://www.opentransportnet.eu/otn/sites/default/files/OTN D4.4 Data Harmonisation and Integration_v1.0.compressed.pdf
Jedlička, K., Ježek, J., Kepka, M., Hájek, P., Mildorf, T., Kolovský, F., Beran, D. (2015d) Dynamic Visualization of Volume of Traffic - presentation, 19th International Conference on Information Systems for Agriculture and Forestry, ISAF 2015, available at < http://www.isaf2015.info/wp-content/uploads/2015/09/Karel-Jedlicka-Dynamic-visualization-of-Traffic-Volume.pdf>
Jedlička, K., Hájek, P., Čada, V., Martolos, J., Šťastný, J.,Beran, D., Kolovský, F., Kozhukh, D. (2016) Open Transport Map - Routable OpenStreetMap, IST-Africa 2016 Conference Proceedings, Paul Cunningham and Miriam Cunningham (Eds), IIMC International Information Management Corporation, ISBN: 978-1-905824-54-0
Kozhukh et al. (2015) Kozhukh, D., Jedlička, K., Mildorf, T., Charvát, K., Charvát K., Jr, Martolos, J., Šťastný, J. (2015) Benefits of Using Traffic Volumes Described on Examples in the Open Transport Net Project Pilot Regions. Agris On-line Papers in Economics and Informatics 06/2015; ISSN 1804-1930 (Volume VII, Number 2, 2015):39-46.
Maron (2015) How complete is OpenStreetMap?, Mikel Maron, November 19 2015, available at https://www.mapbox.com/blog/how-complete-is-openstreetmap/, cited at 04/05/2016
OSM2PO (2015) osm2po - openstreetmap converter and routing engine for java, by Carsten Moeller, available at < http://osm2po.de/>
Open Transport Map (2015) Open Transport Map (2015) Developed in projects OpenTransportNet, SDI4Apps and FOODIE, available at <opentransportmap.info>
OTN web page (2016) Open Transport Net project web page (2016) Open Transport Net project web page available at <http://opentransportnet.eu/>
OpenStreetMap data model (2014) OpenStreetMap data model (2014), available at <https://github.com/OsmSharp/ui/wiki/OpenStreetMap-data-model>
OSMtoOTM (2015) OSMtoOTM mapping scheme for attributes of OpenStreetMap and OTM, available at <http://opentransportmap.info/OSMtoOTM.html>
OmniTRANS (2015) OmniTRANS (2015) the traffic engineering software, information available
83
at <http://www.omnitrans-international.com/en>
OTN Hub (2016) OpenTransportNet Hub available at < http://opentransportnet.eu/>
OTM WMS-T (2016) Dynamic, time related Web Map Service (WMS-T) of Open TransportMap showing Traffic Volumes in pilot cities of OpenTransportNet project, available at < http://gis.lesprojekt.cz/wms/transport/traffic_volumes?SERVICE=WMS&REQUEST=GetCapabilities>
Řezník, T., Charvát, K., Lukas, V., Charvát Jr., K., Horáková, Š., & Kepka, M. (2015) Open Data Model for (Precision) Agriculture Applications and Agricultural Pollution Monitoring.
Veeckman et al. (2015) Veeckman, C., Jedlička, K., De Paepe, D., Kozhukh, D., Kafka, Š. (2015). OTN D7.3 DATA HARMONIZATION & INTEROPERABIILTY. OpenTransportNet – Spatially Referenced Data Hubs for Innovation in the Transport. Section. CIP-ICT-PSP-PB 620533
White Paper I (2016) Deliverable D7.3 DATA HARMONIZATION & INTEROPERABIILTY, project OpenTransportNet IN OPENTRANSPORTNET, available at <https://myminds.be/share/proxy/alfresco/api/node/content/workspace/SpacesStore/35e15e18-f788-4a30-b6fd-eb13fc89446b/OTN%20D7.3%20GI%20Innovation%20White%20paper%20I_v1.0_v1.1.docx>
Karel Jedlička, researcher, Department of Geomatics, Faculty of Applied Sciences, University of West Bohemia, Pilsen, Czech Republic Pavel Hájek, Ph.D. student, Department of Geomatics, Faculty of Applied Sciences, University of West Bohemia, Pilsen, Czech Republic Jan Ježek, researcher, Department of Geomatics, Faculty of Applied Sciences, University of West Bohemia, Pilsen, Czech Republic František Kolovský, student, Department of Geomatics, Faculty of Applied Sciences, University of West Bohemia, Pilsen, Czech Republic Tomáš Mildorf, researcher, Department of Geomatics, Faculty of Applied Sciences, University of West Bohemia, Pilsen, Czech Republic Karel Charvát, Project manager, Czech Center for Science and Society Comp., Prague, Czech Republic Dmitrii Kozhukh, GIS analyst, Help Service – Remote Sensing Comp., Benešov, Czech Republic Jan Martolos, traffic engineer, EDIP Comp., Pilsen, Czech Republic
Jan Šťastný, traffic engineer, EDIP Comp., Pilsen, Czech Republic Daniel Beran, student, Department of Geomatics, Faculty of Applied Sciences, University of West Bohemia, Pilsen, Czech Republic
84