Embed Size (px)
Citation preview

Jean-Pascal van Ypersele ([email protected])

Jean-Pascal van Ypersele ([email protected])

Jean-Pascal van Ypersele ([email protected])
Source: Dr. Pieter Tans, NOAA/ESRL (www.esrl.noaa.gov/gmd/ccgg/trends/)

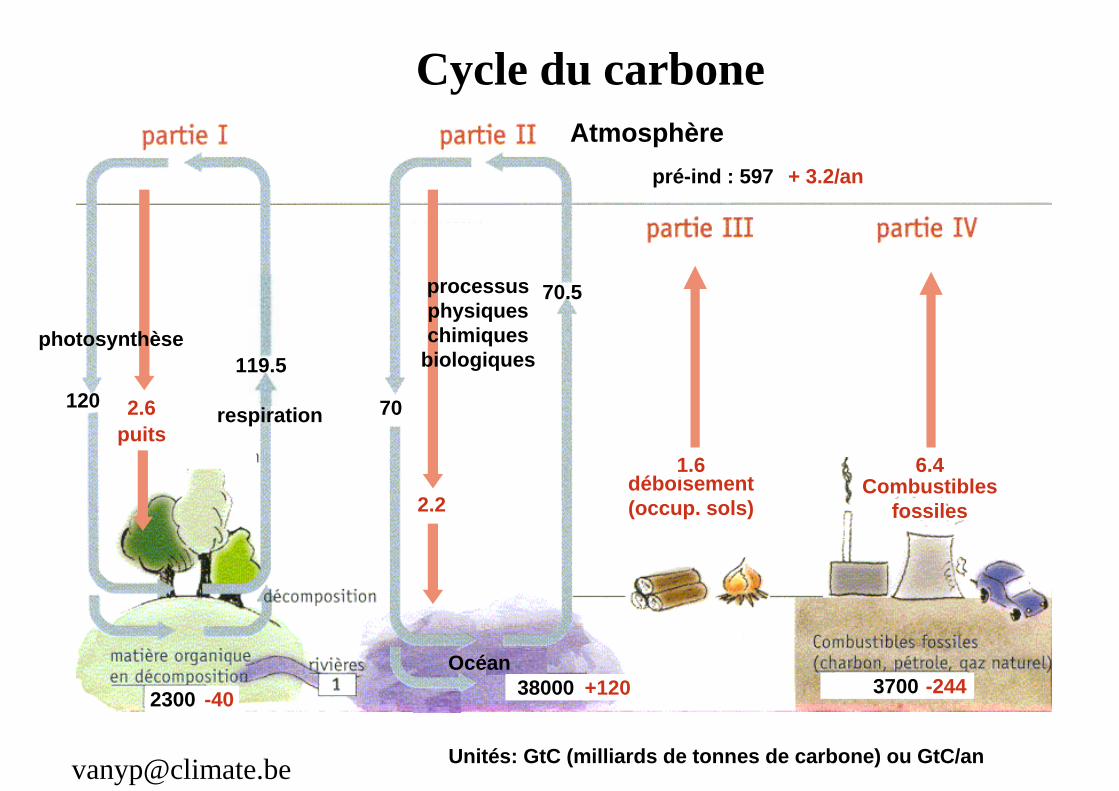
Cycle du carbone
Unités: GtC (milliards de tonnes de carbone) ou GtC/an
120
70.5
70
2300
Atmosphèrepré-ind : 597
38000Océan
3700
respiration
processusphysiqueschimiques
biologiquesphotosynthèse
119.5
Cycle du carbone
Unités: GtC (milliards de tonnes de carbone) ou GtC/an
120
70.5
70
2300
Atmosphèrepré-ind : 597
38000Océan
3700
+ 3.2/an
déboisement(occup. sols)
Combustiblesfossiles
6.4
-244+120-40
1.6puits2.6 respiration
2.2
processusphysiqueschimiques
biologiquesphotosynthèse
119.5

CO2 Concentration in Ice Core Samples andProjections for Next 100 Years
150
200
250
300
350
400
450
500
550
600
650
700
Years Before Present
Vostok RecordIPCC IS92a ScenarioLaw Dome RecordMauna Loa Record
Current(2001)
Projected(2100)
0100,000200,000300,000400,000
(BP 1950)
Projected (2100)
Current (2001)
CO 2
Con
cent
ratio
n (p
pmv)
Les niveaux attendus du CO2atmosphérique pendant les 100
prochaines années sont supérieurs à ce
qu’ils ont toujours étéau cours des 440 000
dernières années
Expected CO2-concentrations are higher than observed at any time
over last 800 000 years
2007
Projection (2100)

A climate model:
Source: McGuffie & Henderson-Sellers (1997)

Jean-Pascal van Ypersele ([email protected])
Jean-Pascal van Ypersele ([email protected])

Jean-Pascal van Ypersele ([email protected])
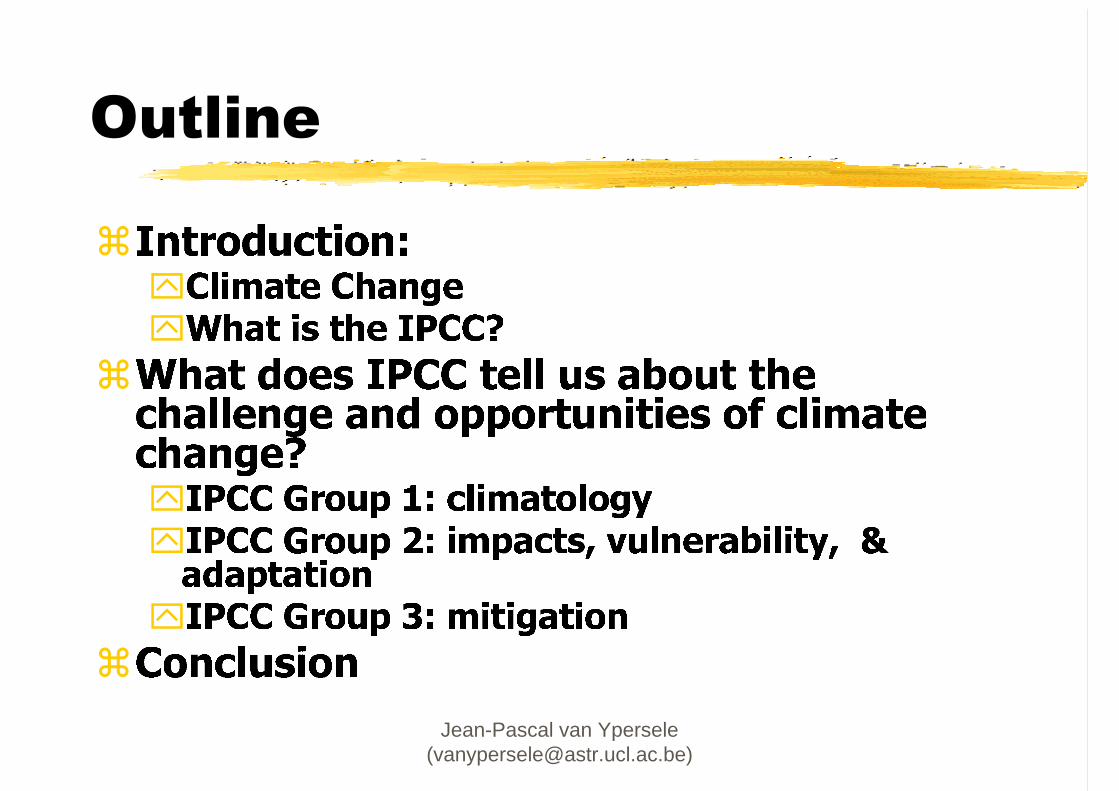
IPCC : Intergovernmental Panel on Climate ChangeCreated by World Meteorological Organisation (WMO) & United Nations Environment Programme (UNEP) in 1988 Mandate : assess the science of climate change, impacts and adaptation, mitigation options Publishes consensus reports (1990, 1996, 2001, 2007) (Cambridge University Press) Advises Climate Change ConventionNobel Peace prize (2007)Web :

Jean-Pascal van Ypersele ([email protected])

Jean-Pascal van Ypersele ([email protected])
Jean-Pascal van Ypersele ([email protected])

Jean-Pascal van Ypersele ([email protected])
IPCC - WGI
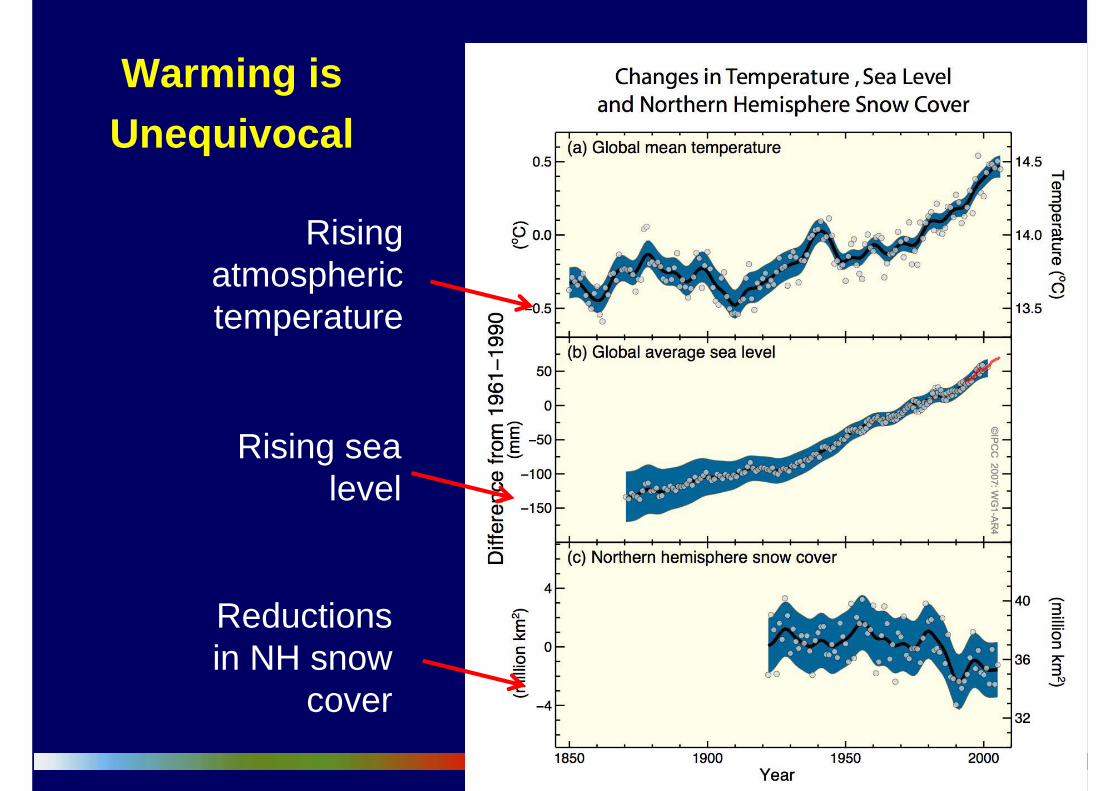
Warming is Unequivocal
Rising atmospheric temperature
Rising sea level
Reductions in NH snow
cover

are observed changes
consistent with expected responses to forcings?inconsistent with alternative explanations?
Observations
All forcing
Solar+volcanic

IPCC - WGI
Understanding and Attributing Climate Change
Most of the observed increase in globally averaged temperatures since the mid-20th century is very likely (>90%) due to the observed increase in anthropogenic greenhouse gas concentrations.
This is an advance since the TAR’s conclusion that “most of the observed warming over the last 50 years is likely (>66%) to have been due to the increase in greenhouse gas concentrations”. .

Jean-Pascal van Ypersele ([email protected])
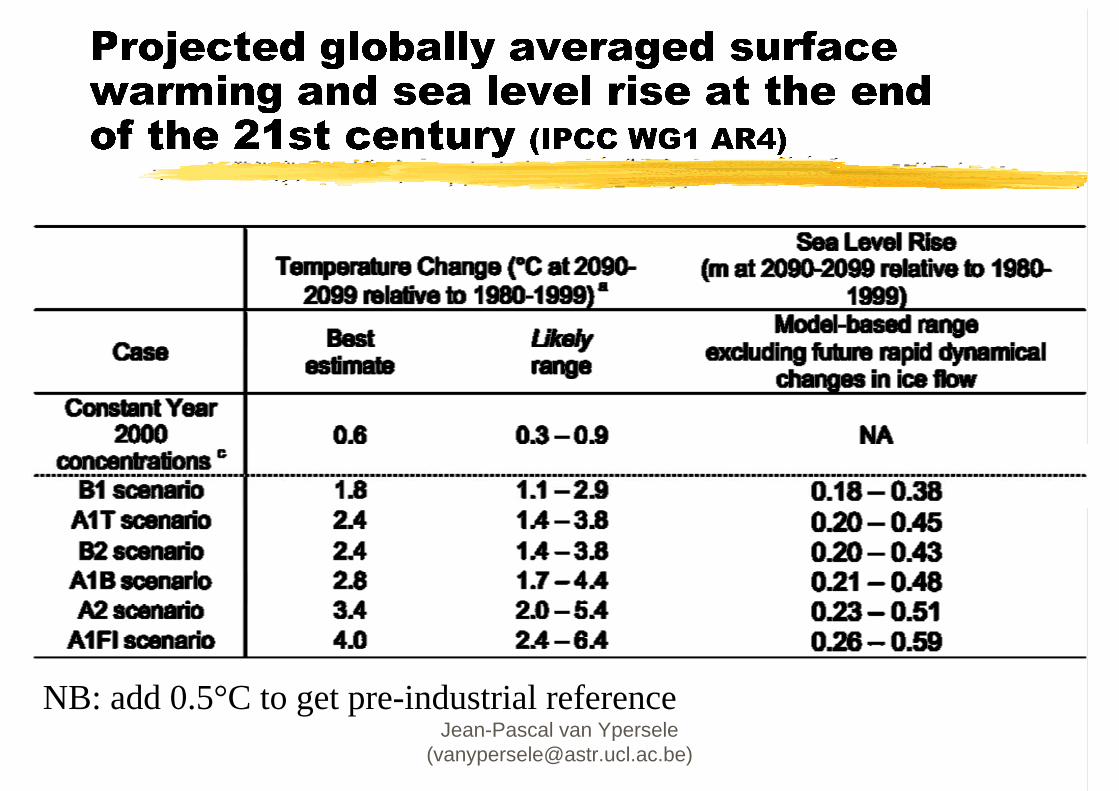
Source: IPCC, AR4 (2007)
NB: écart par rapport à la moyenne 1980-1999

Virtually certain > 99%, very likely > 90%, likely > 66%, more likely than not > 50%
Post 1960 21th century
Jean-Pascal van Ypersele ([email protected])


TP Figure 3.4: Ensemble mean change of annual runoff, in percent, between present (1980-1999) and 2090-2099 for the SRES A1B emissions scenario (based on Milly et al., 2005).
Water at the end of the 21st century for SRES A1B


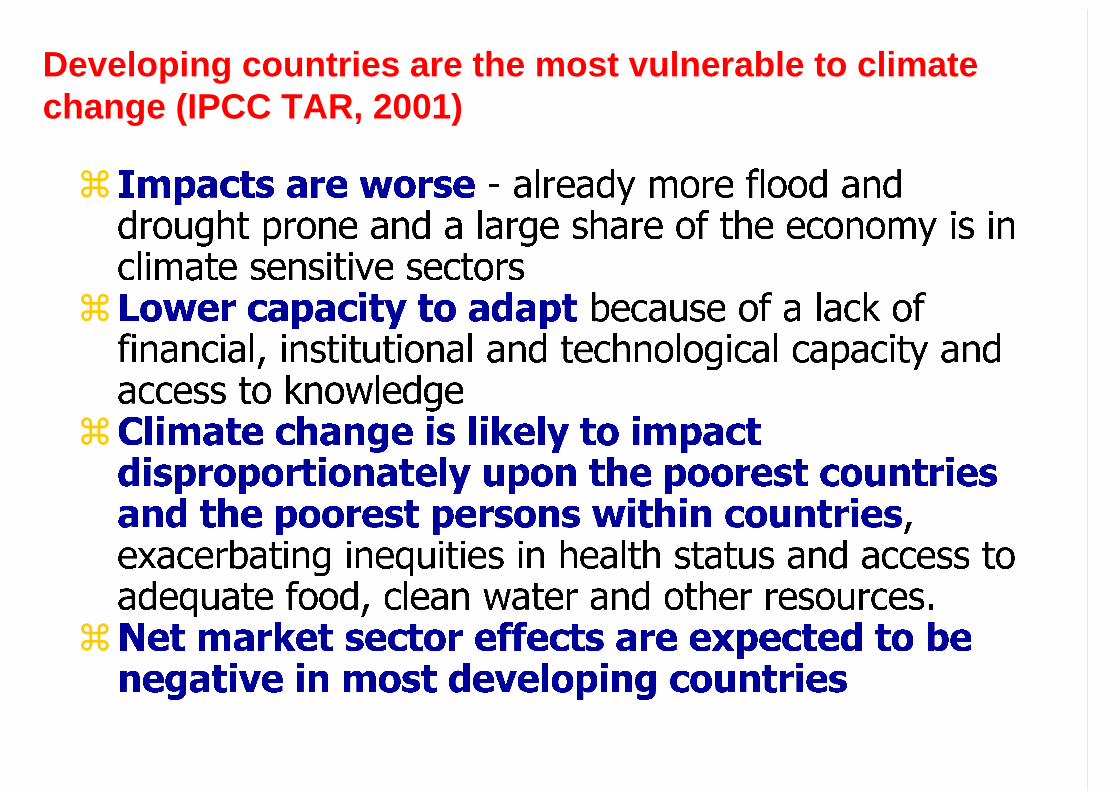
Developing countries are the most vulnerable to climate change (IPCC TAR, 2001)


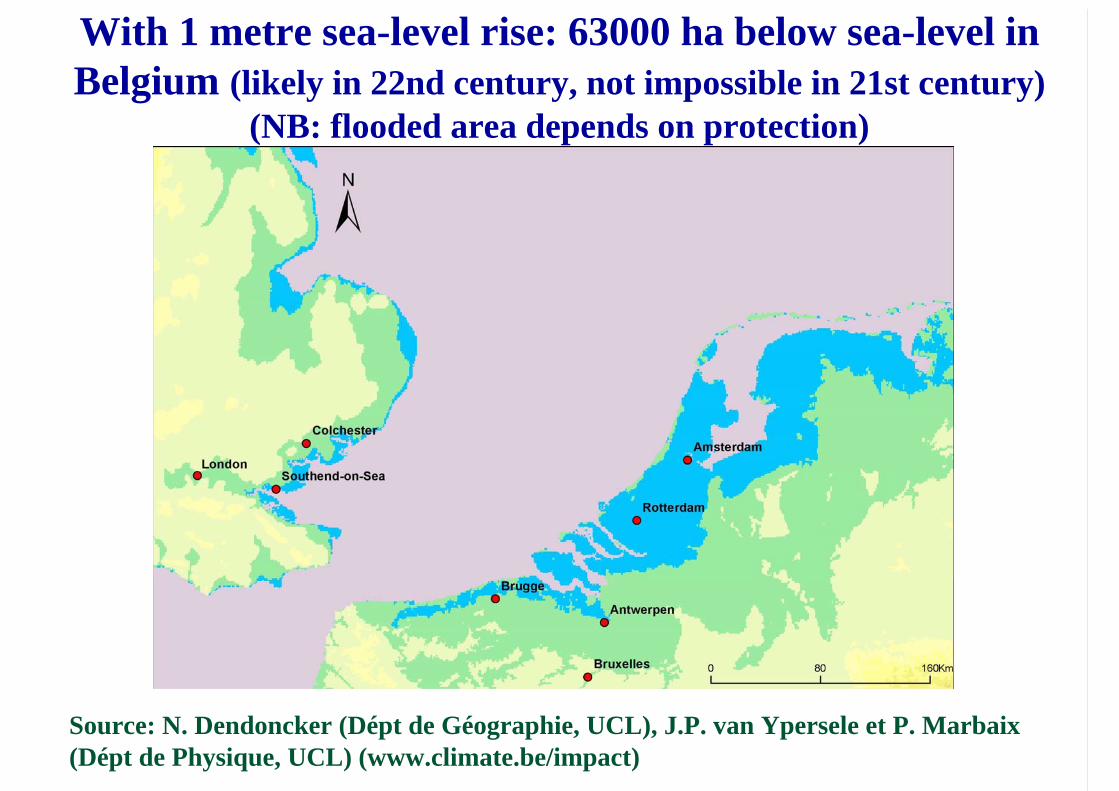
With 1 metre sea-level rise: 63000 ha below sea-level in Belgium (likely in 22nd century, not impossible in 21st century)
(NB: flooded area depends on protection)
Source: N. Dendoncker (Dépt de Géographie, UCL), J.P. van Ypersele et P. Marbaix (Dépt de Physique, UCL) (www.climate.be/impact)

With 8 metre sea-level rise: 3700 km2 below sea-level in Belgium (very possible in year 3000)
(NB: flooded area depends on protection)
Source: N. Dendoncker (Dépt de Géographie, UCL), J.P. van Ypersele et P. Marbaix (Dépt de Physique, UCL) (www.climate.be/impact)

Tens of millions of people are projected to be at risk of being displaced by sea level rise
Assuming 1990s Level of Flood Protection
Source: R. Nicholls, Middlesex University in the U.K. Meteorological Office. 1997. Climate Change and Its Impacts: A Global Perspective.


I Risks to unique and threatened systemsII Risks from extreme climate eventsIII Distribution of ImpactsIV Aggregate ImpactsV Risks from large-scale discontinuities
Source: IPCC TAR WGII, 2001

Jean-Pascal van Ypersele ([email protected])
IPCC
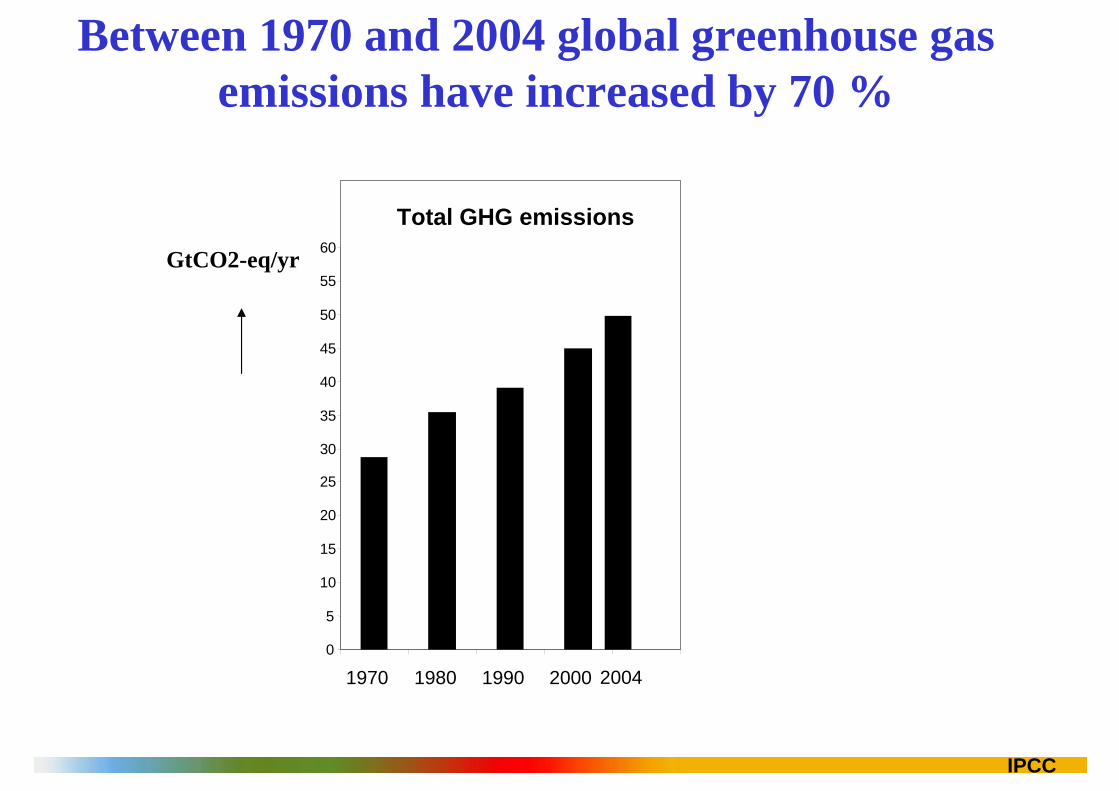
Between 1970 and 2004 global greenhouse gas emissions have increased by 70 %
Total GHG emissions
0
5
10
15
20
25
30
35
40
45
50
55
60
1970 1980 1990 2000 2004
GtCO2-eq/yr
IPCC
IPCC
Equi
libriu
m g
loba
l mea
n te
mpe
ratu
rein
crea
se o
ver
prei
ndus
tria
l(°C
)
GHG concentration stabilization level (ppmv CO2-eq)
Equi
libriu
m g
loba
l mea
n te
mpe
ratu
rein
crea
se o
ver
prei
ndus
tria
l(°C
)
GHG concentration stabilization level (ppmv CO2-eq)
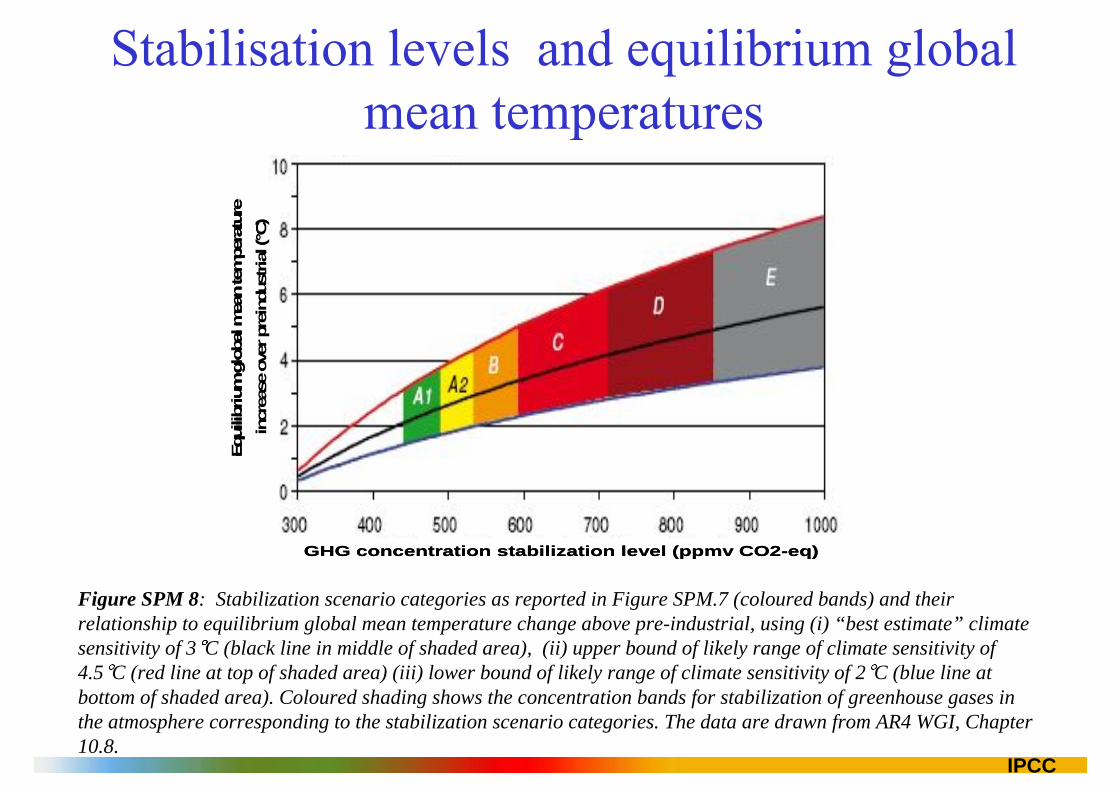
Figure SPM 8: Stabilization scenario categories as reported in Figure SPM.7 (coloured bands) and their relationship to equilibrium global mean temperature change above pre-industrial, using (i) “best estimate” climate sensitivity of 3 C (black line in middle of shaded area), (ii) upper bound of likely range of climate sensitivity of 4.5 C (red line at top of shaded area) (iii) lower bound of likely range of climate sensitivity of 2 C (blue line at bottom of shaded area). Coloured shading shows the concentration bands for stabilization of greenhouse gases in the atmosphere corresponding to the stabilization scenario categories. The data are drawn from AR4 WGI, Chapter 10.8.

IPCC
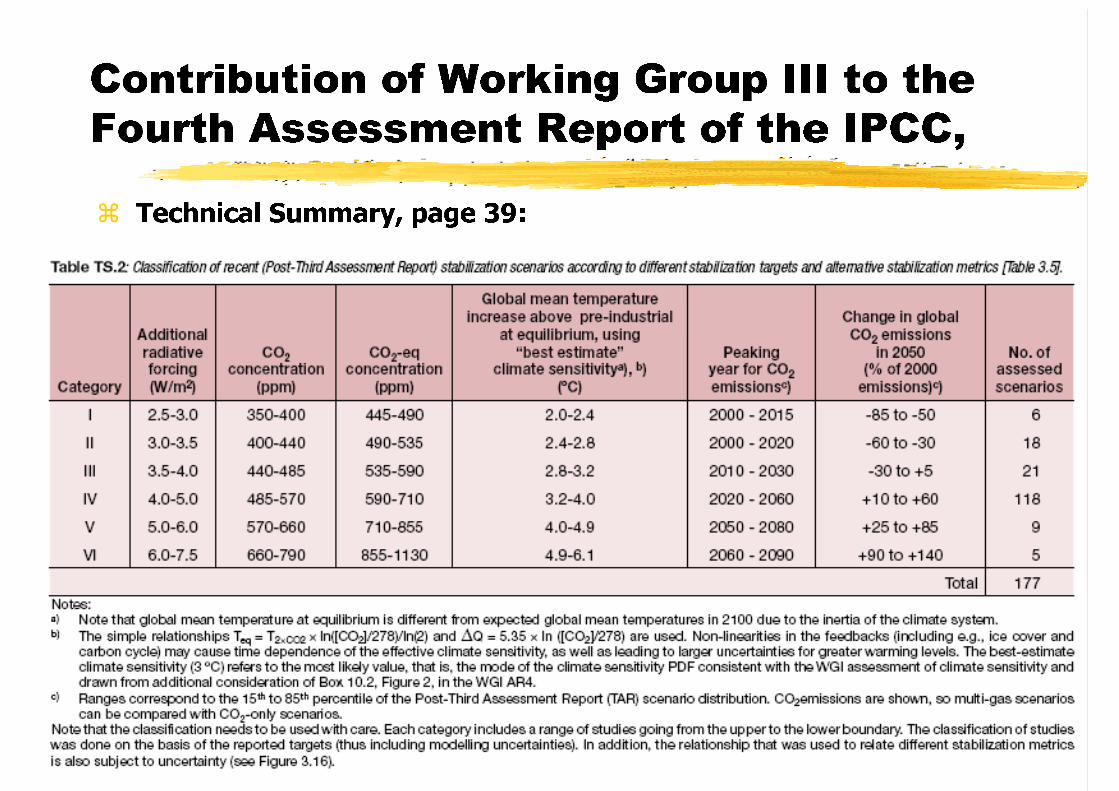
+90 to +1402060 - 20904.9 – 6.1855 – 1130
+25 to +852050 - 20804.0 – 4.9710 – 855
+10 to +602020 - 20603.2 – 4.0590 – 710
-30 to +52010 - 20302.8 – 3.2535 – 590
-60 to -302000 - 20202.4 – 2.8490 – 535
-85 to -502000 - 20152.0 – 2.4445 – 490
Reduction in 2050 compared to 200Year CO2 needs to peak
Global Mean temp. increase at equilibrium (ºC)
Stab level (ppm CO2-eq)
•The lower the stabilization level, the more quickly emissions would need to peak and to decline thereafter•Mitigation efforts over the next two to three decades will have a large impact on opportunities to achieve lower stabilization levels

IPCC
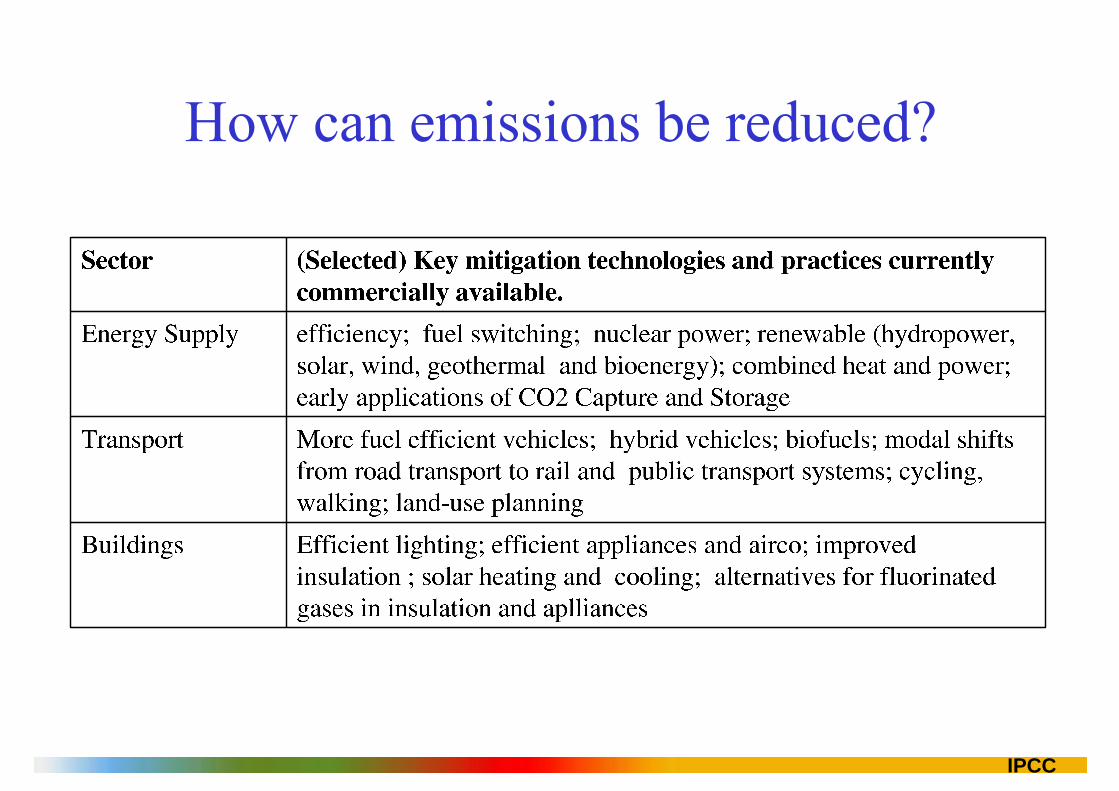
Note: estimates do not include non-technical options, such as lifestyle changes.
IPCC

IPCC

IPCC
• Changes in occupant behaviour, cultural patterns and consumer choice in buildings.
• Reduction of car usage and efficient driving style, in relation to urban planning and availability of public transport
• Staff training, reward systems, regular feedback and documentation of existing practices in industrial organizations

IPCC
< 0.12< 3Not available445-535[4]
<0.10.2 – 2.50.6535-590
< 0.06-0.6 – 1.20.2590-710
Reduction of average annual GDP growth
rates [3](percentage points)
Range of GDP reduction [2]
(%)
MedianGDP
reduction[1](%)
Stabilization levels
(ppm CO2-eq)
[1] This is global GDP based market exchange rates.[2] The median and the 10th and 90th percentile range of the analyzed data are given.[3] The calculation of the reduction of the annual growth rate is based on the average reduction during the period till 2030
that would result in the indicated GDP decrease in 2030.[4] The number of studies that report GDP results is relatively small and they generally use low baselines.

IPCC
GDP without mitigation
GDP withstringent mitigation
GDP
Time
80%
current
77%
~1 year

IPCC
• Near–term health benefits from reduced air pollutionmay offset a substantial fraction of mitigation costs
• Mitigation can also be positive for: energy security, balance of trade improvement, provision of modern energy services to rural areas and employment
BUT• Mitigation in one country or group of countries could
lead to higher emissions elsewhere (“carbon leakage”) or effects on the economy (“spill-over effects”).

IPCC

IPCC
• Notable achievements of the UNFCCC/Kyoto Protocol that may provide the foundation for future mitigation efforts: – global response to the climate problem,– stimulation of an array of national policies,– the creation of an international carbon market and – new institutional mechanisms
• Future agreements:– Greater cooperative efforts to reduce emissions will help to
reduce global costs for achieving a given level of mitigation, or will improve environmental effectiveness
– Improving, and expanding the scope of, market mechanisms (such as emission trading, Joint Implementation and CDM) could reduce overall mitigation costs

IPCC
• Making development more sustainable by changing development paths can make a major contribution to climate change mitigation
• Macroeconomic policy, agricultural policy, multilateral development bank lending, insurance practices, electricity market reform, energy security policy and forest conservation can significantly reduce emissions.
• Implementation may require resources to overcome multiple barriers.
• Possibilities to choose and implement mitigation options to realise synergies and avoid conflicts with other dimensions of sustainable development.

Jean-Pascal van Ypersele ([email protected])
WEHAB Working Group, August 2002)
Some 1.7–2 billion people in the world, mostly in rural areas, have no access to electricity; a further 2 billion are severelyundersupplied.One-third of the world relies on traditionalfuels—wood, dung and agricultural residues—to meet their daily heating and cooking needs.

Jean-Pascal van Ypersele ([email protected])
WEHAB Working Group, August 2002)
The world’s billion poorest people use only 0.2 tonnes of oil-equivalent energyper capita annually, while the billion richest—earning on average over US$20,000 a year—use nearly 25 times as much.World energy systems are responsible for more than half the greenhouse gasemissions due to human activities; most of these emissions are due to fossil fuel use.

Jean-Pascal van Ypersele ([email protected])
WEHAB Working Group, August 2002)
Five key issues are:access to energy and modern energyservices,energy efficiency,renewable energy,advanced fossil-fuel technologies andenergy and transport.

0
2
4
5
7
1890 1950 2010 2050 2090
Years
t C x 10 9
North South
Kyoto Protocol
Source : Sivan Kartha et al, 1998
North +
Southcarbon
emissions
450 ppmvstabilization
scenario
II.3 THE KYOTO PROTOCOL
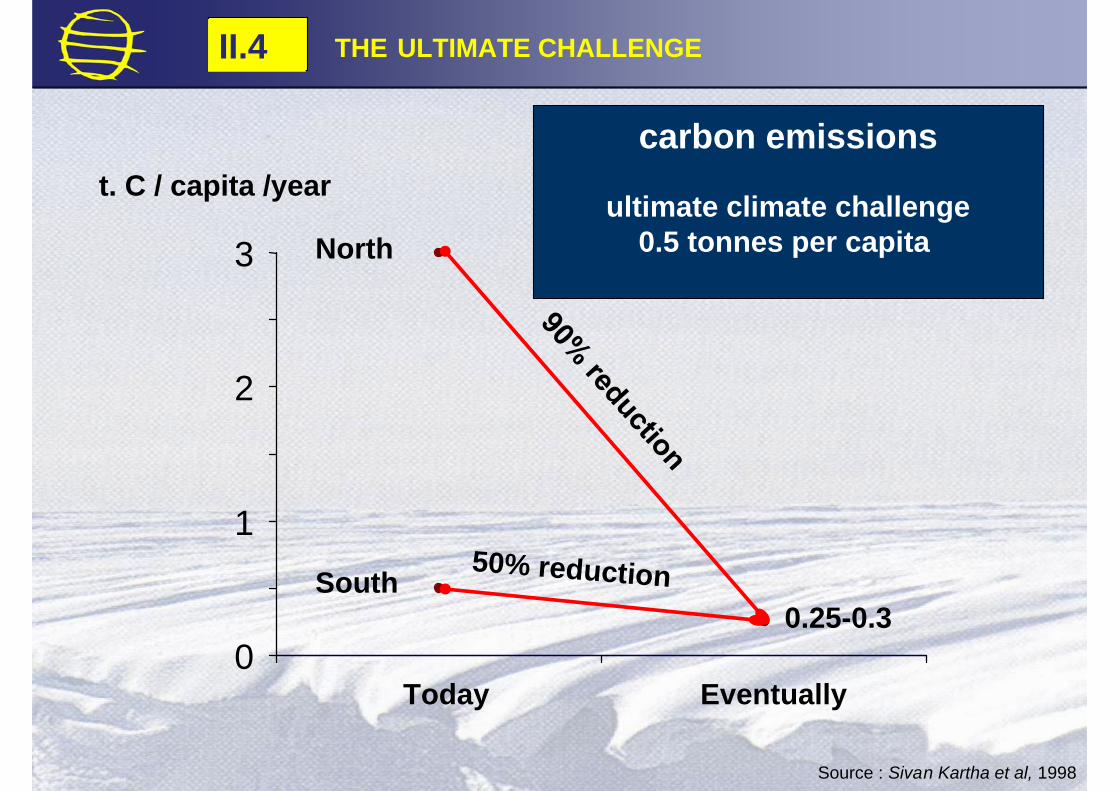
0
1
2
3
Today Eventually
t. C / capita /year
50% reductionSouth
North
0.25-0.3
Source : Sivan Kartha et al, 1998
carbon emissions
ultimate climate challenge0.5 tonnes per capita
II.4 THE ULTIMATE CHALLENGE

Jean-Pascal van Ypersele ([email protected])
Jean-Pascal van Ypersele ([email protected])

Jean-Pascal van Ypersele ([email protected])

Jean-Pascal van Ypersele ([email protected])

Jean-Pascal van Ypersele ([email protected])

Jean-Pascal van Ypersele ([email protected])


![[Base Carbone] Documentation Générale v11.0](https://img.pdfslide.us/doc/110x75/56d6bdf31a28ab30168ff8ce/base-carbone-documentation-generale-v110.jpg)