Embed Size (px)
Citation preview
JDD CONSULTANTS
ANALYSIS OF THE
PEB 2015 EXAM RESULTS
[MARCH 2016]
Candidate numbers
• Foundation Certificate (FC) papers: the number of candidates ranged from 38 on FC5 to 55 on FC1 and, overall, were up by 30% on 2014 (Figure 1).
• Final Diploma (FD) papers:the number of candidates ranged from 102 on FD3 to 201 on FD4 and, overall, were down by 8% on 2014 (Figure 1).
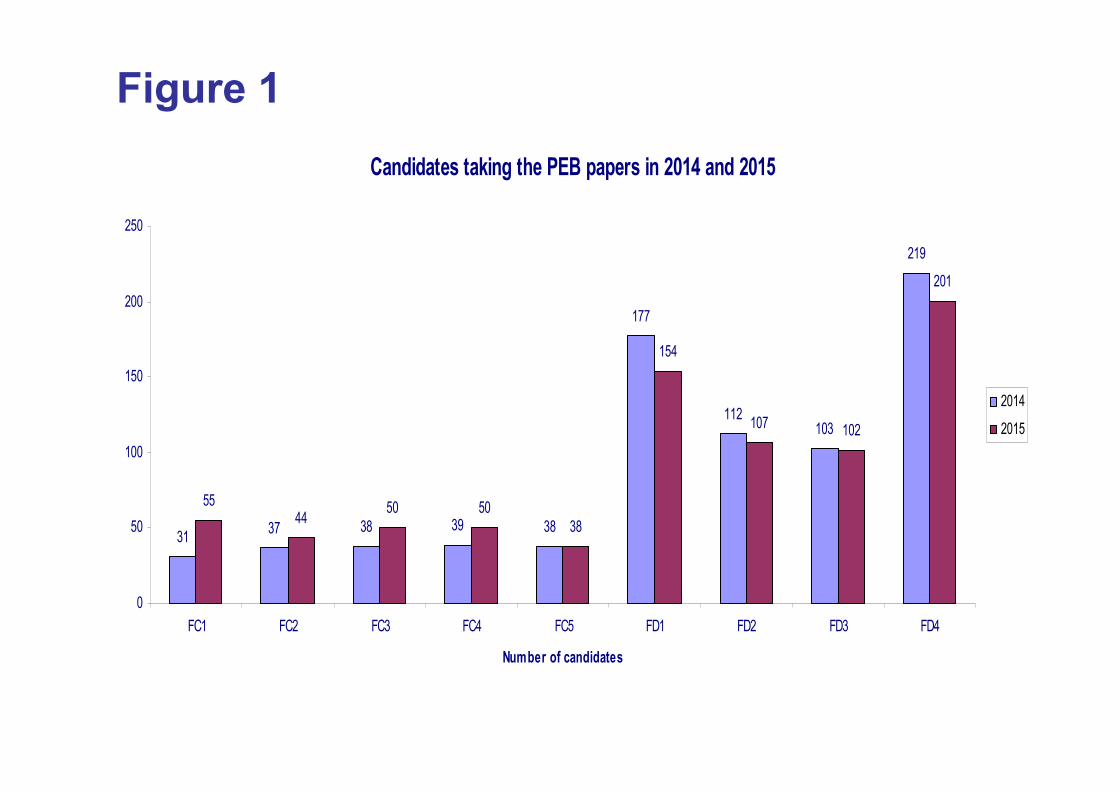
Figure 1
Candidates taking the PEB papers in 2014 and 2015
3137 38 39 38
177
112103
219
5544
50 50
38
154
107 102
201
0
50
100
150
200
250
FC1 FC2 FC3 FC4 FC5 FD1 FD2 FD3 FD4
Number of candidates
2014
2015
Pass rates
• FC papers:
pass rates rose for the FC2 (Law), FC3 (P5) and
FC4 (D&C) papers and remained stable (and
high) for FC1 (P1) and FC5 (P7) (Figure 2).
• FD papers:
pass rates fell for the FD1 (P2), FD2 (P3) and
FD4 (P6) papers and were stable for FD3 (P4)
(Figure 3).
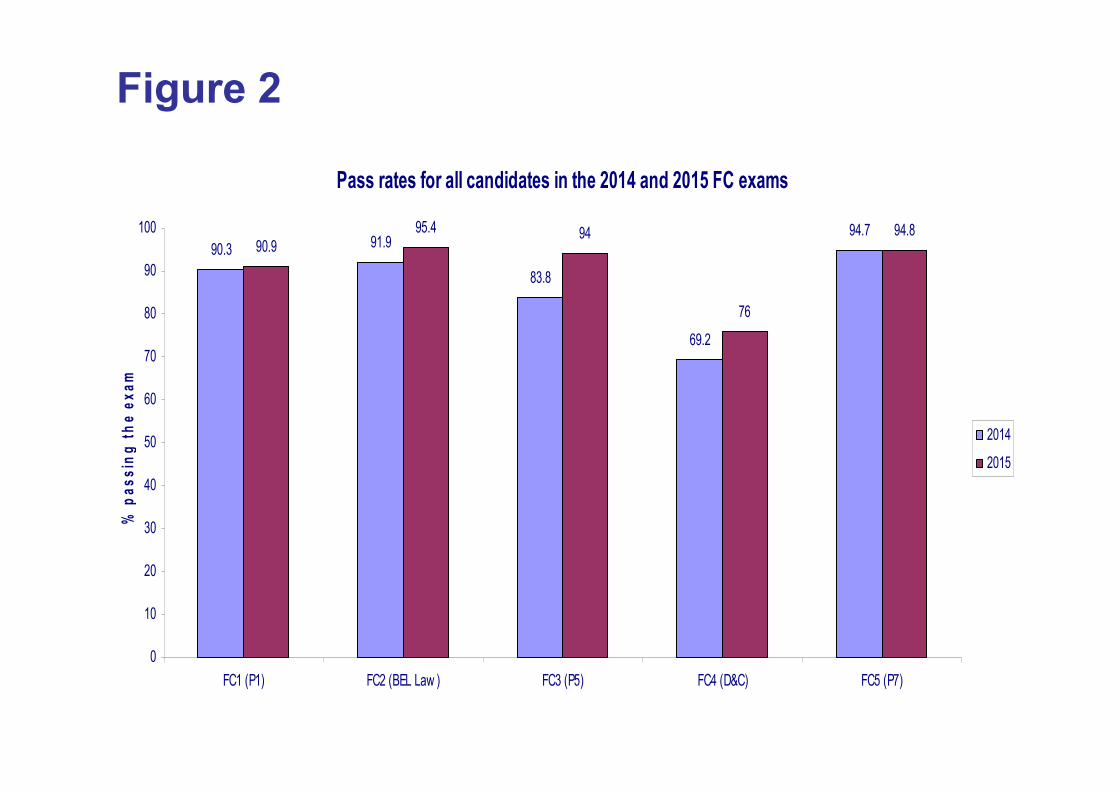
Figure 2
Pass rates for all candidates in the 2014 and 2015 FC exams
90.3 91.9
83.8
69.2
94.790.9
95.4 94
76
94.8
0
10
20
30
40
50
60
70
80
90
100
FC1 (P1) FC2 (BEL Law ) FC3 (P5) FC4 (D&C) FC5 (P7)
% p
as
sin
g t
he
ex
am
2014
2015
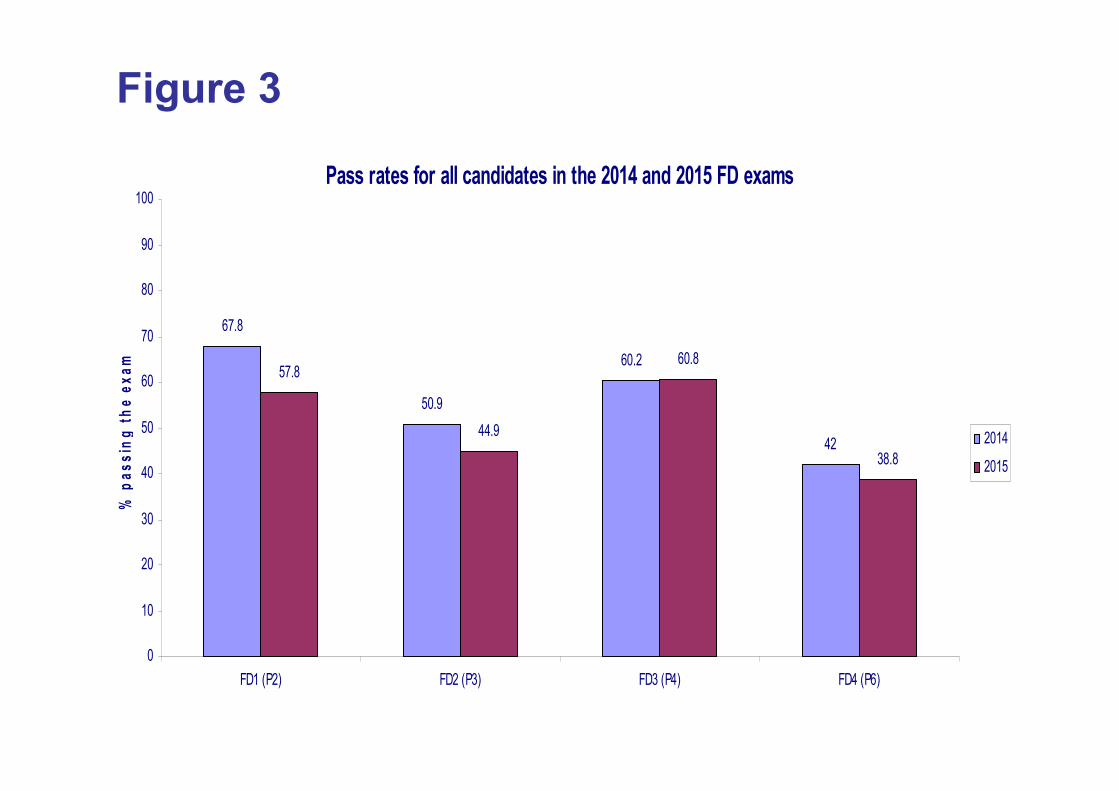
Figure 3
Pass rates for all candidates in the 2014 and 2015 FD exams
67.8
50.9
60.2
42
57.8
44.9
60.8
38.8
0
10
20
30
40
50
60
70
80
90
100
FD1 (P2) FD2 (P3) FD3 (P4) FD4 (P6)
% p
as
sin
g t
he
ex
am
2014
2015
Trends in FC pass rates
• Pass rates have always been very high for
FC1, FC3 and FC5, but have improved
over recent years for FC2 (English Law)
and FC4 (D&C) (Figure 4).
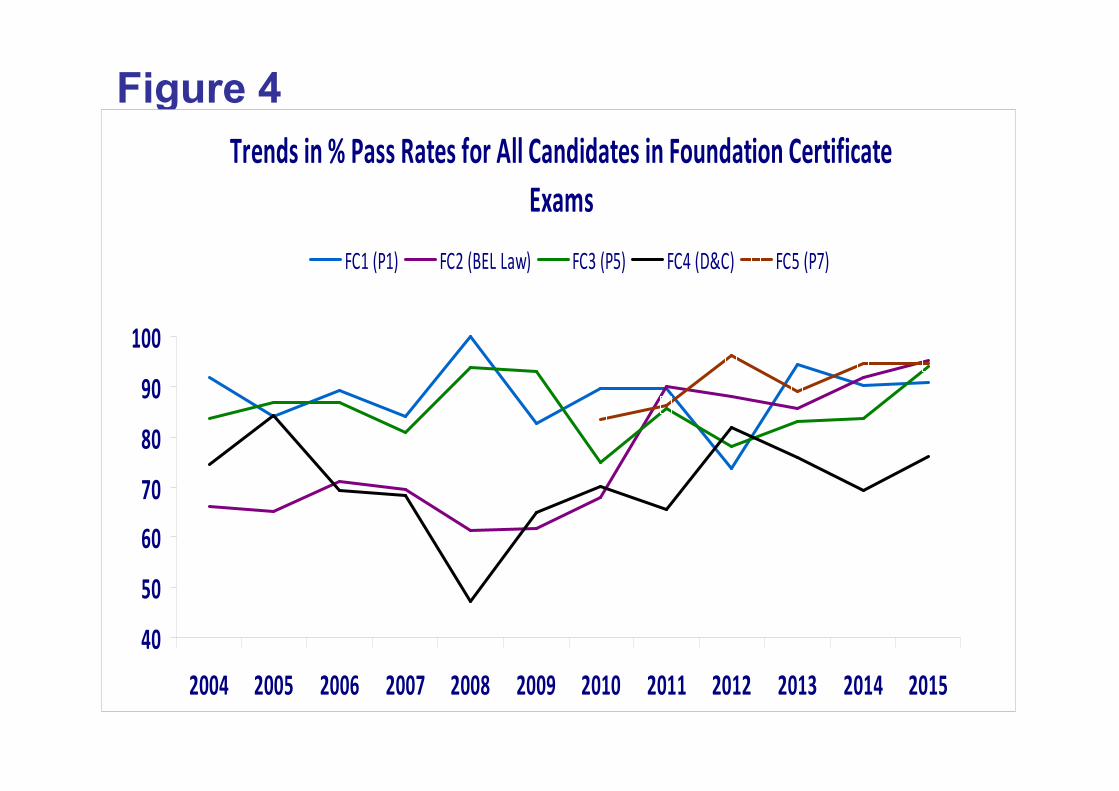
Figure 4
Trends in % Pass Rates for All Candidates in Foundation Certificate
Exams
40
50
60
70
80
90
100
2004 2005 2006 2007 2008 2009 2010 2011 2012 2013 2014 2015
FC1 (P1) FC2 (BEL Law) FC3 (P5) FC4 (D&C) FC5 (P7)
Trends in FD pass rates
• Year-to-year fluctuations in pass rates have been greater for FD papers (than for FC) (Figure 5).
• For FD1, FD2 and FD3, the long-term trend since 2000 has been an improving pass rate: – for FD1 the average has risen from 48% between 2000-03 to
60% between 2013-15;
– for FD2 from 34% to 52%; and
– for FD3 from 46% to 63% (Figures 6-8).
• For FD4, there has been no real upward trend: the 39% passing, on average, between 2000-03 and 41% between 2013-15 (Figure 9).
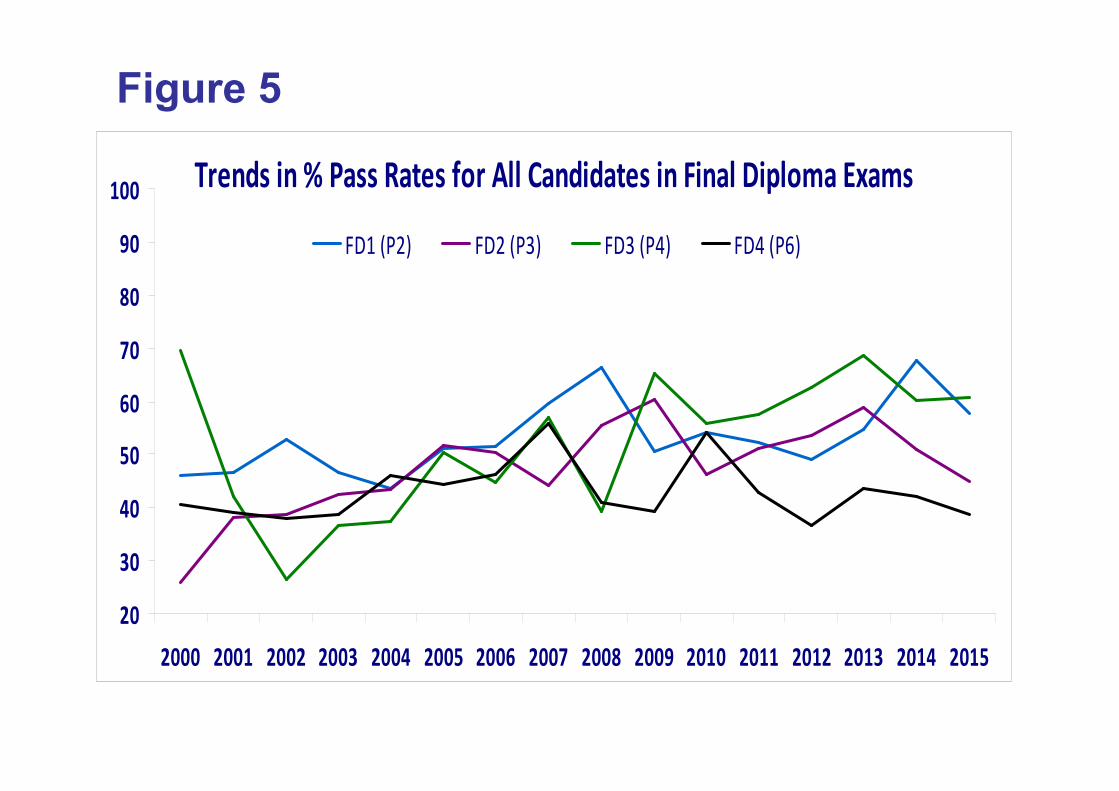
Figure 5
Trends in % Pass Rates for All Candidates in Final Diploma Exams
20
30
40
50
60
70
80
90
100
2000 2001 2002 2003 2004 2005 2006 2007 2008 2009 2010 2011 2012 2013 2014 2015
FD1 (P2) FD2 (P3) FD3 (P4) FD4 (P6)
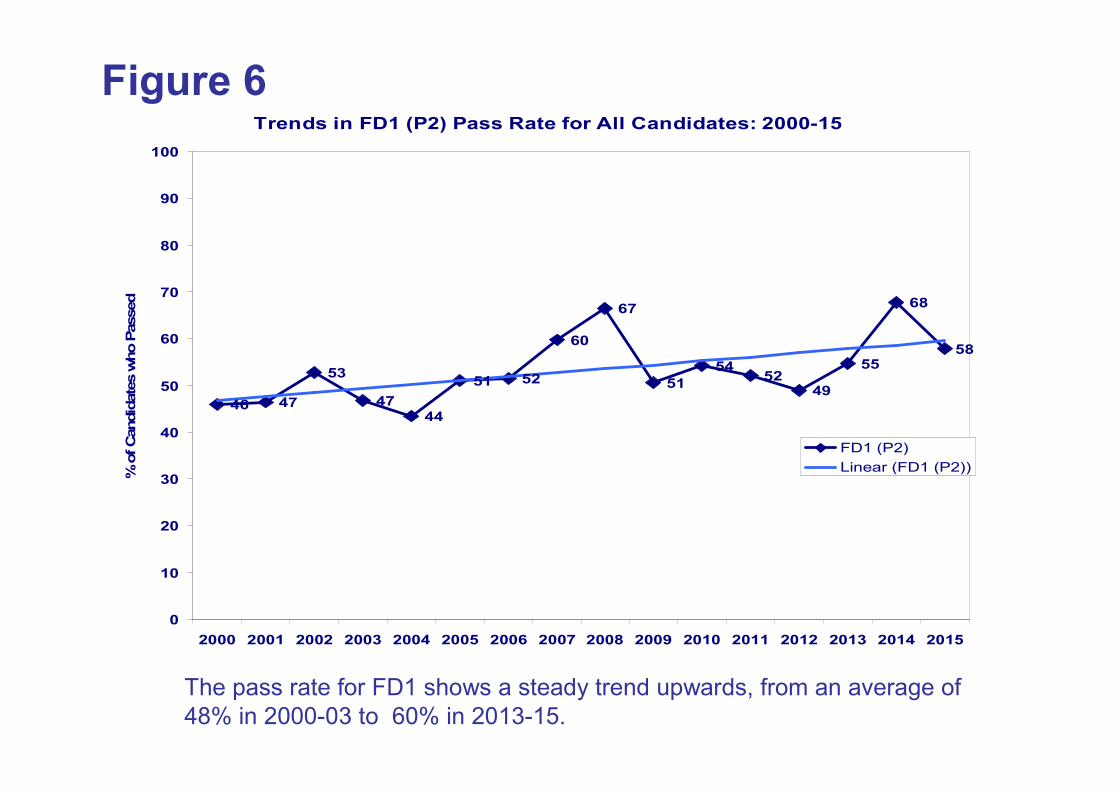
The pass rate for FD1 shows a steady trend upwards, from an average of
48% in 2000-03 to 60% in 2013-15.
Figure 6Trends in FD1 (P2) Pass Rate for All Candidates: 2000-15
46 47
53
4744
51 52
60
67
51
5452
49
55
68
58
0
10
20
30
40
50
60
70
80
90
100
2000 2001 2002 2003 2004 2005 2006 2007 2008 2009 2010 2011 2012 2013 2014 2015
% o
f C
andid
ate
s w
ho P
assed
FD1 (P2)
Linear (FD1 (P2))
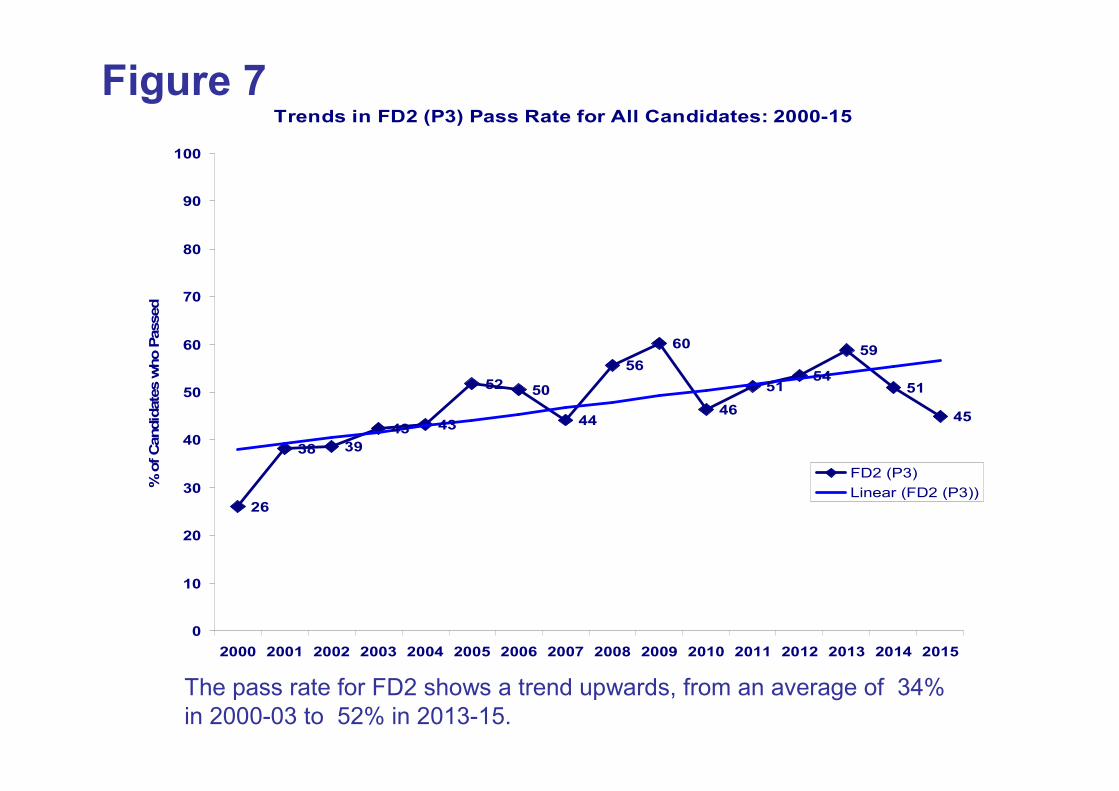
The pass rate for FD2 shows a trend upwards, from an average of 34%
in 2000-03 to 52% in 2013-15.
Figure 7Trends in FD2 (P3) Pass Rate for All Candidates: 2000-15
26
38 39
43 43
52 50
44
56
60
46
5154
59
51
45
0
10
20
30
40
50
60
70
80
90
100
2000 2001 2002 2003 2004 2005 2006 2007 2008 2009 2010 2011 2012 2013 2014 2015
% o
f C
andid
ate
s w
ho P
assed
FD2 (P3)
Linear (FD2 (P3))
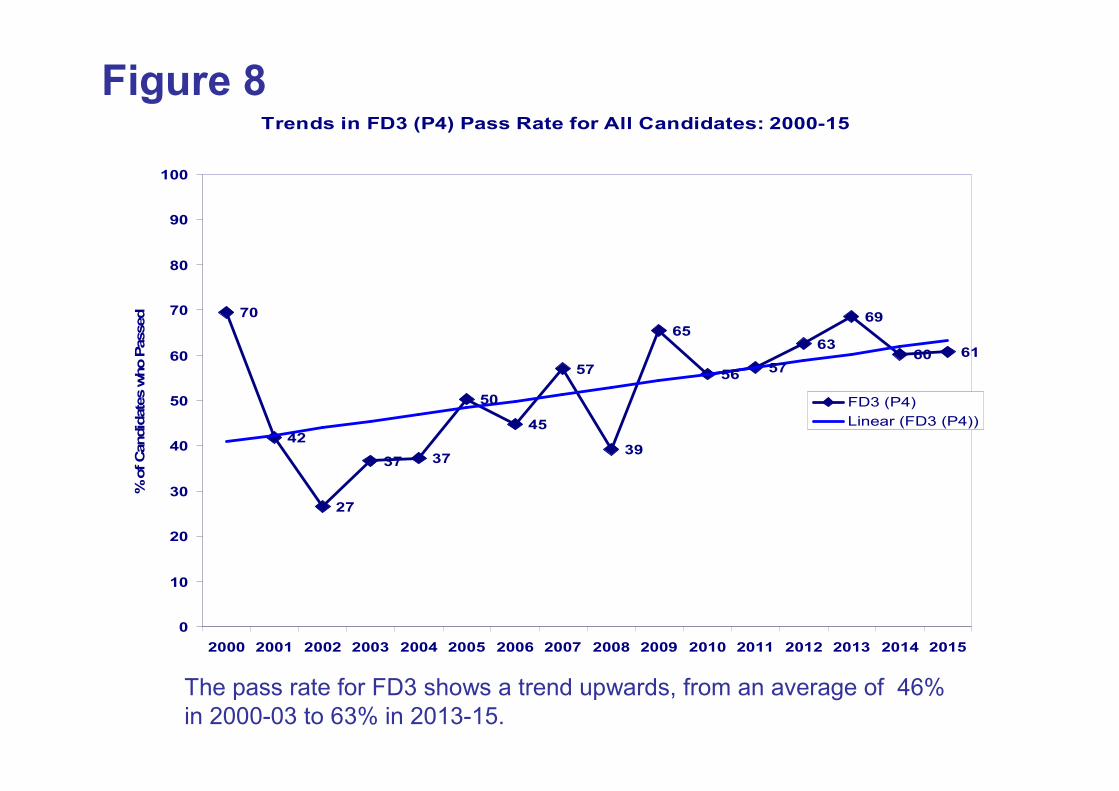
The pass rate for FD3 shows a trend upwards, from an average of 46%
in 2000-03 to 63% in 2013-15.
Figure 8Trends in FD3 (P4) Pass Rate for All Candidates: 2000-15
70
42
27
37 37
50
45
57
39
65
5657
63
69
60 61
0
10
20
30
40
50
60
70
80
90
100
2000 2001 2002 2003 2004 2005 2006 2007 2008 2009 2010 2011 2012 2013 2014 2015
% o
f C
andid
ate
s w
ho P
assed
FD3 (P4)
Linear (FD3 (P4))
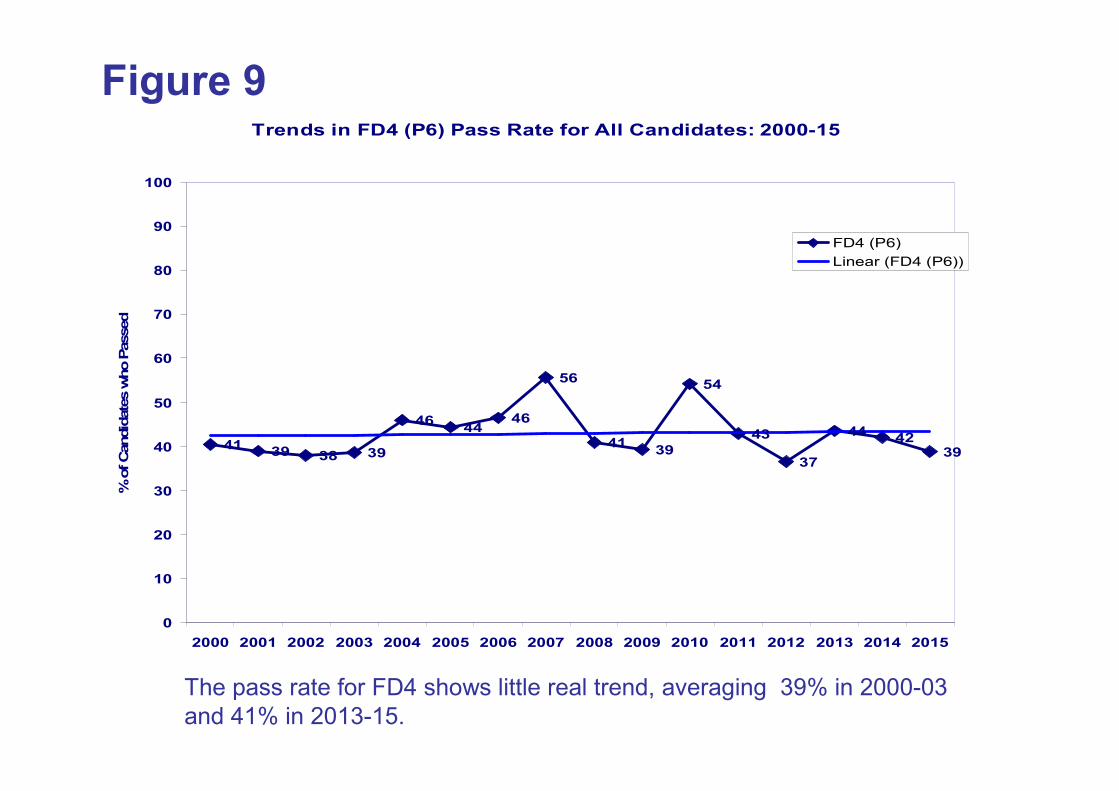
The pass rate for FD4 shows little real trend, averaging 39% in 2000-03
and 41% in 2013-15.
Figure 9 Trends in FD4 (P6) Pass Rate for All Candidates: 2000-15
4139 38 39
4644
46
56
4139
54
43
37
4442
39
0
10
20
30
40
50
60
70
80
90
100
2000 2001 2002 2003 2004 2005 2006 2007 2008 2009 2010 2011 2012 2013 2014 2015
% o
f C
andid
ate
s w
ho P
assed
FD4 (P6)
Linear (FD4 (P6))
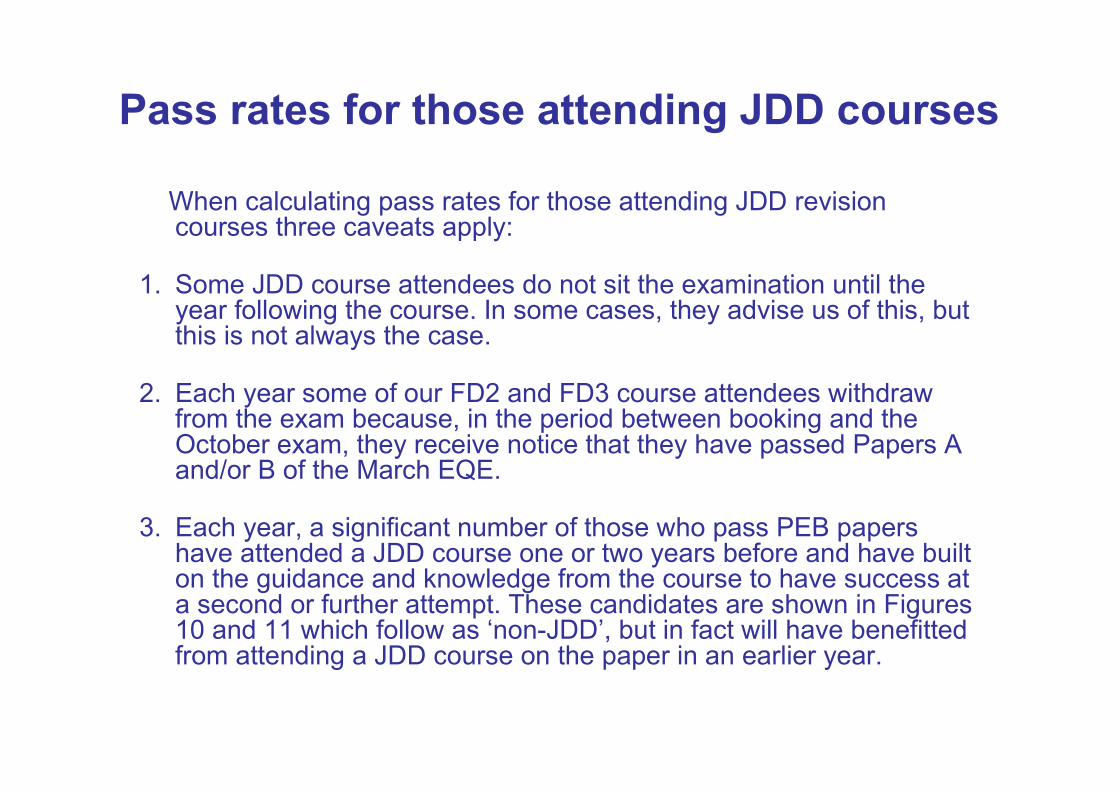
Pass rates for those attending JDD courses
When calculating pass rates for those attending JDD revision courses three caveats apply:
1. Some JDD course attendees do not sit the examination until the year following the course. In some cases, they advise us of this, but this is not always the case.
2. Each year some of our FD2 and FD3 course attendees withdraw from the exam because, in the period between booking and the October exam, they receive notice that they have passed Papers Aand/or B of the March EQE.
3. Each year, a significant number of those who pass PEB papers have attended a JDD course one or two years before and have built on the guidance and knowledge from the course to have success ata second or further attempt. These candidates are shown in Figures 10 and 11 which follow as ‘non-JDD’, but in fact will have benefittedfrom attending a JDD course on the paper in an earlier year.
Foundation Certificate courses
• FC pass rates, for all candidates, are typically
high, but also:
– a high proportion of candidates attend JDD FC
revision courses;
– as in previous years, pass rates for those who
attended our FC course(s) in 2015 were significantly
higher than for those who did not attend our
course(s): in the case of FC4 it was a fifth higher.
Final Diploma courses
• In the cases of FD1, the pass rate for those who attended a JDD revision on the paper in 2015, was almost two-fifths higher than those who did not, while for FD4 it was more than a quarter higher.
• For FD2 and FD3, given that each year EQE Papers A and B exemptions lead to a number of those who attend our FD2 and FD3 not sitting the PEB exams, we are unable to reliably calculate pass rates. But the evidence we have suggests that for FD2 pass rates in 2015 for our course attendees was a quarter higher than for non-attendees and the pass rate for our FD3 attendees was at least 60%.
• Furthermore, a substantial proportion of those who passed the 2015 exam without taking a JDD revision course for the paper in 2015 had attended a JDD course on that paper in 2014 or 2013: over a third in the case of FD4, a fifth for FD2, a sixth for FD1 and a seventh for FD3. In these cases, the candidates will have been able to build on guidance provided in the courses.
Successful FD candidates and how many
papers they passed
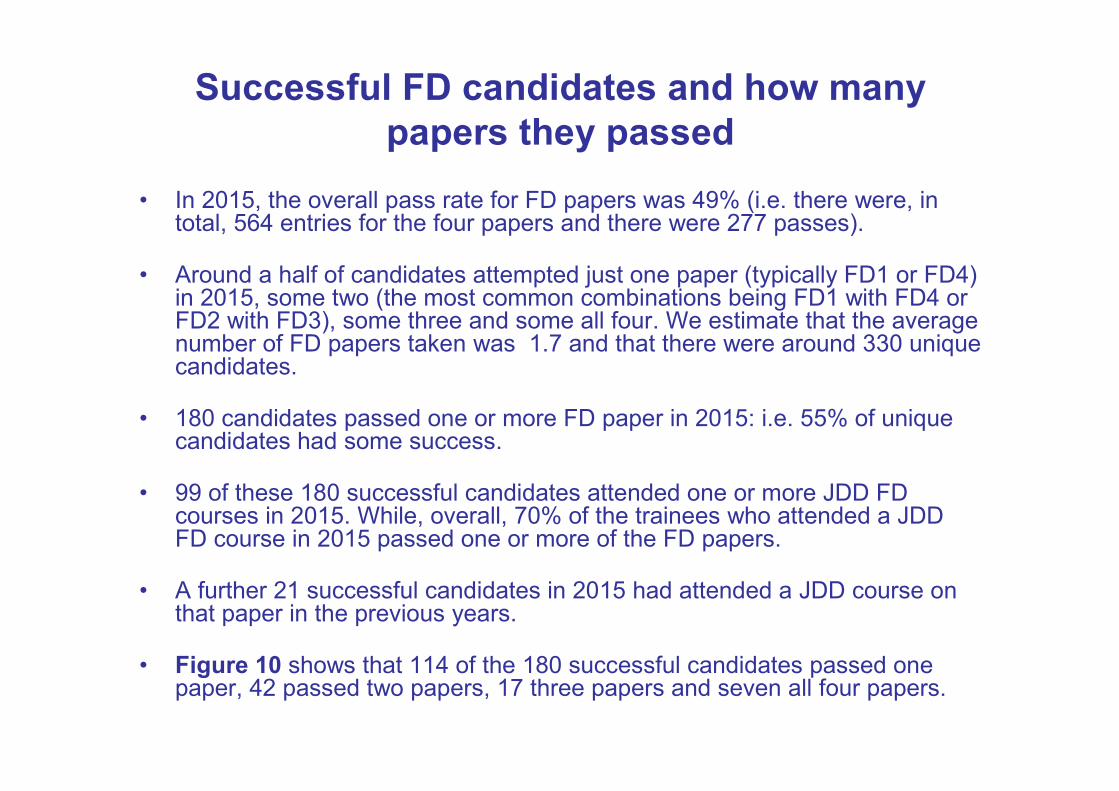
• In 2015, the overall pass rate for FD papers was 49% (i.e. there were, in total, 564 entries for the four papers and there were 277 passes).
• Around a half of candidates attempted just one paper (typically FD1 or FD4) in 2015, some two (the most common combinations being FD1 with FD4 or FD2 with FD3), some three and some all four. We estimate that the average number of FD papers taken was 1.7 and that there were around 330 unique candidates.
• 180 candidates passed one or more FD paper in 2015: i.e. 55% of unique candidates had some success.
• 99 of these 180 successful candidates attended one or more JDD FD courses in 2015. While, overall, 70% of the trainees who attended a JDD FD course in 2015 passed one or more of the FD papers.
• A further 21 successful candidates in 2015 had attended a JDD course on that paper in the previous years.
• Figure 10 shows that 114 of the 180 successful candidates passed one paper, 42 passed two papers, 17 three papers and seven all four papers.
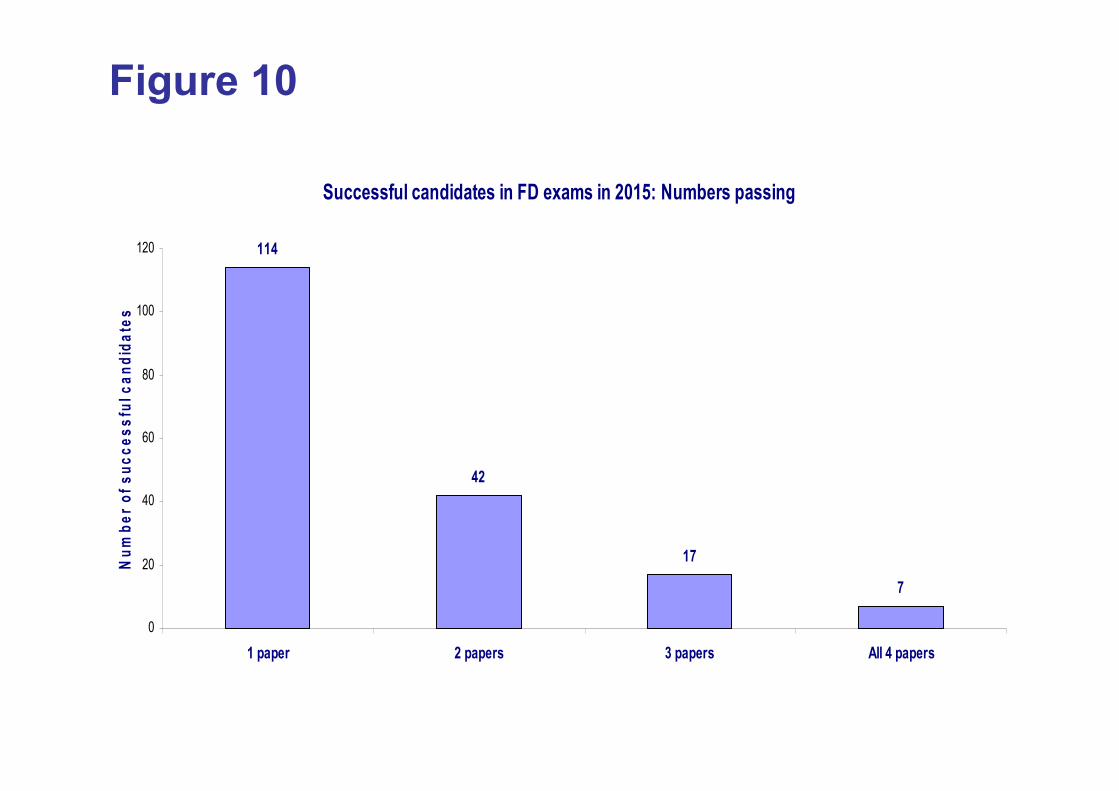
Figure 10
Successful candidates in FD exams in 2015: Numbers passing
114
42
17
7
0
20
40
60
80
100
120
1 paper 2 papers 3 papers All 4 papers
Nu
mb
er
of
su
cc
es
sfu
l c
an
did
ate
s
The profile of those who passed FD exams
Figure 11 shows the profile by ‘student year’ of those who passed the FD1, FD2, FD3 and FD4 exams in 2015.
‘Student year’ is the first year in which a person appears on the CIPA list as a student member. With CIPA no longer publishing anannual list of members, it is increasingly difficult to track this metric and we have had to estimate the student year in many cases.
Given this caveat, Figure 11 indicates that:– Between three-quarters and four-fifths of those who passed FD papers
in 2015 came from the student years of 2011-13: 81-84% for FD2 and FD3, 80% for FD1 and 76% for P6.
– A substantial proportion of those who passed FD4 in 2015 were re-sitters who had taken the examination several times before. Indeed, we know that 16 (or 21%) of those who passed FD4 in 2014 had attended a JDD course in 2014 or earlier and eight of those who passed from our 2015 courses were re-sitters.
– More than half of the ‘first-timers’ who did pass FD4 in 2015 were attendees on our 2015 courses.
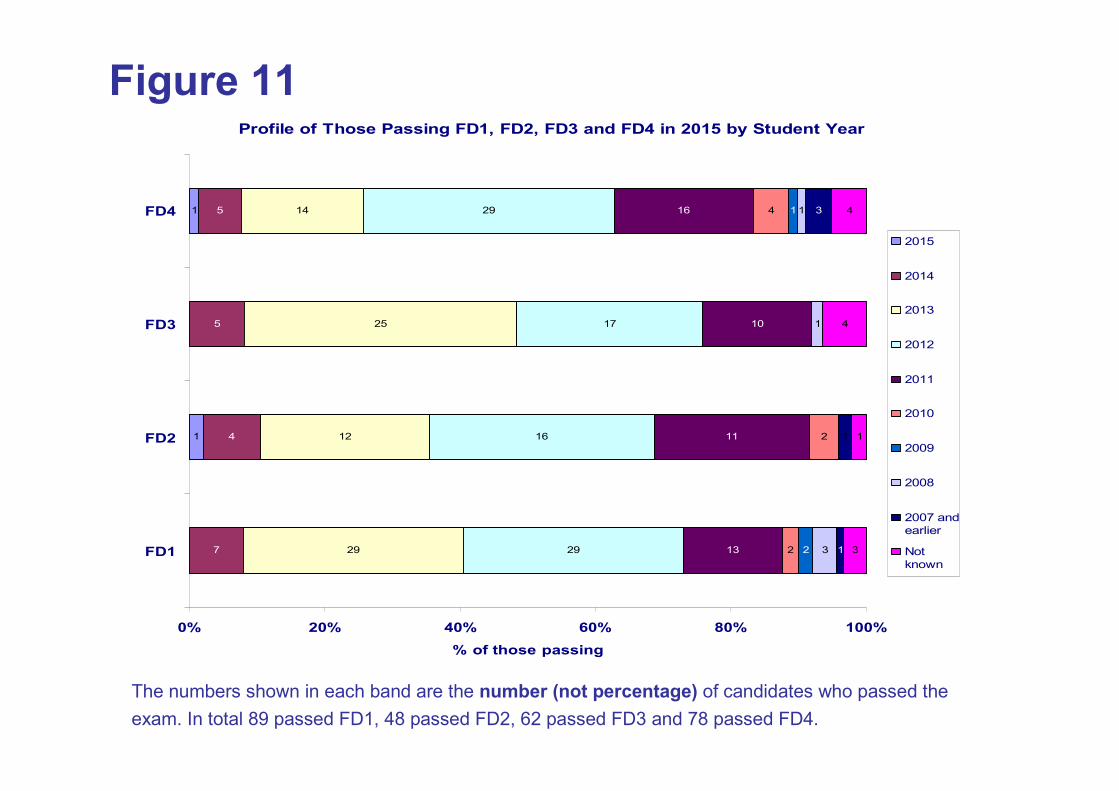
The numbers shown in each band are the number (not percentage) of candidates who passed the
exam. In total 89 passed FD1, 48 passed FD2, 62 passed FD3 and 78 passed FD4.
Figure 11Profile of Those Passing FD1, FD2, FD3 and FD4 in 2015 by Student Year
1
1
7
4
5
5
29
12
25
14
29
16
17
29
13
16
2
4
2
1
3 1
3
3
1
4
4
10
11 2
1
1
1
0% 20% 40% 60% 80% 100%
FD1
FD2
FD3
FD4
% of those passing
2015
2014
2013
2012
2011
2010
2009
2008
2007 and
earlier
Not
known
The fall in FD1, FD2 and FD4 pass rates in 2015 (1)
• For FD1 the pass rate was down substantially on that in PEB 2014, but remained historically high.
• The Examiner’s Report noted “candidates who scored well this year identified the key issue at the heart of the question and worked through it methodically using the information provided. Most marks are awarded for the most pertinent issues and spending time on peripheral issues H waste candidates valuable time”.
• It also suggested that some candidates “are attempting the papers too soon in their professional careers. It is advised that Final Diploma examinations are only attempted by those who have worked towards them by committing time to the appropriate training and believe they are ready to sit the examination”.
The fall in FD1, FD2 and FD4 pass rates in 2015 (2)
• For FD2 the fall in the pass rate was substantial, to below the recent average of over 50%.
• The Examiner’s Report does not comment on this decline, except indicating that those who failed did not stop and think, but instead rushed “by claiming the product the client had made, which was not the invention (it was too narrow)”.
• It noted that this year “The invention was incredibly simple and exposed those candidates who are skilled enough to deal with such simple inventions. More thought was probably required than in previous years as how best to set out the information, particularly the specific description”.
The fall in FD1, FD2 and FD4 pass rates in 2015 (3)
• For FD4 the fall in the pass rate was not large, but the pass rate was below the recent average of over 40%.
• The Examiner’s Report notes that “the background to this year’s paper was a situation which many of the candidates may not have encountered in practice, a request for a declaration of non-infringement”. This suggests that some candidates may have been ‘thrown’ by this unexpected scenario.
• It states that candidates are unlikely to pass if they do not attempt all of the sections or provide only a cursory attempt on inventive step. But it notes that “overall, it was thought that the amount of materials to consider and digest was appropriate and there seemed little evidence this year that candidates had failed to attempt all sections (on the grounds that candidates seemed able to provide a response in all sections)”.
• “Anecdotally, it appeared to the examiners that many candidates were either taking the examination without adequate preparation,too early, or both. These candidates clearly did not meet the requirements of the assessment criteria”.
The challenge of FD4 (1)
• FD4 is a notoriously difficult exam. Figure 9 has shown that pass rates have been consistently low and there has not been the significant upward trend evident for the FD1, FD2 and FD3 papers.
• We know from our tutors’ experience of reading and marking trainees’ attempts on past papers that students can ‘score’ well on a paper from one year but can then struggle with one attempted from another year. This means each paper presents a unique challenge and can ‘suit’ some students better than others. This puts a premium on the practice of a range of past papers to build up resilience for the challenges posed by the exam.
• Indeed, one of our successful candidates shared with us the following advice for future candidates:
– “Practice is the only thing which will help you to pass the exam – read through Nigel Frankland’s book to understand the exam technique, and then apply the same logic to real-world infringement cases that you might be working on. The exam is primarily a study in spotting the relevant features in the claims, and then comparing and contrasting with the infringing device, and everything will fall into place in your head much more quickly if you apply the exam-style to a case you are working on.”
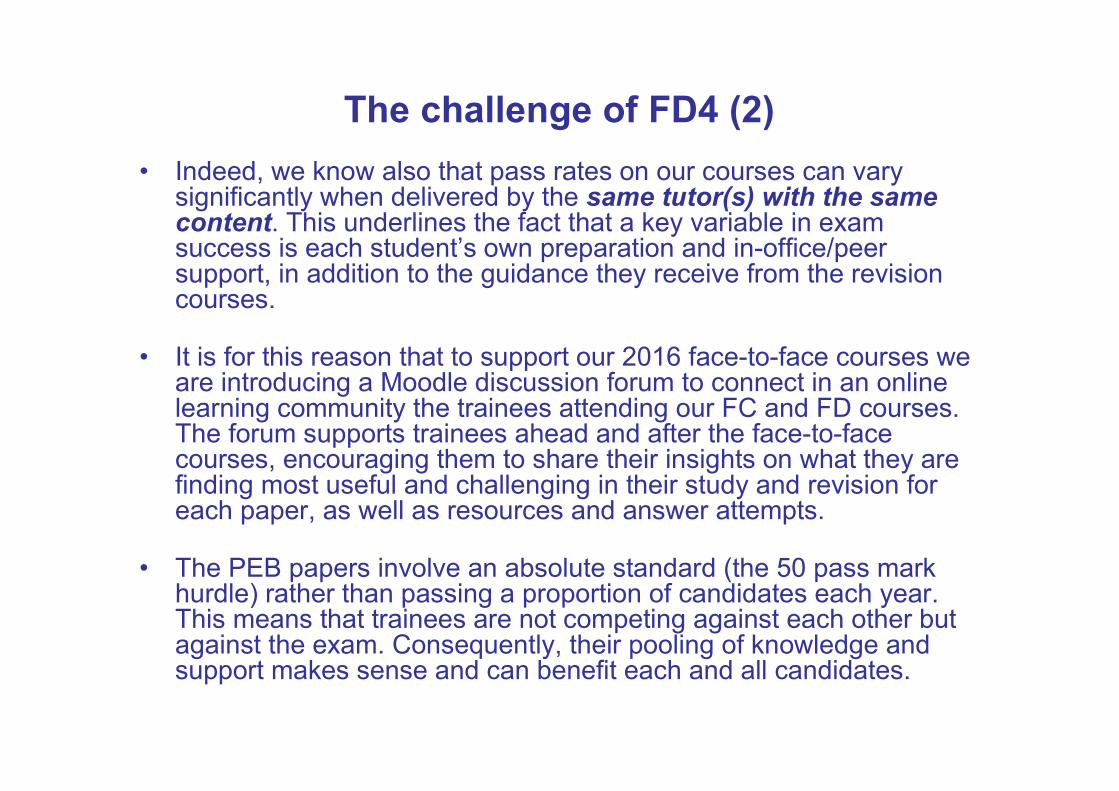
The challenge of FD4 (2)
• Indeed, we know also that pass rates on our courses can vary significantly when delivered by the same tutor(s) with the same content. This underlines the fact that a key variable in exam success is each student’s own preparation and in-office/peer support, in addition to the guidance they receive from the revision courses.
• It is for this reason that to support our 2016 face-to-face courses we are introducing a Moodle discussion forum to connect in an online learning community the trainees attending our FC and FD courses.The forum supports trainees ahead and after the face-to-face courses, encouraging them to share their insights on what they are finding most useful and challenging in their study and revision for each paper, as well as resources and answer attempts.
• The PEB papers involve an absolute standard (the 50 pass mark hurdle) rather than passing a proportion of candidates each year. This means that trainees are not competing against each other but against the exam. Consequently, their pooling of knowledge and support makes sense and can benefit each and all candidates.
JDD Consultants
Analysis by Dr Ian Derbyshire
of JDD Consultants
14 March 2016