Embed Size (px)
Citation preview
•The Foundation for the Demand-Driven Enterprise Understand, Predict, Proactively Manage
•JDE Users Group – November 16, 2006
Clete JohanningIndustry Business Unit – Application Sales
1
Demand ManagementSales & Operations Planning
Trade Promotion Management
2
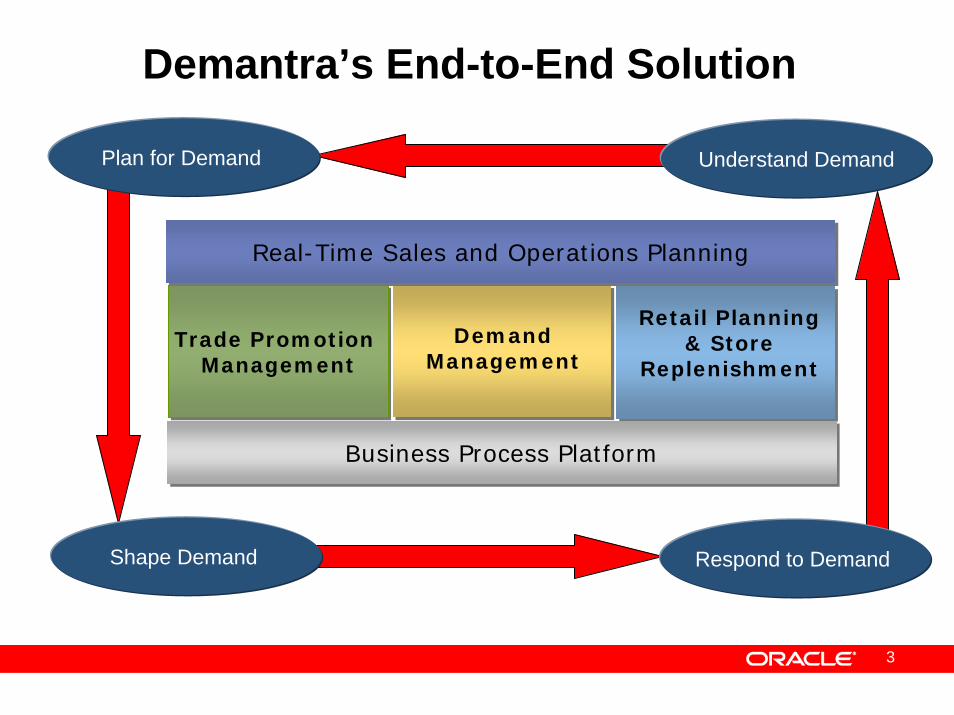
Shape Demand
Understand Demand
Respond to Demand
Plan for Demand
Retail Planning & Store
Replenishment
Demand Management
Trade Promotion Management
Trade Promotion Management
Real-Time Sales and Operations PlanningReal-Time Sales and Operations Planning
Business Process PlatformBusiness Process Platform
Demantra’s End-to-End Solution
3
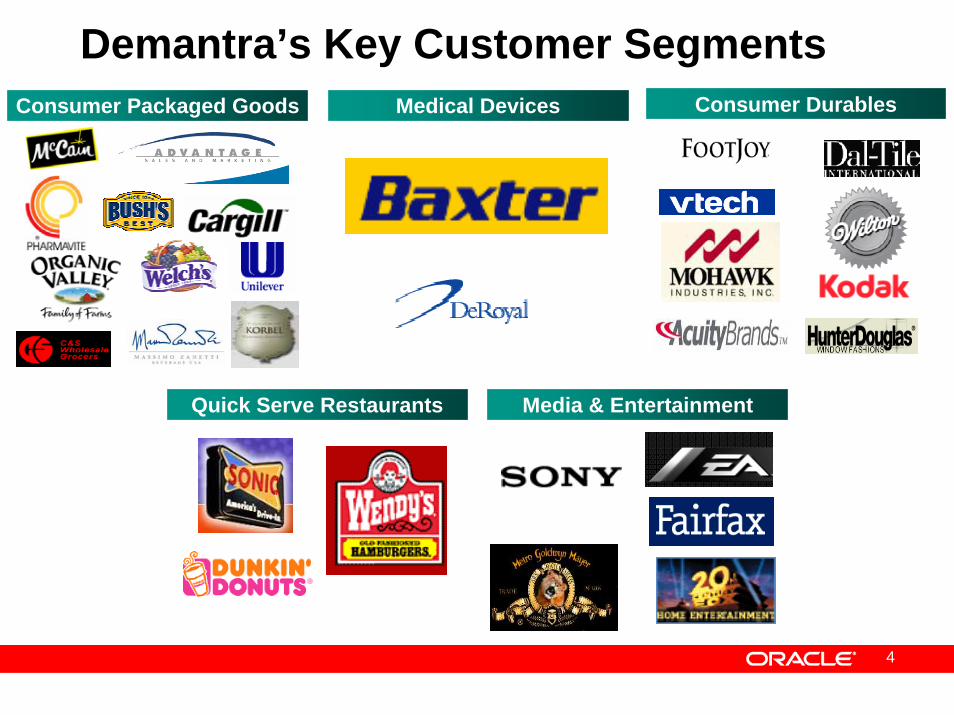
Demantra’s Key Customer Segments
4
Medical Devices
Media & Entertainment
Consumer Packaged Goods Consumer Durables
Quick Serve Restaurants
Demand Management
5
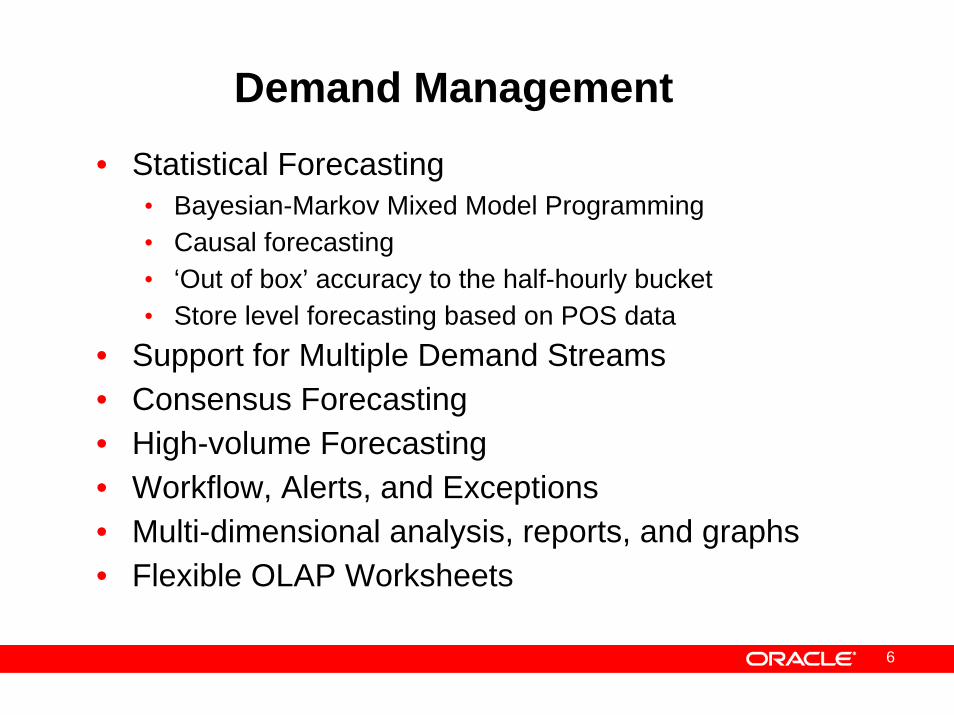
Demand Management• Statistical Forecasting
• Bayesian-Markov Mixed Model Programming• Causal forecasting• ‘Out of box’ accuracy to the half-hourly bucket• Store level forecasting based on POS data
• Support for Multiple Demand Streams • Consensus Forecasting• High-volume Forecasting• Workflow, Alerts, and Exceptions• Multi-dimensional analysis, reports, and graphs• Flexible OLAP Worksheets
6

Demand Management Differentiators
• Manage at any level of time, product and location aggregation• New Product Introduction
• Supports product lifecycle management• Chaining capabilities to existing products
• Shape Modeling• Use comparable products demand shapes as input• Generate composite new shape and align to actual demand
• Attribute Based Forecasting• Analyze demand for a group of combined attributes• Uses business rules for product level modeling
• Assumption Planning• Supports qualitative forecasting• Current and past assumptions are modeled
7
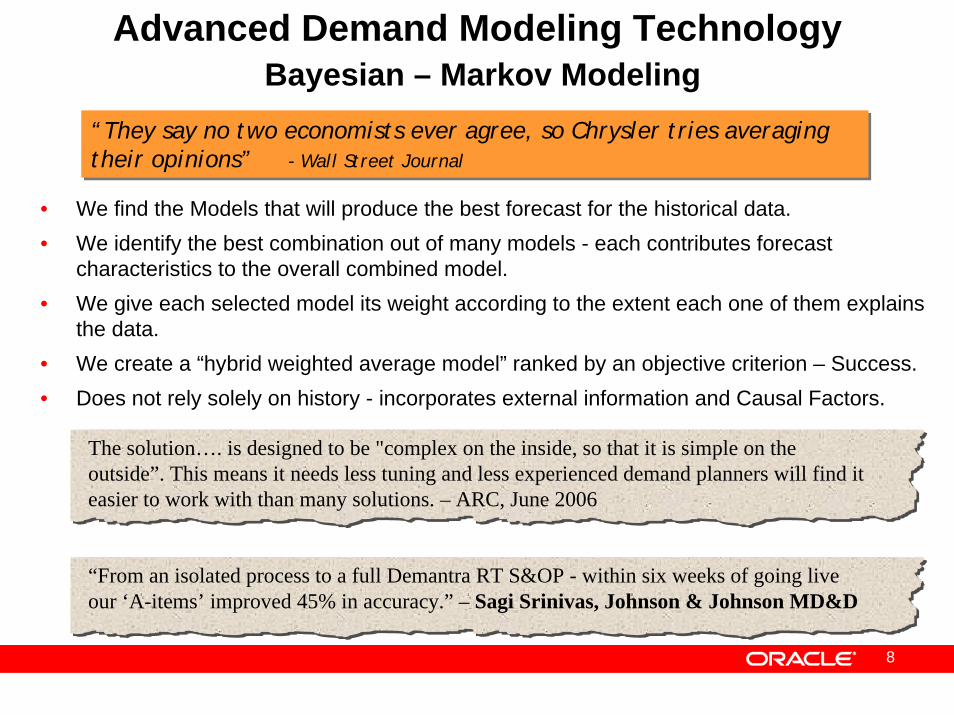
Advanced Demand Modeling TechnologyBayesian – Markov Modeling
“They say no two economists ever agree, so Chrysler tries averaging their opinions” - Wall Street Journal
“They say no two economists ever agree, so Chrysler tries averaging their opinions” - Wall Street Journal
• We find the Models that will produce the best forecast for the historical data.• We identify the best combination out of many models - each contributes forecast
characteristics to the overall combined model.• We give each selected model its weight according to the extent each one of them explains
the data.• We create a “hybrid weighted average model” ranked by an objective criterion – Success.• Does not rely solely on history - incorporates external information and Causal Factors.
The solution…. is designed to be "complex on the inside, so that it is simple on the outside”. This means it needs less tuning and less experienced demand planners will find it easier to work with than many solutions. – ARC, June 2006
“From an isolated process to a full Demantra RT S&OP - within six weeks of going live our ‘A-items’ improved 45% in accuracy.” – Sagi Srinivas, Johnson & Johnson MD&D
8
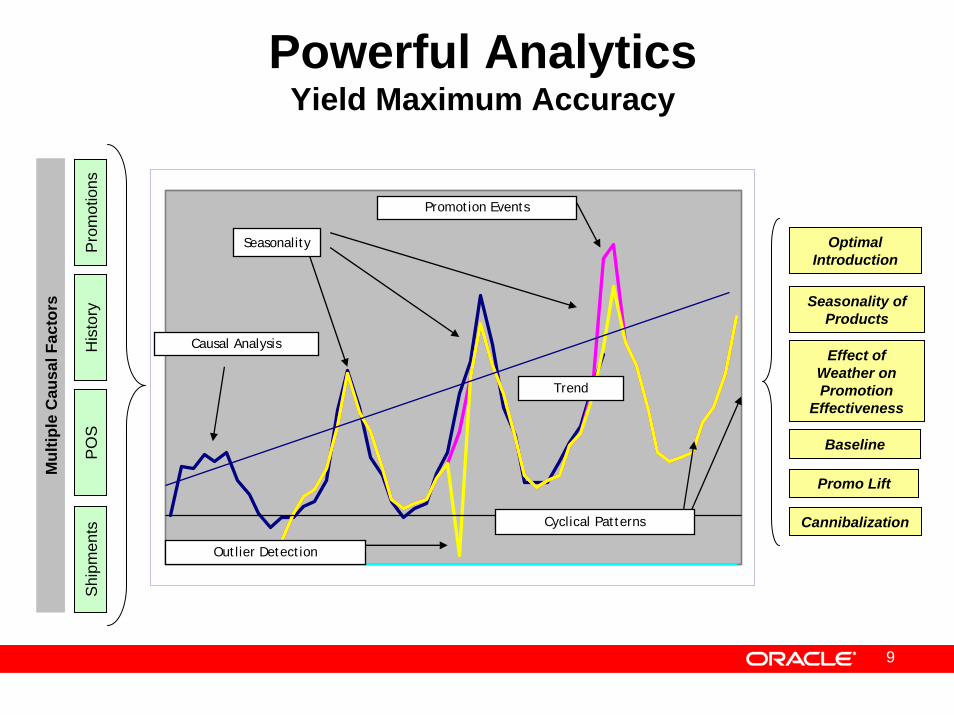
Powerful Analytics Yield Maximum Accuracy
His
tory
PO
SP
rom
otio
nsSh
ipm
ents
Estimator’s Models
Bayesian Estimator
Bayesian Combined
Model
Predictive Model
Causal Analysis
Outlier Detection
Promotion Events
Seasonality
Cyclical Patterns
Trend
Mul
tiple
Cau
sal F
acto
rs
Optimal Introduction
Seasonality of Products
Effect of Weather on Promotion
Effectiveness
Baseline
Promo Lift
Cannibalization
9
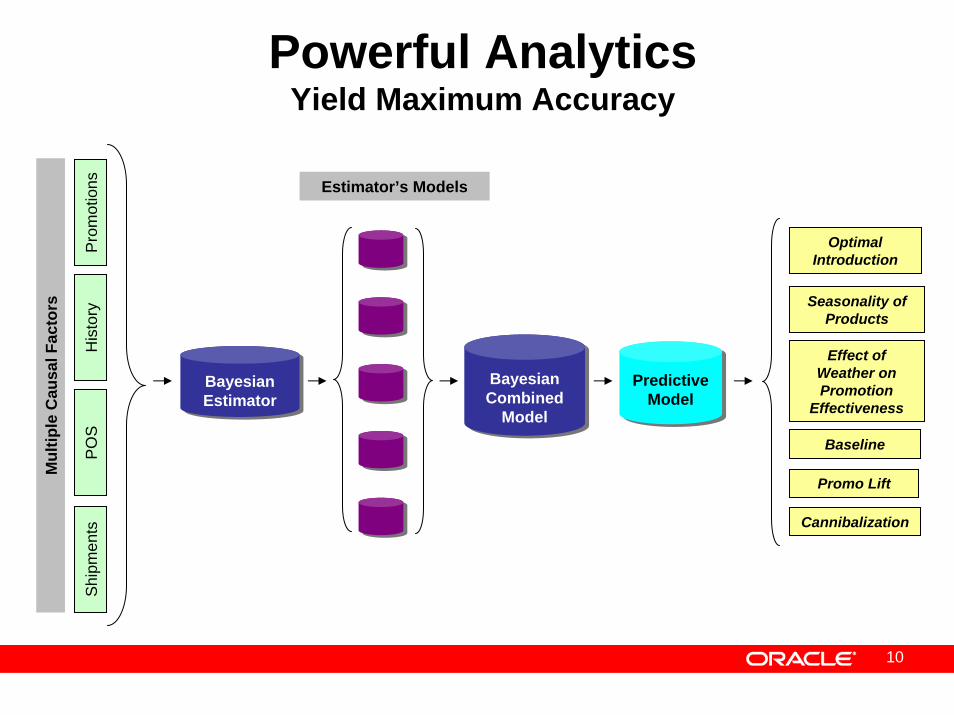
Powerful Analytics Yield Maximum Accuracy
His
tory
PO
SP
rom
otio
nsSh
ipm
ents
10
Optimal Introduction
Seasonality of Products
Effect of Weather on Promotion
Effectiveness
Baseline
Promo Lift
Cannibalization
Mul
tiple
Cau
sal F
acto
rs
Estimator’s Models
Bayesian Combined
Model
Predictive Model
Bayesian Estimator
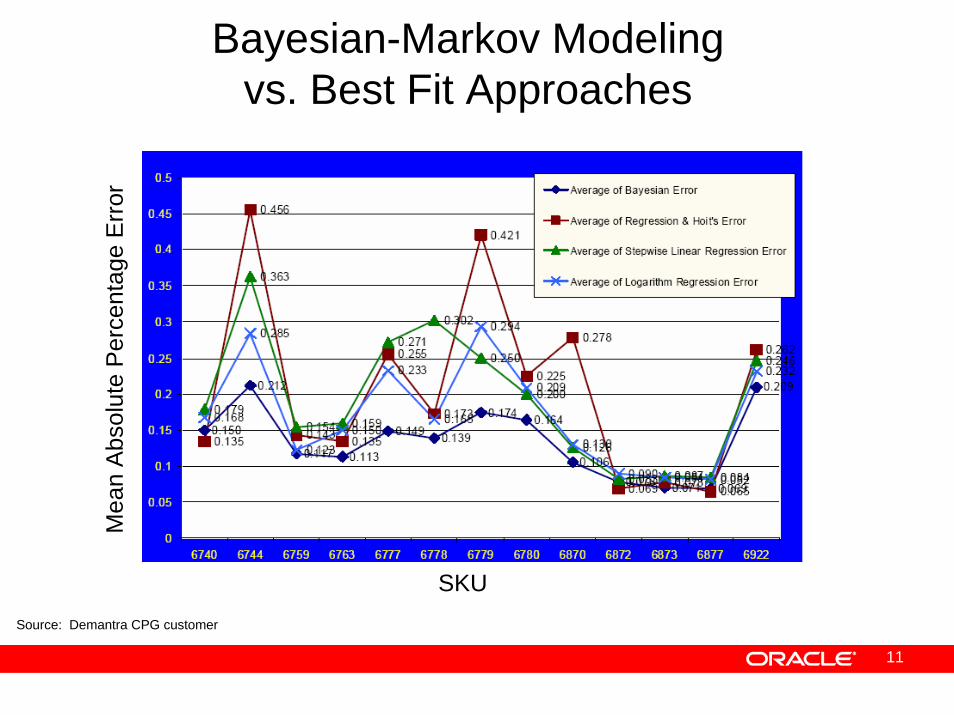
Bayesian-Markov Modeling vs. Best Fit Approaches
SKU
Mea
n A
bsol
ute
Per
cent
age
Err
or
Source: Demantra CPG customer
11
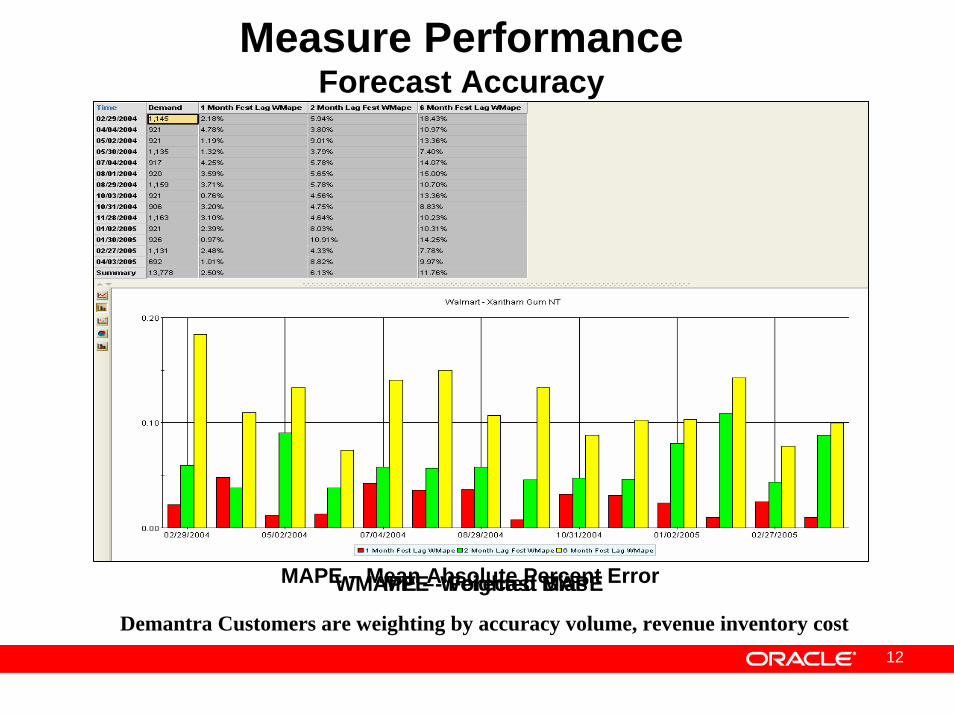
MAPE – Mean Absolute Percent ErrorMPE - Forecast Bias
Measure Performance Forecast Accuracy
WMAPE – Weighted MAPE
Demantra Customers are weighting by accuracy volume, revenue inventory cost12
Real-time Sales & Operations Planning
Overview
13
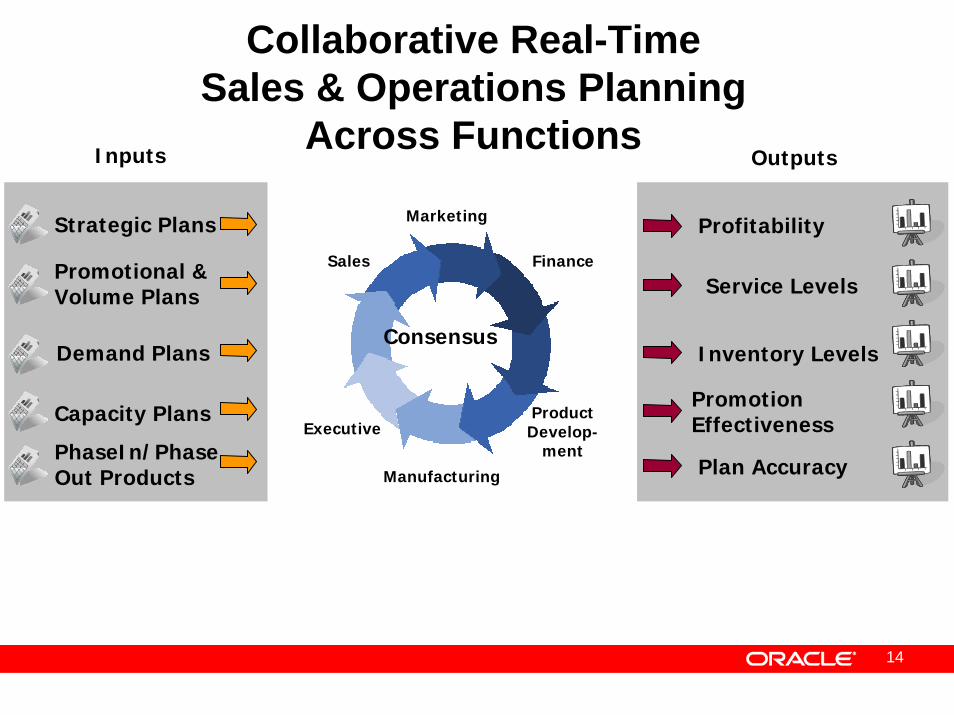
Collaborative Real-Time Sales & Operations Planning
Across FunctionsInputs Outputs
Profitability
Service Levels
Inventory Levels
Promotion Effectiveness
Plan Accuracy
Sales Finance
ExecutiveProductDevelop-
ment
Consensus
Promotional & Volume Plans
Strategic Plans Marketing
Capacity Plans
PhaseIn/Phase Out Products
Demand Plans
Manufacturing
14
15
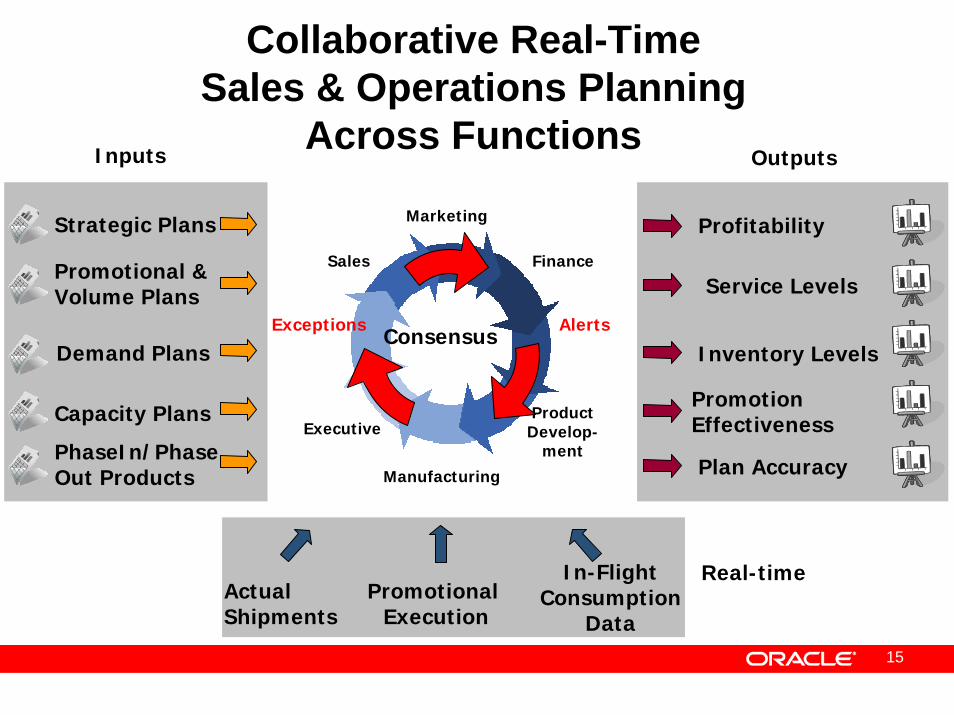
Actual Shipments
Promotional Execution
In-FlightConsumption
Data
Sales Finance
ExecutiveProductDevelop-
ment
Consensus
Promotional & Volume Plans
Strategic Plans Marketing
Manufacturing
Capacity Plans
PhaseIn/Phase Out Products
Demand Plans
Profitability
Service Levels
Inventory Levels
Promotion Effectiveness
Plan Accuracy
AlertsExceptions
Inputs Outputs
Collaborative Real-Time Sales & Operations Planning
Across Functions
Real-time

RT S&OP Collaborative Process
• Collaborative Process Enablers• Develop Baseline Forecast• Develop Consensus Plan• Introduce New Products• Manage Promotions • Manage Replenishment• Measure Performance
16
RT S&OP Collaborative Process
• Collaborative Process Enablers • Develop Baseline Forecast• Develop Consensus Plan• Introduce New Products• Manage Promotions • Manage Replenishment• Measure Performance
17
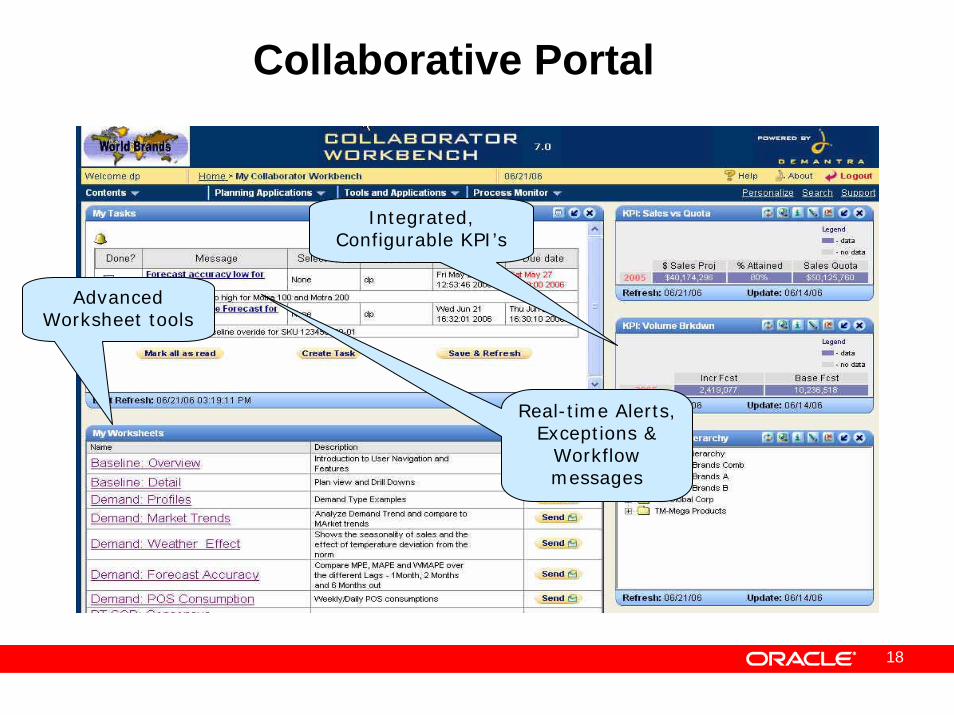
Collaborative Portal
Integrated, Configurable KPI’s
Real-time Alerts, Exceptions &
Workflow messages
Advanced Worksheet tools
18
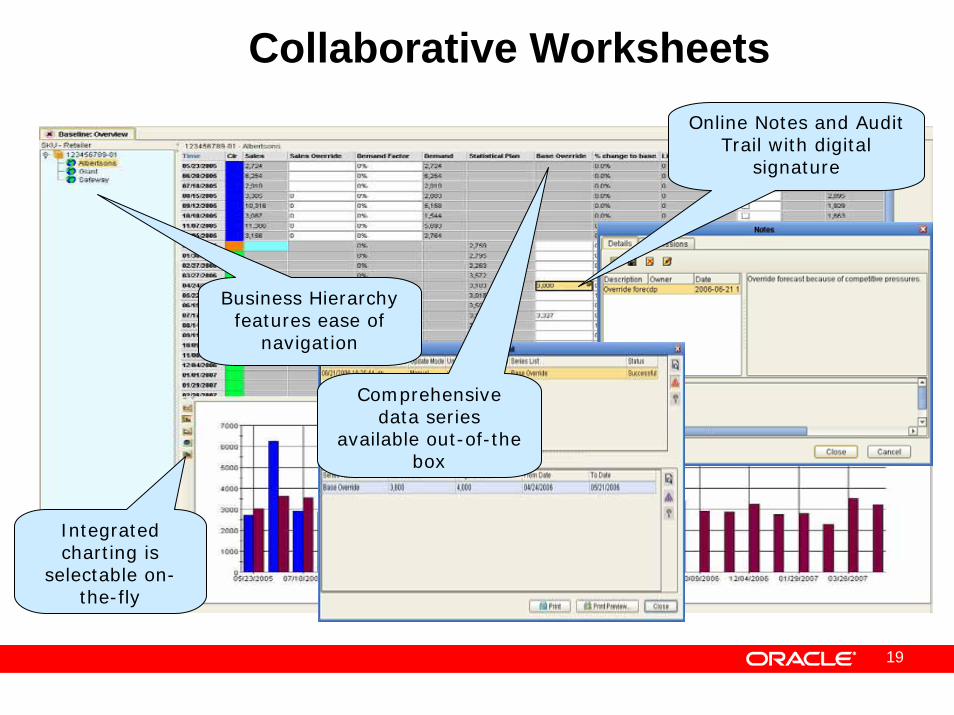
Collaborative Worksheets
Business Hierarchy features ease of
navigation
Comprehensive data series
available out-of-the box
Integrated charting is
selectable on-the-fly
Online Notes and Audit Trail with digital
signature
19
RT S&OP Collaborative Process
• Collaborative Process Enablers• Develop Baseline Forecast• Develop Consensus Plan• Introduce New Products• Manage Promotions • Manage Replenishment• Measure Performance
20
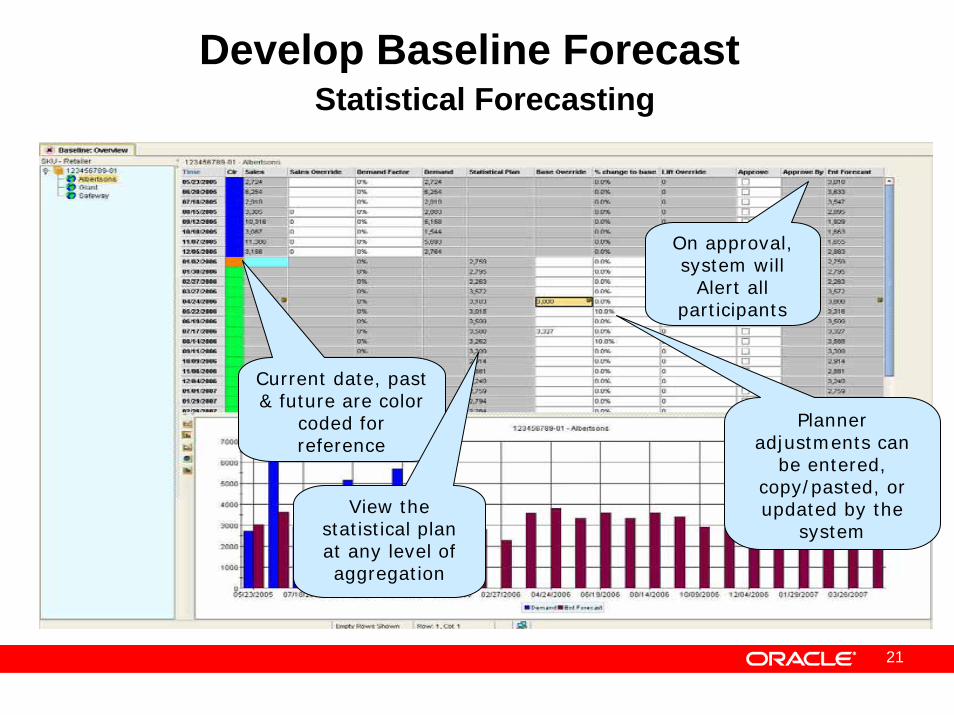
Develop Baseline ForecastStatistical Forecasting
Current date, past & future are color
coded for reference
View the statistical plan at any level of aggregation
Planner adjustments can
be entered, copy/pasted, or updated by the
system
On approval, system will
Alert all participants
21
RT S&OP Collaborative Process
• Collaborative Process Enablers • Develop Baseline Forecast• Develop Consensus Plan• Introduce New Products• Manage Promotions • Manage Replenishment• Measure Performance
22
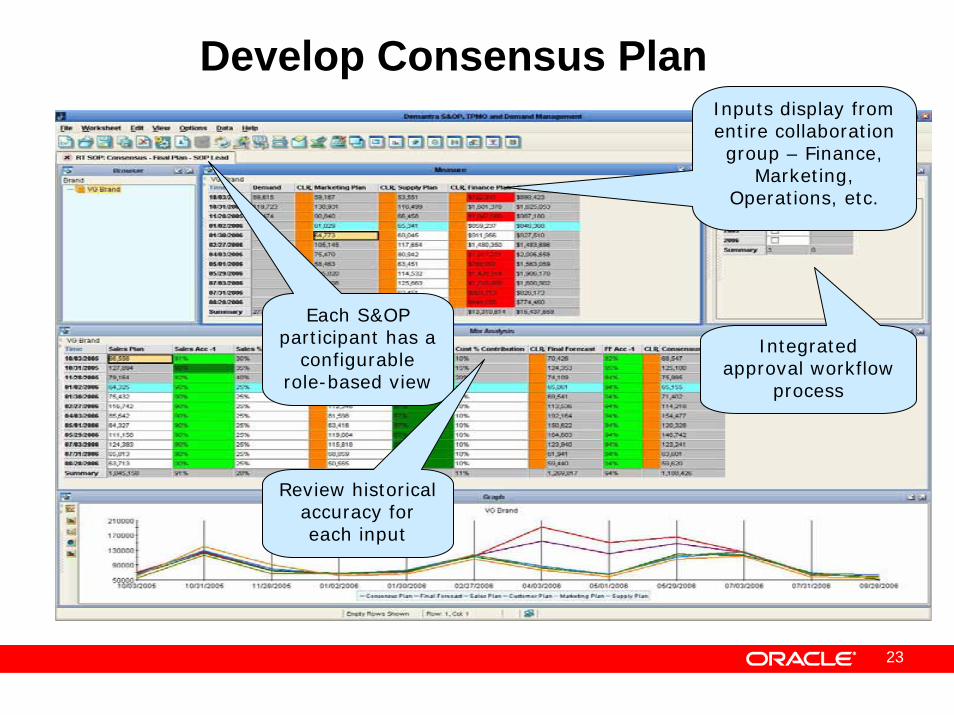
Develop Consensus PlanInputs display from entire collaboration group – Finance,
Marketing, Operations, etc.
Integrated approval workflow
process
Each S&OP participant has a
configurable role-based view
Review historical accuracy for each input
23
RT S&OP Collaborative Process
• Collaborative Process Enablers • Develop Baseline Forecast• Develop Consensus Plan• Introduce New Products• Manage Promotions • Manage Replenishment• Measure Performance
24
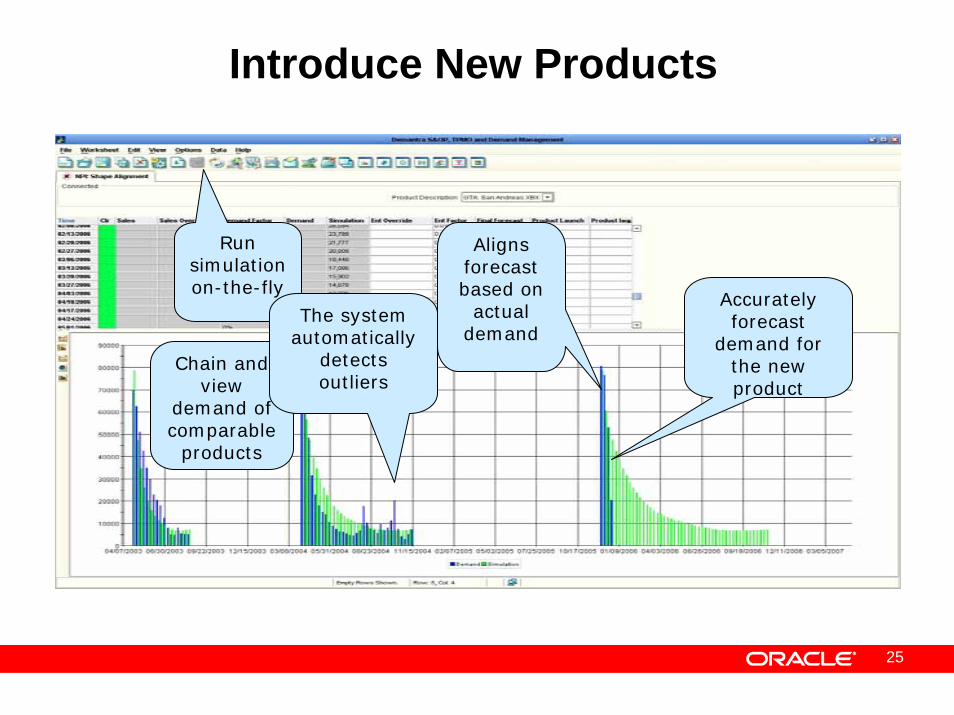
Introduce New Products
Chain and view
demand of comparable
products
Run simulation on-the-fly
Accurately forecast
demand for the new product
Aligns forecast based on
actual demand
The system automatically
detects outliers
25
RT S&OP Collaborative Process
• Collaborative Process Enablers • Develop Baseline Forecast• Develop Consensus Plan• Introduce New Products• Manage Promotions • Manage Replenishment• Measure Performance
26
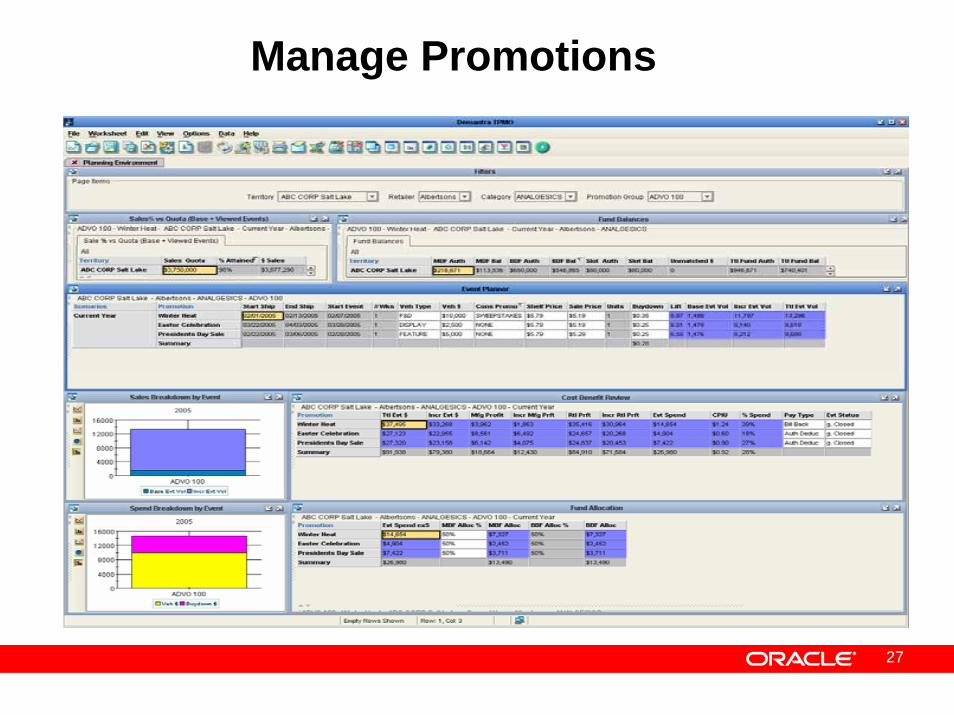
Manage Promotions
27
RT S&OP Collaborative Process
• Collaborative Process Enablers • Develop Baseline Forecast• Develop Consensus Plan• Introduce New Products• Manage Promotions • Manage Replenishment• Measure Performance
28
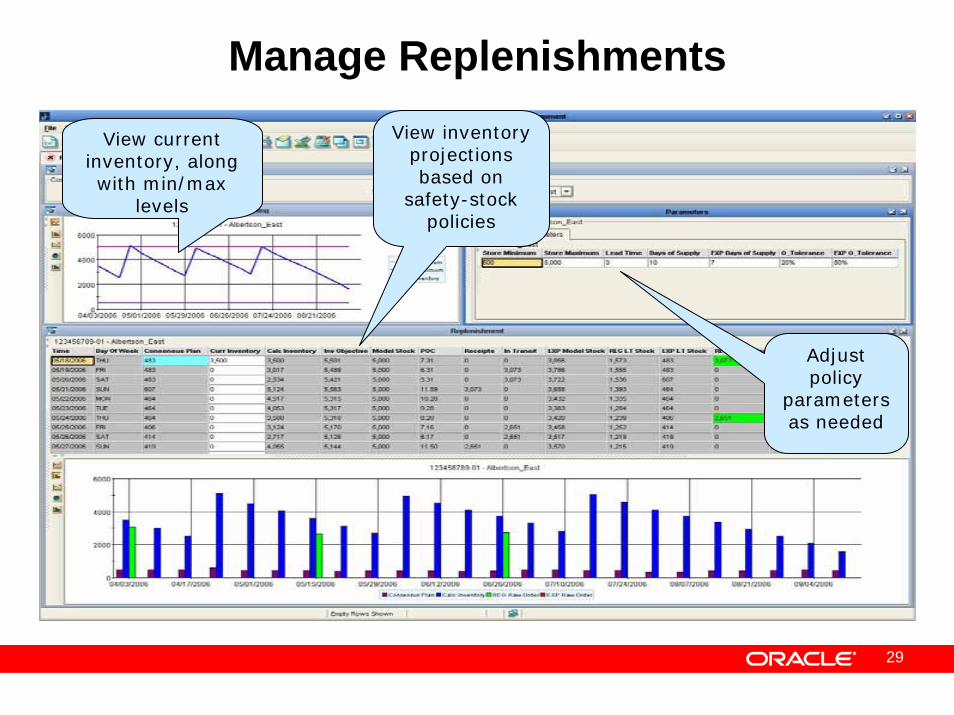
Manage Replenishments
View current inventory, along with min/max
levels
Adjust policy
parameters as needed
View inventory projections based on
safety-stock policies
29
RT S&OP Collaborative Process
• Collaborative Process Enablers • Develop Baseline Forecast• Develop Consensus Plan• Introduce New Products• Manage Promotions • Manage Replenishment• Measure Performance
30
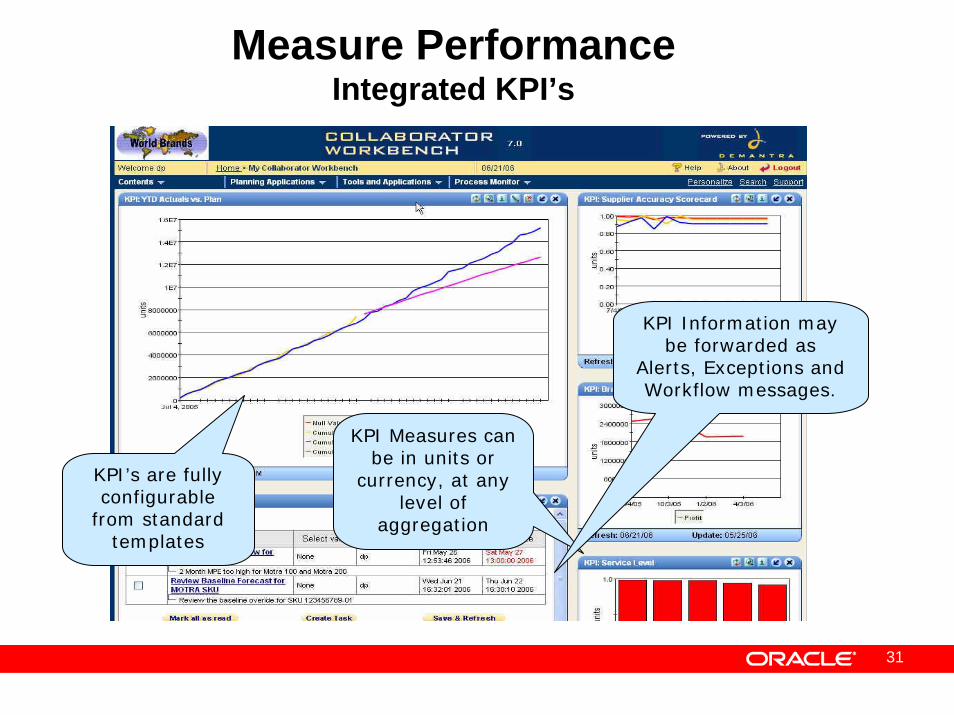
Measure PerformanceIntegrated KPI’s
KPI’s are fully configurable
from standard templates
KPI Measures can be in units or
currency, at any level of
aggregation
KPI Information may be forwarded as
Alerts, Exceptions and Workflow messages.
31
Why Customers Buy Demantra for S&OP
• Gold Standard for Demand Driven Supply Network Vision
• Real-Time, Demand-Driven Planning Applications
• Most Sophisticated Planning Statistics - “out of the box”
• Integrated Analytics Platform
• Collaborative Planning Environment Driven By Workflow
• Technology - Scalability supports granular forecasting• Shelf/Rack/Store/DMA/DC x sku/item x week/day/hour
• Automation and Scalability for Granular Demand Data Visibility
• Business Process Management with Exception Processing
32
33
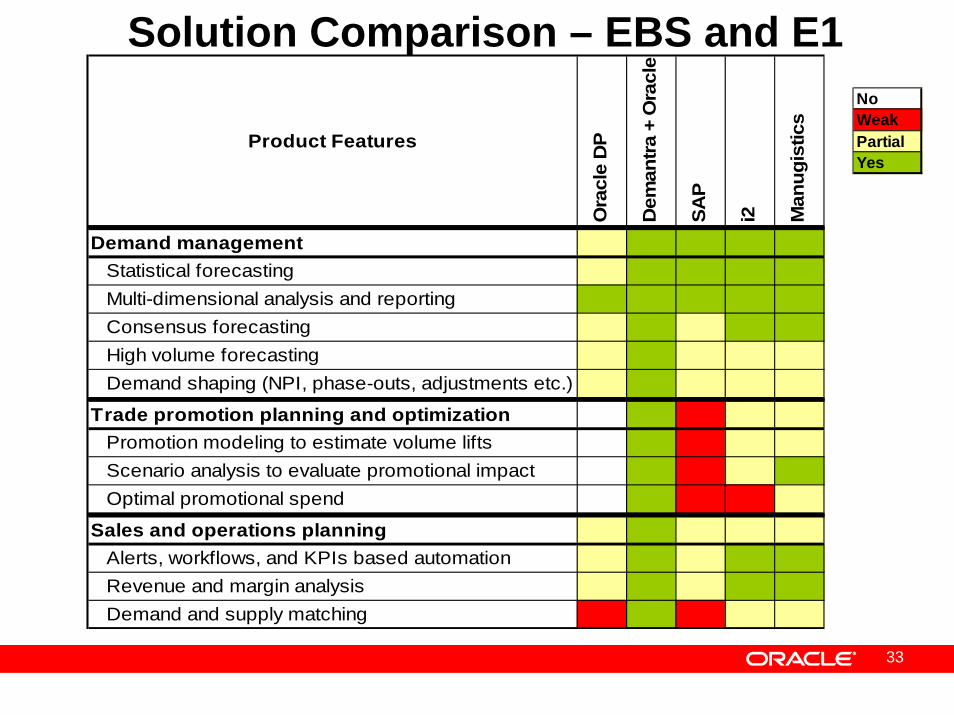
NoWeakPartialYes
Product Features
le D
P
antra
+ O
racl
e
nugi
stic
s
Ora
c
Dem
SAP
i2 Ma
Demand management Statistical forecasting Multi-dimensional analysis and reporting Consensus forecasting High volume forecasting Demand shaping (NPI, phase-outs, adjustments etc.)
Trade promotion planning and optimization Promotion modeling to estimate volume lifts Scenario analysis to evaluate promotional impact Optimal promotional spend
Sales and operations planning Alerts, workflows, and KPIs based automation Revenue and margin analysis Demand and supply matching
Solution Comparison – EBS and E1
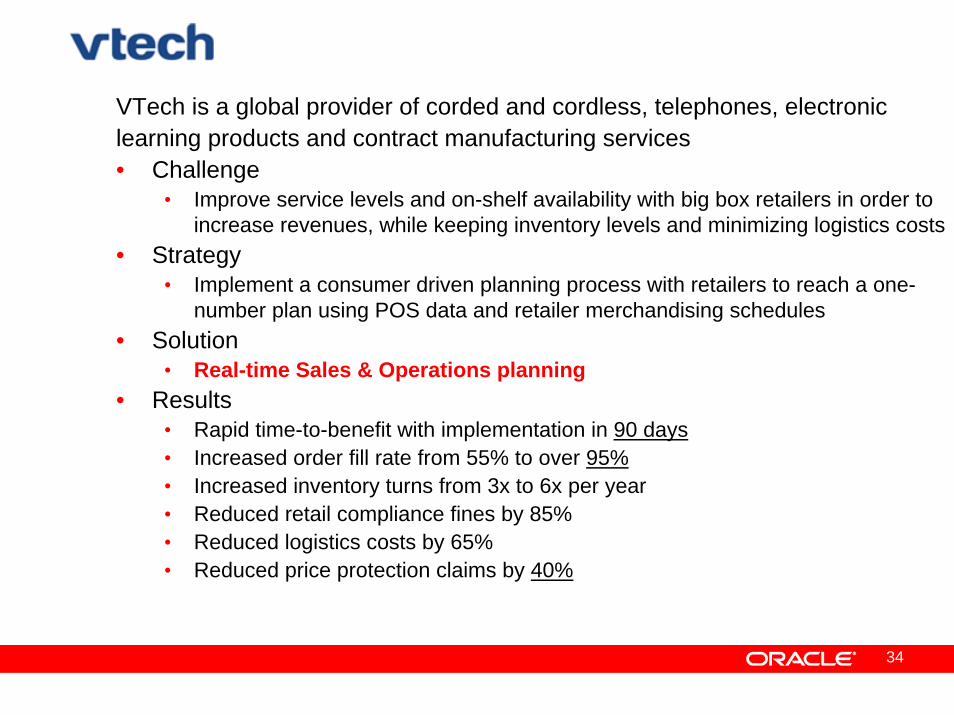
Vtech
VTech is a global provider of corded and cordless, telephones, electroniclearning products and contract manufacturing services• Challenge
• Improve service levels and on-shelf availability with big box retailers in order to increase revenues, while keeping inventory levels and minimizing logistics costs
• Strategy• Implement a consumer driven planning process with retailers to reach a one-
number plan using POS data and retailer merchandising schedules • Solution
• Real-time Sales & Operations planning• Results
• Rapid time-to-benefit with implementation in 90 days• Increased order fill rate from 55% to over 95%• Increased inventory turns from 3x to 6x per year • Reduced retail compliance fines by 85% • Reduced logistics costs by 65% • Reduced price protection claims by 40%
34
Trade Promotion Management
Overview
35
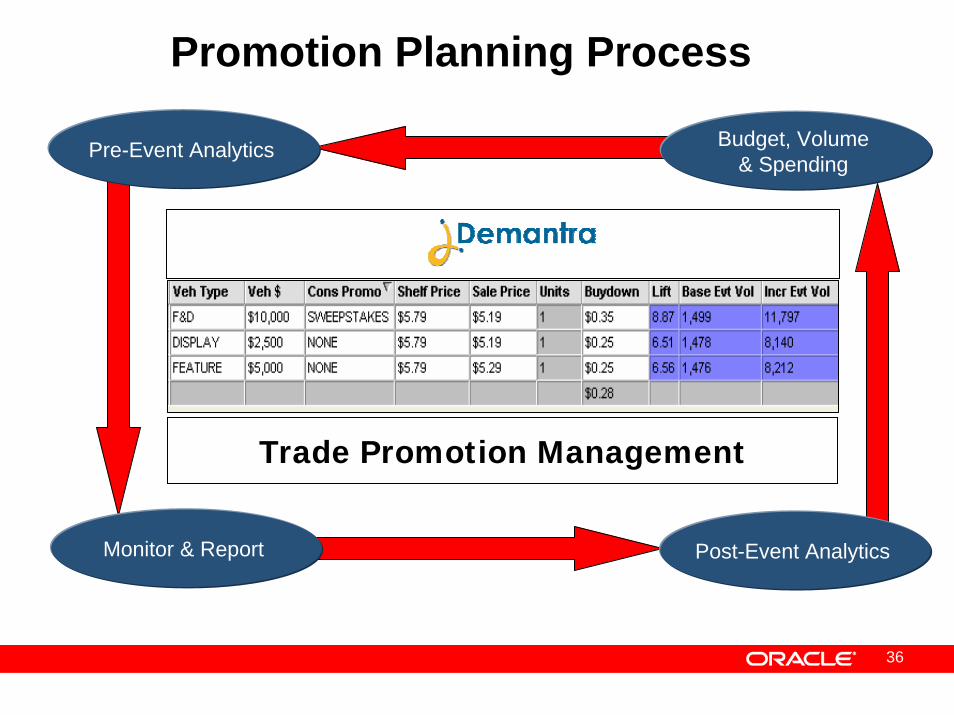
Promotion Planning Process
Monitor & Report
Budget, Volume & Spending
Post-Event Analytics
Pre-Event Analytics
Trade Promotion Management
36
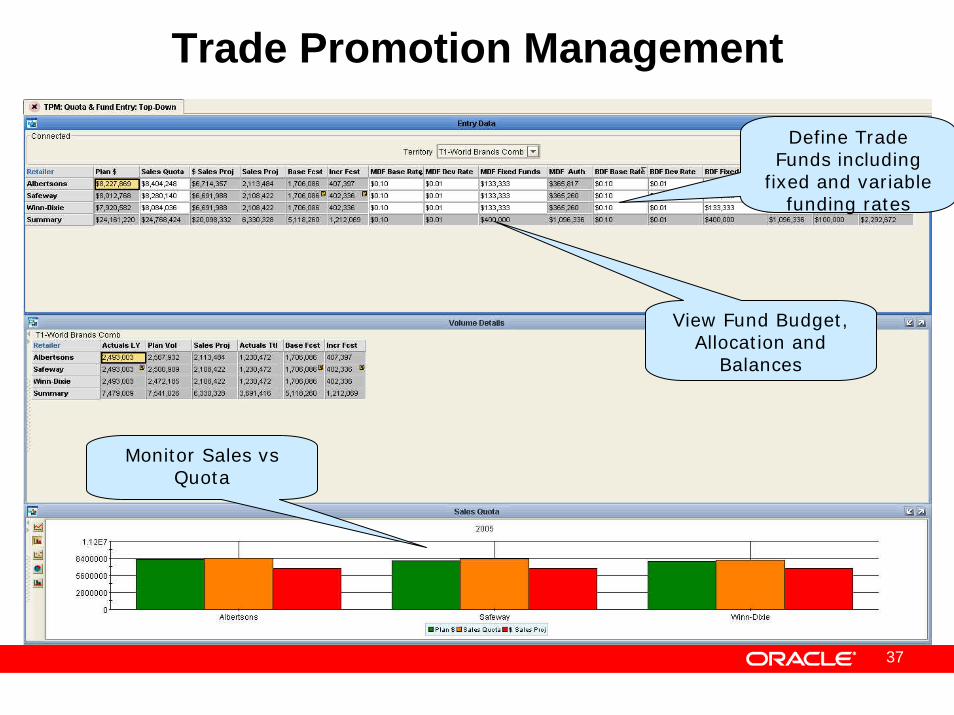
Define Trade Funds including
fixed and variable funding rates
View Fund Budget, Allocation and
Balances
Monitor Sales vs Quota
Screenshot
Trade Promotion Management
37
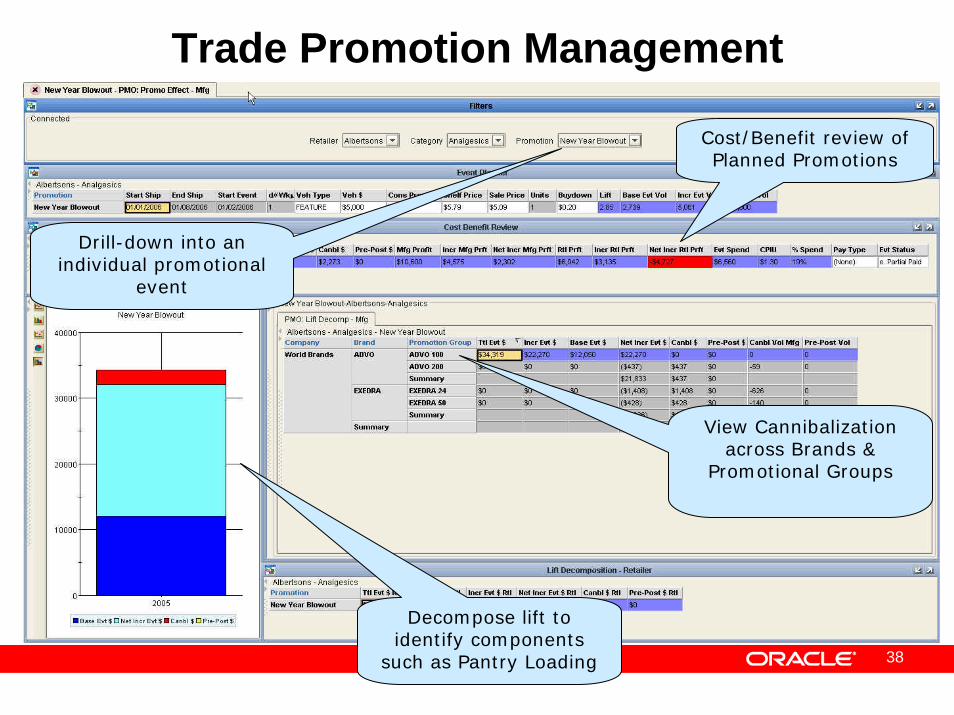
38
View Cannibalization across Brands &
Promotional Groups
Cost/Benefit review of Planned Promotions
Drill-down into an individual promotional
event
Decompose lift to identify components
such as Pantry Loading
Screenshot
Trade Promotion Management
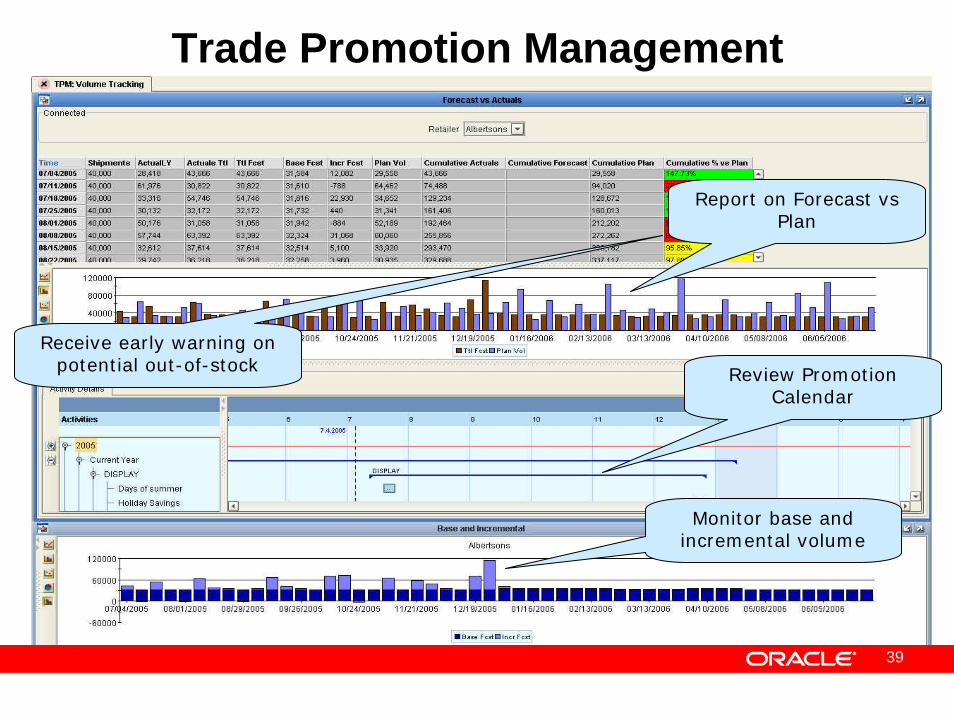
Monitor base and incremental volume
Report on Forecast vs Plan
Receive early warning on potential out-of-stock Review Promotion
Calendar
Screenshot
Trade Promotion Management
39
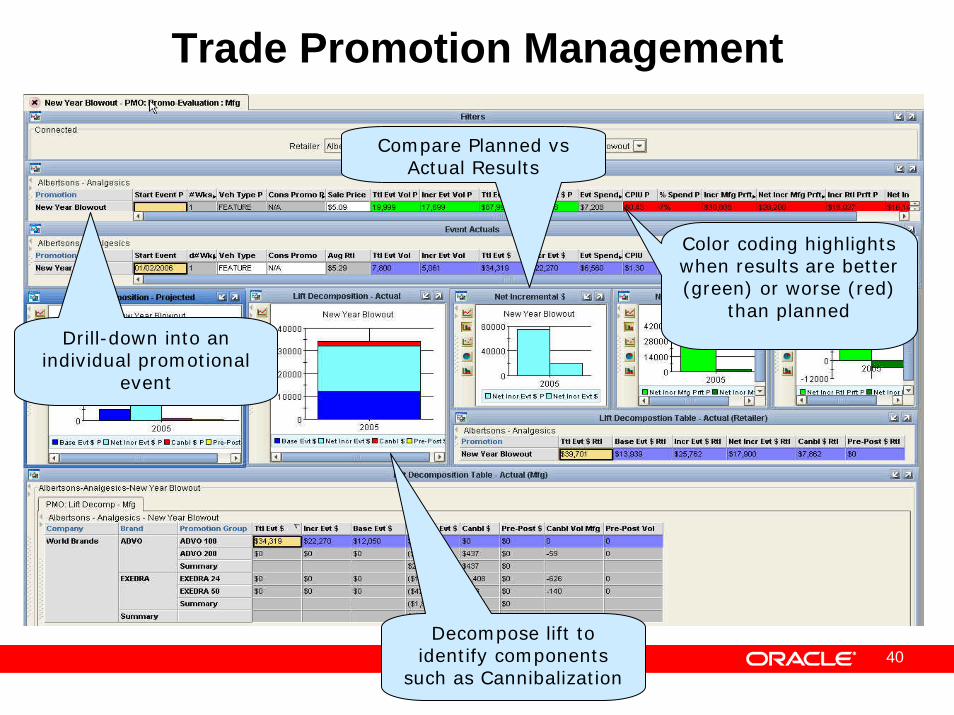
40
Color coding highlights when results are better (green) or worse (red)
than plannedDrill-down into an
individual promotional event
Decompose lift to identify components
such as Cannibalization
Compare Planned vs Actual Results
Screenshot
Trade Promotion Management
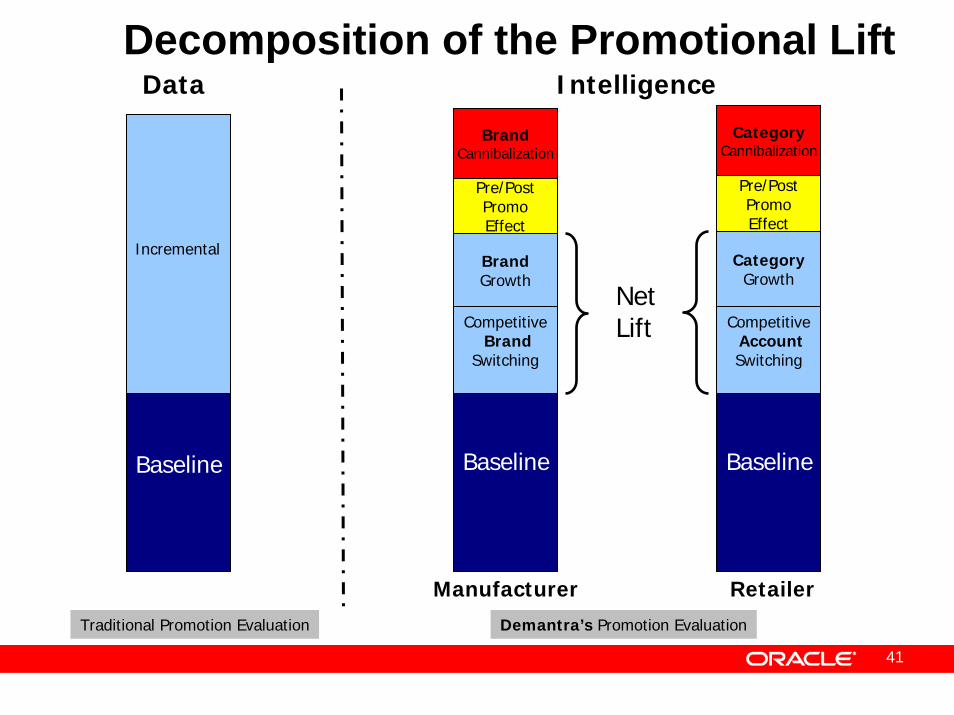
Baseline
Manufacturer Retailer
Incremental
CompetitiveBrand
Switching
BrandGrowth
Pre/PostPromoEffect
BrandCannibalization
Baseline
CompetitiveAccountSwitching
CategoryGrowth
Pre/PostPromoEffect
Baseline
Data Intelligence
NetLift
Traditional Promotion Evaluation
CategoryCannibalization
Demantra’s Promotion Evaluation
Decomposition of the Promotional Lift
41
Why Customers Buy Demantra for Trade Promotion Management
• Improve the efficiency and effectiveness of their trade dollars• Increase their promotional impact without increasing their trade budget
• Reduce their trade budget while maintaining the same level of promotional impact
• Predict the impact of future promotions• Base and Incremental Volume
• Cost, Profitability, and ROI
• Optimize promotions based on • Goals - profit, revenue, units and constraints - budget, timing, retail margin
• Calculate the true “Net Lift” of a promotion by identifying cannibalization and pantry loading
• Collaborative solution that can be extended to additional functional areas both internally (sales, marketing, finance,…) and externally (brokers, distributors, retail partners,…)
42
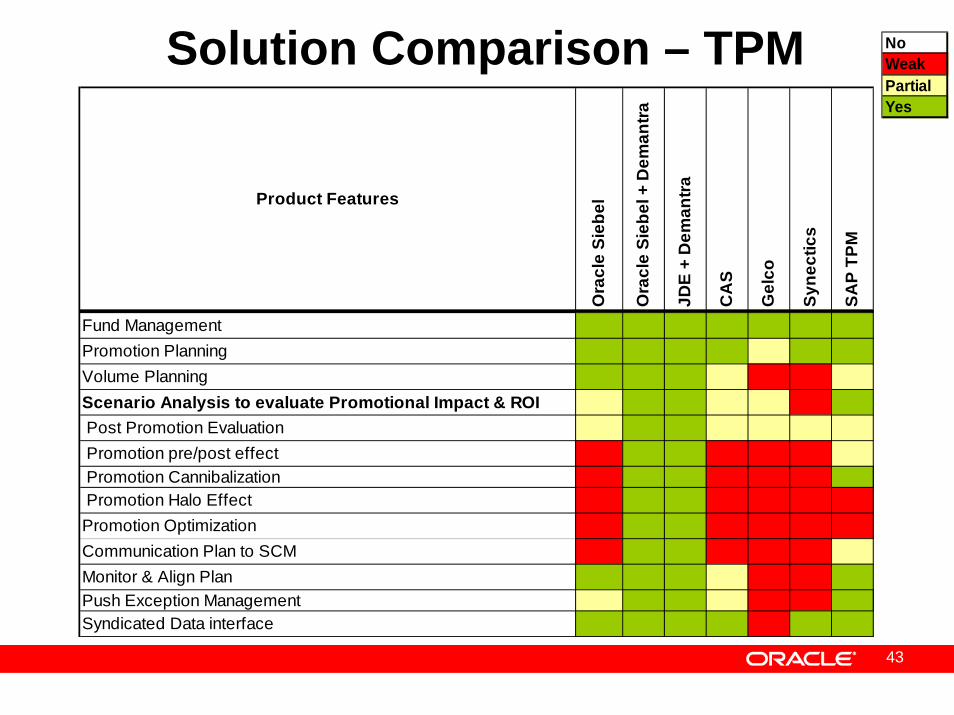
Product Features
Ora
cle
Sieb
el
Ora
cle
Sieb
el +
Dem
antra
JDE
+ D
eman
tra
CA
S
Gel
co
Syne
ctic
s
SAP
TPM
Fund ManagementPromotion PlanningVolume PlanningScenario Analysis to evaluate Promotional Impact & ROI Post Promotion Evaluation Promotion pre/post effect Promotion Cannibalization Promotion Halo EffectPromotion OptimizationCommunication Plan to SCMMonitor & Align PlanPush Exception ManagementSyndicated Data interface
NoWeakPartialYes
Solution Comparison – TPM
43
44
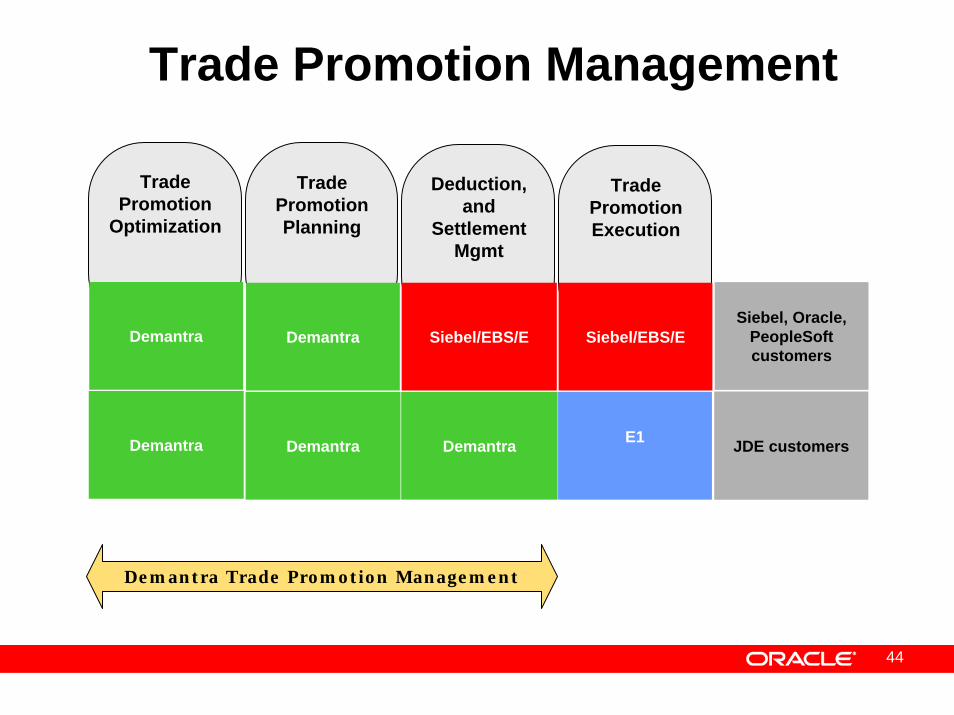
Trade Promotion Management
Trade PromotionPlanning
Demantra
Demantra
Deduction, and
SettlementMgmt
Siebel/EBS/E
Demantra
Trade PromotionExecution
Siebel/EBS/E
E1
JDE
Siebel, Oracle, PeopleSoft customers
JDE customers
Trade Promotion
Optimization
Demantra
Demantra
Demantra Trade Promotion Management
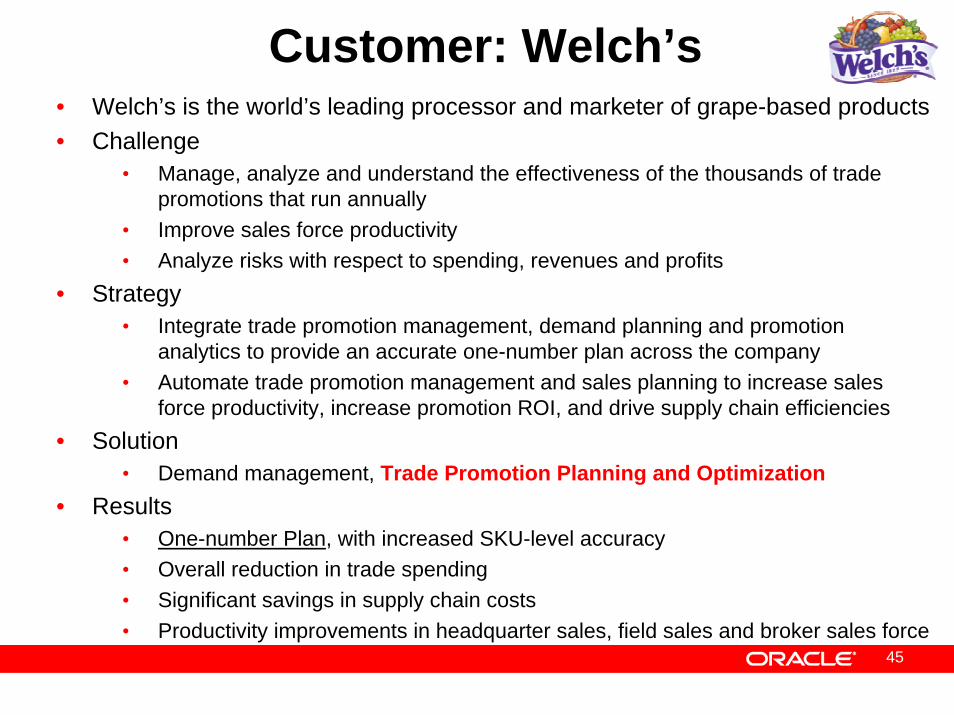
Customer: Welch’s• Welch’s is the world’s leading processor and marketer of grape-based products• Challenge
• Manage, analyze and understand the effectiveness of the thousands of trade promotions that run annually
• Improve sales force productivity• Analyze risks with respect to spending, revenues and profits
• Strategy• Integrate trade promotion management, demand planning and promotion
analytics to provide an accurate one-number plan across the company• Automate trade promotion management and sales planning to increase sales
force productivity, increase promotion ROI, and drive supply chain efficiencies• Solution
• Demand management, Trade Promotion Planning and Optimization• Results
• One-number Plan, with increased SKU-level accuracy• Overall reduction in trade spending• Significant savings in supply chain costs• Productivity improvements in headquarter sales, field sales and broker sales force
45
Integration Overview
46
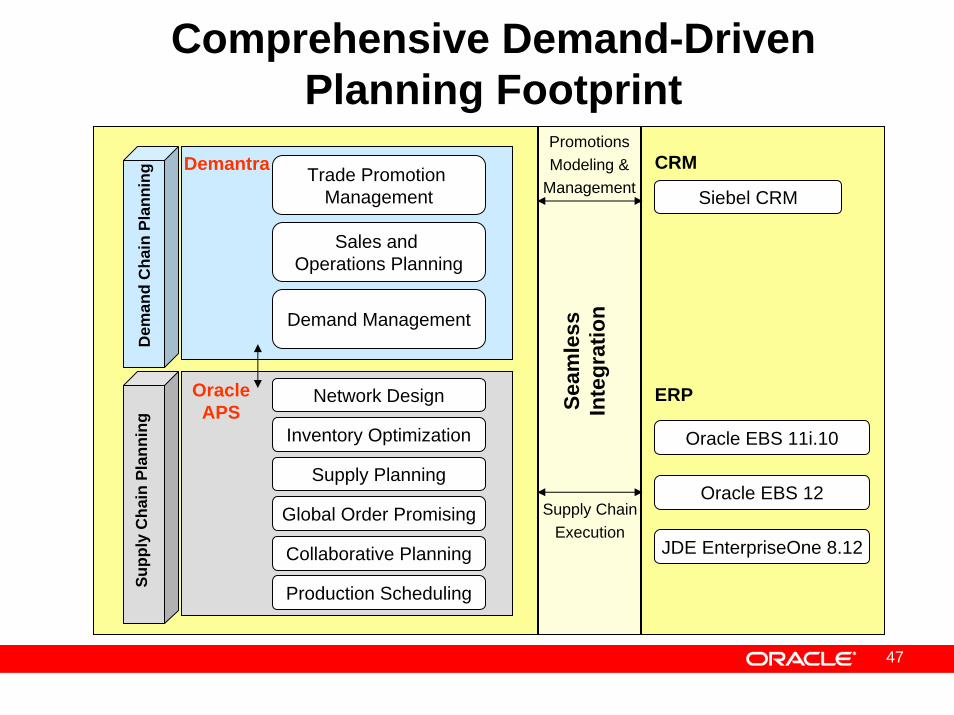
Comprehensive Demand-Driven Planning Footprint
Demantra Trade Promotion Management
Sales and Operations Planning
Demand Management
Dem
and
Cha
in P
lann
ing
Oracle APS
Network Design
Inventory Optimization
Supply Planning
Supp
ly C
hain
Pla
nnin
g
Global Order Promising
Collaborative Planning
Production Scheduling
ERP
Oracle EBS 11i.10
Oracle EBS 12
JDE EnterpriseOne 8.12
CRM
Siebel CRM
PromotionsModeling &
Management
Supply ChainExecution
Seam
less
Inte
grat
ion
47
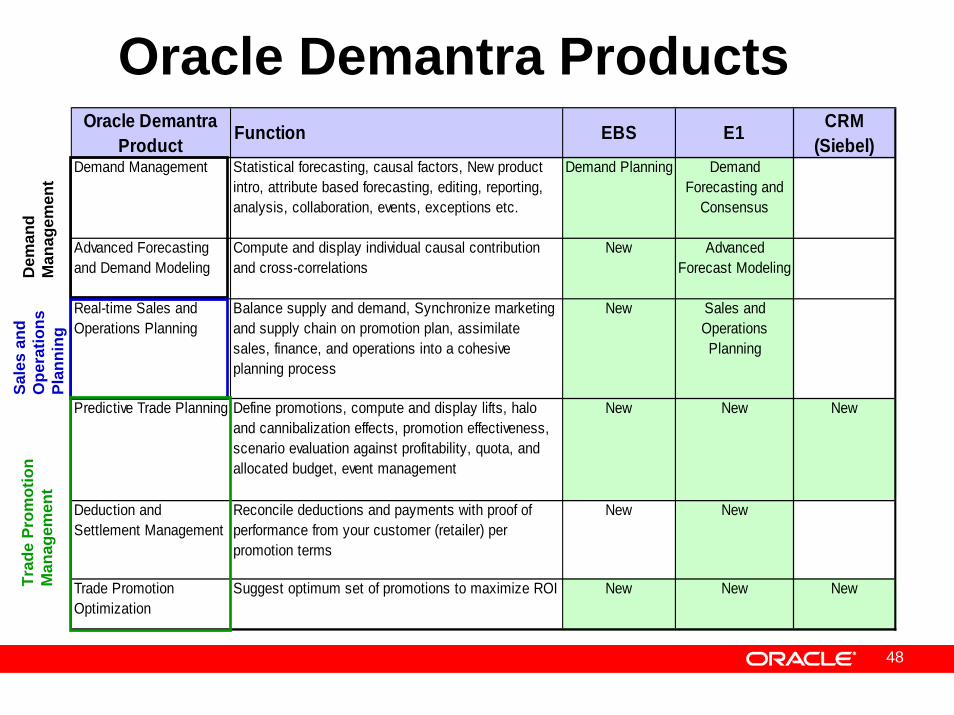
Oracle Demantra ProductsOracle Demantra
Product Function EBS E1 CRM (Siebel)
Demand Management Statistical forecasting, causal factors, New product intro, attribute based forecasting, editing, reporting, analysis, collaboration, events, exceptions etc.
Demand Planning Demand Forecasting and
Consensus
Advanced Forecasting and Demand Modeling
Compute and display individual causal contribution and cross-correlations
New Advanced Forecast Modeling
Real-time Sales and Operations Planning
Balance supply and demand, Synchronize marketing and supply chain on promotion plan, assimilate sales, finance, and operations into a cohesive planning process
New Sales and Operations Planning
Predictive Trade Planning Define promotions, compute and display lifts, halo and cannibalization effects, promotion effectiveness, scenario evaluation against profitability, quota, and allocated budget, event management
New New New
Deduction and Settlement Management
Reconcile deductions and payments with proof of performance from your customer (retailer) per promotion terms
New New
Trade Promotion Optimization
Suggest optimum set of promotions to maximize ROI New New New
Dem
and
Man
agem
ent
Sale
s an
d O
pera
tions
Pl
anni
ng
Trad
e Pr
omot
ion
Man
agem
ent
48
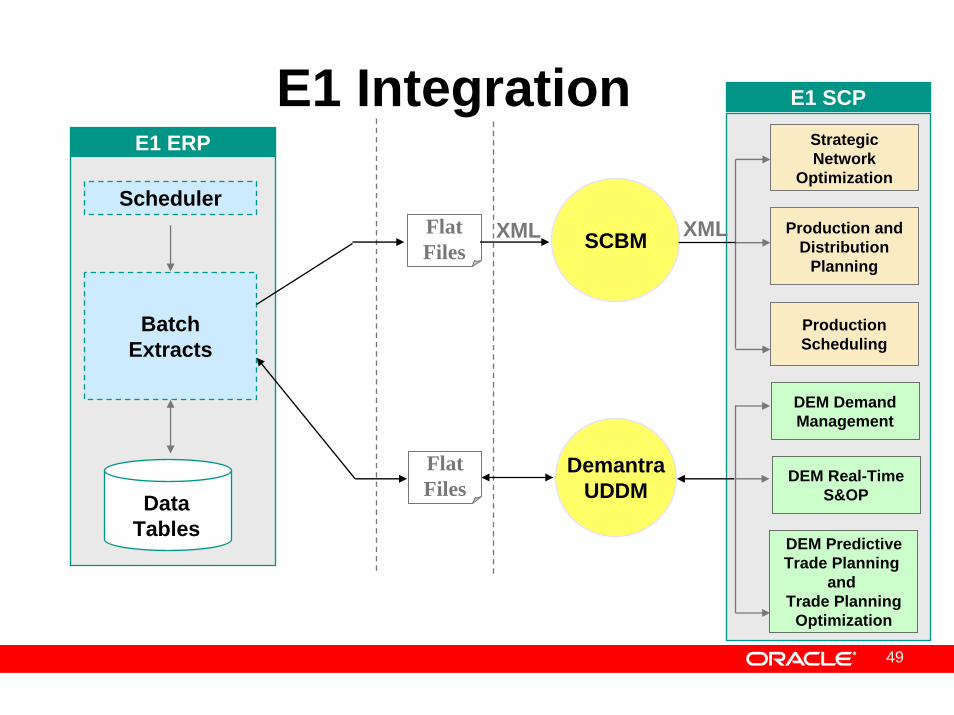
SCBM
ProductionScheduling
StrategicNetwork
Optimization
Production andDistribution
Planning
XML
FlatFiles
DEM DemandManagement
DEM PredictiveTrade Planning
and Trade Planning
Optimization
XML
DemantraUDDM
FlatFiles
BatchExtracts
Scheduler
E1 ERP
E1 Integration
DataTables
E1 SCP
DEM Real-TimeS&OP
49
50
E1 IntegrationKey features
• Utilize E1 flat file extracts
• Extracts enhanced to support incremental extraction
• For example: “most recent 4 weeks of sales history”
• Demantra forecasts output to E1
• SCP (SNO, PDP, PS) access Demantra output via existing E1-SCBM integration

Shape Demand
Understand Demand
Respond to Demand
Plan for Demand
Retail Planning & Store
Replenishment
Demand Management
Trade Promotion Management
Trade Promotion Management
Real-Time Sales and Operations PlanningReal-Time Sales and Operations Planning
Business Process PlatformBusiness Process Platform
Demantra’s End-to-End Solution
51

Q &A
52