Embed Size (px)
Citation preview

Health Consultation
Groundwater Subsurface Vapor Outdoor and Indoor Air Data Review
FORMER NEODESHA OLD REFINERY SITE
NEODESHA WILSON COUNTY KANSAS
OCTOBER 10 2012
US DEPARTMENT OF HEALTH AND HUMAN SERVICES
Agency for Toxic Substances and Disease Registry
Division of Community Health Investigations
Atlanta Georgia 30333
Health Consultation A Note of Explanation
An ATSDR health consultation is a verbal or written response from ATSDR to a specific
request for information about health risks related to a specific site a chemical release or the
presence of hazardous material In order to prevent or mitigate exposures a consultation may
lead to specific actions such as restricting use of or replacing water supplies intensifying
environmental sampling restricting site access or removing the contaminated material
In addition consultations may recommend additional public health actions such as conducting
health surveillance activities to evaluate exposure or trends in adverse health outcomes
conducting biological indicators of exposure studies to assess exposure and providing health
education for health care providers and community members This concludes the health
consultation process for this site unless additional information is obtained by ATSDR which
in the Agencyrsquos opinion indicates a need to revise or append the conclusions previously
issued
You May Contact ATSDR TOLL FREE at
1-800-CDC-INFO
or
Visit our Home Page at httpwwwatsdrcdcgov
HEALTH CONSULTATION
Groundwater Subsurface Vapor Outdoor and Indoor Air Data Review
FORMER NEODESHA OLD REFINERY SITE
NEODESHA WILSON COUNTY KANSAS
Prepared By
Agency for Toxic Substances and Disease Registry
Division of Community Health Investigations
Eastern Branch
Neodesha Former Refinery site Neodesha Wilson County KS Health Consultation
Table of Contents
Summary and Statement of Issues 1
Background 4
Community Health Concerns4
ATSDRrsquos Exposure Pathway Analysis and Evaluation Process 5
Discussion 6
Conclusions17
Recommendations17
Public Health Action Plan17
Authors Technical Advisors 19
References20
Figure 1 Former Neodesha Smelter Area Monitoring Well Network Map24
Figure 2 Benzene Concentration versus Time26
Figure 3 Benzene Concentration Contours27
Figure 4 Subsurface Vapor Sampling Locations
Figure 5 Ourdoor Air Sampling Locations
Figure 6 Indoor Air Sampling Locations 28
Figure 7Benzene Concentration Distribution
Table 1mdashSummary of soil vapor results October 1999 Neodesha KS 29
Table 2 mdash Summary of Soil Vapor Samples Results December 2002 Neodesha KS 32
Table 3mdash Summary Subsurface Vapor Sampling VOC Results March November and
December 2008 33
Table 4 mdashOutdoor Air sampling Results 2000 2004 and 2008 35
Table 5 ndash Indoor Air Sampling Results 20002004 and 2008
Appendix A Cancer Risk Estimate for VOC Exposures 39
Appendix B ATSDRrsquos comparison values and definitions 40
i
Summary and Statement of Issues
Introduction The Agency for Toxic Substances and Disease Registryrsquos (ATSDR) top
priority is to ensure that the people living near the Neodesha former
refinery site located within the Municipality of Neodesha Kansas have
the best information possible to safeguard their health
In response to a petition from a community member in Neodesha the
Agency for Toxic Substances and Disease Registry (ATSDR) released a
Health Consultation titled ldquoNeodesha Refinery (former Amoco
Refinery)rdquo for public comment in October 2003 that evaluated potential
exposures to environmental contaminants During the public comment
period numerous comments were received from community members
Kansas Department of Health and Environment (KDHE) city officials
and personnel of BP Products North American Inc (BP)
Since the release of the document for ldquoPublic Commentrdquo additional
investigations have been conducted at the site and additional
environmental data were available for review As a result ATSDR has
chosen to produce a series of documents that focus on 1) lead levels at
the New Beginnings facility 2) metals in soil in other areas of the
former refinery site 3) metals in soil at the smelter site and 4) volatile
organic compounds (VOCs) in ground water soil vapor and ambient
and indoor air at the former refinery site ATSDR released three health
consultations regarding the soil contaminations at the New Beginnings
facility in other areas of the former refinery site and at the former
smelter area in April 2006 June 2007 and October 2007 respectively
This is the fourth document in the series In this document ATSDR
reviews VOC data for groundwater soil vapor and indoor and outdoor
air to determine if exposures are occurring and if so the health
implications of the exposures
Conclusions ATSDR reached the following conclusions in the health
consultation
Conclusion 1 Breathing indoor and outdoor air at the former refinery site in
Neodesha KS is not expected to harm peoplersquos health
Basis for
conclusion
Next steps
The levels of VOCs in the indoor and outdoor air were at
levels below that which would result in adverse health effects
The groundwater is contaminated with VOCs at the former
refinery The VOCs in the groundwater may volatilize into the
indoor and outdoor air through vapor intrusion BP and other
1
potentially responsible parties (PRPs) will continue the
groundwater monitoring programs at all affected areas Soil
vapor and air samples will be collected if groundwater VOC
levels exceed the screening values in KDHE Risk-based
Standards
Conclusion 2 The general trend in groundwater contamination is decreasing across
the site It appears that the groundwater plume is not spreading but has
varied through the years
Basis for
conclusion
ATSDR used the benzene concentrations as an indication of the extent
of groundwater contamination at the site ATSDR compared benzene
isoconcentration contours from 2000 to 2007 and evaluated thirty-eight
off-site monitoring wells with time series plots to determine the spatial
extent of the groundwater contamination
Next Steps
BP and other PRPs will continue the groundwater monitoring programs
at all affected areas especially at the northeast and southwest corners
of the plume where benzene concentrations in monitoring wells 93 and
135 showed an upward trend
Conclusion 3
Basis for
conclusion
Next Steps
Possible vapor intrusion is not expected to result in exposure via indoor
air contaminants at levels of health concern for the site
All detected VOC concentrations in soil vapor samples collected at
residential and public buildings are below action levels recommended
in the EPA draft guidance on indoor vapor intrusion In addition
indoor air samples did not find elevated levels of VOCs
ATSDR and KDHE will continue to work with the community BP and
other responsible parties to respond to public health questions and
concerns about the site
2
For More For further information about this public health assessment please call
Information ATSDR at 1-800-CDC-INFO and ask for information about the
ldquoNeodesha Former Refinery Siterdquo If you have concerns about your
health you should contact your health care provider
3
Background
The former refinery property encompasses approximately 185 acres in the west part of
Neodesha Kansas The refinery operated for 73 years from 1897 until 1970 The former refinery
property is currently owned by the city of Neodesha Williams Pipe Line Company and various
other businesses The area is now occupied by light industries and small businesses There are a
few residences adjacent to the north and northwest site boundaries the city of Neodesha is
directly east
Since the early 1980s environmental investigation and remediation activities were conducted by
KDHE BP and other businesses located at the site Contaminates of concern for the site include
a plume of benzene toluene ethylbenzene and xylenes (BTEX) in groundwater metals and
petroleum hydrocarbons in the soil
In October 2003 ATSDR responded to a petition from a community member concerned about
exposures to environmental contamination from past refinery operations and released a Health
Consultation titled ldquoNeodesha Refinery (former Amoco Refinery)rdquo for public comment [ATSDR
2003a] Since the release of the document for ldquoPublic Commentrdquo additional investigations were
conducted at the site and additional environmental data were available for review As a result
ATSDR has prepared a series of documents that focus on 1) lead levels at the New Beginnings
facility 2) metals in soil in other areas of the former refinery site 3) metals in soil at the smelter
area and 4) volatile organic compounds in ground water soil vapor and ambient and indoor air
at the former refinery site
In April 2006 ATSDR released a health consultation that addressed the New Beginnings facility
lead contamination Lead levels in the surface soil samples collected on and near the New
Beginnings facility ranged from 156 to 181 mgkg of soil which are below health-based
comparison values and are not likely to result in adverse health effects ATSDR concluded that
the surface soil at New Beginnings facility poses ldquoNo Apparent Public Health Hazardrdquo to people
working or visiting the facility [ATSDR 2006] In June 2007 ATSDR released the second health
consultation that reviewed available soil metals data in other areas of the former refinery site
and assessed the possible implication of exposures to soil contaminants ATSDR concluded the
areas pose ldquoNo Apparent Public Health Hazardrdquo [ATSDR 2007a]
In October 2007 ATSDR released the third health consultation that addressed the soil metals
contamination at the former Neodesha smelter area ATSDR has categorized this area as
constituting an ldquoIndeterminate Public Health Hazardrdquo because soil contamination
characterization in the residential area is limited and additional soil sampling was recommended
to fully characterize the soil contamination [ATSDR 2007b]
This fourth health consultation addresses the volatile organic compounds in ground water soil
vapor and outdoor and indoor air at the former refinery site
Community Health Concerns
As part of the response to the petition to investigate exposure to contamination ATSDR staff
participated in many public meetings reviewed site documents received numerous calls from
4
residents and conducted public availability sessions and public meetings to understand
community memberrsquos concerns regarding the contamination investigation and remediation of
the site ATSDR addressed community concerns regarding soil exposures in the previous three
health consultations Community environmental health concerns related to groundwater
contamination include the following
bull Possible vapor intrusion into homes and buildings from BTEX contaminated groundwater
and soil vapor and
bull Potential impact to surface water by recharge from the contaminated groundwater and
surface runoff from the site
ATSDR addresses community concerns related to the groundwater contamination in this health
consultation
Exposure Pathway Analysis
ATSDR evaluates ways that people may come into contact with contaminated media that may
lead to people being exposed to the contaminants (exposure pathways) ATSDR provides site-
specific public health recommendations based on an evaluation of the toxicological literature
levels of environmental contaminants detected at a site compared to accepted comparison values
(CV) and the characteristics of the exposed population and the frequency and duration of
exposure ATSDR used this approach to determine if groundwater contamination at the former
refinery site posed a public health hazard
In general to select CVs the hierarchy described in the ATSDR Public Health Guidance manual
was used In some cases professional judgment was used to select the most appropriate CVs for
the specific site conditions [ATSDR 2005]
ATSDR used the following CVs for this health consultation the ATSDRrsquos environmental media
evaluation guide (EMEG) reference dose media evaluation guide (RMEG) cancer risk
evaluation guide (CREG) and minimal risk levels (MRL) the EPArsquos screening values from the
draft guidance on indoor vapor intrusion the Regional Screening Level (RSL) and the Maximum
Contaminant Level (MCL) and the KDHE Risk-Based Standards for Kansas (RSK) [KDHE
2010]
Vapor intrusion of contaminants from the soil vapor and groundwater into the indoor air of
buildings was identified as a potential exposure pathway Ingestion (drinking) and dermal (skin)
contact exposures were not identified as pathways because 1) the city drinking water source is
surface water from the Fall River down gradient from the site 2) no private wells are located in
the city of Neodesha and 3) the city has an ordinance to prohibit the use of groundwater for
private wells
5
Vapor intrusion is the migration of VOCs from the subsurface- contaminated groundwater and
soil through the pore spaces of soil into buildings above The air
within the pore spaces of soil is called subsurface vapor in some
cases also called soil gas or soil vapor [ATSDR 2001a ATSDR
2008 EPA 2002 and EPA 2008] Subsurface vapors can enter
residences and other buildings through foundation cracks and gaps
mechanical ventilation systems and leakage areas (for example
utility entry points construction joints and drainage systems)
Subsurface vapor levels are affected by many factors such as water
and air movements temperature variations in soil and atmosphere molecular diffusion
biodegradation barometric pressure precipitation building structures and pressure differences
between the inside and outside of buildings [Kildiff 2002] In recent years subsurface vapor
sampling data have been used to qualify andor quantify indoor air risk through computer
modeling The model (eg the Johnson and Ettinger Model) is based on a number of simplifying
assumptions regarding contaminant distribution and occurrence subsurface characteristics
transport mechanisms and building construction Therefore the model can be used only as a
screening tool to identify conditions that may warrant additional evaluation [EPA2005] Soil
vapor monitoring and modeling results also do not provide actual measurements of
concentrations of contaminants that people may breathe Subsurface vapors migrating indoors
are greatly diluted with outdoor air that enters the home and by diffusive advective or other
attenuating mechanisms as the vapor migrates through the soil Therefore directly measuring
indoor air quality in potentially impacted buildings is often the best approach to evaluate air
contamination at points of exposure
Another potential exposure pathway is surface water if contaminants from surface runoff and
groundwater recharge reach the Fall River
Discussion
Available environmental data for this evaluation and data quality
ATSDR evaluated the available environmental sampling information for potential exposure to
groundwater contaminants at the site Since 1981 numerous investigations of ground water
subsurface vapor indoor and outdoor air samples were conducted at the former refinery and the
city of Neodesha to evaluate the extent of contaminationlowast The following is a summary of all
data used in this evaluation
bull Groundwater semiannual monitoring from 1991 to 2007
bull Subsurface vapor (soil vapor) sampling information in 1999 2002 and 2008
bull Indoor and outdoor air sampling information from 2000 to 2008 and
bull Surface water sampling data from 1992 to 2007
lowast Groundwater contamination was also discovered in two other areas adjacent to the original plume The
contamination is associated with two facilities that used chlorinated compounds such as tetrachloroethene (PCE) and
trichloroethene (TCE) KDHE and potential responsible parties (PRPs) have carried out investigations since 2002
for those facilities ATSDR did not review data associated with those two facilities
6
ATSDR also reviewed information on Quality Assurance (QA)Quality Control (QC)
specifications for field data quality and laboratory data quality to verify the acceptability and
adequacy of data including Chain of Custody sheets project narratives and laboratory
certifications The laboratory analysis methods and the QAQC procedures were appropriate
Therefore the results were considered valid and are included in the evaluation
Environmental data evaluation and public health impacts
The public health evaluations for groundwater soil vapor outdoor and indoor air and surface
water data are presented below
Groundwater samples
The former refinery and the city of Neodesha are located north of the confluence of the Verdigris
and Fall Rivers Shallow groundwater occurs primarily in alluvial sand and gravel deposits The
aquifer is sandwiched between surficial clay soils and bedrock on the bottom Depth to
groundwater varies seasonably within a range of approximately 3 to 40 feet below ground
surface The general groundwater flow is to the southwest south and southeast of the site
towards the Fall and Verdigris Rivers [RETEC 2005]
The first groundwater monitoring wells were installed in 1981 at the site Additional wells were
installed throughout the 1980rsquos and 90rsquos Over 130 monitoring wells were installed on-site and
off-site in the city of Neodesha Numerous temporary groundwater monitoring wells were also
operated throughout Neodesha and the site Figure 1 shows the monitoring well locations on-site
and off-site
Although a completed human exposure pathway for drinking groundwater does not exist at this
site ATSDR reviewed the groundwater data to identify areas where there may be a potential for
vapor intrusion and to address community concerns Groundwater monitoring well data can be
used to define the horizontal and vertical extent of groundwater contamination In addition the
monitoring well data may indicate areas where indoor air might have been affected and what
might happen in the future
Ongoing sampling of the groundwater occurs on a semi-annual basis since 1999 Samples were
analyzed for VOCs and metals using EPA Methods 8260 and 6020 respectively The historical
groundwater quality data provided to ATSDR included six selected chemicals including benzene
ethylbenzene toluene total xylenes naphthalene and lead Because benzene is commonly found
at the site ATSDR reviewed the benzene data to determine the extent of groundwater
contamination and to identify areas of potential vapor intrusion BP reported a downward trend
in benzene concentrations among 17 older off-site wells with more historical data [ENSR 2008]
ATSDR evaluated an additional 21 off-site monitoring wells with the time series plots on
benzene concentrations The general trend in benzene concentrations is downward across the site
over time However at the southeast tip of the plume benzene concentrations in monitoring
wells 93 and 135 showed an upward trend (see Figure 2)
7
Regarding the stability of the plume boundaries Figure 3 shows the benzene concentration
contours (5microgl) in groundwater samples in the monitoring well network from 2000 to 2007 It
appears that the groundwater plume is not spreading but some variations exist through the years
The most recent plume contour is smaller compared to the previous years For example in fall
2006 BP collected split samples from temporary monitoring wells during a plaintiffs
investigation the estimated benzene contour has expanded at the northeast and southwest corners
of the plume compared to previous years Recent communication with KDHE indicated that the
current groundwater monitoring results were similar to the historical data ATSDR evaluated and
no significant changes were observed [ATSDR 2011] Because concentrations in some wells
are increasing ATSDR recommends continuing the groundwater monitoring programs at all
affected areas as a prudent public health practice
Subsurface Vapor Samples
There are different ways of measuring subsurface vapor concentrations When subsurface vapor
samples are collected exterior to a building at varying depths in the unsaturated zone (vadose
zone) they are called soil gas or soil vapor samples When subsurface vapor samples are
collected directly under a building the samples are often called sub-slab samples Subfloor vapor
concentrations may be measured in building crawlspaces these samples represent the vapor
concentration underlying a buildingrsquos living space Crawlspace samples may be evaluated in a
manner similar to subsurface vapor samples although there tends to be less attenuation from
crawlspace to indoor air than from subsurface to indoor air [EPA 2008] Subsurface vapor levels
are affected by many factors and do not provide actual levels of contaminants that people may
inhale therefore subsurface vapor levels can be used as screening levels to identify conditions
that may warrant additional evaluation
8
Vapor Intrusion Exposure Pathways
ATSDR received information on subsurface vapor for four sampling events in 1999 2002 2004
and 2008
bull In September and October 1999 BP collected 14 soil vapor samples at different locations
in Neodesha to characterize soil vapor concentrations as part of the Phase III Remedial
Investigation [ThermoRetec 2000] Soil vapor samples were collected from 14 different
locations from depths of 4 to 16 feet below ground surface (bgs) respectively Sampling
locations can be seen in Figure 4 All samples were analyzed on site for benzene using
Modified EPA Method 8021 Benzene was detected in all soil vapor samples including
9
those considered to represent background conditions (samples SV-3 SV-6 and SV-10)
These results can be found in Table 1 The average benzene concentration was 5429 microg
m3
with a range of 1786 to 91889 microg m3 Benzene concentrations at two locations (SVshy
8 and SV-9) exceeded the screening value of 310 microgm3
in EPArsquos Draft Guidance for
Evaluating the Vapor Intrusion to Indoor Air Pathway from Groundwater and Soils [EPA
2002] Based on this soil vapor investigation indoor and outdoor air sampling was
conducted to assess potential human exposures in 2000
bull In December 2002 seven soil vapor samples were collected from two locations (near
MW-31 see Figure 4) on the foundation area of a proposed building on site Soil vapor
samples were collected at 3 6 and 9 feet bgs Soil vapor samples were tested for 39
analytes and were screened using target soil vapor concentrations in accordance with
EPArsquos Draft Guidance Ten of these analytes were detected and eight were detected at
concentrations above their respective target soil vapor concentrations [RETEC 2003] See
Table 2 for the maximum detected concentrations of VOCs in the two soil vapor samples
However the proposed building was not constructed Therefore human exposure through
vapor intrusion at this location is not expected
bull In April 2004 KDHE collected one sub-slab sample in the basement of the Heller
Elementary to evaluate the potential vapor intrusion from groundwater contamination of
Airosol Company Inc (Airosol) site Available information indicated that chlorinated
compounds were not detected [KDHE 2008]
bull In March 2008 in response to a request by Unified School District the KDHE Bureau of
Environmental Remediation performed a vapor intrusion evaluation from groundwater
contamination of the former refinery site and the Airosol site for several school buildings
in Neodesha KS Three schools were sampled as a part of this evaluation Eight sub-slab
grab samples were collected in one-liter SUMMAtrade canisters [KDHE 2008] In
November and December 2008 an additional 15 sub-slab grab samples were collected at
10 locations overlying the Airosol site groundwater plume All samples were tested for
53 different components 36 of which were detected [KDHE 2009] See Table 3 for
analytical results for detected chemicals and Figure 4 for sampling locations
Overall ATSDR evaluated a total of 45 subsurface vapor samples (soil vapor and sub-slab
samples described above) collected from 30 different locations throughout the site and the City
of Neodesha All detected VOC concentrations are below levels recommended in the EPA draft
guidance on indoor vapor intrusion except for benzene at two locations (SV-8 and SV-9) [EPA
2002] Because of the benzene concentrations and community concerns KDEH and PRPs
collected indoor and outdoor air samples in the areas Those sampling events will be discussed
in the next sections
Outdoor and indoor air samples
Outdoor air
Outdoor air sampling information for 2000 2004 and 2008 are available for this evaluation
10
In February 2000 BP collected a total of 13 outdoor air samples (6 composite and 5 grab
samples at five locations on former refinery property and two grab samples near the high school)
In May 2000 an additional 20 samples were collected at the same 5 locations on 4 different
dates At each location a 24-hour sample was collected and analyzed according to EPA method
TO-15 [TermoRetec 2001] All samples were tested for benzene toluene ethylbenzene and
xylenes (BTEX)
In February 2004 Air Technology Laboratories (ATL) collected five outdoor air samples for
BTEX evaluation All outdoor air samples were collected at three on-site locations Further
KDHE split two of these samples and performed confirmatory analysis [KDEH 2004]
In February November and December 2008 in response to a request by Unified School District
the KDHE Bureau of Environmental Remediation performed vapor intrusion evaluations of
several school buildings in Neodesha KS As part of the investigations a total of 10 outdoor air
samples were collected at four locations including near the schools and a private residence
Samples were evaluated for 47 different VOCs including BTEX [KDHE 2008 2009]
Table 4 is a summary of maximum levels for each chemical detected during each of the sampling
events described above Sampling locations can be seen in Figure 5 The levels of detected
VOCs in samples are below their respective CVs with the exception of seven compounds
benzene methylene chloride PCE TCE 1 2-dichloroethane chloroform and
dibromochloromethane The concentrations of the above VOCs exceeded their respective cancer
screening values Further evaluations of those compounds will be discussed in the Public Health
implications section
Indoor air
ATSDR reviewed indoor air data from sampling events in 2000 2003 2004 and 2008
bull In May 2000 BP collected 52 indoor air samples in accordance with the environmental
assessment plan for the former refinery site Thirty one samples were collected from
homes above the groundwater plume area (defined as the area east of 11th
street south of
Granby Avenue north of Illinois Street and west of 5th
avenue) and 16 samples were
collected outside the area for comparison [ThermoRetec 2001] During this sampling
event BP collected indoor air samples at homes of different construction which included
2 homes with slabs 11 homes with crawlspaces and 7 homes with basements Three of
each type were also sampled outside the plume area Samples were collected from the
primary living space in the lowest living area halfway between the ceiling and the floor
and near the center of the room KDHE collected co-located samples at 18 homes in the
plume area and at 10 other homes Specifics of sampling locations were not provided in
the data report to protect resident privacy See Figure 6 for a map of the plume area
Residents were asked to close windows and doors for at least 12 hours before the
sampling event to reduce contaminant dilution with outdoor air and to detect worst case
exposures Sampling locations were screened with a Combustible Gas Indicator (CGI) to
identify potential natural gas leaks and a Photo Ionization Detector (PID) to screen for
VOCs Questionnaires were administrated to the occupant to determine any other indoor
sources of VOCs Air samples (24-hour composite) were collected following the CGI and
PID screening using stainless steel evacuated canisters Collected samples were sent to
11
Severn Trent Laboratories for analysis All samples were tested for BTEX using EPA
Method TO15 Benzene was detected above the CREG in nearly all samples
bull In March 2003 BP took four 24-hour composite indoor air samples [RETEC 2003] Two
samples each were collected from the New Beginnings facility and the day care near the
site The samples were collected according to EPA Method TO-15 and analyzed for
BTEX compounds One sample was analyzed for 50 VOCs and sixteen VOCs were
detected
bull In February 2004 Air Technology Laboratories (ATL) collected 16 indoor air samples
and KDHE collected 7 indoor air split samples [KDEH 2004] Indoor air samples were
taken from two off-site locations and four on-site locations from residential and public
buildings Sampling locations can be seen in Figure 6 All samples were tested for BTEX
compounds using EPA Method TO15
bull In March and November 2008 in response to a request by Unified School District the
KDHE Bureau of Environmental Remediation performed vapor intrusion evaluations of
several school buildings in Neodesha KS [KDHE 2008 2009] Three schools and 4
homes were sampled as a part of this investigation Sampling locations can be seen in
Figure 6 All sampling locations were selected based on a variety of different criteria
such as presence of floor covering centrality and presence of underground utilities A
total number of 52 indoor air samples were collected during the two sampling events All
samples were collected in individually certified six-liter stainless steel evacuated
SUMMA trade canisters equipped with flow controllers set for approximately eight-hour
samples All samples were analyzed by Pace Analytical an off-site contract laboratory
and were tested for 57 different components 29 of which were detected
In summary a total of 122 indoor air samples were collected in 36 buildings throughout the site
and the City of Neodesha between 2000 and 2008 Confidence in the sampling to detect
variability in vapor migration over time is enhanced by the multiple sampling events Thirty two
VOCs were detected among 57 analytes Concentrations of 6 VOCs exceeded their respective
cancer screen values and will be discussed further below The VOCs are benzene methylene
chloride PCE TCE 1 2-dichloroethane and chloroform The maximum concentrations detected
for each chemical detected in each sampling event are presented in Table 5 In general the
indoor air concentrations of detected chemicals are higher than that of outdoor air Therefore
ATSDR used the indoor air concentrations for discussion of public health implications
It should be noted that indoor air quality assessment poses several challenges and needs to be
treated from a broad perspective First in addition to soil vapor a variety of significant sources
of VOCs also contribute to the indoor air quality A second complication is that indoor inhalation
risk is often driven by very low VOC concentrations which may often be near or below even
state-of-the art laboratory analytical detection limits Third understanding and defining
background indoor VOC concentrations is important but difficult because the reported range is
large For example the background indoor benzene concentration measured in North American
residences since 1990 ranged from non-detect up to 460 micrograms per cubic meter (microg
m3)[EPA 2011] Additionally up to a 1000 fold variability has been documented in sub-slab gas
concentrations under individual buildings and ten-fold variability was found for sub-slab gas in
12
different seasons (EPA 2008) Therefore sampling strategies should investigate the influence
that space and time can have on air contaminant levels and their migration
Surface water samples
ATSDR evaluated surface water samples taken from the Fall River and Verdigris River to
address community concerns There were 96 surface water samples collected from 1992 to 2007
Samples were taken at 8 locations up-gradient and down-gradient from the site All samples were
analyzed for lead (potential impact from surface runoff because lead is a contaminant of concern
in soil at the site) and about 40 samples analyzed for BTEX Lead was tested in 28 samples at
concentrations ranged from non-detect to 17microgl Benzene was detected in 4 samples only one
sample exceeded the MCL of 5 microgl Toluene ethylbenzene and xylene concentrations are all
below their respective MCLs All contaminant concentrations are significantly below
concentrations detected in the groundwater plume Therefore available surface water data
indicated that the contamination from the site is not impacting surface water from a public health
perspective In addition the benzene concentration contours (5microgl) in groundwater samples in
the monitoring well network from 2000 to 2007 indicated the groundwater plume is not
spreading (Figure 3) Recent communication with KDHE indicated that the current groundwater
and surface water monitoring results were similar to the historical data ATSDR evaluated and no
significant changes were observed [ATSDR 2011]
Public health implications
ATSDR evaluated both cancer and non-cancer health effects for air contaminants at the site
ATSDR compared the indoor air contaminant concentrations to their chronic EMEGMRLs the
concentrations in air that are unlikely to be associated with any appreciable risk of adverse non-
cancer effects for more than one year of continuous exposure Benzene was the only chemical
detected above non-cancer screening values Concentrations of six VOCs exceeded their
respective cancer screening values The chemicals above screening values - benzene methylene
chloride PCE (only detected in public buildings) TCE 1 2-dichloroethane and chloroform shy
were evaluated further for potential consequences from exposure ATSDR used conservative risk
assumptions to estimate theoretical cancer risks therefore the actual risks of cancer from
exposure to the six VOCs at the site are probably even lower than predicted
Possible cancer effects from residential exposure
Five chemicals (benzene methylene chloride TCE 1 2-dichloroethane and chloroform) were
detected in residential living spaces The following text outlines ATSDRrsquos in-depth evaluation of
the chemicals
Benzene
Benzene is a colorless and highly flammable gas that evaporates into air quickly It is a
component of crude oil gasoline and cigarette smoke Benzene has been identified in indoor and
outdoor samples of both rural and urban environments The background levels of benzene in
indoor air range from non-detect to 460 microgm3 and the 95 percentile ranges from 99 to 29 microgm
3
13
[EPA 2011] The major sources of benzene exposure to US residents are tobacco smoke (45)
automobile exhaust and industry (20) and other home sources (16) Home sources include
paints and gasoline stored in the home (eg in basements or attached garages) [Wallace 1995
Ott 1998]
Benzene is the most frequently detected indoor contaminant at the site There were a total of 50
indoor samples taken from living areas with a maximum benzene concentration of 1063 microg m3
Figure 7 shows the benzene concentrations distribution in the residential samples Although
nationwide background levels like those in the Neodesha area can often exceed ATSDRrsquos CVs
for benzene ie chronic EMEGMRL of 10 microgm3
and CREG of 01 microgm3 no adverse health
effects including cancer would be expected (see the following paragraphs for a more detailed
explanation regarding this conclusion) The following text is an approach that integrates the
estimate of likely exposure with information about the toxicology and epidemiology of benzene
exposure
Benzene is a known human carcinogen and is leukemogenic Occupational-level benzene
exposures have been specifically linked to acute myelocytic leukemia The lowest human effect
levels reported in ATSDRrsquos Toxicological Profile for benzene [ATSDR 2007c] are 960 microgm3
for leukemia [Ott et al 1978] and 1838 microg m3
for reduced white blood cell and platelet counts
[Lan et al 2004] These values (960 and 1 838 microgm3) represent the lowest measured
concentrations in a range of workplace measurements from the two studies
In some epidemiological and toxicological studies estimates of benzene exposure were
converted to ppm-years ie average benzene levels in parts per million (ppm) multiplied by
exposure duration in years to compare with reported occupational health effects on an equivalent
basis For example a worker exposed to 2 ppm for 20 years and another one exposed to 20 ppm
for 2 years both received the same cumulative exposure (ie 40 ppm-years) Epidemiologic data
have suggested that there are thresholds for leukemia Available studies indicate no detectable
excess of leukemia below cumulative exposures of 40 ppm-years [Rinsky et al 1987] This
would be numerically if not biologically equivalent to about 190 ppb (6061 microgm3) 24 hours a
day over a 70-year lifetime However this apparent threshold is most likely an underestimate
because it is based on underestimated exposures and the inclusion of all leukemia not just AML
ATSDRrsquos CREG is based on an EPA-estimated cancer slope factor which is in turn based on the
assumption of a linear dose-response relationship
A conservative cancer risk estimate (Appendix A) indicated that the predicted slightly increased
theoretical cancer risk falls within EPArsquos general target risk range (between 1 in 1000000 and 1
in 10000) The actual risk of cancer from exposure to benzene at the site is probably even lower
than predicted For the reasons discussed in this section the estimated benzene exposures in the
Neodesha area are not likely to produce any adverse health effects of either a cancerous or nonshy
cancerous nature
Methylene chloride
Methylene chloride is a colorless liquid widely used as an industrial solvent and as a paint
stripper The chemical can be found in some spray paints automotive cleaners pesticide
products and other household products Methylene chloride is the most common laboratory
14
analysis artifact introduced in laboratory sample preparation [ATSDR 2000] The background
levels of methylene chloride in indoor air range from non-detect to a maximum of 2100 microgm3
and the 95 percentile ranged from 29 to 45 microgm3
[EPA 2011] Methylene chloride was found
only at 3 residences at the site with concentrations of 551 129 and 7microgm3 respectively The
maximum concentration of 551 microgm3
was found in one residence (can0116) which also has
the highest concentrations of other VOCs (TCE and 12- dichloroethane) which are the main
contributors to the overall estimated slightly increased theoretical cancer risk KDHE conducted
additional environmental samples at the location and concluded that indoor VOC levels remain
below safe levels
Trichloroethene (TCE)
Trichloroethene (TCE) is a solvent used to remove grease from metals and in typewriter
correction fluid paint removers adhesives and spot removers [ATSDR 2003b] The background
levels of TCE in indoor air range from non-detect to a maximum of 720 microg m3 with the 95
percentile ranged from 056 to 33 microg m3
[EPA 2011] TCE was detected only at one residence
with a concentration of 17 microg m3 Conservative cancer risk estimate (Appendix A) indicated
that the predicted slightly increased theoretical cancer risk falls within EPArsquos general target risk
range
12-Dichloroethane
12-dichloroethane is a manufactured chemical that is not found naturally in the environment
The most common use of 12-dichloroethane is in the production of vinyl chloride which is used
to make a variety of plastic and vinyl products including polyvinyl chloride (PVC) pipes
furniture and automobile upholstery wall coverings housewares and automobile parts It is also
used as a solvent and is added to leaded gasoline to remove lead [ATSDR 2001b] 12shy
dichloroethane was detected only at two residences with concentrations of 151 and 2 microg m3
respectively Conservative cancer risk estimate (Appendix A) indicated that the predicted
slightly increased theoretical cancer risk falls within EPArsquos general target risk range
Chloroform
Chloroform is a colorless liquid with a pleasant nonirritating odor and a slightly sweet taste
Most of the chloroform found in the environment comes from industry [ATSDR 1997a] The
background levels of chloroform in indoor air range from non-detect to a maximum of 54 microg
m3 with the 95 percentile ranged from 41 to 75 microg m
3 [EPA 2011] Chloroform was found in
only one residential sample with a concentration of 16microgm3 Conservative cancer risk estimate
(Appendix A) indicated that the predicted slightly increased theoretical cancer risk falls within
EPArsquos general target risk range The actual risk of cancer from exposure to methylene chloride at
the site is probably even lower than predicted
Possible cancer effects from public building exposure
Five chemicals (benzene methylene chloride PCE TCE and chloroform) were detected in some
public buildings including school rooms a church and the city hall With the exception of PCE
the other four chemicals were detected at levels similar to those found in the residential samples
15
For example the maximum concentrations of benzene methylene chloride TCE and
chloroform were 1504 58 282 and 28microgm3 respectively Conservative cancer risk estimates
(Appendix A) indicated that the predicted slightly increased theoretical cancer risk falls within
EPArsquos general target risk range The actual risk of cancer from exposure to those chemicals at
the site is probably even lower than predicted
PCE is a chemical used for dry cleaning of fabrics and for metal-degreasing [ATSDR 1997b]
The background levels of PCE in indoor air range from non-detect to a maximum of 660 microg m3
with the 95 percentile ranged from 41 to 95 microg m3
[EPA 2011] The maximum concentration
of PCE was found in the one room (high school class room 113) with a concentration of
339microgm3
during the February 2008 sampling event However PCE was not detected in the
second sample taken at the same room in November 2008 sampling event Operation of the
heating system in colder weather conditions of February may account for the hit in February but
none in November In addition conservative cancer risk estimate (Appendix A) indicated that
the predicted slightly increased theoretical cancer risk falls within EPArsquos general target risk
range The actual risk of cancer from exposure to PCE at the site is probably even lower than
predicted
Evaluating Inhalation Exposures to the Mixture of Multiple Chemicals
The health impact of exposure to chemical mixtures is always a concern at hazardous waste sites
ATSDR followed existing ATSDR protocols for evaluating exposures to multiple chemicals of
concern for inhalation exposures at this site (for example using the hazard index approach for
noncancer effects of chemical mixtures) [ATSDR 2004a ATSDR 2004b]
For non-cancer effects ATSDRrsquos mixture guidance manual requires the health scientist to
estimate an inhalation Hazard Quotient (HQ) for each chemical The inhalation HQ is then used
to determine the inhalation Hazard Index (HI) for the mixture of chemicals When the HI for a
mixture exceeds unity concern for the potential hazard of the mixture increases In other words
if the inhalation HI is below 1 (unity) then harmful effects of the mixture are not likely HI for a
mixture is the sum of the inhalation HQ for each chemical in the mixture If all the inhalation
HQs for each chemical are less than 01 then interaction among the chemicals in the mixture are
unlikely Whenever an HQ for a mixture of chemicals exceeds 01 further evaluation is needed
to determine if a concern for possible harmful effects might exist If only one HQ exceeds 01
then interactions between that chemical and other chemicals in the mixture also are unlikely
[ATSDR 2004a] For the Neodesha site benzene is the only chemical that its HQ exceeded 01
therefore the interaction (ie either additive synergistic or antagonistic) between benzene and
other chemicals in the mixture are unlikely In addition the HIs for all chemicals are slightly
above 1 for indoor air in residential buildings (1144) because of benzene And for indoor air in
public buildings the HIs for all chemicals are below 1 (0303) See Appendix A for calculations
In addition all measured levels of contaminants in the indoor air samples in the Neodesha area
are below respective no-observed-adverse-effect levels (NOAELs) and all known adverse effect
levels published in ATSDRrsquos toxicological profiles Therefore ATSDR has concluded that the
combined effect of the contaminants detected at the site is not likely to result in adverse health
effects This conclusion is supported by studies that suggest that a mixture produces no adverse
noncancer health effects in dosed animals when the components of that mixture are present at
16
levels below their respective NOAELs [Wade et al 2002 Feron et al 1993 Jonker et al 1990
Jonker et al 1993a Jonker et al 1993b Groten et al 1991]
For cancer risks the ATSDR Interaction Profile for Benzene Toluene Ethylbenzene and
Xylenes (BTEX) recommended that the possible hematotoxic and carcinogenic hazard from
exposures to BTEX should be evaluated on the basis of benzene alone [ATSDR 2004b] An
evaluation of benzene exposures is presented above in this document ATSDR concluded that
the estimated benzene exposures would not produce any adverse health effects (cancer andor
non-cancer) In addition the combined cancer risk for the site falls within EPArsquos general target
risk range Therefore ATSDR considers that the combined effect of all of these contaminants is
not expected to be of public health concern
Because relatively few chemical mixtures studies have assessed toxic interactions in low dose
ranges and because several carcinogenic chemicals exhibited significant spatial trends ATSDR
recognizes there are uncertainties in evaluating the cumulative effects of chemical mixtures
ATSDR considers it a prudent public health measure to reduce or eliminate releases of chemicals
into residential homes wherever possible
Conclusions
ATSDR concludes that breathing indoor and outdoor air at the former refinery site in Neodesha
KS is not expected to harm peoplersquos health This conclusion is based on the evaluation of ground
water soil vapor indoor air and outdoor air sampling data at the former refinery site and nearby
areas ATSDR determined that the amount of VOCs that could get into a child or adultrsquos body as
a result of working on site or living near the site is below levels that would harm their health
The general trend in groundwater contamination as indicated by benzene concentrations is
downward across the site over time It appears that the groundwater plume is not spreading but
has variations through the years
All detected VOC concentrations in soil vapor samples taken at residential and public buildings
are below levels recommended in the EPA draft guidance on indoor vapor intrusion Therefore
possible vapor intrusion processes are not expected to result in indoor air contaminants at levels
of health concern
Available surface water data indicated that the contamination from the site is not impacting
surface water of the Fall River and Verdigris River from a public health perspective because all
contaminant concentrations are significantly lower than their respective MCLs
Recommendations
No recommendations at this time
Public Health Action Plan
The Public Health Action Plan for the site contains a description of actions that have been or will
be taken by ATSDR andor other government agencies at the site The purpose of the Public
Health Action Plan is to ensure that this public health consultation not only identifies public
17
health hazards but also provides a plan of action designed to mitigate and prevent adverse
human health effects resulting from exposure to hazardous substances in the environment
Included is a commitment on the part of ATSDR to follow up on this plan to ensure its
implementation
Actions Taken
ATSDR conducted site visits in June July and September 2002 March 2003 and April 2006
ATSDR released a health consultation for the former refinery site for public comment and held a
public meeting in October and November 2003
BP completed corrective action study revision 1 in February 2005
ATSDR released a health consultation that addressed the New Beginnings facility lead
contamination in April 2006
ATSDR released a health consultation that reviewed available soil metals data in other areas of
the former refinery site in June 2007
ATSDR released the third health consultation that addressed the soil metals contamination at the
former Neodesha smelter area in October 2007
KDEH completed vapor intrusion evaluations of Neodesha public schools in 2008 and released
final report on February 2009
BP is operating their Phase 2 Interim Remedial Measures in the Neodesha community
Actions Planned
KDHE and ATSDR will continue to work with the community respond to public health
questions and concerns about the site
BP and other PRPs continue the groundwater monitoring programs at all affected areas
especially at the northeast and southwest corners of the plume to monitor the benzene contour
18
Authors Technical Advisors
Jane Zhu
Environmental Health Scientist
Consultation Team
Exposure Investigation and Site Assessment Branch
Division of Health Assessment and Consultation
Agency for Toxic Substances and Disease Registry (ATSDR)
Rachel Worley
Environmental Health Scientist
Consultation Team
Exposure Investigation and Site Assessment Branch
Division of Health Assessment and Consultation
Agency for Toxic Substances and Disease Registry (ATSDR)
Reviewers
Susan Moore
Chief Exposure Investigation and Site Assessment Branch
Division of Health Assessment and Consultation
Agency for Toxic Substances and Disease Registry (ATSDR)
Peter Kowalski MPH CIH
Exposure Investigation and Site Assessment Branch
Division of Health Assessment and Consultation
Agency for Toxic Substances and Disease Registry (ATSDR)
Youlanda Outin
Health Communications Specialist
Division of Health Assessment and Consultation
Agency for Toxic Substances and Disease Registry (ATSDR)
Denise Jordan-Izaguirre
Public Health Advisor
Office of Regional Operations Region 7 Kansas City Office
Agency for Toxic Substances and Disease Registry (ATSDR)
19
References
[ATSDR 1997a] Agency for Toxic Substances and Disease Registry Toxicological profile for
Chloroform Atlanta US Department of Health and Human Services 1997
[ATSDR 1997b] Agency for Toxic Substances and Disease Registry Toxicological profile for
Tetrachloroethylene (PERC) Atlanta US Department of Health and Human Services 1997
[ATSDR 2000]Agency for Toxic Substances and Disease Registry Toxicological profile for
methylene chloride (update) Atlanta US Department of Health and Human Services 2000
[ATSDR 2001a] Agency for Toxic Substances and Disease Registry Landfill Gas PrimermdashAn
overview for environmental health professionals Atlanta US Department of Health and Human
Services 2001
[ATSDR 2001b] ToxFAQstrade for 12-Dichloroethane Available at
httpwwwatsdrcdcgovtoxfaqsTFaspid=591amptid=110httpwwwatsdrcdcgovtoxfaqstfas
pid=591amptid=110
[ATSDR 2003a] Agency for Toxic Substances and Disease Registry Health Consultation
(Public Comment) Neodesha Refinery (Former Amoco Refinery) Neodesha Wilson County
Kansas Atlanta US Department of Health and Human Services 2003
[ATSDR 2003b] Agency for Toxic Substances and Disease Registry ToxFAQstrade for
Trichloroethylene (TCE) Available at httpwwwatsdrcdcgovtoxfaqsTFaspid=172amptid=30
[ATSDR 2004a] Agency for Toxic Substances and Disease Registry Guidance Manual for the
Assessment of Joint Action of Chemical Mixtures Atlanta US Department of Health and
Human Services 2004
[ATSDR 2004b] Agency for Toxic Substances and Disease Registry Interaction profile for
Benzene Toluene Ethylbenzene and Xylenes (BTEX) Atlanta US Department of Health and
Human Services 2004
[ATSDR 2005] Agency for Toxic Substances and Disease Registry Public health assessment
guidance manual (update) Atlanta US Department of Health and Human Services 2005
[ATSDR 2006] Agency for Toxic Substances and Disease Registry Health Consultation (Final)
Neodesha Refinery (Former Amoco Refinery) New Beginnings Facility Neodesha Wilson
County Kansas Atlanta US Department of Health and Human Services 2006
[ATSDR 2007a] Agency for Toxic Substances and Disease Registry Health Consultation
(Final) Neodesha Refinery (Former Amoco Refinery) Soil Data Review for the Former
Neodesha Refinery Site and Nearby Properties Neodesha Wilson County Kansas Atlanta US
Department of Health and Human Services 2007
[ATSDR 2007b] Agency for Toxic Substances and Disease Registry Health Consultation
(Final) Soil Data Review Former Neodesha Smelter Area at the Former Neodesha Old Refinery
20
Site Neodesha Neodesha Wilson County Kansas Atlanta US Department of Health and
Human Services 2007
[ATSDR 2007c] Agency for Toxic Substances and Disease Registry Toxicological profile for
benzene (update) Atlanta US Department of Health and Human Services 2007
[ATSDR 2008] Agency for Toxic Substances and Disease Registry Evaluating Vapor Intrusion
Pathways at Hazardous Waste Sites Atlanta US Department of Health and Human Services
2008
[ATSDR 2011] Agency for Toxic Substances and Disease Registry Phone conversation with
KDHE on December 23 2011 documented in Email Atlanta US Department of Health and
Human Services
[EPA 2002] US Environmental Protection Agency Office of emergency and remedial response
OSWER Draft Guidance for Evaluating the Vapor Intrusion to Indoor Air Pathway from
Groundwater and Soils (Subsurface Vapor Intrusion Guidance)
Washington DC Environmental Protection Agency November 2002 Available at
httpwwwepagovoswhazardcorrectiveactioneisvaporhtm
[EPA 2005] US Environmental Protection Agency Userrsquos Guide for the 3-Phase System Models
and the Soil Gas Models February 22 2004 Available online at
httpwwwepagovoswerriskassessmentairmodelpdf2004_222_3phase_users_guidepdf
[EPA 2008] US Environmental Protection Agency Office of Solid Waste US EPArsquos Vapor
Intrusion Database Preliminary Evaluation of Attenuation Factors (Draft)
Washington DC 20460 March 4 2008
[EPA 2011] US Environmental Protection Agency Office of Solid Waste and Emergency
Response Background Indoor Air Concentration of Volatile Organic Compounds in North
American Residences (1990-2005) A Compilation of Statistics for Assessing Vapor Intrusion
Washington DC 20460 June 2011
[ENSR 2008] ENSR Corporation October 2007 Semiannual Groundwater Monitoring Event for
the Amoco Neodesha Former refinery July 2008
[Feron et al 1993] Feron VJ Jonker D Groten JP Horbach GJMJ Cassee FR Schoen ED et al
1993 Combination technology from challenge to reality Toxicol Trib 141ndash3
[Groten et al 1991] Groten JP Sinkeldam EJ Luten JB Van Bladern PJ 1991 Interaction of
dietary calcium potassium magnesium manganese copper iron zinc and selenium with the
accumulation and oral toxicity of cadmium in rats Food Chem Toxicol 4249ndash58
[Jonker et al 1990] Jonker D Woustern RA van Bladern PJ Til HP Feron VJ 1990 4-week
oral toxicity study of a combination of eight chemicals in rats comparison with the toxicity of
the individual compounds Food Chem Toxicol 28623ndash31
21
[Jonker et al 1993a] Jonker D Jones MA van Bladeren PJ Woutersen RA Til HP Feron VJ
1993a Acute (24 hr) toxicity of a combination of four nephrotoxicants in rats compared with the
toxicity of the individual compounds Food Chem Toxicol 3145ndash52
[Jonker et al 1993b] Jonker D Woutersen RA van Bladeren PJ Til HP Feron VJ 1993b
Subacute (4-wk) oral toxicity of a combination of four nephrotoxicants in rats comparison with
the toxicity of the individual compounds Food Chem Toxicol 31125ndash36
[KDHE 2004] Kansas Department of Health and Environment Email from Pam Chaffee to
Shawn Blackshear ATSDR 2004
[KDHE 2008] Kansas Department of Health and Environment Indoor Air Sampling Results
Neodesha Public Schools Neodesha KS
Topeka KS May 2008
[KDHE 2009] Kansas Department of Health and Environment 2008 Supplemental Vapor
Intrusion Report Neodesha Refinery Site and Airosol Company Site Neodesha KS
Topeka KS February 2009
[KDHE 2010] Kansas Department of Health and Environment The Risk-Based Standards for
Kansas (RSK) Manual httpwwwkdhestateksusremedialRSK_maural_pagehtm Topeka
Kansas October 2010
[Kildiff 2002] Kildiff JK and Cody RJ Soil vapor concentration profile approximate solutions
to aid sampling design and indoor air risk assessment Presented at Third international
conference on the remediation of chlorinated and recalcitrant compounds 2002 May 20ndash30
Monterey California
[Lan et al2004] Lan Q Zhang L Li G et al 2004 Hematotoxicity in workers exposed to low
levels of benzene Science 3061774-1776
[Ott et al 1978] Ott MG Townsend JC Fishbeck WA et al 1978 Mortality among workers
occupationally exposed to benzene Arch Environ Health 333ndash10
[Ott and Robert 1998] Ott WR and Roberts JW 1998 Everyday exposure to toxic pollutants
Sci Am Feb
[RETEC 2003] The RETEC Group Inc Risk Assessment Report Neodesha Former Refinery
Site Neodesha Kansas Fort Collins Colorado May 8 2003 Revision 1 June 11 2003
[RETEC 2005] The RETEC Group Inc Corrective Action Study Neodesha Former Refinery
Neodesha Kansas Fort Collins Colorado Revision 1 February 7 2005
[Rinsky et al 1987] Rinsky RA Smith AB Hornung R Filloon T Young R Okun A Landrigan
P 1987 Benzene and leukemia an epidemiological risk assessment N Eng J Med 3161044ndash50
22
[TermoRetec 2000] ThermoRetec Consulting Corporation Phase III Remedial Investigation
Report BP Amoco Neodesha Former Refinery Neodesha Kansas Golden Colorado June
2000
[TermoRetec 2001] ThermoRetec Consulting Corporation Indoor Air Sampling Report Amoco
Former Refinery Neodesha Kansas Golden Colorado March 2001
[Wallace] Wallace LA Human exposure to environmental pollutants a decade of experience
Clin Exp Allergy 1995254ndash9
[Wade et al 2002] Wade MG Foster WG Younglai EV McMahon A Leingartner K
Yagminas A et al 2002 Effects of subchronic exposure to a complex mixture of persistent
contaminants in male rats systemic immune and reproductive effects Toxicol Sci 67131ndash42
[Wallance 1996] Environmental exposure to benzene an update Environ Health Perspect 1996
December 104(Suppl 6) 1129ndash1136
23
Figure 1 Former Neodesha Smelter Area Monitoring Well Network Map
24
Figure 2
25
Figure 3
26
Figure 4
27
28
Figure 6
29
Figure 7
30
Table 1mdashSummary of soil vapor benzene results October 1999 Neodesha KS
Depth of Benzene Sample ID Benzene (microgm
3)
Sample(ft) (ppb)
SV-1 80 55 1786
160 No vapor NA
SV-2 80 No vapor NA
SV-3 80 909 2903
SV-4 80 No vapor NA
SV-5 80 No vapor NA
145 185 5908
SV-6 8 No vapor NA
145 254 8111
SV-7 6 No vapor NA
SV-8 80 13360 4266352
140 28755 9188942
SV-9 80 502 160308
120 965 30816
SV-10 40 165 5269
SV-11 50 157 5014
SV-12 40 119 3800
SV-13 80 228 7281
SV-14 80 948 30273
Note
NA not applicable
microg m3 microgram per cube meters
ppb parts per billion
Data Source ThermoRetec Consulting Corporation Phase III Remedial Investigation Report BP Amoco Neodesha
Former Refinery Neodesha Kansas Golden Colorado June 2000
31
Table 2 mdash Summary of Soil Vapor Samples Results December 2002 Neodesha KS
MDC (SGI-1) Depth of MDC (SGI-2) Depth of Detected Analyte
(microgm3) Sample(ft) (microgm
3) Sample (ft)
124-Trimethyl benzene 10337 6 98444 6
12-Dichloropropane 1619 6 2869 6
135-Trimethyl benzene 5414 6 43807 9
Benzene 17592 9 217500 9
Ethylbenzene 2782 6 56519 9
11-Dichloroethane 1094 6 527 NA
mampp-xylene 8695 6 165210 9
o-xylene 739 6 32173 9
Toluene 2490 6 83009 9
Tetrachloroethylene
(PCE) lt951 NA 1426 9
Styrene 587 NA 1194 9
Note
The samples were taken from a proposed building location and the proposed building was not constructed
Therefore human exposure through vapor intrusion at this location is not expected
MDC maximum detected concentration There were 4 samples taken at location SGI-1 and 3 samples taken at
SGI-2 Only the MDC are listed in the table
microgm3
microgram per cube meters
NA not available
lt less than
Data Source The RETEC Group Inc Risk Assessment Report Neodesha Former Refinery Site Neodesha Kansas
Fort Collins Colorado May 8 2003 Revision 1 June 11 2003
32
Table 3mdash Summary Sub-slab Vapor Sampling VOC Results March November and December 2008 (microgm3)
Maximum Detected Chemicals CV Maximum concentration location of samples
concentration
Acetone
Benzene
2-Butanone(MEK)
Carbon Disulfide
Chloromethane
Cyclohexane
14-dichlorobenzene
Dichlorodifluoromethane
11-Dichloroethane
cis-12-Dichloroethene (DCE)
Ethylbenzene
4-Ethyltoluene
n-Heptane
n-Hexane
2-Hexanone (MBK)
Methylene chloride
4-methyl2-pentanone (MIBK)
Methyl-tert-butyl-ether (MTBE)
3500
310
10000
7000
900
6000 (RfC)
8000
2000
5000
2000
2200
4000 (Toluene)
NE
2000
900
NE
30000
170 E
315
165
209
122
84
ND(54)
568
771
254
NA
61
667
573
5
94
NA
NA
Heller Custodial Rm
High School Rm212 closet
High School Rm212 closetJrHigh Storage Rm
Heller Castodial Rm
Heller Basement
JrHigh Storage Rm
High School Rm212 closetJrHigh Storage Rm
High School Custodial RmClos
Church SS EastCan0869
Heller Basement
NA
High School Custodial Rm
High School Rm212 closet
Heller Basement
JrHigh Storage Rm
Church SS WestCan1348
NA
NA
17 shy
13 shy
19 shy
13 shy
17 shy
8 shy
33
17
17
8
12
17
12
17
17
14
13
17
17
19
17
Styrene
Tetrachloroethene (PCE)
Toluene
111-Trichloroethane
Trichloroethene (TCE)
Trichlorofluoromethane
112-
Trichlorotrifluoroethane
124-Trimethyl benzene
135-Trimethyl benzene
Vinyl acetate
mampp-xylene
o-xylene
11-Dichloroethene
12-Dichloropropane
Tetrahydorfuran
12-Dichloroethane
Chloroform
Ethyl Acetate
10000
810
4000
22000
220
7000
300000
60
60
2000
70000
70000
2000
40
NE
5000
110
32000
NA
281
202
90
694
12600E
2870
20
NA
68
653
264
997
NA
2
62
68
43
NA
Church SS EastCan0869
High School Custodial Rm
Church SS EastCan0869
Heller Basement
Church SS EastCan0869
Church SS EastCan0869
High School Rm212 closet
NA
Heller KitStorage Rm
High School Custodial Rm
High School Custodial Rm
Church SS EastCan0869
NA
Church SS WestCan1348
Church SS EastCan0869
Church SS EastCan0869
High School Rm212 closet
8 shy
17 shy
19 shy
13 shy
13 shy
4 shy
4 shy
Note ND Not detected Values in paresis are detection limits
NA Not applicable
NE Not established
CV Comparison values (EPA Draft Guidance for Evaluating the Vapor Intrusion to Indoor Air Pathway from Groundwater and Soils (Subsurface Vapor Intrusion Guidance) November 2002
RfC EPA Reference concentration
E Analyte concentration exceeded the calibration range The reported result is estimated
34
12
17
13
8
13
4
9
4
4
Table 4 mdashSummary of Outdoor Air sampling Results 2000 2004 and 2008(microgm3)
Maximum Maximum Maximum
Detected Chemicals (microgm3) CV concentration concentration 2004
concentration
2000 2008
Acetone 30000 MRL 4309 NA 7335
Benzene 01 CREG 145 261 23
2-Butanone(MEK) 5120 RSK 45 NA 1329
Carbon Disulfide 900 MRL 71 NA 317
Chloromethane 100 MRL 12 NA 108
Cyclohexane 6300 RSL NT NA 378
14-dichlorobenzene 60 MRL ND(12) NA 24
Dichlorodifluoromethane 210 RSL 359 NA 179
11-Dichloroethane 15 RSL ND((08) NA 118
cis-12-Dichloroethene (DCE) 365 RSK ND(08) NA 12
Ethylbenzene 300 MRL 284 105 127
4-Ethyltoluene NE 198 NA 357
n-Heptane 35000 NT NA 207
NIOSH
n-Hexane 2000MRL NT NA 62
2-Hexanone 31 RSL 116 NA 347
Methylene chloride 2 CREG 4901 NA 384
4-methyl2-pentanone (MIBK) 3100 RSL ND(41) NA 156
Methyl-tert-butyl-ether 2000 MRL NT NA 105
(MTBE)
Styrene 900 MRL 19 NA 416
Tetrachloroethene (PCE) 02 CREG 957 NA ND(22)
Toluene 300 MRL 6457 874 11
111-Trichloroethane 5200 RSL 11 NA 19
Trichloroethene (TCE) 05 CREG 298 NA 47
35
Trichlorofluoromethane 730 RSL 187 NA 293
112-Trichlorotrifluoroethane 3100 RSL ND(30) NA 741
124-Trimethyl benzene 73 RSL 213 NA ND(40)
135-Trimethyl benzene 365 RSK 064 NA 357
Vinyl acetate 210 RSL NT NA 099
Xylene (total) 200 MRL 875 779 NA
mampp-xylene 730 RSL 788 NA 249
o-xylene 730 RSL 241 NA ND(15)
12-Dichloroethane 004 CREG ND(08) NA 2
Chloroform 004 CREG ND(10) NA 15
Carbon Tetrachloride 200 MRL 056 NA NT
12-dichlorobenzene 210 RSL 073 NA NT
Bromomethane 52 RSL ND(08) NA 19
Chlorobenzene 52 RSL ND(09) NA 31
Dibromochloromethane 009 RSL ND(17) NA 51
Note ND Not detected Values in paresis are detection limits NA Not applicable
NE Not established NT Not tested CV Comparison values CREG RSL EPA Regional Screening Level 2009 RSK KDHE Risk-Based Standards for Kansas 2007 NIOSH National Institution of Occupational Health and Safety
36
Table 5 ndash Indoor Air Sampling Results Summary 2000 2003 2004 and 2008
Maximum Maximum Maximum Maximum
Detected Chemicals (microg m3) CV (Lowest) concentration concentration concentration Concentration 2008
2000 2003 2004
Acetone 30000 MRL 9097 35482
Benzene 01 CREG 1063 219 27 354
2-Butanone(MEK) 5120 RSK 113 1269
Carbon Disulfide 900 MRL 1412 440
Chloromethane 100 MRL 229 202
Cyclohexane 6300 RSL NA 17
14-dichlorobenzene 60 MRL NA 309
Dichlorodifluoromethane 210 RSL 135 4940
11-Dichloroethane 15 RSL NA 151
cis-12-Dichloroethene (DCE) 365 RSK NA 152
Ethylbenzene 300 MRL 2888 123 3019 827
4-Ethyltoluene NE 144 2353
n-Heptane 35000 NIOSH NA 1040
n-Hexane 2000 MRL NA 5151
2-Hexanone 31 RSL NA 372
Methylene chloride 2 CREG 4201 5510
4-methyl2-pentanone (MBK) 3100 RSL NA 311
Methyl-tert-butyl-ether
(MTBE) 2000 MRL NA 1108
Styrene 900 MRL 201 996
Tetrachloroethene (PCE) 02 CREG NA 3390
Toluene 300 MRL 20509 2355 14053 20130
111-Trichloroethane 5200 RSL NA 1853
Trichloroethene (TCE) 05 CREG NA 28
Trichlorofluoromethane 730 RSL 232 3110
112-Trichlorotrifluoroethane 3100 RSL NA 23943
124-Trimethyl benzene 73 RSL 302 157
37
135-Trimethyl benzene 365 RSK NA 74
Vinyl acetate 210 RSL NA 11001
Xylene (total) 200 MRL 13565 NA 16103 NA
mampp-xylene 730 RSL 403 2184
o-xylene 730 RSL 123 1308
12-Dichloroethane 004 CREG NA 151
Chloroform 004 CREG 738 280
12-Dichloropropane 210 RSL NA 39
Tetrahydrofuran 590000 NIOSH NA 165
Ethyl Acetate 1400000 NIOSH NA 1440
14-dichlorobenzene 210 RSL NA 1880
Note
NA Not applicable NE Not established Blank cells Not tested CV Comparison values CREG RSL EPA Regional Screening Level 2009 RSK KDHE Risk-Based Standards for Kansas 2010 NIOSH National Institution of Occupational Health and Safety
38
Appendix A Mixture and Cancer Risk Estimation for VOCs Indoor Air Exposure
The major exposure pathway by which residents can be exposed to VOCs at the site is
inhale contaminated indoor air A total of 36 buildings where indoor samples were taken
and a total number of 122 indoor air samples were collected throughout the site and the
City of Neodesha between 2000 and 2008 Thirty two VOCs were detected among 57
analytes Concentrations of six VOCs exceeded their respective CVs The VOCs are
benzene methylene chloride PCE TCE 1 2-dichloroethane and chloroform ATSDR
designated indoor air samples into residential and public building (schoolchurch etc)
exposure unites to further evaluate the exposure situations ATSDR followed existing
ATSDR protocols for evaluating exposures to multiple chemicals of concern for
inhalation exposures at this site
Cancer risk evaluation
The following conservative assumptions were made to estimate the potential cancer risks
(1) Resident exposure time is 24 hoursday
(2) Resident exposure duration is 33 years
(3) Resident exposure frequency is 365 daysyear
(4) Schooloffice personal and students exposure time is 8 hoursday (public
buildings)
(5) School office personal and students exposure durations are 25 years(public
buildings)
(6) School office personal and students exposure frequency is 5 daysweek for 40
weeks per year(public buildings)
(7) Life time expectancy is 78 years for general US population
(8) Formula used for cancer risk calculation
3)-1 3Risk = Inhale Unit risk (microgm x Exposure Concentration (microgm )
EC = (CA x ET x EF x ED)AT where
CA (microgm3) = contaminant concentration in air
ET (hoursday) = exposure time
EF (daysyear) = exposure frequency
ED (years) = Exposure duration
AT (lifetime in years x 365daysyear x 24 hoursday) = average time
39
VOC CREGCV
(microgm3)
Inhale Unit
risk (microg)3)-1
Maximum
Concentration
EC(microgm3) Estimated
cancer risk
Maximum
Concentration
EC(microg
m3)
Estimated
cancer
(Residential)
(microgm3)
(public
building)
(microgm3)
risk
Benzene 01 22E-06 to 1063 449 98E-06 to 1504 088 19E-06
78E-06 to 68Eshy35E-05 06
Methylene
chloride
2 10E-08 551 2331 19E-06 58 033 26E-08
PCE 02 26E-07 NA NA NA 339 198 51E-07
TCE 05 41E-06 17 071 29E-06 282 016 65E-07
12shy
Dichloroethane
004 26E-05 151 638 16E-04 ND NA NA
Chloroform 004 23E-05 16 067 15E-05 28 016 37E-06
Note
Only samples taken from residential and public building living spaces were used to identify the maximum
concentrations
Maximum benzene concentration was obtained by averaging sampling results when split samples were
taken
PCE CREG and inhale unit risk were adopted from the California EPA per ATSDRrsquos Division of Health
Assessment and Consultation interim guidance for health assessors
TCE CREG was adopted from the California EPA per ATSDRrsquos Division of Health Assessment and
Consultation interim guidance for health assessors TCE inhale unit risk is adopted from EPArsquos IRIS
httpwwwepagovoswerriskassessmentragsfindexhtm
Mixture exposure evaluation
For non-cancer effects ATSDRrsquos mixture guidance manual requires the health scientist
to estimate an inhalation Hazard Quotient (HQ) for each chemical The inhalation HQ is
then used to determine the inhalation Hazard Index (HI) for the mixture of chemicals
When the HI for a mixture exceeds unity concern for the potential hazard of the mixture
increases In another word if the inhalation HI is below 1 (unity) then harmful effects of
the mixture are not likely HI for a mixture is the sum of the inhalation HQ for each
chemical in the mixture If all the inhalation HQs for each chemical are less than 01 then
interaction among the chemicals in the mixture are unlikely Whenever an HQ for a
mixture of chemicals exceeds 01 further evaluation is needed to determine if a concern
for possible harmful effects might exist If only one HQ exceeds 01 then interactions
between that chemical and other chemicals in the mixture also are unlikely
For the Neodesha site benzene is the only chemical that its HQ exceeded 01 therefore
the interaction (ie either additive synergistic or antagonistic) between benzene and
other chemicals in the mixture are unlikely In addition the HIs for all chemicals are
40
slightly above 1 for residential buildings (1144) because of benzene For public
buildings the HIs for all chemicals are below 1 (0303) ATSDR has concluded that the
combined effect of the contaminants detected at the site is not likely to result in adverse
health effects Additional discussions are in the mixture section of this document
VOC MRL(microg
m 3)
Maximum
Concentration
(Residential)
(microgm3)
HQ Maximum
Concentration
(public building)
(microgm3)
EC(microgm3)
(public building)
HQ
Benzene 10 1063 1063 1504 277 0277
Methylene
chloride
1000 551 0055 58 104 0004
PCE 300 NA NA 339 610 0020
TCE 500 17 00034 282 050 0001
12shy
Dichloroethane
2000 151 00075 ND NA NA
Chloroform 100 16 0016 28 050 0001
HI 1144 0303
Note
MRL minimal risk level
NA not applicable
ND not detected
HQ hazard quotient = Maximum concentration for residential exposure (Estimated concentration for
public building exposure) divide MRL
HI hazard index = sum of individual HQ
EC = (CA x ET x EF x ED)AT where
CA (microgm3) = contaminant concentration in air
ET (hoursday) = exposure time = 8 hoursday (public building exposures)
EF (daysyear) = exposure frequency = 5 daysweek for 40 weeks year (public building
exposures)
ED (years) = Exposure duration= 25 years (public building exposures)
AT (ED in years x 365daysyear x 24 hoursday) = average time
41
Appendix B ATSDRrsquos comparison values and definitions
ATSDR comparison values (CVs) are media-specific concentrations considered safe
under default exposure scenario ATSDR uses them as screening values to identify
contaminants (site-specific substances) that require further evaluation to determine the
potential for adverse health effects
Generally a chemical at a site requires further evaluation when its maximum
concentration in air water or soil exceeds one of ATSDRrsquos comparison values
Comparison values are not however thresholds of toxicity While concentrations at or
below the relevant comparison value may reasonably be considered safe it does not
automatically follow that any environmental concentration that exceeds a comparison
value would be expected to produce adverse health effects Indeed the purpose behind
these highly conservative health-based standards and guidelines is to enable health
professionals to recognize and resolve potential public health problems before they
become actual health hazards The probability that adverse health outcomes will actually
occur as a result of exposure to environmental contaminants depends on individual
lifestyles and genetic factors and site-specific conditions that affect the route magnitude
and duration of actual exposure and not on environmental concentrations alone
ATSDR derives screening values on the basis of noncancerous effects by dividing a
NOAEL (no observed adverse effect level) by LOAELs (lowest observed adverse effect
level) These levels stem from animal or human studies and include cumulative safety
margins (variously called safety factors uncertainty factors or modifying factors) that
typically range from 10 to 1000 or more
By contrast cancer-based screening values come from linear extrapolations from animal
data obtained at high doses because human cancer incidence data for very low levels of
exposure simply do not exist and probably never will
Listed below are the comparison values that ATSDR uses to select chemicals for further
evaluation along with the abbreviations for the most common units of measure
EMEG = environmental media evaluation guides
RMEG = reference dose media evaluation guide
MRLs = minimal risk levels
ppm = parts per million eg mgL or mgkg
ppb = parts per billion eg microgL or microgkg
kg = kilogram (1000 gram)
mg = milligram (0001 gram)
microg = microgram (0000001 gram)
L = liter
m3
= cubic meter (= 1000 liters)
acute exposure exposure to a chemical for duration of 14 days or less
42
cancer risk evaluation guide (CREG) estimated contaminant concentration in water
soil or air that would be expected to cause no more than one excess case of cancer in a
million persons exposed over a lifetime CREGs are calculated from EPArsquos cancer slope
factors
chronic exposure exposure to a chemical for 365 days or more
environmental media evaluation guide (EMEG) concentration of a contaminant in
water soil or air unlikely to produce any appreciable risk of adverse non-cancer effects
over a specified duration of exposure EMEGs are derived from ATSDR minimal risk
levels by factoring in default body weights and ingestion rates ATSDR computes
separate EMEGs for acute (le14 days) intermediate (15ndash364 days) and chronic (gt365
days) exposures
intermediate exposure exposure to a chemical for duration of 15ndash364 days
lowest observed adverse effect level (LOAEL) The lowest exposure level of a
chemical in a study or group of studies that produces statistically or biologically
significant increase(s) in frequency or severity of adverse health effects between the
exposed and control populations
minimal risk level (MRL) estimate of daily human exposure to a hazardous substance
that is not likely to pose an appreciable risk of adverse noncancer health effects over a
specified route and duration of exposure
no observed adverse effect level (NOAEL) The dose of a chemical at which no
statistically or biologically significant increases in frequency or severity of adverse health
effects were seen between the exposed population and its appropriate control Effects
may be produced at this dose but they are not considered to be adverse
uncertainty factor (UF) a factor used in deriving the MRL or reference dose or
reference concentration from exposure data
43
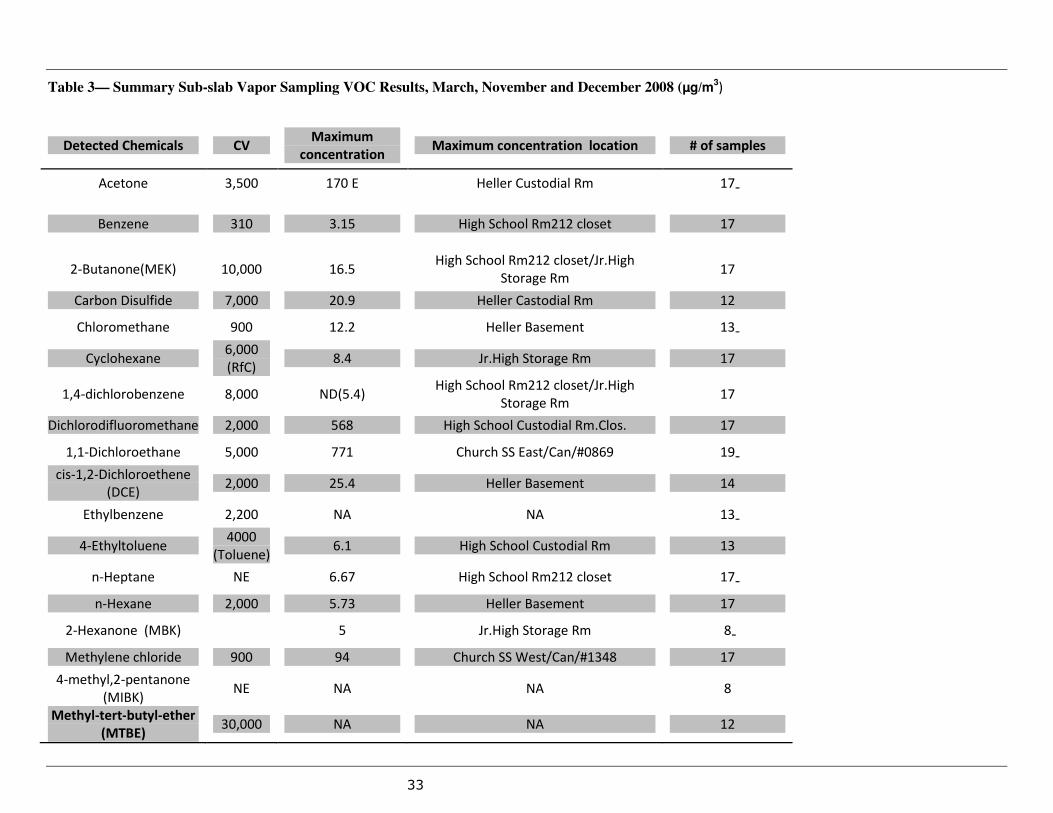