Embed Size (px)
Citation preview
JBoss Operations Network 3.1
Setting up Monitoring Alerts and Operations
for monitoring resources and responding to incidentsEdition 3.1.2
Last Updated: 2017-10-25

JBoss Operations Network 3.1 Setting up Monitoring Alerts and Operations
for monitoring resources and responding to incidentsEdition 3.1.2
Ella Deon [email protected]
Legal Notice
Copyright © 2012 Red Hat, Inc..
This document is licensed by Red Hat under the Creative Commons Attribution-ShareAlike 3.0Unported License. If you distribute this document, or a modified version of it, you must provideattribution to Red Hat, Inc. and provide a link to the original. If the document is modified, all Red Hattrademarks must be removed.
Red Hat, as the licensor of this document, waives the right to enforce, and agrees not to assert,Section 4d of CC-BY-SA to the fullest extent permitted by applicable law.
Red Hat, Red Hat Enterprise Linux, the Shadowman logo, JBoss, OpenShift, Fedora, the Infinitylogo, and RHCE are trademarks of Red Hat, Inc., registered in the United States and othercountries.
Linux ® is the registered trademark of Linus Torvalds in the United States and other countries.
Java ® is a registered trademark of Oracle and/or its affiliates.
XFS ® is a trademark of Silicon Graphics International Corp. or its subsidiaries in the United Statesand/or other countries.
MySQL ® is a registered trademark of MySQL AB in the United States, the European Union andother countries.
Node.js ® is an official trademark of Joyent. Red Hat Software Collections is not formally related toor endorsed by the official Joyent Node.js open source or commercial project.
The OpenStack ® Word Mark and OpenStack logo are either registered trademarks/service marksor trademarks/service marks of the OpenStack Foundation, in the United States and other countriesand are used with the OpenStack Foundation's permission. We are not affiliated with, endorsed orsponsored by the OpenStack Foundation, or the OpenStack community.
All other trademarks are the property of their respective owners.
Abstract
The primary function of JBoss Operations Network is monitoring the status of your resources. Thecore of monitoring includes critical availability monitoring, collecting metrics on platform and serverperformance, and tracking events. JBoss ON also provides a way to define alerts and then notifyadministrators whenever a resource is performing poorly. This guide provides GUI-basedprocedures to view monitoring information, to track events, to define alerts and notifications, and toinitiate operations.
. . . . . . . . . . . . . . . . . . . . . . . . . . . . . . . . . . . . . . . . . . . . . . . . . . . . . . . . . . . . . . . . . . . . . . . . . . . . . . . . . . . . . . . . . . . . . . . . . . . . . . . . . . . . . . . . . . . . . . . . . . . . . . . . . . . . . . . . . . . . . . . . . . . . . . . . . . . . . . . . . . . . . . . . . . . . . . . . . . . . . . . . . . . . . . . . . . . . . . . . . . . . . . . . . . . . . . . . . . . . . . . . . . . . . . . . . . . . . . . . . . . . . . . . . . . . . . . . . . . . . . . . . . . . . . . . . . . . . . . .
. . . . . . . . . . . . . . . . . . . . . . . . . . . . . . . . . . . . . . . . . . . . . . . . . . . . . . . . . . . . . . . . . . . . . . . . . . . . . . . . . . . . . . . . . . . . . . . . . . . . . . . . . . . . . . . . . . . . . . . . . . . . . . . . . . . . . . . . . . . . . . . . . . . . . . . . . . . . . . . . . . . . . . . . . . . . . . . . . . . . . . . . . . . . . . . . . . . . . . . . . . . . . . . . . . . . . . . . . . . . . . . . . . . . . . . . . . . . . . . . . . . . . . . . . . . . . . . . . . . . . . . . . . . . . . . . . . . . . . . .
. . . . . . . . . . . . . . . . . . . . . . . . . . . . . . . . . . . . . . . . . . . . . . . . . . . . . . . . . . . . . . . . . . . . . . . . . . . . . . . . . . . . . . . . . . . . . . . . . . . . . . . . . . . . . . . . . . . . . . . . . . . . . . . . . . . . . . . . . . . . . . . . . . . . . . . . . . . . . . . . . . . . . . . . . . . . . . . . . . . . . . . . . . . . . . . . . . . . . . . . . . . . . . . . . . . . . . . . . . . . . . . . . . . . . . . . . . . . . . . . . . . . . . . . . . . . . . . . . . . . . . . . . . . . . . . . . . . . . . . .
. . . . . . . . . . . . . . . . . . . . . . . . . . . . . . . . . . . . . . . . . . . . . . . . . . . . . . . . . . . . . . . . . . . . . . . . . . . . . . . . . . . . . . . . . . . . . . . . . . . . . . . . . . . . . . . . . . . . . . . . . . . . . . . . . . . . . . . . . . . . . . . . . . . . . . . . . . . . . . . . . . . . . . . . . . . . . . . . . . . . . . . . . . . . . . . . . . . . . . . . . . . . . . . . . . . . . . . . . . . . . . . . . . . . . . . . . . . . . . . . . . . . . . . . . . . . . . . . . . . . . . . . . . . . . . . . . . . . . . . .
. . . . . . . . . . . . . . . . . . . . . . . . . . . . . . . . . . . . . . . . . . . . . . . . . . . . . . . . . . . . . . . . . . . . . . . . . . . . . . . . . . . . . . . . . . . . . . . . . . . . . . . . . . . . . . . . . . . . . . . . . . . . . . . . . . . . . . . . . . . . . . . . . . . . . . . . . . . . . . . . . . . . . . . . . . . . . . . . . . . . . . . . . . . . . . . . . . . . . . . . . . . . . . . . . . . . . . . . . . . . . . . . . . . . . . . . . . . . . . . . . . . . . . . . . . . . . . . . . . . . . . . . . . . . . . . . . . . . . . . .
. . . . . . . . . . . . . . . . . . . . . . . . . . . . . . . . . . . . . . . . . . . . . . . . . . . . . . . . . . . . . . . . . . . . . . . . . . . . . . . . . . . . . . . . . . . . . . . . . . . . . . . . . . . . . . . . . . . . . . . . . . . . . . . . . . . . . . . . . . . . . . . . . . . . . . . . . . . . . . . . . . . . . . . . . . . . . . . . . . . . . . . . . . . . . . . . . . . . . . . . . . . . . . . . . . . . . . . . . . . . . . . . . . . . . . . . . . . . . . . . . . . . . . . . . . . . . . . . . . . . . . . . . . . . . . . . . . . . . . . .
. . . . . . . . . . . . . . . . . . . . . . . . . . . . . . . . . . . . . . . . . . . . . . . . . . . . . . . . . . . . . . . . . . . . . . . . . . . . . . . . . . . . . . . . . . . . . . . . . . . . . . . . . . . . . . . . . . . . . . . . . . . . . . . . . . . . . . . . . . . . . . . . . . . . . . . . . . . . . . . . . . . . . . . . . . . . . . . . . . . . . . . . . . . . . . . . . . . . . . . . . . . . . . . . . . . . . . . . . . . . . . . . . . . . . . . . . . . . . . . . . . . . . . . . . . . . . . . . . . . . . . . . . . . . . . . . . . . . . . . .
. . . . . . . . . . . . . . . . . . . . . . . . . . . . . . . . . . . . . . . . . . . . . . . . . . . . . . . . . . . . . . . . . . . . . . . . . . . . . . . . . . . . . . . . . . . . . . . . . . . . . . . . . . . . . . . . . . . . . . . . . . . . . . . . . . . . . . . . . . . . . . . . . . . . . . . . . . . . . . . . . . . . . . . . . . . . . . . . . . . . . . . . . . . . . . . . . . . . . . . . . . . . . . . . . . . . . . . . . . . . . . . . . . . . . . . . . . . . . . . . . . . . . . . . . . . . . . . . . . . . . . . . . . . . . . . . . . . . . . . .
Table of Contents
1. DOCUMENT INFORMATION1.1. Giving Feedback1.2. Document History
2. INTRODUCTION: MONITORING AND RESPONDING TO RESOURCE ACTIVITY2.1. Monitoring and Types of Data2.2. Alerts and Responses to Changing Conditions2.3. Potential Impact on Server Performance2.4. Differences with Monitoring Based on Different Resource Types
3. AVAILABILITY3.1. Core "Up and Down" Monitoring3.2. Viewing a Resource's Availability Charts3.3. Detailed Discussion: Availability Duration and Performance3.4. Detailed Discussion: "Not Up" Alert Conditions3.5. Viewing Group Availability3.6. Disabling Resources for Maintenance3.7. Allowing Plug-ins to Disable and Enable Resources Automatically3.8. Changing the Availability Check Interval3.9. Changing the Agent's Availability Scan Period
4. METRICS AND MEASUREMENTS4.1. Direct Information about Resources4.2. Viewing Metrics and Baseline Charts4.3. Viewing Live Values4.4. Defining Baselines4.5. Setting Collection Intervals for a Specific Resource4.6. Enabling and Disabling Metrics for a Specific Resource4.7. Changing Metrics Templates4.8. Adding a PostgreSQL Query as a Metric
5. EVENTS5.1. Events, Logs, and Resources5.2. Event Date Formatting5.3. Defining a New Event5.4. Viewing Events5.5. Detailed Discussion: Event Correlation
6. URL RESPONSE TIME MONITORING6.1. Call-Time (or Response Time) Monitoring for URLs6.2. Viewing Call Time Metrics6.3. Extended Example: Website Performance6.4. Configuring EJB Call-Time Metrics6.5. Configuring Response Time Metrics for JBoss EAP 6/AS 76.6. Setting up Response Time Monitoring for EWS/Tomcat and JBoss EAP 5
7. RESOURCE TRAITS7.1. Collection Interval7.2. Viewing Traits7.3. Extended Example: Alerting and Traits
8. RESOURCES WHICH REQUIRE SPECIAL CONFIGURATION FOR MONITORING8.1. Configuring Tomcat/EWS Servers for Monitoring
333
34556
66
1012141516181920
202023262831323335
373738384040
41414242444653
63646464
6565
Table of Contents
1
. . . . . . . . . . . . . . . . . . . . . . . . . . . . . . . . . . . . . . . . . . . . . . . . . . . . . . . . . . . . . . . . . . . . . . . . . . . . . . . . . . . . . . . . . . . . . . . . . . . . . . . . . . . . . . . . . . . . . . . . . . . . . . . . . . . . . . . . . . . . . . . . . . . . . . . . . . . . . . . . . . . . . . . . . . . . . . . . . . . . . . . . . . . . . . . . . . . . . . . . . . . . . . . . . . . . . . . . . . . . . . . . . . . . . . . . . . . . . . . . . . . . . . . . . . . . . . . . . . . . . . . . . . . . . . . . . . . . . . . .
. . . . . . . . . . . . . . . . . . . . . . . . . . . . . . . . . . . . . . . . . . . . . . . . . . . . . . . . . . . . . . . . . . . . . . . . . . . . . . . . . . . . . . . . . . . . . . . . . . . . . . . . . . . . . . . . . . . . . . . . . . . . . . . . . . . . . . . . . . . . . . . . . . . . . . . . . . . . . . . . . . . . . . . . . . . . . . . . . . . . . . . . . . . . . . . . . . . . . . . . . . . . . . . . . . . . . . . . . . . . . . . . . . . . . . . . . . . . . . . . . . . . . . . . . . . . . . . . . . . . . . . . . . . . . . . . . . . . . . . .
. . . . . . . . . . . . . . . . . . . . . . . . . . . . . . . . . . . . . . . . . . . . . . . . . . . . . . . . . . . . . . . . . . . . . . . . . . . . . . . . . . . . . . . . . . . . . . . . . . . . . . . . . . . . . . . . . . . . . . . . . . . . . . . . . . . . . . . . . . . . . . . . . . . . . . . . . . . . . . . . . . . . . . . . . . . . . . . . . . . . . . . . . . . . . . . . . . . . . . . . . . . . . . . . . . . . . . . . . . . . . . . . . . . . . . . . . . . . . . . . . . . . . . . . . . . . . . . . . . . . . . . . . . . . . . . . . . . . . . . .
. . . . . . . . . . . . . . . . . . . . . . . . . . . . . . . . . . . . . . . . . . . . . . . . . . . . . . . . . . . . . . . . . . . . . . . . . . . . . . . . . . . . . . . . . . . . . . . . . . . . . . . . . . . . . . . . . . . . . . . . . . . . . . . . . . . . . . . . . . . . . . . . . . . . . . . . . . . . . . . . . . . . . . . . . . . . . . . . . . . . . . . . . . . . . . . . . . . . . . . . . . . . . . . . . . . . . . . . . . . . . . . . . . . . . . . . . . . . . . . . . . . . . . . . . . . . . . . . . . . . . . . . . . . . . . . . . . . . . . . .
. . . . . . . . . . . . . . . . . . . . . . . . . . . . . . . . . . . . . . . . . . . . . . . . . . . . . . . . . . . . . . . . . . . . . . . . . . . . . . . . . . . . . . . . . . . . . . . . . . . . . . . . . . . . . . . . . . . . . . . . . . . . . . . . . . . . . . . . . . . . . . . . . . . . . . . . . . . . . . . . . . . . . . . . . . . . . . . . . . . . . . . . . . . . . . . . . . . . . . . . . . . . . . . . . . . . . . . . . . . . . . . . . . . . . . . . . . . . . . . . . . . . . . . . . . . . . . . . . . . . . . . . . . . . . . . . . . . . . . . .
. . . . . . . . . . . . . . . . . . . . . . . . . . . . . . . . . . . . . . . . . . . . . . . . . . . . . . . . . . . . . . . . . . . . . . . . . . . . . . . . . . . . . . . . . . . . . . . . . . . . . . . . . . . . . . . . . . . . . . . . . . . . . . . . . . . . . . . . . . . . . . . . . . . . . . . . . . . . . . . . . . . . . . . . . . . . . . . . . . . . . . . . . . . . . . . . . . . . . . . . . . . . . . . . . . . . . . . . . . . . . . . . . . . . . . . . . . . . . . . . . . . . . . . . . . . . . . . . . . . . . . . . . . . . . . . . . . . . . . . .
. . . . . . . . . . . . . . . . . . . . . . . . . . . . . . . . . . . . . . . . . . . . . . . . . . . . . . . . . . . . . . . . . . . . . . . . . . . . . . . . . . . . . . . . . . . . . . . . . . . . . . . . . . . . . . . . . . . . . . . . . . . . . . . . . . . . . . . . . . . . . . . . . . . . . . . . . . . . . . . . . . . . . . . . . . . . . . . . . . . . . . . . . . . . . . . . . . . . . . . . . . . . . . . . . . . . . . . . . . . . . . . . . . . . . . . . . . . . . . . . . . . . . . . . . . . . . . . . . . . . . . . . . . . . . . . . . . . . . . . .
. . . . . . . . . . . . . . . . . . . . . . . . . . . . . . . . . . . . . . . . . . . . . . . . . . . . . . . . . . . . . . . . . . . . . . . . . . . . . . . . . . . . . . . . . . . . . . . . . . . . . . . . . . . . . . . . . . . . . . . . . . . . . . . . . . . . . . . . . . . . . . . . . . . . . . . . . . . . . . . . . . . . . . . . . . . . . . . . . . . . . . . . . . . . . . . . . . . . . . . . . . . . . . . . . . . . . . . . . . . . . . . . . . . . . . . . . . . . . . . . . . . . . . . . . . . . . . . . . . . . . . . . . . . . . . . . . . . . . . . .
. . . . . . . . . . . . . . . . . . . . . . . . . . . . . . . . . . . . . . . . . . . . . . . . . . . . . . . . . . . . . . . . . . . . . . . . . . . . . . . . . . . . . . . . . . . . . . . . . . . . . . . . . . . . . . . . . . . . . . . . . . . . . . . . . . . . . . . . . . . . . . . . . . . . . . . . . . . . . . . . . . . . . . . . . . . . . . . . . . . . . . . . . . . . . . . . . . . . . . . . . . . . . . . . . . . . . . . . . . . . . . . . . . . . . . . . . . . . . . . . . . . . . . . . . . . . . . . . . . . . . . . . . . . . . . . . . . . . . . . .
8.2. Configuring the Apache SNMP Module8.3. Metrics Collection Considerations with Apache and SNMP
9. REPORTS AND DATA9.1. Dashboards and Portlets9.2. Summary Timelines9.3. Resource-Level Metrics Charts9.4. Creating Custom Metrics Pages9.5. Suspect Metrics Report9.6. Platform Utilization Report
10. STORING MONITORING DATA10.1. Changing Storage Lengths10.2. Exporting Raw Data
11. PLANNING ALERTS11.1. An Alerting Strategy in Four Questions11.2. Basic Procedure for Setting Alerts for a Resource11.3. Enabling and Disabling Alert Definitions11.4. Group Alerting and Alert Templates
12. ALERT CONDITIONS12.1. Reasons for Firing an Alert12.2. Detailed Discussion: Ranges, AND, and OR Operators with Conditions12.3. Detailed Discussion: Conditions Based on Log File Messages12.4. Detailed Discussion: Dampening12.5. Detailed Discussion: Automatically Disabling and Recovering Alerts
13. ALERT RESPONSES13.1. Notifying Administrators and Responding to Alerts13.2. Detailed Discussion: Initiating an Operation13.3. Detailed Discussion: Initiating Resource Scripts13.4. Detailed Discussion: Launching JBoss ON CLI Scripts from an Alert13.5. Configuring SNMP for Notifications
14. VIEWING ALERT DATA14.1. Viewing the Alert Definitions Report14.2. Viewing Alerts14.3. Acknowledging an Alert14.4. Troubleshooting Alerts
15. OPERATIONS: AN INTRODUCTION15.1. A Summary of Operation Benefits15.2. About Scheduling Operations
16. MANAGING OPERATIONS: PROCEDURES16.1. Scheduling Operations16.2. Viewing the Operation History16.3. Canceling Pending Operations16.4. Ordering Group Operations16.5. Running Scripts as Operations for JBoss Servers16.6. Setting an Operation Timeout Default16.7. Operation History Report
INDEX
6669
69697374757678
797980
8181838789
929293949597
989999
105106111
115115116119120
121121122
123123125126127129130131
132
Setting up Monitoring, Alerts, and Operations
2
1. DOCUMENT INFORMATION
This guide is part of the overall set of guides for users and administrators of JBoss ON. Our goal isclarity, completeness, and ease of use.
1.1. Giving Feedback
If there is any error in this Admin: Setting up Monitoring, Alerts, and Operations or there is any way toimprove the documentation, please let us know. Bugs can be filed against the documentation for thecommunity-based RHQ Project in Bugzilla, http://bugzilla.redhat.com/bugzilla. Make the bug report asspecific as possible, so we can be more effective in correcting any issues:
1. Select the JBoss products group.
2. Select JBoss Operations Network from the list.
3. Set the component to Documentation.
4. Set the version number to 3.1.2.
5. For errors, give the page number (for the PDF) or URL (for the HTML), and give a succinctdescription of the problem, such as incorrect procedure or typo.
For enhancements, put in what information needs to be added and why.
6. Give a clear title for the bug. For example, "Incorrect command example for setup script options" is better than "Bad example".
We appreciate receiving any feedback — requests for new sections, corrections, improvements,enhancements, even new ways of delivering the documentation or new styles of docs.
1.2. Document History
Revision 3.1.2-2.400 2013-10-31 Rüdiger LandmannRebuild with publican 4.0.0
Revision 3.1.2-2 January 23, 2013 Ella Deon LackeyRemoved references to installing mod_rt for Apache resources.
Updated/restricted support for mod_snmp for Apache resources to Apache 2.2.
Revision 3.1.1-1 September 19, 2012 Ella Deon LackeyBug fixing for JBoss ON 3.1.1.
Revision 3.1-0 June 12, 2012 Ella Deon LackeyInitial release of JBoss ON 3.1.
2. INTRODUCTION: MONITORING AND RESPONDING TO RESOURCEACTIVITY
1. DOCUMENT INFORMATION
3
One of the core functions of JBoss Operations Network is that it lets administrators stay aware of thestate of their JBoss servers, platforms, and overall IT environment.
The current state of individual servers and applications provides critical information to IT staff abouttraffic and usage, equipment failures, and server performance. JBoss Operations Network can supply aclearer picture of these critical data by automatically monitoring resources in its inventory.
The most powerful aspect of management is the ability to know, accurately, where your resources areand to respond to that ever-changing situation reliably.
2.1. Monitoring and Types of Data
Monitoring gives insight into how a specific machine, application, or service is performing. JBoss ONcollects different types of information from different native and external sources for its managedresources.
JBoss Operations Network is not a real-time monitor, and it is not an archive of data points. JBoss ON isnot a profiler. What JBoss ON does is, in essence, filter and process raw data so that long-term trends,operating parameters, and performance histories — the purpose of monitoring — are clear andaccessible from the data. JBoss ON uses schedules to define what information to gather and howfrequently (anywhere from 30 seconds to hours). This prioritizes the performance information for aresource and makes important information more visible and coherent.
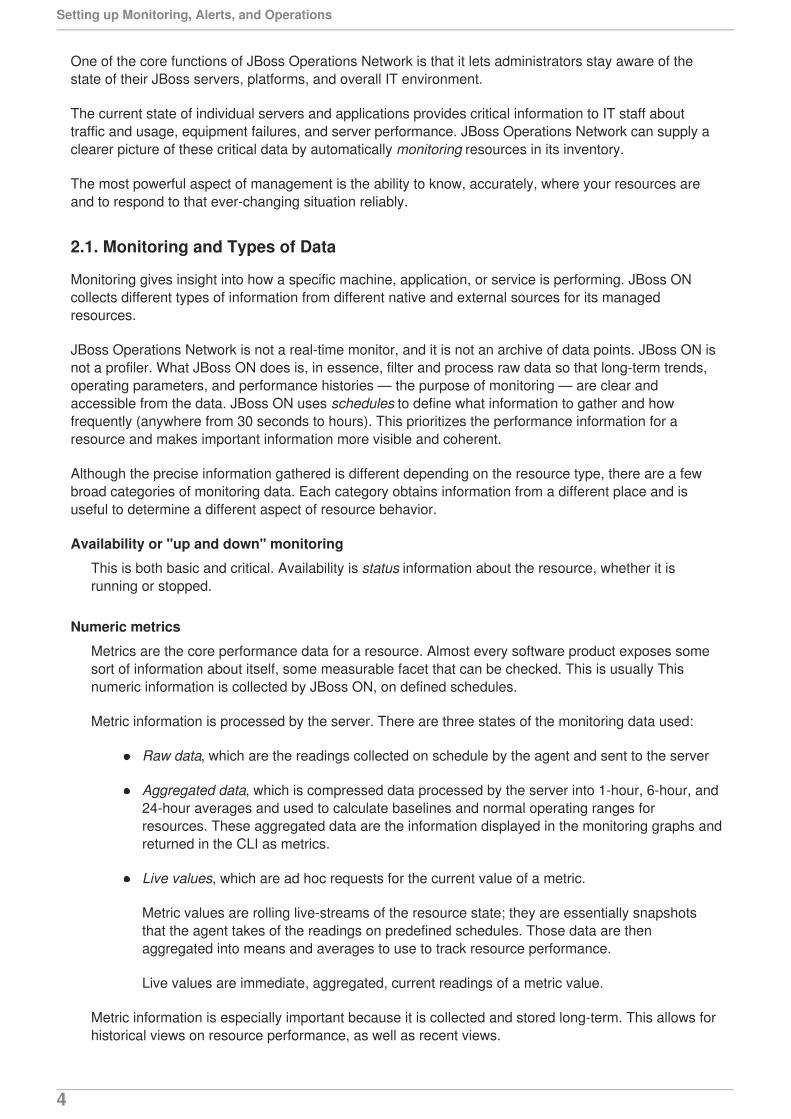
Although the precise information gathered is different depending on the resource type, there are a fewbroad categories of monitoring data. Each category obtains information from a different place and isuseful to determine a different aspect of resource behavior.
Availability or "up and down" monitoring
This is both basic and critical. Availability is status information about the resource, whether it isrunning or stopped.
Numeric metrics
Metrics are the core performance data for a resource. Almost every software product exposes somesort of information about itself, some measurable facet that can be checked. This is usually Thisnumeric information is collected by JBoss ON, on defined schedules.
Metric information is processed by the server. There are three states of the monitoring data used:
Raw data, which are the readings collected on schedule by the agent and sent to the server
Aggregated data, which is compressed data processed by the server into 1-hour, 6-hour, and24-hour averages and used to calculate baselines and normal operating ranges forresources. These aggregated data are the information displayed in the monitoring graphs andreturned in the CLI as metrics.
Live values, which are ad hoc requests for the current value of a metric.
Metric values are rolling live-streams of the resource state; they are essentially snapshotsthat the agent takes of the readings on predefined schedules. Those data are thenaggregated into means and averages to use to track resource performance.
Live values are immediate, aggregated, current readings of a metric value.
Metric information is especially important because it is collected and stored long-term. This allows forhistorical views on resource performance, as well as recent views.
Setting up Monitoring, Alerts, and Operations
4
Logfile messages (events)
While JBoss ON is not a log viewer, it can monitor specified logs and check for important logmessages based on severity or strings within the log messages. This is event monitoring, and itallows JBoss ON to identify incidents for a resource and to send an alert notification and, ifnecessary, take corrective action based on dynamic information outside normal metrics.
Response time metrics
Certain types of resources (URLs for web servers or session beans) depend on responsiveness as acomponent of overall performance. Response time or call-time data tracks how quickly the URL orsession bean responds to client requests and helps determine that the overall application isperformant.
Descriptive strings (traits)
Most resources have some relatively static information that describe the resource itself, such as aninstance name, build date, or version number. This information is a trait. As with other attributes for aresource, this can be monitored. Traits are useful to identify changes to the underlying application,like a version update.
2.2. Alerts and Responses to Changing Conditions
A critical part of monitoring is being aware of when undesirable events occur. Alerting works with otherfunctions in JBoss ON management (monitoring data and configuration drift detection) to defineconditions for triggering an alert.
When an alert condition is met, alerting in JBoss ON serves two important functions:
Alerts communicate that there has been a problem, based on parameters defined by anadministrator.
Alerts respond to incidents automatically. Administrators can automatically initiate an operation,run a JBoss ON CLI script to change JBoss ON or resource configuration, redeploy content, orrun a shell script, all in response to an alert condition.
Automatic, administrator-defined responses to alerts make it significantly easier foradministrators to address infrastructure problems quickly, and can mitigate the effect of outages.
Alerts are based on metrics information, call-time data, availability, and events, all normal monitoringelements. Alerting can also be based on critical changes to a resource, defined in drift definitions thattrack configuration drift. Tracking configuration for resources along with monitoring data letsadministrators remedy unplanned or undesirable system changes easily and consistently.
2.3. Potential Impact on Server Performance
Theoretically, there is no limit to the number of metrics that can collected or the number of alerts that canbe fired.
In reality, there are natural constraints within the IT environment that limit both monitoring and alertsettings:
Database performance, which is the primary factor in most environments
Network bandwidth
1. DOCUMENT INFORMATION
5
There are no hard limits on JBoss ON's alerting and monitoring configuration since it depends on thenumber of resources, number of metrics, collection frequency, and the number of alerts.
As a rule of thumb, there are these performance thresholds:
Up to 30,000 metrics can be collected per minute
Up to 100,000 alerts can be fired per day (roughly 70 per minute)
Plan how to implement metrics collection and alerting. Prioritize resources and then the informationrequired from those resources when enabling metrics schedules and setting collection frequencies. Then,based on those priorities, plan what alerts are required.
Clear monitoring and alerting strategies can help maintain performance while still gathering criticalinformation.
2.4. Differences with Monitoring Based on Different Resource Types
Available metrics, events, traits, and other monitoring settings are defined for each resource type in itsplug-in descriptor.
Obviously, software of completely different types have different possible monitoring configuration.
However, monitoring settings can be different between releases of the same software. Either differentmetrics are available or the same metric may have different configuration names. For example, JBossEAP 4 and 5 have the same metrics, related to monitoring the EAP server JVM, threads, andtransactions. Because of the different management structure in JBoss EAP 6, there are different metrics,related to management requests between the servers in the EAP 6 domain.
The Resource Reference: Monitoring, Operation, and Configuration Options has a complete referencesof available metrics for the official JBoss ON agent plug-ins. Check this guide to see what differencesthere are between release versions.
3. AVAILABILITY
One of the most basic elements for monitoring is knowing whether your server or application is running.Availability monitoring tells administrators that a certain process is running and minimally responsive.
3.1. Core "Up and Down" Monitoring
The first question with monitoring is is the resource running? A resource's availability is the first thing tocheck for overall performance, for determining service levels, and for maintaining infrastructure.
Availability (sometimes called up or down monitoring) determines whether a resource is up or whether itis in some other state.
Up means that the resource is running and that it responds to the agent within a prescribed time.
How availability is determined depends on the resource; it could be checking a process ID or a JVM orsomething else. Availability for a resource type is defined in its plug-in descriptor. Therefore, the plug-incontainer is the intermediary between the resource and the agent. The agent checks the plug-incontainer for resource availability; the container obtains it from the resource component.
Usually, an availability check takes a fraction of a second; for certain types of resources or in certainenvironments, it could take longer. There is a timeout period for availability scans, set to five (5) secondsby default. If a resource is running and responds to the availability scan within that five-second window,
Setting up Monitoring, Alerts, and Operations
6
the resource is up.
Because availability — or "up and down" — monitoring is so critical to IT administrators, availabilitystates in JBoss ON are highly visible. Availability is displayed on resource details pages, in every list ofresources, in groups, and in monitoring reports. The idea is that it should only take a glance to be able todetermine whether your resource is up.
Figure 1. Resource Availability
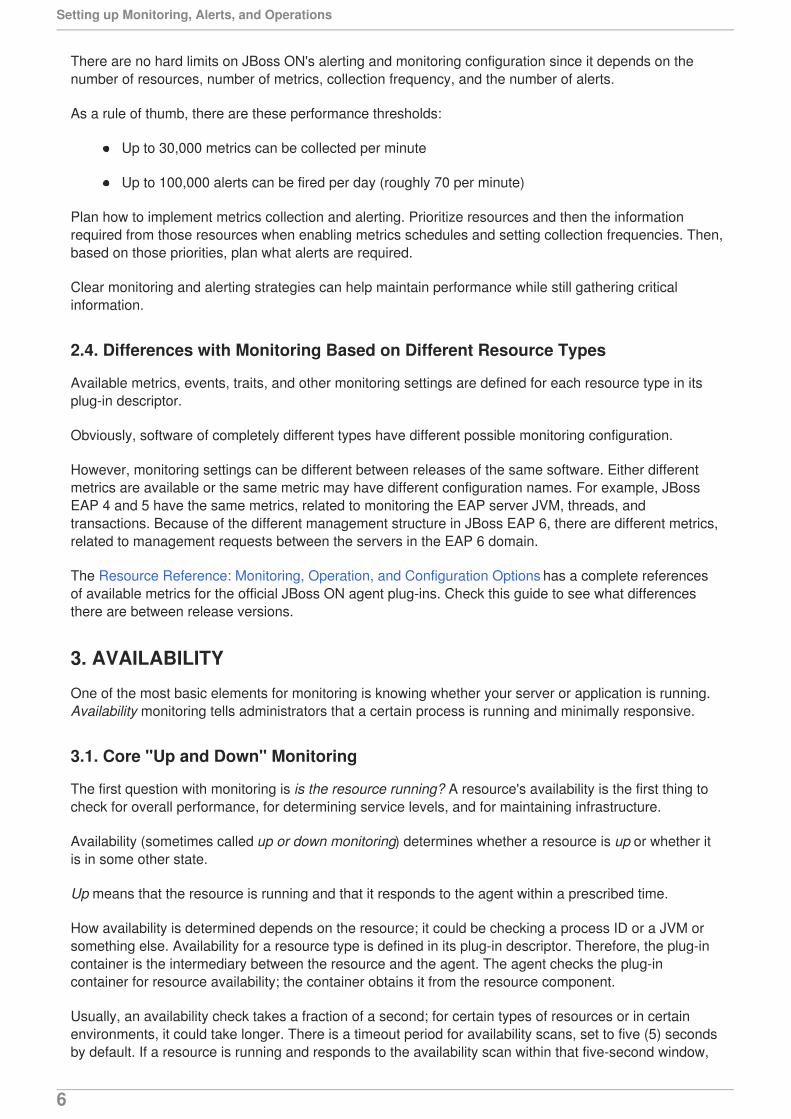
Even though availability is not a true monitoring metric, the Monitoring > Graphs page even showsthe percentage of time, within the display time period, that the resource has been in an up state. This isbecause availability (and concomitant uptime) impacts every other metric collected by the agent.
Figure 2. Availability Uptime Percentage
NOTE
Often, if a resource shows down availability even when it is running, it is a problem withthe connection settings. The agent may not have information it requires, such as ausername or new port number, that it requires to connect to the resource. Since the agentcannot connect to the resource, it assumes it is down.
3.1.1. Availability States
There is a gray area between up and not up. While a resource may not be up, it may be not up fordifferent reasons. For instance, an agent could have been restarted, so no resource states are known.Or a resource may have been taken offline for maintenance, so no availability reports are being sent.
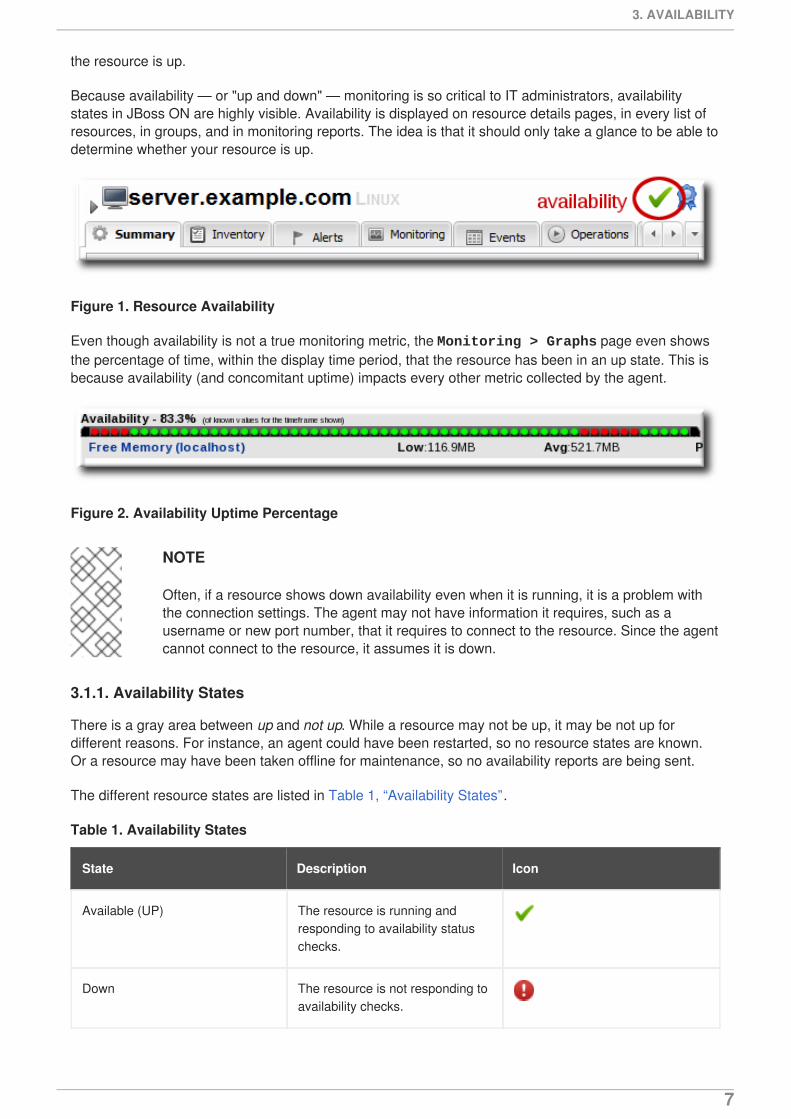
The different resource states are listed in Table 1, “Availability States”.
Table 1. Availability States
State Description Icon
Available (UP) The resource is running andresponding to availability statuschecks.
Down The resource is not responding toavailability checks.
3. AVAILABILITY
7
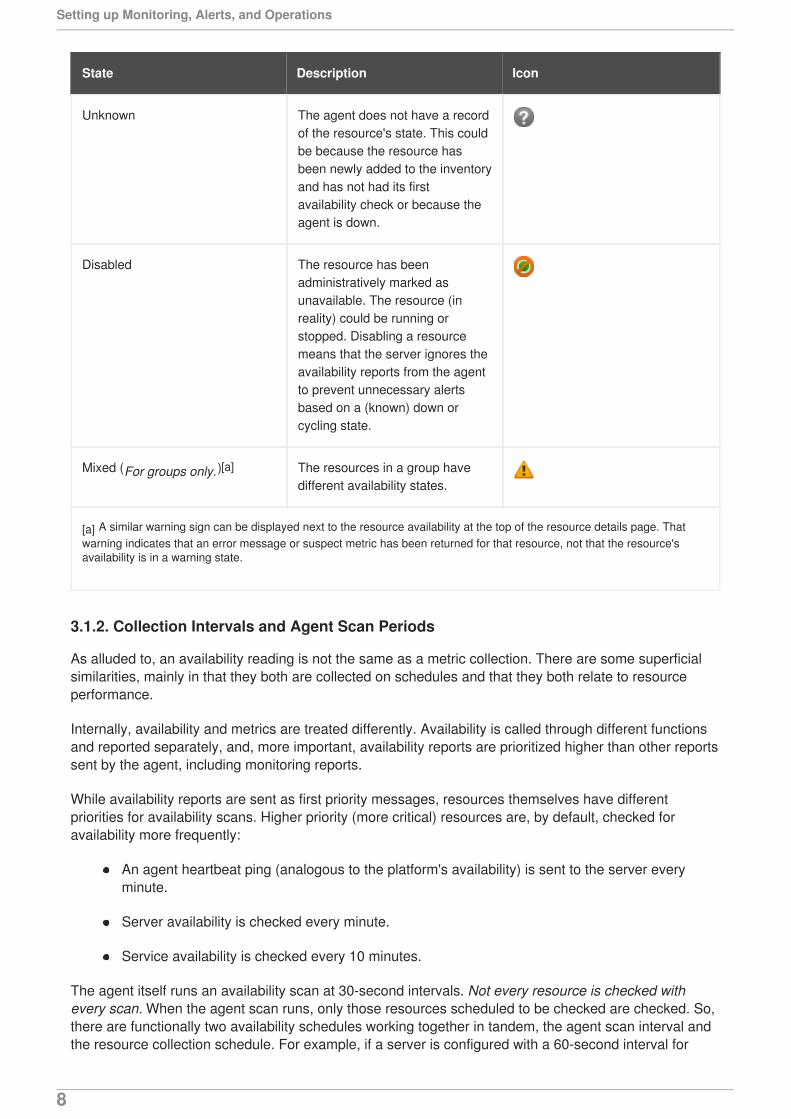
Unknown The agent does not have a recordof the resource's state. This couldbe because the resource hasbeen newly added to the inventoryand has not had its firstavailability check or because theagent is down.
Disabled The resource has beenadministratively marked asunavailable. The resource (inreality) could be running orstopped. Disabling a resourcemeans that the server ignores theavailability reports from the agentto prevent unnecessary alertsbased on a (known) down orcycling state.
Mixed (For groups only.)[a] The resources in a group havedifferent availability states.
[a] A similar warning sign can be displayed next to the resource availability at the top of the resource details page. Thatwarning indicates that an error message or suspect metric has been returned for that resource, not that the resource'savailability is in a warning state.
State Description Icon
3.1.2. Collection Intervals and Agent Scan Periods
As alluded to, an availability reading is not the same as a metric collection. There are some superficialsimilarities, mainly in that they both are collected on schedules and that they both relate to resourceperformance.
Internally, availability and metrics are treated differently. Availability is called through different functionsand reported separately, and, more important, availability reports are prioritized higher than other reportssent by the agent, including monitoring reports.
While availability reports are sent as first priority messages, resources themselves have differentpriorities for availability scans. Higher priority (more critical) resources are, by default, checked foravailability more frequently:
An agent heartbeat ping (analogous to the platform's availability) is sent to the server everyminute.
Server availability is checked every minute.
Service availability is checked every 10 minutes.
The agent itself runs an availability scan at 30-second intervals. Not every resource is checked withevery scan. When the agent scan runs, only those resources scheduled to be checked are checked. So,there are functionally two availability schedules working together in tandem, the agent scan interval andthe resource collection schedule. For example, if a server is configured with a 60-second interval for
Setting up Monitoring, Alerts, and Operations
8
availability checks and the agent scan period is 30 seconds, the server is eligible to be checked everytwo scans. That means that the server is checked roughly every 60 seconds, but that is a best effortestimate; if the agent is under a heavy load or if there are a large number of resources, the agent mayrun its scans longer than every 30 seconds, so the actual interval between checks for a specific resourcewould be longer.
The agent only sends an availability report to the server if there is an availability state change for one ofits managed resources.
If an agent goes down suddenly, it shows a down state within five minutes, the (default) agent quietperiod. If the agent shuts down gracefully, the JBoss ON server recognizes the state change withinabout a minute. Once the server recognizes the agent is down, it begins backfilling the states of all of theresources in that agent's inventory (Section 3.1.4, “Parent-Child States and Backfilling”).
Down servers typically record a down state between one and two minutes after going down. This is notexactly real-time, but it is close enough for most infrastructure to be able to establish a reliable baselineof performance and even calculate service levels and uptime. A short window of 90 seconds can catchmost resource cycling.
The default agent scan interval is 30 seconds, but, depending on a resource schedule, it could be over10 minutes before some services are detected as down. If an administrator suspects that there has beena state change, it is possible to force an immediate availability scan for all resources for the agentthrough the interactive agent prompt:
> avail -- force
Using simply the avail command runs the check for the next scheduled resources, not all resources.
Additionally, resource plug-ins can be written so that any operation which could cause a state change(such as start, stop, and restart operations) automatically requests an availability check for the resourcewhen the operation ends.
3.1.3. Long Scan Times and Async Availability Collection
Availability scans are performed by a resource plug-in itself, for its defined resource types, and thenreported to the plug-in container..
Availability checks are typically very fast, fractions of a second, but there can be situations where anavailability check takes longer. The plug-in container limits how long an availability check can run to fiveseconds, to prevent a rogue plug-in from delaying availability reporting for all other resources managedby the agent.
There can be instances where a certain plug-in or resource type consistently has scans longer than thefive-second timeout period.
For custom plug-ins, plug-in writers can configure asynchronous availability checking. Basically, withasync availability checks, the resource component creates its own, independent thread to run availabilitychecks. Within that thread, the availability checks can take as long as they need to complete. Theavailability checks can also be run fairly frequently, every minute by default, to make sure that theavailability state is current, even if the full check takes longer to complete.
The component caches and then reports the most recent availability result to the plug-in container. Thatstored last availability can be delivered very quickly, in the fractions of a second that the plug-incontainer expects.
3. AVAILABILITY
9
Async availability checks are implemented through the AvailabilityCollectorRunnable class inthe JBoss ON plug-in API. Details for this class are available in the plug-in API and Writing Custom Plug-ins.
NOTE
It is also possible to address long availability check times by extending the scan timeoutperiod in the agent configuration itself. For example, add a new timeout period to the ADDITIONAL_JAVA_OPTIONS parameters in the rhq-agent-env.sh file:
RHQ_AGENT_ADDITIONAL_JAVA_OPTS="-Drhq.agent.plugins.availability-scan.timeout=15000"
However, that timeout period applies to the entire plug-in container, not just one specific,slow-running plug-in. If there are several plug-ins that are running sluggish availabilitychecks, then the availability report may take too long to complete, causing the agent todelay or even miss sending availability reports to the JBoss ON server.
Generally, it is preferable to configure async availability on a custom plug-in, rather thantrying to reset the scan interval for all plug-ins.
3.1.4. Parent-Child States and Backfilling
Availability is assessed from the top of the resource tree downward. For example, if an application serveris down, it is safe to assume that all of its dependent webapp children are also down.
This is called backfilling. The parent's state is propagated to its children without running additionalavailability scans for each child. Backfilling can set children to down, unknown, or disabled states.
In some cases, backfilling even includes up states. Some dependent child resources (low priorityservices that only run if the parent is running) may not even have their own availability assessedindependently by default. When a child's availability checking is disabled, the child presumptively uses itsparent's state. If the parent is up, those children are assumed to be up.
There is one slight variation on backfilling — if a platform is marked as down. A platform being down isthe same as the agent being down. It means that the agent has not reported to the server. There couldbe a number of reasons for that, apart from any servers or services actually being offline. In this case, theplatform (functionally, the agent) is set to down, but its children are set to unknown.
3.2. Viewing a Resource's Availability Charts
1. Click the Inventory tab in the top menu.
2. Select the resource category, such as servers or services, in the Resources menu table on theleft. Then browse or search for the resource.
Setting up Monitoring, Alerts, and Operations
10
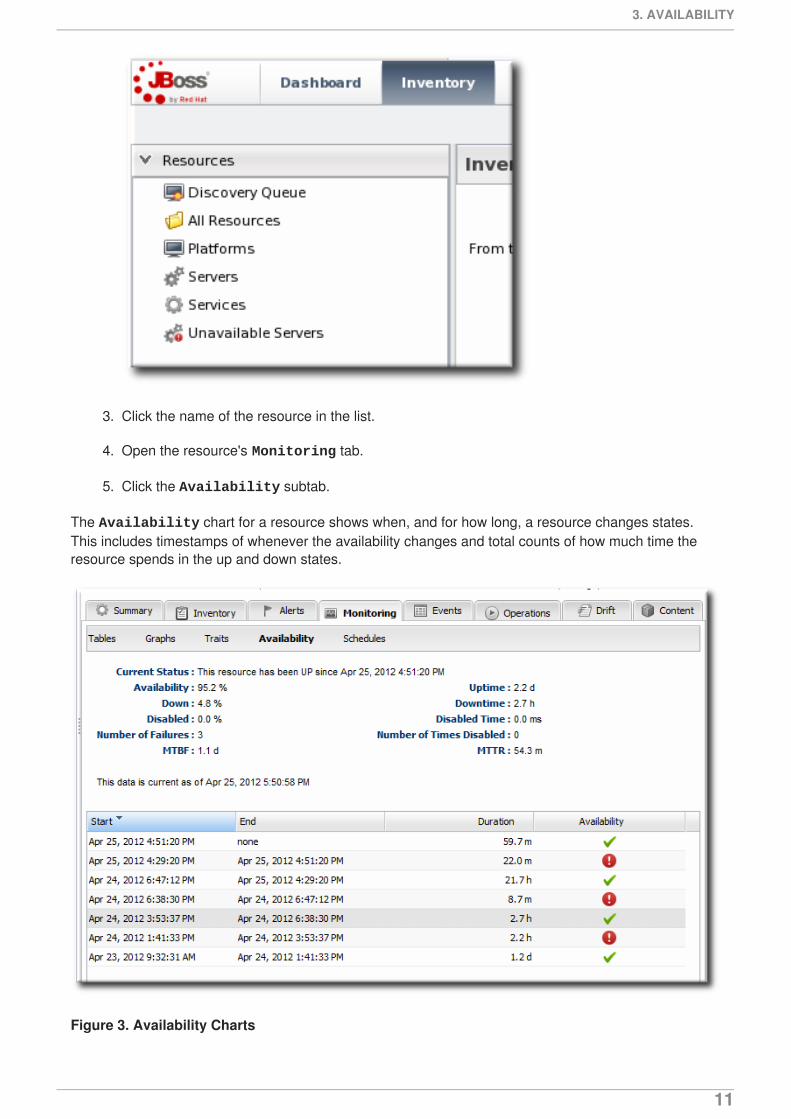
3. Click the name of the resource in the list.
4. Open the resource's Monitoring tab.
5. Click the Availability subtab.
The Availability chart for a resource shows when, and for how long, a resource changes states.This includes timestamps of whenever the availability changes and total counts of how much time theresource spends in the up and down states.
Figure 3. Availability Charts
3. AVAILABILITY
11
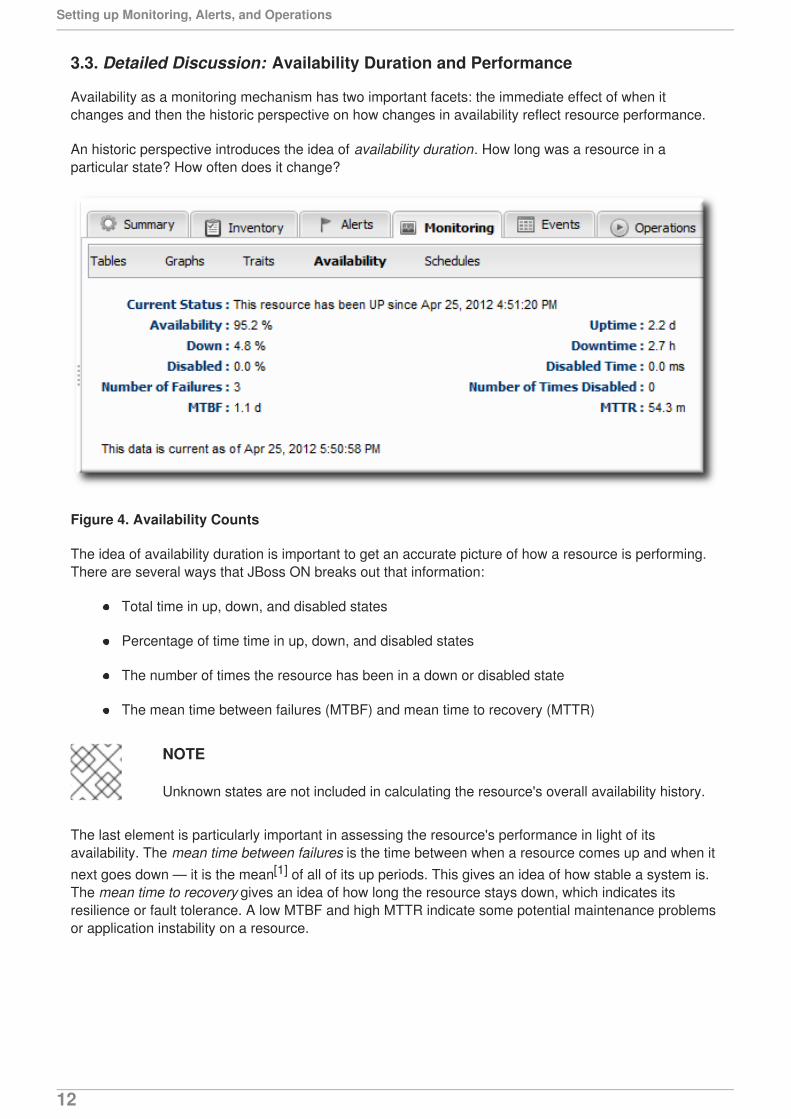
3.3. Detailed Discussion: Availability Duration and Performance
Availability as a monitoring mechanism has two important facets: the immediate effect of when itchanges and then the historic perspective on how changes in availability reflect resource performance.
An historic perspective introduces the idea of availability duration. How long was a resource in aparticular state? How often does it change?
Figure 4. Availability Counts
The idea of availability duration is important to get an accurate picture of how a resource is performing.There are several ways that JBoss ON breaks out that information:
Total time in up, down, and disabled states
Percentage of time time in up, down, and disabled states
The number of times the resource has been in a down or disabled state
The mean time between failures (MTBF) and mean time to recovery (MTTR)
NOTE
Unknown states are not included in calculating the resource's overall availability history.
The last element is particularly important in assessing the resource's performance in light of itsavailability. The mean time between failures is the time between when a resource comes up and when itnext goes down — it is the mean[1] of all of its up periods. This gives an idea of how stable a system is.The mean time to recovery gives an idea of how long the resource stays down, which indicates itsresilience or fault tolerance. A low MTBF and high MTTR indicate some potential maintenance problemsor application instability on a resource.
Setting up Monitoring, Alerts, and Operations
12
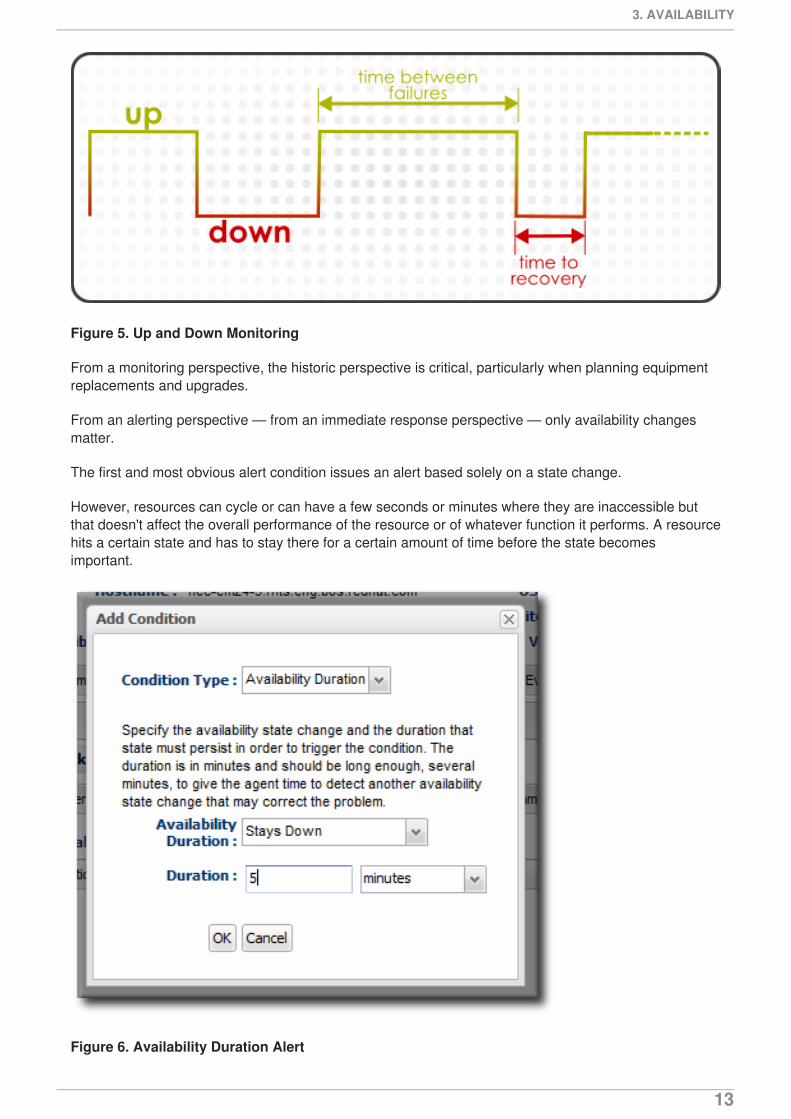
Figure 5. Up and Down Monitoring
From a monitoring perspective, the historic perspective is critical, particularly when planning equipmentreplacements and upgrades.
From an alerting perspective — from an immediate response perspective — only availability changesmatter.
The first and most obvious alert condition issues an alert based solely on a state change.
However, resources can cycle or can have a few seconds or minutes where they are inaccessible butthat doesn't affect the overall performance of the resource or of whatever function it performs. A resourcehits a certain state and has to stay there for a certain amount of time before the state becomesimportant.
Figure 6. Availability Duration Alert
3. AVAILABILITY
13
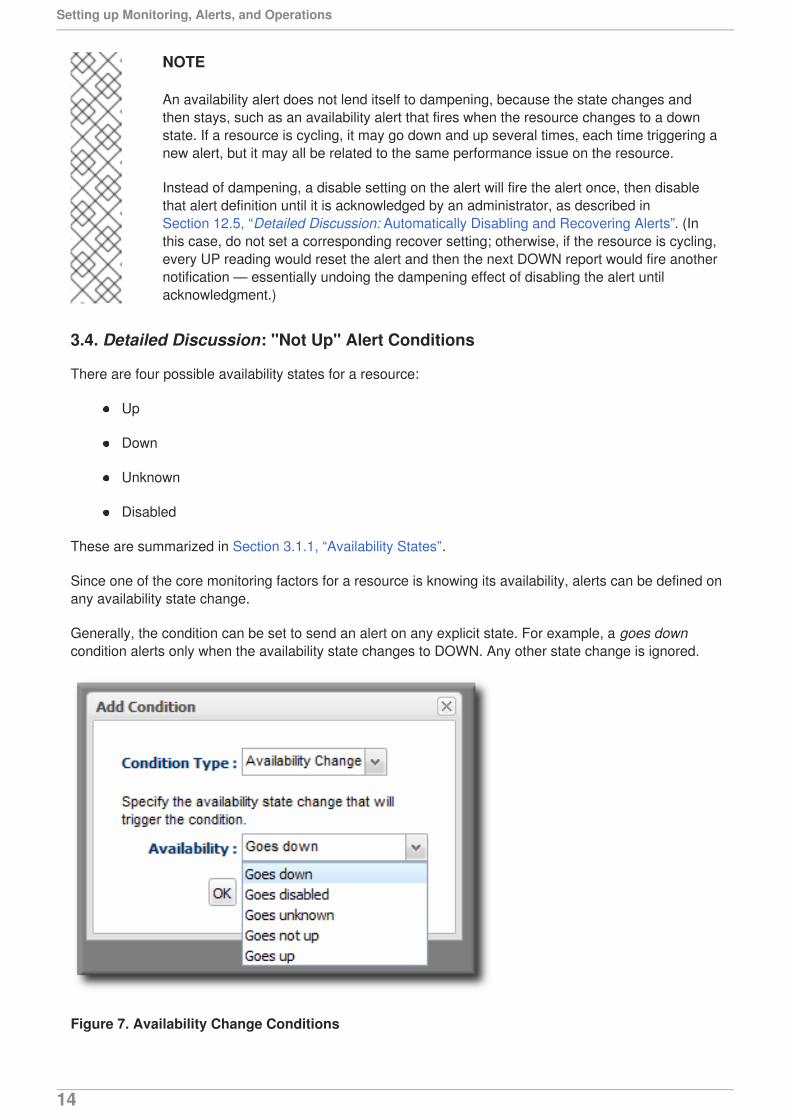
NOTE
An availability alert does not lend itself to dampening, because the state changes andthen stays, such as an availability alert that fires when the resource changes to a downstate. If a resource is cycling, it may go down and up several times, each time triggering anew alert, but it may all be related to the same performance issue on the resource.
Instead of dampening, a disable setting on the alert will fire the alert once, then disablethat alert definition until it is acknowledged by an administrator, as described inSection 12.5, “Detailed Discussion: Automatically Disabling and Recovering Alerts”. (Inthis case, do not set a corresponding recover setting; otherwise, if the resource is cycling,every UP reading would reset the alert and then the next DOWN report would fire anothernotification — essentially undoing the dampening effect of disabling the alert untilacknowledgment.)
3.4. Detailed Discussion: "Not Up" Alert Conditions
There are four possible availability states for a resource:
Up
Down
Unknown
Disabled
These are summarized in Section 3.1.1, “Availability States”.
Since one of the core monitoring factors for a resource is knowing its availability, alerts can be defined onany availability state change.
Generally, the condition can be set to send an alert on any explicit state. For example, a goes downcondition alerts only when the availability state changes to DOWN. Any other state change is ignored.
Figure 7. Availability Change Conditions
Setting up Monitoring, Alerts, and Operations
14
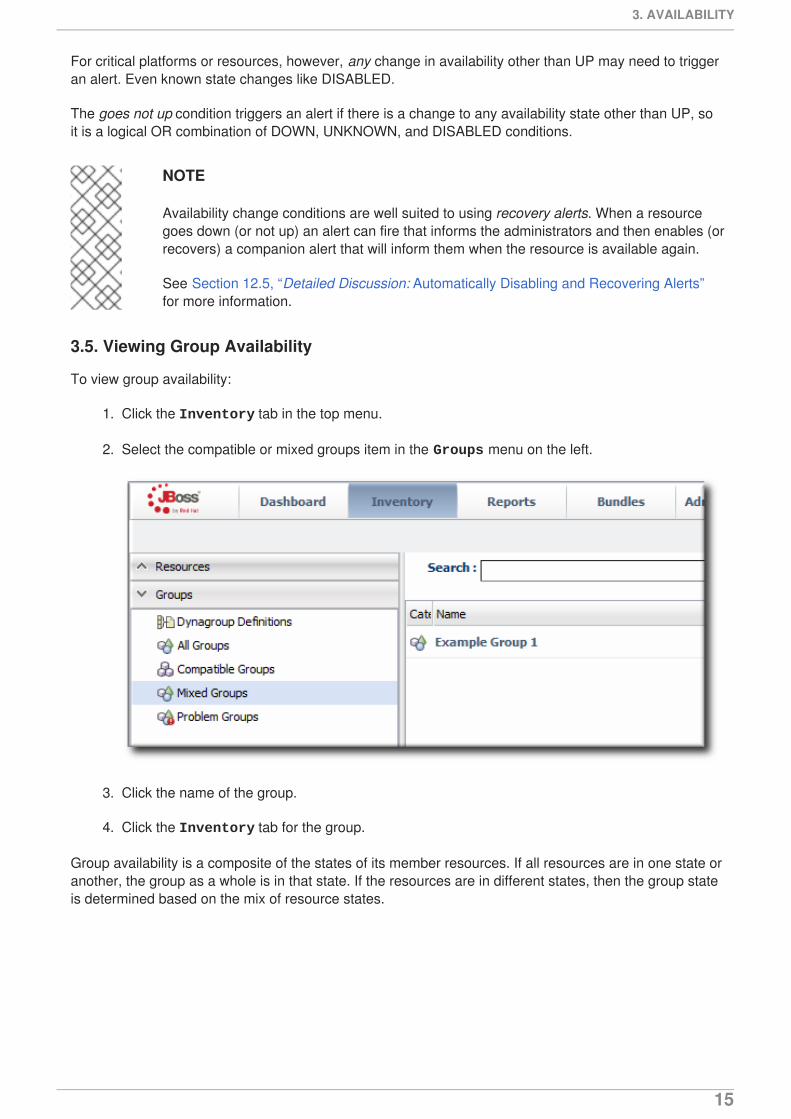
For critical platforms or resources, however, any change in availability other than UP may need to triggeran alert. Even known state changes like DISABLED.
The goes not up condition triggers an alert if there is a change to any availability state other than UP, soit is a logical OR combination of DOWN, UNKNOWN, and DISABLED conditions.
NOTE
Availability change conditions are well suited to using recovery alerts. When a resourcegoes down (or not up) an alert can fire that informs the administrators and then enables (orrecovers) a companion alert that will inform them when the resource is available again.
See Section 12.5, “Detailed Discussion: Automatically Disabling and Recovering Alerts”for more information.
3.5. Viewing Group Availability
To view group availability:
1. Click the Inventory tab in the top menu.
2. Select the compatible or mixed groups item in the Groups menu on the left.
3. Click the name of the group.
4. Click the Inventory tab for the group.
Group availability is a composite of the states of its member resources. If all resources are in one state oranother, the group as a whole is in that state. If the resources are in different states, then the group stateis determined based on the mix of resource states.
3. AVAILABILITY
15
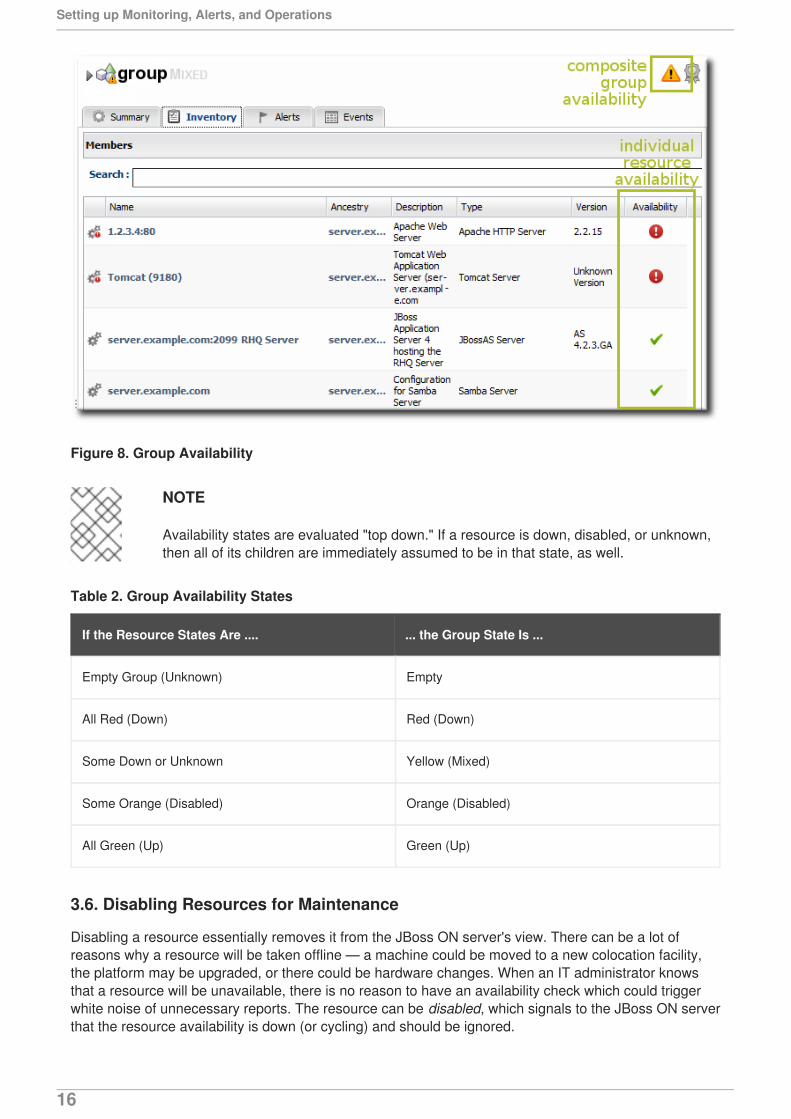
Figure 8. Group Availability
NOTE
Availability states are evaluated "top down." If a resource is down, disabled, or unknown,then all of its children are immediately assumed to be in that state, as well.
Table 2. Group Availability States
If the Resource States Are .... ... the Group State Is ...
Empty Group (Unknown) Empty
All Red (Down) Red (Down)
Some Down or Unknown Yellow (Mixed)
Some Orange (Disabled) Orange (Disabled)
All Green (Up) Green (Up)
3.6. Disabling Resources for Maintenance
Disabling a resource essentially removes it from the JBoss ON server's view. There can be a lot ofreasons why a resource will be taken offline — a machine could be moved to a new colocation facility,the platform may be upgraded, or there could be hardware changes. When an IT administrator knowsthat a resource will be unavailable, there is no reason to have an availability check which could triggerwhite noise of unnecessary reports. The resource can be disabled, which signals to the JBoss ON serverthat the resource availability is down (or cycling) and should be ignored.
Setting up Monitoring, Alerts, and Operations
16
There are two things to remember when disabling a resource:
If the agent is still up, then the resource availability is still reported. It is just ignored by the JBossON server, and is not included in any availability calculations.
Disabling a parent resource automatically disables all of its children, too.
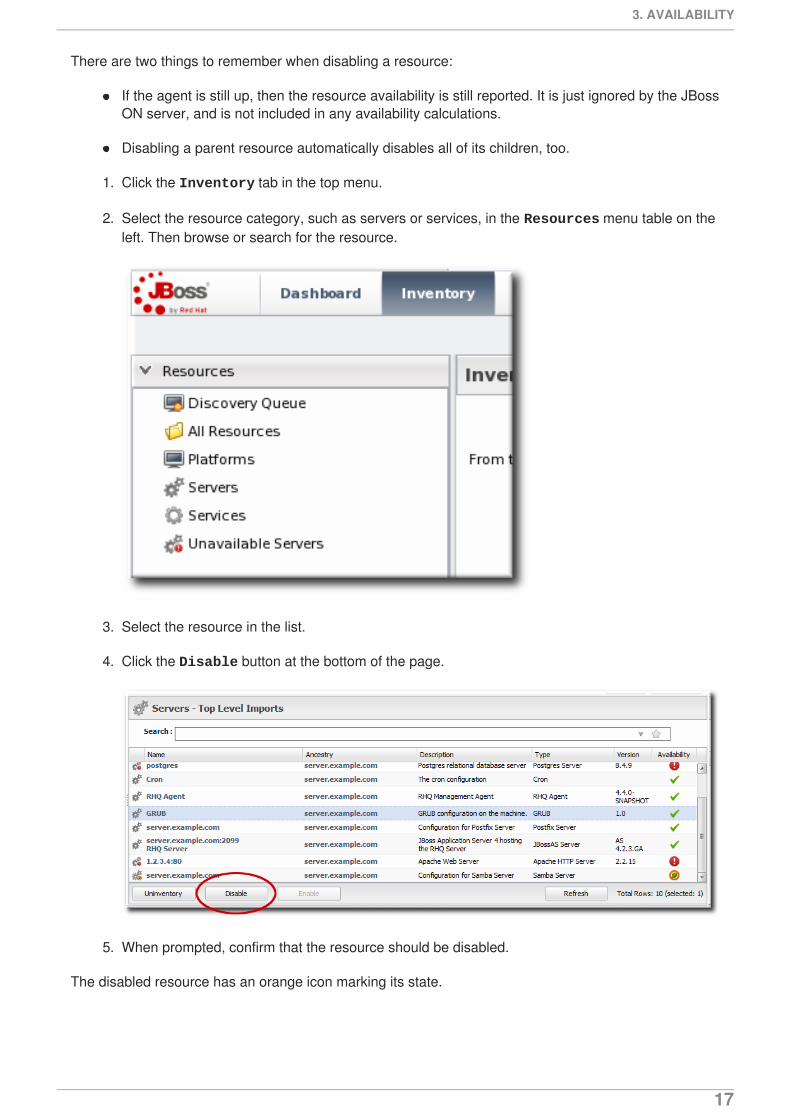
1. Click the Inventory tab in the top menu.
2. Select the resource category, such as servers or services, in the Resources menu table on theleft. Then browse or search for the resource.
3. Select the resource in the list.
4. Click the Disable button at the bottom of the page.
5. When prompted, confirm that the resource should be disabled.
The disabled resource has an orange icon marking its state.
3. AVAILABILITY
17
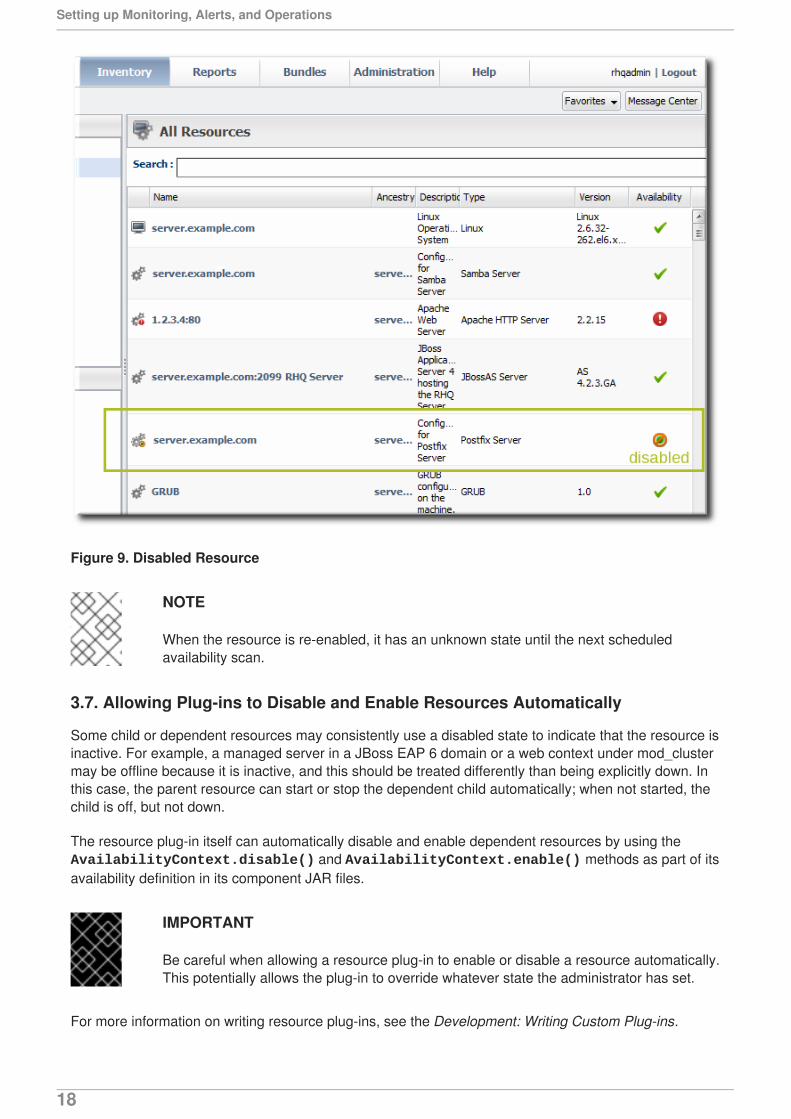
Figure 9. Disabled Resource
NOTE
When the resource is re-enabled, it has an unknown state until the next scheduledavailability scan.
3.7. Allowing Plug-ins to Disable and Enable Resources Automatically
Some child or dependent resources may consistently use a disabled state to indicate that the resource isinactive. For example, a managed server in a JBoss EAP 6 domain or a web context under mod_clustermay be offline because it is inactive, and this should be treated differently than being explicitly down. Inthis case, the parent resource can start or stop the dependent child automatically; when not started, thechild is off, but not down.
The resource plug-in itself can automatically disable and enable dependent resources by using the AvailabilityContext.disable() and AvailabilityContext.enable() methods as part of itsavailability definition in its component JAR files.
IMPORTANT
Be careful when allowing a resource plug-in to enable or disable a resource automatically.This potentially allows the plug-in to override whatever state the administrator has set.
For more information on writing resource plug-ins, see the Development: Writing Custom Plug-ins.
Setting up Monitoring, Alerts, and Operations
18
3.8. Changing the Availability Check Interval
While the availability check is not strictly a metric, it does have a collection schedule that can be editedwith the other metric collection schedules.
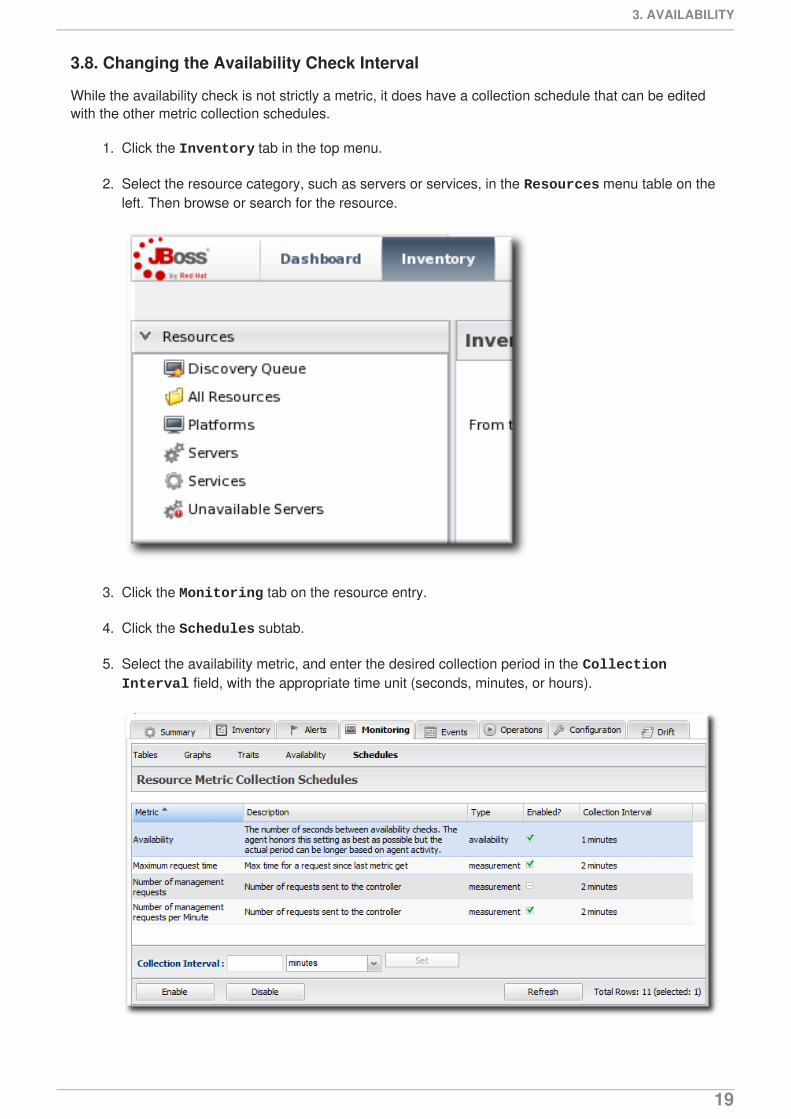
1. Click the Inventory tab in the top menu.
2. Select the resource category, such as servers or services, in the Resources menu table on theleft. Then browse or search for the resource.
3. Click the Monitoring tab on the resource entry.
4. Click the Schedules subtab.
5. Select the availability metric, and enter the desired collection period in the Collection Interval field, with the appropriate time unit (seconds, minutes, or hours).
3. AVAILABILITY
19
NOTE
Availability schedules can be set on compatible groups or resource typetemplates. Setting it at the group or resource type level changes multipleresources simultaneously.
6. Click Set.
3.9. Changing the Agent's Availability Scan Period
Since availability is processed on the server, large environments with hundreds of agents and tens ofthousands of resources can stress the server and hurt performance. In that case, the default scaninterval may be too short, and setting a longer scan interval may improve JBoss ON server performance.
NOTE
When changing core agent or server settings, especially ones that impact JBoss ONperformance, contact Red Hat Support Services for assistance.
1. Open the agent configuration file.
vim agentRoot/rhq-agent/conf/agent-configuration.xml
2. Uncomment the lines in the XML file, and set the new scan time (in seconds).
<entry key="rhq.agent.plugins.availability-scan.period-secs" value="60"/>
3. Restart the agent in the foreground of a terminal. Use the --cleanconfig option to force theagent to read the new configuration from the configuration file.
agentRoot/rhq-agent/bin/rhq-agent.sh --cleanconfig
4. METRICS AND MEASUREMENTS
Every operating system, application, and server has some mechanism for gaging its performance. Adatabase has page hits and misses, servers have open connection counts, platforms have memory andCPU usage. These performance measurements can be monitored by JBoss Operations Network asmetrics.
4.1. Direct Information about Resources
Metrics are a way of measuring a resource's performance or a way of measuring its load. The key wordis measurement. A metric is some data point which software exposes, which is relevant to the operationsor purpose of that software, that provides insight into the quantifiable behavior of that software.
Setting up Monitoring, Alerts, and Operations
20
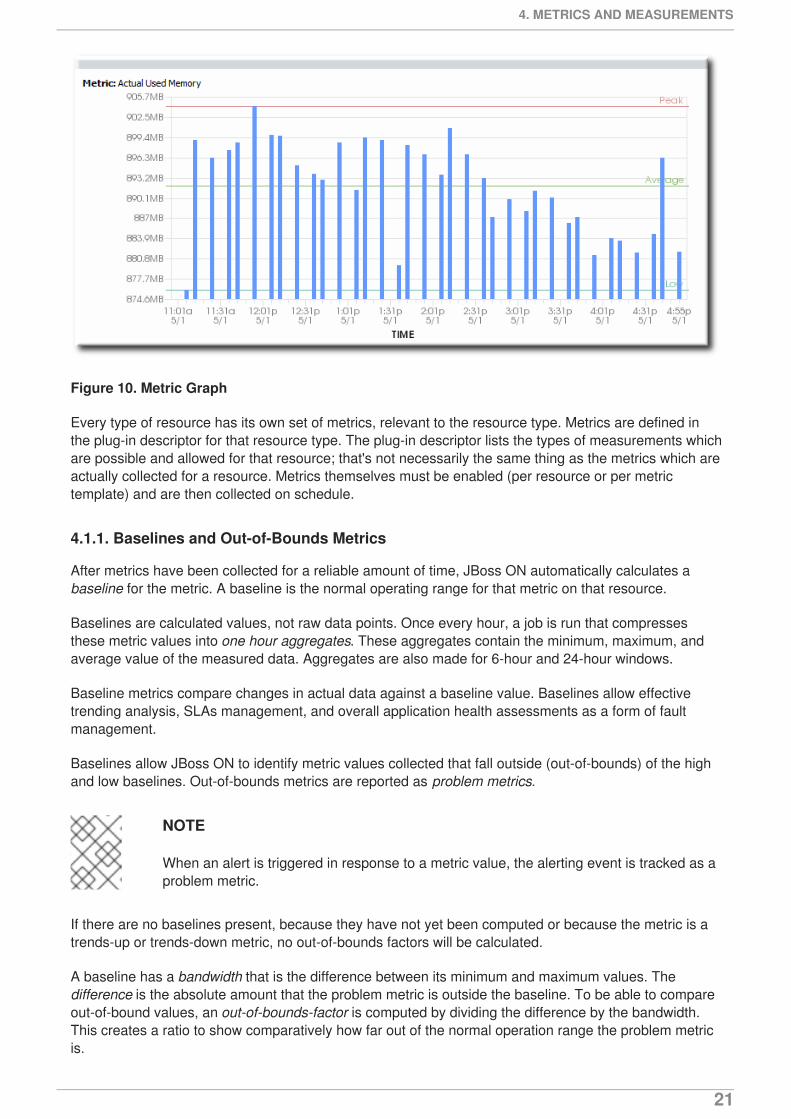
Figure 10. Metric Graph
Every type of resource has its own set of metrics, relevant to the resource type. Metrics are defined inthe plug-in descriptor for that resource type. The plug-in descriptor lists the types of measurements whichare possible and allowed for that resource; that's not necessarily the same thing as the metrics which areactually collected for a resource. Metrics themselves must be enabled (per resource or per metrictemplate) and are then collected on schedule.
4.1.1. Baselines and Out-of-Bounds Metrics
After metrics have been collected for a reliable amount of time, JBoss ON automatically calculates abaseline for the metric. A baseline is the normal operating range for that metric on that resource.
Baselines are calculated values, not raw data points. Once every hour, a job is run that compressesthese metric values into one hour aggregates. These aggregates contain the minimum, maximum, andaverage value of the measured data. Aggregates are also made for 6-hour and 24-hour windows.
Baseline metrics compare changes in actual data against a baseline value. Baselines allow effectivetrending analysis, SLAs management, and overall application health assessments as a form of faultmanagement.
Baselines allow JBoss ON to identify metric values collected that fall outside (out-of-bounds) of the highand low baselines. Out-of-bounds metrics are reported as problem metrics.
NOTE
When an alert is triggered in response to a metric value, the alerting event is tracked as aproblem metric.
If there are no baselines present, because they have not yet been computed or because the metric is atrends-up or trends-down metric, no out-of-bounds factors will be calculated.
A baseline has a bandwidth that is the difference between its minimum and maximum values. Thedifference is the absolute amount that the problem metric is outside the baseline. To be able to compareout-of-bound values, an out-of-bounds-factor is computed by dividing the difference by the bandwidth.This creates a ratio to show comparatively how far out of the normal operation range the problem metricis.
4. METRICS AND MEASUREMENTS
21
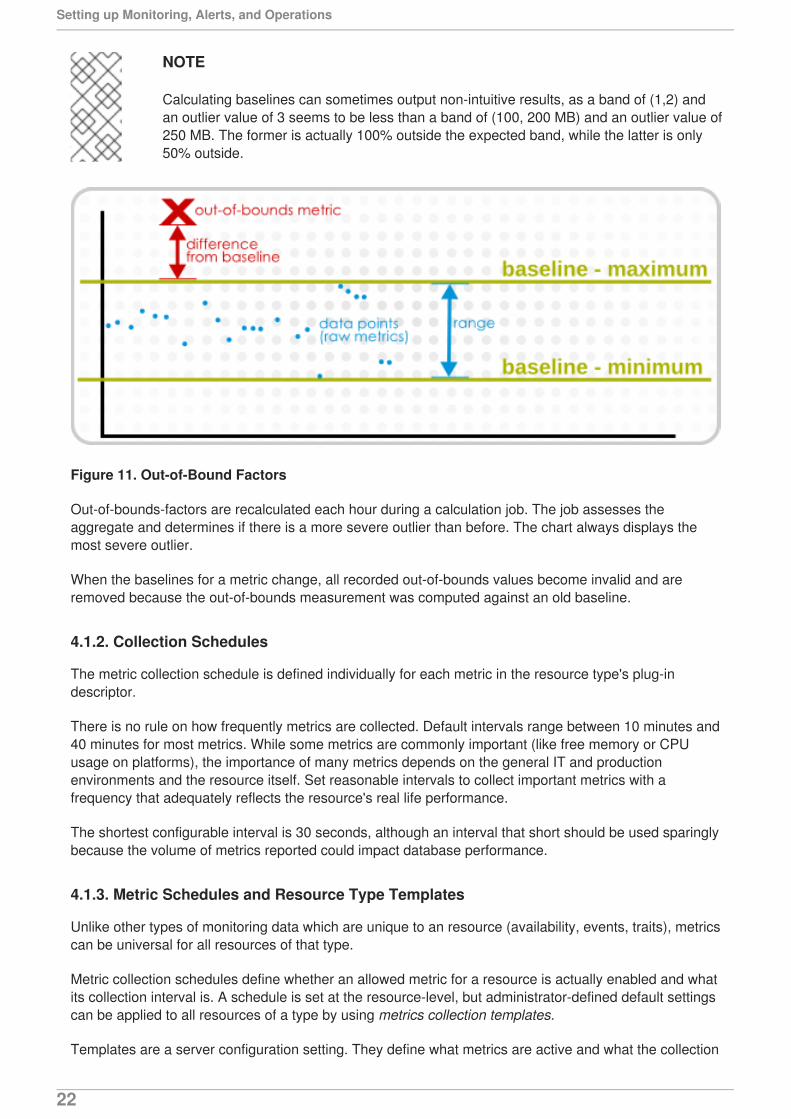
NOTE
Calculating baselines can sometimes output non-intuitive results, as a band of (1,2) andan outlier value of 3 seems to be less than a band of (100, 200 MB) and an outlier value of250 MB. The former is actually 100% outside the expected band, while the latter is only50% outside.
Figure 11. Out-of-Bound Factors
Out-of-bounds-factors are recalculated each hour during a calculation job. The job assesses theaggregate and determines if there is a more severe outlier than before. The chart always displays themost severe outlier.
When the baselines for a metric change, all recorded out-of-bounds values become invalid and areremoved because the out-of-bounds measurement was computed against an old baseline.
4.1.2. Collection Schedules
The metric collection schedule is defined individually for each metric in the resource type's plug-indescriptor.
There is no rule on how frequently metrics are collected. Default intervals range between 10 minutes and40 minutes for most metrics. While some metrics are commonly important (like free memory or CPUusage on platforms), the importance of many metrics depends on the general IT and productionenvironments and the resource itself. Set reasonable intervals to collect important metrics with afrequency that adequately reflects the resource's real life performance.
The shortest configurable interval is 30 seconds, although an interval that short should be used sparinglybecause the volume of metrics reported could impact database performance.
4.1.3. Metric Schedules and Resource Type Templates
Unlike other types of monitoring data which are unique to an resource (availability, events, traits), metricscan be universal for all resources of that type.
Metric collection schedules define whether an allowed metric for a resource is actually enabled and whatits collection interval is. A schedule is set at the resource-level, but administrator-defined default settingscan be applied to all resources of a type by using metrics collection templates.
Templates are a server configuration setting. They define what metrics are active and what the collection
Setting up Monitoring, Alerts, and Operations
22
schedules are for all resources of a specific type. When templates are used, they supplant whateverdefault metrics settings are given in the plug-in descriptor. (A metric template only defines whether ametric is enabled and what its interval is — the plug-in descriptor alone defines what metrics are availablefor a resource type.)
These settings can be overridden at the resource-level, as necessary. Still, metrics collection templatesprovide a simple way to apply metrics settings consistently across resources and machines.
4.1.4. Raw Metrics, Displayed Metrics, and Storing Data
The live reading of metric information is raw data. This raw data is stored in the backend server, but it isnot the information that is displayed in the web UI.
The information displayed in the web UI is aggregated data. The web UI has a limited display space,segmented into 60 x-axis segments. The JBoss ON server averages the raw data to create the datapoints for whatever the display time period is. For example, if the display range is 60 hours, each x-axissegment is 1-hour wide, and that data point is an average of all readings collected in that 1-hoursegment. This aggregation is dynamic, depending on the monitoring window given in the chart views.
As Section 4.1.1, “Baselines and Out-of-Bounds Metrics” describes, the baseline calculations themselvesare aggregates of the raw data, with 1-hour, 6-hour, and 24-hour windows to set minimum, maximum,and average baselines. Unlike the UI aggregates, these aggregated data are calculated and then storedas monitoring data in the server database.
Raw data are only stored for one week, by default, while aggregated values are stored for up to a year.The data storage times are configurable.
4.2. Viewing Metrics and Baseline Charts
The core of monitoring is the metric information that is collected for a resource. Each resource hasdifferent metrics (and these are listed in the Resource Reference: Monitoring, Operation, andConfiguration Options). Three monitoring charts show the same information, but in different perspectivesand different levels of detail:
The resource-level Summary
Graphs
Tables
The Summary tab for resources, much like the Dashboard for the entire JBoss ON inventory, hasportlets that show different resource information. Most resources have three portlets for measurements,events, and out-of-bound metrics. The Measurements portlet has small thumbnail charts that show thetrend for the metric, along with the current reading.
4. METRICS AND MEASUREMENTS
23
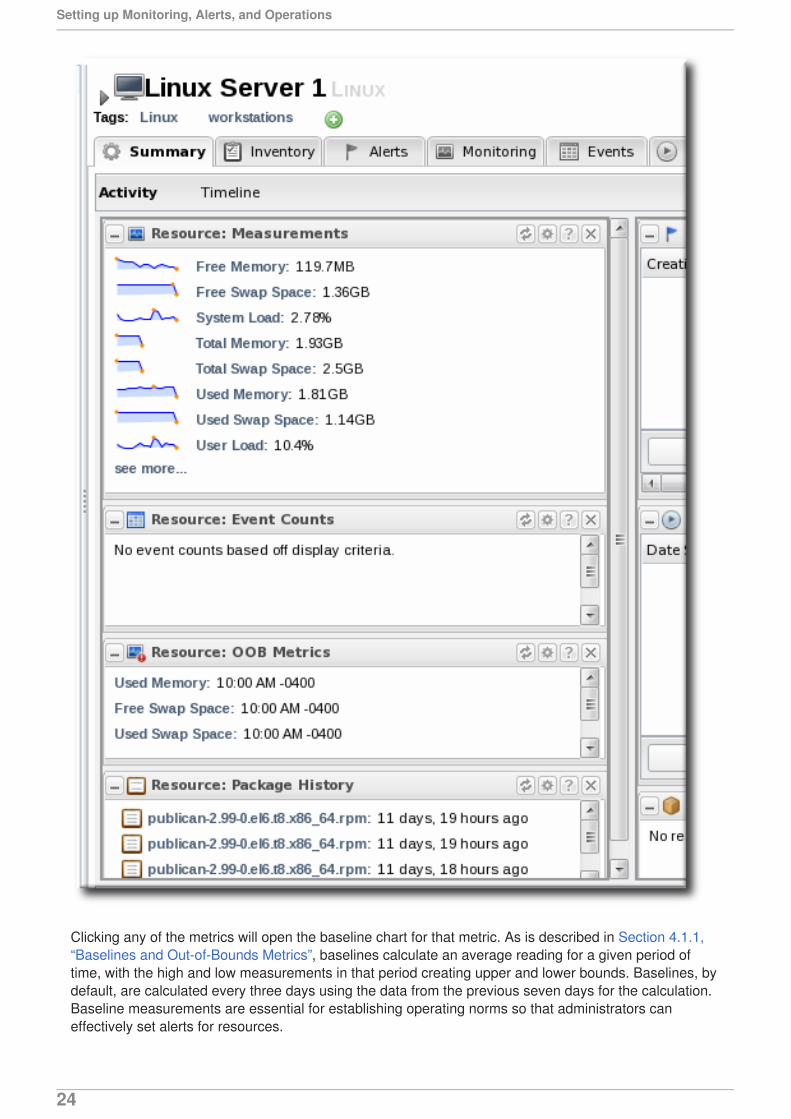
Clicking any of the metrics will open the baseline chart for that metric. As is described in Section 4.1.1,“Baselines and Out-of-Bounds Metrics”, baselines calculate an average reading for a given period oftime, with the high and low measurements in that period creating upper and lower bounds. Baselines, bydefault, are calculated every three days using the data from the previous seven days for the calculation.Baseline measurements are essential for establishing operating norms so that administrators caneffectively set alerts for resources.
Setting up Monitoring, Alerts, and Operations
24
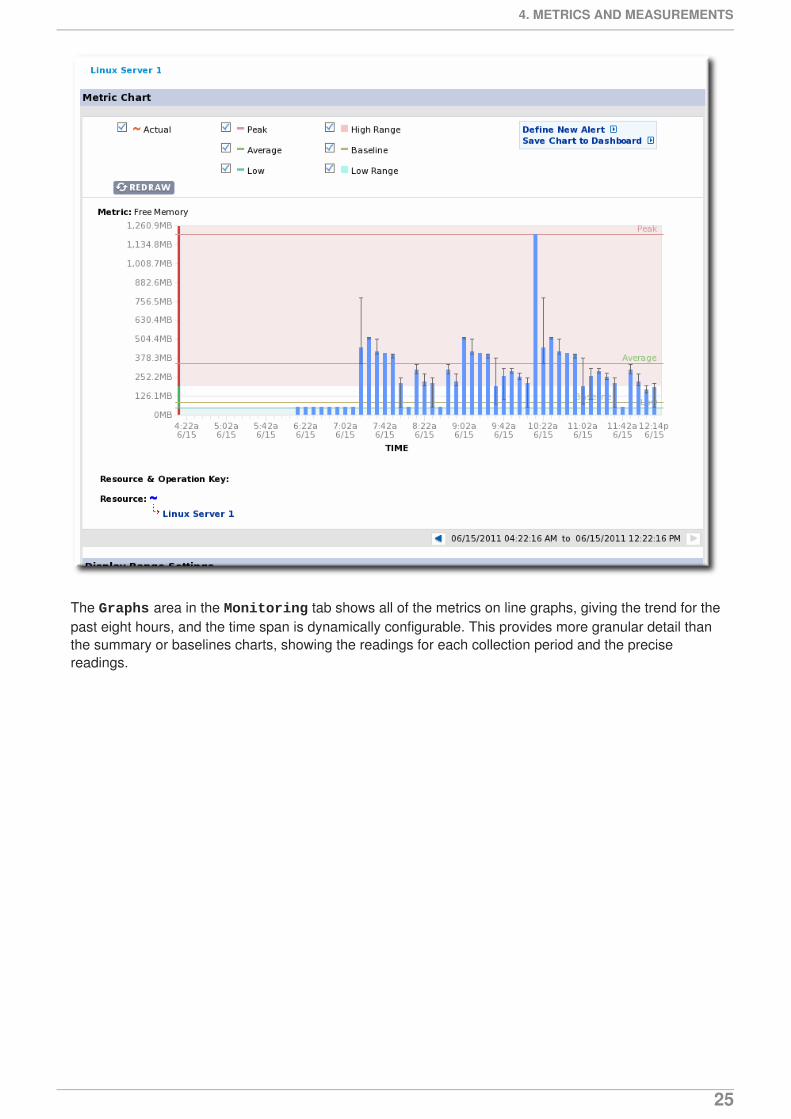
The Graphs area in the Monitoring tab shows all of the metrics on line graphs, giving the trend for thepast eight hours, and the time span is dynamically configurable. This provides more granular detail thanthe summary or baselines charts, showing the readings for each collection period and the precisereadings.
4. METRICS AND MEASUREMENTS
25
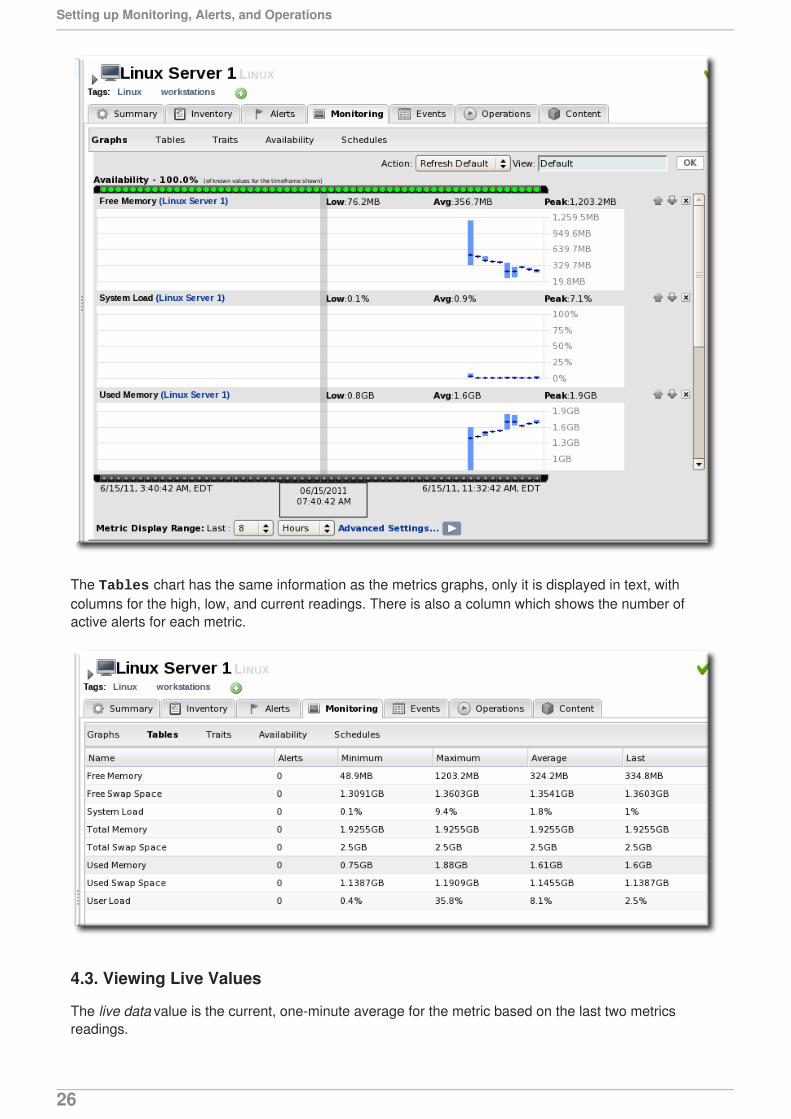
The Tables chart has the same information as the metrics graphs, only it is displayed in text, withcolumns for the high, low, and current readings. There is also a column which shows the number ofactive alerts for each metric.
4.3. Viewing Live Values
The live data value is the current, one-minute average for the metric based on the last two metricsreadings.
Setting up Monitoring, Alerts, and Operations
26
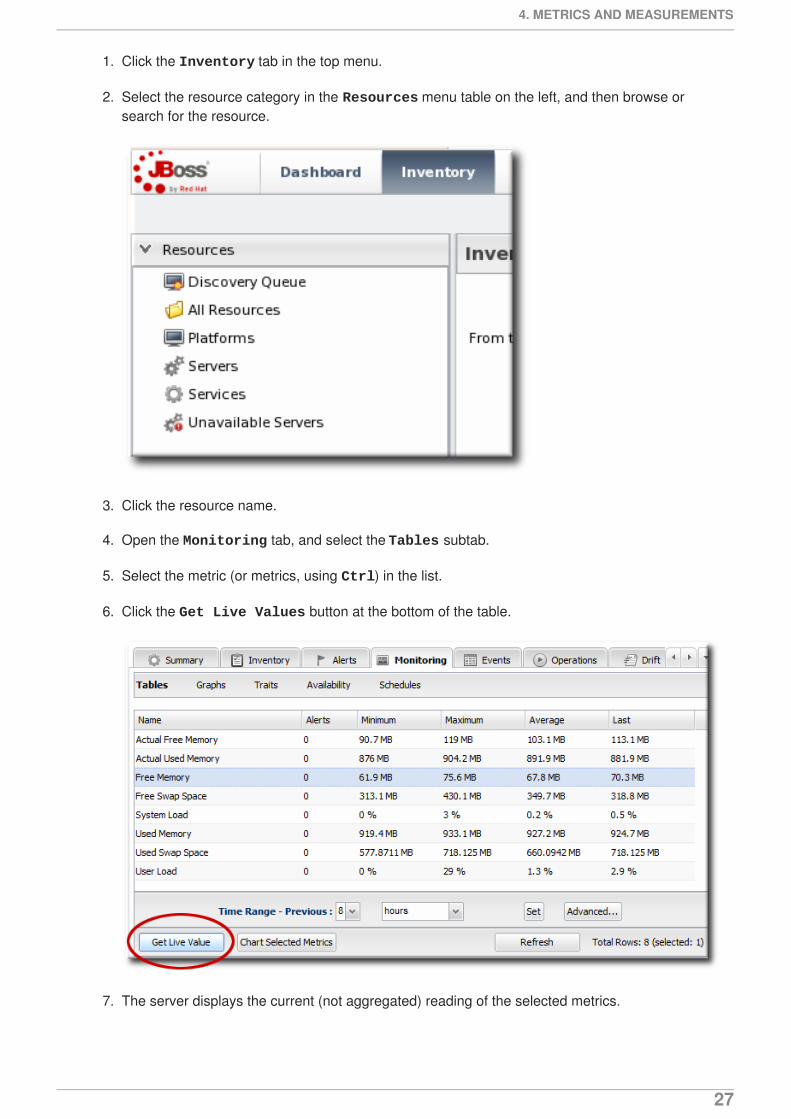
1. Click the Inventory tab in the top menu.
2. Select the resource category in the Resources menu table on the left, and then browse orsearch for the resource.
3. Click the resource name.
4. Open the Monitoring tab, and select the Tables subtab.
5. Select the metric (or metrics, using Ctrl) in the list.
6. Click the Get Live Values button at the bottom of the table.
7. The server displays the current (not aggregated) reading of the selected metrics.
4. METRICS AND MEASUREMENTS
27
4.4. Defining Baselines
4.4.1. Setting Baseline Calculation Properties
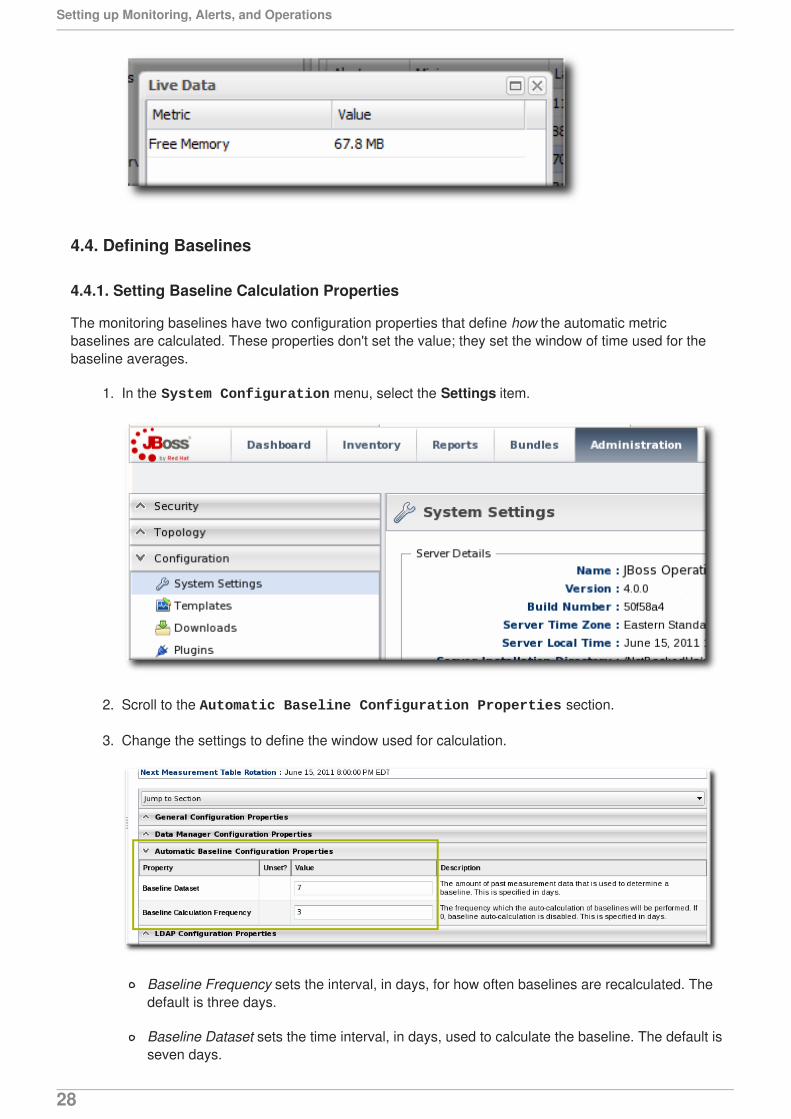
The monitoring baselines have two configuration properties that define how the automatic metricbaselines are calculated. These properties don't set the value; they set the window of time used for thebaseline averages.
1. In the System Configuration menu, select the Settings item.
2. Scroll to the Automatic Baseline Configuration Properties section.
3. Change the settings to define the window used for calculation.
Baseline Frequency sets the interval, in days, for how often baselines are recalculated. Thedefault is three days.
Baseline Dataset sets the time interval, in days, used to calculate the baseline. The default isseven days.
Setting up Monitoring, Alerts, and Operations
28
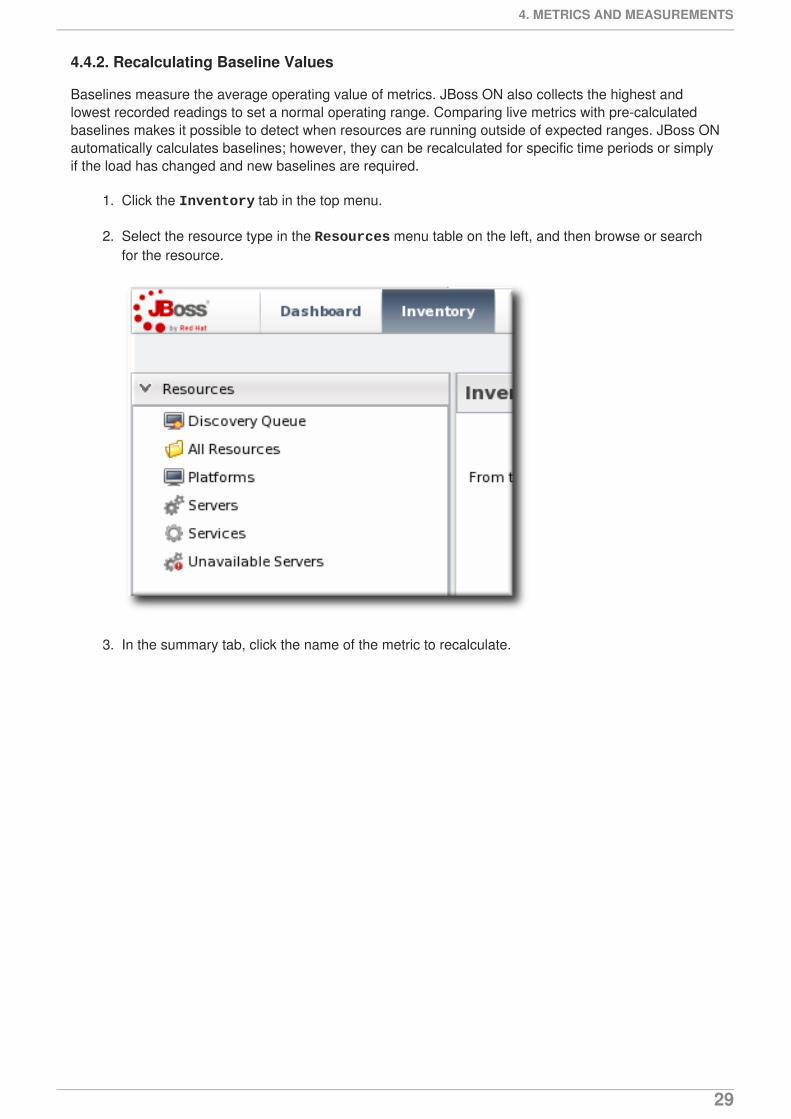
4.4.2. Recalculating Baseline Values
Baselines measure the average operating value of metrics. JBoss ON also collects the highest andlowest recorded readings to set a normal operating range. Comparing live metrics with pre-calculatedbaselines makes it possible to detect when resources are running outside of expected ranges. JBoss ONautomatically calculates baselines; however, they can be recalculated for specific time periods or simplyif the load has changed and new baselines are required.
1. Click the Inventory tab in the top menu.
2. Select the resource type in the Resources menu table on the left, and then browse or searchfor the resource.
3. In the summary tab, click the name of the metric to recalculate.
4. METRICS AND MEASUREMENTS
29
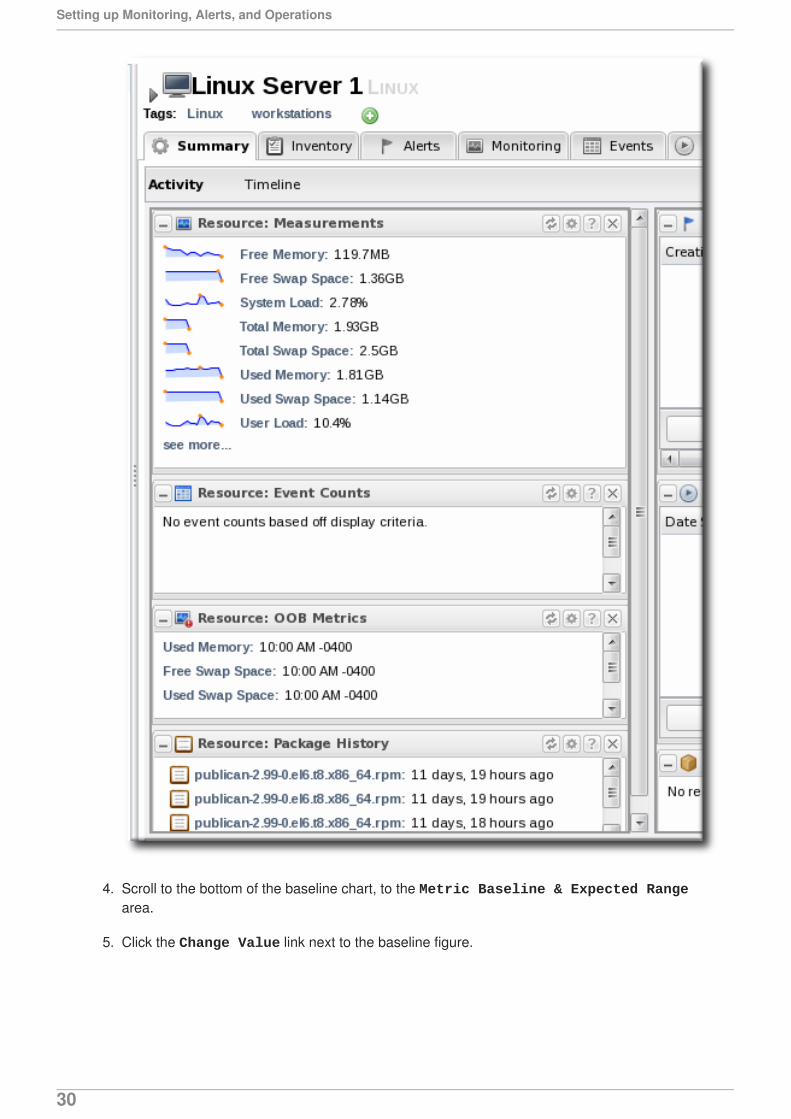
4. Scroll to the bottom of the baseline chart, to the Metric Baseline & Expected Rangearea.
5. Click the Change Value link next to the baseline figure.
Setting up Monitoring, Alerts, and Operations
30
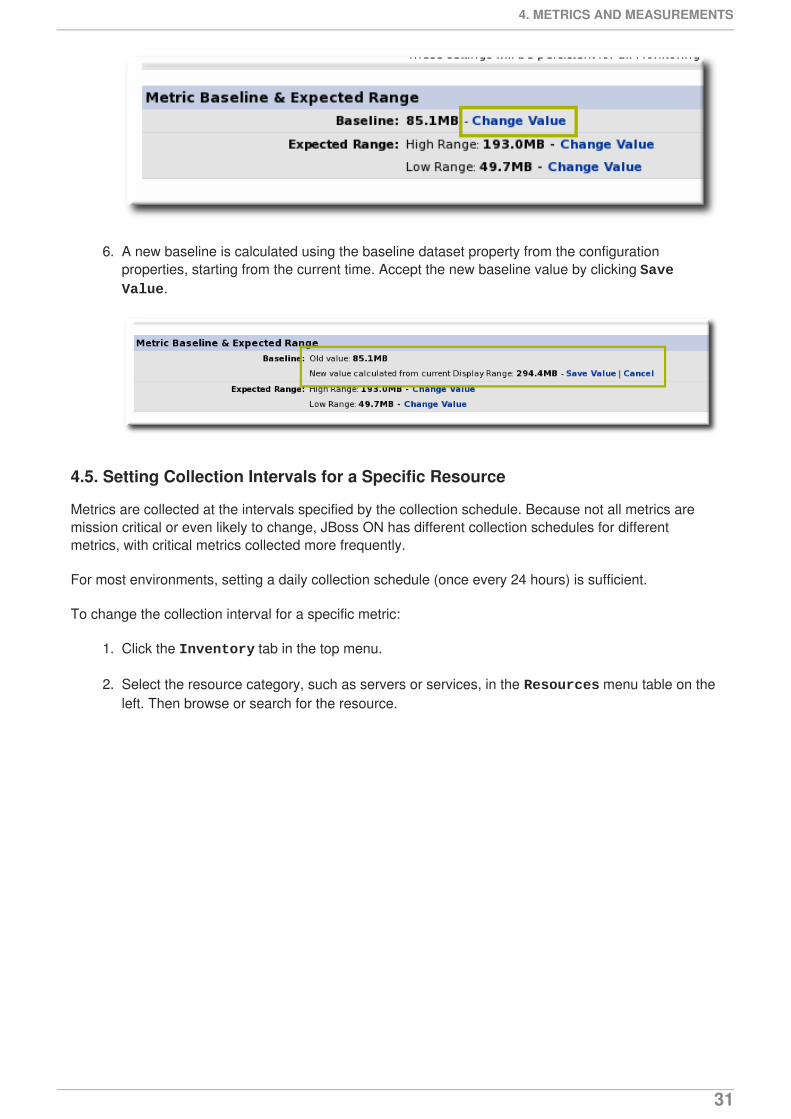
6. A new baseline is calculated using the baseline dataset property from the configurationproperties, starting from the current time. Accept the new baseline value by clicking Save Value.
4.5. Setting Collection Intervals for a Specific Resource
Metrics are collected at the intervals specified by the collection schedule. Because not all metrics aremission critical or even likely to change, JBoss ON has different collection schedules for differentmetrics, with critical metrics collected more frequently.
For most environments, setting a daily collection schedule (once every 24 hours) is sufficient.
To change the collection interval for a specific metric:
1. Click the Inventory tab in the top menu.
2. Select the resource category, such as servers or services, in the Resources menu table on theleft. Then browse or search for the resource.
4. METRICS AND MEASUREMENTS
31
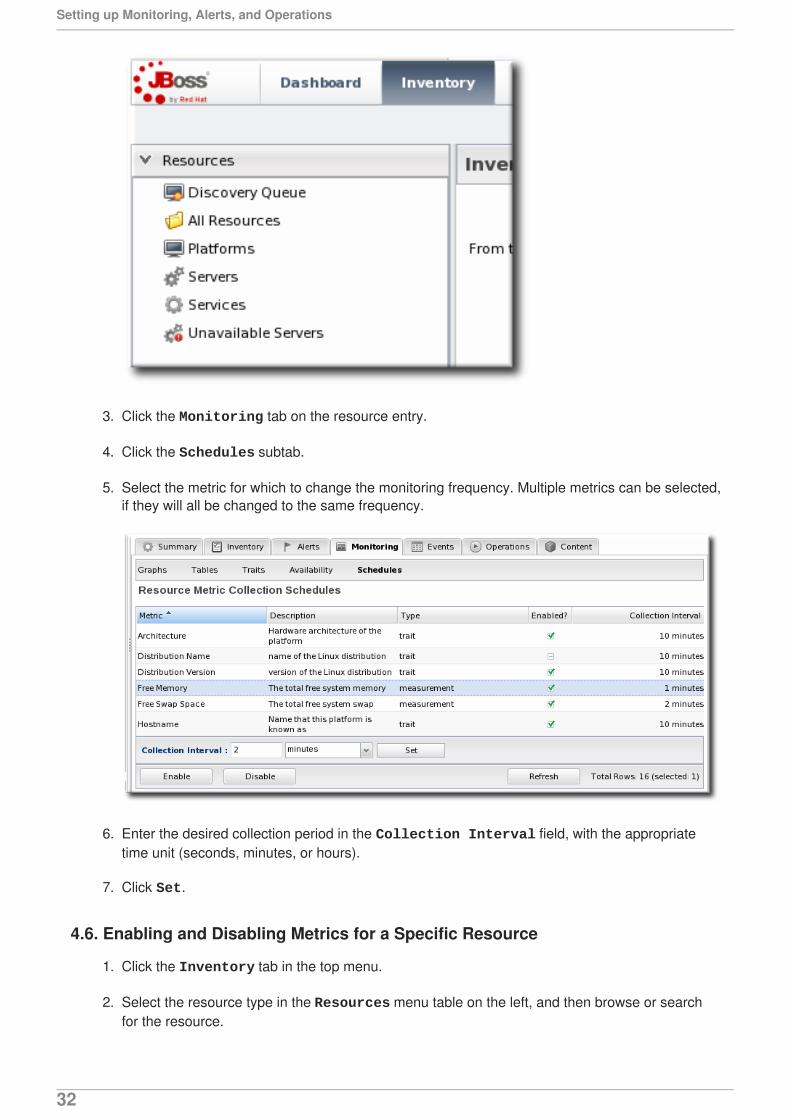
3. Click the Monitoring tab on the resource entry.
4. Click the Schedules subtab.
5. Select the metric for which to change the monitoring frequency. Multiple metrics can be selected,if they will all be changed to the same frequency.
6. Enter the desired collection period in the Collection Interval field, with the appropriatetime unit (seconds, minutes, or hours).
7. Click Set.
4.6. Enabling and Disabling Metrics for a Specific Resource
1. Click the Inventory tab in the top menu.
2. Select the resource type in the Resources menu table on the left, and then browse or searchfor the resource.
Setting up Monitoring, Alerts, and Operations
32
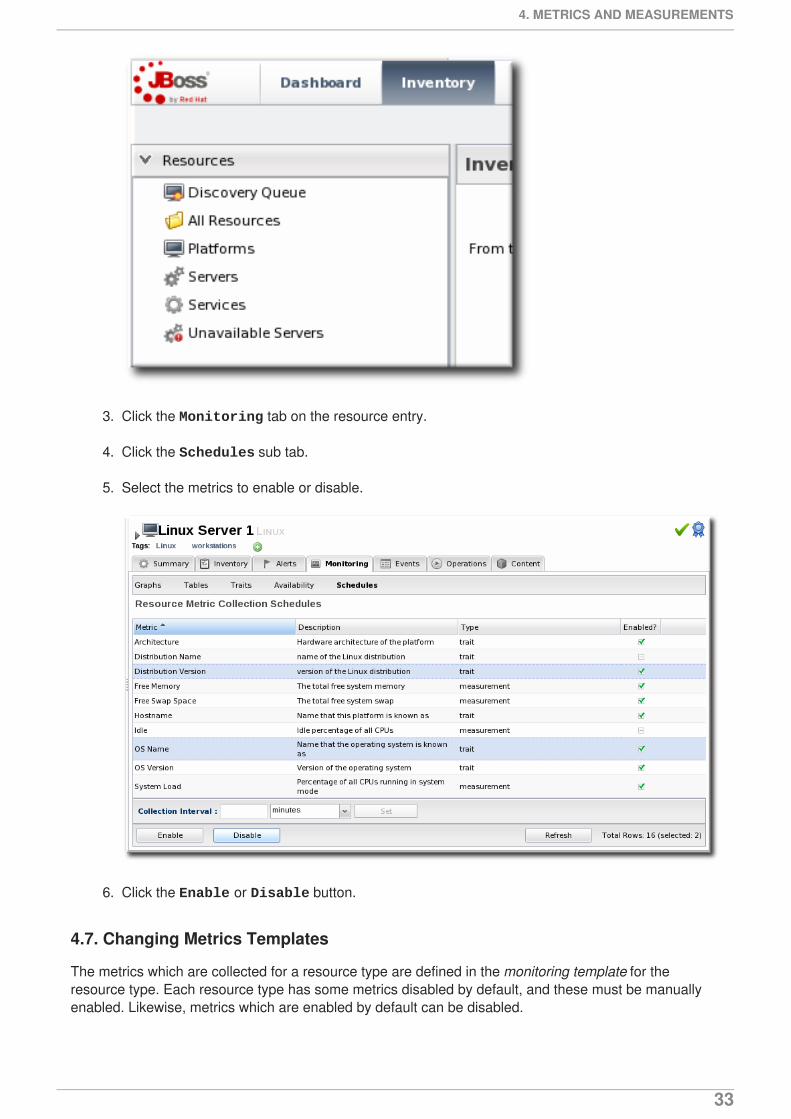
3. Click the Monitoring tab on the resource entry.
4. Click the Schedules sub tab.
5. Select the metrics to enable or disable.
6. Click the Enable or Disable button.
4.7. Changing Metrics Templates
The metrics which are collected for a resource type are defined in the monitoring template for theresource type. Each resource type has some metrics disabled by default, and these must be manuallyenabled. Likewise, metrics which are enabled by default can be disabled.
4. METRICS AND MEASUREMENTS
33
NOTE
Metric templates only apply to new resources of that resource type unless the checkbox isselected to apply them to existing resources as well as new resources.
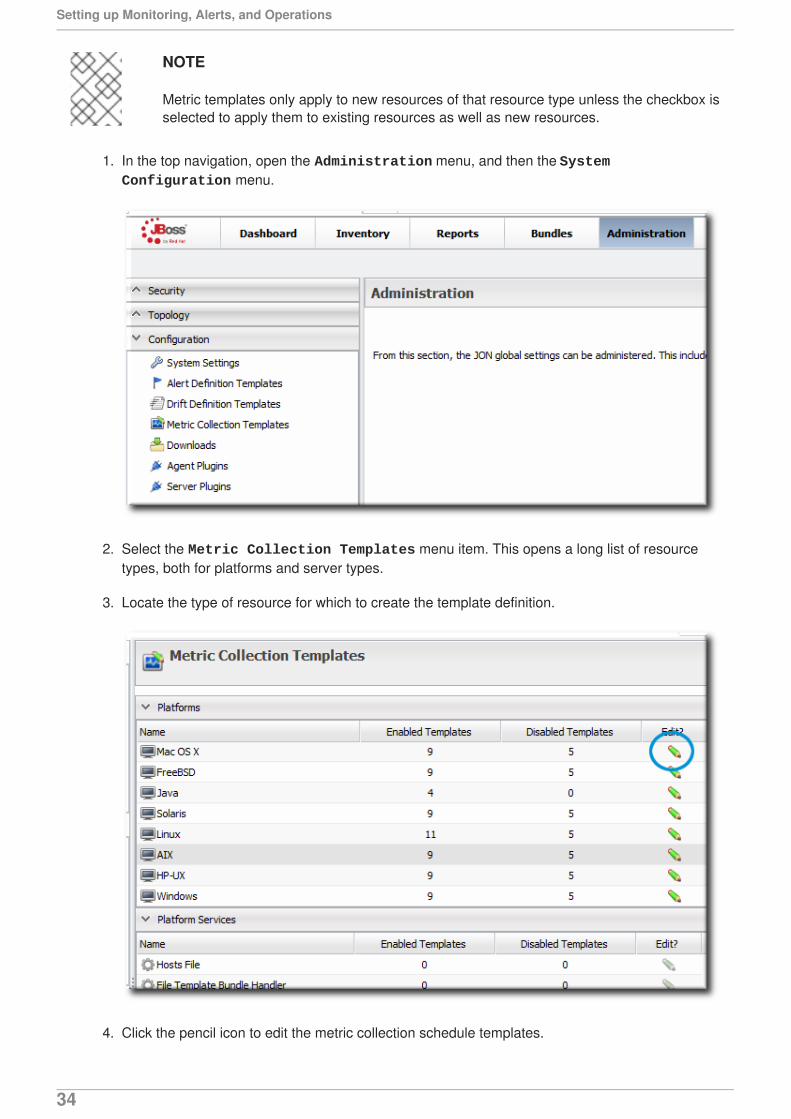
1. In the top navigation, open the Administration menu, and then the System Configuration menu.
2. Select the Metric Collection Templates menu item. This opens a long list of resourcetypes, both for platforms and server types.
3. Locate the type of resource for which to create the template definition.
4. Click the pencil icon to edit the metric collection schedule templates.
Setting up Monitoring, Alerts, and Operations
34
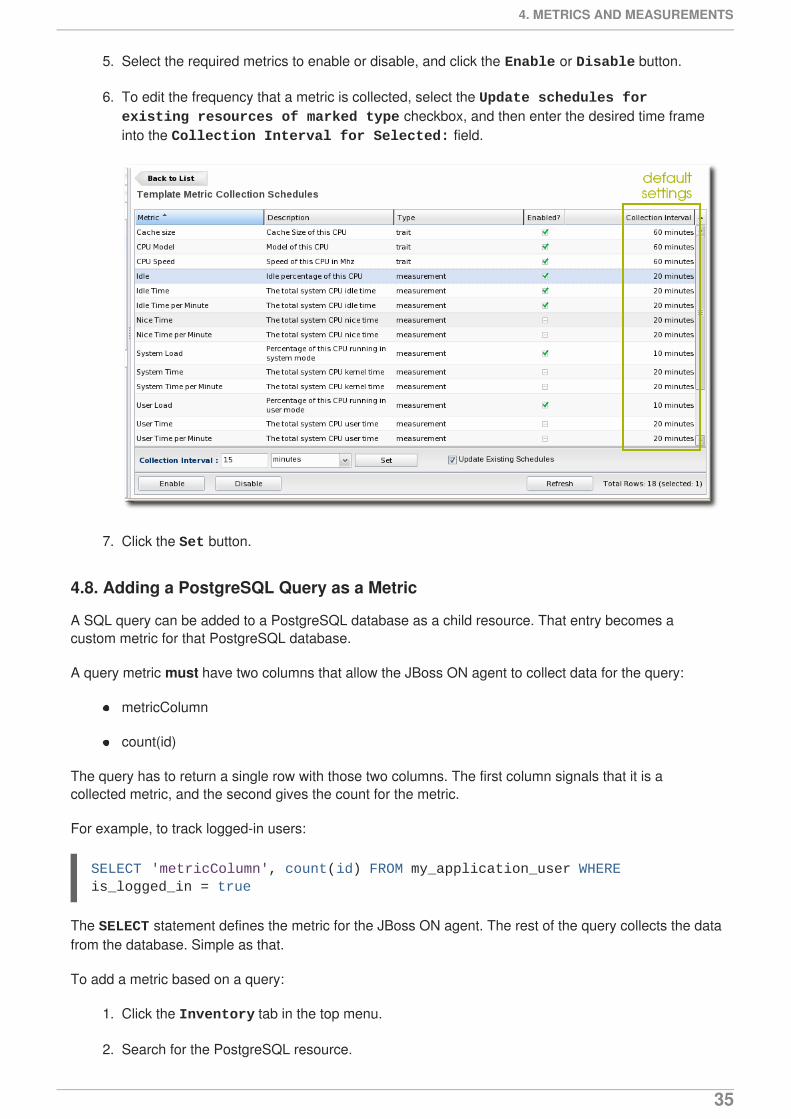
5. Select the required metrics to enable or disable, and click the Enable or Disable button.
6. To edit the frequency that a metric is collected, select the Update schedules for existing resources of marked type checkbox, and then enter the desired time frameinto the Collection Interval for Selected: field.
7. Click the Set button.
4.8. Adding a PostgreSQL Query as a Metric
A SQL query can be added to a PostgreSQL database as a child resource. That entry becomes acustom metric for that PostgreSQL database.
A query metric must have two columns that allow the JBoss ON agent to collect data for the query:
metricColumn
count(id)
The query has to return a single row with those two columns. The first column signals that it is acollected metric, and the second gives the count for the metric.
For example, to track logged-in users:
The SELECT statement defines the metric for the JBoss ON agent. The rest of the query collects the datafrom the database. Simple as that.
To add a metric based on a query:
1. Click the Inventory tab in the top menu.
2. Search for the PostgreSQL resource.
SELECT 'metricColumn', count(id) FROM my_application_user WHERE is_logged_in = true
4. METRICS AND MEASUREMENTS
35
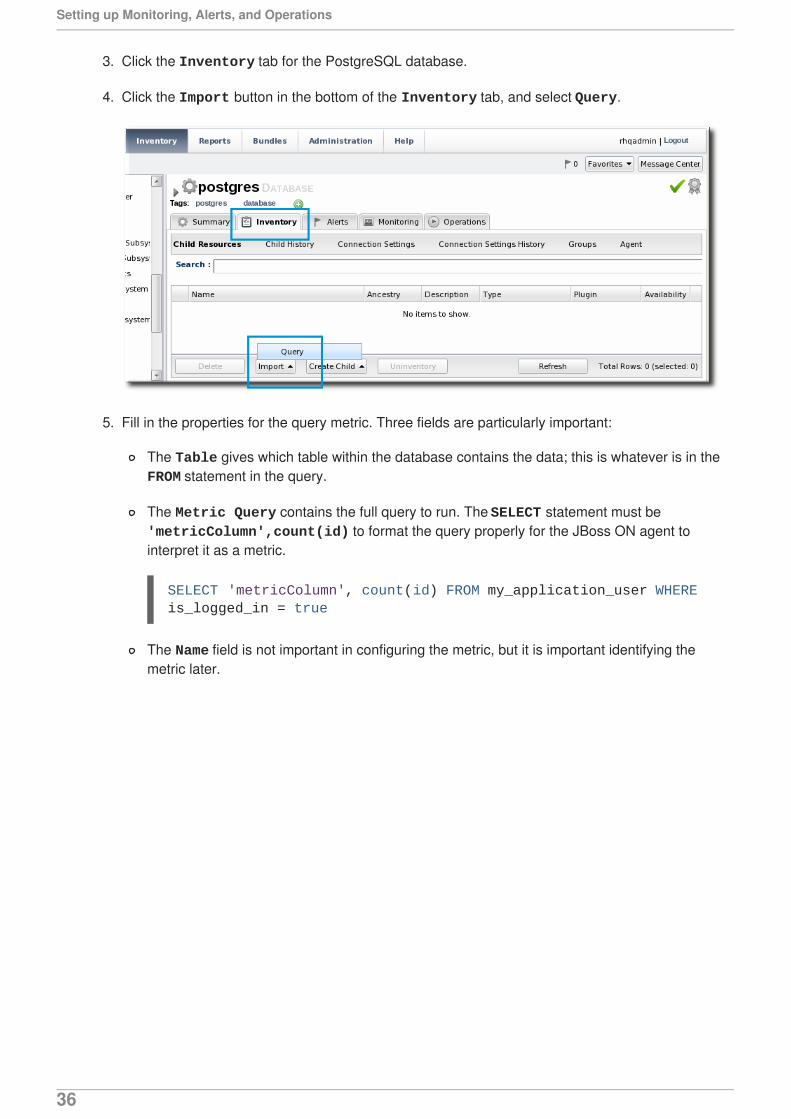
3. Click the Inventory tab for the PostgreSQL database.
4. Click the Import button in the bottom of the Inventory tab, and select Query.
5. Fill in the properties for the query metric. Three fields are particularly important:
The Table gives which table within the database contains the data; this is whatever is in theFROM statement in the query.
The Metric Query contains the full query to run. The SELECT statement must be 'metricColumn',count(id) to format the query properly for the JBoss ON agent tointerpret it as a metric.
The Name field is not important in configuring the metric, but it is important identifying themetric later.
SELECT 'metricColumn', count(id) FROM my_application_user WHERE is_logged_in = true
Setting up Monitoring, Alerts, and Operations
36
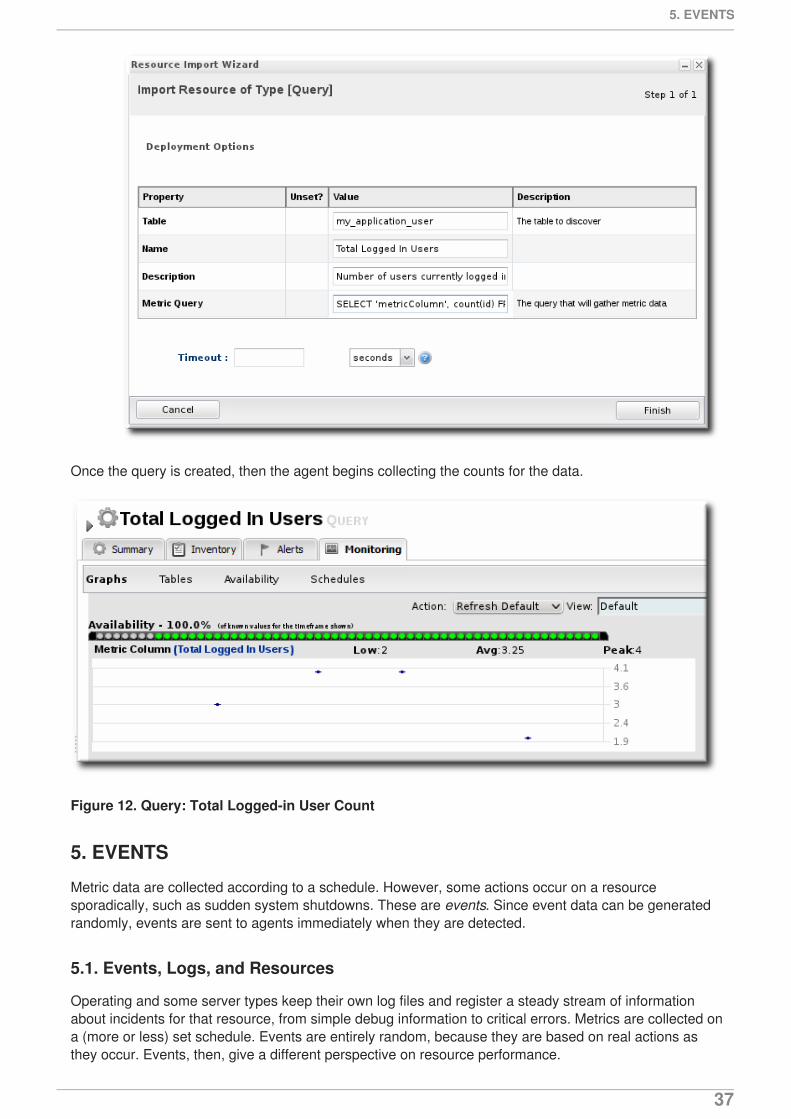
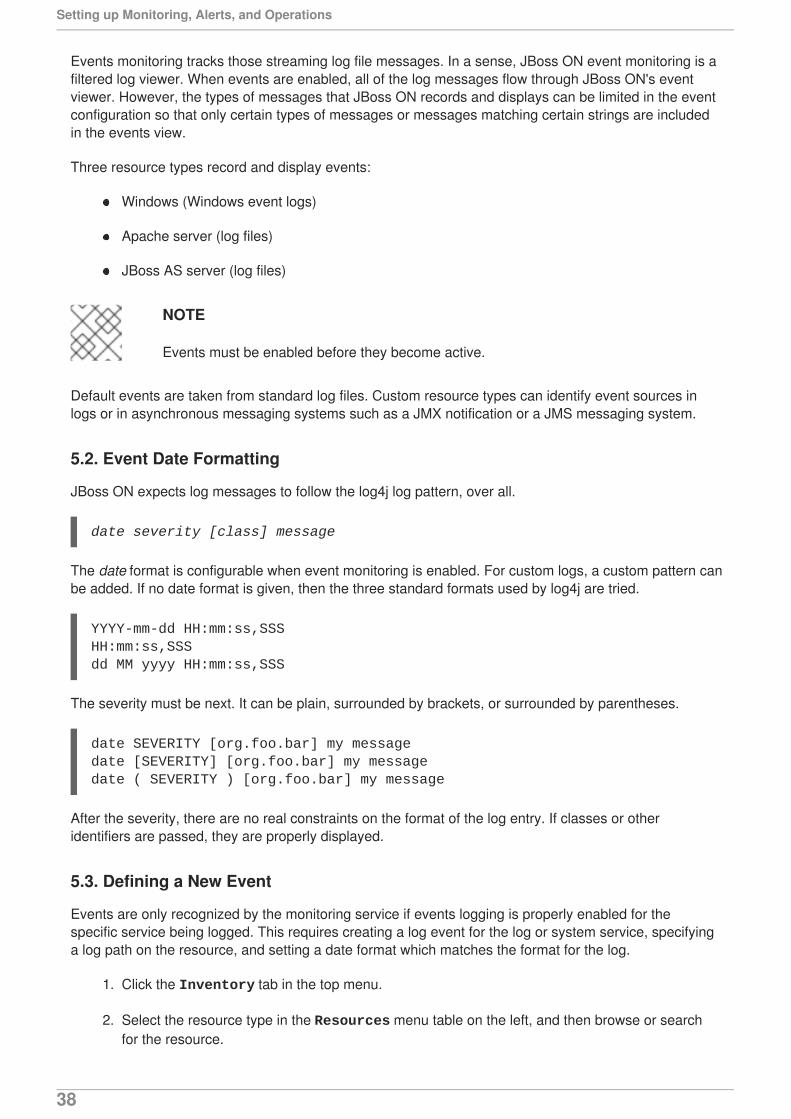
Once the query is created, then the agent begins collecting the counts for the data.
Figure 12. Query: Total Logged-in User Count
5. EVENTS
Metric data are collected according to a schedule. However, some actions occur on a resourcesporadically, such as sudden system shutdowns. These are events. Since event data can be generatedrandomly, events are sent to agents immediately when they are detected.
5.1. Events, Logs, and Resources
Operating and some server types keep their own log files and register a steady stream of informationabout incidents for that resource, from simple debug information to critical errors. Metrics are collected ona (more or less) set schedule. Events are entirely random, because they are based on real actions asthey occur. Events, then, give a different perspective on resource performance.
5. EVENTS
37
Events monitoring tracks those streaming log file messages. In a sense, JBoss ON event monitoring is afiltered log viewer. When events are enabled, all of the log messages flow through JBoss ON's eventviewer. However, the types of messages that JBoss ON records and displays can be limited in the eventconfiguration so that only certain types of messages or messages matching certain strings are includedin the events view.
Three resource types record and display events:
Windows (Windows event logs)
Apache server (log files)
JBoss AS server (log files)
NOTE
Events must be enabled before they become active.
Default events are taken from standard log files. Custom resource types can identify event sources inlogs or in asynchronous messaging systems such as a JMX notification or a JMS messaging system.
5.2. Event Date Formatting
JBoss ON expects log messages to follow the log4j log pattern, over all.
date severity [class] message
The date format is configurable when event monitoring is enabled. For custom logs, a custom pattern canbe added. If no date format is given, then the three standard formats used by log4j are tried.
YYYY-mm-dd HH:mm:ss,SSSHH:mm:ss,SSSdd MM yyyy HH:mm:ss,SSS
The severity must be next. It can be plain, surrounded by brackets, or surrounded by parentheses.
date SEVERITY [org.foo.bar] my messagedate [SEVERITY] [org.foo.bar] my messagedate ( SEVERITY ) [org.foo.bar] my message
After the severity, there are no real constraints on the format of the log entry. If classes or otheridentifiers are passed, they are properly displayed.
5.3. Defining a New Event
Events are only recognized by the monitoring service if events logging is properly enabled for thespecific service being logged. This requires creating a log event for the log or system service, specifyinga log path on the resource, and setting a date format which matches the format for the log.
1. Click the Inventory tab in the top menu.
2. Select the resource type in the Resources menu table on the left, and then browse or searchfor the resource.
Setting up Monitoring, Alerts, and Operations
38
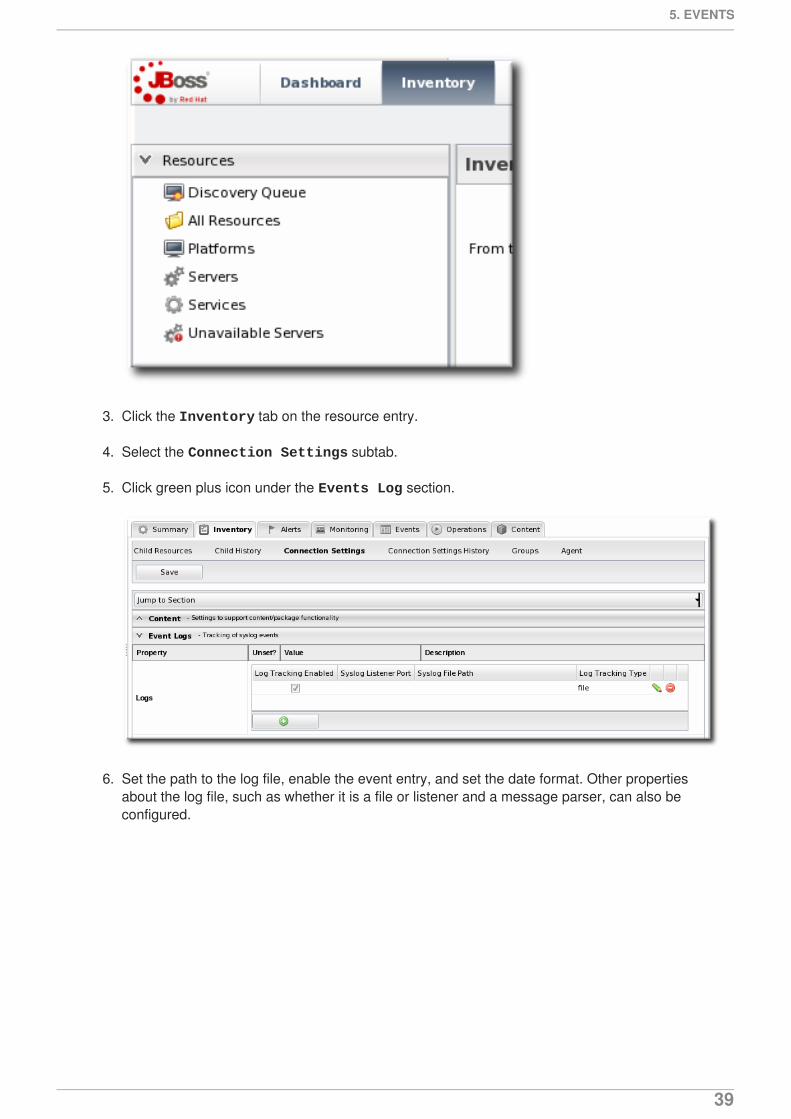
3. Click the Inventory tab on the resource entry.
4. Select the Connection Settings subtab.
5. Click green plus icon under the Events Log section.
6. Set the path to the log file, enable the event entry, and set the date format. Other propertiesabout the log file, such as whether it is a file or listener and a message parser, can also beconfigured.
5. EVENTS
39
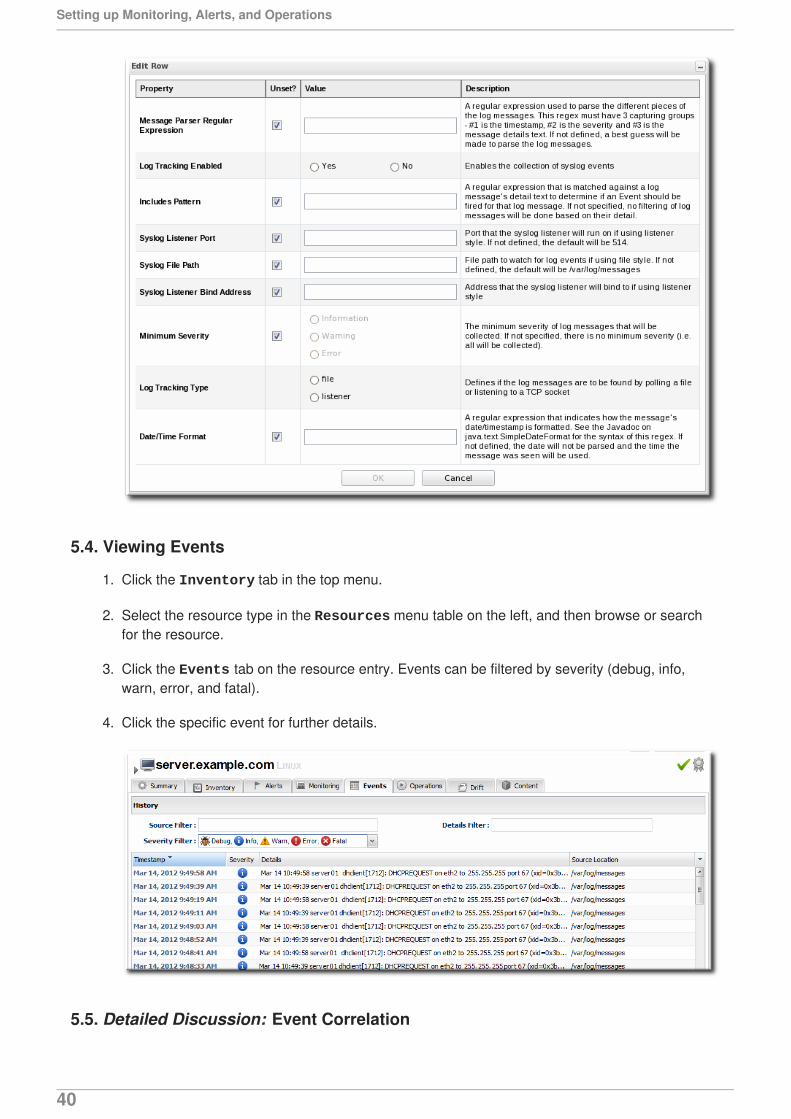
5.4. Viewing Events
1. Click the Inventory tab in the top menu.
2. Select the resource type in the Resources menu table on the left, and then browse or searchfor the resource.
3. Click the Events tab on the resource entry. Events can be filtered by severity (debug, info,warn, error, and fatal).
4. Click the specific event for further details.
5.5. Detailed Discussion: Event Correlation
Setting up Monitoring, Alerts, and Operations
40
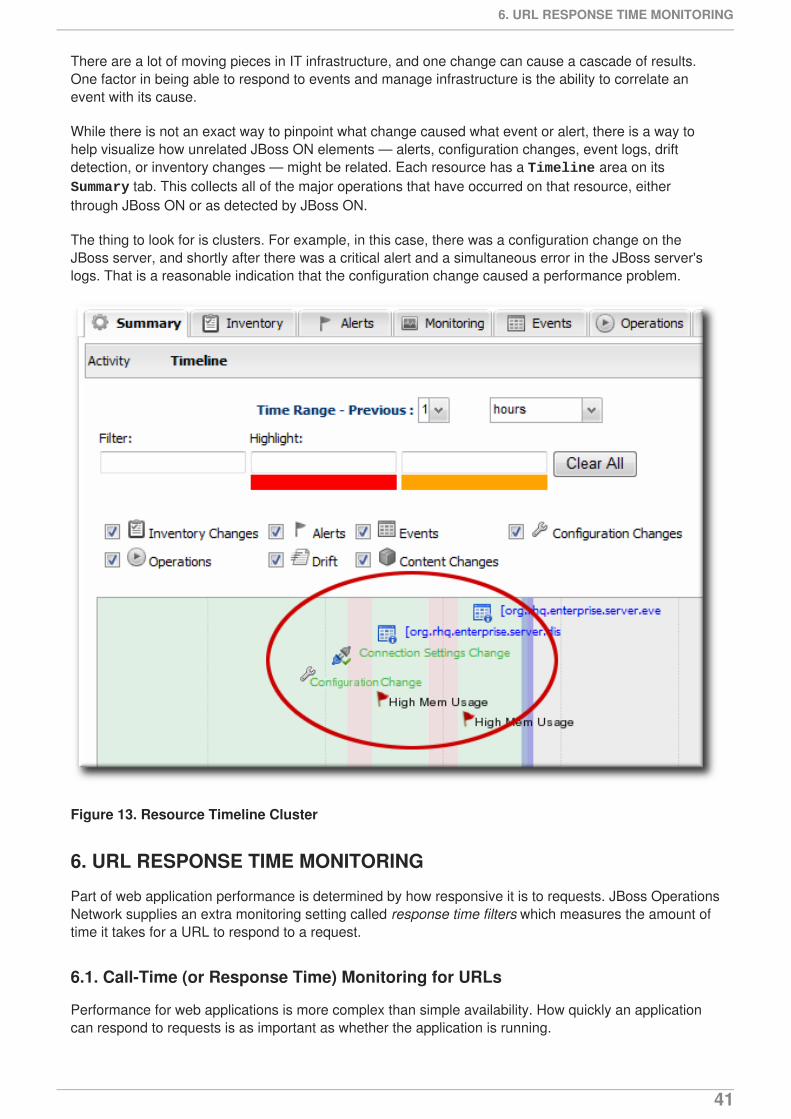
There are a lot of moving pieces in IT infrastructure, and one change can cause a cascade of results.One factor in being able to respond to events and manage infrastructure is the ability to correlate anevent with its cause.
While there is not an exact way to pinpoint what change caused what event or alert, there is a way tohelp visualize how unrelated JBoss ON elements — alerts, configuration changes, event logs, driftdetection, or inventory changes — might be related. Each resource has a Timeline area on its Summary tab. This collects all of the major operations that have occurred on that resource, eitherthrough JBoss ON or as detected by JBoss ON.
The thing to look for is clusters. For example, in this case, there was a configuration change on theJBoss server, and shortly after there was a critical alert and a simultaneous error in the JBoss server'slogs. That is a reasonable indication that the configuration change caused a performance problem.
Figure 13. Resource Timeline Cluster
6. URL RESPONSE TIME MONITORING
Part of web application performance is determined by how responsive it is to requests. JBoss OperationsNetwork supplies an extra monitoring setting called response time filters which measures the amount oftime it takes for a URL to respond to a request.
6.1. Call-Time (or Response Time) Monitoring for URLs
Performance for web applications is more complex than simple availability. How quickly an applicationcan respond to requests is as important as whether the application is running.
6. URL RESPONSE TIME MONITORING
41
The time that it takes an application to respond to some kind of request is call-time or response timedata.
Two types of resources support call-time data by default:
Session beans, for EJB method calls.
Web servers (standalone or embedded in an application server), for URL responses. Webservers require an additional response time filter with configuration on what URL resources tomeasure for response times.
Response time monitoring is more based upon performance than it is on capturing a single data point.Response or call-time data are displayed as aggregates, showing maximum, minimum, and averageresponse times per URL or per method.
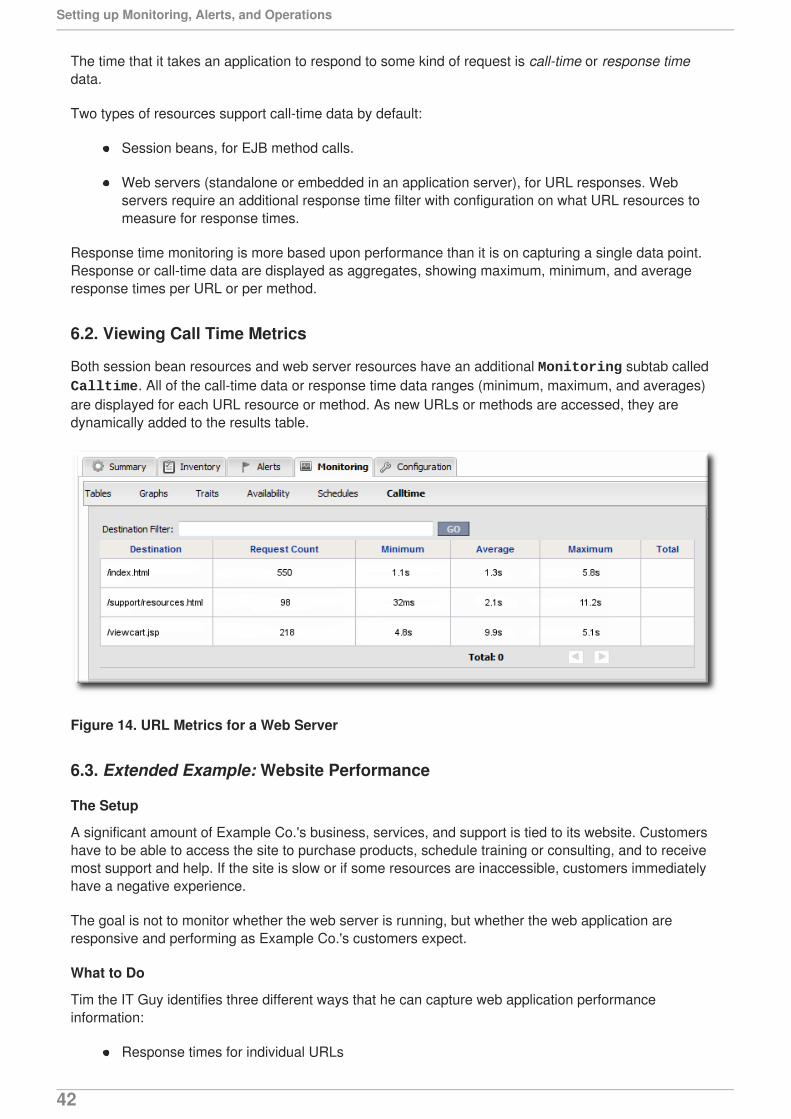
6.2. Viewing Call Time Metrics
Both session bean resources and web server resources have an additional Monitoring subtab called Calltime. All of the call-time data or response time data ranges (minimum, maximum, and averages)are displayed for each URL resource or method. As new URLs or methods are accessed, they aredynamically added to the results table.
Figure 14. URL Metrics for a Web Server
6.3. Extended Example: Website Performance
The Setup
A significant amount of Example Co.'s business, services, and support is tied to its website. Customershave to be able to access the site to purchase products, schedule training or consulting, and to receivemost support and help. If the site is slow or if some resources are inaccessible, customers immediatelyhave a negative experience.
The goal is not to monitor whether the web server is running, but whether the web application areresponsive and performing as Example Co.'s customers expect.
What to Do
Tim the IT Guy identifies three different ways that he can capture web application performanceinformation:
Response times for individual URLs
Setting up Monitoring, Alerts, and Operations
42
Throughput information like total number of requests and responses
Counts for critical HTTP response codes
Both monitoring and alerting can be configured based solely off response time and throughput metrics.However, bad website performance is indicative of an underlying problem with the web server or itsassociated database. Therefore, Tim not only wants to be informed when website performance it poor;he wants to correlate some performance metrics with underlying server and database performance andlaunch operations that can mitigate poor responsiveness.
Tim maps a few common scenarios which cause poor website or web server performance and planssimple, immediate operations that JBoss ON can perform until an IT staffer can analyze the problem.Tim attempts to narrow down potential causes to a performance. Alerts can be issued for a singlecondition or for a combination of conditions. In Tim's case, he creates a three different alerts based ondifferent combinations of underlying causes for performance problems (Section 11.2, “Basic Procedurefor Setting Alerts for a Resource”).
If there are poor response times and a high number of HTTP error 500 responses, then the alertcan be configured with an operation to restart the web server (Section 13.2, “DetailedDiscussion: Initiating an Operation”).
If there are poor response times and a high number of HTTP error 404 response (meaning thatresources may not be delivered properly), then the alert is configured to restart the database.
If there are poor response times and a high number of total requests per minute, then it maymean that there is simply too much load on the server. The alert can be configured to createanother web server instance to help with load balancing; using a JBoss ON CLI script allows theJBoss ON server to create new resources as necessary and deploy bundles of the appropriateweb apps (Section 13.3, “Detailed Discussion: Initiating Resource Scripts”).
The most critical factor is the response time, which is a factor in every alert. Each alert has one conditionbased on the call time data, specifically of the call-time data moves past a certain threshold.
6. URL RESPONSE TIME MONITORING
43
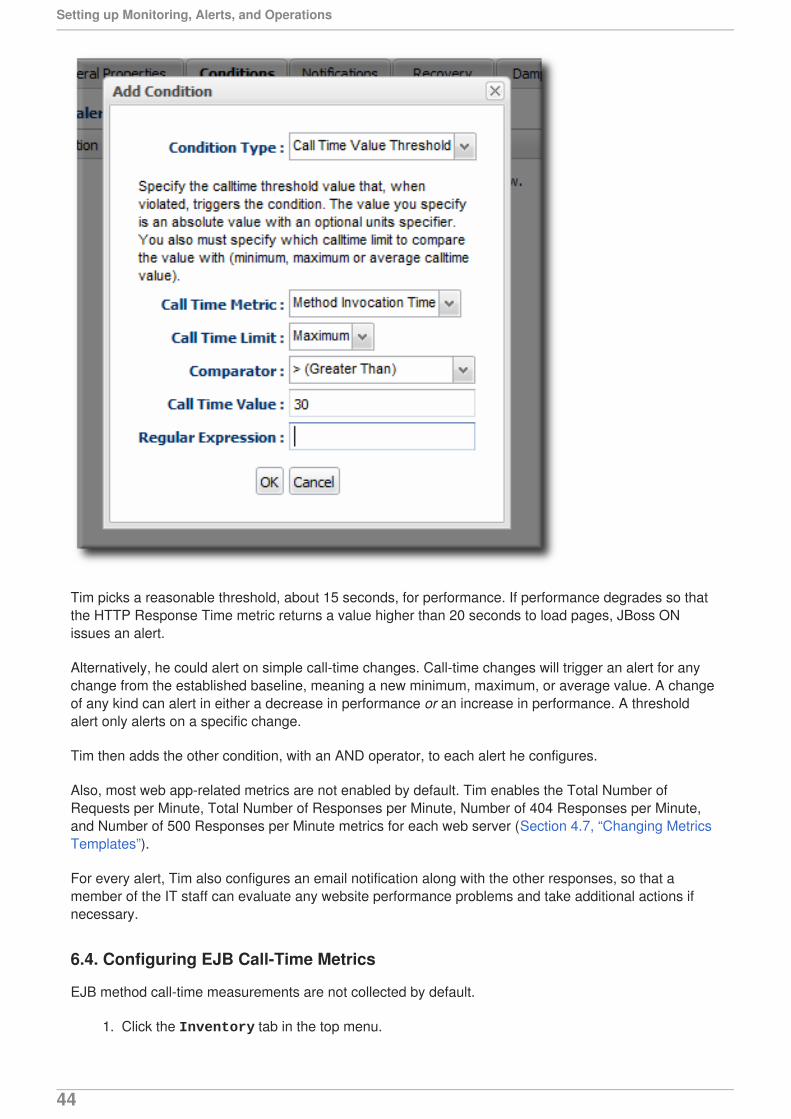
Tim picks a reasonable threshold, about 15 seconds, for performance. If performance degrades so thatthe HTTP Response Time metric returns a value higher than 20 seconds to load pages, JBoss ONissues an alert.
Alternatively, he could alert on simple call-time changes. Call-time changes will trigger an alert for anychange from the established baseline, meaning a new minimum, maximum, or average value. A changeof any kind can alert in either a decrease in performance or an increase in performance. A thresholdalert only alerts on a specific change.
Tim then adds the other condition, with an AND operator, to each alert he configures.
Also, most web app-related metrics are not enabled by default. Tim enables the Total Number ofRequests per Minute, Total Number of Responses per Minute, Number of 404 Responses per Minute,and Number of 500 Responses per Minute metrics for each web server (Section 4.7, “Changing MetricsTemplates”).
For every alert, Tim also configures an email notification along with the other responses, so that amember of the IT staff can evaluate any website performance problems and take additional actions ifnecessary.
6.4. Configuring EJB Call-Time Metrics
EJB method call-time measurements are not collected by default.
1. Click the Inventory tab in the top menu.
Setting up Monitoring, Alerts, and Operations
44
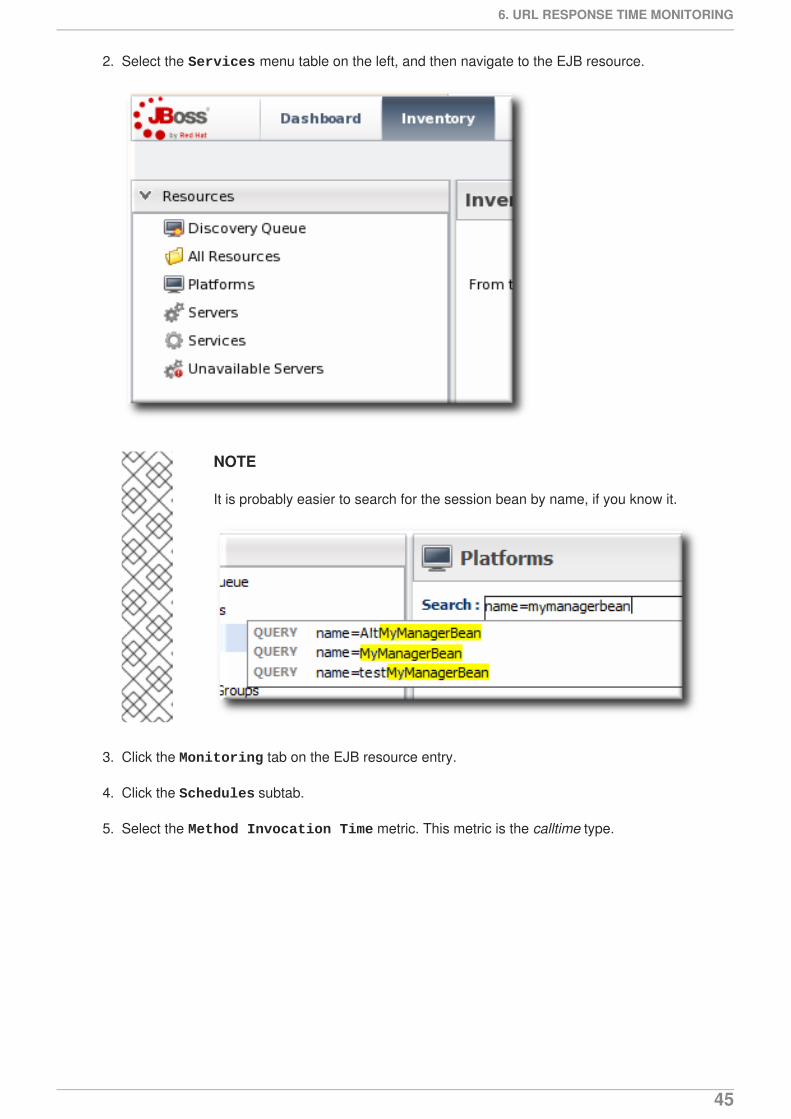
2. Select the Services menu table on the left, and then navigate to the EJB resource.
NOTE
It is probably easier to search for the session bean by name, if you know it.
3. Click the Monitoring tab on the EJB resource entry.
4. Click the Schedules subtab.
5. Select the Method Invocation Time metric. This metric is the calltime type.
6. URL RESPONSE TIME MONITORING
45
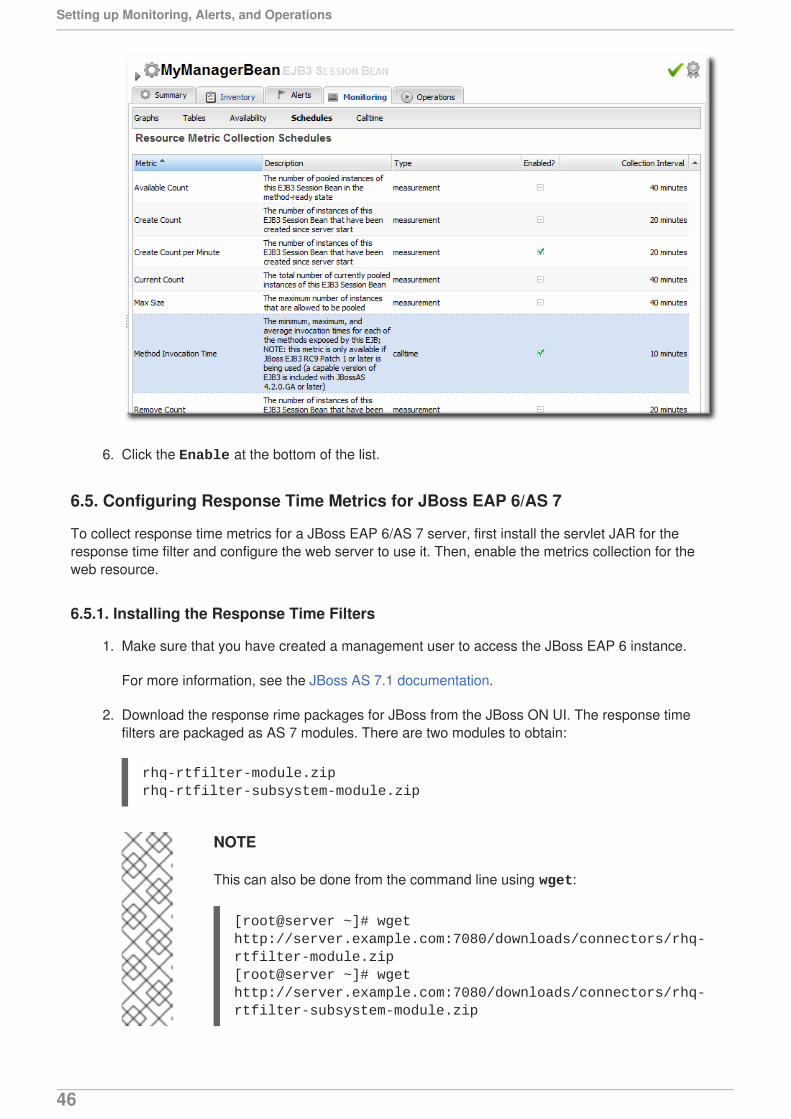
6. Click the Enable at the bottom of the list.
6.5. Configuring Response Time Metrics for JBoss EAP 6/AS 7
To collect response time metrics for a JBoss EAP 6/AS 7 server, first install the servlet JAR for theresponse time filter and configure the web server to use it. Then, enable the metrics collection for theweb resource.
6.5.1. Installing the Response Time Filters
1. Make sure that you have created a management user to access the JBoss EAP 6 instance.
For more information, see the JBoss AS 7.1 documentation.
2. Download the response rime packages for JBoss from the JBoss ON UI. The response timefilters are packaged as AS 7 modules. There are two modules to obtain:
rhq-rtfilter-module.ziprhq-rtfilter-subsystem-module.zip
NOTE
This can also be done from the command line using wget:
[root@server ~]# wget http://server.example.com:7080/downloads/connectors/rhq-rtfilter-module.zip[root@server ~]# wget http://server.example.com:7080/downloads/connectors/rhq-rtfilter-subsystem-module.zip
Setting up Monitoring, Alerts, and Operations
46
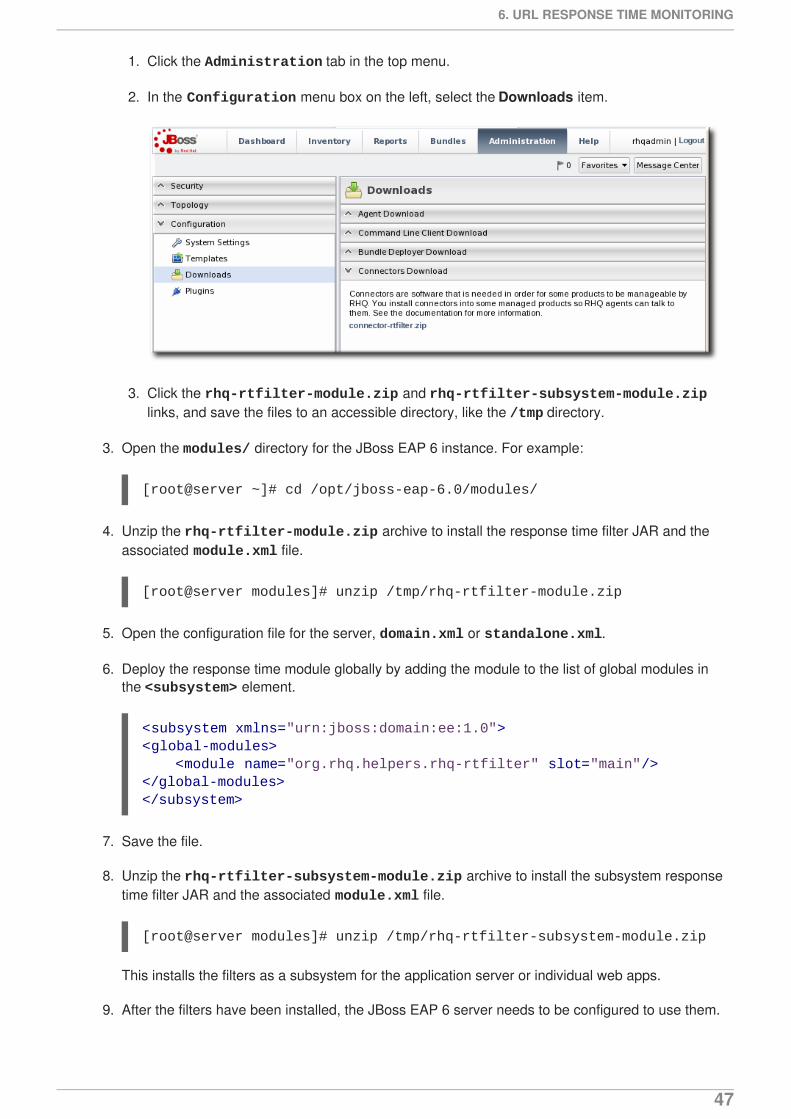
1. Click the Administration tab in the top menu.
2. In the Configuration menu box on the left, select the Downloads item.
3. Click the rhq-rtfilter-module.zip and rhq-rtfilter-subsystem-module.ziplinks, and save the files to an accessible directory, like the /tmp directory.
3. Open the modules/ directory for the JBoss EAP 6 instance. For example:
[root@server ~]# cd /opt/jboss-eap-6.0/modules/
4. Unzip the rhq-rtfilter-module.zip archive to install the response time filter JAR and theassociated module.xml file.
[root@server modules]# unzip /tmp/rhq-rtfilter-module.zip
5. Open the configuration file for the server, domain.xml or standalone.xml.
6. Deploy the response time module globally by adding the module to the list of global modules inthe <subsystem> element.
7. Save the file.
8. Unzip the rhq-rtfilter-subsystem-module.zip archive to install the subsystem responsetime filter JAR and the associated module.xml file.
[root@server modules]# unzip /tmp/rhq-rtfilter-subsystem-module.zip
This installs the filters as a subsystem for the application server or individual web apps.
9. After the filters have been installed, the JBoss EAP 6 server needs to be configured to use them.
<subsystem xmlns="urn:jboss:domain:ee:1.0"> <global-modules> <module name="org.rhq.helpers.rhq-rtfilter" slot="main"/></global-modules></subsystem>
6. URL RESPONSE TIME MONITORING
47
The response time filter can be deployed globally, for all web applications hosted by the EAP/ASinstance, or it can be configured for a specific web application.
To deploy the filter as a global subsystem:
1. Open the configuration file for the server, domain.xml or standalone.xml.
2. Add the an <extensions> element for the response time filter.
3. Add a <subsystem> element beneath the <profile element.
All that is required for response time filtering to work is the default <subsystem> element,without any optional parameters. However, the parameters can be uncommented and set asnecessary; the different ones are described in Table 3, “Parameters Available for User-Defined <filter> Settings”.
The <subsystem> element should be added even if none of the optional parameters areset.
<extension module="org.rhq.helpers.rhq-rtfilter-subsystem"/>
<subsystem xmlns="urn:rhq:rtfilter:1.0"> <!-- Optional parameters. <init-param> <param-name>chopQueryString</param-name> <param-value>true</param-value> </init-param> <init-param> <param-name>logDirectory</param-name> <param-value>/tmp</param-value> </init-param> <init-param> <param-name>logFilePrefix</param-name> <param-value>localhost_7080_</param-value> </init-param> <init-param> <param-name>dontLogRegEx</param-name> <param-value></param-value> </init-param> <init-param> <param-name>matchOnUriOnly</param-name> <param-value>true</param-value> </init-param> <init-param> <param-name>timeBetweenFlushesInSec</param-name> <param-value>73</param-value> </init-param> <init-param> <param-name>flushAfterLines</param-name> <param-value>13</param-value> </init-param> <init-param> <param-name>maxLogFileSize</param-name> <param-value>5242880</param-value>
Setting up Monitoring, Alerts, and Operations
48
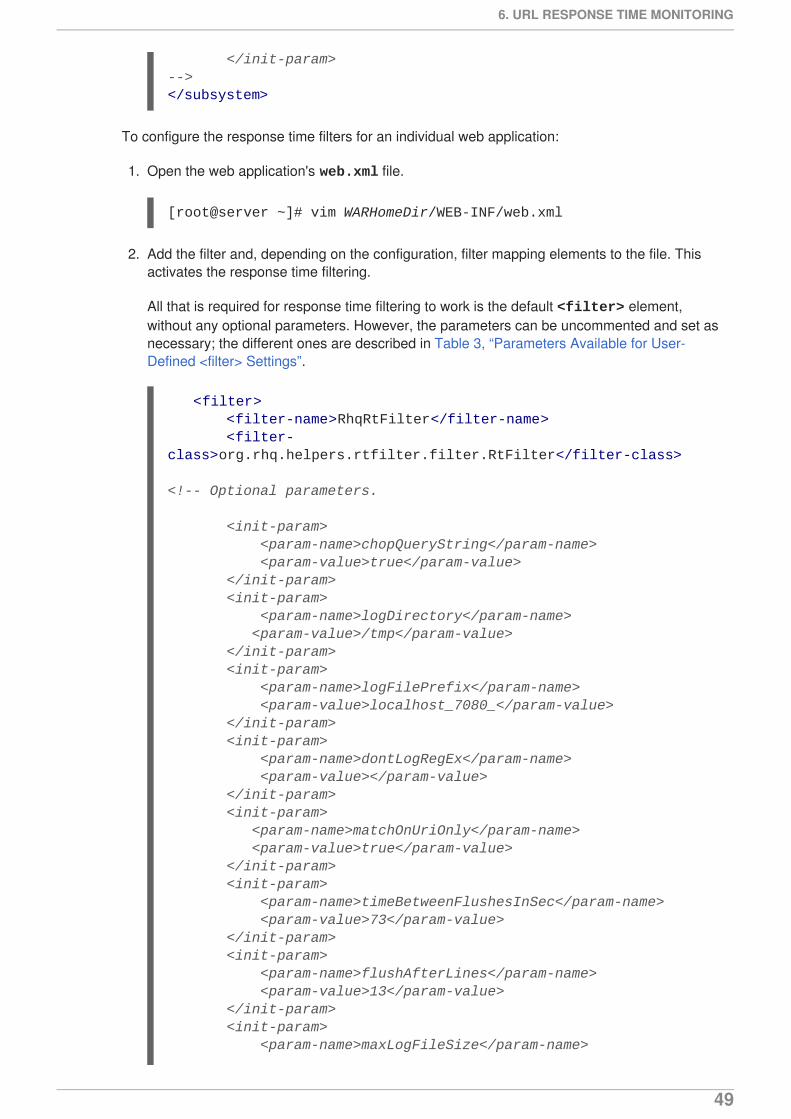
To configure the response time filters for an individual web application:
1. Open the web application's web.xml file.
[root@server ~]# vim WARHomeDir/WEB-INF/web.xml
2. Add the filter and, depending on the configuration, filter mapping elements to the file. Thisactivates the response time filtering.
All that is required for response time filtering to work is the default <filter> element,without any optional parameters. However, the parameters can be uncommented and set asnecessary; the different ones are described in Table 3, “Parameters Available for User-Defined <filter> Settings”.
</init-param> --></subsystem>
<filter> <filter-name>RhqRtFilter</filter-name> <filter-class>org.rhq.helpers.rtfilter.filter.RtFilter</filter-class>
<!-- Optional parameters. <init-param> <param-name>chopQueryString</param-name> <param-value>true</param-value> </init-param> <init-param> <param-name>logDirectory</param-name> <param-value>/tmp</param-value> </init-param> <init-param> <param-name>logFilePrefix</param-name> <param-value>localhost_7080_</param-value> </init-param> <init-param> <param-name>dontLogRegEx</param-name> <param-value></param-value> </init-param> <init-param> <param-name>matchOnUriOnly</param-name> <param-value>true</param-value> </init-param> <init-param> <param-name>timeBetweenFlushesInSec</param-name> <param-value>73</param-value> </init-param> <init-param> <param-name>flushAfterLines</param-name> <param-value>13</param-value> </init-param> <init-param> <param-name>maxLogFileSize</param-name>
6. URL RESPONSE TIME MONITORING
49
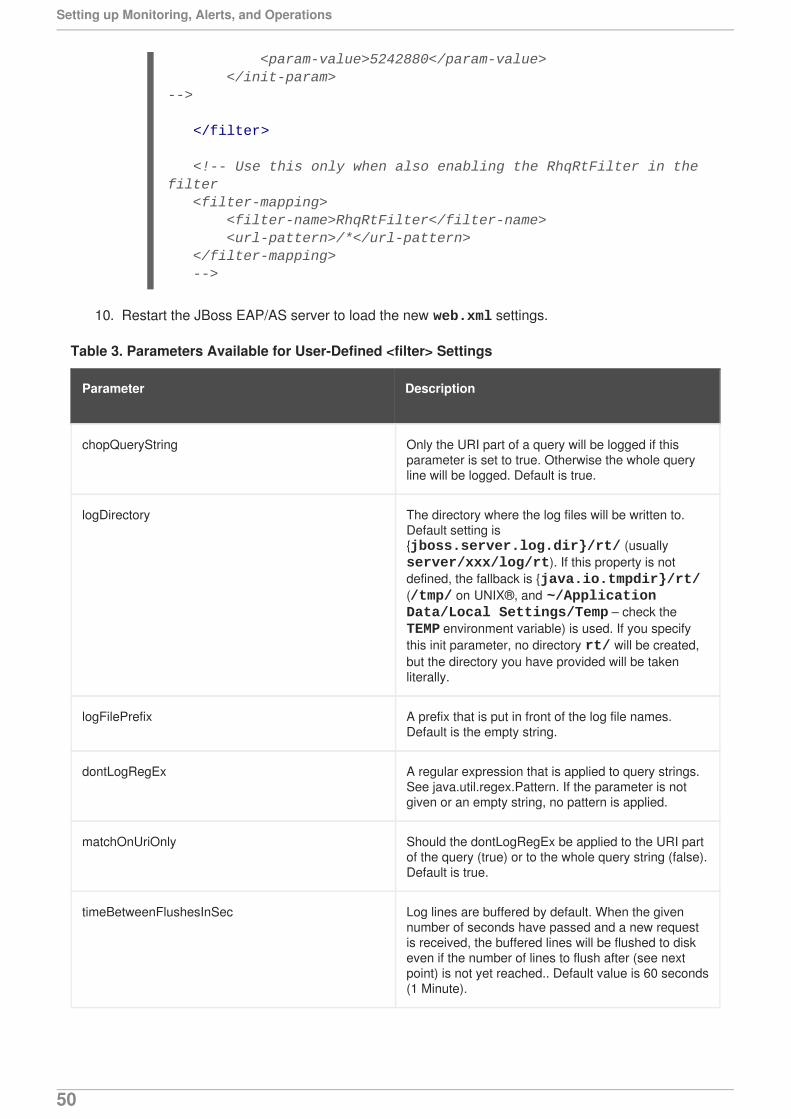
10. Restart the JBoss EAP/AS server to load the new web.xml settings.
Table 3. Parameters Available for User-Defined <filter> Settings
Parameter Description
chopQueryString Only the URI part of a query will be logged if thisparameter is set to true. Otherwise the whole queryline will be logged. Default is true.
logDirectory The directory where the log files will be written to.Default setting is{jboss.server.log.dir}/rt/ (usually server/xxx/log/rt). If this property is notdefined, the fallback is {java.io.tmpdir}/rt/(/tmp/ on UNIX®, and ~/Application Data/Local Settings/Temp – check the TEMP environment variable) is used. If you specifythis init parameter, no directory rt/ will be created,but the directory you have provided will be takenliterally.
logFilePrefix A prefix that is put in front of the log file names.Default is the empty string.
dontLogRegEx A regular expression that is applied to query strings.See java.util.regex.Pattern. If the parameter is notgiven or an empty string, no pattern is applied.
matchOnUriOnly Should the dontLogRegEx be applied to the URI partof the query (true) or to the whole query string (false).Default is true.
timeBetweenFlushesInSec Log lines are buffered by default. When the givennumber of seconds have passed and a new requestis received, the buffered lines will be flushed to diskeven if the number of lines to flush after (see nextpoint) is not yet reached.. Default value is 60 seconds(1 Minute).
<param-value>5242880</param-value> </init-param> -->
</filter>
<!-- Use this only when also enabling the RhqRtFilter in the filter <filter-mapping> <filter-name>RhqRtFilter</filter-name> <url-pattern>/*</url-pattern> </filter-mapping> -->
Setting up Monitoring, Alerts, and Operations
50
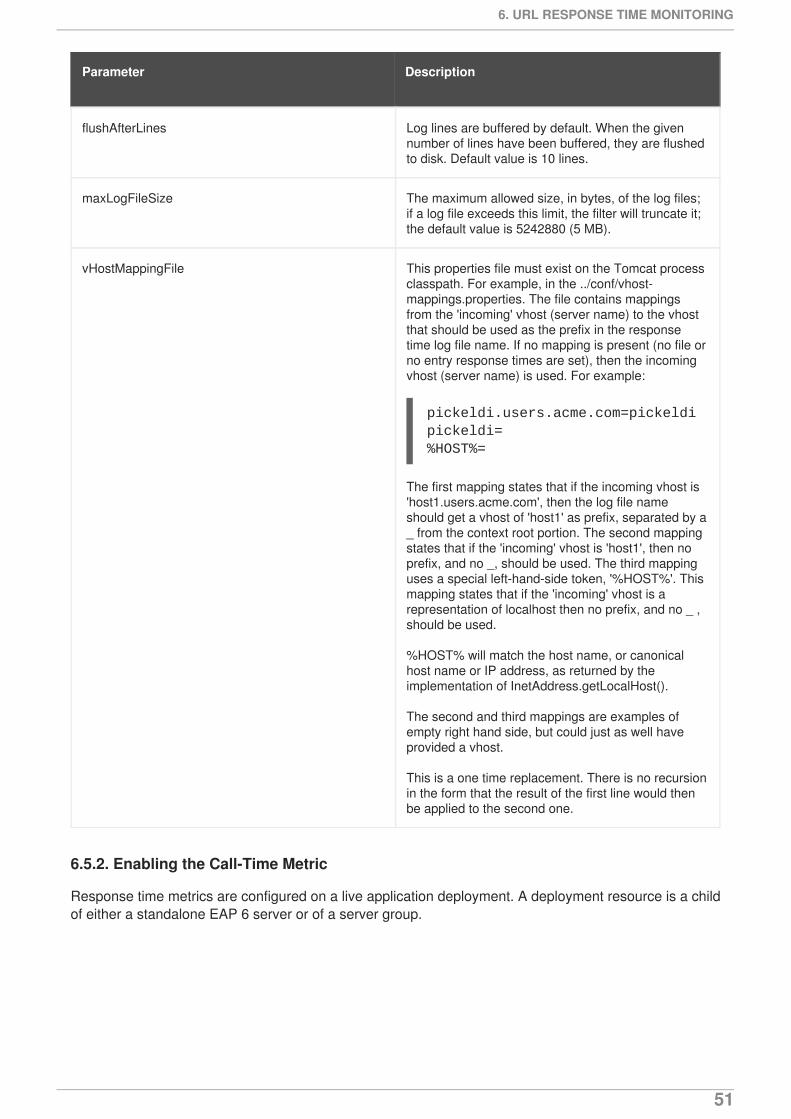
flushAfterLines Log lines are buffered by default. When the givennumber of lines have been buffered, they are flushedto disk. Default value is 10 lines.
maxLogFileSize The maximum allowed size, in bytes, of the log files;if a log file exceeds this limit, the filter will truncate it;the default value is 5242880 (5 MB).
vHostMappingFile This properties file must exist on the Tomcat processclasspath. For example, in the ../conf/vhost-mappings.properties. The file contains mappingsfrom the 'incoming' vhost (server name) to the vhostthat should be used as the prefix in the responsetime log file name. If no mapping is present (no file orno entry response times are set), then the incomingvhost (server name) is used. For example:
pickeldi.users.acme.com=pickeldipickeldi=%HOST%=
The first mapping states that if the incoming vhost is'host1.users.acme.com', then the log file nameshould get a vhost of 'host1' as prefix, separated by a_ from the context root portion. The second mappingstates that if the 'incoming' vhost is 'host1', then noprefix, and no _, should be used. The third mappinguses a special left-hand-side token, '%HOST%'. Thismapping states that if the 'incoming' vhost is arepresentation of localhost then no prefix, and no _ ,should be used.
%HOST% will match the host name, or canonicalhost name or IP address, as returned by theimplementation of InetAddress.getLocalHost().
The second and third mappings are examples ofempty right hand side, but could just as well haveprovided a vhost.
This is a one time replacement. There is no recursionin the form that the result of the first line would thenbe applied to the second one.
Parameter Description
6.5.2. Enabling the Call-Time Metric
Response time metrics are configured on a live application deployment. A deployment resource is a childof either a standalone EAP 6 server or of a server group.
6. URL RESPONSE TIME MONITORING
51
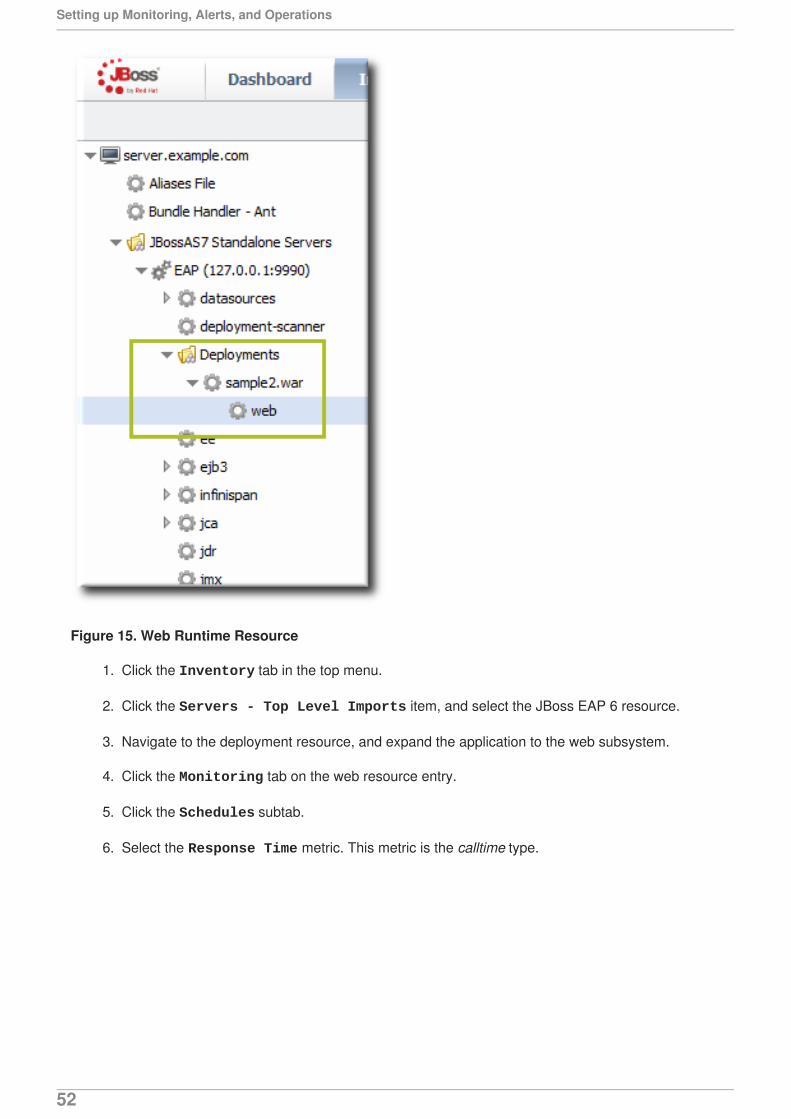
Figure 15. Web Runtime Resource
1. Click the Inventory tab in the top menu.
2. Click the Servers - Top Level Imports item, and select the JBoss EAP 6 resource.
3. Navigate to the deployment resource, and expand the application to the web subsystem.
4. Click the Monitoring tab on the web resource entry.
5. Click the Schedules subtab.
6. Select the Response Time metric. This metric is the calltime type.
Setting up Monitoring, Alerts, and Operations
52
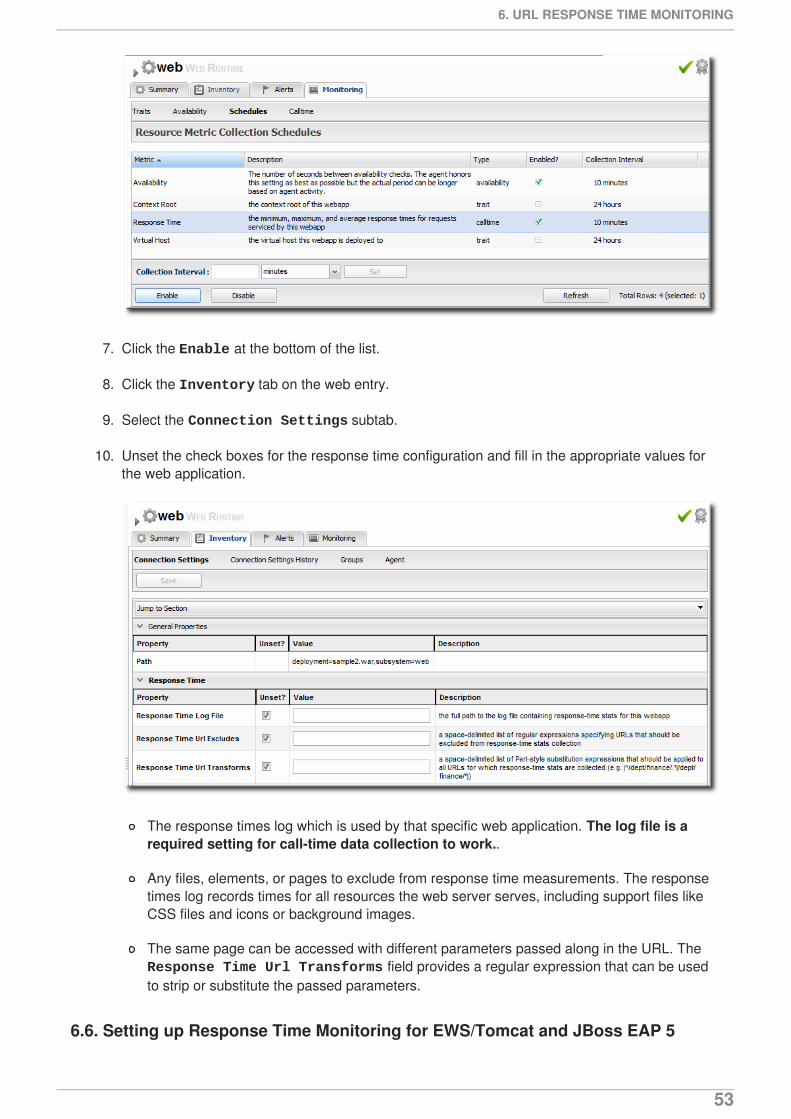
7. Click the Enable at the bottom of the list.
8. Click the Inventory tab on the web entry.
9. Select the Connection Settings subtab.
10. Unset the check boxes for the response time configuration and fill in the appropriate values forthe web application.
The response times log which is used by that specific web application. The log file is arequired setting for call-time data collection to work..
Any files, elements, or pages to exclude from response time measurements. The responsetimes log records times for all resources the web server serves, including support files likeCSS files and icons or background images.
The same page can be accessed with different parameters passed along in the URL. The Response Time Url Transforms field provides a regular expression that can be usedto strip or substitute the passed parameters.
6.6. Setting up Response Time Monitoring for EWS/Tomcat and JBoss EAP 5
6. URL RESPONSE TIME MONITORING
53
Response time monitoring is not available from application or web servers by default; a special modulemust be installed which allows JBoss ON to collect response time metrics.
After the module is installed, then the HTTP metrics can be enabled for the resource.
6.6.1. Parameters for User-Defined <filter>s
Administrators can set rules for how response time metrics are collected for application and web servers.This are response time filters.
For response time monitoring to work, JBoss and EWS/Tomcat all must have response time filtersinstalled. Additional configuration options can be added to those default filters to customize themonitoring for the resource.
Table 4. Parameters for User-Defined <filter>s
Parameter Description
chopQueryString Only the URI part of a query will be logged if thisparameter is set to true. Otherwise the whole queryline will be logged. Default is true.
logDirectory The directory where the log files will be written to.Default setting is{jboss.server.log.dir}/rt/ (usually server/xxx/log/rt). If this property is notdefined, the fallback is {java.io.tmpdir}/rt/(/tmp/ on UNIX®, and ~/Application Data/Local Settings/Temp – check the TEMP environment variable) is used. If you specifythis init parameter, no directory rt/ will be created,but the directory you have provided will be takenliterally.
logFilePrefix A prefix that is put in front of the log file names.Default is the empty string.
dontLogRegEx A regular expression that is applied to query strings.See java.util.regex.Pattern. If the parameter is notgiven or an empty string, no pattern is applied.
matchOnUriOnly Should the dontLogRegEx be applied to the URI partof the query (true) or to the whole query string (false).Default is true.
timeBetweenFlushesInSec Log lines are buffered by default. When the givennumber of seconds have passed and a new requestis received, the buffered lines will be flushed to diskeven if the number of lines to flush after (see nextpoint) is not yet reached.. Default value is 60 seconds(1 Minute).
flushAfterLines Log lines are buffered by default. When the givennumber of lines have been buffered, they are flushedto disk. Default value is 10 lines.
Setting up Monitoring, Alerts, and Operations
54
maxLogFileSize The maximum allowed size, in bytes, of the log files;if a log file exceeds this limit, the filter will truncate it;the default value is 5242880 (5 MB).
vHostMappingFile This properties file must exist in the Tomcat processclasspath. For example, in the conf/vhost-mappings.properties file. The file containsmappings from the 'incoming' vhost (server name) tothe vhost that should be used as the prefix in theresponse time log file name. If no mapping is present(no file or no entry response times are set), then theincoming vhost (server name) is used. For example:
pickeldi.users.acme.com=pickeldipickeldi=%HOST%=
The first mapping states that if the incoming vhost is'host1.users.acme.com', then the log file nameshould get a vhost of 'host1' as prefix, separated by a_ from the context root portion. The second mappingstates that if the 'incoming' vhost is 'host1', then noprefix, and no _, should be used. The third mappinguses a special left-hand-side token, '%HOST%'. Thismapping states that if the 'incoming' vhost is arepresentation of localhost then no prefix, and no _ ,should be used.
%HOST% will match the host name, or canonicalhost name or IP address, as returned by theimplementation of InetAddress.getLocalHost().
The second and third mappings are examples ofempty right hand side, but could just as well haveprovided a vhost.
This is a one time replacement. There is no recursionin the form that the result of the first line would thenbe applied to the second one.
Parameter Description
6.6.2. Configuring Response Time Metrics for JBoss EAP/AS 5
To collect response time metrics for a JBoss EAP/AS 5 server, first install the servlet JAR for theresponse time filter and configure the web server to use it.
1. Download the Response Time packages for JBoss from the JBoss ON UI.
6. URL RESPONSE TIME MONITORING
55
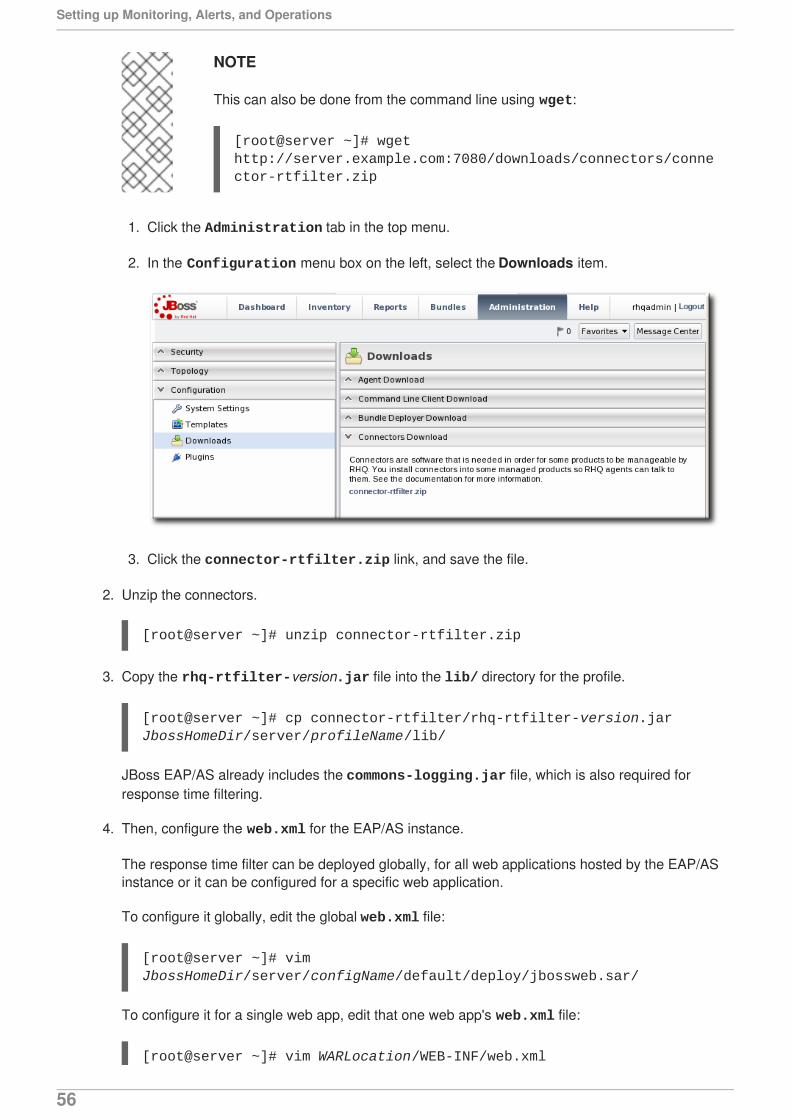
NOTE
This can also be done from the command line using wget:
[root@server ~]# wget http://server.example.com:7080/downloads/connectors/connector-rtfilter.zip
1. Click the Administration tab in the top menu.
2. In the Configuration menu box on the left, select the Downloads item.
3. Click the connector-rtfilter.zip link, and save the file.
2. Unzip the connectors.
[root@server ~]# unzip connector-rtfilter.zip
3. Copy the rhq-rtfilter-version.jar file into the lib/ directory for the profile.
[root@server ~]# cp connector-rtfilter/rhq-rtfilter-version.jar JbossHomeDir/server/profileName/lib/
JBoss EAP/AS already includes the commons-logging.jar file, which is also required forresponse time filtering.
4. Then, configure the web.xml for the EAP/AS instance.
The response time filter can be deployed globally, for all web applications hosted by the EAP/ASinstance or it can be configured for a specific web application.
To configure it globally, edit the global web.xml file:
[root@server ~]# vim JbossHomeDir/server/configName/default/deploy/jbossweb.sar/
To configure it for a single web app, edit that one web app's web.xml file:
[root@server ~]# vim WARLocation/WEB-INF/web.xml
Setting up Monitoring, Alerts, and Operations
56
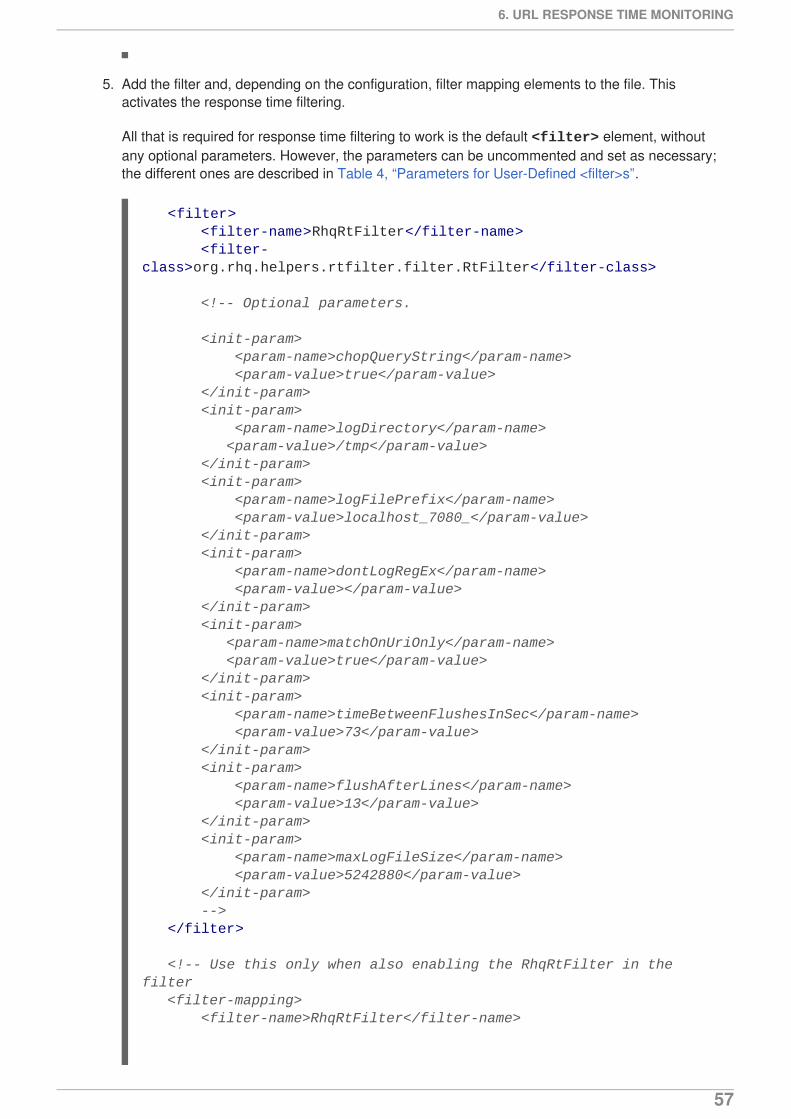
5. Add the filter and, depending on the configuration, filter mapping elements to the file. Thisactivates the response time filtering.
All that is required for response time filtering to work is the default <filter> element, withoutany optional parameters. However, the parameters can be uncommented and set as necessary;the different ones are described in Table 4, “Parameters for User-Defined <filter>s”.
<filter> <filter-name>RhqRtFilter</filter-name> <filter-class>org.rhq.helpers.rtfilter.filter.RtFilter</filter-class>
<!-- Optional parameters. <init-param> <param-name>chopQueryString</param-name> <param-value>true</param-value> </init-param> <init-param> <param-name>logDirectory</param-name> <param-value>/tmp</param-value> </init-param> <init-param> <param-name>logFilePrefix</param-name> <param-value>localhost_7080_</param-value> </init-param> <init-param> <param-name>dontLogRegEx</param-name> <param-value></param-value> </init-param> <init-param> <param-name>matchOnUriOnly</param-name> <param-value>true</param-value> </init-param> <init-param> <param-name>timeBetweenFlushesInSec</param-name> <param-value>73</param-value> </init-param> <init-param> <param-name>flushAfterLines</param-name> <param-value>13</param-value> </init-param> <init-param> <param-name>maxLogFileSize</param-name> <param-value>5242880</param-value> </init-param> --> </filter>
<!-- Use this only when also enabling the RhqRtFilter in the filter <filter-mapping> <filter-name>RhqRtFilter</filter-name>
6. URL RESPONSE TIME MONITORING
57
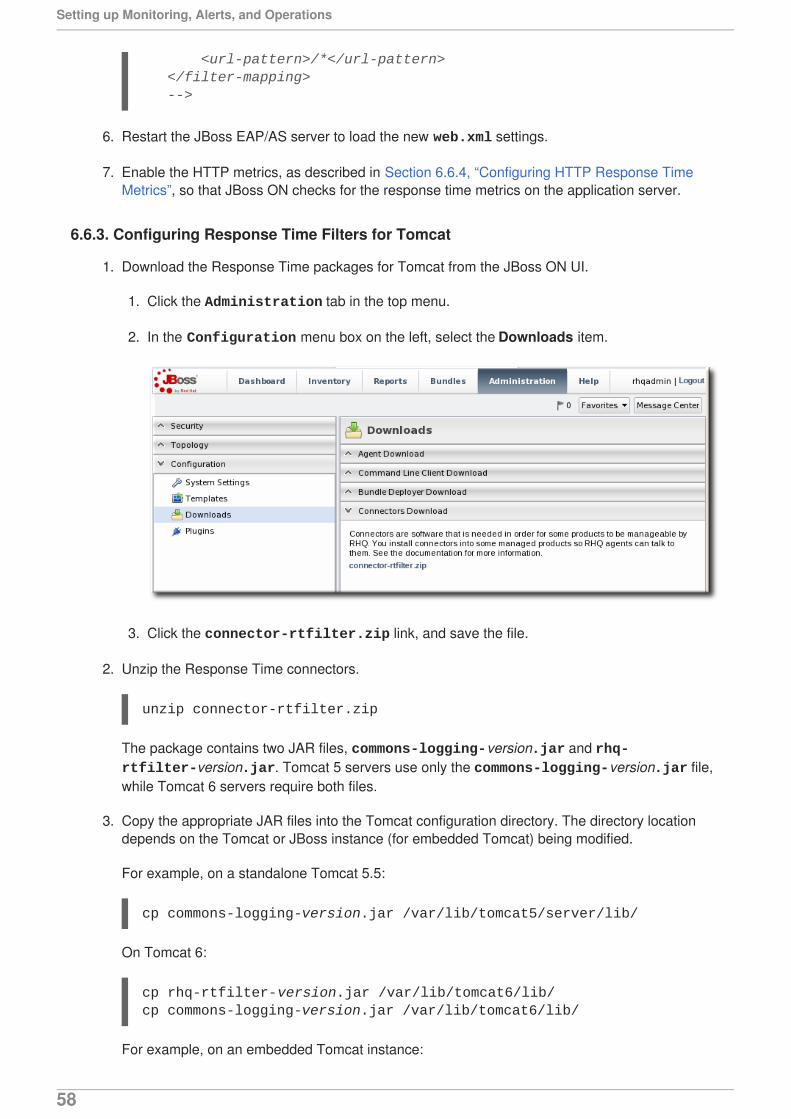
6. Restart the JBoss EAP/AS server to load the new web.xml settings.
7. Enable the HTTP metrics, as described in Section 6.6.4, “Configuring HTTP Response TimeMetrics”, so that JBoss ON checks for the response time metrics on the application server.
6.6.3. Configuring Response Time Filters for Tomcat
1. Download the Response Time packages for Tomcat from the JBoss ON UI.
1. Click the Administration tab in the top menu.
2. In the Configuration menu box on the left, select the Downloads item.
3. Click the connector-rtfilter.zip link, and save the file.
2. Unzip the Response Time connectors.
unzip connector-rtfilter.zip
The package contains two JAR files, commons-logging-version.jar and rhq-rtfilter-version.jar. Tomcat 5 servers use only the commons-logging-version.jar file,while Tomcat 6 servers require both files.
3. Copy the appropriate JAR files into the Tomcat configuration directory. The directory locationdepends on the Tomcat or JBoss instance (for embedded Tomcat) being modified.
For example, on a standalone Tomcat 5.5:
cp commons-logging-version.jar /var/lib/tomcat5/server/lib/
On Tomcat 6:
cp rhq-rtfilter-version.jar /var/lib/tomcat6/lib/cp commons-logging-version.jar /var/lib/tomcat6/lib/
For example, on an embedded Tomcat instance:
<url-pattern>/*</url-pattern> </filter-mapping> -->
Setting up Monitoring, Alerts, and Operations
58
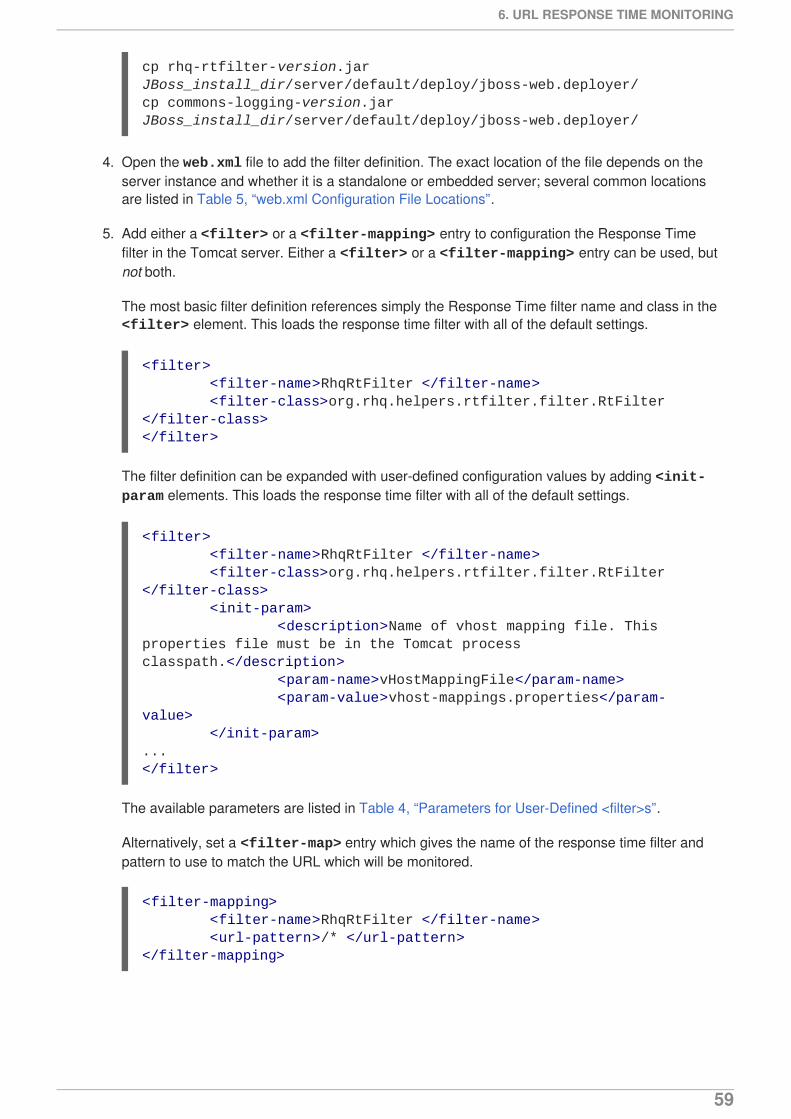
cp rhq-rtfilter-version.jar JBoss_install_dir/server/default/deploy/jboss-web.deployer/cp commons-logging-version.jar JBoss_install_dir/server/default/deploy/jboss-web.deployer/
4. Open the web.xml file to add the filter definition. The exact location of the file depends on theserver instance and whether it is a standalone or embedded server; several common locationsare listed in Table 5, “web.xml Configuration File Locations”.
5. Add either a <filter> or a <filter-mapping> entry to configuration the Response Timefilter in the Tomcat server. Either a <filter> or a <filter-mapping> entry can be used, butnot both.
The most basic filter definition references simply the Response Time filter name and class in the<filter> element. This loads the response time filter with all of the default settings.
The filter definition can be expanded with user-defined configuration values by adding <init-param elements. This loads the response time filter with all of the default settings.
The available parameters are listed in Table 4, “Parameters for User-Defined <filter>s”.
Alternatively, set a <filter-map> entry which gives the name of the response time filter andpattern to use to match the URL which will be monitored.
<filter> <filter-name>RhqRtFilter </filter-name> <filter-class>org.rhq.helpers.rtfilter.filter.RtFilter </filter-class></filter>
<filter> <filter-name>RhqRtFilter </filter-name> <filter-class>org.rhq.helpers.rtfilter.filter.RtFilter </filter-class> <init-param> <description>Name of vhost mapping file. This properties file must be in the Tomcat process classpath.</description> <param-name>vHostMappingFile</param-name> <param-value>vhost-mappings.properties</param-value> </init-param>...</filter>
<filter-mapping> <filter-name>RhqRtFilter </filter-name> <url-pattern>/* </url-pattern></filter-mapping>
6. URL RESPONSE TIME MONITORING
59
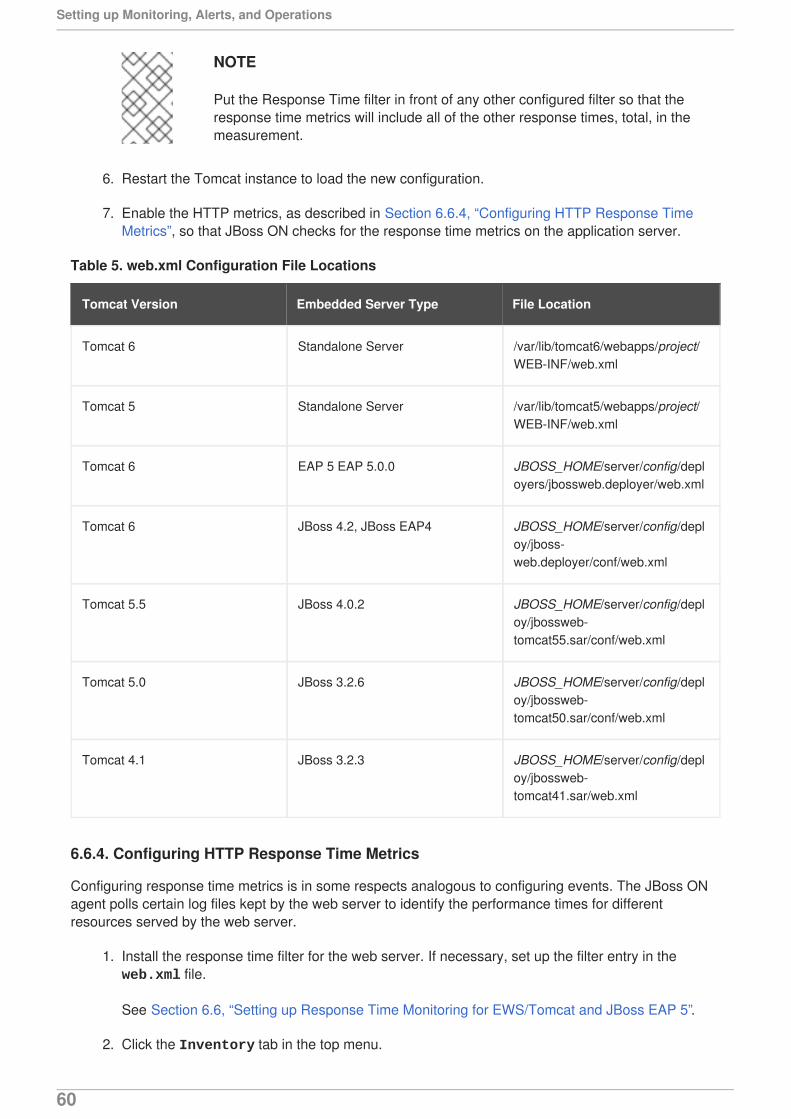
NOTE
Put the Response Time filter in front of any other configured filter so that theresponse time metrics will include all of the other response times, total, in themeasurement.
6. Restart the Tomcat instance to load the new configuration.
7. Enable the HTTP metrics, as described in Section 6.6.4, “Configuring HTTP Response TimeMetrics”, so that JBoss ON checks for the response time metrics on the application server.
Table 5. web.xml Configuration File Locations
Tomcat Version Embedded Server Type File Location
Tomcat 6 Standalone Server /var/lib/tomcat6/webapps/project/WEB-INF/web.xml
Tomcat 5 Standalone Server /var/lib/tomcat5/webapps/project/WEB-INF/web.xml
Tomcat 6 EAP 5 EAP 5.0.0 JBOSS_HOME/server/config/deployers/jbossweb.deployer/web.xml
Tomcat 6 JBoss 4.2, JBoss EAP4 JBOSS_HOME/server/config/deploy/jboss-web.deployer/conf/web.xml
Tomcat 5.5 JBoss 4.0.2 JBOSS_HOME/server/config/deploy/jbossweb-tomcat55.sar/conf/web.xml
Tomcat 5.0 JBoss 3.2.6 JBOSS_HOME/server/config/deploy/jbossweb-tomcat50.sar/conf/web.xml
Tomcat 4.1 JBoss 3.2.3 JBOSS_HOME/server/config/deploy/jbossweb-tomcat41.sar/web.xml
6.6.4. Configuring HTTP Response Time Metrics
Configuring response time metrics is in some respects analogous to configuring events. The JBoss ONagent polls certain log files kept by the web server to identify the performance times for differentresources served by the web server.
1. Install the response time filter for the web server. If necessary, set up the filter entry in the web.xml file.
See Section 6.6, “Setting up Response Time Monitoring for EWS/Tomcat and JBoss EAP 5”.
2. Click the Inventory tab in the top menu.
Setting up Monitoring, Alerts, and Operations
60
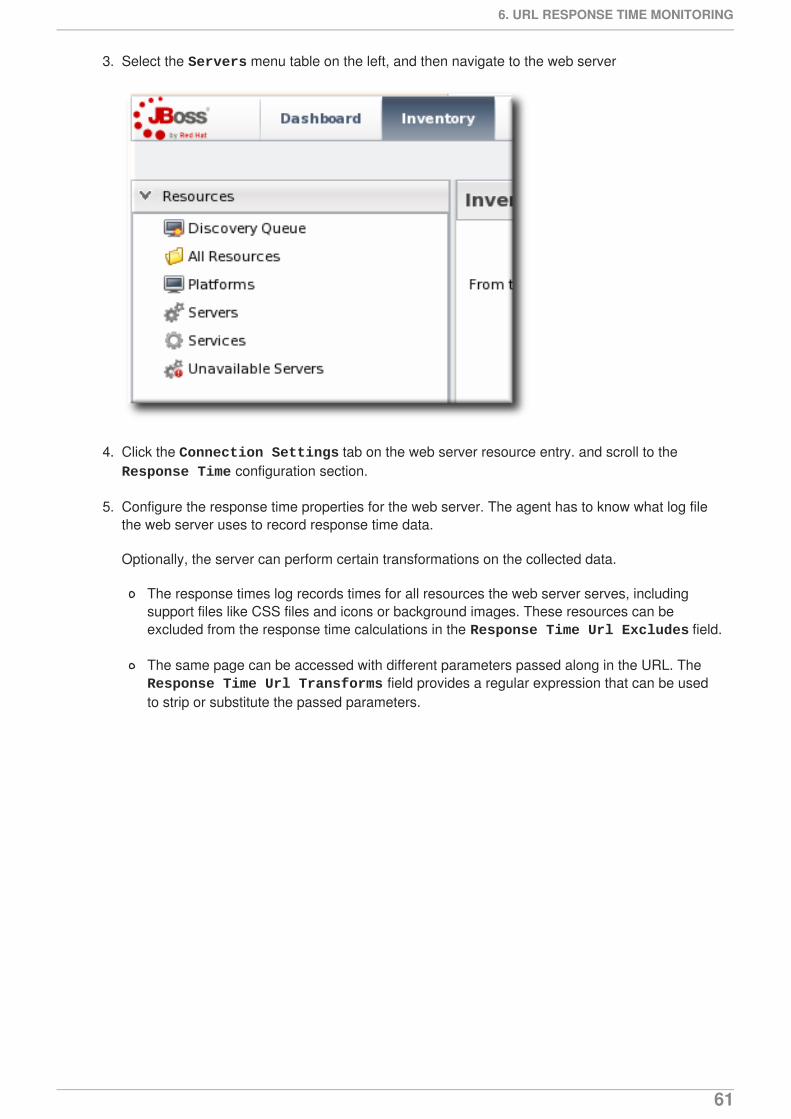
3. Select the Servers menu table on the left, and then navigate to the web server
4. Click the Connection Settings tab on the web server resource entry. and scroll to the Response Time configuration section.
5. Configure the response time properties for the web server. The agent has to know what log filethe web server uses to record response time data.
Optionally, the server can perform certain transformations on the collected data.
The response times log records times for all resources the web server serves, includingsupport files like CSS files and icons or background images. These resources can beexcluded from the response time calculations in the Response Time Url Excludes field.
The same page can be accessed with different parameters passed along in the URL. The Response Time Url Transforms field provides a regular expression that can be usedto strip or substitute the passed parameters.
6. URL RESPONSE TIME MONITORING
61
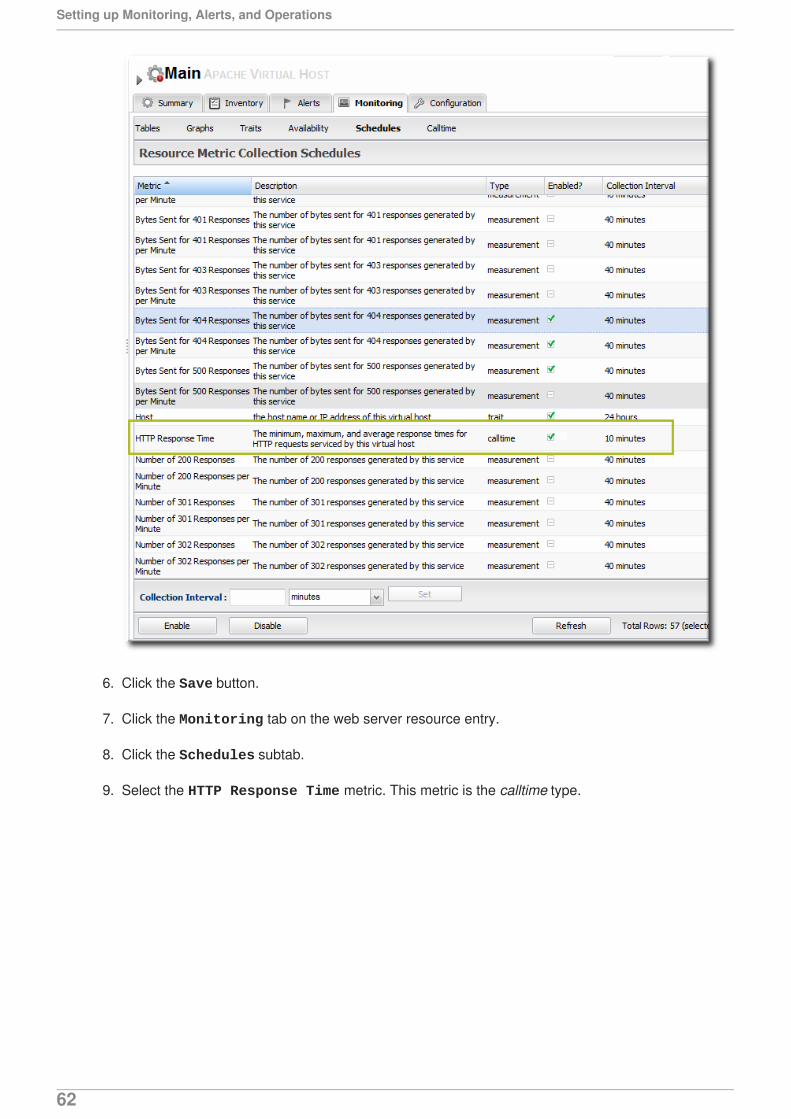
6. Click the Save button.
7. Click the Monitoring tab on the web server resource entry.
8. Click the Schedules subtab.
9. Select the HTTP Response Time metric. This metric is the calltime type.
Setting up Monitoring, Alerts, and Operations
62
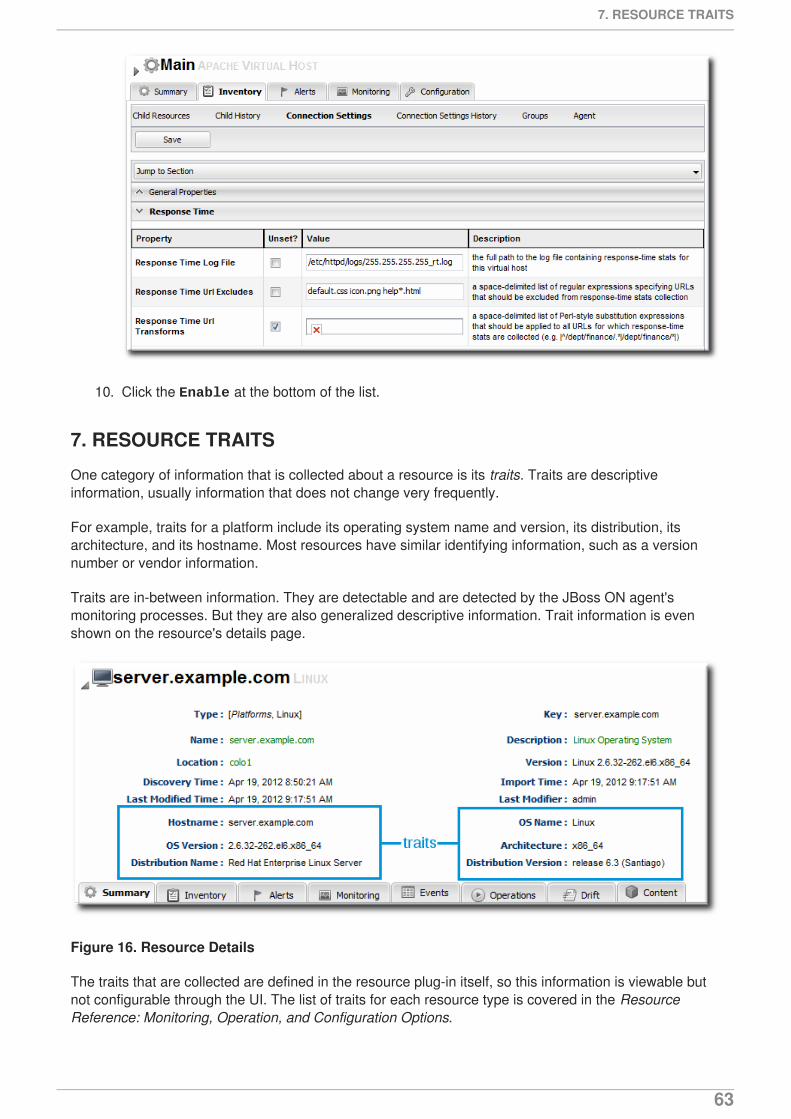
10. Click the Enable at the bottom of the list.
7. RESOURCE TRAITS
One category of information that is collected about a resource is its traits. Traits are descriptiveinformation, usually information that does not change very frequently.
For example, traits for a platform include its operating system name and version, its distribution, itsarchitecture, and its hostname. Most resources have similar identifying information, such as a versionnumber or vendor information.
Traits are in-between information. They are detectable and are detected by the JBoss ON agent'smonitoring processes. But they are also generalized descriptive information. Trait information is evenshown on the resource's details page.
Figure 16. Resource Details
The traits that are collected are defined in the resource plug-in itself, so this information is viewable butnot configurable through the UI. The list of traits for each resource type is covered in the ResourceReference: Monitoring, Operation, and Configuration Options.
7. RESOURCE TRAITS
63
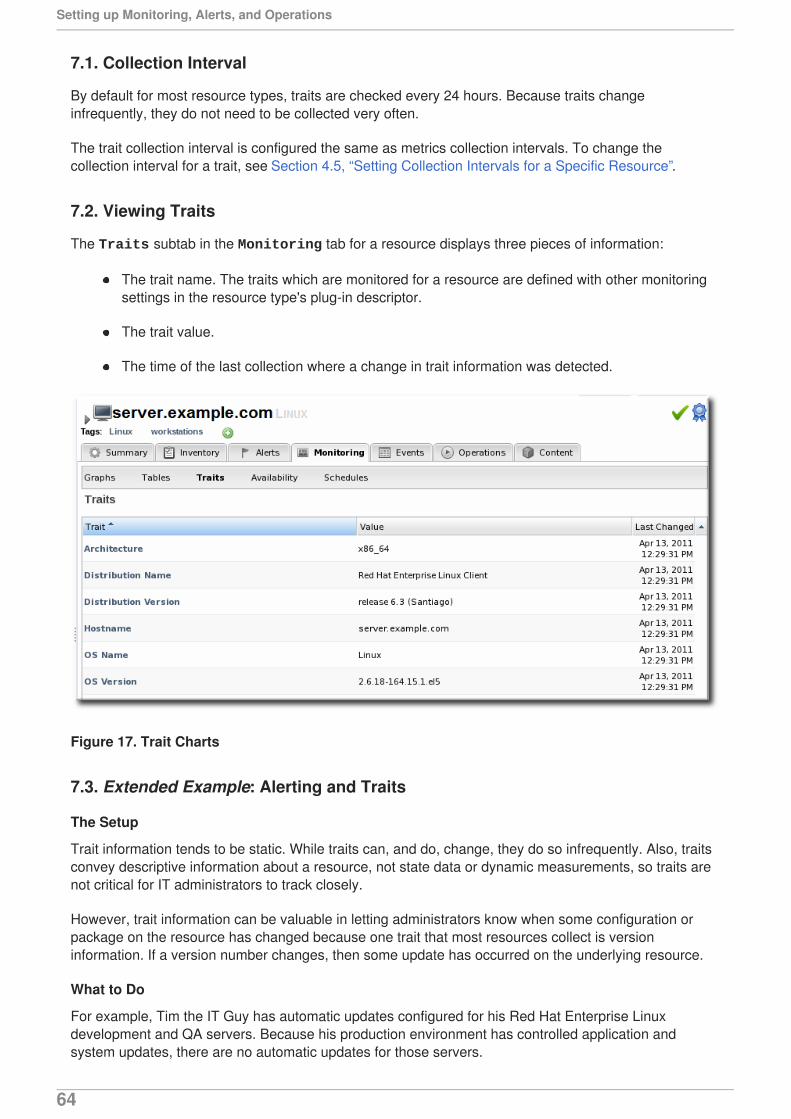
7.1. Collection Interval
By default for most resource types, traits are checked every 24 hours. Because traits changeinfrequently, they do not need to be collected very often.
The trait collection interval is configured the same as metrics collection intervals. To change thecollection interval for a trait, see Section 4.5, “Setting Collection Intervals for a Specific Resource”.
7.2. Viewing Traits
The Traits subtab in the Monitoring tab for a resource displays three pieces of information:
The trait name. The traits which are monitored for a resource are defined with other monitoringsettings in the resource type's plug-in descriptor.
The trait value.
The time of the last collection where a change in trait information was detected.
Figure 17. Trait Charts
7.3. Extended Example: Alerting and Traits
The Setup
Trait information tends to be static. While traits can, and do, change, they do so infrequently. Also, traitsconvey descriptive information about a resource, not state data or dynamic measurements, so traits arenot critical for IT administrators to track closely.
However, trait information can be valuable in letting administrators know when some configuration orpackage on the resource has changed because one trait that most resources collect is versioninformation. If a version number changes, then some update has occurred on the underlying resource.
What to Do
For example, Tim the IT Guy has automatic updates configured for his Red Hat Enterprise Linuxdevelopment and QA servers. Because his production environment has controlled application andsystem updates, there are no automatic updates for those servers.
Setting up Monitoring, Alerts, and Operations
64
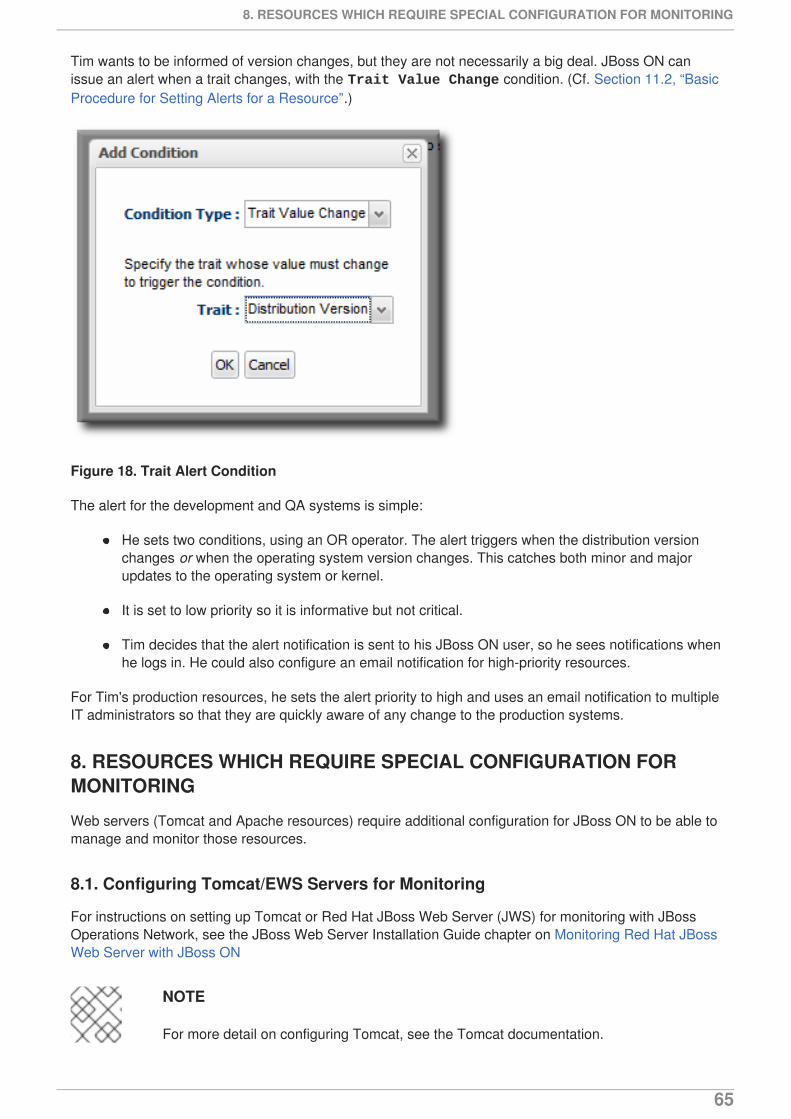
Tim wants to be informed of version changes, but they are not necessarily a big deal. JBoss ON canissue an alert when a trait changes, with the Trait Value Change condition. (Cf. Section 11.2, “BasicProcedure for Setting Alerts for a Resource”.)
Figure 18. Trait Alert Condition
The alert for the development and QA systems is simple:
He sets two conditions, using an OR operator. The alert triggers when the distribution versionchanges or when the operating system version changes. This catches both minor and majorupdates to the operating system or kernel.
It is set to low priority so it is informative but not critical.
Tim decides that the alert notification is sent to his JBoss ON user, so he sees notifications whenhe logs in. He could also configure an email notification for high-priority resources.
For Tim's production resources, he sets the alert priority to high and uses an email notification to multipleIT administrators so that they are quickly aware of any change to the production systems.
8. RESOURCES WHICH REQUIRE SPECIAL CONFIGURATION FORMONITORING
Web servers (Tomcat and Apache resources) require additional configuration for JBoss ON to be able tomanage and monitor those resources.
8.1. Configuring Tomcat/EWS Servers for Monitoring
For instructions on setting up Tomcat or Red Hat JBoss Web Server (JWS) for monitoring with JBossOperations Network, see the JBoss Web Server Installation Guide chapter on Monitoring Red Hat JBossWeb Server with JBoss ON
NOTE
For more detail on configuring Tomcat, see the Tomcat documentation.
8. RESOURCES WHICH REQUIRE SPECIAL CONFIGURATION FOR MONITORING
65
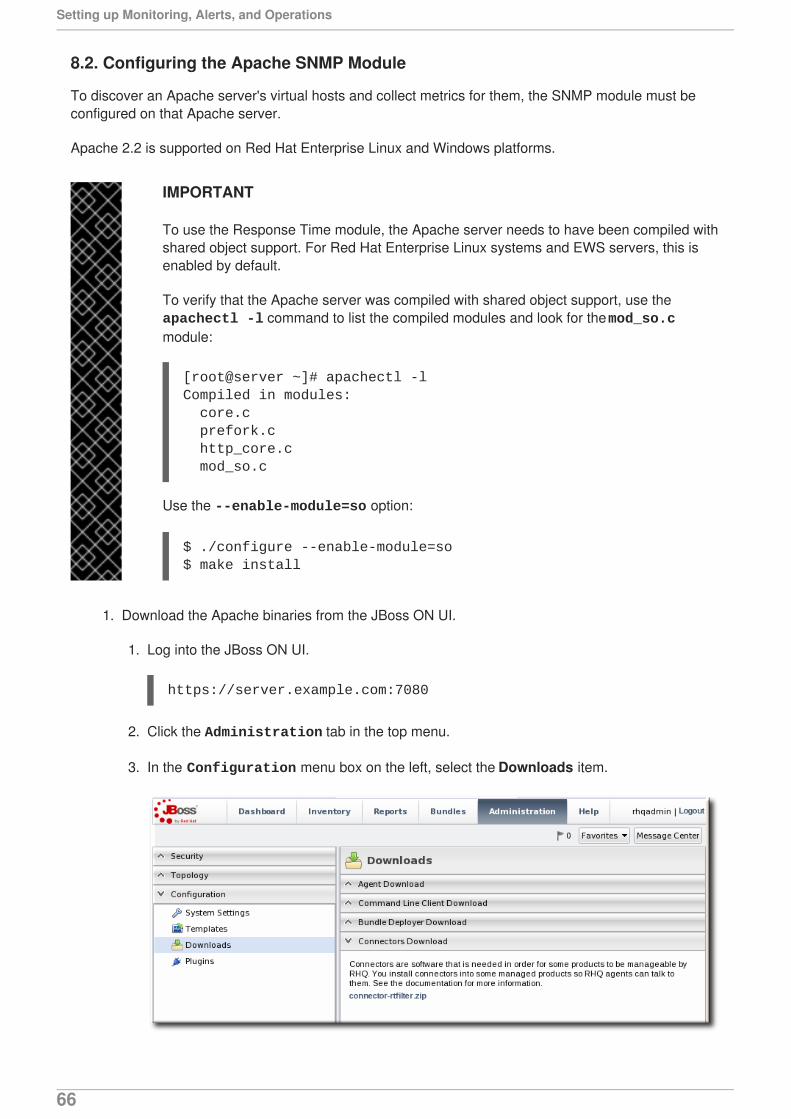
8.2. Configuring the Apache SNMP Module
To discover an Apache server's virtual hosts and collect metrics for them, the SNMP module must beconfigured on that Apache server.
Apache 2.2 is supported on Red Hat Enterprise Linux and Windows platforms.
IMPORTANT
To use the Response Time module, the Apache server needs to have been compiled withshared object support. For Red Hat Enterprise Linux systems and EWS servers, this isenabled by default.
To verify that the Apache server was compiled with shared object support, use the apachectl -l command to list the compiled modules and look for the mod_so.cmodule:
[root@server ~]# apachectl -lCompiled in modules: core.c prefork.c http_core.c mod_so.c
Use the --enable-module=so option:
$ ./configure --enable-module=so$ make install
1. Download the Apache binaries from the JBoss ON UI.
1. Log into the JBoss ON UI.
https://server.example.com:7080
2. Click the Administration tab in the top menu.
3. In the Configuration menu box on the left, select the Downloads item.
Setting up Monitoring, Alerts, and Operations
66
4. Scroll to Connector Downloads, and click the connector-apache.zip link todownload the Apache connectors.
2. Unzip the Apache connectors in a directory that is accessible to the JBoss ON agent.
unzip connector-apache.zip
3. Each Apache version and platform has its own package that contains the Apache-SNMPconnectors. Extract the Apache connectors in a directory that is accessible to the JBoss ONagent. Binaries are available for Red Hat Enterprise Linux 32-bit and 64-bit and Windows 32-bit.
For example, on Red Hat Enterprise Linux 32-bit:
[jsmith@server ~]$ cd apacheModuleRoot/apache-snmp/binaries/[jsmith@server binaries]$ tar xjvf snmp_module-x86-linux-apache#.tar.bz2
# is the Apache server version number.
NOTE
Apache connectors can be compiled for other platforms, like Solaris, from thesource files in apacheRoot/apache-snmp/binaries/sources. Forexample:
[jsmith@server ~]$ cd JON_AGENT_INSTALL_DIR/product_connectors/apache-snmp/sources[jsmith@server sources]$ ./build_apache_snmp.sh APACHE_VERSION APACHE_2.x_INSTALL_DIR/bin/apxs
To compile the Apache-SNMP connector, apxs, perl, make, and automakemust all be installed and in user PATH.
4. Install the module. For example:
[root@server ~]# cd apacheModuleRoot/apache-snmp/binaries/snmp_module_# [root@server snmp_module]# cp module/* apache_install_directory/modules
[root@server snmp_module]# cp conf/* apache_install_directory/conf
[root@server snmp_module]# mkdir apache_install_directory/var
On Windows:
> xcopy /e JON_AGENT_INSTALL_DIR\product_connectors\apache-snmp\binaries\x86
5. Open the httpd.conf file for editing. For example:
8. RESOURCES WHICH REQUIRE SPECIAL CONFIGURATION FOR MONITORING
67
[root@server ~]# vim apache_install_directory/conf/httpd.conf
6. Enable the module by adding these lines to the httpd.conf file.
LoadModule snmpcommon_module modules/libsnmpcommon.soLoadModule snmpagt_module modules/libsnmpmonagt.so SNMPConf confSNMPVar var
For Windows:
LoadModule snmpcommon_module modules/snmpcommon.soLoadModule snmpagt_module modules/snmpmonagt.so SNMPConf confSNMPVar var
7. Make sure the main Apache configuration section, as well as each <VirtualHost>configuration block, contains a ServerName directive with a port. The SNMP module uses thisdirective to uniquely identify the main server and each virtual host, so each ServerNamedirective must contain a unique value. For example:
ServerName main.example.com:80... <VirtualHost vhost1.example.com:80>ServerName vhost1.example.com:80...</VirtualHost>
8. If there is more than one Apache instance on the same machine, it is possible to use differentSNMP files for each instance.
1. Each Apache instance has its own httpd.conf file. Set the SNMPConf directory in eachfile to its own SNMP configuration directory. For example, for instance1:
vim instance1-httpd.conf
SNMPConf /opt/apache-instance1/conf
Then, for instance2:
vim instance2-httpd.conf
SNMPConf /opt/apache-instance2/conf
Each snmpd.conf file should be in the specified directory.
2. Edit the agentaddress property in apache_install_directory/conf/snmpd.conf so thateach instance has a different value agent address and port, so there is no conflict betweeninstances.
Setting up Monitoring, Alerts, and Operations
68
See the snmpd.conf documentation for a description of this property's syntax.
9. Restart the Apache server. For example:
apachectl -k restart
10. Verify that the SNMP module was properly installed. If the module is loaded, then there will belines referencing the SNMP module in the errors log:
grep SNMP apache_installation_dir/logs/error_log
[Wed Mar 19 09:54:34 2008] [notice] Apache/2.0.63 (Unix) CovalentSNMP/2.3.0 configured -- resuming normal operations[Wed Mar 19 09:54:35 2008] [notice] SNMP: CovalentSNMP/2.3.0 started (user '1000' - SNMP address '1610' - pid '26738')
8.3. Metrics Collection Considerations with Apache and SNMP
Three metrics show values of zero when monitoring an Apache instance with the SNMP module:
Bytes received for GET requests per minute
Bytes received for POST requests per minute
Total number of bytes received per minute
This is because of how SNMP interprets information from the request body. First, SNMP providesvarious length values for the request body and a GET request does not have a body, so GET responsesare not calculated and, therefore, have a value of zero. Second, Apache does not calculate a requestbody size if there is request chunking.
9. REPORTS AND DATA
Monitoring information in JBoss ON is easy to find. Resources and groups both have dashboards whichcontain snapshot views of the most recent metrics values and a series of graphs and tables which breakdown the different metrics values over a given time window.
Monitoring information is available in several areas:
Dashboards with metrics portlets for individual resources, compatible groups, and the maindashboard
Timelines, which aggregate all collected data, events, configuration, operations, and otherchanges for a resource
Resource-level charts and tables for metrics
A Suspect Metrics report
9.1. Dashboards and Portlets
The fastest place to view monitoring and alerting information is through one of the JBoss ON dashboards.The dashboards collect almost all monitoring, event, alert, and operations data into a single location.
9. REPORTS AND DATA
69
Each data set is collected in a separate box or portlets displayed in the dashboard. These portlets canbe edited, added, and removed from the dashboards; this is covered in the Admin: Initial Setup for theResource Inventory, Groups, and Users.
9.1.1. Resource-Level Dashboards
The Summary > Activity tab for an individual resource (or compatible group) shows a snapshot of allrecent actions on the resource, such as new packages and content, inventory changes, events,operations, and alerts. There is also a portlet that displays the most recent detected value of the primarymetrics for the resource.
Setting up Monitoring, Alerts, and Operations
70
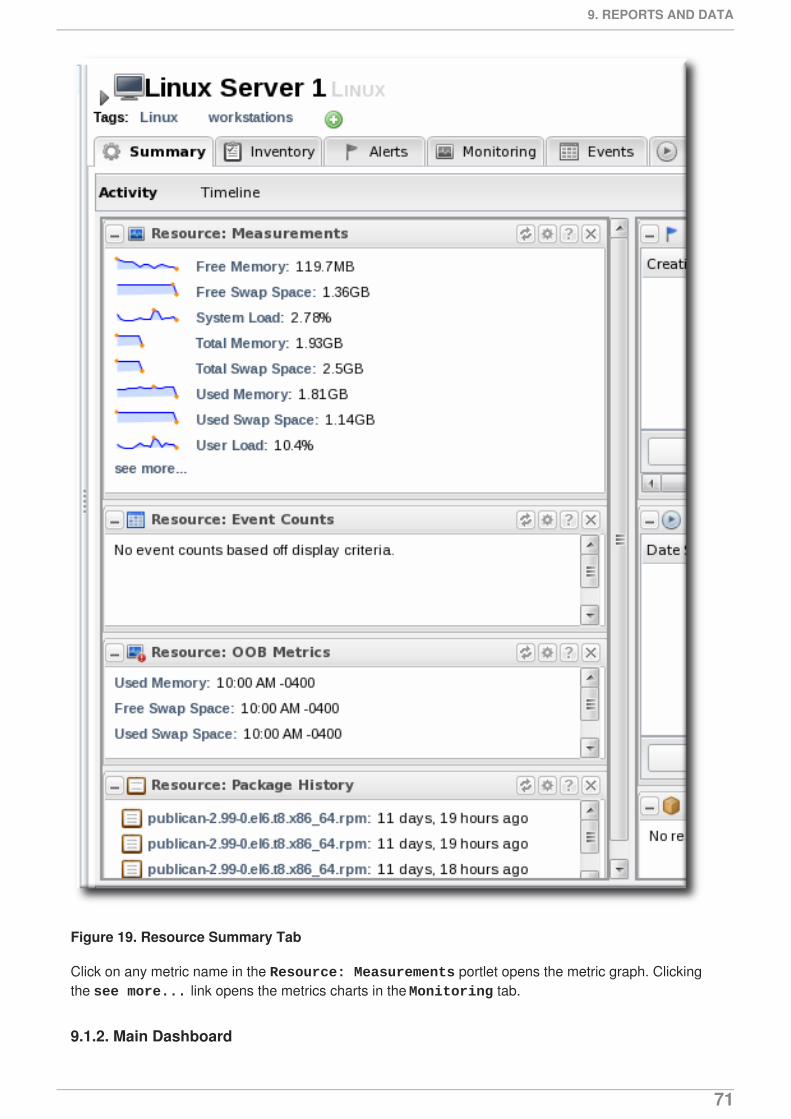
Figure 19. Resource Summary Tab
Click on any metric name in the Resource: Measurements portlet opens the metric graph. Clickingthe see more... link opens the metrics charts in the Monitoring tab.
9.1.2. Main Dashboard
9. REPORTS AND DATA
71
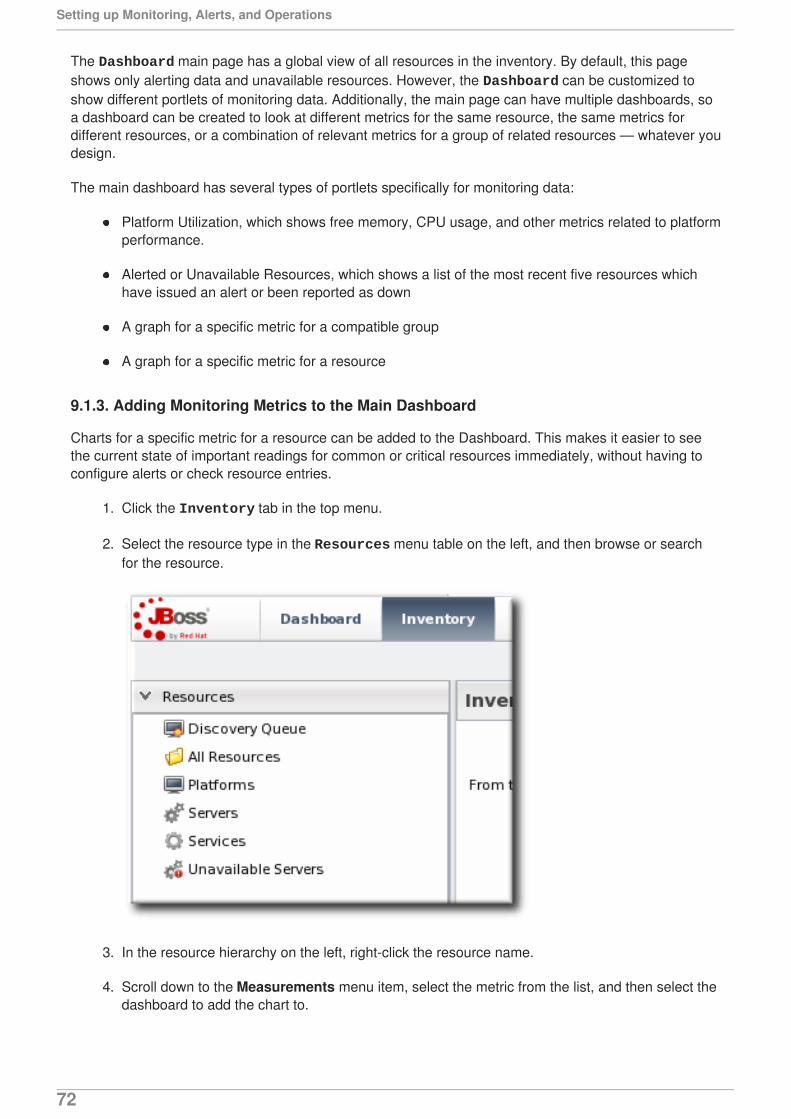
The Dashboard main page has a global view of all resources in the inventory. By default, this pageshows only alerting data and unavailable resources. However, the Dashboard can be customized toshow different portlets of monitoring data. Additionally, the main page can have multiple dashboards, soa dashboard can be created to look at different metrics for the same resource, the same metrics fordifferent resources, or a combination of relevant metrics for a group of related resources — whatever youdesign.
The main dashboard has several types of portlets specifically for monitoring data:
Platform Utilization, which shows free memory, CPU usage, and other metrics related to platformperformance.
Alerted or Unavailable Resources, which shows a list of the most recent five resources whichhave issued an alert or been reported as down
A graph for a specific metric for a compatible group
A graph for a specific metric for a resource
9.1.3. Adding Monitoring Metrics to the Main Dashboard
Charts for a specific metric for a resource can be added to the Dashboard. This makes it easier to seethe current state of important readings for common or critical resources immediately, without having toconfigure alerts or check resource entries.
1. Click the Inventory tab in the top menu.
2. Select the resource type in the Resources menu table on the left, and then browse or searchfor the resource.
3. In the resource hierarchy on the left, right-click the resource name.
4. Scroll down to the Measurements menu item, select the metric from the list, and then select thedashboard to add the chart to.
Setting up Monitoring, Alerts, and Operations
72
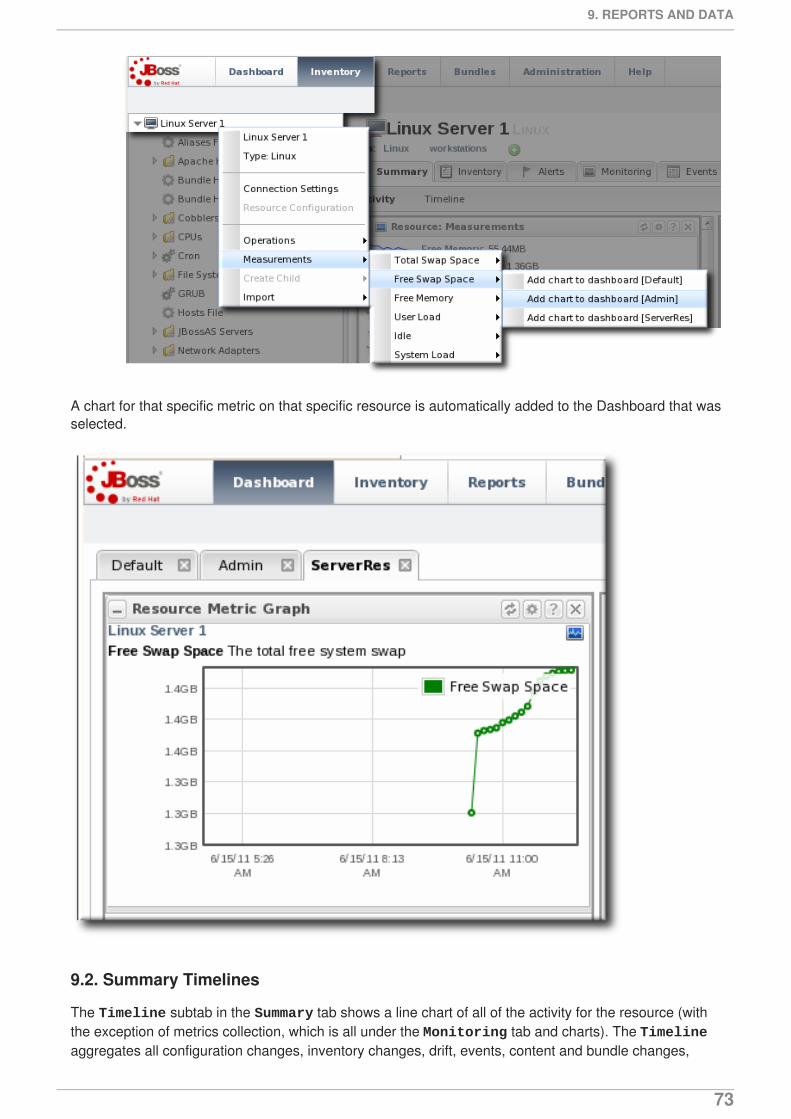
A chart for that specific metric on that specific resource is automatically added to the Dashboard that wasselected.
9.2. Summary Timelines
The Timeline subtab in the Summary tab shows a line chart of all of the activity for the resource (withthe exception of metrics collection, which is all under the Monitoring tab and charts). The Timelineaggregates all configuration changes, inventory changes, drift, events, content and bundle changes,
9. REPORTS AND DATA
73
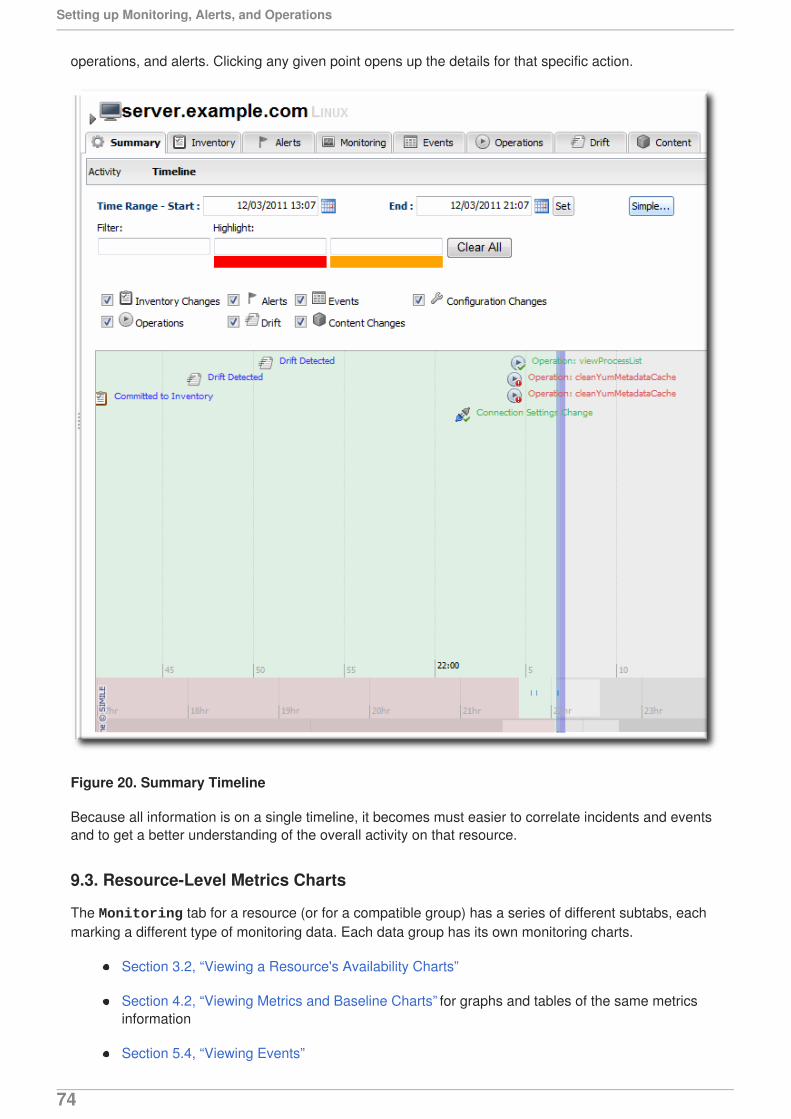
operations, and alerts. Clicking any given point opens up the details for that specific action.
Figure 20. Summary Timeline
Because all information is on a single timeline, it becomes must easier to correlate incidents and eventsand to get a better understanding of the overall activity on that resource.
9.3. Resource-Level Metrics Charts
The Monitoring tab for a resource (or for a compatible group) has a series of different subtabs, eachmarking a different type of monitoring data. Each data group has its own monitoring charts.
Section 3.2, “Viewing a Resource's Availability Charts”
Section 4.2, “Viewing Metrics and Baseline Charts” for graphs and tables of the same metricsinformation
Section 5.4, “Viewing Events”
Setting up Monitoring, Alerts, and Operations
74
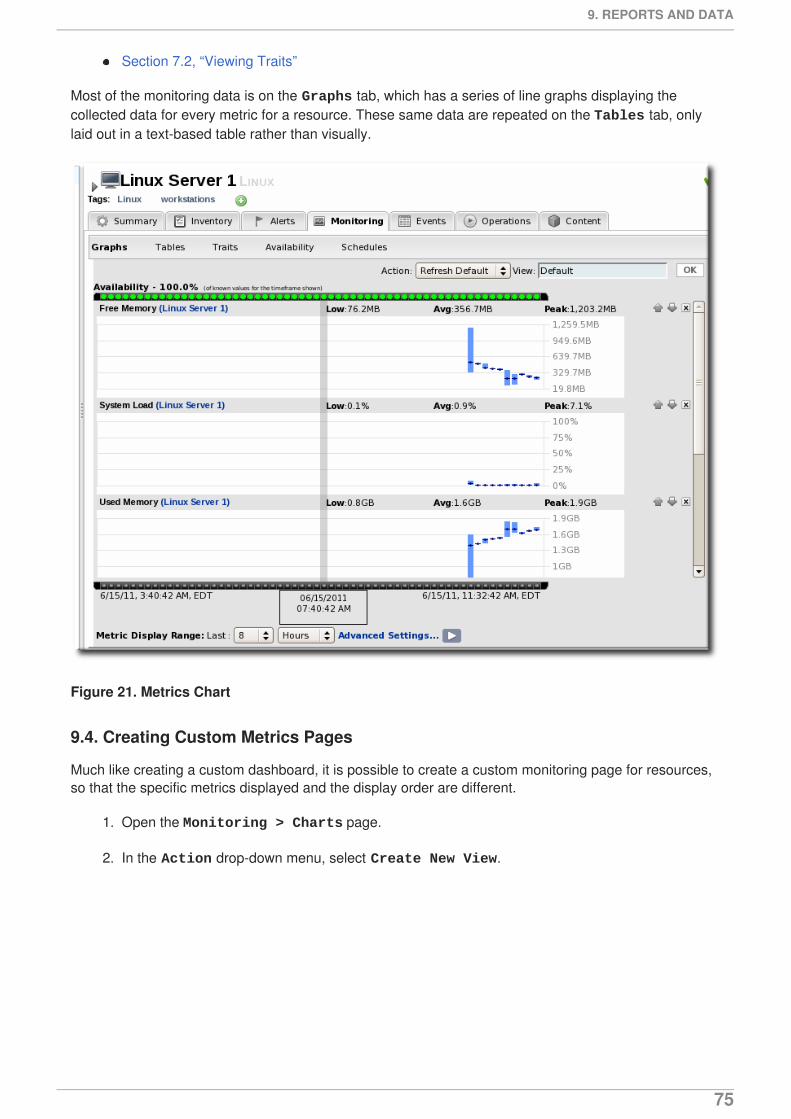
Section 7.2, “Viewing Traits”
Most of the monitoring data is on the Graphs tab, which has a series of line graphs displaying thecollected data for every metric for a resource. These same data are repeated on the Tables tab, onlylaid out in a text-based table rather than visually.
Figure 21. Metrics Chart
9.4. Creating Custom Metrics Pages
Much like creating a custom dashboard, it is possible to create a custom monitoring page for resources,so that the specific metrics displayed and the display order are different.
1. Open the Monitoring > Charts page.
2. In the Action drop-down menu, select Create New View.
9. REPORTS AND DATA
75
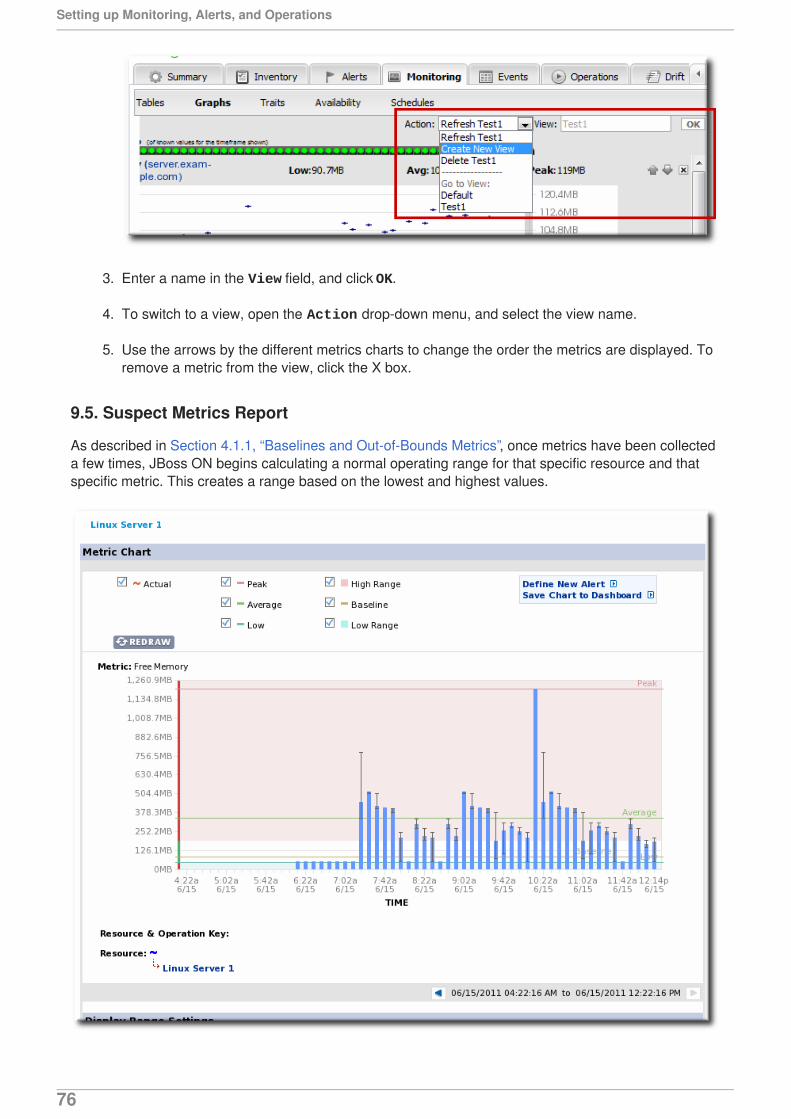
3. Enter a name in the View field, and click OK.
4. To switch to a view, open the Action drop-down menu, and select the view name.
5. Use the arrows by the different metrics charts to change the order the metrics are displayed. Toremove a metric from the view, click the X box.
9.5. Suspect Metrics Report
As described in Section 4.1.1, “Baselines and Out-of-Bounds Metrics”, once metrics have been collecteda few times, JBoss ON begins calculating a normal operating range for that specific resource and thatspecific metric. This creates a range based on the lowest and highest values.
Setting up Monitoring, Alerts, and Operations
76
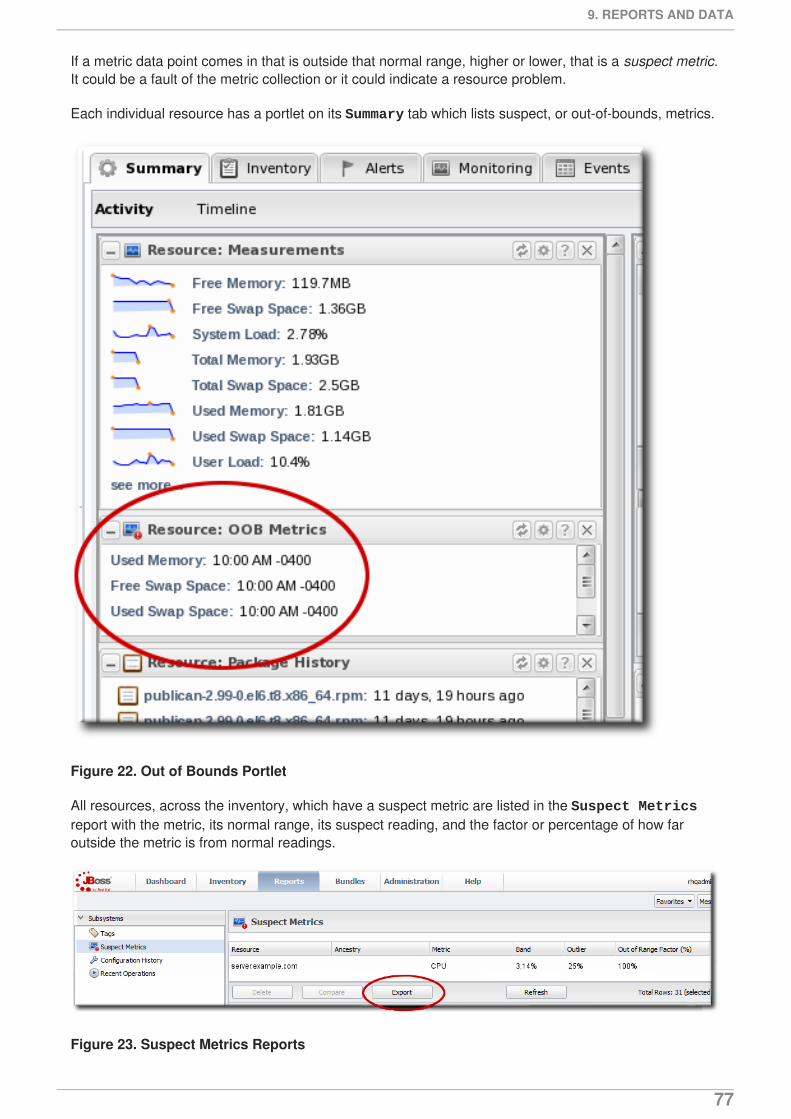
If a metric data point comes in that is outside that normal range, higher or lower, that is a suspect metric.It could be a fault of the metric collection or it could indicate a resource problem.
Each individual resource has a portlet on its Summary tab which lists suspect, or out-of-bounds, metrics.
Figure 22. Out of Bounds Portlet
All resources, across the inventory, which have a suspect metric are listed in the Suspect Metricsreport with the metric, its normal range, its suspect reading, and the factor or percentage of how faroutside the metric is from normal readings.
Figure 23. Suspect Metrics Reports
9. REPORTS AND DATA
77
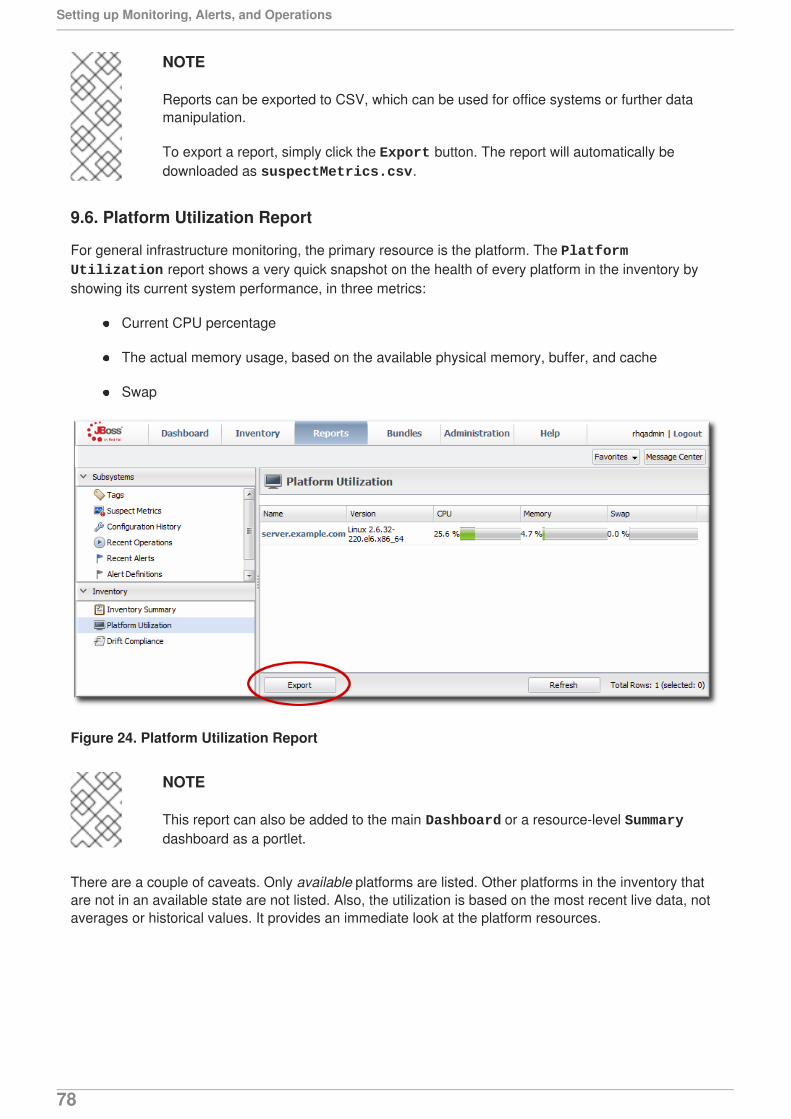
NOTE
Reports can be exported to CSV, which can be used for office systems or further datamanipulation.
To export a report, simply click the Export button. The report will automatically bedownloaded as suspectMetrics.csv.
9.6. Platform Utilization Report
For general infrastructure monitoring, the primary resource is the platform. The Platform Utilization report shows a very quick snapshot on the health of every platform in the inventory byshowing its current system performance, in three metrics:
Current CPU percentage
The actual memory usage, based on the available physical memory, buffer, and cache
Swap
Figure 24. Platform Utilization Report
NOTE
This report can also be added to the main Dashboard or a resource-level Summarydashboard as a portlet.
There are a couple of caveats. Only available platforms are listed. Other platforms in the inventory thatare not in an available state are not listed. Also, the utilization is based on the most recent live data, notaverages or historical values. It provides an immediate look at the platform resources.
Setting up Monitoring, Alerts, and Operations
78
NOTE
Reports can be exported to CSV, which can be used for office systems or further datamanipulation.
To export a report, simply click the Export button. The report will automatically bedownloaded as platformUtilization.csv.
10. STORING MONITORING DATA
JBoss ON monitoring information reveals both current measurements and historical trends and averages.JBoss ON stores data in a kind of cascade, where raw data are aggregated and compressed on aschedule. This preserves the trends of data without inflating the size of the monitoring data. Data arehandled like this:
Raw metrics are collected every few minutes and are aggregated in a rolling average in one-hour windows to produce minimum, average, and maximum values.
One-hour values are combined and averaged in six-hour periods.
Six-hour periods are combined and aggregated into 24-hour (1 day) windows.
10.1. Changing Storage Lengths
The raw measurements, six-hour periods, and 24-hour periods are preserved in the JBoss ON databasefor a configurable amount of time, ranging from one week for raw measurements to one year for 24-houraggregates.
NOTE
The storage size of raw metrics can grow very quickly. Be careful when adjusting thestorage time of raw metrics to account for the size of your database and the number andfrequency of all metrics collected across your inventory.
If you need to store raw data for long periods, consider exporting the raw data from thedatabase and archiving it separately.
To change the amount of time that monitoring data are stored:
1. In the System Configuration menu, select the Settings item.
10. STORING MONITORING DATA
79
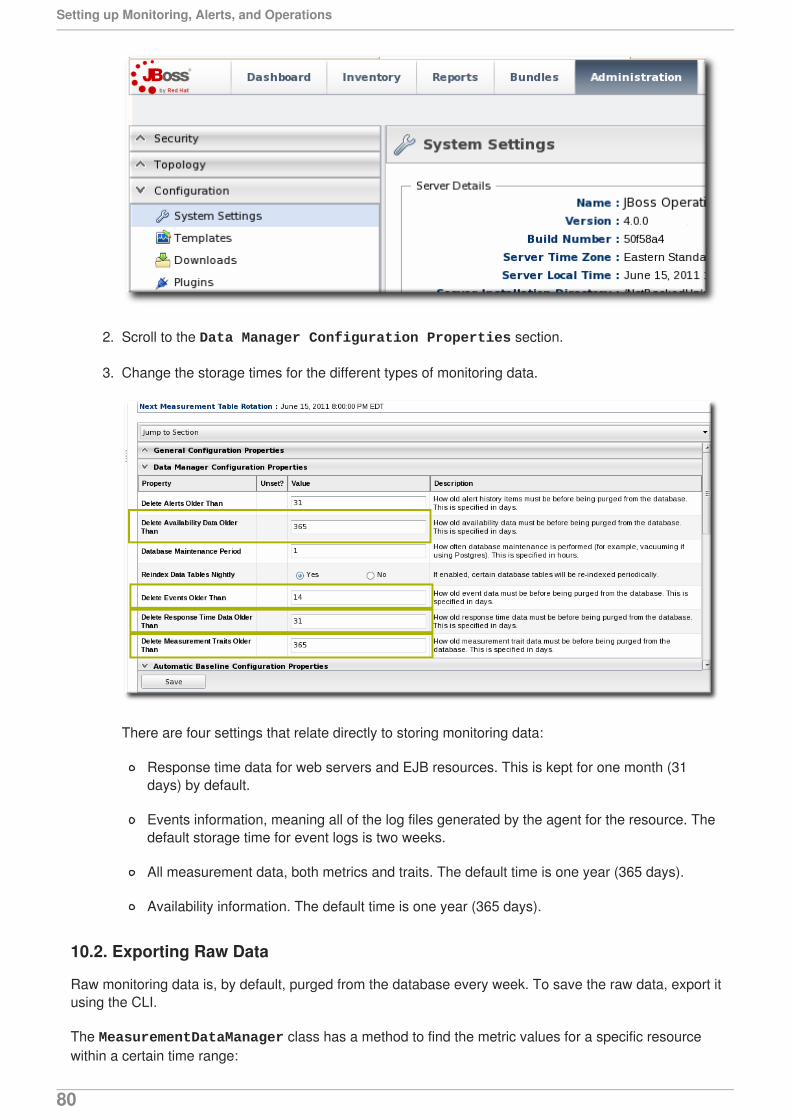
2. Scroll to the Data Manager Configuration Properties section.
3. Change the storage times for the different types of monitoring data.
There are four settings that relate directly to storing monitoring data:
Response time data for web servers and EJB resources. This is kept for one month (31days) by default.
Events information, meaning all of the log files generated by the agent for the resource. Thedefault storage time for event logs is two weeks.
All measurement data, both metrics and traits. The default time is one year (365 days).
Availability information. The default time is one year (365 days).
10.2. Exporting Raw Data
Raw monitoring data is, by default, purged from the database every week. To save the raw data, export itusing the CLI.
The MeasurementDataManager class has a method to find the metric values for a specific resourcewithin a certain time range:
Setting up Monitoring, Alerts, and Operations
80
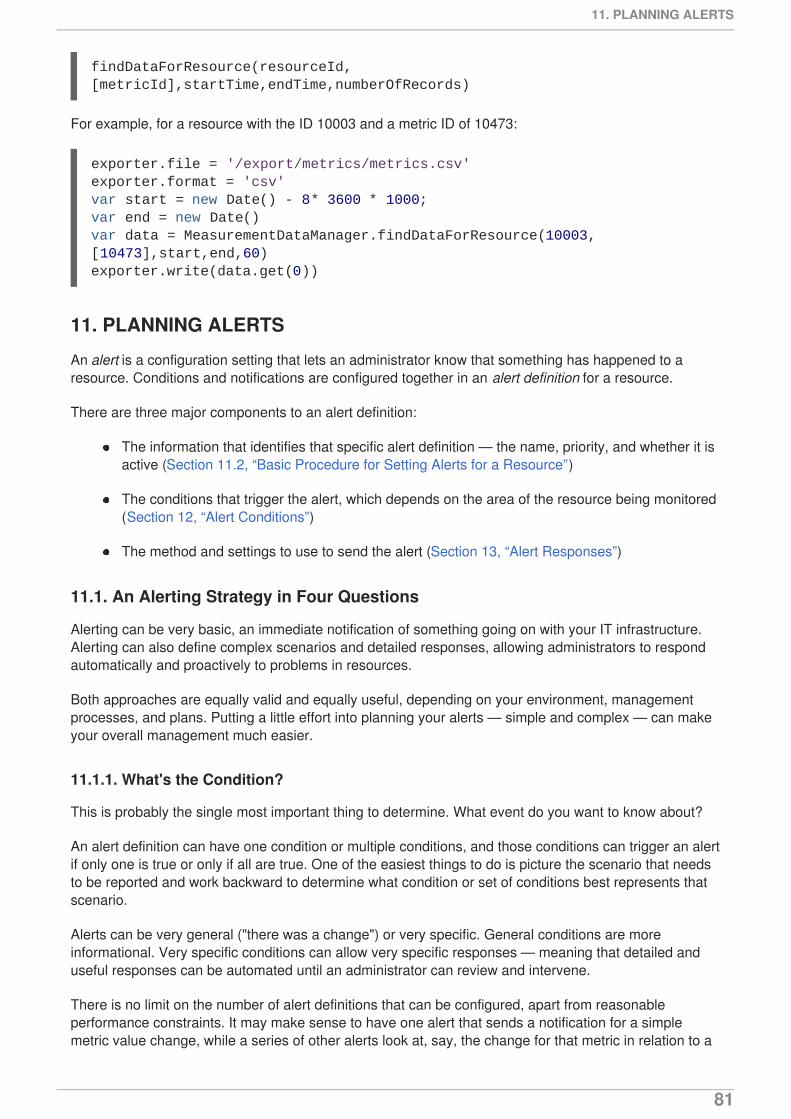
findDataForResource(resourceId,[metricId],startTime,endTime,numberOfRecords)
For example, for a resource with the ID 10003 and a metric ID of 10473:
11. PLANNING ALERTS
An alert is a configuration setting that lets an administrator know that something has happened to aresource. Conditions and notifications are configured together in an alert definition for a resource.
There are three major components to an alert definition:
The information that identifies that specific alert definition — the name, priority, and whether it isactive (Section 11.2, “Basic Procedure for Setting Alerts for a Resource”)
The conditions that trigger the alert, which depends on the area of the resource being monitored(Section 12, “Alert Conditions”)
The method and settings to use to send the alert (Section 13, “Alert Responses”)
11.1. An Alerting Strategy in Four Questions
Alerting can be very basic, an immediate notification of something going on with your IT infrastructure.Alerting can also define complex scenarios and detailed responses, allowing administrators to respondautomatically and proactively to problems in resources.
Both approaches are equally valid and equally useful, depending on your environment, managementprocesses, and plans. Putting a little effort into planning your alerts — simple and complex — can makeyour overall management much easier.
11.1.1. What's the Condition?
This is probably the single most important thing to determine. What event do you want to know about?
An alert definition can have one condition or multiple conditions, and those conditions can trigger an alertif only one is true or only if all are true. One of the easiest things to do is picture the scenario that needsto be reported and work backward to determine what condition or set of conditions best represents thatscenario.
Alerts can be very general ("there was a change") or very specific. General conditions are moreinformational. Very specific conditions can allow very specific responses — meaning that detailed anduseful responses can be automated until an administrator can review and intervene.
There is no limit on the number of alert definitions that can be configured, apart from reasonableperformance constraints. It may make sense to have one alert that sends a notification for a simplemetric value change, while a series of other alerts look at, say, the change for that metric in relation to a
exporter.file = '/export/metrics/metrics.csv'exporter.format = 'csv'var start = new Date() - 8* 3600 * 1000;var end = new Date()var data = MeasurementDataManager.findDataForResource(10003,[10473],start,end,60)exporter.write(data.get(0))
11. PLANNING ALERTS
81
different metric, and then runs a certain JBoss ON CLI script depending on what other factors areinvolved.
11.1.2. What's the Frequency?
A condition can occur and recur, across multiple monitoring scans. How many times do you need to beinformed of the same condition?
There are a lot of factors to consider: what kind of response will be taken, what kind of audit trail youneed to keep, how common a condition is likely to be, and how long a condition may exist.
Some factors in the alert definition such as dampening rules and disable/recover alert settings throttlehow many notifications are sent.
One thing to remember is that an alert notification is every response that the JBoss ON server takeswhen an alert is triggered. It can be sending an email, posting a message in the UI, running a CLI script,or initiating an operation.
For common, relatively low-priority alerts, probably a single notification is sufficient, so dampening anddisable rules can be set to prevent spamming administrators with emails or flooding the recent alertsportlet.
For infrequent issues, critical failures, or high priority resources, the frequency of the alert notificationdepends on what actions you need to take. Informational alerts may sent for as along as the conditionpersists, while an alert with an aggressive response like running a CLI script may only be run once andthen disabled to prevent from repeatedly running the same script.
11.1.3. What's the Response to Take?
Responding to an alert has two phases: the immediate response and then long-term mitigation.
When an alert for a certain condition or event on your resource is fired, what is the very first thing thatshould happen? Should there be an email to an administrator? Should the JBoss ON server take someaction to manage the resource? JBoss ON supports SNMP traps, so should an SNMP notification besent to an external auditing/monitoring application?
Like conditions, there is no limit to the number of notifications that can be sent when an alert occurs.Multiple responses may make sense in some cases, where JBoss ON should email an administrator andrestart a resource can simultaneously.
Operations and CLI script allow administrators to automate responses, and particularly for business-critical systems, this allows JBoss ON to take an immediate action before an administrator may even beaware there is a problem.
Once an immediate action has been taken (either by JBoss ON or by an administrator), then theadministrator can acknowledge the alert, essentially dismissing it. That final step can be an importantprocedure, a way of stating that an administrator has reviewed the alert, identified what caused it, andfound a solution.
Having a way of reviewing and signing off on events — not just as a JBoss ON task, but in real life —establishes a reliable procedure for handling IT problems and improving overall maintenance strategies.
11.1.4. How Many Resources Does This Affect?
Alert definitions can be set for an individual resource, for a group of compatible resources, or for anentire resource type.
Setting up Monitoring, Alerts, and Operations
82
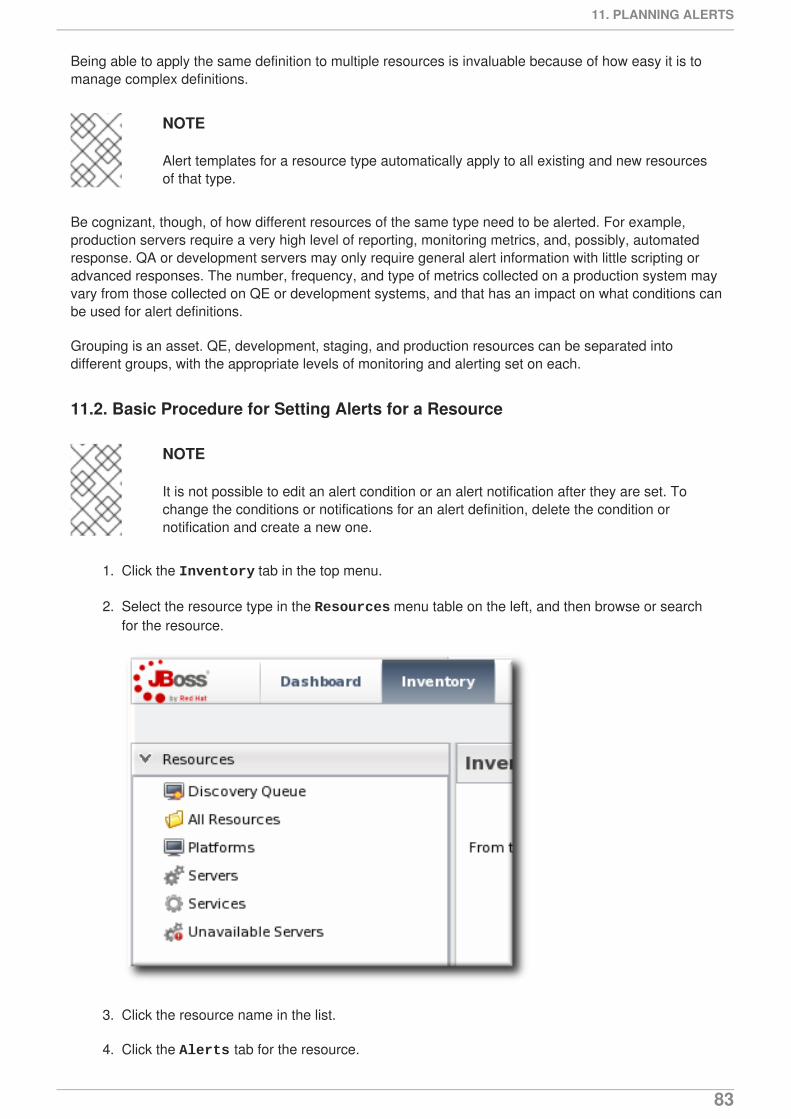
Being able to apply the same definition to multiple resources is invaluable because of how easy it is tomanage complex definitions.
NOTE
Alert templates for a resource type automatically apply to all existing and new resourcesof that type.
Be cognizant, though, of how different resources of the same type need to be alerted. For example,production servers require a very high level of reporting, monitoring metrics, and, possibly, automatedresponse. QA or development servers may only require general alert information with little scripting oradvanced responses. The number, frequency, and type of metrics collected on a production system mayvary from those collected on QE or development systems, and that has an impact on what conditions canbe used for alert definitions.
Grouping is an asset. QE, development, staging, and production resources can be separated intodifferent groups, with the appropriate levels of monitoring and alerting set on each.
11.2. Basic Procedure for Setting Alerts for a Resource
NOTE
It is not possible to edit an alert condition or an alert notification after they are set. Tochange the conditions or notifications for an alert definition, delete the condition ornotification and create a new one.
1. Click the Inventory tab in the top menu.
2. Select the resource type in the Resources menu table on the left, and then browse or searchfor the resource.
3. Click the resource name in the list.
4. Click the Alerts tab for the resource.
11. PLANNING ALERTS
83
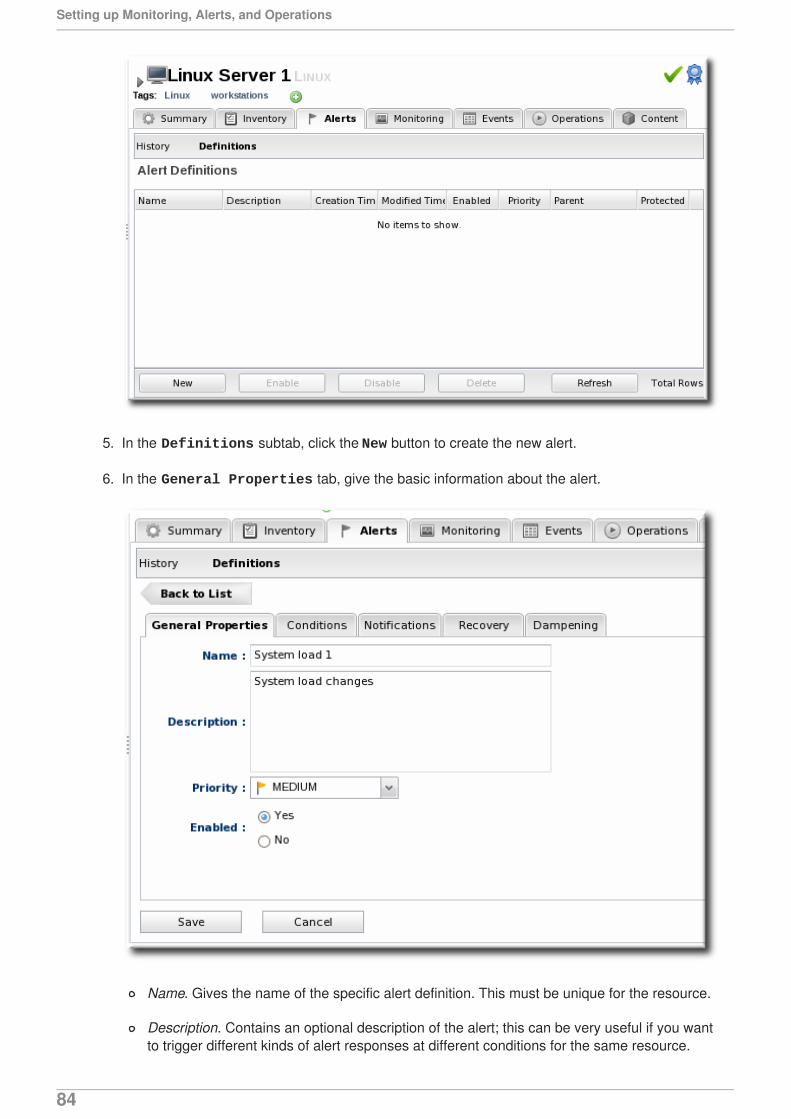
5. In the Definitions subtab, click the New button to create the new alert.
6. In the General Properties tab, give the basic information about the alert.
Name. Gives the name of the specific alert definition. This must be unique for the resource.
Description. Contains an optional description of the alert; this can be very useful if you wantto trigger different kinds of alert responses at different conditions for the same resource.
Setting up Monitoring, Alerts, and Operations
84
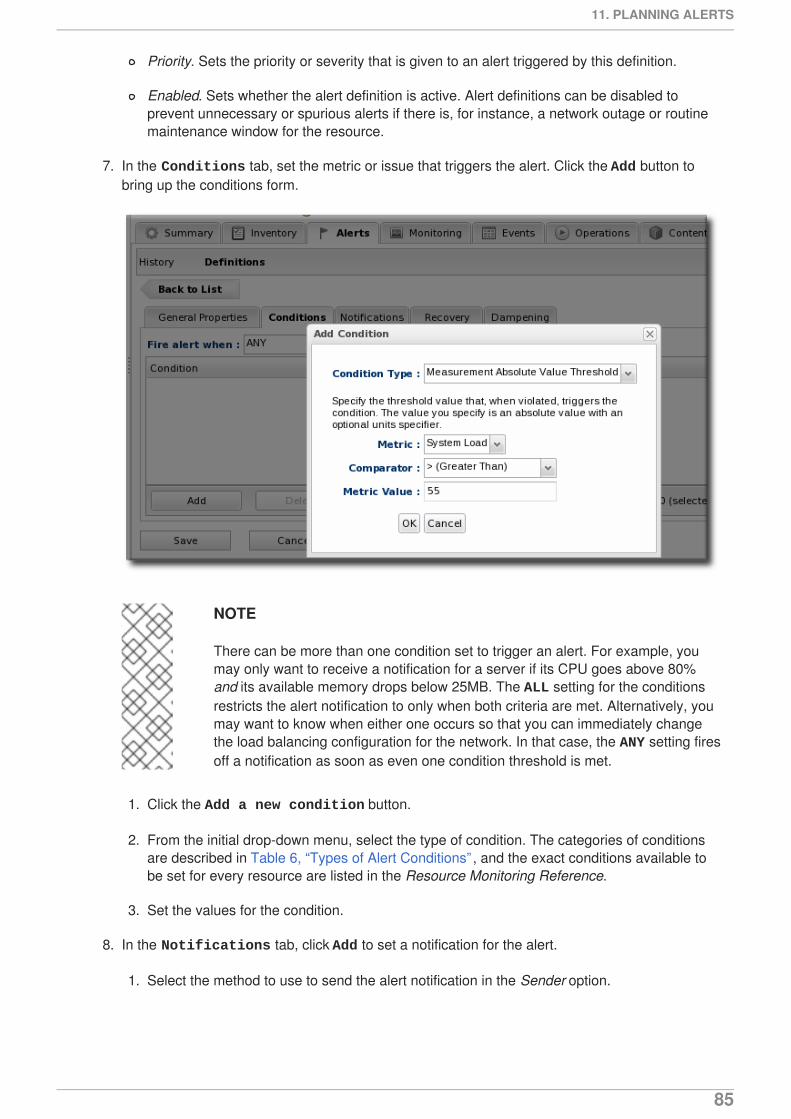
Priority. Sets the priority or severity that is given to an alert triggered by this definition.
Enabled. Sets whether the alert definition is active. Alert definitions can be disabled toprevent unnecessary or spurious alerts if there is, for instance, a network outage or routinemaintenance window for the resource.
7. In the Conditions tab, set the metric or issue that triggers the alert. Click the Add button tobring up the conditions form.
NOTE
There can be more than one condition set to trigger an alert. For example, youmay only want to receive a notification for a server if its CPU goes above 80%and its available memory drops below 25MB. The ALL setting for the conditionsrestricts the alert notification to only when both criteria are met. Alternatively, youmay want to know when either one occurs so that you can immediately changethe load balancing configuration for the network. In that case, the ANY setting firesoff a notification as soon as even one condition threshold is met.
1. Click the Add a new condition button.
2. From the initial drop-down menu, select the type of condition. The categories of conditionsare described in Table 6, “Types of Alert Conditions” , and the exact conditions available tobe set for every resource are listed in the Resource Monitoring Reference.
3. Set the values for the condition.
8. In the Notifications tab, click Add to set a notification for the alert.
1. Select the method to use to send the alert notification in the Sender option.
11. PLANNING ALERTS
85
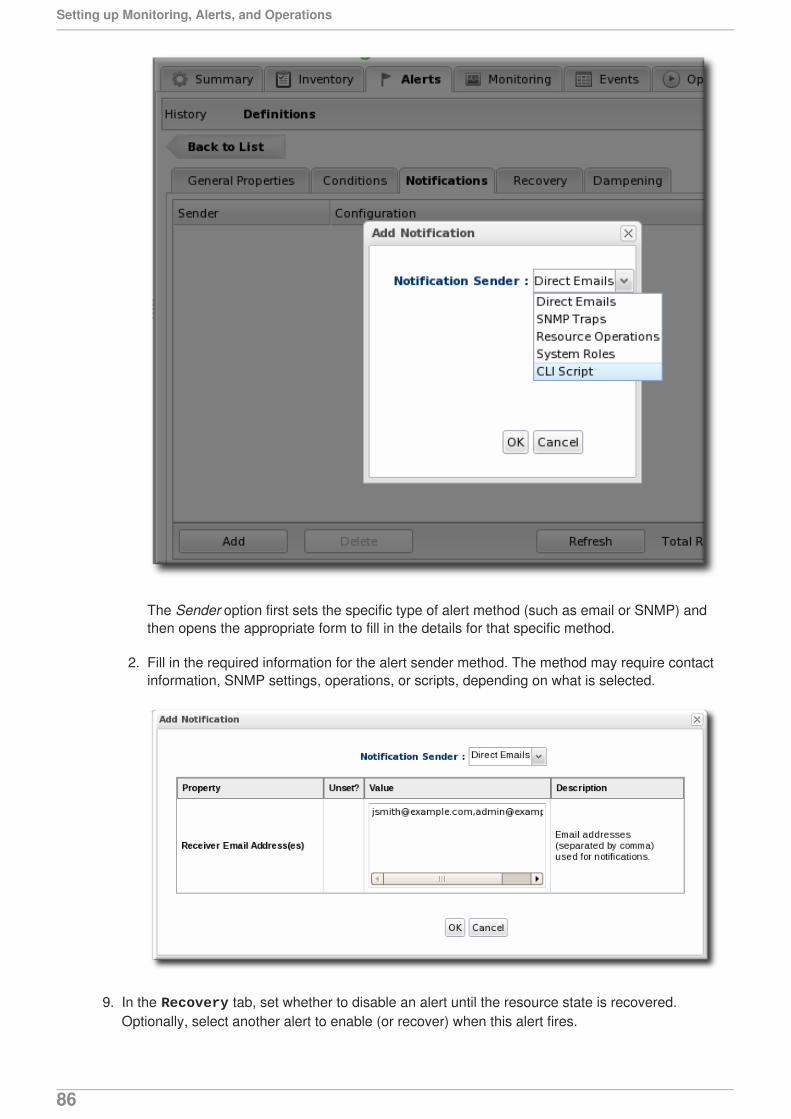
The Sender option first sets the specific type of alert method (such as email or SNMP) andthen opens the appropriate form to fill in the details for that specific method.
2. Fill in the required information for the alert sender method. The method may require contactinformation, SNMP settings, operations, or scripts, depending on what is selected.
9. In the Recovery tab, set whether to disable an alert until the resource state is recovered.Optionally, select another alert to enable (or recover) when this alert fires.
Setting up Monitoring, Alerts, and Operations
86
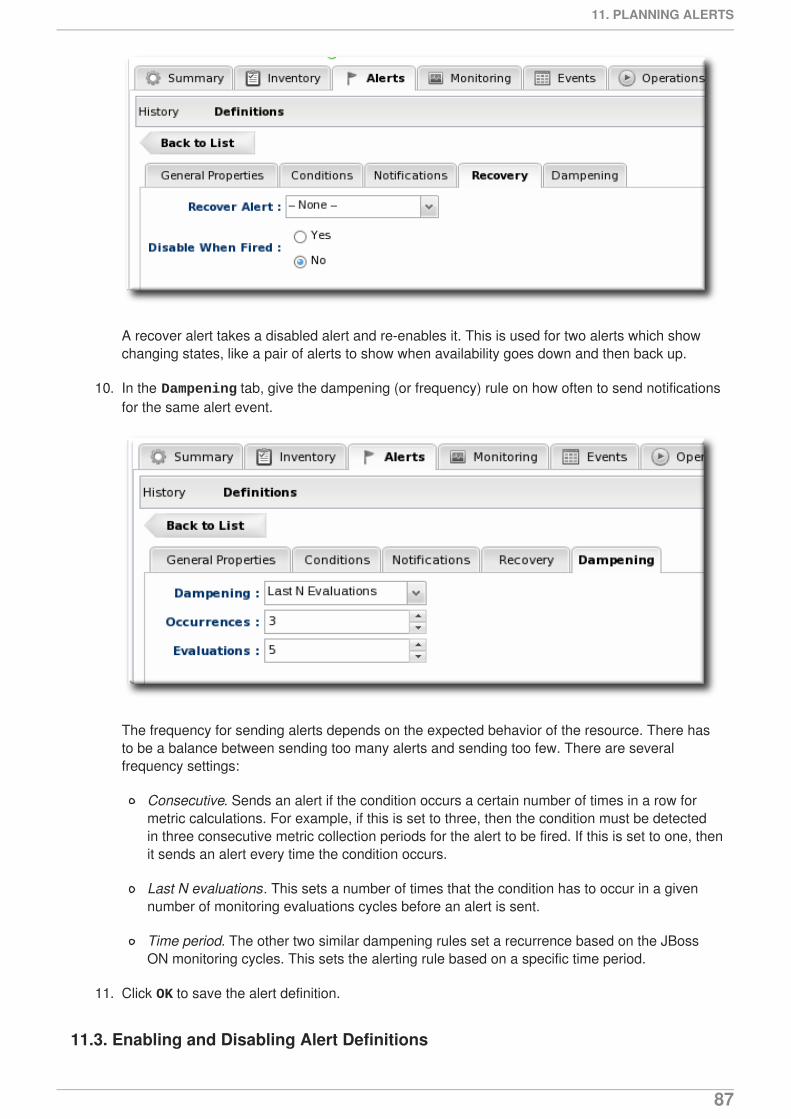
A recover alert takes a disabled alert and re-enables it. This is used for two alerts which showchanging states, like a pair of alerts to show when availability goes down and then back up.
10. In the Dampening tab, give the dampening (or frequency) rule on how often to send notificationsfor the same alert event.
The frequency for sending alerts depends on the expected behavior of the resource. There hasto be a balance between sending too many alerts and sending too few. There are severalfrequency settings:
Consecutive. Sends an alert if the condition occurs a certain number of times in a row formetric calculations. For example, if this is set to three, then the condition must be detectedin three consecutive metric collection periods for the alert to be fired. If this is set to one, thenit sends an alert every time the condition occurs.
Last N evaluations. This sets a number of times that the condition has to occur in a givennumber of monitoring evaluations cycles before an alert is sent.
Time period. The other two similar dampening rules set a recurrence based on the JBossON monitoring cycles. This sets the alerting rule based on a specific time period.
11. Click OK to save the alert definition.
11.3. Enabling and Disabling Alert Definitions
11. PLANNING ALERTS
87
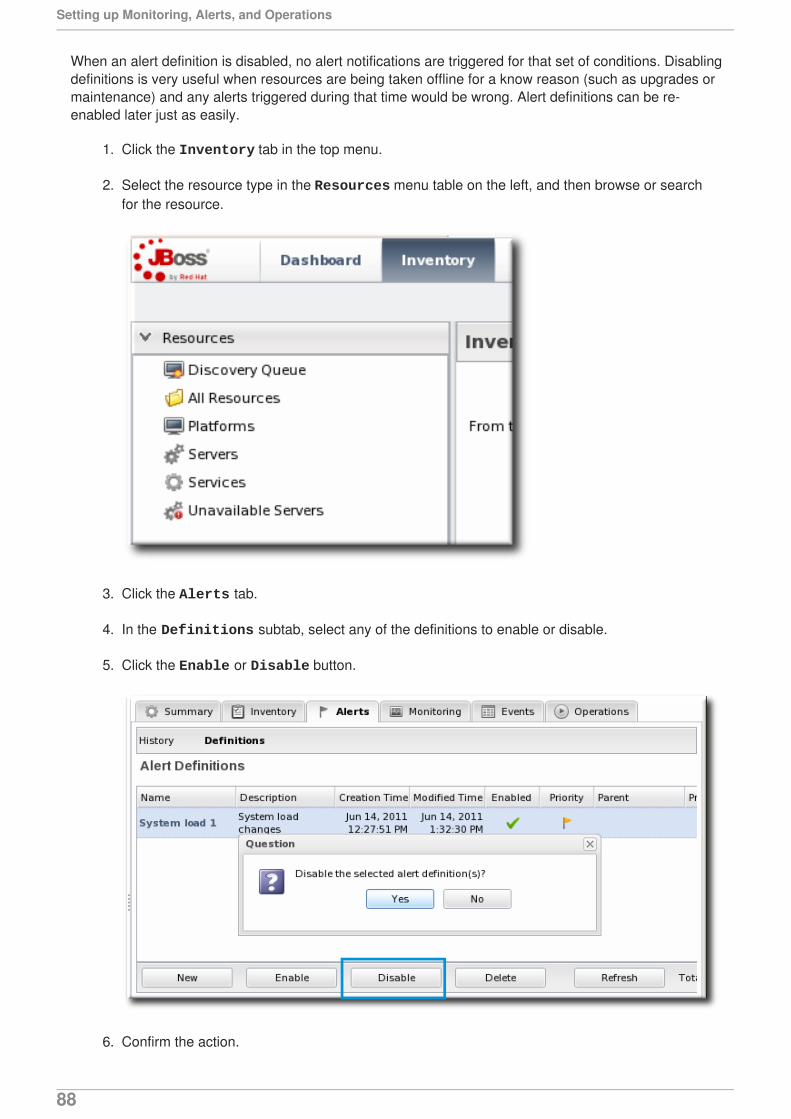
When an alert definition is disabled, no alert notifications are triggered for that set of conditions. Disablingdefinitions is very useful when resources are being taken offline for a know reason (such as upgrades ormaintenance) and any alerts triggered during that time would be wrong. Alert definitions can be re-enabled later just as easily.
1. Click the Inventory tab in the top menu.
2. Select the resource type in the Resources menu table on the left, and then browse or searchfor the resource.
3. Click the Alerts tab.
4. In the Definitions subtab, select any of the definitions to enable or disable.
5. Click the Enable or Disable button.
6. Confirm the action.
Setting up Monitoring, Alerts, and Operations
88
11.4. Group Alerting and Alert Templates
Most alerts can be defined consistently for multiple resources of the same type. JBoss ON has two waysto accomplish this:
Alert templates
Alerts on compatible groups
An alert template is a configuration setting for the JBoss ON server. An alert is configured for a specificresource type (even if no resource of that type exists in the inventory yet). Whenever a resource isadded, any alert templates in the JBoss ON configuration are automatically applied to that resource.Alert templates can be configured to allow local changes (for example, Resource A may have differentbaselines or expected behavior, so the alert conditions can be altered). Templates can also be strictlyenforced, so that every resource of that type has exactly the same settings.
NOTE
Alert templates for a resource type automatically apply to all existing and new resourcesof that type. This can be deselected when the template is edited, so that changes onlyapply to new resources.
Alerts can be configured on compatible groups. As with alert templates, the compatible group's alertdefinitions trickle down to the rest of the group members. When a resource is added to a group, the alertsare automatically added to the resource. When the resource is removed from the group, the alert isautomatically deleted. Group alerting works for both manual groups and dynamic groups. As with alerttemplates, group alerts can allow local changes or enforce the group alert settings.
Templates make configuration really easy to apply consistently and often, and JBoss ON allowstemplates to be set for alerts based on their general resource type.
Group alerts, like alert templates, apply equally to every member of a compatible group. Group alertsoffer more control over which resources have the alert definition, however, since resources can bemanually added to the group or selected based on a search filter. When a resource joins or leaves agroup, its alert definitions are automatically updated.
11.4.1. Creating Alert Definition Templates
Alert templates are fully defined alert definitions — from conditions to notification methods — that arecreated for any of the managed resource types in JBoss ON. Servers or applications of the same typewill probably have the same set of alert conditions that apply, such as free memory or CPU usage. Analert definition template creates an alert based on the general type of resource. So, there can be alerttemplates for Windows, Linux, and Solaris servers, Tomcat and Apache servers, and services like sshdand cron. Every time a resource of that type is added, then the alert definition is automatically added tothe resource with the predefined settings. Any alert assigned to a resource through a template can beedited locally for that resource, so these alert definitions are still flexible and customizable.
NOTE
Alert templates for a resource type automatically apply to all existing and new resourcesof that type. This can be deselected when the template is edited, so that changes onlyapply to new resources.
To create an alert definition template:
11. PLANNING ALERTS
89
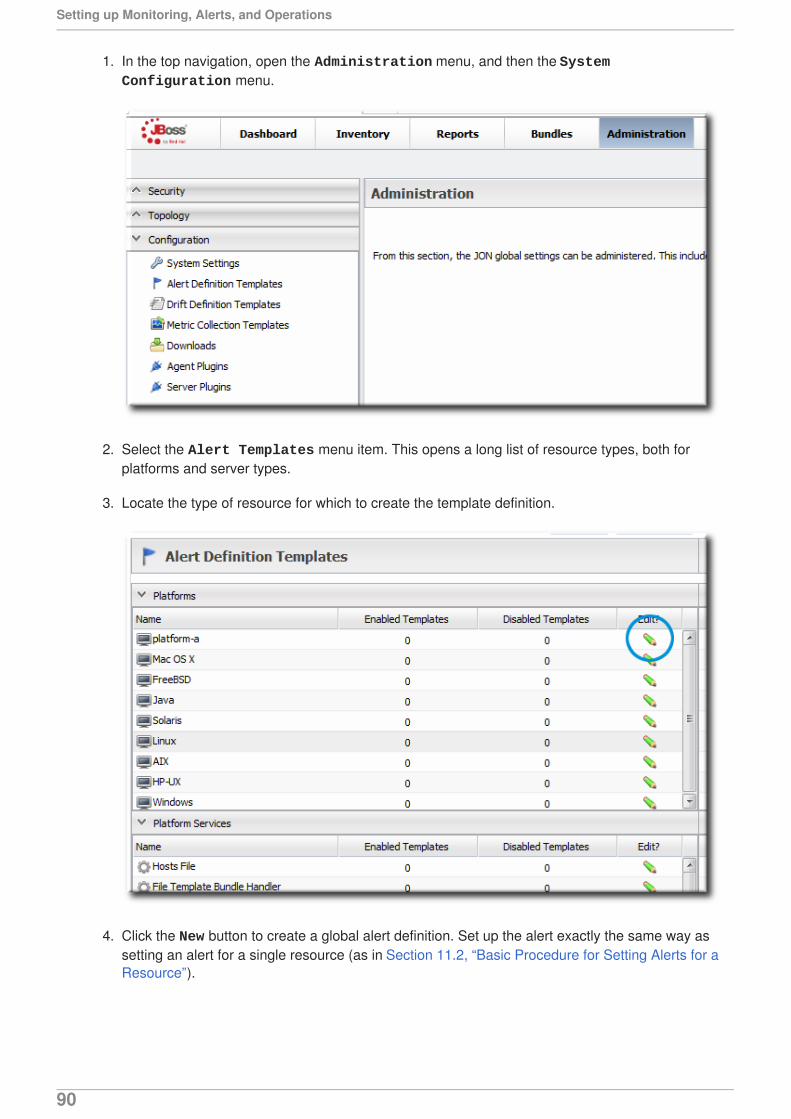
1. In the top navigation, open the Administration menu, and then the System Configuration menu.
2. Select the Alert Templates menu item. This opens a long list of resource types, both forplatforms and server types.
3. Locate the type of resource for which to create the template definition.
4. Click the New button to create a global alert definition. Set up the alert exactly the same way assetting an alert for a single resource (as in Section 11.2, “Basic Procedure for Setting Alerts for aResource”).
Setting up Monitoring, Alerts, and Operations
90
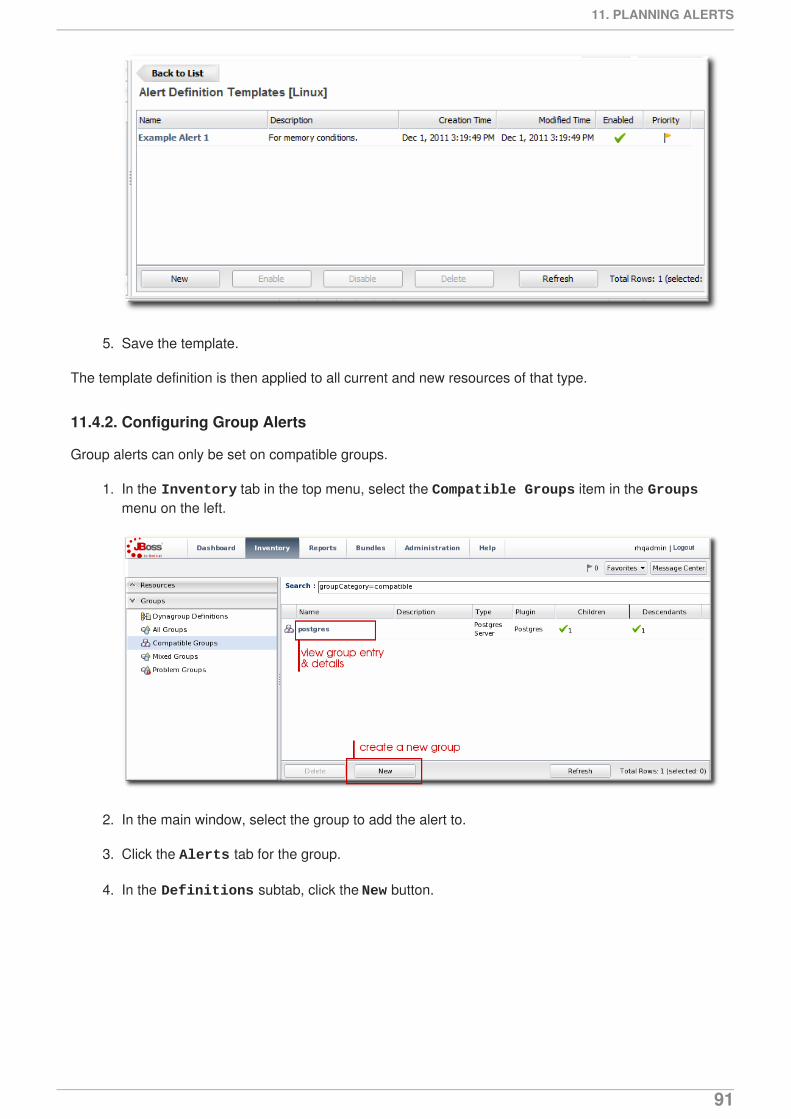
5. Save the template.
The template definition is then applied to all current and new resources of that type.
11.4.2. Configuring Group Alerts
Group alerts can only be set on compatible groups.
1. In the Inventory tab in the top menu, select the Compatible Groups item in the Groupsmenu on the left.
2. In the main window, select the group to add the alert to.
3. Click the Alerts tab for the group.
4. In the Definitions subtab, click the New button.
11. PLANNING ALERTS
91
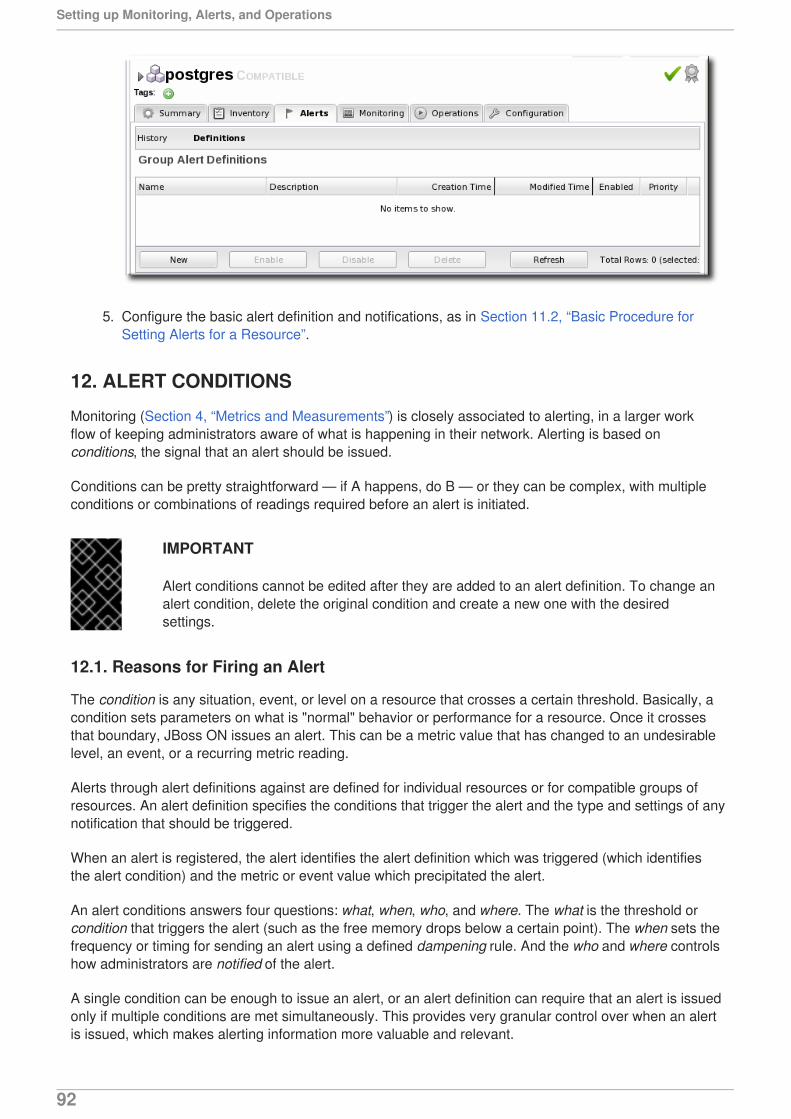
5. Configure the basic alert definition and notifications, as in Section 11.2, “Basic Procedure forSetting Alerts for a Resource”.
12. ALERT CONDITIONS
Monitoring (Section 4, “Metrics and Measurements”) is closely associated to alerting, in a larger workflow of keeping administrators aware of what is happening in their network. Alerting is based onconditions, the signal that an alert should be issued.
Conditions can be pretty straightforward — if A happens, do B — or they can be complex, with multipleconditions or combinations of readings required before an alert is initiated.
IMPORTANT
Alert conditions cannot be edited after they are added to an alert definition. To change analert condition, delete the original condition and create a new one with the desiredsettings.
12.1. Reasons for Firing an Alert
The condition is any situation, event, or level on a resource that crosses a certain threshold. Basically, acondition sets parameters on what is "normal" behavior or performance for a resource. Once it crossesthat boundary, JBoss ON issues an alert. This can be a metric value that has changed to an undesirablelevel, an event, or a recurring metric reading.
Alerts through alert definitions against are defined for individual resources or for compatible groups ofresources. An alert definition specifies the conditions that trigger the alert and the type and settings of anynotification that should be triggered.
When an alert is registered, the alert identifies the alert definition which was triggered (which identifiesthe alert condition) and the metric or event value which precipitated the alert.
An alert conditions answers four questions: what, when, who, and where. The what is the threshold orcondition that triggers the alert (such as the free memory drops below a certain point). The when sets thefrequency or timing for sending an alert using a defined dampening rule. And the who and where controlshow administrators are notified of the alert.
A single condition can be enough to issue an alert, or an alert definition can require that an alert is issuedonly if multiple conditions are met simultaneously. This provides very granular control over when an alertis issued, which makes alerting information more valuable and relevant.
Setting up Monitoring, Alerts, and Operations
92
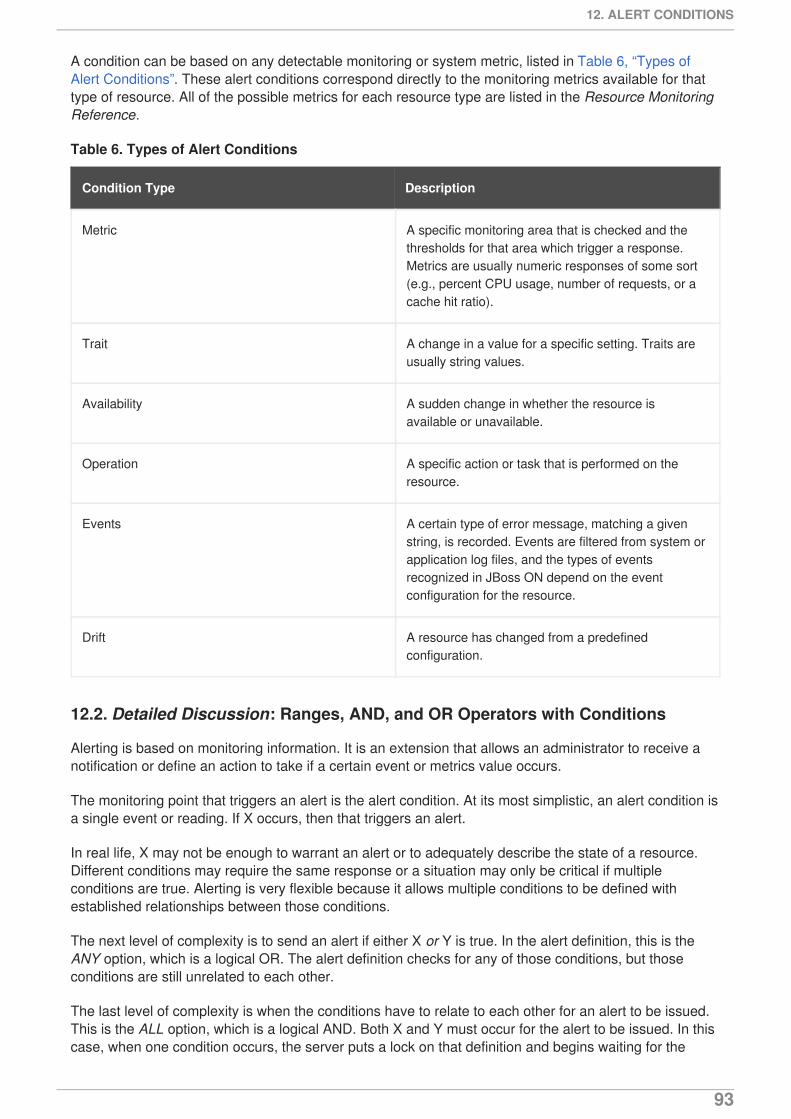
A condition can be based on any detectable monitoring or system metric, listed in Table 6, “Types ofAlert Conditions”. These alert conditions correspond directly to the monitoring metrics available for thattype of resource. All of the possible metrics for each resource type are listed in the Resource MonitoringReference.
Table 6. Types of Alert Conditions
Condition Type Description
Metric A specific monitoring area that is checked and thethresholds for that area which trigger a response.Metrics are usually numeric responses of some sort(e.g., percent CPU usage, number of requests, or acache hit ratio).
Trait A change in a value for a specific setting. Traits areusually string values.
Availability A sudden change in whether the resource isavailable or unavailable.
Operation A specific action or task that is performed on theresource.
Events A certain type of error message, matching a givenstring, is recorded. Events are filtered from system orapplication log files, and the types of eventsrecognized in JBoss ON depend on the eventconfiguration for the resource.
Drift A resource has changed from a predefinedconfiguration.
12.2. Detailed Discussion: Ranges, AND, and OR Operators with Conditions
Alerting is based on monitoring information. It is an extension that allows an administrator to receive anotification or define an action to take if a certain event or metrics value occurs.
The monitoring point that triggers an alert is the alert condition. At its most simplistic, an alert condition isa single event or reading. If X occurs, then that triggers an alert.
In real life, X may not be enough to warrant an alert or to adequately describe the state of a resource.Different conditions may require the same response or a situation may only be critical if multipleconditions are true. Alerting is very flexible because it allows multiple conditions to be defined withestablished relationships between those conditions.
The next level of complexity is to send an alert if either X or Y is true. In the alert definition, this is theANY option, which is a logical OR. The alert definition checks for any of those conditions, but thoseconditions are still unrelated to each other.
The last level of complexity is when the conditions have to relate to each other for an alert to be issued.This is the ALL option, which is a logical AND. Both X and Y must occur for the alert to be issued. In thiscase, when one condition occurs, the server puts a lock on that definition and begins waiting for the
12. ALERT CONDITIONS
93
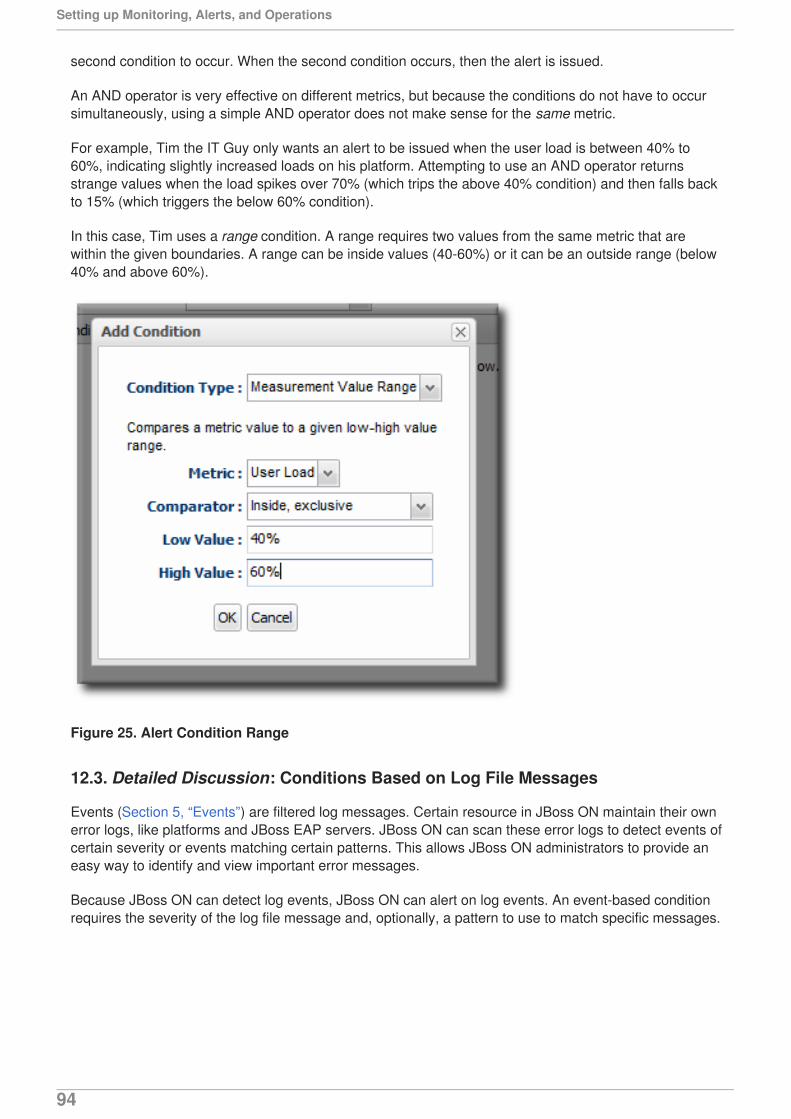
second condition to occur. When the second condition occurs, then the alert is issued.
An AND operator is very effective on different metrics, but because the conditions do not have to occursimultaneously, using a simple AND operator does not make sense for the same metric.
For example, Tim the IT Guy only wants an alert to be issued when the user load is between 40% to60%, indicating slightly increased loads on his platform. Attempting to use an AND operator returnsstrange values when the load spikes over 70% (which trips the above 40% condition) and then falls backto 15% (which triggers the below 60% condition).
In this case, Tim uses a range condition. A range requires two values from the same metric that arewithin the given boundaries. A range can be inside values (40-60%) or it can be an outside range (below40% and above 60%).
Figure 25. Alert Condition Range
12.3. Detailed Discussion: Conditions Based on Log File Messages
Events (Section 5, “Events”) are filtered log messages. Certain resource in JBoss ON maintain their ownerror logs, like platforms and JBoss EAP servers. JBoss ON can scan these error logs to detect events ofcertain severity or events matching certain patterns. This allows JBoss ON administrators to provide aneasy way to identify and view important error messages.
Because JBoss ON can detect log events, JBoss ON can alert on log events. An event-based conditionrequires the severity of the log file message and, optionally, a pattern to use to match specific messages.
Setting up Monitoring, Alerts, and Operations
94
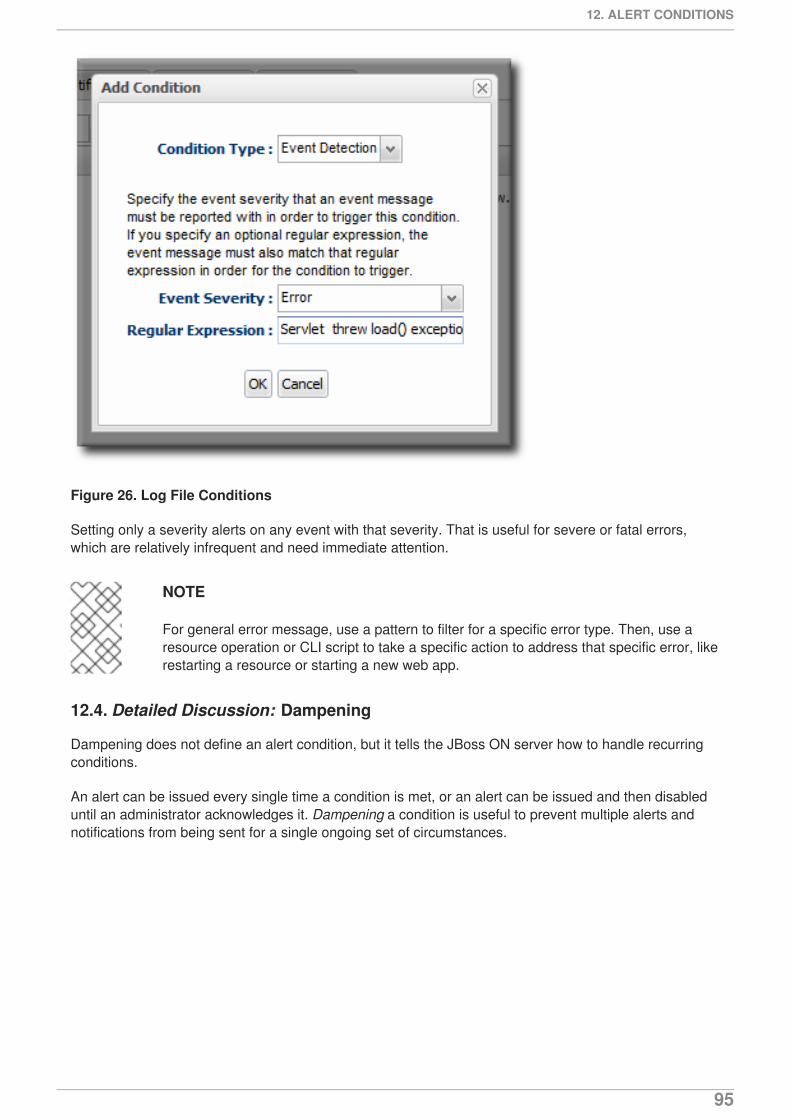
Figure 26. Log File Conditions
Setting only a severity alerts on any event with that severity. That is useful for severe or fatal errors,which are relatively infrequent and need immediate attention.
NOTE
For general error message, use a pattern to filter for a specific error type. Then, use aresource operation or CLI script to take a specific action to address that specific error, likerestarting a resource or starting a new web app.
12.4. Detailed Discussion: Dampening
Dampening does not define an alert condition, but it tells the JBoss ON server how to handle recurringconditions.
An alert can be issued every single time a condition is met, or an alert can be issued and then disableduntil an administrator acknowledges it. Dampening a condition is useful to prevent multiple alerts andnotifications from being sent for a single ongoing set of circumstances.
12. ALERT CONDITIONS
95
Figure 27. Dampening Filter
For example, Tim the IT Guy sets an alert to let him know if his platform CPU usage spikes above 80%.Every time the monitoring scan runs, the metric is again determined to be true, and is treated as a newand discrete instance. If the metric schedule is set for 10 minutes and it takes him an hour to respond tothe alert, he could have six or seven alert notifications before he has a chance to respond. If the only alertresponse is an email, this is an annoyance, but not a problem.
If, however, Tim the IT Guy has an alert response to create a new JBoss server if his EAP connectioncount goes above a certain point, the same response could be taken six or seven times, when it actuallyshould be done once and then the condition will naturally resolve itself.
Dampening is another set of instructions on how to evaluate the condition before triggering another alert.It tells JBoss ON how to interpret those monitoring data.
JBoss ON could send an alert every time the condition is encountered. In that case, there wouldbe multiple alerts issued if the CPU percentage bounced around, while only one alert would besent if it hit it briefly or hit it and stayed there.
JBoss ON could send an alert only if the condition was encountered a certain number of timesconsecutively or X number of times out of Y number of polls. In this case, only a recurring orsustained problem would trigger an alert. A momentary spike or trough wouldn't be enough tofire a notification.
A condition may need to occur several times over a short period of time for it to be a problem, butonce is not a problem. For example, a server may bounce between 78% and 80% CPU overseveral minutes, it could hit 80% once for only a few seconds, or it could hit 80% and stay there.The condition may only be relevant if the CPU hits 80% and stays, and the other readings can beignored.
A notification is sent only if the problem occurs within a set time period. This can be useful totrack the frequency of recurring problems or to track how long a condition persisted.
Setting up Monitoring, Alerts, and Operations
96
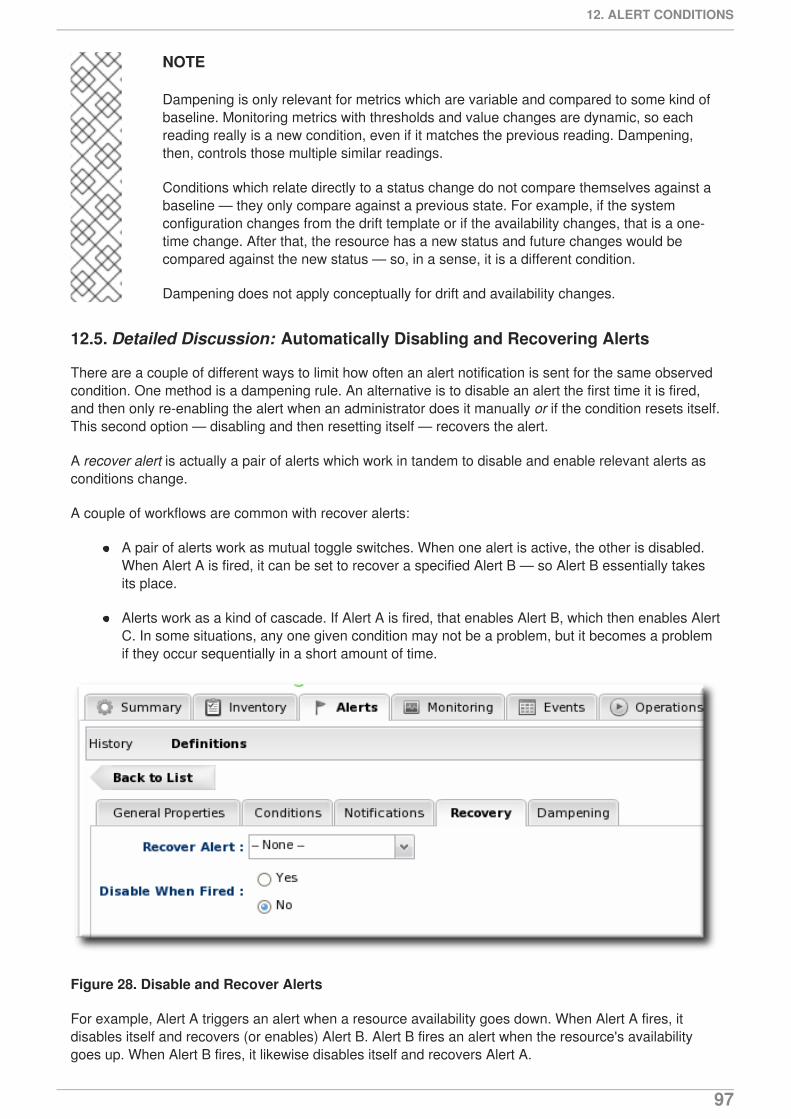
NOTE
Dampening is only relevant for metrics which are variable and compared to some kind ofbaseline. Monitoring metrics with thresholds and value changes are dynamic, so eachreading really is a new condition, even if it matches the previous reading. Dampening,then, controls those multiple similar readings.
Conditions which relate directly to a status change do not compare themselves against abaseline — they only compare against a previous state. For example, if the systemconfiguration changes from the drift template or if the availability changes, that is a one-time change. After that, the resource has a new status and future changes would becompared against the new status — so, in a sense, it is a different condition.
Dampening does not apply conceptually for drift and availability changes.
12.5. Detailed Discussion: Automatically Disabling and Recovering Alerts
There are a couple of different ways to limit how often an alert notification is sent for the same observedcondition. One method is a dampening rule. An alternative is to disable an alert the first time it is fired,and then only re-enabling the alert when an administrator does it manually or if the condition resets itself.This second option — disabling and then resetting itself — recovers the alert.
A recover alert is actually a pair of alerts which work in tandem to disable and enable relevant alerts asconditions change.
A couple of workflows are common with recover alerts:
A pair of alerts work as mutual toggle switches. When one alert is active, the other is disabled.When Alert A is fired, it can be set to recover a specified Alert B — so Alert B essentially takesits place.
Alerts work as a kind of cascade. If Alert A is fired, that enables Alert B, which then enables AlertC. In some situations, any one given condition may not be a problem, but it becomes a problemif they occur sequentially in a short amount of time.
Figure 28. Disable and Recover Alerts
For example, Alert A triggers an alert when a resource availability goes down. When Alert A fires, itdisables itself and recovers (or enables) Alert B. Alert B fires an alert when the resource's availabilitygoes up. When Alert B fires, it likewise disables itself and recovers Alert A.
12. ALERT CONDITIONS
97
Recover alerts inform an administrator first of when an issue occurs and then second when it is resolved.In the availability examples, the first alert lets the administrator know that a resource is offline, while thesecond alert lets the administrator know that the resource is back online.
The Setup: Toggle Recover Alerts for Availability
Tim the IT Guy has several servers that he uses for email routing and other business operations, andthen he has a couple of machines that he holds in reserve as backups.
He has mail-server-a.example.com has his primary mail server, and he only wants to bring mail-server-b.example.com online if mail-server-a goes offline, and then he wants it to go back inreserve when mail-server-a comes back.
The Plan
Tim creates a set of alert definitions to help handle the transition between his mail servers.
The first alert definition fires when the mail-server-a platform changes availability state togoes down.
The notification does a couple of things:
Deploy a bundle with the latest mail server configuration to another platform, mail-server-b.
Execute a command-line script on mail-server-b to start the mail service.
Email Tim the IT Guy to let him know that mail-server-a is unavailable.
For recovery, the alert does two things:
Disable the current alert. It only needs to fire once, to get the backup server online.
Recover (or enable) Alert B, so that JBoss ON waits for mail-server-a to come back up.
The second alert definition, Alert B, is only in effect while mail-server-a is offline. This alert firesas soon as mail-server-b changes availability state to goes up.
This alert definition basically waits around as long as mail-server-a is down. When mail-server-a is back online, Alert B's notification is to execute a command-line script onmail-server-b to stop the mail service.
Alert B also sends a notification email to Tim the IT Guy to let him know that mail-server-a is available again.
For recovery, the alert does two things:
Disable the current alert. Like with Alert A, Alert B only needs to fire once, to shut off thebackup as soon as the primary server is back.
Recover (or enable) Alert A, so the JBoss ON waits again for mail-server-a to go down.
13. ALERT RESPONSES
Alert conditions define when an alert is supposed to be triggered. An alert notification defines how thatalert notification is communicated. An alert notification can be a way of informing administrators andusers of the condition, but it can also be a way of having JBoss ON itself address an issue.
Setting up Monitoring, Alerts, and Operations
98
A single alert can have multiple responses, to make managing potential problems easier.
IMPORTANT
Alert notifications cannot be edited after they are added to an alert definition. To changean alert notification, delete the original notification and create a new one with the desiredsettings.
13.1. Notifying Administrators and Responding to Alerts
Every alert is recorded and viewable in the JBoss ON GUI. Alerts have an optional configuration, though,of sending an external notification whenever the alert is issued.
Once an incident occurs, there has to be a way to let a systems administrator know what is going on, sothey can respond to an issue. This is done by configuring a notification. Alert notifications fall into twocategories: a way of communicating the alert and an action to take in response to an alert.
There are three methods, by default, of communicating that an alert has been fired:
Email, to one or multiple addresses
SNMP traps
Messages to JBoss ON users
There are also a few default methods of having JBoss ON respond to an alert:
Running a resource operation (on the alerting resource or any other resource in inventory)
Running a resource script (specific type of resource operation)
JBoss ON CLI scripts
NOTE
It is also possible to write custom alert methods, which are implemented as server-sideplug-ins. Creating custom plug-ins is described in the JBoss Operations Network Plug-insWriting Guide.
Alert notifications can be clustered. That just means that the same alert can be broadcast throughseveral different methods at the same time. For example, if a public website goes down, then a companymay want notifications to be sent to their head web administrator and to have the web server restarted atthe same time.
NOTE
A single alert can initiate multiple notifications. Alert notifications are run in the order theyare listed in the alert definition.
13.2. Detailed Discussion: Initiating an Operation
A parallel response to an alert is to launch an operation. Resource operations (which, like metrics, aredefined in the resource type agent plug-in) are launched, like a notification, in response to a triggeredalert. Alert operations can be run on the resource that issued the alert or on any other resource in the
13. ALERT RESPONSES
99
inventory, which allows immediate and automatic responses to alert conditions. For instance, a JBossserver may begin performing badly because its JVM is out of memory. The JVM is the resource whichissues its alert, but the response by the agent is to restart the JBoss server.
When a certain alert condition occurs, the JBoss ON agent can respond by initiating an operation on aresource. This is part of the alert definition configuration, but it's worth calling out because it is such auseful tool for managing responses to alerts. Whenever an alert is fired, the agent can perform somekind of action, like restarting a server. This can be done either on the resource which issued the alert oron another resource.
Remote operations can be exceedingly useful (and versatile). For example, a JBoss server may beginperforming badly because its JVM is out of memory. The JVM is the resource which issues its alert, butthe response by the agent is to restart the JBoss server.
Regular operations are either initiated immediately or run on defined schedules for a specific configuredresource. Alert operations are even more flexible than regular operations for two reasons:
Alert operations are fired responsively to address any alert or event.
Alert operations can be initiated on any resource in the JBoss ON inventory, not only theresource which sent the alert. That means that an operation can be run for a different applicationon the same host server or even on an entirely different server.
The operations performed in response to an alert are the same as the operations which can bescheduled to run on a resource. The operations available for an alert depend on the target resource onwhich the operation will run — not the resource where the alert is set.
Alert operations senders can be used to run scripts on remote resources. For example, if a resourcegoes down, a diagnostic script can be run on its parent platform or another resource can be broughtonline and properly configured to take its place.
13.2.1. Using Tokens with Alert Operations
Alert operations can use tokens to either send information or supply information about the event. Forexample, tokens can be used to supply resource information in a command-line script.
Alert operations can accept tokens to fill in certain values automatically. These tokens have the followingform:
<%space.param_name%>
The space gives the JBoss ON configuration area where the value is derived; this will commonly beeither alert or resource. The param_name gives the entry value that is being supplied. For example,to point to the URL of the specific fired alert, the token would be <%alert.url%>, while to pull in theresource name, the token would be <%resource.name%>.
JBoss ON has pre-defined token values that relate to the fired alert, the resource which issued the alert,the resource which is the target of the operation, and the operation that was initiated. These are listed inTable 7, “Available Alert Operation Tokens”. All of these potential token values are Java properties thebelong to the operation's parent JBoss ON server.
The alert operations plug-in resolves the token value itself when the alert operation is processed to findthe value. The realized value is sent to the script service, which ultimately plugs the value into thecommand-line argument or script which referenced the token.
Table 7. Available Alert Operation Tokens
Setting up Monitoring, Alerts, and Operations
100
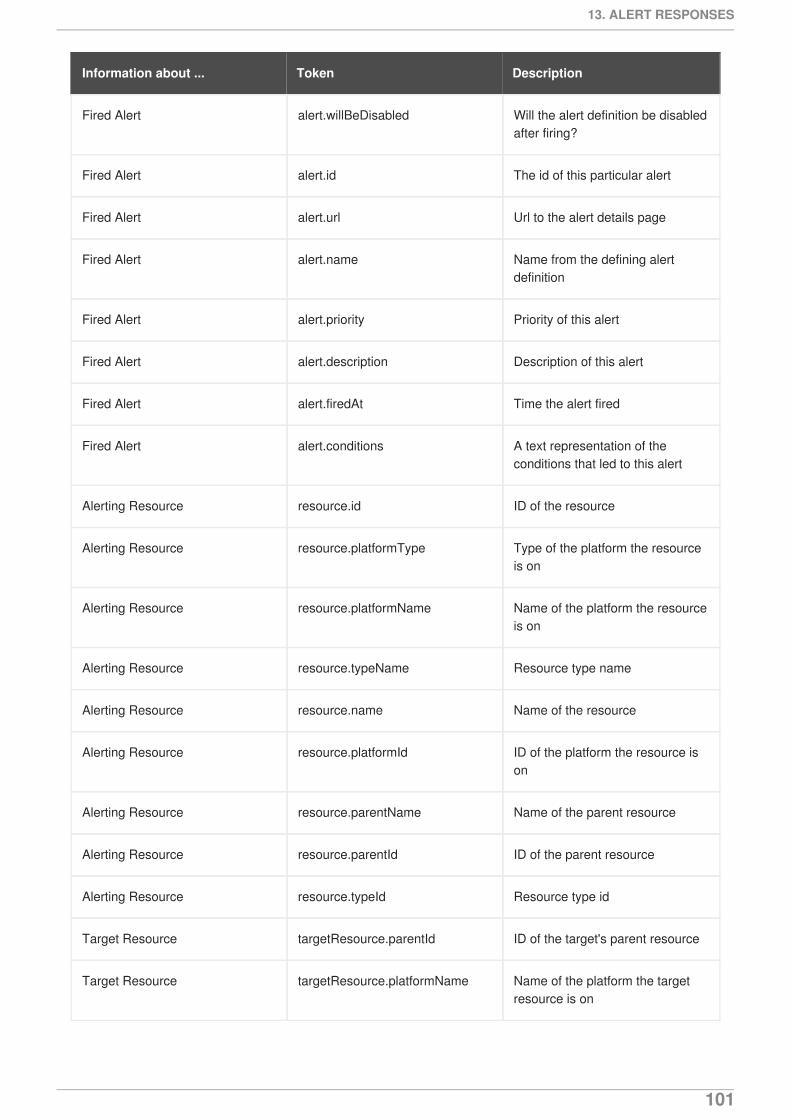
Information about ... Token Description
Fired Alert alert.willBeDisabled Will the alert definition be disabledafter firing?
Fired Alert alert.id The id of this particular alert
Fired Alert alert.url Url to the alert details page
Fired Alert alert.name Name from the defining alertdefinition
Fired Alert alert.priority Priority of this alert
Fired Alert alert.description Description of this alert
Fired Alert alert.firedAt Time the alert fired
Fired Alert alert.conditions A text representation of theconditions that led to this alert
Alerting Resource resource.id ID of the resource
Alerting Resource resource.platformType Type of the platform the resourceis on
Alerting Resource resource.platformName Name of the platform the resourceis on
Alerting Resource resource.typeName Resource type name
Alerting Resource resource.name Name of the resource
Alerting Resource resource.platformId ID of the platform the resource ison
Alerting Resource resource.parentName Name of the parent resource
Alerting Resource resource.parentId ID of the parent resource
Alerting Resource resource.typeId Resource type id
Target Resource targetResource.parentId ID of the target's parent resource
Target Resource targetResource.platformName Name of the platform the targetresource is on
13. ALERT RESPONSES
101
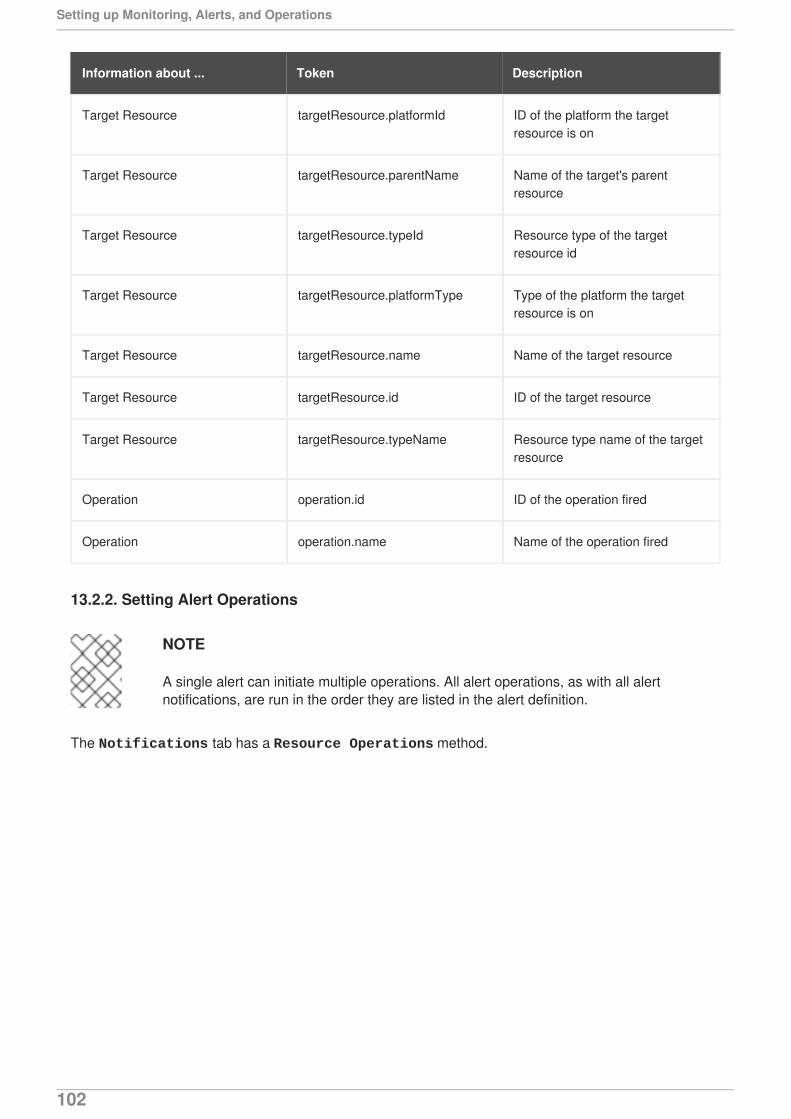
Target Resource targetResource.platformId ID of the platform the targetresource is on
Target Resource targetResource.parentName Name of the target's parentresource
Target Resource targetResource.typeId Resource type of the targetresource id
Target Resource targetResource.platformType Type of the platform the targetresource is on
Target Resource targetResource.name Name of the target resource
Target Resource targetResource.id ID of the target resource
Target Resource targetResource.typeName Resource type name of the targetresource
Operation operation.id ID of the operation fired
Operation operation.name Name of the operation fired
Information about ... Token Description
13.2.2. Setting Alert Operations
NOTE
A single alert can initiate multiple operations. All alert operations, as with all alertnotifications, are run in the order they are listed in the alert definition.
The Notifications tab has a Resource Operations method.
Setting up Monitoring, Alerts, and Operations
102
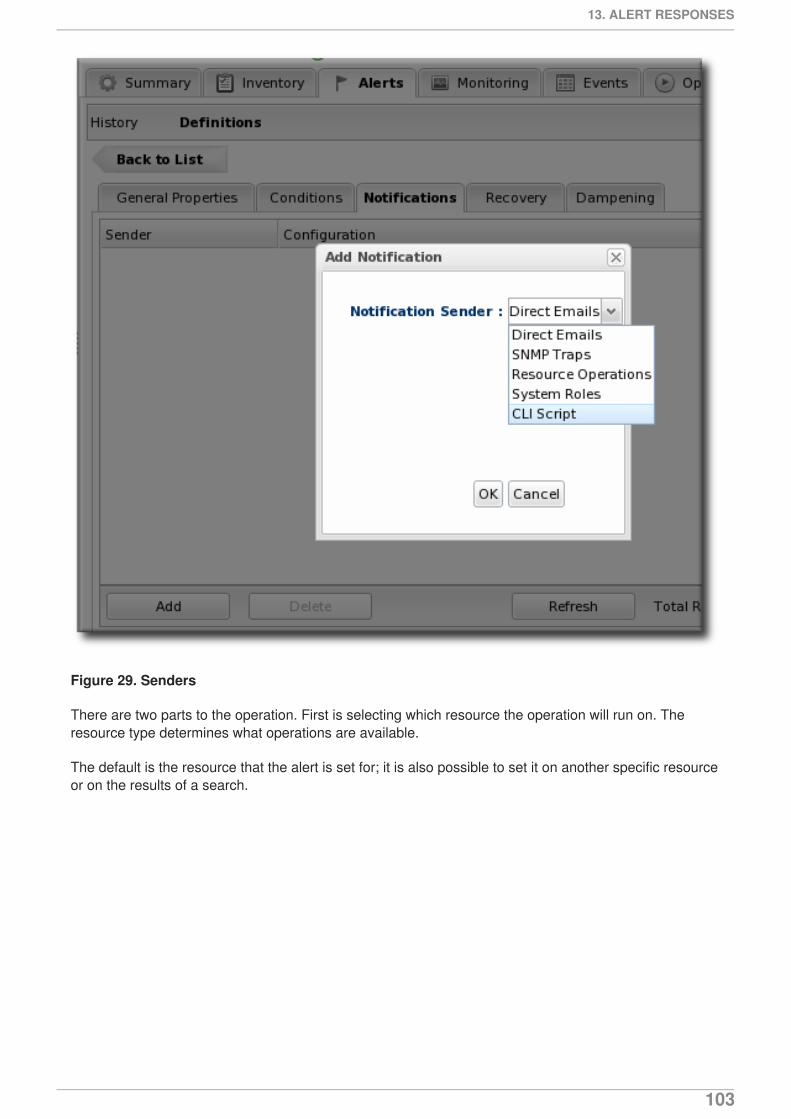
Figure 29. Senders
There are two parts to the operation. First is selecting which resource the operation will run on. Theresource type determines what operations are available.
The default is the resource that the alert is set for; it is also possible to set it on another specific resourceor on the results of a search.
13. ALERT RESPONSES
103
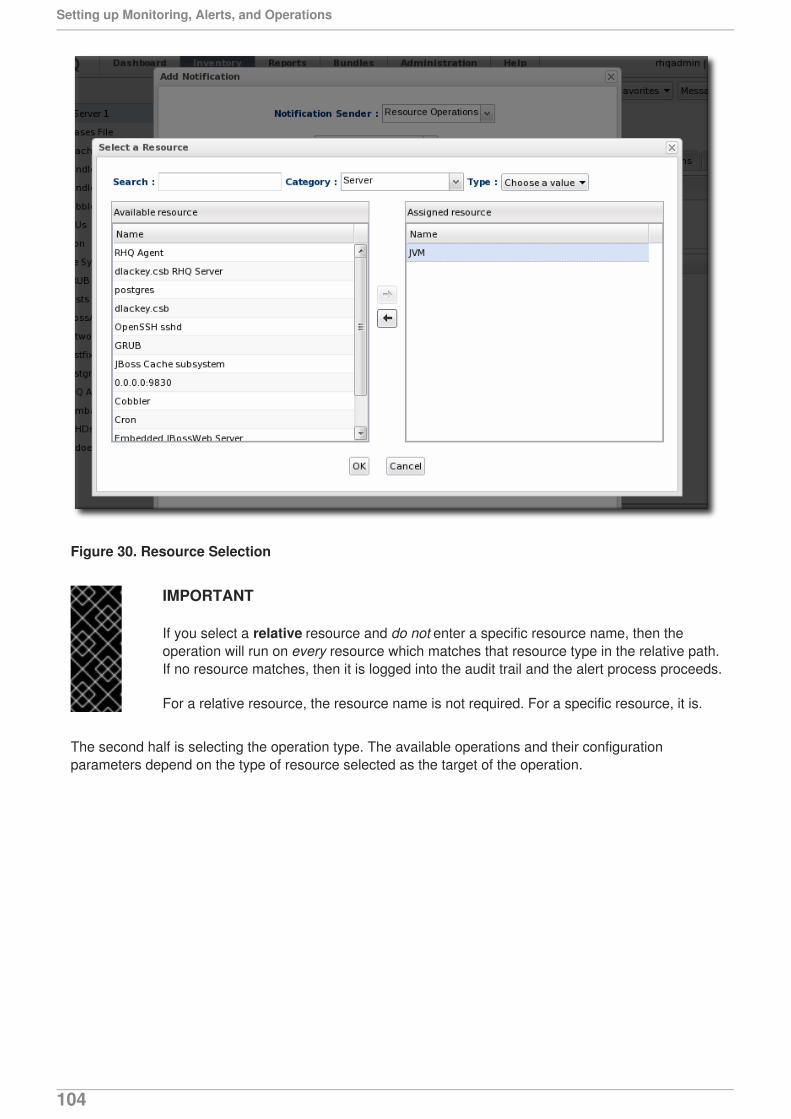
Figure 30. Resource Selection
IMPORTANT
If you select a relative resource and do not enter a specific resource name, then theoperation will run on every resource which matches that resource type in the relative path.If no resource matches, then it is logged into the audit trail and the alert process proceeds.
For a relative resource, the resource name is not required. For a specific resource, it is.
The second half is selecting the operation type. The available operations and their configurationparameters depend on the type of resource selected as the target of the operation.
Setting up Monitoring, Alerts, and Operations
104
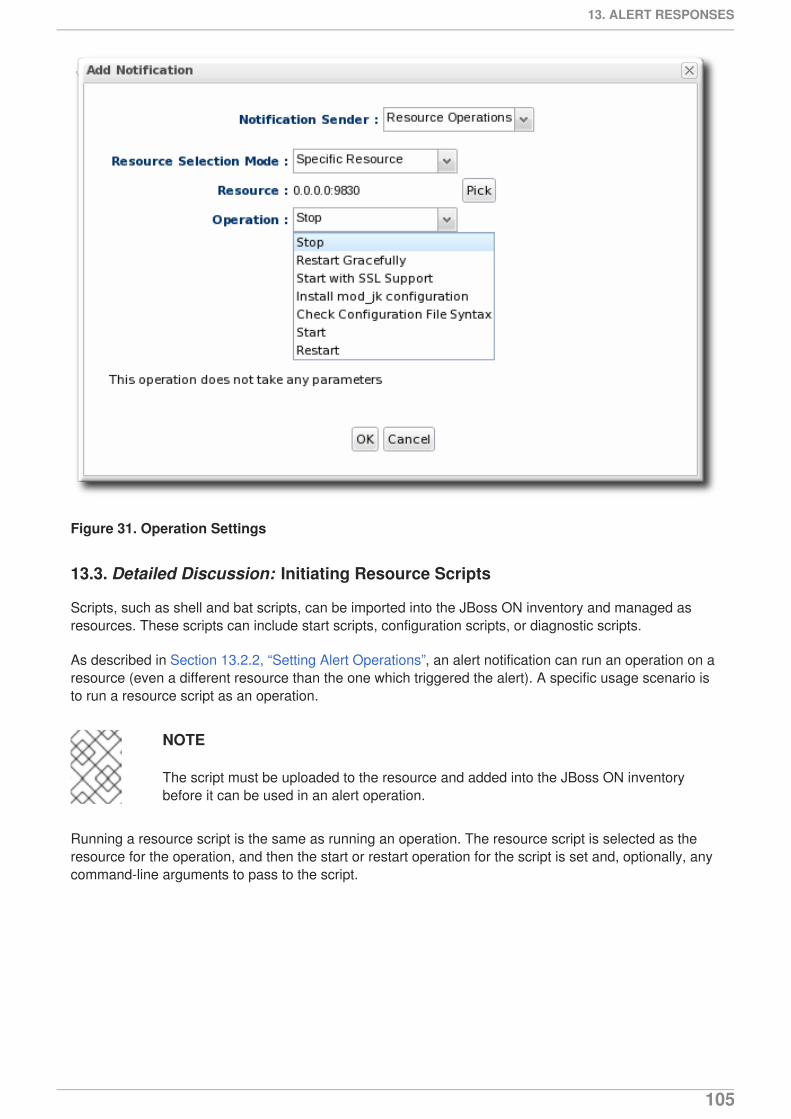
Figure 31. Operation Settings
13.3. Detailed Discussion: Initiating Resource Scripts
Scripts, such as shell and bat scripts, can be imported into the JBoss ON inventory and managed asresources. These scripts can include start scripts, configuration scripts, or diagnostic scripts.
As described in Section 13.2.2, “Setting Alert Operations”, an alert notification can run an operation on aresource (even a different resource than the one which triggered the alert). A specific usage scenario isto run a resource script as an operation.
NOTE
The script must be uploaded to the resource and added into the JBoss ON inventorybefore it can be used in an alert operation.
Running a resource script is the same as running an operation. The resource script is selected as theresource for the operation, and then the start or restart operation for the script is set and, optionally, anycommand-line arguments to pass to the script.
13. ALERT RESPONSES
105
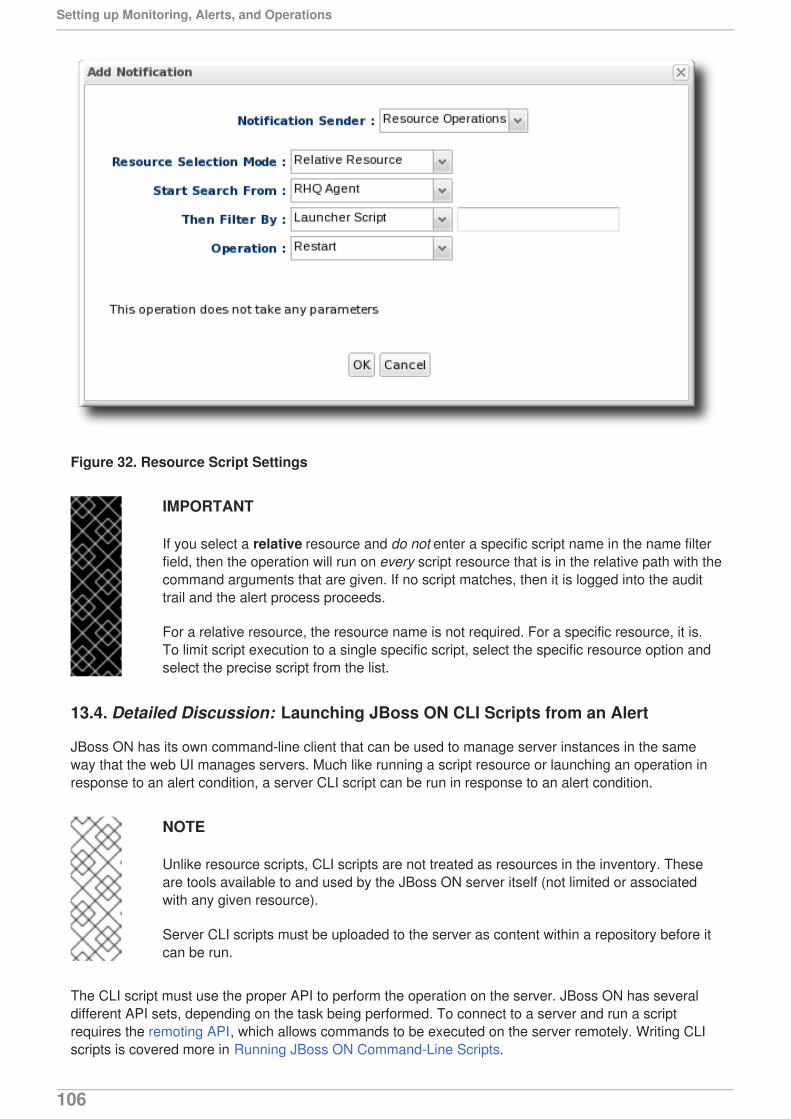
Figure 32. Resource Script Settings
IMPORTANT
If you select a relative resource and do not enter a specific script name in the name filterfield, then the operation will run on every script resource that is in the relative path with thecommand arguments that are given. If no script matches, then it is logged into the audittrail and the alert process proceeds.
For a relative resource, the resource name is not required. For a specific resource, it is.To limit script execution to a single specific script, select the specific resource option andselect the precise script from the list.
13.4. Detailed Discussion: Launching JBoss ON CLI Scripts from an Alert
JBoss ON has its own command-line client that can be used to manage server instances in the sameway that the web UI manages servers. Much like running a script resource or launching an operation inresponse to an alert condition, a server CLI script can be run in response to an alert condition.
NOTE
Unlike resource scripts, CLI scripts are not treated as resources in the inventory. Theseare tools available to and used by the JBoss ON server itself (not limited or associatedwith any given resource).
Server CLI scripts must be uploaded to the server as content within a repository before itcan be run.
The CLI script must use the proper API to perform the operation on the server. JBoss ON has severaldifferent API sets, depending on the task being performed. To connect to a server and run a scriptrequires the remoting API, which allows commands to be executed on the server remotely. Writing CLIscripts is covered more in Running JBoss ON Command-Line Scripts.
Setting up Monitoring, Alerts, and Operations
106
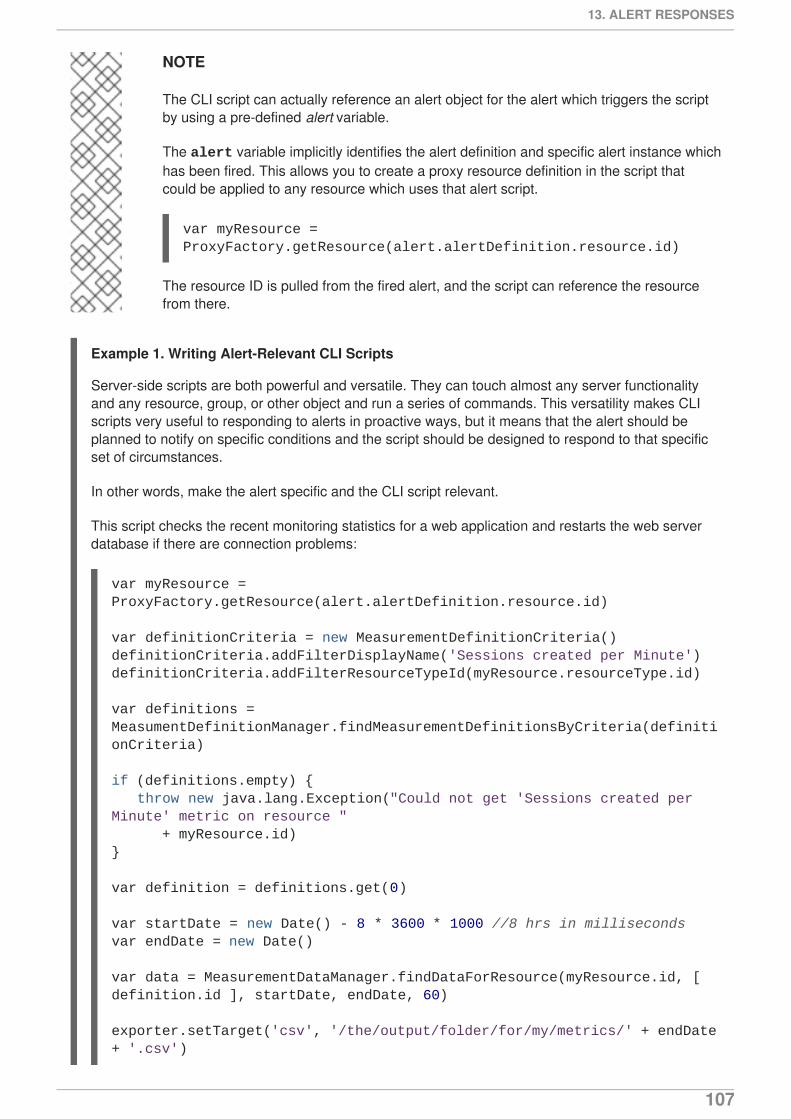
NOTE
The CLI script can actually reference an alert object for the alert which triggers the scriptby using a pre-defined alert variable.
The alert variable implicitly identifies the alert definition and specific alert instance whichhas been fired. This allows you to create a proxy resource definition in the script thatcould be applied to any resource which uses that alert script.
var myResource = ProxyFactory.getResource(alert.alertDefinition.resource.id)
The resource ID is pulled from the fired alert, and the script can reference the resourcefrom there.
Example 1. Writing Alert-Relevant CLI Scripts
Server-side scripts are both powerful and versatile. They can touch almost any server functionalityand any resource, group, or other object and run a series of commands. This versatility makes CLIscripts very useful to responding to alerts in proactive ways, but it means that the alert should beplanned to notify on specific conditions and the script should be designed to respond to that specificset of circumstances.
In other words, make the alert specific and the CLI script relevant.
This script checks the recent monitoring statistics for a web application and restarts the web serverdatabase if there are connection problems:
var myResource = ProxyFactory.getResource(alert.alertDefinition.resource.id)
var definitionCriteria = new MeasurementDefinitionCriteria()definitionCriteria.addFilterDisplayName('Sessions created per Minute')definitionCriteria.addFilterResourceTypeId(myResource.resourceType.id)
var definitions = MeasumentDefinitionManager.findMeasurementDefinitionsByCriteria(definitionCriteria)
if (definitions.empty) { throw new java.lang.Exception("Could not get 'Sessions created per Minute' metric on resource " + myResource.id)}
var definition = definitions.get(0)
var startDate = new Date() - 8 * 3600 * 1000 //8 hrs in millisecondsvar endDate = new Date()
var data = MeasurementDataManager.findDataForResource(myResource.id, [ definition.id ], startDate, endDate, 60)
exporter.setTarget('csv', '/the/output/folder/for/my/metrics/' + endDate + '.csv')
13. ALERT RESPONSES
107
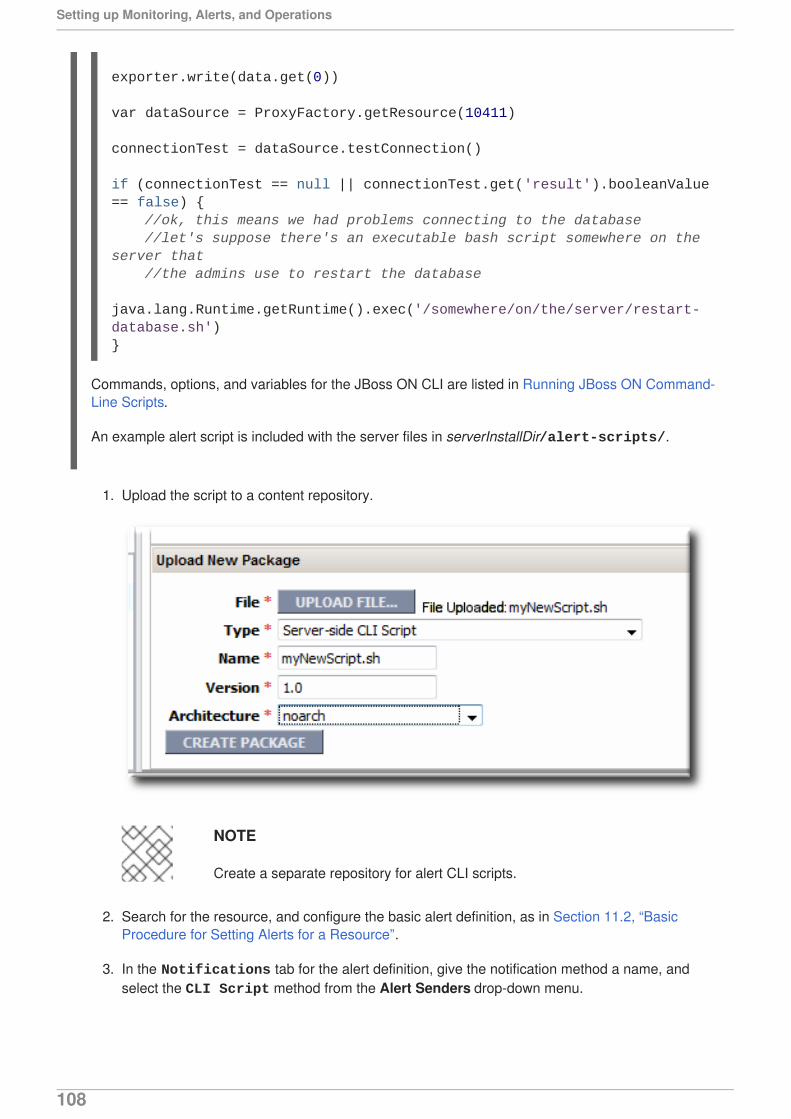
Commands, options, and variables for the JBoss ON CLI are listed in Running JBoss ON Command-Line Scripts.
An example alert script is included with the server files in serverInstallDir/alert-scripts/.
1. Upload the script to a content repository.
NOTE
Create a separate repository for alert CLI scripts.
2. Search for the resource, and configure the basic alert definition, as in Section 11.2, “BasicProcedure for Setting Alerts for a Resource”.
3. In the Notifications tab for the alert definition, give the notification method a name, andselect the CLI Script method from the Alert Senders drop-down menu.
exporter.write(data.get(0))
var dataSource = ProxyFactory.getResource(10411)
connectionTest = dataSource.testConnection()
if (connectionTest == null || connectionTest.get('result').booleanValue == false) { //ok, this means we had problems connecting to the database //let's suppose there's an executable bash script somewhere on the server that //the admins use to restart the database java.lang.Runtime.getRuntime().exec('/somewhere/on/the/server/restart-database.sh')}
Setting up Monitoring, Alerts, and Operations
108
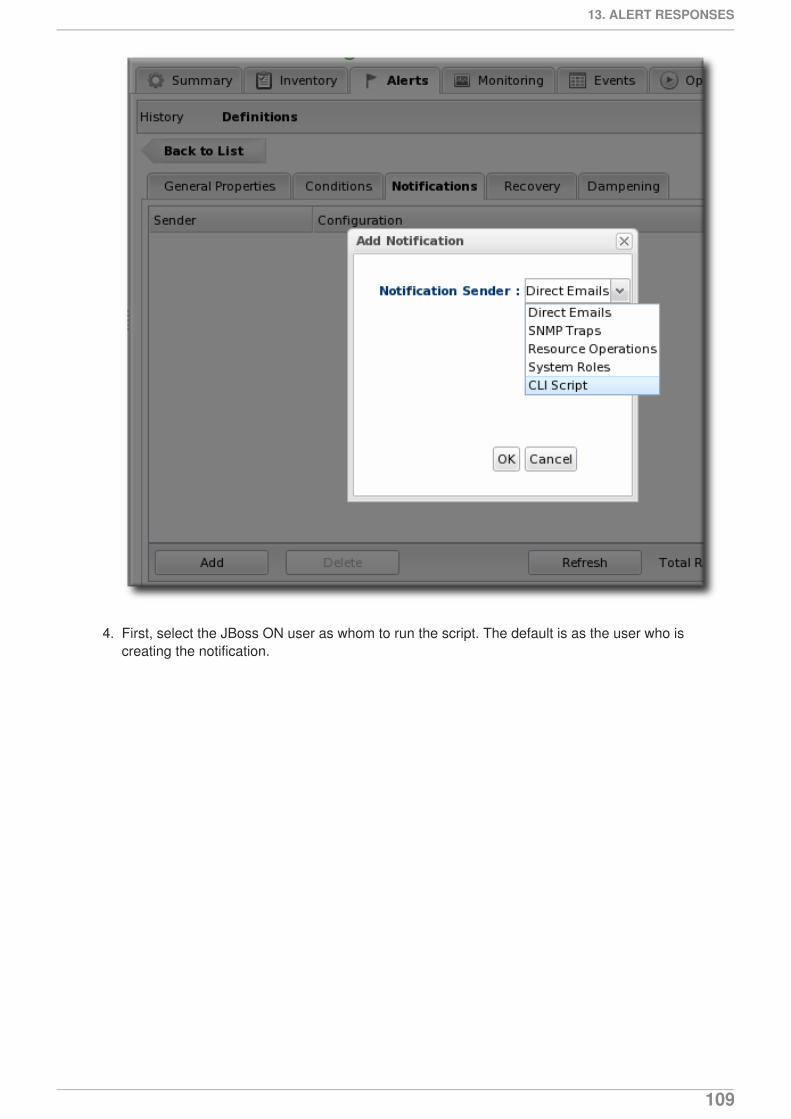
4. First, select the JBoss ON user as whom to run the script. The default is as the user who iscreating the notification.
13. ALERT RESPONSES
109
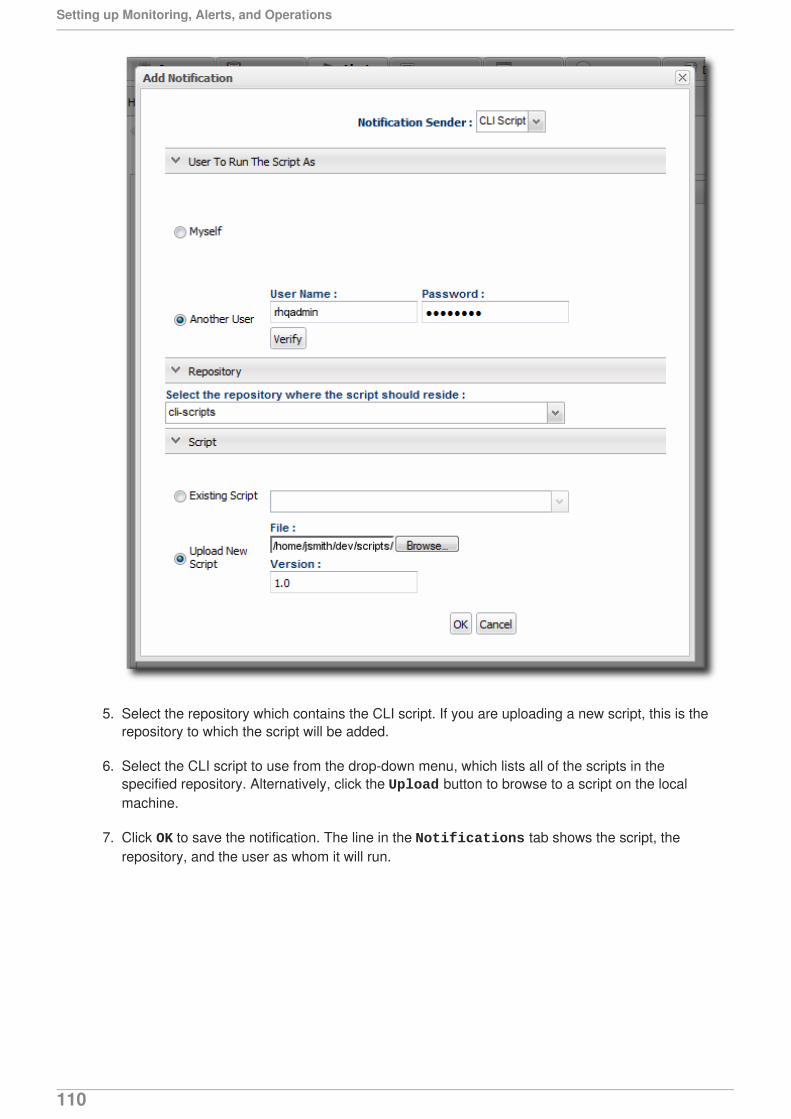
5. Select the repository which contains the CLI script. If you are uploading a new script, this is therepository to which the script will be added.
6. Select the CLI script to use from the drop-down menu, which lists all of the scripts in thespecified repository. Alternatively, click the Upload button to browse to a script on the localmachine.
7. Click OK to save the notification. The line in the Notifications tab shows the script, therepository, and the user as whom it will run.
Setting up Monitoring, Alerts, and Operations
110
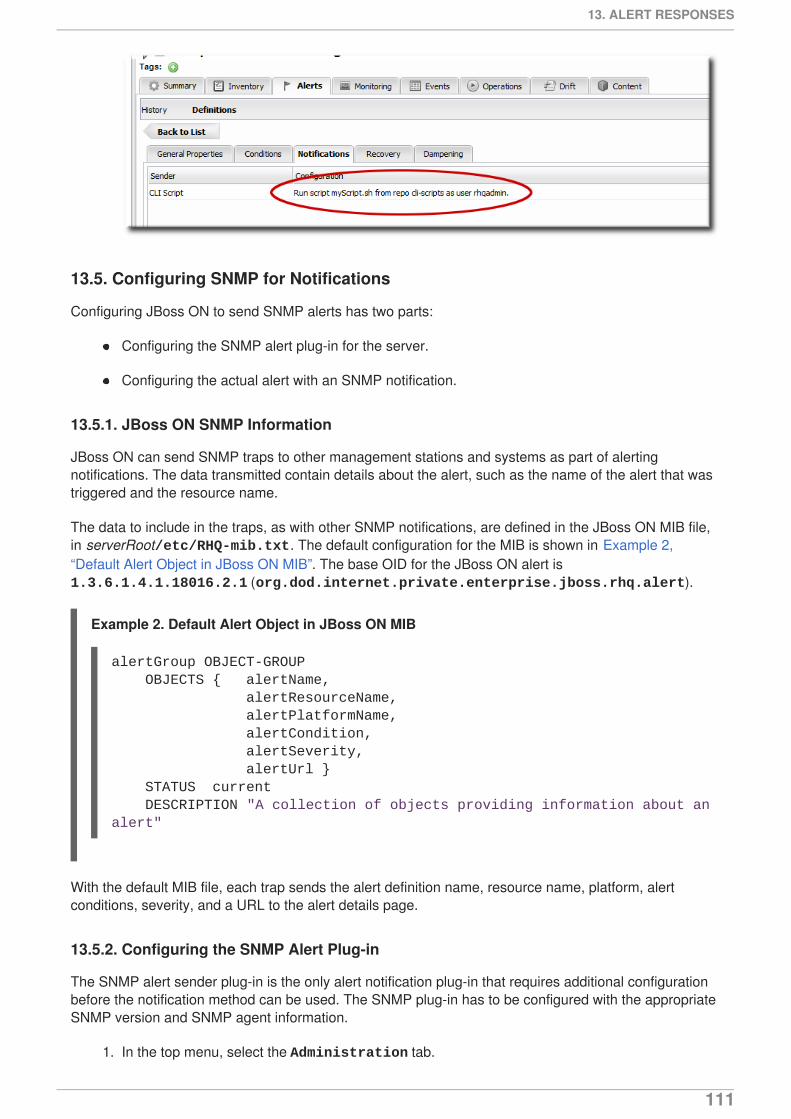
13.5. Configuring SNMP for Notifications
Configuring JBoss ON to send SNMP alerts has two parts:
Configuring the SNMP alert plug-in for the server.
Configuring the actual alert with an SNMP notification.
13.5.1. JBoss ON SNMP Information
JBoss ON can send SNMP traps to other management stations and systems as part of alertingnotifications. The data transmitted contain details about the alert, such as the name of the alert that wastriggered and the resource name.
The data to include in the traps, as with other SNMP notifications, are defined in the JBoss ON MIB file,in serverRoot/etc/RHQ-mib.txt. The default configuration for the MIB is shown in Example 2,“Default Alert Object in JBoss ON MIB”. The base OID for the JBoss ON alert is 1.3.6.1.4.1.18016.2.1 (org.dod.internet.private.enterprise.jboss.rhq.alert).
Example 2. Default Alert Object in JBoss ON MIB
With the default MIB file, each trap sends the alert definition name, resource name, platform, alertconditions, severity, and a URL to the alert details page.
13.5.2. Configuring the SNMP Alert Plug-in
The SNMP alert sender plug-in is the only alert notification plug-in that requires additional configurationbefore the notification method can be used. The SNMP plug-in has to be configured with the appropriateSNMP version and SNMP agent information.
1. In the top menu, select the Administration tab.
alertGroup OBJECT-GROUP OBJECTS { alertName, alertResourceName, alertPlatformName, alertCondition, alertSeverity, alertUrl } STATUS current DESCRIPTION "A collection of objects providing information about an alert"
13. ALERT RESPONSES
111
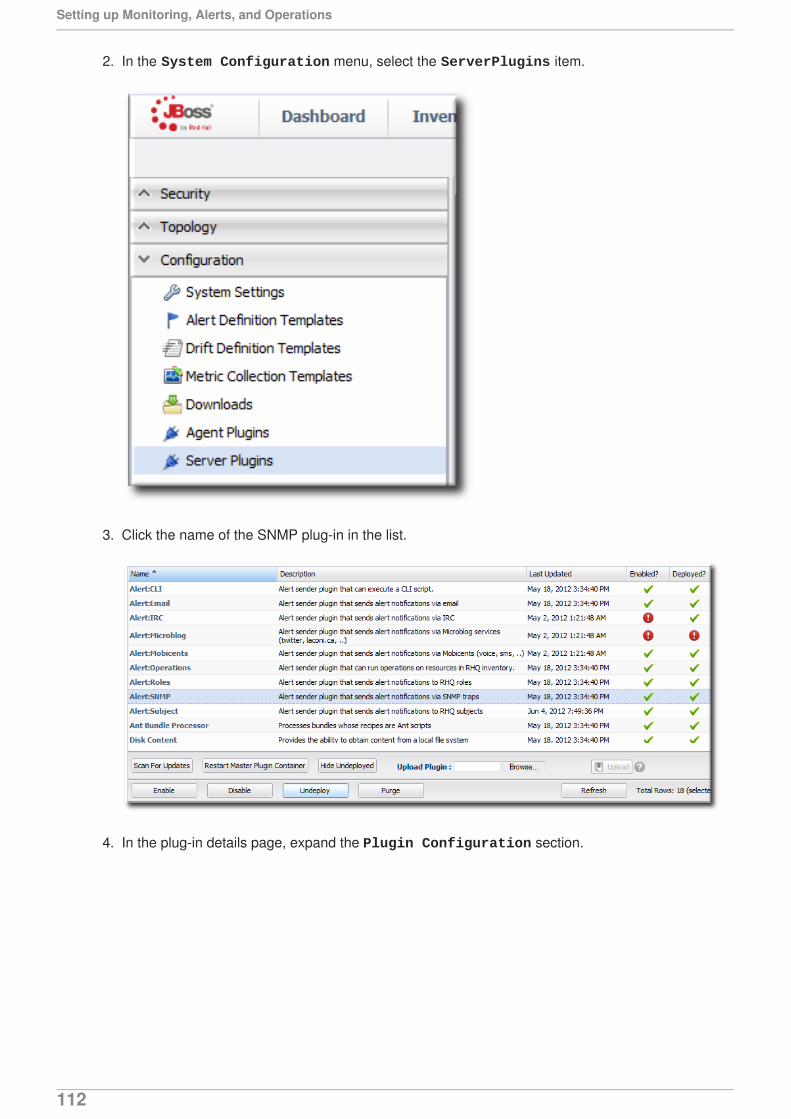
2. In the System Configuration menu, select the ServerPlugins item.
3. Click the name of the SNMP plug-in in the list.
4. In the plug-in details page, expand the Plugin Configuration section.
Setting up Monitoring, Alerts, and Operations
112
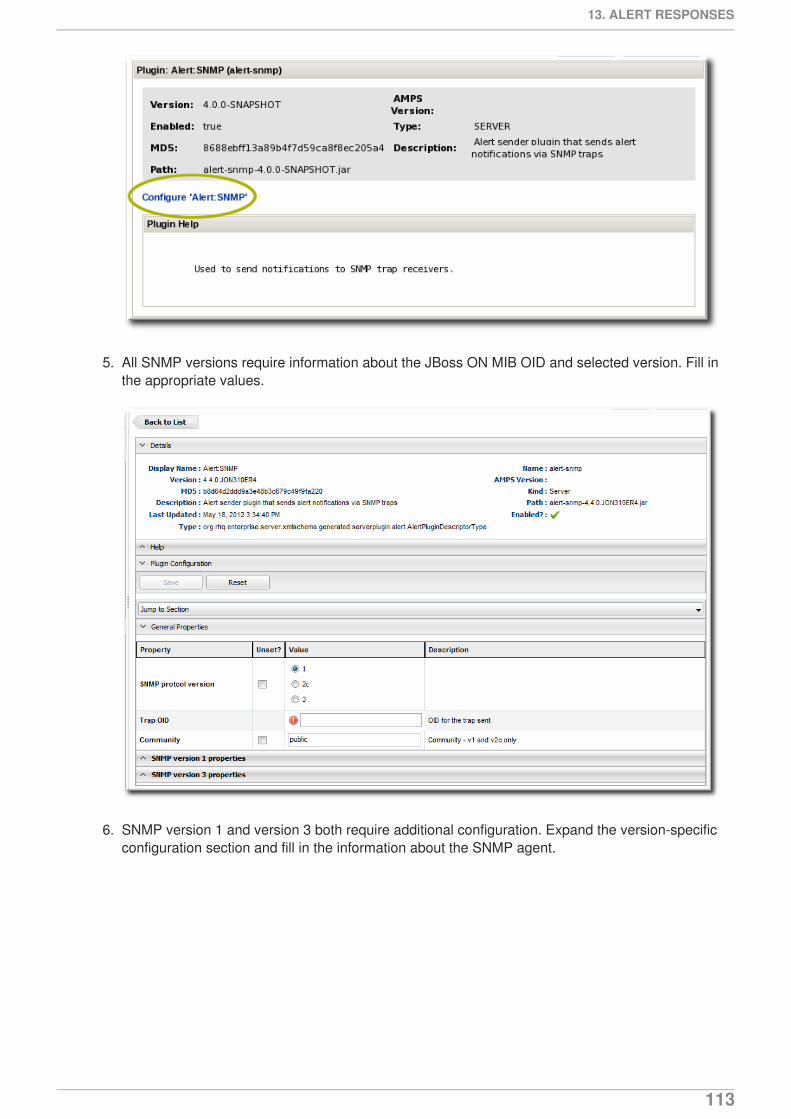
5. All SNMP versions require information about the JBoss ON MIB OID and selected version. Fill inthe appropriate values.
6. SNMP version 1 and version 3 both require additional configuration. Expand the version-specificconfiguration section and fill in the information about the SNMP agent.
13. ALERT RESPONSES
113
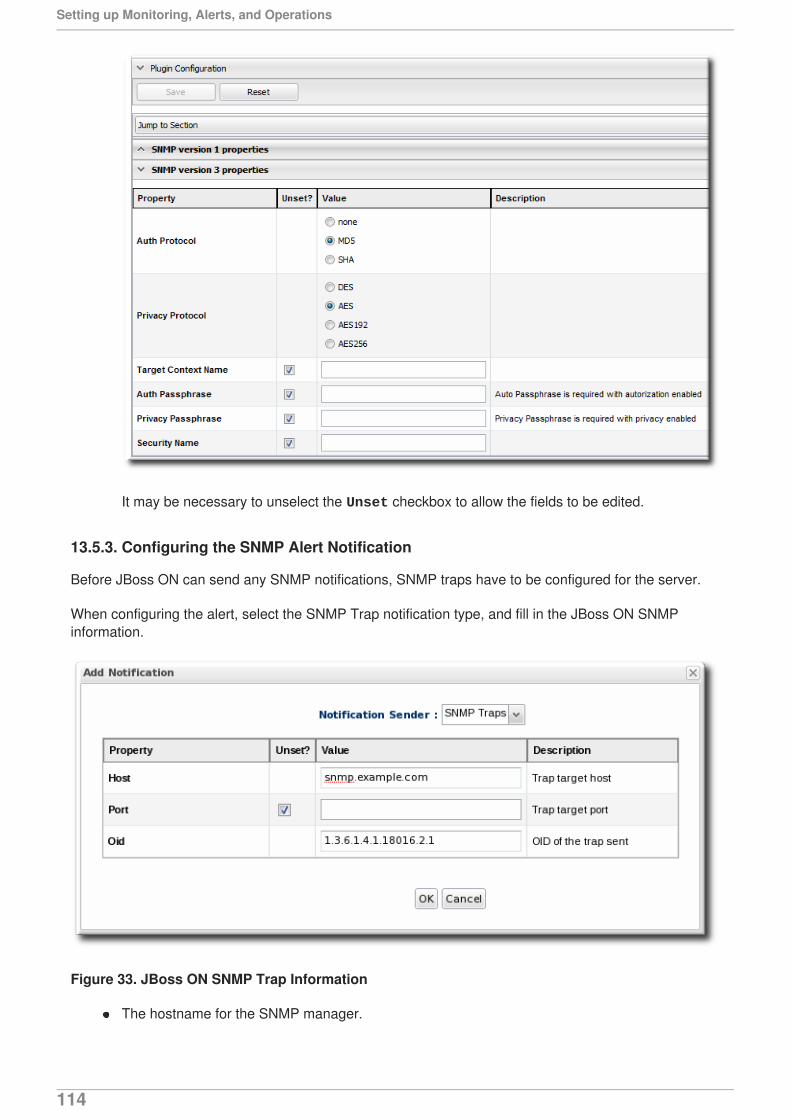
It may be necessary to unselect the Unset checkbox to allow the fields to be edited.
13.5.3. Configuring the SNMP Alert Notification
Before JBoss ON can send any SNMP notifications, SNMP traps have to be configured for the server.
When configuring the alert, select the SNMP Trap notification type, and fill in the JBoss ON SNMPinformation.
Figure 33. JBoss ON SNMP Trap Information
The hostname for the SNMP manager.
Setting up Monitoring, Alerts, and Operations
114
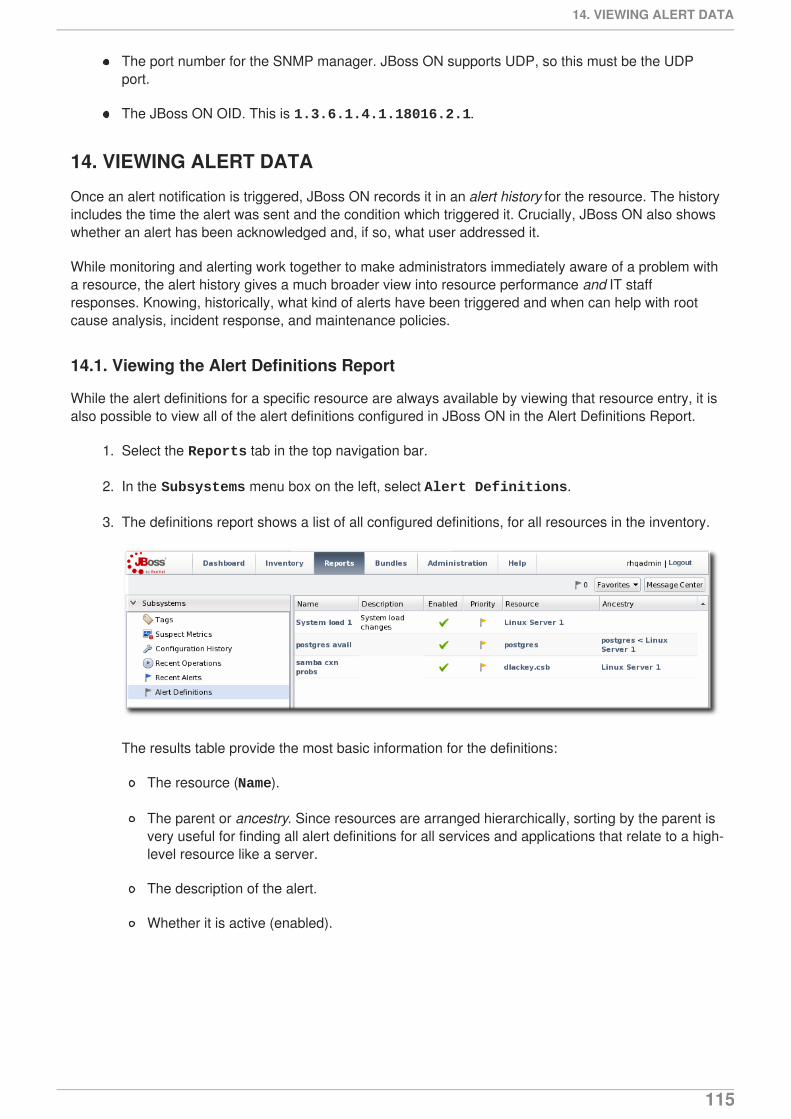
The port number for the SNMP manager. JBoss ON supports UDP, so this must be the UDPport.
The JBoss ON OID. This is 1.3.6.1.4.1.18016.2.1.
14. VIEWING ALERT DATA
Once an alert notification is triggered, JBoss ON records it in an alert history for the resource. The historyincludes the time the alert was sent and the condition which triggered it. Crucially, JBoss ON also showswhether an alert has been acknowledged and, if so, what user addressed it.
While monitoring and alerting work together to make administrators immediately aware of a problem witha resource, the alert history gives a much broader view into resource performance and IT staffresponses. Knowing, historically, what kind of alerts have been triggered and when can help with rootcause analysis, incident response, and maintenance policies.
14.1. Viewing the Alert Definitions Report
While the alert definitions for a specific resource are always available by viewing that resource entry, it isalso possible to view all of the alert definitions configured in JBoss ON in the Alert Definitions Report.
1. Select the Reports tab in the top navigation bar.
2. In the Subsystems menu box on the left, select Alert Definitions.
3. The definitions report shows a list of all configured definitions, for all resources in the inventory.
The results table provide the most basic information for the definitions:
The resource (Name).
The parent or ancestry. Since resources are arranged hierarchically, sorting by the parent isvery useful for finding all alert definitions for all services and applications that relate to a high-level resource like a server.
The description of the alert.
Whether it is active (enabled).
14. VIEWING ALERT DATA
115
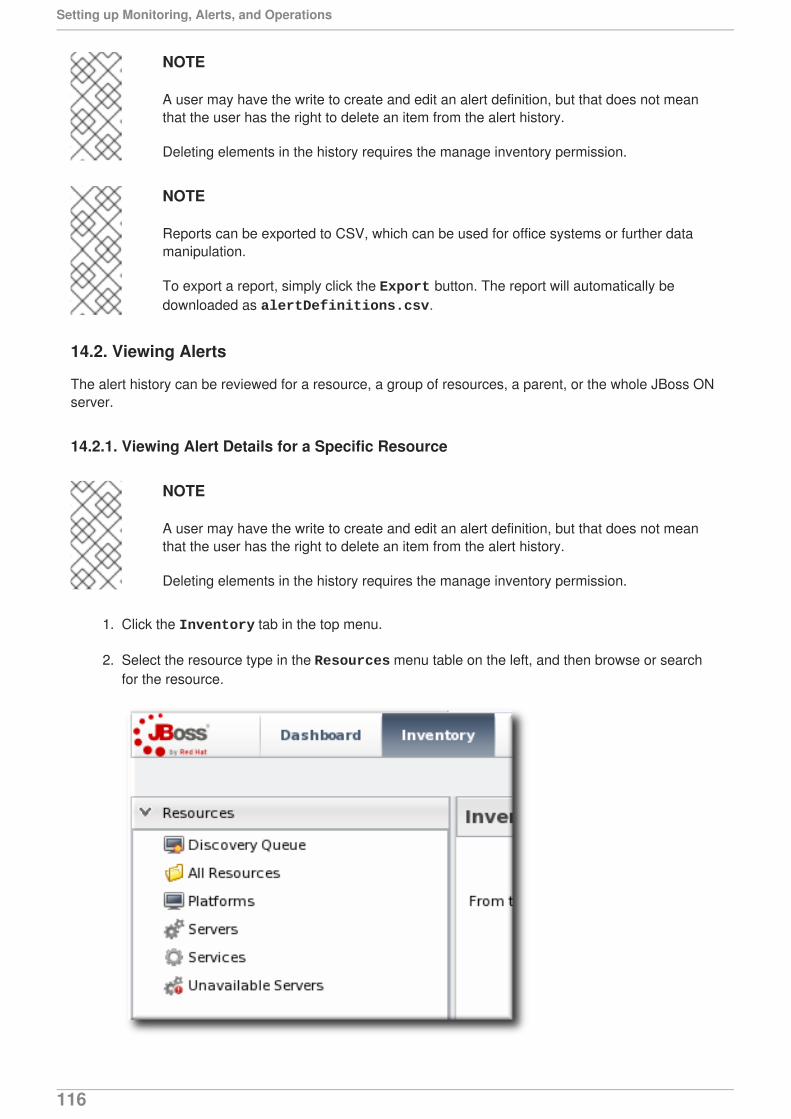
NOTE
A user may have the write to create and edit an alert definition, but that does not meanthat the user has the right to delete an item from the alert history.
Deleting elements in the history requires the manage inventory permission.
NOTE
Reports can be exported to CSV, which can be used for office systems or further datamanipulation.
To export a report, simply click the Export button. The report will automatically bedownloaded as alertDefinitions.csv.
14.2. Viewing Alerts
The alert history can be reviewed for a resource, a group of resources, a parent, or the whole JBoss ONserver.
14.2.1. Viewing Alert Details for a Specific Resource
NOTE
A user may have the write to create and edit an alert definition, but that does not meanthat the user has the right to delete an item from the alert history.
Deleting elements in the history requires the manage inventory permission.
1. Click the Inventory tab in the top menu.
2. Select the resource type in the Resources menu table on the left, and then browse or searchfor the resource.
Setting up Monitoring, Alerts, and Operations
116
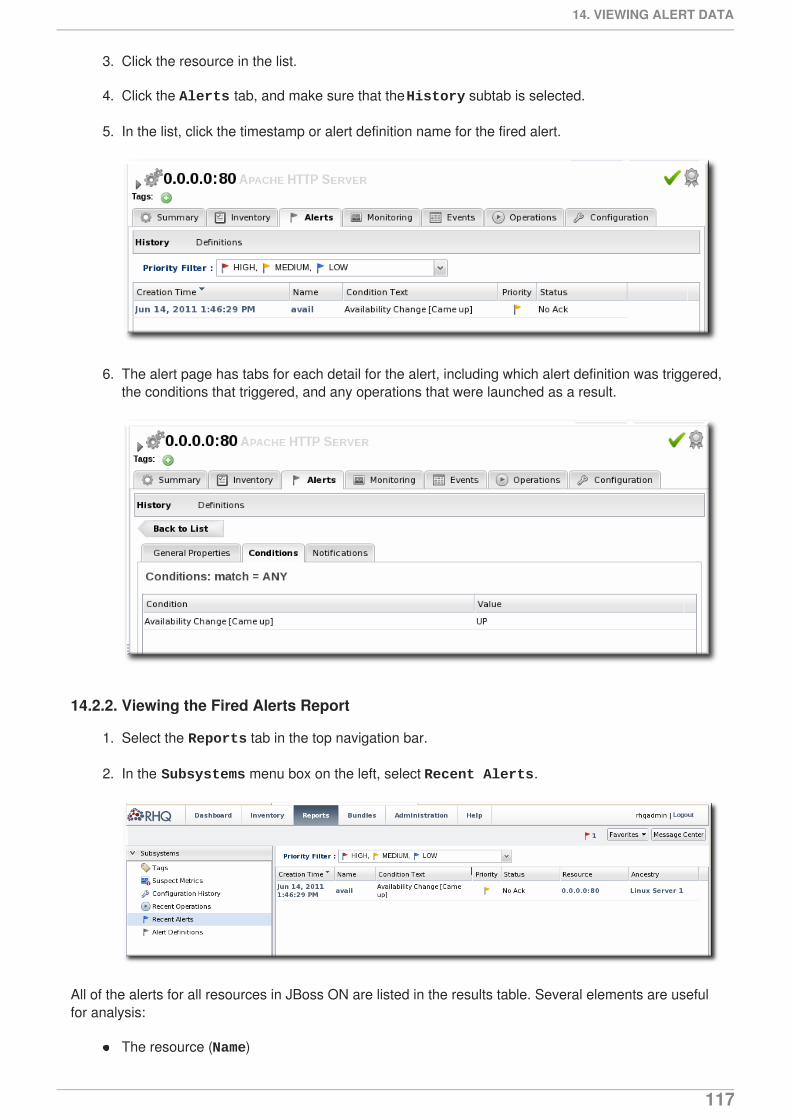
3. Click the resource in the list.
4. Click the Alerts tab, and make sure that the History subtab is selected.
5. In the list, click the timestamp or alert definition name for the fired alert.
6. The alert page has tabs for each detail for the alert, including which alert definition was triggered,the conditions that triggered, and any operations that were launched as a result.
14.2.2. Viewing the Fired Alerts Report
1. Select the Reports tab in the top navigation bar.
2. In the Subsystems menu box on the left, select Recent Alerts.
All of the alerts for all resources in JBoss ON are listed in the results table. Several elements are usefulfor analysis:
The resource (Name)
14. VIEWING ALERT DATA
117
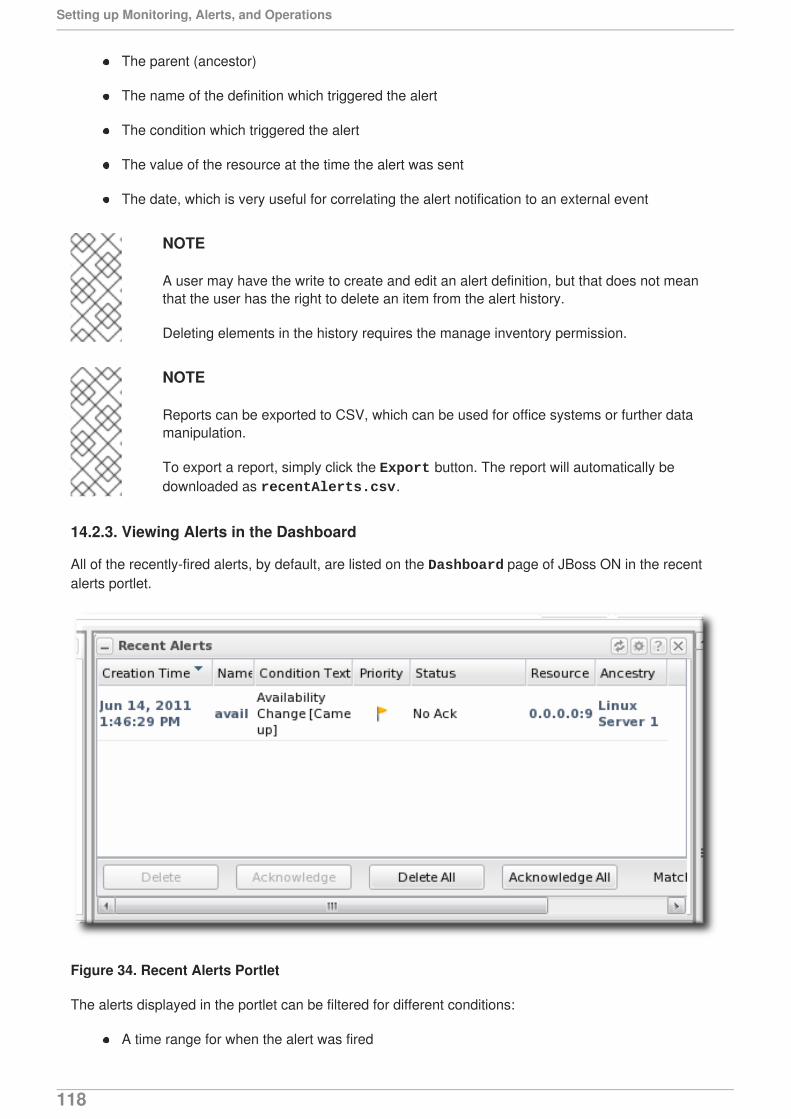
The parent (ancestor)
The name of the definition which triggered the alert
The condition which triggered the alert
The value of the resource at the time the alert was sent
The date, which is very useful for correlating the alert notification to an external event
NOTE
A user may have the write to create and edit an alert definition, but that does not meanthat the user has the right to delete an item from the alert history.
Deleting elements in the history requires the manage inventory permission.
NOTE
Reports can be exported to CSV, which can be used for office systems or further datamanipulation.
To export a report, simply click the Export button. The report will automatically bedownloaded as recentAlerts.csv.
14.2.3. Viewing Alerts in the Dashboard
All of the recently-fired alerts, by default, are listed on the Dashboard page of JBoss ON in the recentalerts portlet.
Figure 34. Recent Alerts Portlet
The alerts displayed in the portlet can be filtered for different conditions:
A time range for when the alert was fired
Setting up Monitoring, Alerts, and Operations
118
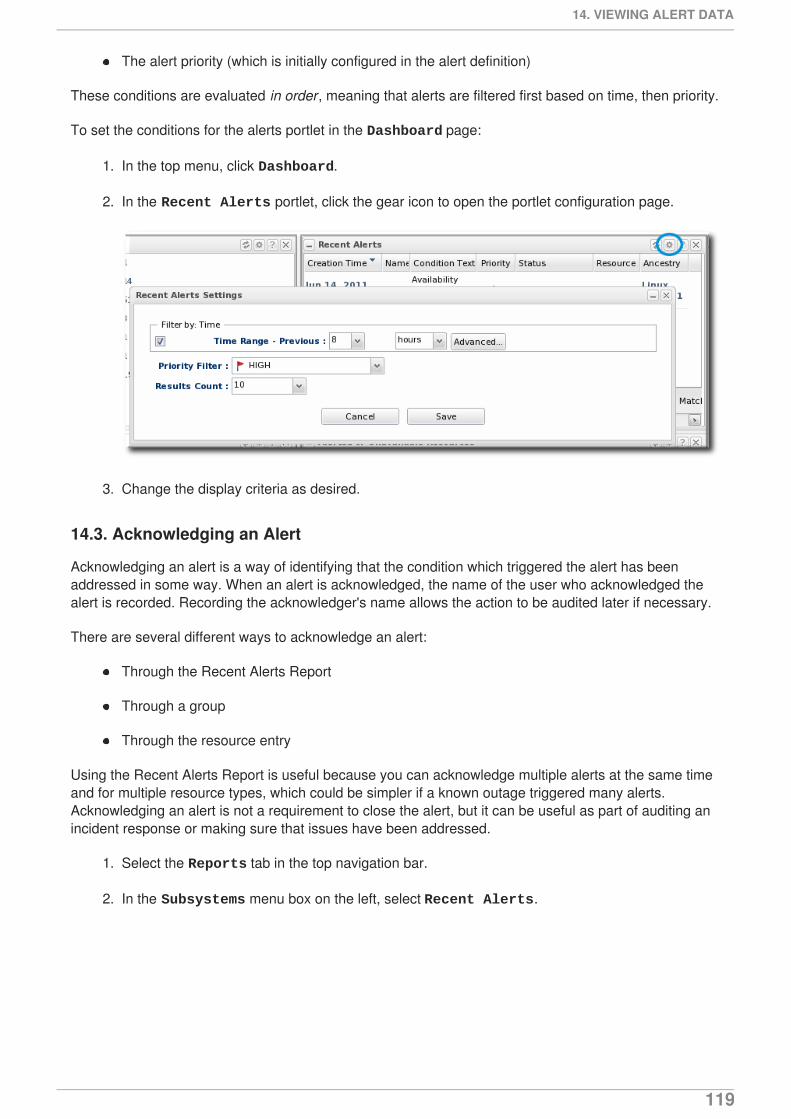
The alert priority (which is initially configured in the alert definition)
These conditions are evaluated in order, meaning that alerts are filtered first based on time, then priority.
To set the conditions for the alerts portlet in the Dashboard page:
1. In the top menu, click Dashboard.
2. In the Recent Alerts portlet, click the gear icon to open the portlet configuration page.
3. Change the display criteria as desired.
14.3. Acknowledging an Alert
Acknowledging an alert is a way of identifying that the condition which triggered the alert has beenaddressed in some way. When an alert is acknowledged, the name of the user who acknowledged thealert is recorded. Recording the acknowledger's name allows the action to be audited later if necessary.
There are several different ways to acknowledge an alert:
Through the Recent Alerts Report
Through a group
Through the resource entry
Using the Recent Alerts Report is useful because you can acknowledge multiple alerts at the same timeand for multiple resource types, which could be simpler if a known outage triggered many alerts.Acknowledging an alert is not a requirement to close the alert, but it can be useful as part of auditing anincident response or making sure that issues have been addressed.
1. Select the Reports tab in the top navigation bar.
2. In the Subsystems menu box on the left, select Recent Alerts.
14. VIEWING ALERT DATA
119
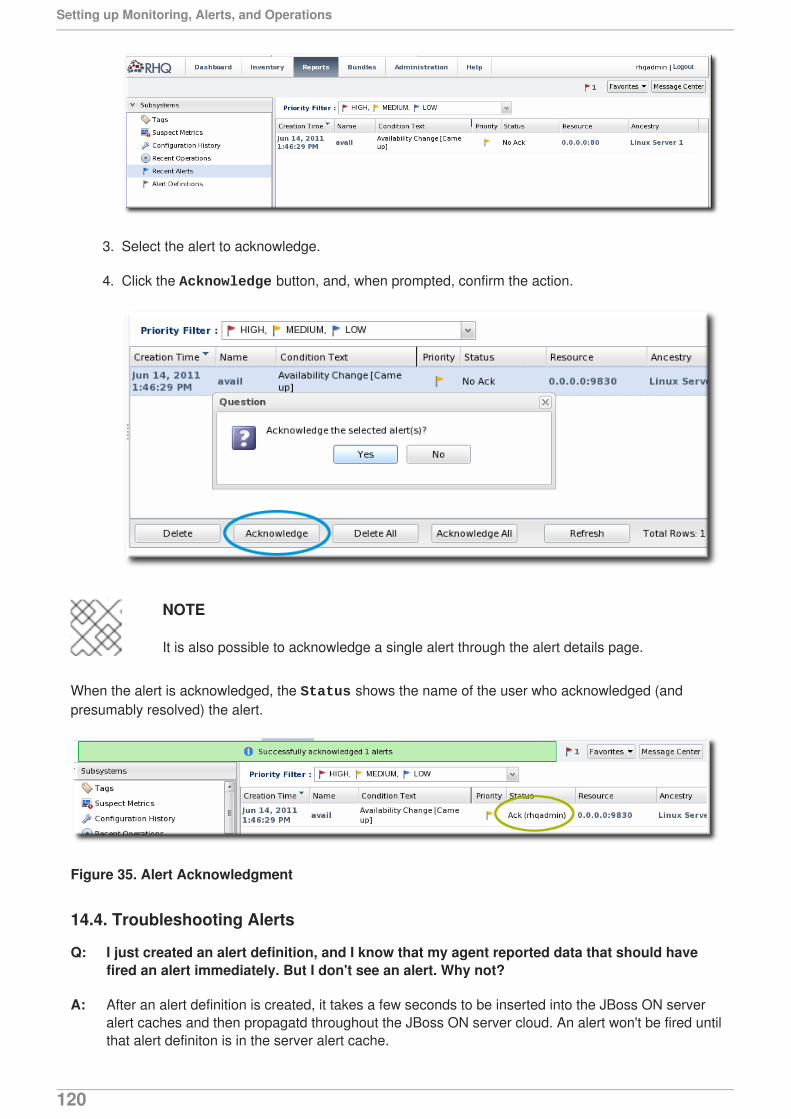
Q:
A:
3. Select the alert to acknowledge.
4. Click the Acknowledge button, and, when prompted, confirm the action.
NOTE
It is also possible to acknowledge a single alert through the alert details page.
When the alert is acknowledged, the Status shows the name of the user who acknowledged (andpresumably resolved) the alert.
Figure 35. Alert Acknowledgment
14.4. Troubleshooting Alerts
I just created an alert definition, and I know that my agent reported data that should havefired an alert immediately. But I don't see an alert. Why not?
After an alert definition is created, it takes a few seconds to be inserted into the JBoss ON serveralert caches and then propagatd throughout the JBoss ON server cloud. An alert won't be fired untilthat alert definiton is in the server alert cache.
Setting up Monitoring, Alerts, and Operations
120
Q:
A:
When the alert definition is inserted into the cache, a message is recored in the JBoss ON serverlogs:
INFO [CacheConsistencyManagerBean] localhost took [51]ms to reload global cacheINFO [CacheConsistencyManagerBean] localhost took [49]ms to reload cache for 1 agents
It generally takes around 30 seconds for an alert definition to be added to the cache. Wait at least aminute after creating a definition before checking if it fires an alert.
Why do I see alerts triggered on different metric values on different alert definitionconditions when they are using the same metric?
This can occur due to the nature of how alert conditions are processed when measurement datacomes in from the agent. This happens if a single alert definition has multiple conditions that usethe same metric and that alert definition uses the "ALL" conjunction. For example, if an alertdefinition has one condition for "alert if metric X is greater than 5" and a separate condition for"alert if metric X less than 10."
The alert condition range works around this by doing range checking. For more information, seeSection 12.2, “Detailed Discussion: Ranges, AND, and OR Operators with Conditions”.
15. OPERATIONS: AN INTRODUCTION
JBoss Operations Network provides a way to manage resources by scheduling and launchingoperations. Operations are basic management tasks. The available tasks differ for every different type ofresource.
The Resource Reference: Monitoring, Operation, and Configuration Options contains a completereference for all of the operations that can be scheduled for each resource type, as well as configurableparameters for the operations. Regardless of the type of operation or resource, the process forscheduling operations is similar for both resources and compatible groups in JBoss ON.
JBoss Operations Network allows administrators to manage resources by scheduling and launchingoperations. Operations manage resources by initiating or even scheduling some basic, specified tasks,such as restarting a server or running a script. Operations can be carried out on any resource in theinventory, and even on the JBoss ON agent themselves. The types of operations that are available foreach resource depends on the type of resource being managed. For example, a JBoss AS server hasdifferent available operations than a cron service. The supported operations for a resource are definedby its agent plug-in, and the default operations are listed for each resource type in the ResourceReference: Monitoring, Operation, and Configuration Options.
15.1. A Summary of Operation Benefits
Operations provide a way to perform tasks in a consistent way, with a defined order both on resourcesand in task queuing, and in a way that can be tracked. Because operations are defined by plug-ins, theyare extensible. The versatility of running specific tasks through JBoss ON provides several benefits toadministrators:
15. OPERATIONS: AN INTRODUCTION
121
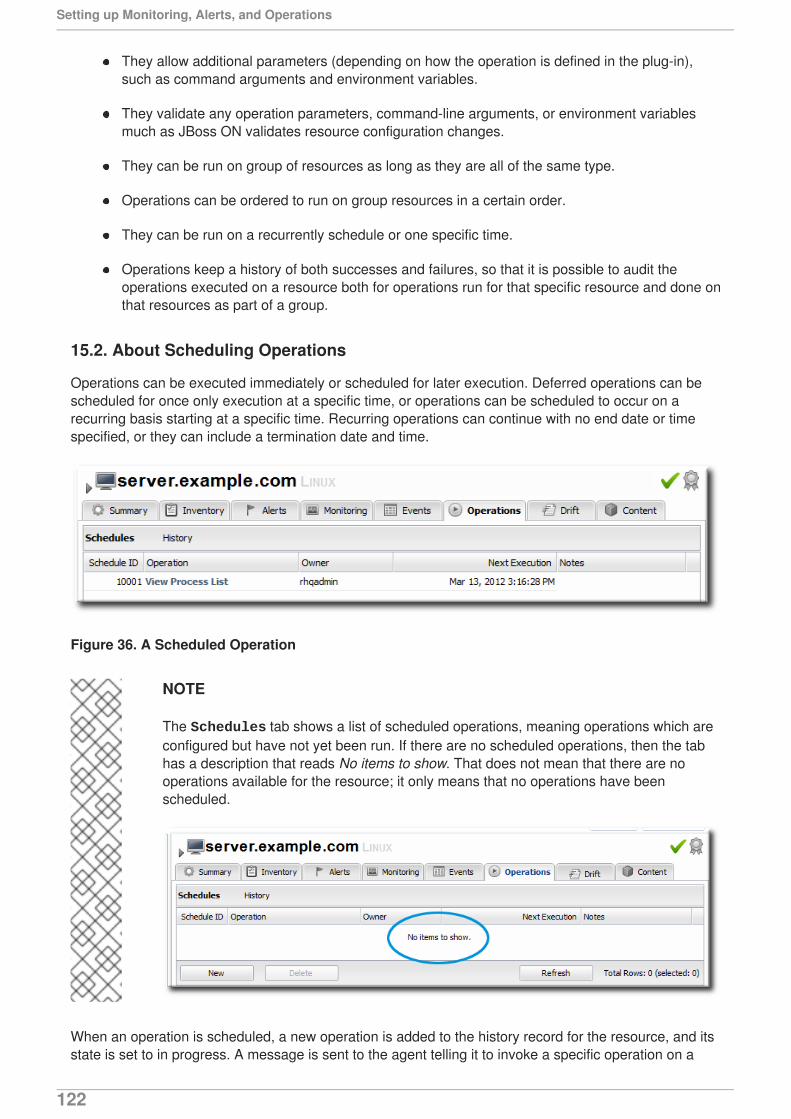
They allow additional parameters (depending on how the operation is defined in the plug-in),such as command arguments and environment variables.
They validate any operation parameters, command-line arguments, or environment variablesmuch as JBoss ON validates resource configuration changes.
They can be run on group of resources as long as they are all of the same type.
Operations can be ordered to run on group resources in a certain order.
They can be run on a recurrently schedule or one specific time.
Operations keep a history of both successes and failures, so that it is possible to audit theoperations executed on a resource both for operations run for that specific resource and done onthat resources as part of a group.
15.2. About Scheduling Operations
Operations can be executed immediately or scheduled for later execution. Deferred operations can bescheduled for once only execution at a specific time, or operations can be scheduled to occur on arecurring basis starting at a specific time. Recurring operations can continue with no end date or timespecified, or they can include a termination date and time.
Figure 36. A Scheduled Operation
NOTE
The Schedules tab shows a list of scheduled operations, meaning operations which areconfigured but have not yet been run. If there are no scheduled operations, then the tabhas a description that reads No items to show. That does not mean that there are nooperations available for the resource; it only means that no operations have beenscheduled.
When an operation is scheduled, a new operation is added to the history record for the resource, and itsstate is set to in progress. A message is sent to the agent telling it to invoke a specific operation on a
Setting up Monitoring, Alerts, and Operations
122
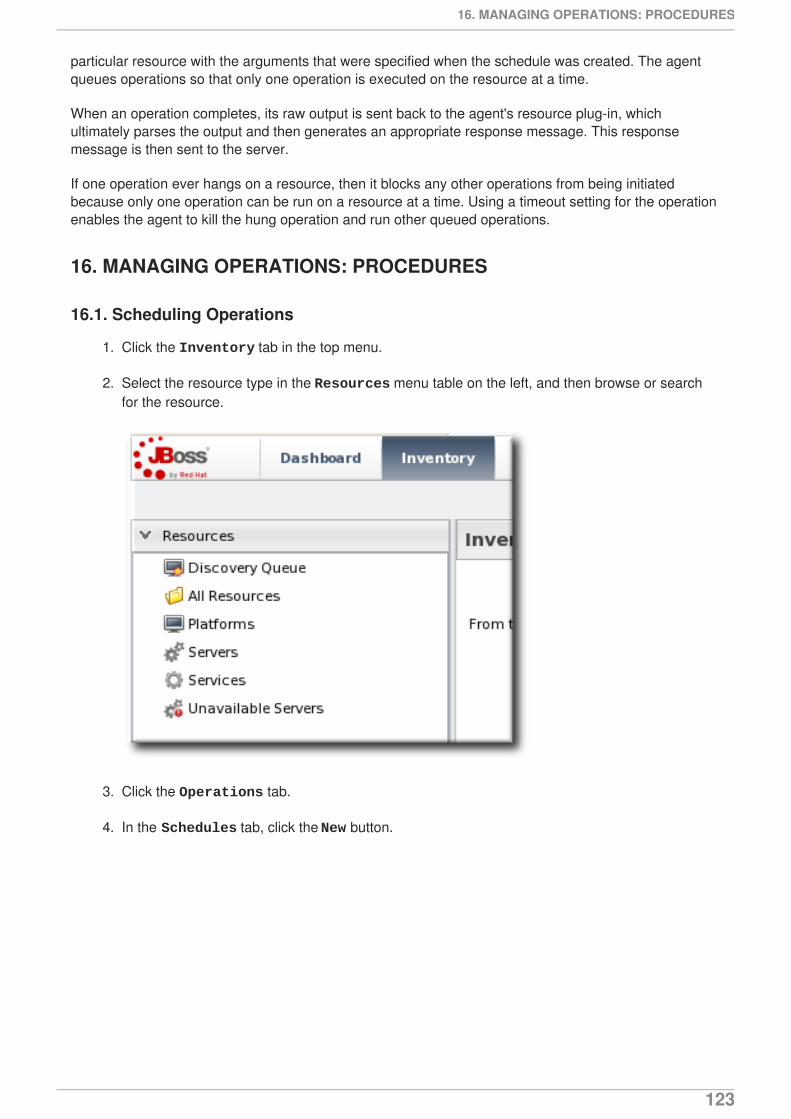
particular resource with the arguments that were specified when the schedule was created. The agentqueues operations so that only one operation is executed on the resource at a time.
When an operation completes, its raw output is sent back to the agent's resource plug-in, whichultimately parses the output and then generates an appropriate response message. This responsemessage is then sent to the server.
If one operation ever hangs on a resource, then it blocks any other operations from being initiatedbecause only one operation can be run on a resource at a time. Using a timeout setting for the operationenables the agent to kill the hung operation and run other queued operations.
16. MANAGING OPERATIONS: PROCEDURES
16.1. Scheduling Operations
1. Click the Inventory tab in the top menu.
2. Select the resource type in the Resources menu table on the left, and then browse or searchfor the resource.
3. Click the Operations tab.
4. In the Schedules tab, click the New button.
16. MANAGING OPERATIONS: PROCEDURES
123
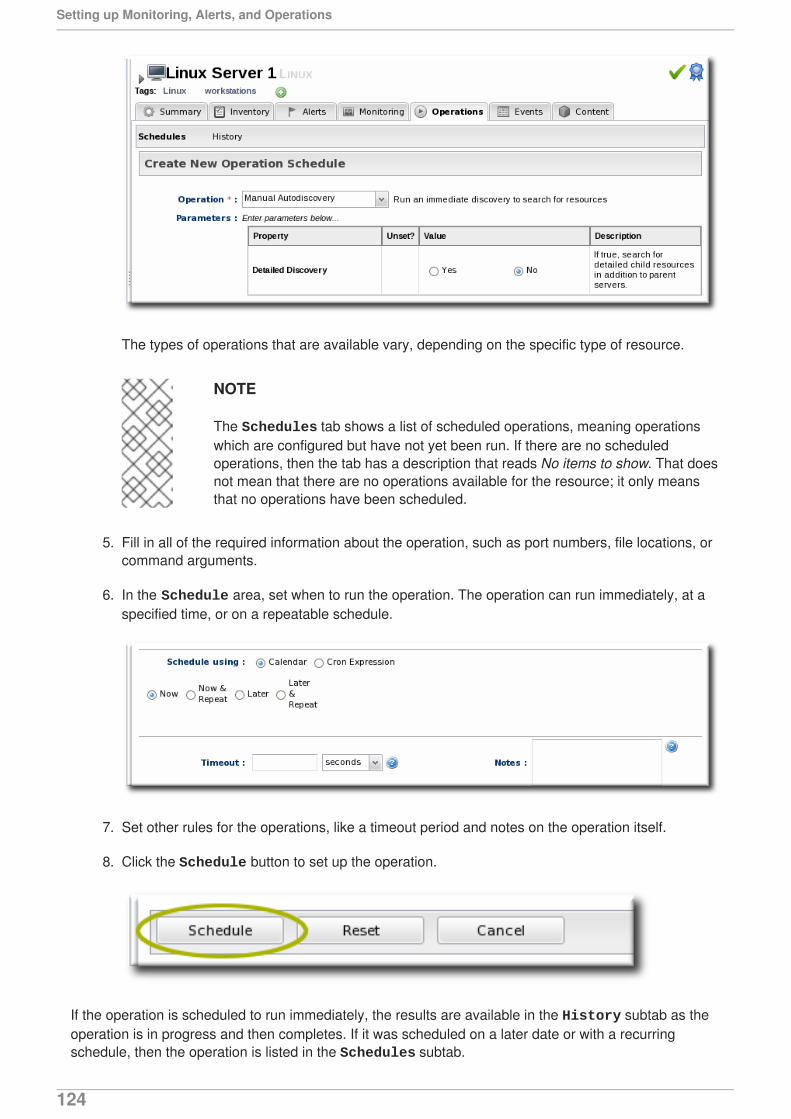
The types of operations that are available vary, depending on the specific type of resource.
NOTE
The Schedules tab shows a list of scheduled operations, meaning operationswhich are configured but have not yet been run. If there are no scheduledoperations, then the tab has a description that reads No items to show. That doesnot mean that there are no operations available for the resource; it only meansthat no operations have been scheduled.
5. Fill in all of the required information about the operation, such as port numbers, file locations, orcommand arguments.
6. In the Schedule area, set when to run the operation. The operation can run immediately, at aspecified time, or on a repeatable schedule.
7. Set other rules for the operations, like a timeout period and notes on the operation itself.
8. Click the Schedule button to set up the operation.
If the operation is scheduled to run immediately, the results are available in the History subtab as theoperation is in progress and then completes. If it was scheduled on a later date or with a recurringschedule, then the operation is listed in the Schedules subtab.
Setting up Monitoring, Alerts, and Operations
124
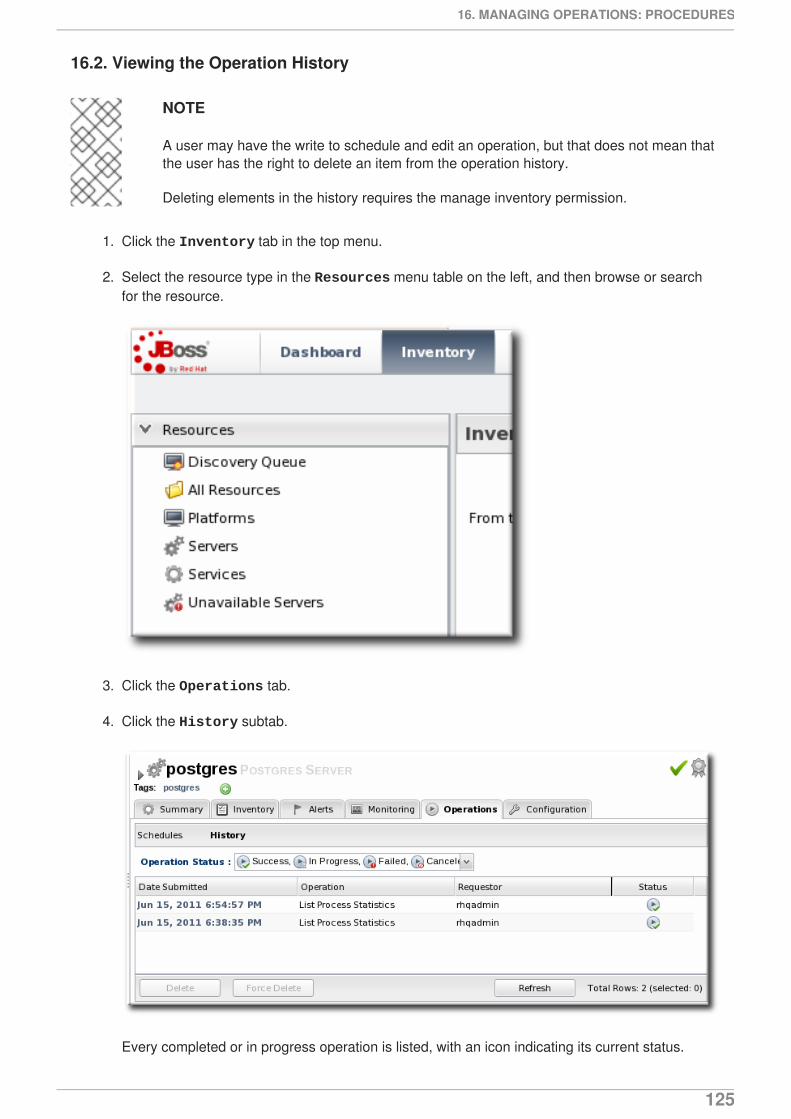
16.2. Viewing the Operation History
NOTE
A user may have the write to schedule and edit an operation, but that does not mean thatthe user has the right to delete an item from the operation history.
Deleting elements in the history requires the manage inventory permission.
1. Click the Inventory tab in the top menu.
2. Select the resource type in the Resources menu table on the left, and then browse or searchfor the resource.
3. Click the Operations tab.
4. Click the History subtab.
Every completed or in progress operation is listed, with an icon indicating its current status.
16. MANAGING OPERATIONS: PROCEDURES
125
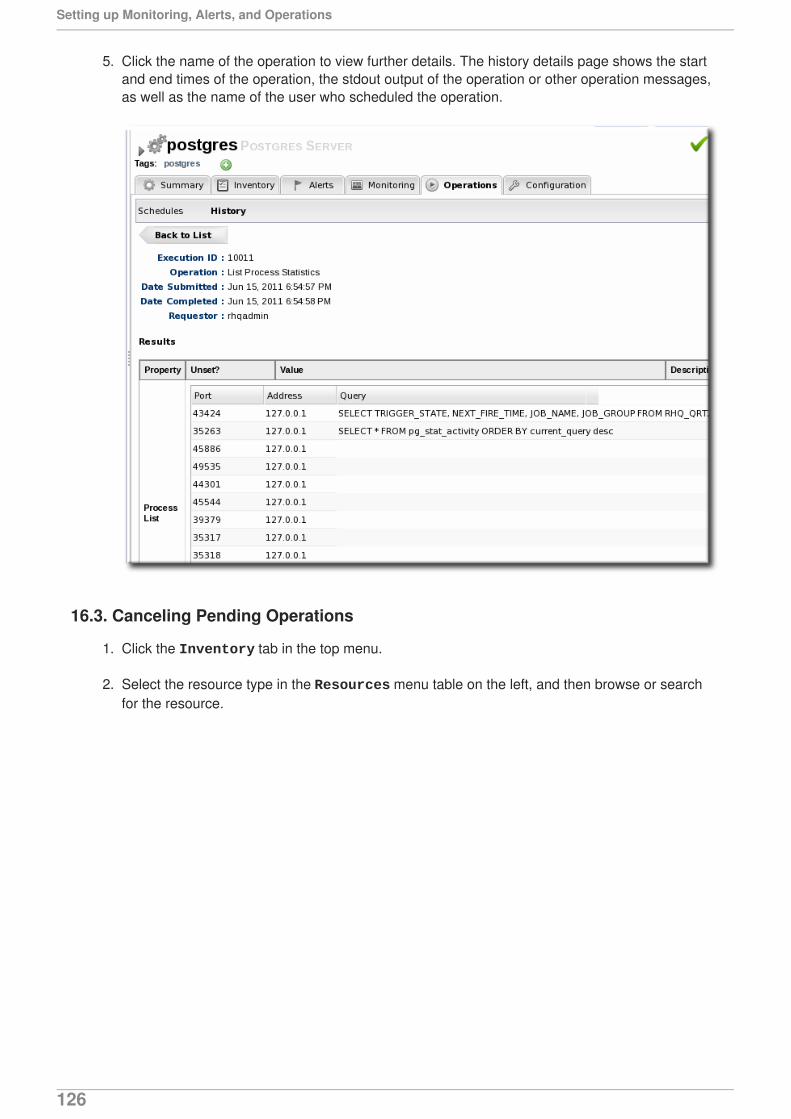
5. Click the name of the operation to view further details. The history details page shows the startand end times of the operation, the stdout output of the operation or other operation messages,as well as the name of the user who scheduled the operation.
16.3. Canceling Pending Operations
1. Click the Inventory tab in the top menu.
2. Select the resource type in the Resources menu table on the left, and then browse or searchfor the resource.
Setting up Monitoring, Alerts, and Operations
126
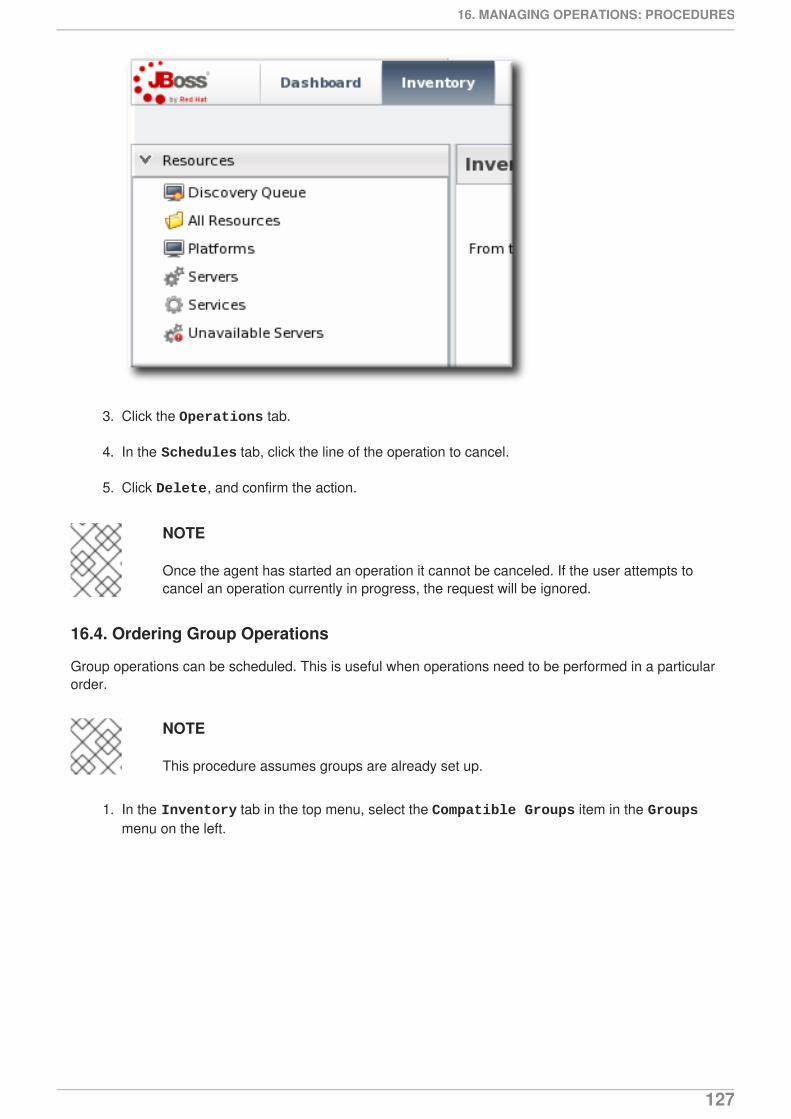
3. Click the Operations tab.
4. In the Schedules tab, click the line of the operation to cancel.
5. Click Delete, and confirm the action.
NOTE
Once the agent has started an operation it cannot be canceled. If the user attempts tocancel an operation currently in progress, the request will be ignored.
16.4. Ordering Group Operations
Group operations can be scheduled. This is useful when operations need to be performed in a particularorder.
NOTE
This procedure assumes groups are already set up.
1. In the Inventory tab in the top menu, select the Compatible Groups item in the Groupsmenu on the left.
16. MANAGING OPERATIONS: PROCEDURES
127
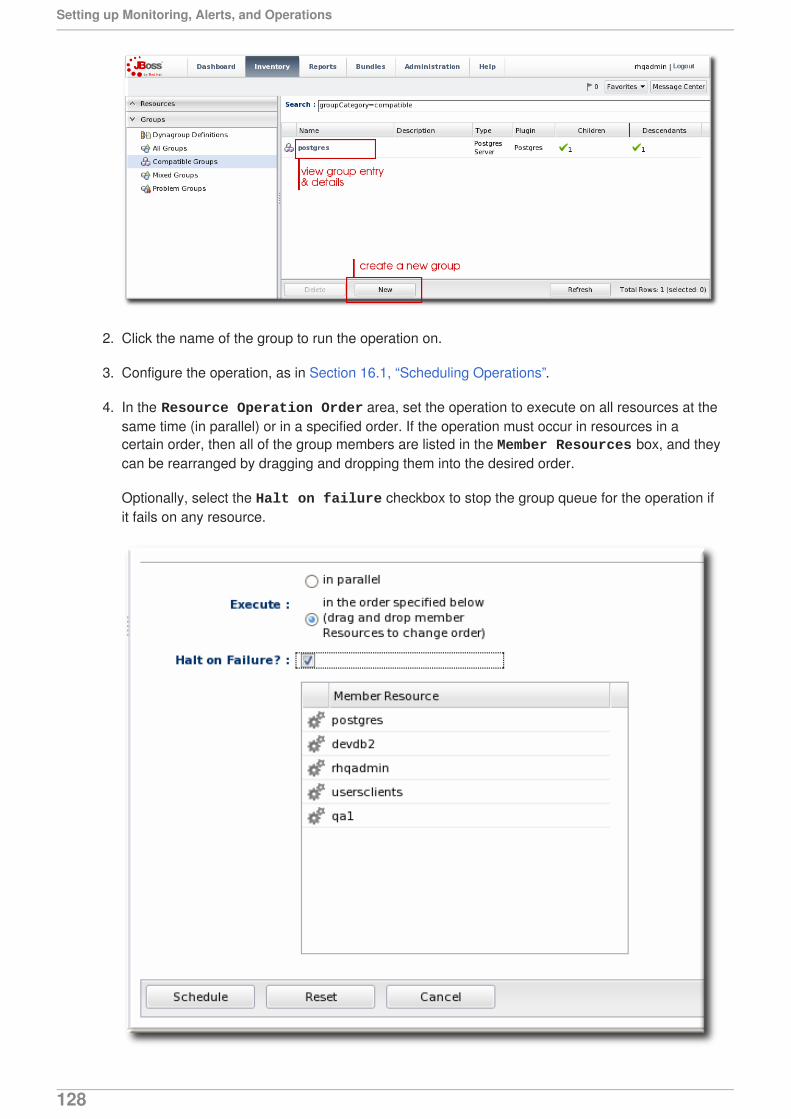
2. Click the name of the group to run the operation on.
3. Configure the operation, as in Section 16.1, “Scheduling Operations”.
4. In the Resource Operation Order area, set the operation to execute on all resources at thesame time (in parallel) or in a specified order. If the operation must occur in resources in acertain order, then all of the group members are listed in the Member Resources box, and theycan be rearranged by dragging and dropping them into the desired order.
Optionally, select the Halt on failure checkbox to stop the group queue for the operation ifit fails on any resource.
Setting up Monitoring, Alerts, and Operations
128
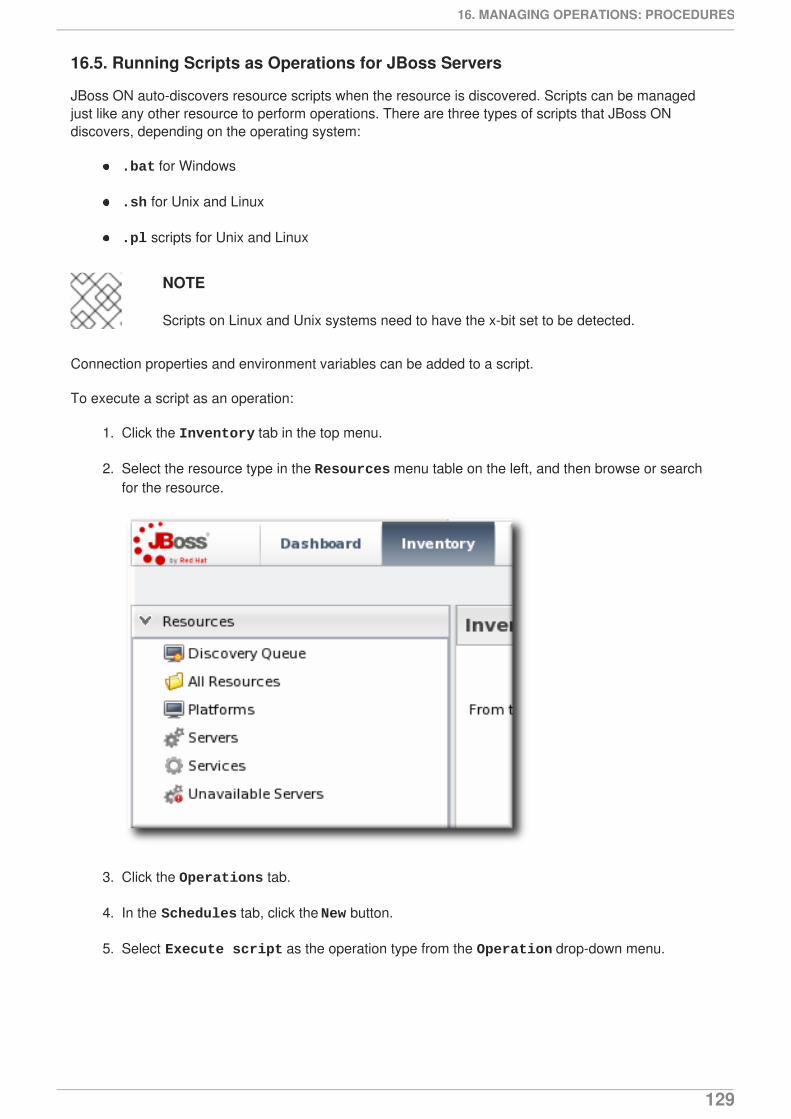
16.5. Running Scripts as Operations for JBoss Servers
JBoss ON auto-discovers resource scripts when the resource is discovered. Scripts can be managedjust like any other resource to perform operations. There are three types of scripts that JBoss ONdiscovers, depending on the operating system:
.bat for Windows
.sh for Unix and Linux
.pl scripts for Unix and Linux
NOTE
Scripts on Linux and Unix systems need to have the x-bit set to be detected.
Connection properties and environment variables can be added to a script.
To execute a script as an operation:
1. Click the Inventory tab in the top menu.
2. Select the resource type in the Resources menu table on the left, and then browse or searchfor the resource.
3. Click the Operations tab.
4. In the Schedules tab, click the New button.
5. Select Execute script as the operation type from the Operation drop-down menu.
16. MANAGING OPERATIONS: PROCEDURES
129
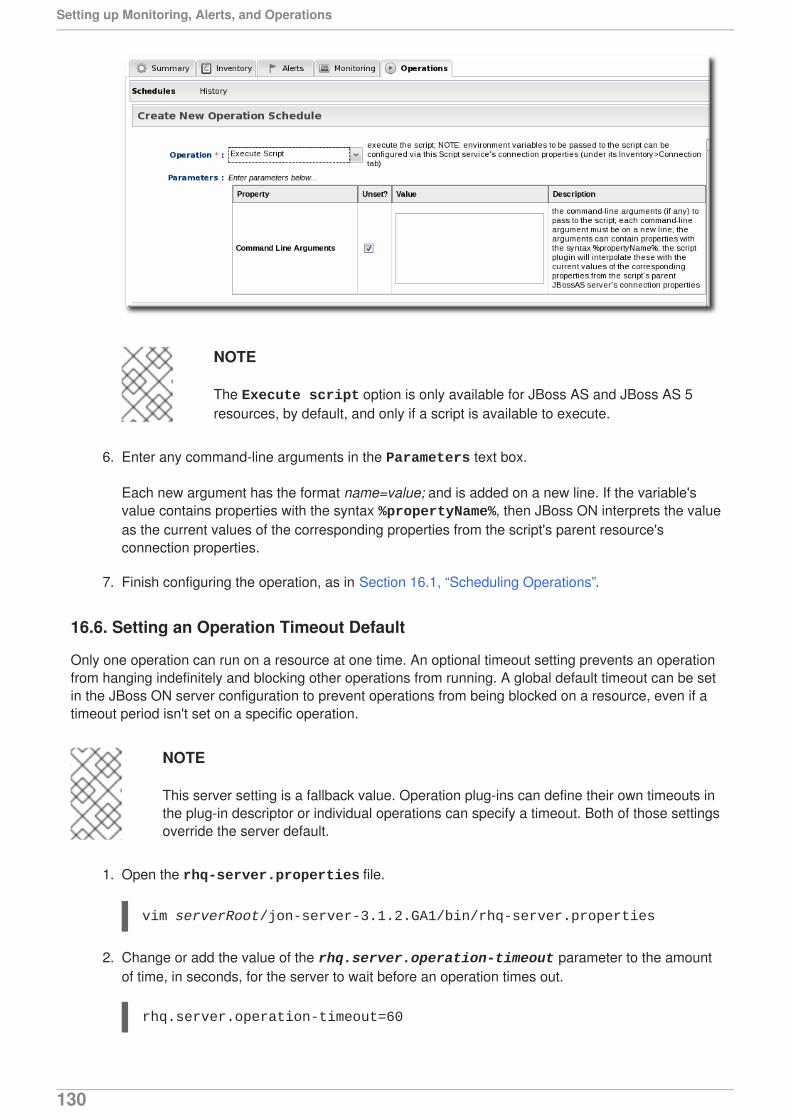
NOTE
The Execute script option is only available for JBoss AS and JBoss AS 5resources, by default, and only if a script is available to execute.
6. Enter any command-line arguments in the Parameters text box.
Each new argument has the format name=value; and is added on a new line. If the variable'svalue contains properties with the syntax %propertyName%, then JBoss ON interprets the valueas the current values of the corresponding properties from the script's parent resource'sconnection properties.
7. Finish configuring the operation, as in Section 16.1, “Scheduling Operations”.
16.6. Setting an Operation Timeout Default
Only one operation can run on a resource at one time. An optional timeout setting prevents an operationfrom hanging indefinitely and blocking other operations from running. A global default timeout can be setin the JBoss ON server configuration to prevent operations from being blocked on a resource, even if atimeout period isn't set on a specific operation.
NOTE
This server setting is a fallback value. Operation plug-ins can define their own timeouts inthe plug-in descriptor or individual operations can specify a timeout. Both of those settingsoverride the server default.
1. Open the rhq-server.properties file.
vim serverRoot/jon-server-3.1.2.GA1/bin/rhq-server.properties
2. Change or add the value of the rhq.server.operation-timeout parameter to the amountof time, in seconds, for the server to wait before an operation times out.
rhq.server.operation-timeout=60
Setting up Monitoring, Alerts, and Operations
130
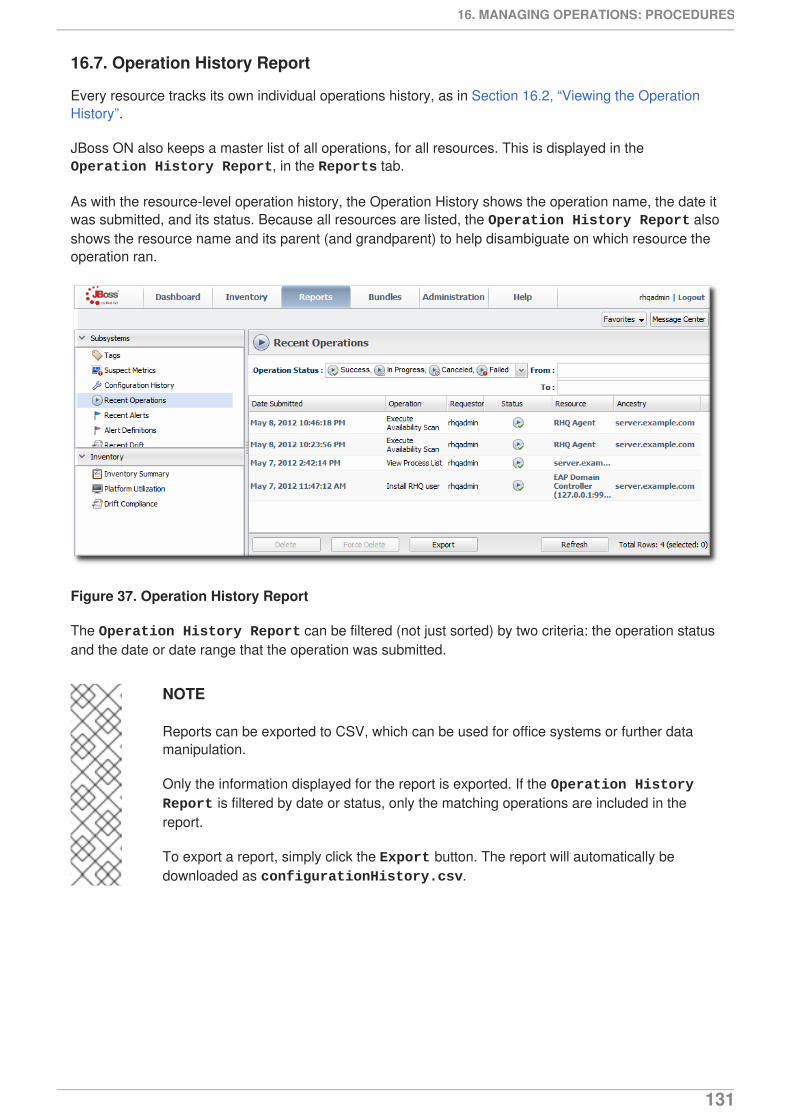
16.7. Operation History Report
Every resource tracks its own individual operations history, as in Section 16.2, “Viewing the OperationHistory”.
JBoss ON also keeps a master list of all operations, for all resources. This is displayed in the Operation History Report, in the Reports tab.
As with the resource-level operation history, the Operation History shows the operation name, the date itwas submitted, and its status. Because all resources are listed, the Operation History Report alsoshows the resource name and its parent (and grandparent) to help disambiguate on which resource theoperation ran.
Figure 37. Operation History Report
The Operation History Report can be filtered (not just sorted) by two criteria: the operation statusand the date or date range that the operation was submitted.
NOTE
Reports can be exported to CSV, which can be used for office systems or further datamanipulation.
Only the information displayed for the report is exported. If the Operation History Report is filtered by date or status, only the matching operations are included in thereport.
To export a report, simply click the Export button. The report will automatically bedownloaded as configurationHistory.csv.
16. MANAGING OPERATIONS: PROCEDURES
131
INDEX
A
alerts
acknowledging, Acknowledging an Alert
assigning operations, Detailed Discussion: Initiating an Operation
available operation tokens, Using Tokens with Alert Operations
conditions, Reasons for Firing an Alert
configuring, Planning Alerts
configuring and managing, Alert Conditions, Alert Responses
configuring for groups, Configuring Group Alerts
creating definition templates, Creating Alert Definition Templates
definitions report, Viewing the Alert Definitions Report
enabling and disabling definitions, Enabling and Disabling Alert Definitions
fired alerts report, Viewing the Fired Alerts Report
groups and templates, Group Alerting and Alert Templates
histories and acknowledgments, Viewing Alert Data
initiating CLI scripts, Detailed Discussion: Launching JBoss ON CLI Scripts from an Alert
initiating resource scripts, Detailed Discussion: Initiating Resource Scripts
notification methods, Notifying Administrators and Responding to Alerts
operations, Detailed Discussion: Initiating an Operation, Setting Alert Operations
setting, Basic Procedure for Setting Alerts for a Resource
setting dashboard display, Viewing Alerts in the Dashboard
SNMP, Configuring SNMP for Notifications, Configuring the SNMP Alert Plug-in
SNMP notifications, Configuring the SNMP Alert Notification
tokens and operations, Using Tokens with Alert Operations
using templates and group alerts, Group Alerting and Alert Templates
viewing, Viewing Alerts
viewing alerts for specific resource, Viewing Alert Details for a Specific Resource
Apache
configuring the SNMP module, Configuring the Apache SNMP Module
auto discovery
Tomcat, Configuring Tomcat/EWS Servers for Monitoring
availability, Availability
charts, Viewing a Resource's Availability Charts
troubleshooting, Core "Up and Down" Monitoring
uptime percentage, Core "Up and Down" Monitoring
B
Setting up Monitoring, Alerts, and Operations
132
baselines
recalculating, Recalculating Baseline Values
C
call-time data, URL Response Time Monitoring
CLI
running for alerts, Detailed Discussion: Launching JBoss ON CLI Scripts from an Alert
configuration
alerts, Alert Conditions, Alert Responses
Apache SNMP module, Configuring the Apache SNMP Module
response time filters for Tomcat, Configuring Response Time Filters for Tomcat
D
dashboard
alerts settings, Viewing Alerts in the Dashboard
data storage
monitoring, Storing Monitoring Data
E
events
defining new events, Defining a New Event
overview, Events
viewing, Viewing Events
G
groups
alerts and templates, Group Alerting and Alert Templates
configuring alerts, Configuring Group Alerts
J
JBoss EAP 6/AS 7
configuring response time metrics, Configuring Response Time Metrics for JBoss EAP 6/AS 7
JBoss EAP/AS 5
configuring response time metrics, Configuring Response Time Metrics for JBoss EAP/AS 5
JBoss ON
and SNMP, JBoss ON SNMP Information
INDEX
133
M
metrics, Metrics and Measurements
baselines, Baselines and Out-of-Bounds Metrics
monitoring
call-time data, URL Response Time Monitoring
changing defaults, Changing Metrics Templates
changing the resource availability scan period, Changing the Agent's Availability Scan Period
collection schedules, Collection Schedules
configuring response time filters for JBoss EAP 6/AS 7 servers, Configuring Response TimeMetrics for JBoss EAP 6/AS 7
configuring response time filters for JBoss EAP/AS 5 servers, Configuring Response TimeMetrics for JBoss EAP/AS 5
configuring Tomcat, Configuring Tomcat/EWS Servers for Monitoring
enabling and disabling metrics, Enabling and Disabling Metrics for a Specific Resource
operations, Reports and Data
out of bounds (OOB), Baselines and Out-of-Bounds Metrics
problem metrics, Baselines and Out-of-Bounds Metrics
recalculating baselines, Recalculating Baseline Values
resources with special configuration, Resources Which Require Special Configuration forMonitoring
response time filters, URL Response Time Monitoring
setting collection intervals, Setting Collection Intervals for a Specific Resource
storage limits for data, Storing Monitoring Data
traits, Resource Traits
N
notifications
SNMP and alerts, Configuring the SNMP Alert Notification
O
operations, Operations: An Introduction
alerts, Detailed Discussion: Initiating an Operation
alerts and tokens, Using Tokens with Alert Operations
canceling, Canceling Pending Operations
executing scripts, Running Scripts as Operations for JBoss Servers
ordering group, Ordering Group Operations
scheduling, About Scheduling Operations, Scheduling Operations
scripts, Running Scripts as Operations for JBoss Servers
setting alert operations, Setting Alert Operations
timeout defaults, Setting an Operation Timeout Default
Setting up Monitoring, Alerts, and Operations
134
timeouts, About Scheduling Operations
viewing history, Viewing the Operation History
R
reports
alert definitions, Viewing the Alert Definitions Report
resources
enabling and disabling metric collection, Enabling and Disabling Metrics for a SpecificResource
monitoring, Reports and Data
monitoring and recalculating baselines, Recalculating Baseline Values
monitoring collection intervals, Setting Collection Intervals for a Specific Resource
setting alerts, Basic Procedure for Setting Alerts for a Resource
viewing alerts for specific resources, Viewing Alert Details for a Specific Resource
response time filters
configuring JBoss EAP 6/AS 7, Configuring Response Time Metrics for JBoss EAP 6/AS 7
configuring JBoss EAP/AS 5, Configuring Response Time Metrics for JBoss EAP/AS 5
configuring Tomcat, Configuring Response Time Filters for Tomcat
response-time filters, URL Response Time Monitoring
S
scripts
as operations, Running Scripts as Operations for JBoss Servers
from alerts, Detailed Discussion: Initiating Resource Scripts
initiating from alerts
CLI, Detailed Discussion: Launching JBoss ON CLI Scripts from an Alert
SNMP
alert notification, Configuring the SNMP Alert Notification
and JBoss ON, JBoss ON SNMP Information
configuring alerts, Configuring the SNMP Alert Plug-in
configuring for alerts, Configuring SNMP for Notifications
configuring the Apache module, Configuring the Apache SNMP Module
T
tokens
alerts and operations, Using Tokens with Alert Operations
Tomcat
configuring response time filters, Configuring Response Time Filters for Tomcat
INDEX
135
monitoring configuration, Configuring Tomcat/EWS Servers for Monitoring
traits, Resource Traits
U
uptime percentage, Core "Up and Down" Monitoring
[1] This is mean in the statistical sense. It is the middle data point of all collected uptime lengths.
Setting up Monitoring, Alerts, and Operations
136