Embed Size (px)
DESCRIPTION
Cristina M. Giannantonio, Ph.D. Amy E. Hurley-Hanson, Ph.D. Published by Chapman University’s Argyros School of Business and Economics Sponsored by the Western Decision Sciences Institute Vol. 15 No. 2 Editors WDSI
Citation preview

Published by Chapman University’s Argyros School of Business and EconomicsSponsored by the Western Decision Sciences Institute
Vol. 15 No. 2
Journal of Business and Management
J.B.M.
Editors
Cristina M. Giannantonio, Ph.D. Amy E. Hurley-Hanson, Ph.D.
WDSI
WESTERN DECISION SCIENCES INSTITUTE
The Western Decision Sciences Institute is a regional division of the Decision SciencesInstitute. WDSI serves its interdisciplinary academic and business members primarilythrough the organization of an annual conference and the publication of the Journal ofBusiness and Management. The conference and journal allow academicians and busi-ness professionals from all over the world to share information and research withrespect to all aspects of education, business, and organizational decisions.
PRESIDENTKeong Leong
University of Nevada, Las Vegas
PRESIDENT-ELECTMahyar Amouzegar
California State University, Long Beach
PROGRAM CHAIR/VICE PRESIDENT FOR PROGRAMS/PROCEEDINGS EDITORNafisseh Heiat
Montana State University-Billings
VICE PRESIDENT FOR PROGRAMS-ELECTJohn Davies
Victoria University of Wellington
VICE PRESIDENT FOR MEMBER SERVICESSheldon R. Smith
Utah Valley State College
SECRETARY/TREASURERRick Henage
Utah Valley University
DIRECTOR OF INFORMATION SYSTEMSAbbas Heiat
Montana State University - Billings
IMMEDIATE PAST-PRESIDENTVijay Kannan
Utah State University
REGIONAL VICE PRESIDENTKaren L. Fowler
University of Northern Colorado
WDSI
Journal of Business and Management – Vol. 15, No. 2, 2009
Journal of Business and ManagementVolume 15 Number 2 2009
EDITORS
Cristina M. Giannantonio, Chapman UniversityAmy E. Hurley-Hanson, Chapman University
Journal of Businessand Management
EDITORS
Cristina M. Giannantonio, Chapman UniversityAmy E. Hurley-Hanson, Chapman University
EDITORIAL BOARD
Nancy BorkowskiFlorida International University
Krishna S. DhirBerry College
Sonia M. GoltzMichigan Tech University
Miles G. NichollsRMIT University
Richard L. JensonUtah State University
Terri A. ScanduraUniversity of Miami
Jeffrey A. SonnenfeldYale University
Victor H. VroomYale University
PAST EDITORS
Burhan Yavas, California State University Dominguez Hills 1993-1999Raymond Hogler, Colorado State University 2000-2004
EDITORIAL STAFF
Rosalinda Monroy, Chapman University Publications Jaclyn Witt, Editorial Assistant
J.B.M.
Contents
The Mediating Influence of Role Stress on the Relationship between Adult
Attention Deficit and Self-Efficacy . . . . . . . . . . . . . . . . . . . . . . . . . . . . . . . . . . . 111
Graeme H. Coetzer, Byron Hanson and Richard Trimble
Anticipation is in the Eye of the Beholder: Top-Level Managers See Things
Differently When It Comes to Crises Preparedness . . . . . . . . . . . . . . . . . . . . . . 129
Milan D. Larson and Karen Fowler
Personality and Virtual Reality Team Candidates: The Roles of Personality Traits,
Technology Anxiety and Trust as Predictors of
Perceptions of Virtual Reality Teams. . . . . . . . . . . . . . . . . . . . . . . . . . . . . . . . . . 143
Paul H. Jacques, John Garger, Carroll A. Brown and Cynthia S. Deale
Bank Selection Criteria of Retail Customers in Bangladesh:
A Study on Khulna City . . . . . . . . . . . . . . . . . . . . . . . . . . . . . . . . . . . . . . . . . . . 159
ATM Jahiruddin and Rumana Haque
Impact of Firm Performance on Changes in Strategic Resource
Allocation Decisions . . . . . . . . . . . . . . . . . . . . . . . . . . . . . . . . . . . . . . . . . . . . . . 171
Hao Ma and Ranjan Karri
3Journal of Business and Management – Vol. 15, No. 2, 2009 iii

Journal of Business and Management – Vol. 15, No. 2, 2009
The Mediating Influence of Role Stress on the Relationshipbetween Adult Attention Deficit
and Self-Efficacy
Graeme H. Coetzer1
Griffith Business School
Byron Hanson
Duke Corporate Education
Richard Trimble
Central Washington University – Lynnwood
Adult Attention Deficit Disorder (AAD) and stress are pervasive andsignificant experiences with harmful consequences for both employees andorganizations as a whole. This research study proposes a network ofsignificant relationships between AAD, role stress, and self-efficacy. Adultswho are experiencing the core symptoms of AAD (difficulties with taskactivation, concentration, effort, emotional interference, and accessingmemory) are less likely to manage their role effectively and develop self-efficacy. The correlations between AAD and both role stress (r = 0.49, p <0.01) and self-efficacy (r = -0.32, p < 0.01) were statistically significant, aswas the correlation between role stress and self-efficacy (r = -0.44, p < 0.01).The Sobel test (Z = 6.57, p < 0.00) provides support for the hypothesis thatrole stress mediates the relationship between AAD and self-efficacy. Asignificant partial correlation between AAD and self-efficacy (r = -0.15, p =0.02) remains after inclusion of the mediator (role stress), which limits thefinding to partial mediation. Future research needs to draw samples from avariety of work situations.
111Coetzer, Hanson and Trimble
1 Please direct correspondence to Graeme Coetzer
112 Journal of Business and Management – Vol. 15, No. 2, 2009
The Diagnostic and Statistical Manual of Mental Disorders-Fourth Edition (DSM-IV) defines Attention Deficit and Hyperactivity Disorder (ADHD) as “a persistentpattern of inattention and/or hyperactivity-impulsivity that is more frequent andsevere than is typically observed in individuals at a comparable level of development”(APA, 1994). Recent lifespan research suggests that the majority of children withADHD continue to experience symptoms as adults (Barkley et al., 2002; Biederman,Mick & Faraone, 2000; Mannuzza et al., 1998; Weiss et al., 1985). A recent nationalsurvey found that 4.2 % of US workers had Adult Attention Deficit HyperactivityDisorder (ADHD), resulting in $19.5 billion in lost human capital per annum(Kessler et al., 2005). Other studies on the prevalence of ADHD among adults in theUnited States claim that prevalence rates are much higher (Barkley et al., 2002;Mannuzza et al., 1993, 1998; Weiss et al., 1985). A recent population screen of 966adults in the United States suggests prevalence rates of 2.9% for narrowly definedADHD and 16.4% using a more broad definition (Biederman & Faraone, 2005).Prevalence rates of 10%-12% of the adult population in the United States are aconservative average for the prevalence studies that have been done to-date. Kessleret al. (2005) concludes that Adult Attention Deficit Disorders are a common andcostly problem within the US workforce.
Adult Attention Deficit
Adults with ADHD have difficulty focusing on their problem behavior and withouthelp, will often fall into a chain of failures (Nadeau, 1997). Barkley (1990) suggests thatdepression, anxiety, and diminished hopes of future success may even exacerbate thesymptoms of adult ADHD. This suggests that without intervention, adults withattention disorders are more likely to find themselves in a debilitating cycle. The chainof failures produced by attention-related difficulties may produce depression, anxietyand hopelessness. This, in turn, exacerbates the symptoms of the disorder and increasesthe likelihood of ongoing failures. A recent national survey by Harris Interactive (2004)found that the majority of adults with ADHD believed that the disorder had constrainedthem from achieving both short and long-term goals. Research has confirmed thatadults with ADHD attain lower occupational ranking, socioeconomic status, and socialclass standing when compared with their peers (Biederman et al., 2006; Mannuzza etal., 1993). Research by Biederman et al. (2006) found that, on average, adults withADHD have annual household incomes that are $10,791 lower for high schoolgraduates and $4,334 lower for college graduates. Annual income loss for adults withADHD in the United States is estimated at $77 billion, which is similar to income lossestimates for drug abuse ($58 billion) and alcohol abuse ($86 billion). Research hasalso established a link between ADHD and substance abuse (Biederman et al., 2006).
A recent study using data from Fortune 200 companies found that absenteeism andmedical costs for employees diagnosed with ADHD were 48% higher. Adults withADHD were also more likely to change jobs (Corgiat & Goodwin, 1992; Wallis, 1994),engage in part-time employment (Biederman et al., 2006) and seek out jobs that don’trequire concentration over long periods of time (Weinstock, 1993). They also avoidjobs that require close supervision, repetitive tasks and sedentary performance

conditions (Mannuzza et al., 1993). The disorder is also associated with higheraccident rates and lower productivity (Reynolds, 1996, 1997). Adults with ADHD areperceived by their employers as requiring more supervision and as less able tocomplete assignments (Barkley, 1990).
ADHD may also be associated with positive behaviors like ingenuity, creativity, anddetermination (Mannuzza et al., 1993), which may explain why entrepreneurs appearto have relatively higher levels of the disorder (Miller, 1993). In fast-paced workenvironments, adults with ADHD may perform just as well, if not better, than non-ADHD employees (Stuart, 1992). Hartmann (1993) encourages a more encompassingview of adult workers with ADHD by suggesting that employers consider both thenegative and positive behaviors associated with the condition.
Research on adult ADHD suggests that the hyperactivity/impulsivity component ofthe disorder may disappear or not exist (Weiss & Hechtman, 1986, 1993), whereas theinattention component and related cognitive symptoms, referred to as Adult AttentionDeficit (AAD), are more likely to persist or develop (Brown, 1995). Brown (1995)suggests that the hyperactivity/impulsivity component should be excluded but alsosuggests that strict reference to the symptoms of inattention may not capture all of thekey symptoms. Brown (1996) proposes five clusters of symptoms, all of which seemto commonly occur among persons with AADs. The five-symptom clusters include:difficulties with activating to work, concentrating, sustaining effort and energy,managing emotional interference, and accessing memory. This suggests that AAD, asopposed to ADHD, may be a more prevalent problem for adult workers and that someof the key symptoms associated with the disorder may have been ignored in previousresearch. Researchers have also expressed concern about strictly treating AttentionDeficit Disorder as a categorical diagnosis, as opposed to a dimensional construct withvarying levels of severity (Achenbach, 1991; Blacker & Tsuang, 1992). Categoricaldiagnosis promotes simplistic use and interpretation of the construct. This researchdefines adult attention deficit (AAD) as a persistent pattern of inattention and relatedcognitive symptoms that occur with varying levels of severity and create additionalchallenges within the academic, work and social life of adults. Although empiricalresearch on the impact of Attention Deficit Disorder and organizational behavior islimited, research to-date suggests that Attention Deficit Disorder is having a widerange of negative consequences in the workplace.
The Expected Relationship between AAD and Self-Efficacy
Adults who experience ongoing difficulty with activation, concentration, effort,emotional interference, and accessing memory are more likely to have difficultyachieving a sense of personal mastery over key life tasks. This should constrainpersonal performance, thereby negatively affecting what has been called self-efficacy.Social cognitive theory (Bandura, 1986) suggests that cognitive processing of socialinformation can influence human performance. Beliefs about one’s ability to mobilizesufficient effort, cognitive resources and the behavioral strategies necessary forsuccessful task completion are considered important determinants of performance andsatisfaction (Bandura, 1997). Self-efficacy is generally defined as the perceived
113Coetzer, Hanson and Trimble
capability for performing a specific task (Bandura & Wood, 1989). It can be improvedthrough positive mastery experiences, the observation of similar others succeedingwith sustained effort, receiving realistic encouragement from a credible source, and theperception of being in a performance-ready state (physiological and psychological)(Bandura & Schunk, 1989; Bandura & Wood, 1989). These general determinantsinfluence self-efficacy through a process of cognitive evaluation (Gist & Mitchell,1992). Positive or negative efficacy information is generated by evaluating the taskrequirements, related personal experiences and relevant personal and situationalconstraints and resources. Research has confirmed self-efficacy as a valid predictor ofsatisfaction, effort, persistence, and success across a wide range of tasks (Gist &Mitchell, 1992; Lennings, 1994; Luthans & Stajkovic, 1998) including team work(Chowdhury, Endres & Lanis, 2002; Phillips, 2001; Cohen & Bailey, 1997).
The modern workplace is increasingly characterized by foreign competition, teamwork, self-leadership, constant change, projects, stress, and the demand for greaterinformation processing and productivity (Manz & Sims, 1996; Smith, 1997). This isincreasing the cognitive load and emotional labor associated with work. A significantincrease in dual income families, divorce rates, job insecurity, and threats to nationaland international security are also adding to the cognitive and emotional challengesfaced by adults. Increasing cognitive loads and emotional labor are increasing work-related stress. Surveys conducted over the last two decades suggest that between onethird and two thirds of the US labor force experiences high levels of stress at work(Barsade & Wiesenfeld, 1997; Bond, Galinsky & Swanberg, 1998; Driscoll, 1995;Northwestern National Life Insurance Company, 1992; Schultz & Schultz, 1998).Surveys conducted by the European Foundation and European Commission foundthat stress is actually the primary complaint among workers (Costa & Paoli, 1994).Estimates of the organizational costs of workplace stress for US employers during the1990s ranged from $80 billion (Mann, 1996) to more than $200 billion (DeFrank &Ivancevich, 1998). The American Institute of Stress (2001) provided a more recentestimate of $300 billion annually. Research also suggests that the majority of workersbelieve that levels of stress are rising significantly (Armour, 2003; D’Arcy, Masius &Bowles, 1996; Cohen, 1997; Princeton Survey Associates, 1997; Reheiser &Spielberger, 1995).
Success in managing complex and dynamic challenges, both at home and at work,requires the effective use of cognitive and emotional resources. Both personal andwork- related responsibilities require adults to identify, process, and integrate complextask information. They must be able to sustain the effort and energy necessary to keepup with the pace of personal and work responsibilities, and make quality contributionsin a timely manner. They must also be able to monitor and effectively respond topersonal emotions, stress, and social dynamics. Adults who experience an ongoingdifficulty with activation, concentration, effort, emotional interference and accessingmemory are more likely to have difficulty achieving a sense of personal mastery overkey life tasks. This should lower self-efficacy and constrain personal performance.Thus,
H1: Adult attention deficit will be negatively associated with self-efficacy.
114 Journal of Business and Management – Vol. 15, No. 2, 2009
115Coetzer, Hanson and Trimble
The Expected Mediating Influence of Role Stress on the Relationshipbetween AAD and Self-Efficacy
Research has shown that the personal attributes of employees influence their abilityto manage role stress, which ultimately influences performance (Chatman, Flynn &Spataro, 2001; Howell & Higgins, 1990; Kelly, Gable & Hise, 1981). Researchconducted by the Center for Cognitive and Emotional Health suggests that employeeswith AAD experience higher levels of stress and have difficulty managing importantadministrative tasks associated with both personal and professional roles (Hallowell,2005). This suggests that role stress may be a key mediator of the relationship betweenAAD and role stress.
Role stress is generally defined as "anything about an organizational role thatproduces adverse consequences for the individual" (Kahn & Quinn, 1970, p. 41).More specifically, role stress is defined as “a perception indicated by ambiguity, conflictand overload arising from both the characteristics of the individual and the workenvironment” (Tetrick, 1992, p. 136). Role ambiguity occurs when a person is not surewhat their role requires and/or how to do it (Cooper, Dewe & O’Driscoll, 2001;Senatra, 1980), whereas role conflict occurs when the performance requirements of arole are not compatible (Gaertner & Ruhe, 1981; Kahn et al., 1964; Shenkar & Ziera,1992). Role overload is defined as having too many things to do in a given time period(Bacharach, Bamberger & Conley, 1991; Peterson & Smith, 1995; Gordon, Haka &Schick, 1990).
Moderate levels of stress (referred to as eustress), may stimulate people to exceland increase performance (Selye, 1976). Eustress is conceptually opposite to distressand refers to stress that is taxing but has a sustained positive influence. Bhagat et al.(1985, p. 203) suggest that some workplace stressors are positive because they“produce a state of challenge, coupled with disruptive pleasure.” For example, theneed to create greater alignment between elements within a role and across roles hasbeen found to reduce boredom (Seiber, 1974) and help energize employees (Jones,1993; Marks, 1977). However, when stress levels exceed the coping skills andresources available to the employee, the results are typically harmful to both theemployee and the organization (Jamal, 1984, 1985; Goolsby, Rhoads & Singh, 1994).A role that becomes overloaded with content may increase productivity in the short-term but performance inevitably suffers (Beehr & Walsh, 1976).
The general view that role stress is detrimental to individuals and organizations hasbeen widely supported and subsequently, the subject of more than 300 journal articles(Ortqvist & Wincent, 2006). Organizational and individual problems associated withrole stress include absenteeism (Brown, 2001; Goetzel et al., 1998), high turnover(Lee, 1997; Mann, 1996), burnout (Holloway & Wallinga, 1990; Jones, 1993),emotional exhaustion (Posig & Kickul, 2003), deteriorating personal health, jobdissatisfaction (Keenan & Newton, 1984), reduced organizational commitment(Johnston et al., 1990), and lower job performance (Abramis, 1994; Babin & Boles,1996; Jamal,1984; Micheals & Rebele, 1990).
Role stress derived from role overload, ambiguity, and conflict should undermineself-efficacy. A lack of clarity about one’s role creates confusion and frustration which
undermines productivity. A further tax on productivity results from spending personalresources on role clarification as opposed to content execution. Role ambiguity alsoundermines the ability to clearly measure performance relative to role requirementsand as a result, undermines the ability to develop a sense of mastery. Role overloadundermines the ability to perform a job with excellence because of the need todistribute resources over too many tasks. Role overload will also divert personalresources as attempts are made to manage the boundaries of the role as opposed toexecuting the content. Role conflict creates a win-lose situation where effectiveexecution of certain aspects of the role undermines the ability to perform other aspectsof the role effectively. The confusion, frustration and exhaustion created by such asituation should undermine a sense of mastery and performance readiness, which inturn should undermine self-efficacy.
The harmful and costly consequences of role stress underscores the importance ofunderstanding individual and organizational antecedents, and developing strategiesfor reducing these stressors (Lawson, Liks & Savery, 2001). Research has shown thatthe personal attributes of employees influences their ability to manage role stress,which ultimately influences performance (Chatman et al., 2001; Howell & Higgins,1990; Kelly et al., 1981). A recent national survey (Harris Interactive, 2004) found that64 percent of adults with ADHD reported having difficulties with workplace stress.
Research conducted by the Center for Cognitive and Emotional Health suggeststhat employees with AAD experience higher levels of stress and have difficultymanaging important administrative tasks (Hallowell, 2005). Research on theinfluence of Adult Attention Deficit Disorder on marital relations provides furtherevidence of difficulty managing key tasks. Families containing a parent who has anAttention Deficit Disorder often rely on the nonafflicted spouse for planning,organizing, setting limits, time management, problem solving, child rearing, makingfinancial contributions, and maintaining family harmony (Dixon, 1995; Weiss &Hechtman, 1993).
Hallowell (2005) states that the symptoms of AAD are being amplified by anincreasingly hyperkinetic work environment. As cognitive load and emotional laborincreases, the frontal lobes of the cortex are increasingly used to maintain a sense ofdirection and organization. The inhibiting functions within the frontal lobes of thecortex are also used to constrain emotional flooding caused by lower brain responsesto increasingly threatening conditions. Research conducted (Young et al., 2007) hasconfirmed that adults with AAD have significantly greater difficulty with planning andproblem solving as task difficulty increases. This suggests that limited capacity withinthe frontal lobes of the cortex to inhibit emotional and cognitive interference reducesthe capacity to cope with increasing cognitive load and emotional labor.
Difficulties managing necessary tasks should increase role stress, especially undercurrent organizational conditions. Adults need to attend to multiple sources of role-related information and integrate this information into a coherent mental map of theirrole requirements. Adults also need to shape role requirements in order to preventconflicts and maximize person-role fit. As previously suggested, adults need to keep upwith the pace of work, make quality contributions in a timely manner, and adjust as newconditions arise. Accurately monitoring and responding to personal emotions and social
116 Journal of Business and Management – Vol. 15, No. 2, 2009
dynamics is an important part of this challenge. Adults who experience difficultiesactivating task work, sustaining concentration, sustaining effort, managing emotionalinterference, and accessing short-term memory are less likely to manage their roleeffectively. A persistent constraint on personal productivity should create a backlog oftasks contributing to role overload. Difficulties with sustaining attention, managingemotional interference and accessing short term memory should undermine thedevelopment of a clear, well-integrated, and detailed mental map of a role. Thesechallenges could also make it more difficult to update understanding of rolerequirements as conditions change. This situation may contribute to an ongoing senseof confusion about the requirements of a role. These conditions will produce higherlevels of role confusion. Difficulties with gathering, integrating and updating roleinformation should constrain the ability to shape a role. Difficulties shaping a role canlead to higher levels of role conflict. Addressing role conflicts effectively also requiressustained energy and emotional control, which is lacking in adults with AAD. Therefore,the increase in role stress caused by AAD will constrain the development of self-efficacy.This suggests that role stress will mediate the relationship between AAD and self-efficacy.Therefore,
H2: Role stress will mediate the relationship between adult attention deficit and self-efficacy
Methods
Subjects and ProcedureThe subjects of this study were 229 university students enrolled in two evening
management courses at a large state university in Western Canada. The average age ofthe subjects was twenty four, with women making up 52% of the participants. All thestudents reported that they had some work experience, and 63% reported that theywere engaged in at least 16 hours of paid work per week. Each of the studentscompleted measures of adult attention deficit, role stress and self-efficacy as part of apersonality awareness exercise. Product moment correlations were used to test all thehypotheses regarding associations between the measures, and the Sobel (1982) testwas used to examine the mediating influence role stress on the relationship betweenAAD and personal mastery.
MeasuresAdult Attention Deficit (AAD). The Brown (1996) Attention Deficit Disorder scales
were used to measure the amount of adult attention deficit. The instrument wasdesigned and tested for use with adults eighteen years and older. The forty self-reportitems on the Brown AAD scales are grouped into five clusters of conceptually relatedsymptoms of AAD. Organizing and activating to work (cluster 1) measures difficultyin getting organized and started on tasks. An example item is: “I am disorganized; Ihave excessive difficulty keeping track of plans, money, or time.” Sustainingconcentration (cluster 2) measures problems in sustaining attention while performingtasks. An example item is: “I listen and try to pay attention (e.g., in a meeting, lecture,or conversation) but my mind often drifts” or “I miss out on desired information.”
117Coetzer, Hanson and Trimble
Sustaining energy and effort (cluster 3) measures problems in keeping up consistentenergy and effort while performing tasks. An example item is: “I ‘run out of steam’ anddon’t follow through” or “my effort fades quickly.” Managing affective interference(cluster 4) measures difficulty with moods and sensitivity to criticism. An exampleitem is: “I become irritated easily” or “I am ‘short-fused’ with sudden outbursts ofanger.” Utilizing working memory and accessing recall (cluster 5) measuresforgetfulness in daily routines and problems in the recall of learned material. Anexample item is: “I intend to do things but forget (e.g., turn off appliances, get thingsfrom store, return phone calls, keep appointments, pay bills, do assignments).”
Subjects used a 4-point scale (1=never, 2=once a week, 3=twice a week, 4=almostdaily) to rate the frequency with which each item occurred in their own lives. A totalscore for AAD was derived by adding up the scores for each of the items. The Cronbachalpha internal reliability coefficient was α=0.90 suggesting good internal reliability.
Role Stress. Items for measuring role ambiguity, conflict, and overload weregenerated after reviewing the Role Stress Inventory (House, Lirtzman & Rizzo, 1970),Occupational Environment Scale (Osipow & Spokane, 1983), Role Clarity Index(Kahn et al., 1964), and the Work Stress Inventory (Barone et al., 1984) (see Table2). The items needed to be worded in a more general manner so as to capture roleambiguity, role conflict, and role overload as it pertains to the more general contextfaced by students. Four items were chosen for each of the dimensions of role stress.An example item for role ambiguity is: “I’m confused about the various tasks thatmake up my role.” An example item for role conflict is: “The important tasks I needto do often conflict with one another.” An example item for role overload is: “I havemore tasks that I can effectively manage.” Subjects used a seven point Likert scale(1=strongly disagree, 2=disagree, 3=slightly disagree, 4=neutral, 5=slightly agree,6=agree, 7=strongly agree) to rate the extent to which they agreed with each item.Scores for each dimension of role stress were derived by adding up the scores for theassociated items. A total score for role stress was derived by adding up the scores foreach of the dimensions. The Cronbach alpha internal reliability coefficient wasα=0.92 suggesting good internal reliability.
Self-Efficacy The measure developed by Jerusalem and Schwarzer (1995) was used to
measure general self-efficacy. The scale measures efficacy with regard to copingwith daily challenges and stressful situations. The measure includes ten items andan example item is: “I can always manage to solve difficult problems if I try hardenough.” Subjects used a 5-point scale (1=strongly disagree, 2=disagree, 3=neutral,4=agree, 5=strongly agree) to rate the extent to which they agreed with each item.The Cronbach alpha internal reliability coefficient was α=0.93 suggesting goodinternal reliability.
118 Journal of Business and Management – Vol. 15, No. 2, 2009
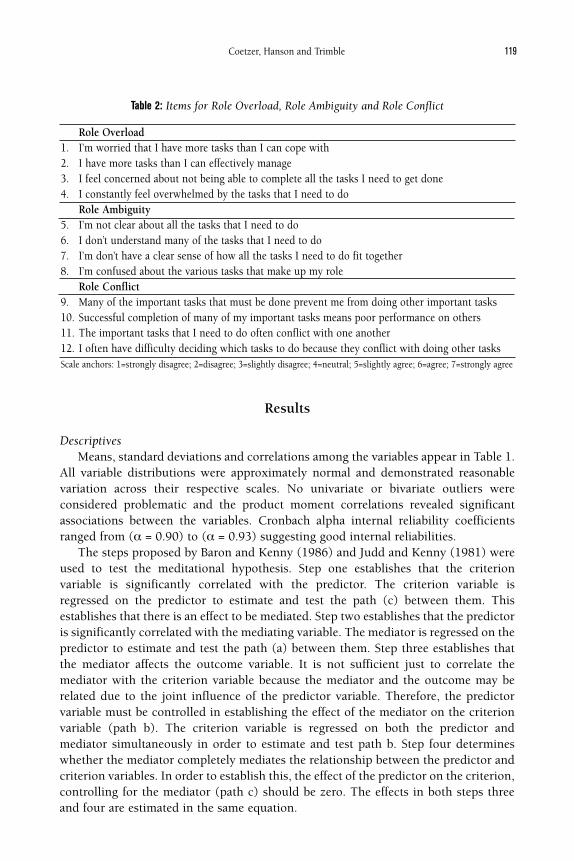
Table 2: Items for Role Overload, Role Ambiguity and Role Conflict
Results
DescriptivesMeans, standard deviations and correlations among the variables appear in Table 1.
All variable distributions were approximately normal and demonstrated reasonablevariation across their respective scales. No univariate or bivariate outliers wereconsidered problematic and the product moment correlations revealed significantassociations between the variables. Cronbach alpha internal reliability coefficientsranged from (α = 0.90) to (α = 0.93) suggesting good internal reliabilities.
The steps proposed by Baron and Kenny (1986) and Judd and Kenny (1981) wereused to test the meditational hypothesis. Step one establishes that the criterionvariable is significantly correlated with the predictor. The criterion variable isregressed on the predictor to estimate and test the path (c) between them. Thisestablishes that there is an effect to be mediated. Step two establishes that the predictoris significantly correlated with the mediating variable. The mediator is regressed on thepredictor to estimate and test the path (a) between them. Step three establishes thatthe mediator affects the outcome variable. It is not sufficient just to correlate themediator with the criterion variable because the mediator and the outcome may berelated due to the joint influence of the predictor variable. Therefore, the predictorvariable must be controlled in establishing the effect of the mediator on the criterionvariable (path b). The criterion variable is regressed on both the predictor andmediator simultaneously in order to estimate and test path b. Step four determineswhether the mediator completely mediates the relationship between the predictor andcriterion variables. In order to establish this, the effect of the predictor on the criterion,controlling for the mediator (path c) should be zero. The effects in both steps threeand four are estimated in the same equation.
119Coetzer, Hanson and Trimble
Role Overload1. I’m worried that I have more tasks than I can cope with2. I have more tasks than I can effectively manage3. I feel concerned about not being able to complete all the tasks I need to get done4. I constantly feel overwhelmed by the tasks that I need to do
Role Ambiguity5. I’m not clear about all the tasks that I need to do6. I don’t understand many of the tasks that I need to do7. I’m don’t have a clear sense of how all the tasks I need to do fit together8. I’m confused about the various tasks that make up my role
Role Conflict9. Many of the important tasks that must be done prevent me from doing other important tasks10. Successful completion of many of my important tasks means poor performance on others11. The important tasks that I need to do often conflict with one another12. I often have difficulty deciding which tasks to do because they conflict with doing other tasksScale anchors: 1=strongly disagree; 2=disagree; 3=slightly disagree; 4=neutral; 5=slightly agree; 6=agree; 7=strongly agree
The amount of mediation, which is called the indirect effect, is defined as thereduction of the effect of the predictor variable on the criterion variable, or c - c'. Thisdifference in coefficients is theoretically exactly the same as the product of the effectof the predictor on the mediator times the effect of the mediator on the criterion, orab (thus it holds that ab ≈ c - c'). The two are exactly equal when multiple regressionis used, there are no missing data and the same covariates are in the equation. If steptwo (the test of a) and step three (the test of b) are met, it follows that there necessarilyis a reduction in the effect of the predictor on the criterion. One way to test the nullhypothesis that ab = 0 is to test that both a and b are zero (steps 2 and 3).
Much more commonly, a single test is used and is highly recommended(MacKinnon et al., 2002). The test was first proposed by Sobel (1982). It requires thestandard error of a or sa (which equals a/ta where ta is the t test of coefficient a) andthe standard error of b or sb. The Sobel test provides the standard error of ab can beshown to equal approximately the square root of
b2sa2 + a2sb
2
Other standard errors have been proposed, but the Sobel test is by far the mostcommonly reported. The test of the indirect effect is given by dividing ab by thesquare root of the above variance and treating the ratio as a Z test (i.e., larger than 1.96in absolute value is significant at the .05 level).
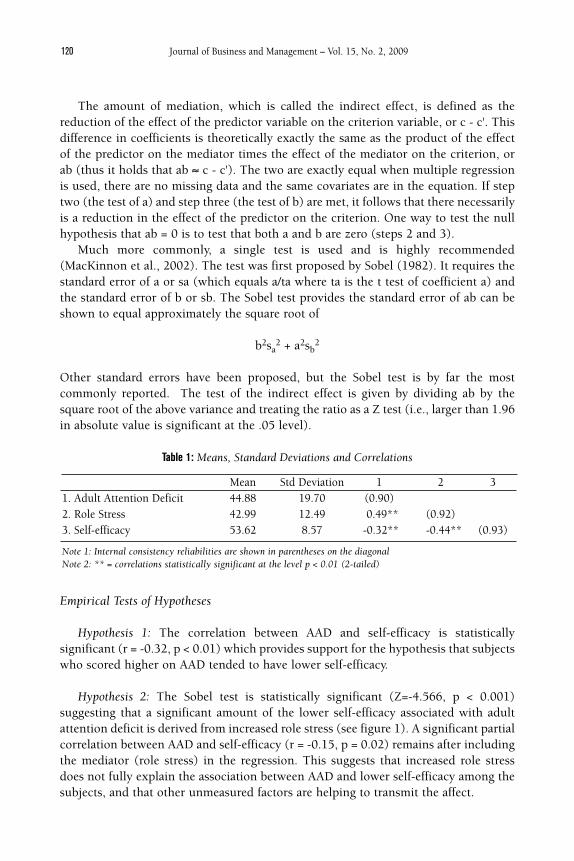
Table 1: Means, Standard Deviations and Correlations
Empirical Tests of Hypotheses
Hypothesis 1: The correlation between AAD and self-efficacy is statisticallysignificant (r = -0.32, p < 0.01) which provides support for the hypothesis that subjectswho scored higher on AAD tended to have lower self-efficacy.
Hypothesis 2: The Sobel test is statistically significant (Z=-4.566, p < 0.001)suggesting that a significant amount of the lower self-efficacy associated with adultattention deficit is derived from increased role stress (see figure 1). A significant partialcorrelation between AAD and self-efficacy (r = -0.15, p = 0.02) remains after includingthe mediator (role stress) in the regression. This suggests that increased role stressdoes not fully explain the association between AAD and lower self-efficacy among thesubjects, and that other unmeasured factors are helping to transmit the affect.
120 Journal of Business and Management – Vol. 15, No. 2, 2009
Mean Std Deviation 1 2 31. Adult Attention Deficit 44.88 19.70 (0.90)2. Role Stress 42.99 12.49 0.49** (0.92)3. Self-efficacy 53.62 8.57 -0.32** -0.44** (0.93)
Note 1: Internal consistency reliabilities are shown in parentheses on the diagonalNote 2: ** = correlations statistically significant at the level p < 0.01 (2-tailed)
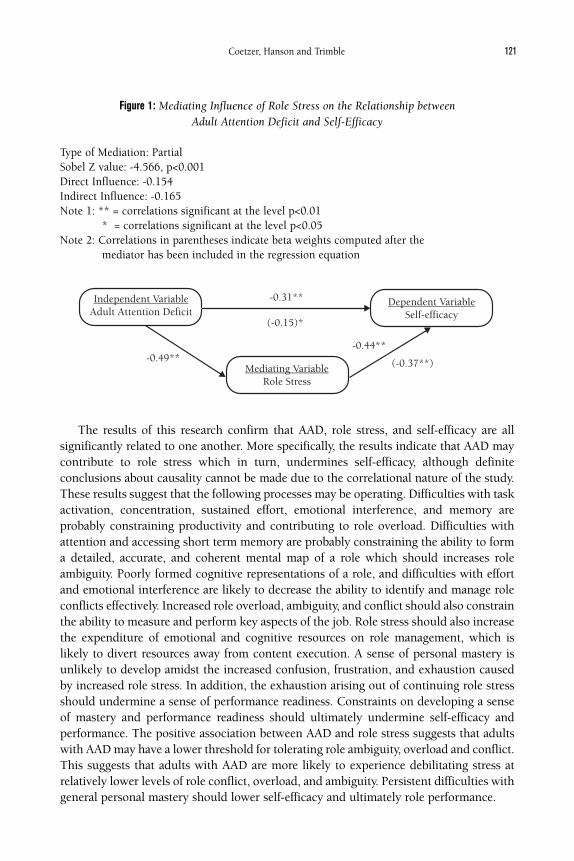
Figure 1: Mediating Influence of Role Stress on the Relationship between Adult Attention Deficit and Self-Efficacy
Type of Mediation: PartialSobel Z value: -4.566, p<0.001Direct Influence: -0.154Indirect Influence: -0.165Note 1: ** = correlations significant at the level p<0.01
* = correlations significant at the level p<0.05Note 2: Correlations in parentheses indicate beta weights computed after the
mediator has been included in the regression equation
The results of this research confirm that AAD, role stress, and self-efficacy are allsignificantly related to one another. More specifically, the results indicate that AAD maycontribute to role stress which in turn, undermines self-efficacy, although definiteconclusions about causality cannot be made due to the correlational nature of the study.These results suggest that the following processes may be operating. Difficulties with taskactivation, concentration, sustained effort, emotional interference, and memory areprobably constraining productivity and contributing to role overload. Difficulties withattention and accessing short term memory are probably constraining the ability to forma detailed, accurate, and coherent mental map of a role which should increases roleambiguity. Poorly formed cognitive representations of a role, and difficulties with effortand emotional interference are likely to decrease the ability to identify and manage roleconflicts effectively. Increased role overload, ambiguity, and conflict should also constrainthe ability to measure and perform key aspects of the job. Role stress should also increasethe expenditure of emotional and cognitive resources on role management, which islikely to divert resources away from content execution. A sense of personal mastery isunlikely to develop amidst the increased confusion, frustration, and exhaustion causedby increased role stress. In addition, the exhaustion arising out of continuing role stressshould undermine a sense of performance readiness. Constraints on developing a senseof mastery and performance readiness should ultimately undermine self-efficacy andperformance. The positive association between AAD and role stress suggests that adultswith AAD may have a lower threshold for tolerating role ambiguity, overload and conflict.This suggests that adults with AAD are more likely to experience debilitating stress atrelatively lower levels of role conflict, overload, and ambiguity. Persistent difficulties withgeneral personal mastery should lower self-efficacy and ultimately role performance.
121Coetzer, Hanson and Trimble
Implications for organizations and education institutions Organizations need to be more aware of the influence AAD may have on role stress
and self-efficacy. Organizations committed to creating more empowered cultures thatemphasize fluid roles and self-regulation may end up producing the opposite ifemployees with attention difficulties are not provided with the necessary support.Helping employees with AAD to manage role ambiguity, overload and conflict moreeffectively may be necessary in order for such employees to fully access the benefits ofan empowered work environment. Failure to help employees with AAD manage theirrole may result in a reduction in mastery, performance readiness, self-efficacy, andperformance. Making managers and employees more aware of the role managementchallenges potentially faced by employees with AAD may help to increase theunderstanding and support received from coworkers and supervisors. Providing suchemployees with the skills and opportunities to identify and manage role design issuesmay help to reduce role stress. Managers who are responsible for supervising anddeveloping employees with AAD will likely be required to make relative greaterinvestments in such employees. It is important to provide managers with the supportthey need when developing such employees, especially during the introduction ofmore empower work designs. In general, investing resources necessary to supportemployees with the disorder may help to reduce potential increases in absenteeism,turnover, health care costs, and poor performance.
Increasing coverage of the disorder within the Americans with Disabilities Actappears likely and employers need to be ready to provide reasonableaccommodations when required to do so. Making employees and managers moregenerally aware of the symptoms of AAD and the treatment options available mayprovide the education necessary to reduce the extent to which the condition remainsundiagnosed and untreated.
Educational institutions, like management programs within universities, need toassist potential managers to recognize and respond to the symptoms of AAD in boththemselves and others. Early diagnoses and treatment may help to prevent theexacerbating cycles of failure that often accompany the condition. An increasedemphasis on role management skills within business programs may be necessary tohelp potential managers reduce future role stress.
Limitations and suggestions for future researchThe instability of the hyperactivity/impulsivity component of ADHD in adults and
the traditionally narrow focus on symptoms of inattention (hyperactivity/impulsivityaside) suggests that AAD may be more prevalent and problematic within the USworkforce. Studies that determine the prevalence of AAD versus adult ADHD arerequired to clarify this important issue. AAD appears to have mostly negativeoutcomes for employees and organizations, but there is some evidence that employeeswith AAD excel with certain tasks and in certain situations. This highlights theimportance of identifying the specific tasks and situations that are problematic or agood fit for employees with AAD. Research that examines the influence of AAD on awide range of typical work tasks and situations is required. Research that identifies thevariety of personal and organizational characteristics, strategies, and supporting
122 Journal of Business and Management – Vol. 15, No. 2, 2009
resources that mitigate the negative influence of AAD on role stress and taskperformance will help to provide clues about possible interventions. Personal casehistories of employees who rate high on both role stress and AAD, and low on personalmastery, will provide insight into the progression of these relationships, as well as thepersonal and organizational factors that influence this progression.
This is a correlational study and as a result, it limits any causal conclusions that canbe made. The use of only self-report data prevents statistical control of commonmethod bias. A variety of data collection methods is suggested for future research inorder to control for such potential bias. The external validity of this study is limitedby the use of adult students. Future research needs to draw samples from a variety ofwork situations in order to capture the full range of role stress.
Prior to this study, no systematic empirical research existed on the relationshipbetween AAD, role stress, and self-efficacy. This study should help to initiate a newavenue of empirical research in organizational behavior, and help to solidify the bodyof anecdotal evidence about the influence of AAD in the workplace. This willhopefully bring greater understanding and support to adult workers who are trying tobetter manage the impact of AAD on both themselves and others.
References
Abramis, D. J. (1994). Work role ambiguity, job satisfaction, and job performance:Meta analyses and review. Psychological Reports, 75: 1411–1433.
Achenbach, T. M. (1991). Comorbidity in child and adolescent psychiatry:Categorical and quantitative perspectives. Journal of Child and AdolescentPsychopharmacology, 1(4): 271-278.
American Institute of Stress. (2001). Health and Stress. The Newsletter of the AmericanInstitute of Stress (March): 3
American Psychiatric Association. (1994). Diagnostic and statistical manual of mentaldisorders (4th Ed., DSM-IV). Washington, DC.
Armour, S. (2003). Rising Job Stress could affect the bottom line. (2003, July 29). USAToday, p. 1.
Babin, B. J. & Boles, J. S. (1996). On the front lines: Stress, conflict, and the customerservice provider. Journal of Business Research, 37: 41-50.
Bacharach, S. B., Bamberger, P. & Conley, S. (1991). Work home conflict amongnurses and engineers: Mediating the impact of Role Stress on Burn-out andSatisfaction at Work. Journal of Organizational Behavior, 12: 39-53.
Bandura, A. (1986). Differential engagement of self-reactive influences in cognitivemotivation. Organizational Behavior and Human Decision Processes, 38(1): 92-114.
Bandura, A. (1997). Self-Efficacy: The Exercise of Control. New York: W.H. Freeman.Bandura, A. & Schunk, D. (1989). Cultivating competence, self-efficacy, and intrinsic
interest.through proximal self-motivation. Journal of Personality and SocialPsychology, 41: 586-98.
Bandura, A. & Wood, R. (1989). Social cognitive theory of organizationalmanagement. Academy of Management Review, 14(3): 361-384.
Barkley, R. A. (1990). Attention Deficit Hyperactivity Disorder: A Handbook for Diagnosis
123Coetzer, Hanson and Trimble

and Treatment. New York: Guilford Press.Barkley, R. A., Fischer, M., Smallish, L. & Fletcher, K. (2002). The persistence of
attention deficit/hyperactivity disorder into young adulthood as a function ofreporting source and definition of disorder. Journal of Abnormal Psychology, 111:279-289.
Baron, R.M. & Kenney, D.A. (1986). The moderator-mediator variable distinction insocial psychological research: Conceptual, strategic, and statistical considerations.Journal of Personality and Social Psychology, 51: 1173-1184.
Barone, D. F., Caddy, G. R., Katell, A. D. & Roselione, F. B. (1984). Work StressInventory Scale 2: Job risk. Paper presented at the meeting of the SoutheasternPsychological Association, New Orleans, LA.
Barsade, S. & Wiesenfeld, B. (1997). Attitudes in the American Workplace. New Haven,CT: Yale University School of Management.
Beehr, T.A., Walsh, J.T. & Taber, T.D (1976). Relationship of stress to individually andorganizationally valued states: Higher order needs as a moderator. Journal of AppliedPsychology, 61(1): 41-7.
Bhagat, R. S., McQuaid, S. J., Lindholm, H. & Segovis, J. (1985). Total life stress: amulti-method validation of the construct and its effects on organizationally valuedoutcomes and withdrawal behaviors. Journal of Applied Psychology, 70(1): 202
Biederman, J. & Faraone, S. V. (2005). What is the prevalence of adult ADHD? Resultsof a population screen of 966 adults. Journal of Attention Disorders, 9(2): 384-391.
Biederman, J., Faraone, S.V., Spencer, T.J., Mick, E., Monuteaux, M.C. & Aleardi, M.(2006). Functional impairments in adults with self-reports of diagnosed ADHD: Acontrolled study of 1001 adults in the community. Journal of Clinical Psychiatry,67(4): 524-40.
Biederman, J., Mick, E. & Faraone, S. V. (2000). Age-dependent decline in symptomsof ADHD: Impact of remission definition and symptom type. American Journal ofPsychiatry, 157: 816-818.
Blacker, D. & Tsuang, M. T. (1992). Contested boundaries of bi-polar disorder and thelimits of categorical diagnosis in psychiatry. American Journal of Psychiatry,149(11): 1473-1483.
Bond, J. T., Galinsky, E. & Swanberg, J. E. (1998). The 1997 National Study of theChanging Workforce. New York: The Families and Work Institute.
Brown, D. (2001). Wellness programs bring healthy bottom line. Canadian HRReporter, 14(22): 22-23.
Brown, T. E. (1995). Differential diagnosis of ADD vs. ADHD in adults. In Nadeau,K. G. (Ed.), A comprehensive guide to attention deficit disorders in adults. New York:Brunner/Mazel.
Brown, T. E. (1996). Brown attention deficit disorder scales for adolescents and adults.The Psychological Corporation: Harcourt Assessment Corporation.
Chatman, J. A., Flynn, F. J. & Spataro, S. E. (2001). Getting to Know You: TheInfluence of Personality on Impressions and Performance of DemographicallyDifferent People in Organizations. Administrative Science Quarterly, 46: 414–442.
Chowdhury, S., Endres, M. & Lanis, T.W. (2002). Preparing students for success inteam work environments: the importance of building confidence. Journal of
124 Journal of Business and Management – Vol. 15, No. 2, 2009

Managerial Issues, 14(3): 346-59.Coetzer, G.H. & Richmond, L. (2007). An Empirical Analysis of the relationship
between Adult Attention Deficit and Efficacy for Working in Teams. Journal of TeamPerformance Management, 13 (1/2): 5-20.
Cohen, S.G. & Bailey, D.E. (1997). What makes teams work: group effectivenessresearch from the shop floor to the executive suite. Journal of Management, 23(3):239-90.
Cohen, A. (1997). Facing pressure. Sales and Marketing Management, 149(4): 30-38Cooper, C.L., Dewe, P.J. & O’Driscoll, M. P. (2001). Organizational Stress: A Review and
Critique of Theory, Research and Applications. London: Sage.Corgiat, M. D. & Goodwin, R. E. (1992). Cognitive rehabilitation of adult attention
deficit disorder. A case study. Journal of cognitive rehabilitation, 10(5). 28-35.Costa, J. & Paoli, P. (1994). Monitoring occupational stress factors among European
workers at national and European levels. Stress at work – A call for action. EuropeanConference Proceedings. Dublin: Loughlinstown House, Shankill, Co.
Cronbach, L. J. (1951). Coefficient alpha and internal structure of tests. Psychometrika,16: 297-334.
D’Arcy, Masius & Bowles. (1996). The D’Arcy, Masius, and Bowles report Fears andfantasies of the American consumer. New York: NY.
DeFrank, R.S. & Ivancevich, J.M. (1998). Stress on the job: An executive update.Academy of Management Executive, 12: 55-66.
Dixon, E. B. (1995). Impact of adult ADD on the family. In Nadeau, K. (Ed.), Acomprehensive guide to attention deficit disorder in adults: Research, diagnosis, andtreatment. New York: Bruner/Mazel.
Driscoll, R. J., Worthington, K. A. & Hurrell, J. J. (1995). Workplace assault: Anemerging job stressor. Consulting Practice and Research, 47(4): 205-212.
Gaertner, J.F. & Ruhe, J.A. (1981). Job-related stress in public accounting. Journal ofAccountancy, 151(6): 68-74.
Gist, M.E. & Mitchell, T.R. (1992). Self-efficacy: a theoretical analysis of itsdeterminants and malleability. Academy of Management Review, 17(2): 183-211.
Goetzel, R.Z., Anderson, D.R., Whitmer, R.W., Ozminkowski, R. J., Dunn, R.L.,Wasserman, J. & the HERO Research Committee. (1998). The RelationshipBetween Modifiable Health Risks and Health Care Expenditures: An Analysis of theMulti-Employer HERO Health Risk and Cost Database. Journal of Occupational andEnvironmental Medicine, 40(10): 843-854.
Goolsby, Z.J., Rhoads, G. & Singh, J. (1994). Behavioral and psychologicalconsequences of boundary spanning burnout for customer service representatives.Journal of Marketing Research, 31: 558-569.
Gordon, L., Haka, S. & Schick, A. (1990). Information overload: A temporal approach.Accounting. Organizations and Society, 15(2): 199-220.
Hartmann, T. (1993). Attention Deficit Disorder: A Different Perception. Penn Valley; CA:Underwood-Miller.
Hallowell, E. M. (2005). Overload circuits: Why smart people underperform. HarvardBusiness Review, 83(1): 54-62.
125Coetzer, Hanson and Trimble
Holloway, D. & Wallinga, C. R. (1990). Burnout in child life specialists: The relationof role stress. Children’s Health Care, 19: 10–18.
House, R. J., Lirtzman, S. I. & Rizzo, J. R., (1970). Role conflict and ambiguity incomplex organizations. Administrative Science Quarterly, 15: 150–163.
Howell, J. M. & Higgins, C. A. (1990). Champions of Technological Innovation.Administrative Science Quarterly, 35: 317–341.
Jamal, M. (1984). Job stress and job performance controversy: An empiricalassessment. Organizational Behavior and Human Performance, 33: 1-21.
Jamal, M. (1985). Relationship of Job stress to Job Performance: A study of managersand blue collar workers. Human Relations, 38 (May): 409-424.
Jerusalem, M. & Schwarzer, R. (1995). Generalized Self-Efficacy scale. In Weinman, J.,Wright, S. & Johnston, M. (Eds.), Measures in health psychology: A user’s portfolio.Causal and control beliefs. Windsor, UK: NFER-NELSON.
Johnston, M. W., Parasuraman, A., Futrell, C. M. & Black, W. C. (1990). Alongitudinal assessment of the impact of selected organizational influences onsalespeople’s organizational commitment during early employment. Journal ofMarketing Research, 27: 333–344.
Jones, M. L. (1993). Role conflict: Cause of burnout or energizer? Social Work, 38:136–141.
Judd, C. M. & Kenny, D. A. (1981). Process analysis: Estimating mediation intreatment evaluations. Evaluation Review, 5: 602-619.
Kahn, R. L. & Quinn, R. P. (1970). Role Stress: A Framework for Analysis. InMcClean, A. (Ed.), Mental Health and Work Organizations. Chicago: Rand McNally& Co.
Kahn, R. L., Wolfe, D., Quinn, A., Snoek, J. D. & Rosenthal, R. (1964). OrganizationalStress: Studies in Role conflict and Role Ambiguity. New York: Wiley and Sons.
Keenan, A. & Newton, T. J. (1984). Frustration in organizations: Relationships to rolestress, climate, and psychological strain. Journal of Occupational Psychology, 57:57–65.
Kelly, J., Gable, M. & Hise, R. T. (1981). Satisfaction in Chain Store Manager Roles,Journal of Retailing, 57(1): 27–42.
Kessler, R.C., Adler, L., Ames, M., Barkley, R. A., Birnbuam, H., Greenberg, P.,Johnstone, J. A., Spencer, T. & Ustun, T. B. (2005). The prevalence and effects ofADHD on work performance in a nationally representative sample of workers.Journal of Occupational and Environmental Medicine, 47(6): 565-572.
Lawson K., Liks, A. & Savery, J. (2001). The relationship between empowerment, jobsatisfaction and reported stress levels: some Australian evidence. Leadership &Organization Development Journal, 22(3): 32-41.
Lee, D. (1997). Employee stress. The John Liner Review, 11: 3Lennings, C.J. (1994). An evaluation of a generalized self-efficacy scale. Personality
and Individual Differences, 16(5): 745-50.Luthans, F. & Stajkovic, A.D. (1998). Self-efficacy and work-related performance: a
meta-analysis. Psychological Bulletin, 124: 240-61.MacKinnon, D. P., Lockwood, C. M., Hoffman, J. M., West, S. G. & Sheets, V. (2002).
A comparison of methods to test the significance of the mediated effect.
126 Journal of Business and Management – Vol. 15, No. 2, 2009

Psychological Methods, 7: 83-104. Mann, S. E. (1996). Employee stress: An important cost in mergers. Business Insurance,
30: 24.Mannuzza, S., Klein, R. G., Bessler, A, Malloy, P. & LaPadula, M. (1998). Adult
psychiatric status of hyperactive boys grown up. American Journal of Psychiatry,155: 493-498.
Mannuzza, S., Klein, R. G., Bessler, A., Malloy, P. & LaPadula, M. (1993). Adultoutcome of hyperactive boys: Educational achievement, occupational rank, andpsychiatric status. Archives of General Psychiatry, 50: 565-576.
Manz, C.E. & Sims, H.P. (1996). Creating a company of heroes. New York: Wiley.Marks, S. R. (1977). Multiple roles and role strain: Some notes on human energy, time
and commitment. American Sociological Review, 42: 921–926.Micheals, R. & Rebele, J. (1990). Independent auditors’ role stress: Antecedent,
outcome and moderating variables. Behavioral Research in Accounting, 2: 963-974.Miller, K. (1993, January). Attention-Deficit Disorder Affects Adults, But Some
Doctors Question How Widely. The Wall Street Journal.Nadeau, K. G. (1997). ADHD in the Workplace: Choices, Changes and Challenges.
Bristol, PA: Brunner/Mazel.Northwestern National Life Insurance Company. (1991). Employee Burnout: America’s
newest epidemic. Minneapolis: MN.Ortqvist, D. & Wincent, J. (2006). Prominent Consequences of Role Stress: A Meta-
Analytic Review. International Journal of Stress Management, 13(4), 399-422.Osipow, S. H. & Spokane, A. R. (1983). A manual for measures of occupational stress,
strain and coping. Columbus, OH: Marathon Consulting Press.Peterson, F. M. & Smith, P. B. (1995). Role conflict, ambiguity and overload. Academy
of Management Review, 6: 665-74.Phillips, J.M. (2001). The role of decision influence and team performance in member
self-efficacy, withdrawal, satisfaction with the leader, and willingness to return.Organizational Behavior and Human Decision Processes, 84(1): 122
Posig, M. & Kickul, J. (2003). Extending our understanding of burnout: Test of anintegrated model in nonservice occupations. Journal of Occupational HealthPsychology, 8: 3–19.
Princeton Survey Associates. (1997). Labor Day survey: State of workers. Princeton, NJ:Princeton Survey Research Associates.
Reheiser, E. & Spielberger, C. (1995). Measuring occupational stress: The Job StressSurvey. In Crandall, R. & Perrewe, P. (Eds.). Occupational Stress: A handbook.Washington, DC: Taylor and Francis.
Reynolds, S. H. (1996). Is ADHD driving up our workers’ comp costs? HR Magazine,41(9): 92-96.
Reynolds, S. H. (1997). Attention deficit disorder in adults: The missing link in thechronic accident repeater syndrome. Professional Safety, 42(2): 20-26.
Schultz, D. & Schultz, S. E. (1998). Psychology and work today: An introduction toindustrial and organizational psychology (7th Ed). Upper Saddle River, NJ:Prentice Hall.
Seiber, S. D. (1974). Toward a theory of role accumulation. American Sociological
127Coetzer, Hanson and Trimble
Review, 39: 567–578.Selye, H. (1976). The stress of life. New York: McGraw-Hill.Senatra, P. T. (1980). Role conflict, role ambiguity, and organizational climate in a
public accounting firm. The Accounting Review, 55: 594–603.Shenkar, O. & Ziera, Y. (1992). Role conflict and role ambiguity of chief executive
officers in international joint ventures. Journal of International Business Studies,23(1): 55-75
Smith, V. (1997). New forms of work organization. Annual Review of Sociology, 23:315-339.
Sobel, M. E. (1982). Asymptotic intervals for indirect effects in structural equationsmodels. In Leinhart, S. (Ed.), Sociological methodology: 1982. San Francisco: Jossey-Bass.
Stuart, P. (1992). Tracing Workplace Problems to Hidden Disorders. Personnel Journal,71(6): 82-95.
Tetrick, L. (1992). Mediating effect of perceived role stress: A confirmatory analysis.In Quick, J. Murphy, L. & Jr. Hurrell, J. (Eds.). Stress and well being at work.Washington, DC: APA.
Wallis, C. (1994). Life in overdrive: Doctors say huge numbers of kids and adults haveADHD - Is it for real? Time, 144(3): 43-50.
Weinstock, S. A. (1993, March). Attention-Deficit Disorder Mythology. The Wall StreetJournal.
Weiss, G., Hechtman, L. T., Milroy, T. & Perlman, T. (1985). Psychiatric status ofhyperactives as adults: A controlled prospective 15 year follow up of 63 hyperactivechildren. Journal of the American Academy of Child Psychiatry, 24(2): 211-220.
Weiss, G. & Hechtman, L. T. (1986). Hyperactive children grown up: Empiricalfindings and theoretical considerations. New York: Guilford Press.
Weiss, G. & Hechtman., L. T. (1993). Hyperactive children grown up: ADHD in children,adolescents and adults (2nd Ed.) New York: Guilford Press.
Young, S., Morris, R., Toone, B. & Tyson, C. (2007). Planning ability in adults withattention-deficit/hyperactivity disorder. Neuropsychology, 21(5): 581-589.
128 Journal of Business and Management – Vol. 15, No. 2, 2009
Anticipation is in the Eye of theBeholder: Top-Level Managers SeeThings Differently When It Comes to
Crises Preparedness
Milan D. Larson
University of Northern Colorado
Karen Fowler
Colorado State University – Pueblo
This study offers insights on how executives, managers, and employeesperceive the likelihood of various major crises or disasters. Findings indicatethat natural disasters were perceived most likely to occur while terroristattacks were perceived as the least likely to occur. Further pairwisecomparisons reveal significant differences between the various levels ofmanagement for major terrorist attacks, natural disasters, and accidentaldisasters. Suggestions for future research, management implications, andlimitations of the study are also offered.
Crisis management and disaster prevention/preparedness have long been topics ofinterest in strategy, planning, decision making, and public administration literatures. Aspointed out by Mitroff, Diamond and Alpaslan (2006), the crisis management fieldsolidified its modern importance following the Johnson & Johnson Tylenol incident in1982. Many organizational crises followed. However, more recent devastations such asthe Oklahoma City bombing, shootings at Columbine High School, 9/11, HurricaneKatrina, and Virginia Tech shootings have catapulted crisis management into theforefront of many scholarly disciplines. These horrific events have become part of today’sreality and as a result, there is an urgent need to understand relationships between crisismanagement theory and the practice of crisis management beyond a case-by-case basis.
129Larson and Fowler
This research assesses the leadership perceptions of being prepared for varioustypes of crises and disasters. More specifically, it establishes the argument that theperceptions of a crisis to occur vary between the leadership levels in organizations.However, before turning the focus on the pre-event crisis constructs, we provide thefollowing review of crisis planning research to establish a context for our findings.
Crisis and Disaster Planning
Heightened Need for Planning One week after 9/11, at the Disaster Recovery Journal’s Fall World Conference in
Orlando, a significant number of the companies in attendance already had crisismanagement plans in place. However 97% of these firms also reported a need to havetheir crisis management plans changed (Disaster Recovery Journal, 2001). Even twoyears after 9/11, corporate security chiefs said nearly half of their companies were stillnot prepared in basic areas (Wall Street Journal, 2003). Intrigued by this lack ofpreparedness, The Wall Street Journal (2003) published an entire section entitled “HowVulnerable Are You?” addressing the issue of workplace security. During this sametimeframe, the Academy of Management Executive published an interview with LeeKorins, former CEO of the Security Traders Association, in which he recounted hispersonal experience in escaping from the North Tower of the World Trade Centerimmediately following the terrorist attack (Clinebell & Rowley, 2003). Manyconstituents are also asking how events at Virginia Tech could have been handled moreappropriately. Universities are now trying to improve their abilities to respond tounexpected crises. As these events suggest, crisis management and disasterpreparedness are crucial topics in today’s society and opportunities for empiricalorganizational research are numerous.
Changing Nature of Crisis EventsIn the past, crisis events were often defined as low probability, high consequence
events that could threaten organizational legitimacy, profitability, and viability(Shrivastava, 1987). They were also characterized by ambiguity of cause, effect, andmeans of resolution (Pearson & Clair, 1998). Many of the recent tragic events alreadymentioned have affected our thinking with respect to some of these contentions. Thenumerous crises that can be readily cited seem to suggest the probability foroccurrence is increasing (Lalonde, 2007). Certainly these events have escalated thenecessity for better crisis and emergency planning in all types of organizations and therelated bodies of literature are being reexamined.
The crisis, disaster, and emergency planning literatures can be categorizedgenerally as theoretical, empirical, and practitioner-oriented articles. Researchers inthese areas have debated the theoretical differences among existing disaster-relatedparadigms, such as the disaster-resistant community, disaster-resilient community, andsustainable development/sustainable hazards mitigation concepts (McEntire et al.,2002). In order to advance crisis management knowledge, other researchers haveattempted to integrate crisis concepts and develop better process models (McEntire etal., 2002; Mitroff, Shrivastava & Udwadia, 1987; Pearson & Clair, 1998).
130 Journal of Business and Management – Vol. 15, No. 2, 2009
Perception and Organizational LearningFor most crises, the planning process to help minimize the impact of an event is an
important strategic concern that must be addressed by senior executives. Therefore,some of the recent work in this area has studied the role of perception in crisisplanning by surveying top managers of Fortune 500 firms (Penrose, 2000). Thisresearch examined the perception by managers of a crisis being a threat or anopportunity—and the resulting relationship—to a number number of crisis planningvariables. As Penrose (2000) and Marra (1998) state, much of the traditional crisismanagement literature stresses the fundamental importance of implementing anenterprise-wide crisis plan. When organizations practice proactive crisis management,the damage of a crisis can be lessened. Furthermore, when a crisis occurs inorganizations that are prepared, learning takes place and those organizations are moreprepared for the next crisis. This is due, in part, to accelerated change in organizationalprocesses (Burnett, 1998). In addition, Spillan and Crandall (2002) investigatedwhether organizations were more prepared if they had crisis management teams inplace or if they were more prepared because they had already experienced a crisis. Thefindings from their study revealed previous experience was more important than crisismanagement teams (Spillan & Crandall, 2002). When organizations merely respondto a crisis, without a proactive posture, more damage seems to prevail (Nudell &Antokol, 1988). Smits and Ally (2003) also contend that when behavioral readiness isabsent, crisis management effectiveness becomes a matter of chance.
Massey (2001) investigated the effects of crisis-response strategies on perceptionsof organizational legitimacy. His findings suggest that to maintain legitimacy,organizations must engage in successful crisis management. Prior to 9/11, manyorganizational decision makers seemed to be either ignorant about the need for theirinvolvement in crisis management and disaster preparedness, and/or reluctant andunwilling to allocate resources appropriately to develop effective crises managementand disaster preparedness plans for their employees, in spite of the volumes ofpractitioner, pedagogical, and theoretical articles on how to plan for a crisis.
Spillan and Crandall (2002) surveyed executive officers of nonprofit organizationsand found that the presence of a crisis management team in an organization does notnecessarily mean that concern for all types of crisis events exists. Nonprofit managerswho have actually experienced a crisis are more concerned about that particular crisisthan the managers who have not experienced that crisis. The authors point out thattheir research sample was comprised primarily of small nonprofit organizations andspeculate that smaller nonprofits may be less sophisticated in their crisis managementpreparations than larger nonprofits.
Decision Making and LeadershipOther researchers have examined the paradoxical nature of crisis (Nathan, 2000),
attempted to guide comprehensive government decision making in crisis management(Rosenthal & Kouzmin, 1997), examined public leadership in times of crisis (Boin &Hart, 2003), offered plans for coping with crises in our schools (Perea & Morrison,1997; Lichtenstein, Kline & Schonfeld, 1994), and described frameworks for ethicaldecision-making in times of crisis (Christensen & Kohls, 2003). Drabek and McEntire
131Larson and Fowler
(2003) provide a thorough literature review and analysis of emergent phenomena andsociological aspects of disaster, pointing out numerous opportunities for furtherempirical research.
Crisis Management ProcessesOne of the most comprehensive theoretical treatments of crisis management has
been offered by Pearson and Clair (1998). Their crisis management process modelprovides a comprehensive descriptive model of pre-event environment, perceptual andorganizational characteristics, and post-event reactions, responses, and outcomes. Aswith any crisis event, empirical assessment can be limited. Often researchers do notknow what pre-event preparedness was in place, but they can assess visible damagethat may have occurred. If no visible damage occurred, researchers may not knowabout the crisis at all, therefore making any pre-event or post-event assessmentimpossible. Pearson and Clair (1998) have stressed there is little empirical knowledgeavailable on crisis and disaster planning processes and many of the variables discussedin the literature have yet to be operationalized.
Drawing on Pearson and Clair’s model, Hale, Hale and Dulek (2006) empiricallystudied the complex decision processes employed by executives during their crisisresponse. While their research was focused on post-event analysis, one finding wasparticularly relevant to our research. These authors found the presence of a crisismanagement plan (a pre-event construct) to improve post-event decision making,even if the written plan was dissimilar to the crisis actually faced by the organization.
Pre-Event ConstructsThe research presented here focuses on pre-event constructs identified in Pearson
and Clair’s (1998) work. The three primary pre-event constructs in Clair and Pearson’smodel include environmental context, such as institutionalized practices, executiveperceptions of risk, and adoption of organizational crisis management preparations. As explained by Pearson and Clair (1998), some may perceive a certain event as apotential crisis, while others may see the same event as nonthreatening, thus stressingthe critical role of perception. What a person can anticipate, adjust to, and act upondepends on his or her cognitive structure and decision making processes. If top-levelmanagers do not acknowledge the potential consequences of a disaster, they will notdo well with preparing the organization’s reaction to the crisis. Additionally, a person’scomfort level for different events comes from the level of intensity of the event itselfas well as the perceived likelihood the event will occur. For example, the more extreme(but less likely to occur) the event (e.g., terrorist attack), the less urgent a top-levelmanager might respond. Conversely, the less extreme (but more likely to occur) anevent, the more prepared an organization will become. Based on Pearson and Clair’s(1998) theoretical framework that a manager’s perception of a crisis event occurring iscritical to an organization’s preparedness, our study compares the perceptions of crisispreparedness of different levels of leadership in varying degrees of disaster.
132 Journal of Business and Management – Vol. 15, No. 2, 2009
Research Hypotheses
The intent in this research was to assess the perceptions of different levels ofleadership being prepared for varying types of disaster. However, unlike other researchsuch as Penrose (2000), Spillan and Crandall (2002) and Hale et al. (2006) (who choseto question exclusively top management and executives), we wanted to survey abroader range of management compared with organizational employees. Our interestwas to investigate any differences that might exist between management levels andcompany employees. The initial prestudy surveys indicated that many organizationalemployees were not aware of any crisis or emergency preparedness plans in their workenvironment. However, when investigated further, some of these organizations did, infact, have plans residing in the organization’s security department or on theorganization’s website. This led us to believe there could be variations in perceptionsof being prepared. The problem (as the study saw it), was that existing plans had neverbeen fully communicated nor institutionalized throughout the levels of theorganization. Therefore, this resulted in organizational members being unprepared torespond to a crisis or disaster if one did occur. Therefore, the following hypotheses areoffered:
Hypothesis 1: Top-level managers will have a higher perception of crisis preparednessthan mid-level managers.
Hypothesis 2: Top-level managers will have a higher perception of crisis preparednessthan entry-level managers.
Hypothesis 3: Top-level managers will have a higher perception of crisis preparednessthan employees.
Hypothesis 4: Mid-level managers will have a higher perception of crisis preparednessthan entry-level managers.
Hypothesis 5: Mid-level managers will have a higher perception of crisis preparednessthan employees.
Hypothesis 6: Entry-level managers will have a higher perception of crisis preparednessthan employees.
Methods
Rank Order on Likelihood of Events OccurringIn order to understand the likelihood of a crisis to occur, we asked participants to
rank order the likelihood of different crisis events to occur. The five types of crises thatappeared on the questionnaire included:
• secondary terrorist attacks (anthrax in mail, attack on a computer system, etc.)
133Larson and Fowler
• natural disasters (flood, tornado, earthquake, forest fire, hurricane, blizzard, etc.)
• major terrorist attacks (bombs, destruction of building, biological attack, etc.)• accidental disasters (long-term power outage, building fire, chemical spill,
radioactive leak, etc.)• workplace violence
Consensus among statisticians (Minium, 1978) suggests that an order effect was notlikely to occur, provided we did not present the crises in any predeterminedsequential-type order on the questionnaire. Therefore, the order effect wascontrolled by presenting them in the order shown above that reflected them asindependent events.
SampleThe population selected for this research was the alumni database from a medium-
sized, AACSB-accredited college of business at a state university in the SouthwesternUnited States. Every graduate from the college for the past 10 years was included inthe population, resulting in an initial population of 2,296 graduates. Thirteen alumswere eliminated from the study because they had moved home to foreign countriesand mailing addresses were not available. The questionnaire, along with a cover letterexplaining the research, was mailed to 2,283 alums. Of the surveys mailed, 104resulted in incorrect addresses and had to be discarded. The final useable sampleconsisted of 2,179 alums. Of these, 363 alums completed the questionnaire, resultingin a response rate of 16.5%.
DemographicsThe majority of the respondents worked at for-profit organizations (80.4%),
employing 100-499 employees at their work location (27.5%), employing over 500total organizational employees (61.7%), and having over 25 work locations for theirorganization (43.3%). Respondents’ work locations included 25 states with themajority represented by the state in which the college of business was located. Thegender of the respondents was evenly split with 50.3% being female and 49.7% beingmale. The majority of respondents were nonmanagement employees (45.2%), followedby mid-level managers (27.5%), then entry-level management (17.4%). Nearly 10% ofthe respondents indicated their positions to be top-level or executive-level. This metour objective of surveying all levels of employees in different types of organizations.
Analysis and Results
To compare the perceived readiness for a crisis prior to the actual event occurring,we used analysis of variance (ANOVA) methods for the different leadership levels invarying degrees of crisis preparedness for each of the types of disasters. To calculatethe likelihood of each type of disaster, we averaged the rank order (1=most likely tooccur to 5=least likely to occur) from each respondent’s ranking of major terroristattacks, secondary terrorist attacks, natural disasters, accidental disasters, and
134 Journal of Business and Management – Vol. 15, No. 2, 2009
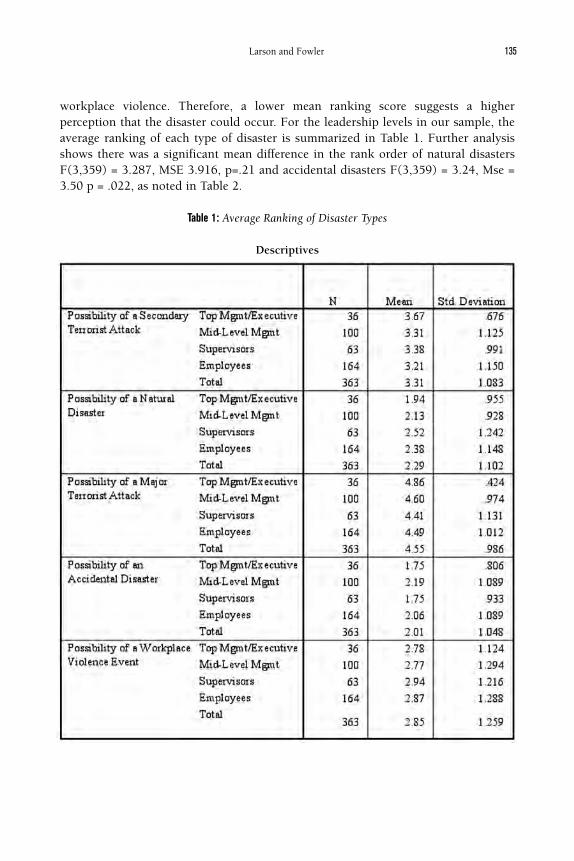
workplace violence. Therefore, a lower mean ranking score suggests a higherperception that the disaster could occur. For the leadership levels in our sample, theaverage ranking of each type of disaster is summarized in Table 1. Further analysisshows there was a significant mean difference in the rank order of natural disastersF(3,359) = 3.287, MSE 3.916, p=.21 and accidental disasters F(3,359) = 3.24, Mse =3.50 p = .022, as noted in Table 2.
Table 1: Average Ranking of Disaster Types
Descriptives
135Larson and Fowler

Table 2: ANOVA Analysis of Mean Differences
As indicated in Table 3, further pairwise comparisons using LSD revealed that,consistent with Hypothesis 1, top-level managers had a significantly different rankingof terrorist attacks, natural disasters, and accidental disasters than other managers andemployees did. Contrary to Hypothesis 1, however, top-level managers do not have anotably different perception that workplace violence will occur than do the otherlevels of management or employees. Thus, Hypotheses 2 and 3 are only partiallysupported with our sample.
In our analysis for mid-level managers, the pairwise comparisons show asignificant mean difference when considering natural disasters and accidentaldisasters, but not in terrorist attacks or workplace violence. Therefore, Hypotheses 4and 5 are only partially supported.
Investigating the perceptions of entry-level managers, our findings show asignificant mean difference regarding accidental disasters. However, when it comes toterrorist attacks, natural disasters, and workplace violence, entry-level managers donot perceive any significant differences than the employees of the organizations usedin this study. As a result, Hypothesis 6 is only partially supported.
Discussion and Implications for Future Research
The reality of our world suggests organizations can no longer ignore the possibilitythat major crises are a distinct possibility. Although it is impossible to predict all thedifferent scenarios, having some plan in place is paramount. Research hasdemonstrated that having a crisis plan in place, even though it may not be completelyspelled out, helps minimize the lasting effect of the disasters (Fink, 1986). Thepresence of a crisis management plan also improves crisis decision making processes,even when the plan is dissimilar to the actual crisis faced (Hale et al., 2006). The onlyway to begin the process of planning is by anticipating some of the many possibilitiesof a disaster. Thus, the awareness by leaders can only facilitate and enhance the overall
136 Journal of Business and Management – Vol. 15, No. 2, 2009
preparation and planning.This research attempted to operationalize constructs previously identified in the
crisis and disaster preparedness literature (Pearson & Clair, 1998) and empiricallyassess variables identified as important to crisis and disaster preparedness. Ourresearch findings demonstrate that Pearson and Clair’s (1998) theoretical propositionshold true when tested with empirical data. More specifically, our results focused onthe propositions in their theoretical model that “executive perceptions about risk willfoster adoption of crisis management programs” and that a “modest amount of crisispreparation likely will lead executives to believe that their organization is no longervulnerable to a crisis” (Pearson & Clair, 1998, p. 70). Our research demonstrates that,in many cases, top-level managers and mid-level managers showed a higher level ofperceived preparedness than employees. Additionally, entry-level managersdemonstrated higher perceptions of accidental disasters. This makes intuitive sensebecause of the very close day-to-day working relationships that entry-level managershave with employees. This finding does not support, however, the contention that allemployees in the organization be thoroughly familiar with the crisis or disaster plan.Instead, it supports the notion that management may believe the organization is moreprepared than may actually be the case.
Managerial ImplicationsPractically speaking, the success stories generated on 9/11 garner their own
support for the value of getting prepared. The practitioner literature is also abundantwith case-specific and generalized prescriptive advice for being prepared. The 1993bombing of the World Trade Center spurred the Board of Trade and some other firmsin and around the Twin Towers to better protect their employees and data. Forexample, for Morgan Stanley (the World Trade Center’s largest tenant with 3700employees), sticking with the evacuation plan was critical to saving lives. Even thoughsomeone on the South Tower’s public address system informed workers it was safe toreturn to their offices, Morgan’s security officer kept employees moving down dozensof flights of stairs. All but six employees escaped. Everyone knew about thecontingency plan. Oft-repeated drills saved others as well. Employees of the Japanesefirm Mizuho had emergency kits with burn cream, smoke hoods, and glow sticksstrapped to the backs of their chairs (Time, 2001). While all of these examples areunfortunate, they also offer insight into the benefits of being prepared.
Managers who remain unprepared for managing crises or disasters in theirorganizations increase the likelihood of being faced with potential legal and othercomplications. They could be held liable for failing to do so, as is similar in casesinvolving things like unsafe working conditions. Lockwood (2005) stresses thatemployees want to feel safe at work and that feeling safe at work contributes to anemployee’s overall job satisfaction. Bordwin (1999) examines the legal aspects ofcrisis, indicating managers could get sued. His research cites the potential forcriminal liability, for example, when poultry packing executives were jailed formanslaughter when workers caught in a plant fire could not escape because the fireexits were bolted shut.
137Larson and Fowler

Table 3: LSD Pairwise Comparisons: Mean Differences Between Mgrs & Employees
138 Journal of Business and Management – Vol. 15, No. 2, 2009
* p<.05
The tragedy that occurred on 9/11 caused some analysts to reexamine the issues ofcentralization and decentralization of organizational structures and processes as theyrelate to crisis prevention and preparedness (Time, 2001). Hurricane Katrina maycertainly fuel those efforts as well. Trophy buildings, high profile locations, singlelocations, advertising of brand names on vans and buses, employee uniforms,employee criminal records, air travel, management succession, and organizational sizehave all come under new and heightened scrutiny. Private jet air travel is boomingunder the assumption that private airports may be safer. Softer, heuristic forecastingtechniques have been thrust back into the limelight. Reexamining team decisions hasadditionally come into question.
One additional finding from this study highlights a common rank order perceptionof the different crisis events. In all cases, except for mid-level managers, participantsin this study perceived the following rank order (from least likely to most likely) ofevents to occur: major terrorist attacks, secondary terrorist attacks, workplaceviolence, natural disasters, and accidental disasters. Mid-level managers had similarperceptions of rank order, except for the last two categories. Future research shouldinvestigate these rank orders to see if these findings hold true with larger samples fromother parts of the United States and in other industries not represented by our sample.
Future ResearchBased on this study, we believe our findings are only the beginning for a better
understanding of crisis management. Although we have operationalized part ofPearson and Clair’s (1998) model, there are other areas to further investigate. Forexample, future research should explore the implications of organizational structures.Do certain organizational structures lend themselves to a more effective response tocrisis management? Also unanswered is whether or not some industries are betterprepared than others. For example, do industries that are classified as hazardous bythe Occupational Safety and Health Administration (OSHA) have a more effectivecrisis management track record? Are these industries required to have a morefoolproof system in place because they are closely monitored by OSHA? Another areaof research should take an even deeper look into crisis management by exploring“why” the different perceptions exist. Our findings only explored whether or notdifferent levels of management had the same perceptions. Now that we know differentperceptions exist, the next logical step is to understand why.
Limitations
As with all empirical research, our study has limitations that should be noted forfuture research in crisis planning and preparedness. One of the most visible limitationsis that the majority of our responses were from the state in which the alumnigraduated. Although one could argue the homogeneity of this sample serves assurrogate control for contextual elements and a more rigorous test of Pearson andClair’s (1998) constructs, it is still worth noting a homogeneous sample has itsdrawbacks for generalizing the findings. By having a high representation from one areaof the United States, other perceptions may exist with employees and managers from
139Larson and Fowler
different geographic areas. Similarly, the sample in our study represents a strong biastoward the United States. Therefore, perceptions of crisis preparedness may bedifferent in other parts of the world. Future research should include a broadergeographical area. Another limitation to our study is the high number of respondentsfrom for-profit organizations. Although for-profit organizations represent a largepercent of US firms, crisis research for non-profit organizations, such as schools, maylend different results. Future research should investigate an array of industries,geographical locations, as well as organizational types and sizes, as we attempt toimprove crisis and disaster planning and preparedness. The stakes are high.
Summary
This research presents results of an exploratory empirical study that assessed theperceived likelihood of different crises. By analyzing the different levels of leadershipand their corresponding anticipation of a major crisis or disaster occurring, we hopethis study offers insights into the subsequent planning processes of preparing for the“thinkable.” It no longer suffices to refer to recent events as “unthinkable.” Theseevents happened and have occurred (in some cases more than once). In mostsituations, our findings indicate different levels of management have a differentperception as to what kind of disaster is more likely to occur. With the insights gainedfrom this study, future research can begin to address other crisis managementquestions as to why these different perceptions exist and whether these differencescause any conflicts in the execution of crises management plans. Ultimately, theseinsights can assist organizational decision makers who understand the realities oftoday’s crisis-ridden environment.
References
Boin, A. & Hart, P. (2003). Public leadership in times of crisis: mission impossible?Public Administration Review, 63(5): 544-553.
Bordwin, M. (1999). Plan B…Or is it plan C for crisis? Management Review: 53-55.Burnett, J.J. (1998). A strategic approach to managing crises. Public Relations Review,
24(4): 475-488.Christensen, S.L. & Kohls, J. (2003). Ethical decision making in times of
organizational crisis. Business & Society, 42(3): 328-358.Clinebell, S. & Rowley, D.J. (2003). Former CEO of the Security Traders Association Lee
Korins on managing through chaos. Academy of Management Executive, 17(2): 30-36.Disaster Recovery Journal. (2001, Fall). World Conference. Disaster Recovery Journal,
(14)1. Orlando, FL.Drabek, T.E. & McEntire, D.A. (2003). Emergent phenomena and the sociology of
disaster: lessons, trends and opportunities from the research literature. DisasterPrevention and Management, 12(2): 97-112.
Fink, S.L. (1986). Crisis management: planning for the inevitable. New York: AmericanManagement Association.
Hale, J.E., Hale, D.P. & Dulek, R.E. (2006). Decision processes during crisis response:
140 Journal of Business and Management – Vol. 15, No. 2, 2009
an exploratory investigation. Journal of Managerial Issues, 18: 301-321.Lalonde, C. (2007). Crisis management and organizational development: towards the
conception of a learning model in crisis management. Organization DevelopmentJournal, 25(1): 17-26.
Lichtenstein, R., Schonfeld, D.J. & Kline, M. (1994). School crisis response: expectingthe unexpected. Educational Leadership, 52(3): 79-84.
Lockwood, N.R. (2005). Crisis management in today’s business environment: HR’sstrategic role. HRMagazine, 50: 1-11.
Marra, F.J. (1998). Crisis communication plans: poor predictors of excellent crisispublic relations. Public Relations Review, 24: 461-474.
Massey, J.E. (2001). Managing organization legitimacy: communication strategies.Journal of Business Communication, 38(2): 153-168.
Minium, E.W. (1978). Statistical reasoning in psychology and education. New York: JohnWiley & Sons.
Mitroff, I.I., Diamond, M.A. & Alpaslan, C.M. (2006). How prepared are America’scolleges and universities for major crises? Assessing the state of crisis management.Change, 38: 60-68.
Mitroff, I.I., Shrivastava, P. & Udwadia, F.E. (1987). Effective crisis management.Academy of Management Executive, 1 (3): 283-292.
Nathan, M. (2000). The paradoxical nature of crisis. Review of Business, 21(3): 12-18. Nudell, M. & Antokol, N. (1988). The handbook for effective emergency and crisis
management. Toronto: Lexington Books..Pearson, C.M. & Clair, J.A. (1998). Reframing crisis management. Academy of
Management Review, 23(1): 59-77. Penrose, J.M. (2000). The role of perception in crisis planning. Public Relations Review,
26(2): 155-165.Perea, R.D. & Morrison, S. (1997). Preparing for a crisis. Educational Leadership,
55(2): 42-45.Rosenthal, U. & Kouzmin, A. (1997). Crises and crisis management: toward
comprehensive government decision making. Journal of Public AdministrationResearch and Theory, 7(2): 277-305.
Shrivastava, P. (1987). Bhopal: Anatomy of a crisis. New York: Ballinger.Smits, S.J. & Ally, N.E. (2003). Thinking the unthinkable – leadership’s role in creating
behavioral readiness for crisis management. Competitiveness Review, 13(1): 1-23. Spillan, J.E. & Crandall, W.R. (2002). Crisis planning in the nonprofit sector:
should we plan for something bad if it may not occur? Southern Business Review(Spring): 18-29.
Time. (2001, October 8). Guarding against new risks: global executives are working toprotect their employees and businesses from calamity. Time, 158:16, B8.
The Wall Street Journal. (2003, September 29). How vulnerable are you? The Wall StreetJournal, R1 – R8.
141Larson and Fowler

142 Journal of Business and Management – Vol. 15, No. 2, 2009
143Jacques, Garger, Brown and Deale
Personality and Virtual Reality Team Candidates: The Roles ofPersonality Traits, Technology
Anxiety and Trust as Predictors ofPerceptions of Virtual Reality Teams
Paul H. Jacques
Western Carolina University
John Garger
Metronome Computer Services
Carroll A. Brown
Western Carolina University
Cynthia S. Deale
East Carolina University
This paper examines personality traits as antecedents to perceptions of theusefulness and intention to use a virtual reality team (VRT) environment atan early stage of virtual team education. Subjects watched a training videoemphasizing communication in VRTs across various boundaries includingtime, culture, social norms, and organizational expectations. Subjects thencompleted and returned surveys collecting relevant constructs. Support forthe proposed model was found in which personality traits predictedpropensity to trust and technology communication anxiety. In addition,propensity to trust and technology communication anxiety predictedperceived VRT usefulness and intention to use VRTs respectively. The modelsuggests that both stable personality traits such as extraversion andopenness, and situation-specific traits such as technology communicationanxiety predict subjects’ perceptions of the useful and intention to use avirtual team in the near future.
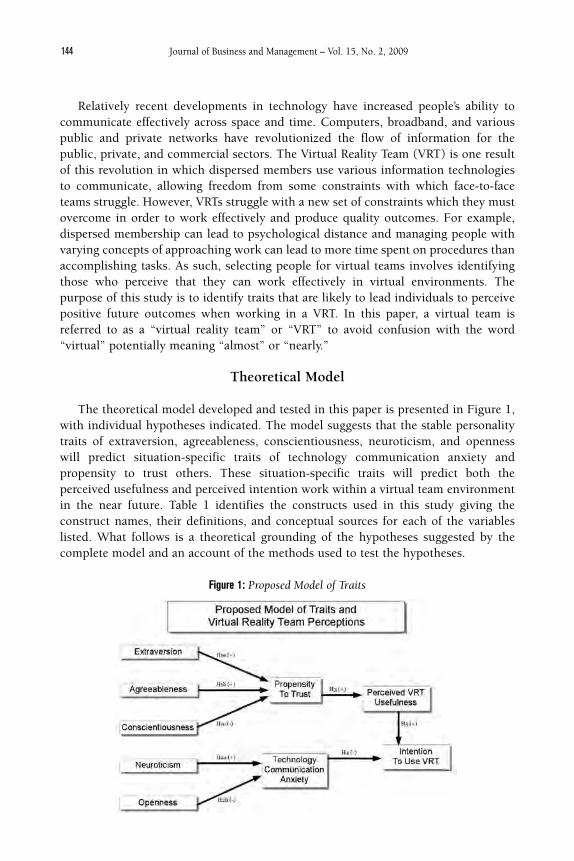
144 Journal of Business and Management – Vol. 15, No. 2, 2009
Relatively recent developments in technology have increased people’s ability tocommunicate effectively across space and time. Computers, broadband, and variouspublic and private networks have revolutionized the flow of information for thepublic, private, and commercial sectors. The Virtual Reality Team (VRT) is one resultof this revolution in which dispersed members use various information technologiesto communicate, allowing freedom from some constraints with which face-to-faceteams struggle. However, VRTs struggle with a new set of constraints which they mustovercome in order to work effectively and produce quality outcomes. For example,dispersed membership can lead to psychological distance and managing people withvarying concepts of approaching work can lead to more time spent on procedures thanaccomplishing tasks. As such, selecting people for virtual teams involves identifyingthose who perceive that they can work effectively in virtual environments. Thepurpose of this study is to identify traits that are likely to lead individuals to perceivepositive future outcomes when working in a VRT. In this paper, a virtual team isreferred to as a “virtual reality team” or “VRT” to avoid confusion with the word“virtual” potentially meaning “almost” or “nearly.”
Theoretical Model
The theoretical model developed and tested in this paper is presented in Figure 1,with individual hypotheses indicated. The model suggests that the stable personalitytraits of extraversion, agreeableness, conscientiousness, neuroticism, and opennesswill predict situation-specific traits of technology communication anxiety andpropensity to trust others. These situation-specific traits will predict both theperceived usefulness and perceived intention work within a virtual team environmentin the near future. Table 1 identifies the constructs used in this study giving theconstruct names, their definitions, and conceptual sources for each of the variableslisted. What follows is a theoretical grounding of the hypotheses suggested by thecomplete model and an account of the methods used to test the hypotheses.
Figure 1: Proposed Model of Traits
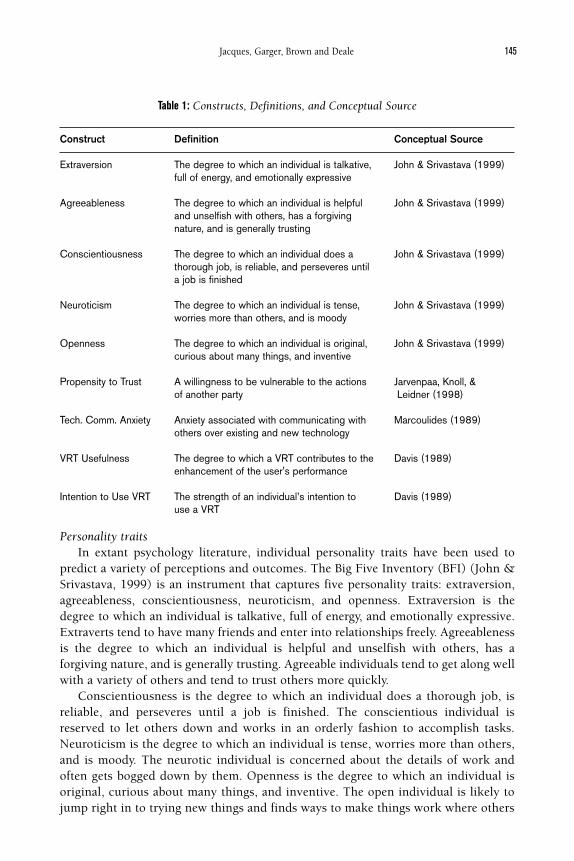
145Jacques, Garger, Brown and Deale
Table 1: Constructs, Definitions, and Conceptual Source
Personality traitsIn extant psychology literature, individual personality traits have been used to
predict a variety of perceptions and outcomes. The Big Five Inventory (BFI) (John &Srivastava, 1999) is an instrument that captures five personality traits: extraversion,agreeableness, conscientiousness, neuroticism, and openness. Extraversion is thedegree to which an individual is talkative, full of energy, and emotionally expressive.Extraverts tend to have many friends and enter into relationships freely. Agreeablenessis the degree to which an individual is helpful and unselfish with others, has aforgiving nature, and is generally trusting. Agreeable individuals tend to get along wellwith a variety of others and tend to trust others more quickly.
Conscientiousness is the degree to which an individual does a thorough job, isreliable, and perseveres until a job is finished. The conscientious individual isreserved to let others down and works in an orderly fashion to accomplish tasks.Neuroticism is the degree to which an individual is tense, worries more than others,and is moody. The neurotic individual is concerned about the details of work andoften gets bogged down by them. Openness is the degree to which an individual isoriginal, curious about many things, and inventive. The open individual is likely tojump right in to trying new things and finds ways to make things work where others
Construct Definition Conceptual Source
Extraversion The degree to which an individual is talkative, John & Srivastava (1999)full of energy, and emotionally expressive
Agreeableness The degree to which an individual is helpful John & Srivastava (1999)and unselfish with others, has a forgiving nature, and is generally trusting
Conscientiousness The degree to which an individual does a John & Srivastava (1999)thorough job, is reliable, and perseveres until a job is finished
Neuroticism The degree to which an individual is tense, John & Srivastava (1999)worries more than others, and is moody
Openness The degree to which an individual is original, John & Srivastava (1999)curious about many things, and inventive
Propensity to Trust A willingness to be vulnerable to the actions Jarvenpaa, Knoll, & of another party Leidner (1998)
Tech. Comm. Anxiety Anxiety associated with communicating with Marcoulides (1989)others over existing and new technology
VRT Usefulness The degree to which a VRT contributes to the Davis (1989)enhancement of the user's performance
Intention to Use VRT The strength of an individual’s intention to Davis (1989) use a VRT
146 Journal of Business and Management – Vol. 15, No. 2, 2009
would give up more easily.In psychology literature, personality traits have been used to predict a variety of
outcomes including predicting work-related performance (Judge et al., 2007),bullying, and discrimination (Parkins, Fishbein & Ritchey, 2006), and therelationship of a focal individual’s personality with projection to that of others(Motowidlo, Hooper & Jackson, 2006). The applicability of the 5-factor model ofpersonality to an array of job performance criteria has been shown to exist in a varietyof settings. In a meta-analysis of 117 studies totaling nearly 24,000 subjects thatexamined the relationships between the “Big 5” and performance outcomes, Barrickand Mount (1991) found the conscientiousness construct to be positively related toperformance outcomes across occupational types. Furthermore, they found thatextraversion was positively related to performance ratings in occupations involvingsocial interaction. In addition, findings from Barrick et al. (1998) link extraversionwith the ability of teams to be self-sustaining.
One beneficial aspect to using personality traits in research is that they have beentheorized to be long-term to life-long attributes of individuals (Conley, 1985; Eysenck& Eysenk, 1985; Parham & Schaie, 1976). Predicting outcomes or perceptions withpersonality traits is longitudinally replicable for the same individual. This has adistinct advantage when choosing people for moderate or long-term training. Sincepersonality traits are life-long attributes, identifying ideal candidates at one timemakes it likely that the candidates will remain good candidates throughout andbeyond training.
TrustJarvenpaa, Knoll and Leidner (1998) found support for their hypotheses that team
building exercises predict perceptions of ability, integrity, and benevolence which inturn, predict trust in global virtual teams. Mayer, Davis and Schoorman (1995, p. 712)define trust as the “willingness to be vulnerable to the actions of another party basedon the expectation that the other will perform a particular action important to thetrustor, irrespective of the ability to monitor or control that other party.” Thisdefinition has important considerations for VRTs where monitoring and controllingothers is difficult, if not impossible. Consequently, individuals with a need to monitorothers for lack of trust will find it difficult to work in VRTs effectively. Couch and Jones(1997) and Gurtman (1992) argue that trust is essential to the development andmaintenance of team member relationships and is linked to the quality of thoserelationships. Identifying antecedents to propensity to trust at the individual level cangive insight into those who will adjust to VRTs successfully. Of note, Ding and Mowei(2005) found no differences in levels of trust either between males and females orwithin the age range of the undergraduate students used in their research. Therefore,there would be no compelling reason to include age and gender within the scope ofvariables used in the present study.
There have been few studies linking elements of the 5-factor model of personalityand trust. Two such studies, however, establish linkages between personalitydimensions and trust. In one such study, Sutherland and Tan (2004) construct atheoretical framework linking extraversion and openness with greater propensity to
147Jacques, Garger, Brown and Deale
trust, while higher levels of conscientiousness would be related to lower propensity totrust. In general, extraverts enter into relationships easily and seek many differentrelationships simultaneously. The more extraverted a person is, the more thatindividual has many relationships that tend to be shallow. In contrast, the introvertoften has fewer but deeper relationships. The extravert is more interested in thequantity rather than the quality of relationships, resulting in an individual being morewilling to trust in order to attain more and more relationships to satisfy his/her needfor interpersonal interactions. As such, the degree that an individual is extraverted willpredict that individual’s propensity to trust. Given the discussion above, the followingseries of hypotheses are offered beginning with:
Hypothesis 1a: Extraversion will be positively correlated with propensity to trust.
Agreeable individuals by nature get along with others and trust more easily thanmost people. This trait to be agreeable results in an individual who, at the outset of arelationship, engages in trusting behaviors earlier than someone with a lower need tobe agreeable. In addition, the agreeable individual may even trust too soon in arelationship resulting in good outcomes when the trusted party is worthy of trust andnegative outcomes when the trusted party is not. Regardless of the trustworthiness ofthe second party, individuals with a higher need to be agreeable will trust more readilyin situation-specific situations. Indeed, Matzler, Mooradian and Renzl (2006) foundthat individuals high in agreeableness more readily share knowledge thus resulting inhigher levels of ratings of interpersonal trust. Therefore,
Hypothesis 1b: Agreeableness will be positively correlated with propensity to trust.
The conscientious individual detests letting others down and seeks to be reliable toothers. This individual finds it more difficult to trust in others in a team environmentfor fear of other people’s unreliable behavior reflecting on him/her. The conscientiousindividual prefers to work alone when he/she knows that his/her outcomes will beevaluated by others. With a need to be reliable to such raters, uncertainty brought onby a need to trust others to perform tasks makes it difficult for the conscientiousindividual to trust. Hence,
Hypothesis 1c: Conscientious will be negatively correlated with propensity to trust.
Technology anxietyAnxiety associated with using and learning to use technology has been explored in
extant literature (Lewis, Daley & Shea, 2005; Marcoulides, 1988, 1991). Beckers,Schmidt and Wicherts (2007) found that when using pencil/paper and computercollection methods, computer anxiety was more strongly related to trait anxiety thanto state anxiety. However, they also found that in the computer collection, computeranxiety and state anxiety were related “suggesting that state anxiety in situationsinvolving a computer is caused by pre-existing computer anxiety” (Beckers et al.,2007). Individuals working in VRTs often find themselves using new technology for
148 Journal of Business and Management – Vol. 15, No. 2, 2009
the first time and existing technology in new ways. Individuals with a general fear ofusing technology find it difficult to perform well in VRTs where using technology isthe primary communication instrument through which tasks are accomplished withother team members. In a study of personality and Information Technology (IT),Perrewe and Thatcher (2002) found that computer anxiety was negatively related tocomputer self-efficacy. This suggests that confidence in using computers is a functionof an individual’s apprehension and ultimately avoidance of computer usage. Sincemuch of the communication in VRTs is conducted over computers connected tonetworks, investigating the antecedents to computer and technology anxiety willprovide better insight into the causes of this phenomenon.
The highly neurotic individual worries about future events and responsibilities.These individuals are also concerned about the details of how to accomplish tasks andthe obstacles that are ahead. The thought of using new technology or familiartechnology in new ways makes the neurotic individual avoid such situations wherethere is uncertainty in future outcomes. This individual is more likely to experienceanxiety with the concept of communicating through unfamiliar media, and absentintensive training, will immediately reject the use of virtual reality teams as a means toaccomplish work-related tasks. Hence,
Hypothesis 2a: Neuroticism will be positively correlated with technology communication anxiety.
The nature of the open individual is to be curious and try new things. Theseindividuals are naturally curious about communicating in VRTs and would not beapprehensive of trying new ways of working with others. As an individual with a highneed for openness is always looking for new ways to accomplish tasks, communicatingover technology with others would be a welcomed experience. This results in lowerlevels of anxiety when prompted to communicate with unfamiliar devices. Hence,
Hypothesis 2b: Openness will be negatively correlated with technology communication anxiety.
VRT constructsIn a study by Davis (1989), the author describes a construct that measures the
degree “to which an application contributes to the enhancement of the user'sperformance.” This definition which describes the perceived usefulness of anapplication is a part of the Technology Acceptance Model (TAM) (Davis, Bagozzi &Warshaw, 1989). Another construct in the TAM, behavior intention, describes thestrength of an individual’s intention to use the application under study and derivesfrom the more general Theory of Reasoned Action (Ajzen & Fishbein, 1975, 1980).One advantage of these constructs is the ability to capture perceptions about a specifictechnology rather than capture perceptions of the ease of use and intention to usetechnology in general. Therefore, it is possible to capture these constructs as theyrelate specifically to a technology under investigation.
The Technology Acceptance Model (TAM) (Davis, 1989; Davis & Venkatesh, 2000)
149Jacques, Garger, Brown and Deale
posits that perceived usefulness of technology is an important construct inunderstanding why individuals adopt technologies. Given that trust in VRTs is integralto successful performance, trust will be perceived as a necessary component to theusefulness of VRTs as a means to accomplish tasks. Therefore, the followinghypothesis is offered:
Hypothesis 3: Propensity to trust will be positively correlated with perceived VRT usefulness.
It is reasonable to assume that anxiety about any component of an unfamiliartechnology would result in a decreased intention to use the technology. Individualswho perceive anxiety when they use technology will be less likely to use VRTs whenthey are informed that communicating with technology is a major component. Inaddition, technology changes at a rapid pace making competency in today’s technologyobsolete in the foreseeable future. For this reason, technology use creates uncertaintyas to the perishable skills associated with learning to use technology effectively whichelevates an individual’s anxiety when evaluating the need to communicate exclusivelywith technology in a VRT. This, in turn, reduces the likelihood that an individual willchoose to work in a virtual team in the future. Hence,
Hypothesis 4: Technology communication anxiety will be negatively correlated with intention to use VRTs.
The TAM posits that perceived usefulness of technology predicts an individual’sintention to use that technology. In conjunction with this relationship, individualswho perceive VRTs as useful will be more likely to work in a VRT. Hence, in line withprevious research,
Hypothesis 5: Perceived VRT usefulness will be positively correlated with intention to use VRTs.
Methods
SampleSubjects were 276 undergraduate junior and senior management students from a
midsized, comprehensive university in the United States who volunteered to be a partof the study during the spring 2007 semester. Surveys were administered in 9 coursesencompassing 13 sections. Of the 276 subjects who volunteered, 252 returnedcompleted surveys, a 91.3% response rate. 131 (52%) of the subjects were female and121 were male.
MeasuresThe Big Five Inventory (John & Srivastava, 1999) consisting of forty-four items was
used to measure extraversion (8 items), agreeableness (9 items), conscientiousness (9items), neuroticism (8 items), and openness (10 items). Propensity to trust was
150 Journal of Business and Management – Vol. 15, No. 2, 2009
measured with seven items which were modified to reflect subjects’ perception ofgeneral trust in others (Jarvenpaa et al., 1998; Mayer et al., 1996). Technologycommunication anxiety was measured with two items adapted from Marcoulides’(1989) Computer Anxiety Scale. These items reflected a subject’s anxiety incommunicating with others over existing and new technology. Perceived usefulness (4items) and propensity to work in VRTs (2 items) were measured with six items from theTechnology Acceptance Model (Davis, 1989; Davis & Venkatesh, 2000). All items weregathered using a 5-point Likert scale ranging from 1 (strongly disagree) to 5 (stronglyagree), with 2 through 4 representing intermediate responses.
ProcedureThe study took place during the beginning of normal class time so subjects were
not asked to participate in an unfamiliar location or at an inconvenient time. Subjectscompleted a preliminary survey consisting of the extraversion, agreeableness,conscientiousness, neuroticism, openness, propensity to trust, and technologycommunication anxiety constructs. These constructs were specifically collected beforethe VRT introduction so responses to these items were not influenced by thesubsequent VRT training.
Subjects then watched a video about communicating in VRTs. This video consistedof an 18-minute production titled Building the Virtual Team: Communication AcrossCultural Boundaries (Customer Service University, 2006). The purpose of using thisvideo was to introduce the topic of VRTs to the subjects without providing anysignificant amount of skill development in any specific facet of VRTs. The videofocused specifically on crossing boundaries in virtual teams by following a virtual teammanager as she struggles with differing team members’ perceptions of time, socialnorms, cultural issues, and organizational expectations. Actors played out their rolesand occasionally spoke directly to the audience explaining their individual point ofview emphasizing the crossing of boundaries. In no way are the current authorsaffiliated with the publisher of the video and the current authors received nocompensation for using the video in this study. After the video, subjects completed asurvey consisting of the perceived usefulness and intention to use VRT constructs.
Data AnalysisData were analyzed using multiple regressions to obtain standardized regression
weights, squared multiple correlations, and significant levels for test statistics. Sincemultiple items were collected for each variable under study, scale scores were createdby taking a mean of the items to estimate constructs. Regression analysis was chosento test the relationships among the constructs because it meets two main criteria forthe present study. First, it allows the simultaneous evaluation of multiple,antecedent constructs on an endogenous construct without regard to the order inwhich the antecedent constructs are entered. Second, multiple regression allows fora measure of either the positive or negative strength of a relationship between twoconstructs allowing the researcher to determine if a hypothesized relationship isstatistically justified.

151Jacques, Garger, Brown and Deale
Results
Preliminary analyses of data included calculation of construct means, standarddeviations, and correlations. Construct reliabilities (coefficient alphas) ranged from0.70 for the propensity to trust construct to 0.85 for the extraversion construct. Asummary of these statistics is shown in Table 2.
Table 2: Means, Standard Deviations, Construct Correlations, and Scale Reliabilities†
Evidence was found in support of Hypotheses 1a (standardized regression weight= 0.12, p < 0.05), Hypothesis 1b (standardized regression weight = 0.32, p < 0.01), andHypothesis 1c (standardized regression weight = -0.15, p < 0.05). Evidence was alsofound to support Hypothesis 2a (standardized regression weight = 0.18, p < 0.01) andHypothesis 2b (standardized regression weight = -0.17, p < 0.01). Propensity to trustwas positively correlated with perceived VRT usefulness in support of Hypothesis 3(standardized regression weight = 0.17, p < 0.01) and technology communicationanxiety was found to negatively correlate with intention to use VRTs in support ofHypothesis 4 (standardized regression weight = -0.09, p < 0.05). Commensurate withprevious research, perceived VRT usefulness was found to positively correlate withintention to use VRTs in support of Hypothesis 5 (standardized regression weight =0.65, p < 0.01). Squared multiple correlations were 0.12 for propensity to trust, 0.07for technology communication anxiety, 0.03 for perceived VRT usefulness, and 0.43for intention to use VRTs. A summary of these findings is shown in Figure 2.
Mean SD 1 2 3 4 5 6 7 8 9
1. Extraversion 3.36 0.70 0.85
2. Agreeableness 3.73 0.52 0.17** 0.75
3. Conscientiousness 3.58 0.51 0.14* 0.32** 0.73
4. Neuroticism 2.82 0.65 -0.44** -0.27** -0.20** 0.80
5. Openness 3.40 0.57 0.35** 0.17** 0.12 -0.26** 0.78
6. Propensity to Trust 2.99 0.56 0.15* 0.29** -0.04 -0.18** 0.14* 0.70
7. Tech. Comm. Anxiety 2.19 0.82 -0.11 -0.13* -0.12 0.22** -0.21** -0.07 0.75
8. VRT Perc. Usefulness 3.10 0.76 0.10 0.09 0.03 -0.06 0.12 0.17** 0.02 0.83
9. Intention to Use VRT 2.99 0.88 0.04 -0.01 0.10 0.03 0.14* 0.08 -0.08 0.65** 0.76
† Cronbach reliabilities shown along the diagonal
* p < 0.05
** p < 0.01
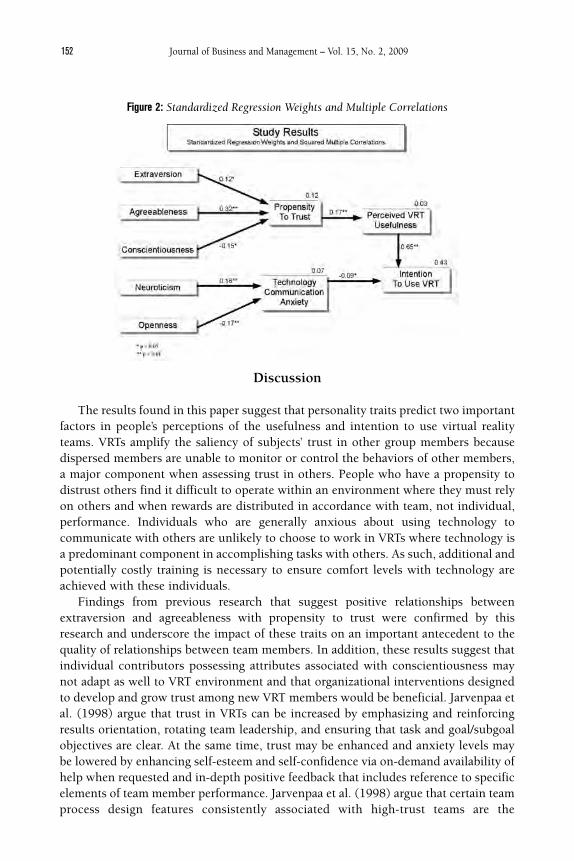
152 Journal of Business and Management – Vol. 15, No. 2, 2009
Figure 2: Standardized Regression Weights and Multiple Correlations
Discussion
The results found in this paper suggest that personality traits predict two importantfactors in people’s perceptions of the usefulness and intention to use virtual realityteams. VRTs amplify the saliency of subjects’ trust in other group members becausedispersed members are unable to monitor or control the behaviors of other members,a major component when assessing trust in others. People who have a propensity todistrust others find it difficult to operate within an environment where they must relyon others and when rewards are distributed in accordance with team, not individual,performance. Individuals who are generally anxious about using technology tocommunicate with others are unlikely to choose to work in VRTs where technology isa predominant component in accomplishing tasks with others. As such, additional andpotentially costly training is necessary to ensure comfort levels with technology areachieved with these individuals.
Findings from previous research that suggest positive relationships betweenextraversion and agreeableness with propensity to trust were confirmed by thisresearch and underscore the impact of these traits on an important antecedent to thequality of relationships between team members. In addition, these results suggest thatindividual contributors possessing attributes associated with conscientiousness maynot adapt as well to VRT environment and that organizational interventions designedto develop and grow trust among new VRT members would be beneficial. Jarvenpaa etal. (1998) argue that trust in VRTs can be increased by emphasizing and reinforcingresults orientation, rotating team leadership, and ensuring that task and goal/subgoalobjectives are clear. At the same time, trust may be enhanced and anxiety levels maybe lowered by enhancing self-esteem and self-confidence via on-demand availability ofhelp when requested and in-depth positive feedback that includes reference to specificelements of team member performance. Jarvenpaa et al. (1998) argue that certain teamprocess design features consistently associated with high-trust teams are the
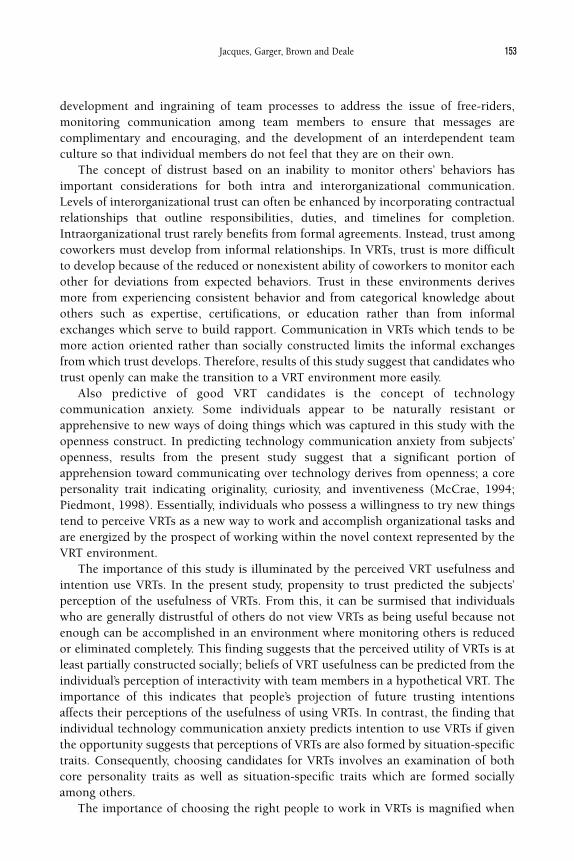
153Jacques, Garger, Brown and Deale
development and ingraining of team processes to address the issue of free-riders,monitoring communication among team members to ensure that messages arecomplimentary and encouraging, and the development of an interdependent teamculture so that individual members do not feel that they are on their own.
The concept of distrust based on an inability to monitor others’ behaviors hasimportant considerations for both intra and interorganizational communication.Levels of interorganizational trust can often be enhanced by incorporating contractualrelationships that outline responsibilities, duties, and timelines for completion.Intraorganizational trust rarely benefits from formal agreements. Instead, trust amongcoworkers must develop from informal relationships. In VRTs, trust is more difficultto develop because of the reduced or nonexistent ability of coworkers to monitor eachother for deviations from expected behaviors. Trust in these environments derivesmore from experiencing consistent behavior and from categorical knowledge aboutothers such as expertise, certifications, or education rather than from informalexchanges which serve to build rapport. Communication in VRTs which tends to bemore action oriented rather than socially constructed limits the informal exchangesfrom which trust develops. Therefore, results of this study suggest that candidates whotrust openly can make the transition to a VRT environment more easily.
Also predictive of good VRT candidates is the concept of technologycommunication anxiety. Some individuals appear to be naturally resistant orapprehensive to new ways of doing things which was captured in this study with theopenness construct. In predicting technology communication anxiety from subjects’openness, results from the present study suggest that a significant portion ofapprehension toward communicating over technology derives from openness; a corepersonality trait indicating originality, curiosity, and inventiveness (McCrae, 1994;Piedmont, 1998). Essentially, individuals who possess a willingness to try new thingstend to perceive VRTs as a new way to work and accomplish organizational tasks andare energized by the prospect of working within the novel context represented by theVRT environment.
The importance of this study is illuminated by the perceived VRT usefulness andintention use VRTs. In the present study, propensity to trust predicted the subjects’perception of the usefulness of VRTs. From this, it can be surmised that individualswho are generally distrustful of others do not view VRTs as being useful because notenough can be accomplished in an environment where monitoring others is reducedor eliminated completely. This finding suggests that the perceived utility of VRTs is atleast partially constructed socially; beliefs of VRT usefulness can be predicted from theindividual’s perception of interactivity with team members in a hypothetical VRT. Theimportance of this indicates that people’s projection of future trusting intentionsaffects their perceptions of the usefulness of using VRTs. In contrast, the finding thatindividual technology communication anxiety predicts intention to use VRTs if giventhe opportunity suggests that perceptions of VRTs are also formed by situation-specifictraits. Consequently, choosing candidates for VRTs involves an examination of bothcore personality traits as well as situation-specific traits which are formed sociallyamong others.
The importance of choosing the right people to work in VRTs is magnified when
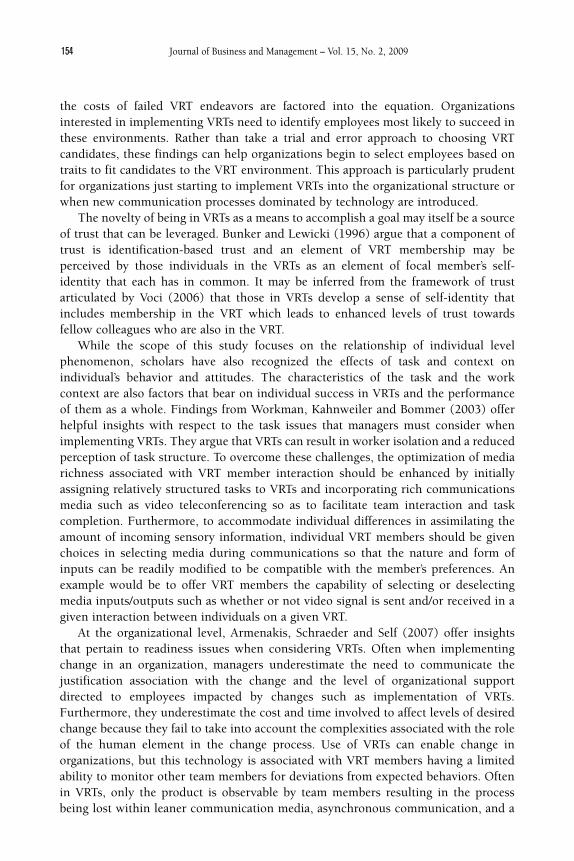
154 Journal of Business and Management – Vol. 15, No. 2, 2009
the costs of failed VRT endeavors are factored into the equation. Organizationsinterested in implementing VRTs need to identify employees most likely to succeed inthese environments. Rather than take a trial and error approach to choosing VRTcandidates, these findings can help organizations begin to select employees based ontraits to fit candidates to the VRT environment. This approach is particularly prudentfor organizations just starting to implement VRTs into the organizational structure orwhen new communication processes dominated by technology are introduced.
The novelty of being in VRTs as a means to accomplish a goal may itself be a sourceof trust that can be leveraged. Bunker and Lewicki (1996) argue that a component oftrust is identification-based trust and an element of VRT membership may beperceived by those individuals in the VRTs as an element of focal member’s self-identity that each has in common. It may be inferred from the framework of trustarticulated by Voci (2006) that those in VRTs develop a sense of self-identity thatincludes membership in the VRT which leads to enhanced levels of trust towardsfellow colleagues who are also in the VRT.
While the scope of this study focuses on the relationship of individual levelphenomenon, scholars have also recognized the effects of task and context onindividual’s behavior and attitudes. The characteristics of the task and the workcontext are also factors that bear on individual success in VRTs and the performanceof them as a whole. Findings from Workman, Kahnweiler and Bommer (2003) offerhelpful insights with respect to the task issues that managers must consider whenimplementing VRTs. They argue that VRTs can result in worker isolation and a reducedperception of task structure. To overcome these challenges, the optimization of mediarichness associated with VRT member interaction should be enhanced by initiallyassigning relatively structured tasks to VRTs and incorporating rich communicationsmedia such as video teleconferencing so as to facilitate team interaction and taskcompletion. Furthermore, to accommodate individual differences in assimilating theamount of incoming sensory information, individual VRT members should be givenchoices in selecting media during communications so that the nature and form ofinputs can be readily modified to be compatible with the member’s preferences. Anexample would be to offer VRT members the capability of selecting or deselectingmedia inputs/outputs such as whether or not video signal is sent and/or received in agiven interaction between individuals on a given VRT.
At the organizational level, Armenakis, Schraeder and Self (2007) offer insightsthat pertain to readiness issues when considering VRTs. Often when implementingchange in an organization, managers underestimate the need to communicate thejustification association with the change and the level of organizational supportdirected to employees impacted by changes such as implementation of VRTs.Furthermore, they underestimate the cost and time involved to affect levels of desiredchange because they fail to take into account the complexities associated with the roleof the human element in the change process. Use of VRTs can enable change inorganizations, but this technology is associated with VRT members having a limitedability to monitor other team members for deviations from expected behaviors. Oftenin VRTs, only the product is observable by team members resulting in the processbeing lost within leaner communication media, asynchronous communication, and a
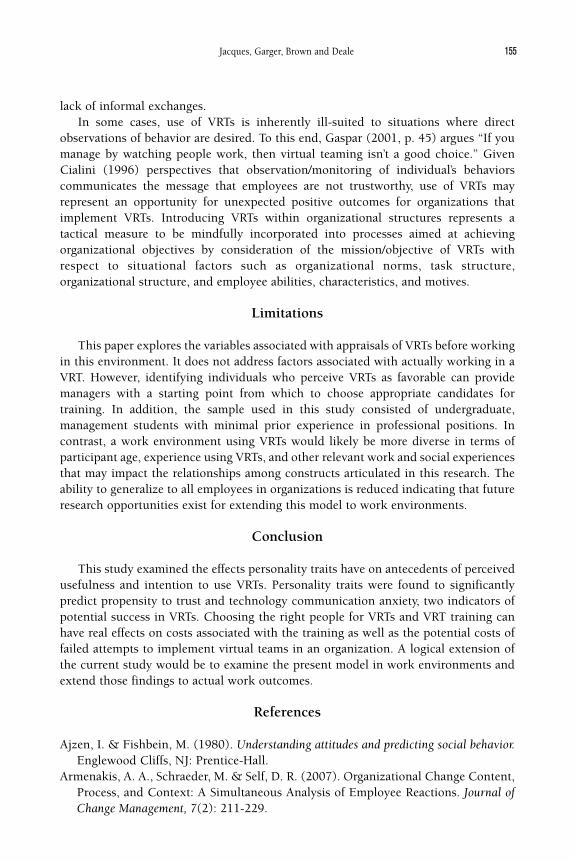
155Jacques, Garger, Brown and Deale
lack of informal exchanges. In some cases, use of VRTs is inherently ill-suited to situations where direct
observations of behavior are desired. To this end, Gaspar (2001, p. 45) argues “If youmanage by watching people work, then virtual teaming isn’t a good choice.” GivenCialini (1996) perspectives that observation/monitoring of individual’s behaviorscommunicates the message that employees are not trustworthy, use of VRTs mayrepresent an opportunity for unexpected positive outcomes for organizations thatimplement VRTs. Introducing VRTs within organizational structures represents atactical measure to be mindfully incorporated into processes aimed at achievingorganizational objectives by consideration of the mission/objective of VRTs withrespect to situational factors such as organizational norms, task structure,organizational structure, and employee abilities, characteristics, and motives.
Limitations
This paper explores the variables associated with appraisals of VRTs before workingin this environment. It does not address factors associated with actually working in aVRT. However, identifying individuals who perceive VRTs as favorable can providemanagers with a starting point from which to choose appropriate candidates fortraining. In addition, the sample used in this study consisted of undergraduate,management students with minimal prior experience in professional positions. Incontrast, a work environment using VRTs would likely be more diverse in terms ofparticipant age, experience using VRTs, and other relevant work and social experiencesthat may impact the relationships among constructs articulated in this research. Theability to generalize to all employees in organizations is reduced indicating that futureresearch opportunities exist for extending this model to work environments.
Conclusion
This study examined the effects personality traits have on antecedents of perceivedusefulness and intention to use VRTs. Personality traits were found to significantlypredict propensity to trust and technology communication anxiety, two indicators ofpotential success in VRTs. Choosing the right people for VRTs and VRT training canhave real effects on costs associated with the training as well as the potential costs offailed attempts to implement virtual teams in an organization. A logical extension ofthe current study would be to examine the present model in work environments andextend those findings to actual work outcomes.
References
Ajzen, I. & Fishbein, M. (1980). Understanding attitudes and predicting social behavior.Englewood Cliffs, NJ: Prentice-Hall.
Armenakis, A. A., Schraeder, M. & Self, D. R. (2007). Organizational Change Content,Process, and Context: A Simultaneous Analysis of Employee Reactions. Journal ofChange Management, 7(2): 211-229.
156 Journal of Business and Management – Vol. 15, No. 2, 2009
Barrick, M. R. & Mount, M. K. (1991). The big five personality dimensions and jobperformance: A meta-analysis. Personnel Psychology, 44(1): 1-26.
Barrick, M. R., Stewart, G. L., Neubert, M. J. & Mount, M. K. (1998). Relating memberability and personality to work-team processes and team effectiveness. Journal ofApplied Psychology, 83(3): 377-391.
Beckers, J. J., Schmidt, H. G. & Wicherts, J. M. (2007). Computer anxiety: “Trait” or“state”? Computer in Human Behavior, 23(6): 2851-2862.
Bunker, B. & Lewicki, R. J. (1996). Developing and maintaining trust in workrelationships. In Kramer, R. M. & Tyler, T. R. (Eds.), Trust in organizations: Frontiersof theory and research. Thousand Oaks, CA: Sage Publications.
Cialini, R. (1996). Social influence and the triple tumor structure of organizationaldishonesty. In Messick, D. M. & Tenbrunsel, A. E. (Eds.), Codes of Conduct:Behavioral Research into Business Ethics. New York: Russell Sage Foundation.
Conley, J. J. (1985). Longitudinal stability of personality traits: a multitrait-multimethod-multioccasion analysis. Journal of Personality and Social Psychology,49(5): 1266-1282.
Couch L. L. & Jones, W. H. (1997). Measuring levels of trust. Journal of Research inPersonality, 31: 319-336.
Customer Service University (Producer). (2006). Building the Virtual Team:Communication Across Cultural Boundaries. [Motion picture]. (Available fromhttp://www.customerserviceuniversity.com, 3104 Ushant Ct., Wellington, FL 33414)
Davis, F. D. (1989). Perceived usefulness, perceived ease of use, and user acceptanceof information technology. MIS Quarterly, 13(3): 319-339.
Davis, F. D., Bagozzi, R. P. & Warshaw, P. R. (1989). User acceptance of computertechnology: A comparison of two theoretical models. Management Science, 35(8):982-1003.
Davis, F. D. & Venkatesh, V. (2000). A theoretical extension of the technology acceptancemodel: Four longitudinal field studies. Management Science, 46(2): 186-204.
Ding, D. & Mowei, S. (2005). Relationships among personality traits, online socialsupport, and online interpersonal trust. Psychological Science (China), 28(2): 300-303.
Eysenck, H. J. & Eysenck M. W. (1985). Personality and individual differences: A naturalscience approach. New York: Plenum Press.
Fishbein, M. & Ajzen, I. (1975). Belief, attitude, intention, and behavior: An introductionto theory and research. Reading, MA: Addison-Wesley.
Gaspar, S. (2001). Virtual teams, real benefits. Network World, 18(39): 45.Gurtman, M. (1992). Trust, distrust, and interpersonal problems: A circumplex
analysis. Journal of Personality and Social Psychology, 62(6): 989-1002.Jarvenpaa, S. L., Knoll, K. & Leidner, D. E. (1998). Is anybody out there? Antecedents
of trust in global virtual teams. Journal of Management Information Systems, 14(4):29-64.
John, O. P. & Srivastava, S. (1999). The big five trait taxonomy: History, measurement,and theoretical perspectives. In Pervin, L. A. & John, O. P. (Eds.), Handbook ofPersonality: Theory and Research. New York: The Guilford Press.
Judge, T. A., Shaw, J. C., Jackson, C. L., Scott, B. A. & Rich, B. L. (2007). Self-efficacyand work-related performance: The role of individual differences. The Journal of
157Jacques, Garger, Brown and Deale
Applied Psychology, 92(1): 107-127.Lewis, D., Daley, T. M. & Shea, T. (2005). The effect of virtual team membership on
attitudes towards technology usage: A study of student attitudes in the UnitedStates. International Journal of Management, 22(1): 3-10.
Marcoulides, G. A. (1988). The relationship between computer anxiety and computerachievement. Journal of Educational Computing Research, 4(2): 151-158.
Marcoulides, G. A. (1989). Measuring computer anxiety: The Computer AnxietyScale. Educational and Psychological Measurement, 49(3): 733-739.
Marcoulides, G. A. (1991). Strategies for alleviating computer anxieties. In J. A.Morrell & M. Fleischer (Eds.), Advances in the implementation and impact ofcomputer systems. Greenwich, CT: JAI Press.
Matzler, K., Mooradian, T. & Renzl, B. (2006). Who Trusts? Personality, Trust andKnowledge Sharing. Management Learning, 37(4): 523-540.
Mayer, R. C., Davis, J. H. & Schoorman, F. D. (1995). An integrative model oforganizational trust. Academy of Management Review, 20(3): 709–734.
McCrae, R. R. (1994). Openness to experience: expanding the boundaries of factor V.European Journal of Personality, 8(4): 251-272.
Motowidlo, S. J., Hooper, A. C. & Jackson, H. L. (2006). Implicit policies aboutrelations between personality traits and behavioral effectiveness in situationaljudgment items. The Journal of Applied Psychology, 91(4): 749-761.
Parham, I. A. & Schaie, K. W. (1976). Stability of adult personality traits: fact or fable?Journal of Personality and Social Psychology, 34(1): 146-158.
Parkins, I. S., Fishbein, H. D. & Ritchey, P. N. (2006). The influence of personality on workplace bullying and discrimination. The Journal of Applied Social Psychology,36(10): 2554-2577.
Perrewe, P. L. & Thatcher, J. B. (2002). An empirical examination of individual traitsas antecedents to computer anxiety and computer self-efficacy. MIS Quarterly,26(4): 381-396.
Piedmont, R. L. (1998). The revised NEO personality inventory: Clinical and researchapplications. New York: Plenum Press.
Sutherland, P. & Tan, F. B. (2004). The nature of consumer trust in B2C electroniccommerce: A multi-dimensional conceptualization. Proceedings of the InternationalConference of the Information Resources Management Association: InnovationsThrough Information Technology: 611-614.
Voci, A. (2006). The link between identification and in-group favouritism: effects ofthreat to social identity and trust-related emotions. British Journal of SocialPsychology, 45(2): 265-284.
Workman, M., Kahnweiler, W. & Bommer, W. (2003). The effects of cognitive styleand media richness on commitment to telework and virtual teams. Journal ofVocational Behavior, 63(2): 199-219.

158 Journal of Business and Management – Vol. 15, No. 2, 2009
Bank Selection Criteria of RetailCustomers in Bangladesh: A Study on Khulna City
ATM Jahiruddin
Khulna University
Rumana Haque
Khulna University
Bangladesh is a Southeast Asian developing country that has beenexperiencing a constant GDP growth of over 5% for the last decade. Thisgrowing trend in the economy can largely be attributed to the massive growthin the private sector, among whose banking industry has been the largest.With the mushrooming growth for the last 15 years, the banking industryhas turned out to be one of the most competitive service industries inBangladesh today. In order to attract the target customers and competesuccessfully, it is imperative that banks are aware of the factors customersconsider important in selecting a bank. This study was carried out with thegoal of evaluating the general pattern of preference for different kinds ofbanks by different types of customers and to identify the relative importanceof different factors to the bank customers in selecting their banks. The studywas carried out with a group of 198 bank customers in Khulna, the thirdlargest city in Bangladesh. It was a single cross-sectional study where datawere collected directly from the respondents with the help of a structuredquestionnaire. The study reveals significant differences among the customersof different genders, education levels, and income levels with respect to theirpreference for different types of banks operating in Bangladesh. The studyalso reveals that bank customers in Bangladesh places highest emphasis ondifferent factors related to their convenience in availing required bankingservices in selecting their banks. Other factors customers consider importantare economic, promotional, and influence factors.”
159Jahiruddin and Haque
The balanced economic development of any country depends largely on thedevelopment of its financial institutions, as they provide much needed funds forestablishing and operating the business organizations. After the liberation ofBangladesh in 1971, there were only four commercial banks in the country under stateownership. The banking industry in Bangladesh began to flourish from the early 1980sas the government opened up different sectors for private investment. The banking hasexperienced mushrooming growth in last decade and at present, the number ofscheduled banks in Bangladesh is 49; including 4 public sector commercial banks, 28national private commercial banks, 12 foreign banks and 5 Development FinancialInstitutions (DFIs) (Bangladesh Bank, 2006). In general, banks in Bangladesh segmenttheir customers into two major categories: 1) corporate (business) customers and 2)retail customers (consumers). These two groups of customers are usually served bythe corporate and retail divisions of the bank.
As the competition intensified in the banking industry and an emphasis on greatercustomer empowerment has increased in the society overall, the nature of operationscarried out and the versatility of services provided by the banks in Bangladesh has alsochanged significantly in order to attract and retain customers. Banks are nowproviding a wide range of services and investing a large amount of money inpromotional activities, something that was beyond imagination two decades ago.Third generation banks in Bangladesh have come up with latest computer technologysuch as online banking and ATM services in order to render more efficiency for thecustomers. To make all these efforts successful in attracting target customers andoperate in this competitive market successfully, it is imperative that banks be aware ofthe factors that their customers consider important when selecting a bank.
Hardly any research effort has been exerted in Bangladesh on this issue so far.Therefore, the aim of our research is to evaluate the pattern of choice of different kindsof banks with the different demographic groups of customers, to identify the factorsbank customers consider when selecting a bank, and the relative importance theyplace on these factors.
Literature Review
Most of the recent studies on measurement of quality and customers’ satisfaction inthe service industry used the SERVQUAL model (Buttle, 1996; Robinson, 1999). TheSERVQUAL model is comprised of 22 statements that are used to measure service qualityacross 5 major dimensions such as Tangibility (the ability to deliver service dependablyand accurately), Reliability (willingness to help customers and deliver prompt service),Responsiveness (physical facilities, equipments and appearance), Assurance (employees’ability to convey trust and confidence and their knowledge and courtesy) and Empathy(level of caring and individual attention to customers). Most studies that used thismodel, used these 22 statements as is, and modified them in order to match them withthe context of the study. Jabnoun and Al-Tamimi (2003) used the SERVQUAL model inorder to measure the service quality of the commercial banks in UAE and found that the22 parameters he used for measuring service quality of the banks are grouped under 5dimensions of the SERVQUAL model in the following way:
160 Journal of Business and Management – Vol. 15, No. 2, 2009
Tangibility: The bank looks attractive from the outside. The bank has modern equipmentand technology, nice interior decoration and comfort, and well-dressed employees.
Reliability: Bank statements are issued regularly. Employees are readily available forservice and are present at the information desk.
Responsiveness: Employees have a helpful attitude, promptly answer telephone calls,have prompt delivery services, and encouraging responses to mail requests.
Assurance: Employees are polite and courteous. There is regular communicationcarried out by the bank. Employees answer queries, are efficient in service delivery,and they provide up-to-date information.
Empathy: Customers are given individual attention and easy access to services. Thereis a short queue line for the ATM and the ATM is easily accessible. The bank haslong and convenient operating hours.
As mentioned earlier, hardly any research has been carried out on the bank selectioncriteria used in Bangladesh. However, literature has revealed that the bank selectioncriteria used by different categories of customers in some other parts of the world havebeen extensively researched. Though not all the studies on bank selection critieria usethe SERVQUAL model, most of the factors used are similar. In fact most of the factorsthese studies used are similar to those used by Jabnoun and Al-Tamimi (2003).
Kaufman (1967) carried out a study on the factors used in selecting banks by bothbusiness customers and retail (household) customers in the US. The factor that retailbank customers identified as the most important when selecting their banks was aconvenient location (Mason & Mayer, 1974). Other important factors they identifiedwere the length of bank-customers relationships, the quality of services offered by thebank, friendly staff, a pleasant loan experience, and the advice of friends and influenceof relatives. In the study carried out by Boyd, Leonard and White (1994) on theselection criteria of financial institutions in the US, the five most important criteriaidentified were: reputation, interest on savings accounts, interest (price) charged onloans, fast service, and different locations throughout the city.
Kaynak and Harcar (2004) found a clear difference among bank customers in theUS with respect to their preference for local banks versus national banks. The resultsindicated that national bank customers placed greater importance on factors like abank’s service charges, their overall confidence in the bank, low interest rates on loans,billing, and higher interest payments with savings accounts. On the other hand, factorsthat were emphasized by the customers of local banks were: fast and efficient service,available parking spaces, the external appearance of the bank, mass media advertisingand the interior comfort of the bank itself. Studies (Gupta & Torkzadeh, 1988;Laroche, Rosenblatt & Manaing, 1986) on the bank customers in Canada showed thatcustomers valued many of the same bank characteristics as customers in the US.Canadian customers looked for careful management of the accounts, rate of interestpaid, the politeness and friendliness of staff, procedures for transactions, houses ofoperation, wait times inside the bank, and the convenience of the location.
A number of studies on this issue were also carried out in different Europeancountries. Zineldin (1996) completed a study on bank customers in Sweden. Hisfindings revealed that the most important criteria used by the consumers in selecting
161Jahiruddin and Haque

their banks were service quality and the bank’s delivery system. Promotional activities,reputation and differentiation were among other factors that the bank customers ofSweden considered. A study by Holstius and Kaynak (1995) indicated that the factorsthat determined a customer’s preference in selecting a bank in Finland included theirpersonal reception at the bank, how efficient the bank’s service was, the cost of servicecharges, the friendliness of bank employees, and the customer’s perceived confidentiality.Kennington, Hill and Rakouska (1999) also carried out a study on bank selection criteriain Poland during the country’s transitionionary phase from a socialist economy to anopen-market economy. They identified that bank customers in Poland consideredreputation (a composite of factors like safety, security and trust), rates, service andconvenience important when choosing a bank. The term “service” included features likefriendliness, politeness, and courtesy. “Rate” referred more specifically to the operatingcharges for accounts, the cost of different services and the proximity of the bank to acustomer’s home or work, the bank’s hours and the number of branches a bank had.
A number of studies were carried out on the bank selection criteria in the MiddleEast. Almossawi (2001) researched college students in Bahrain and found what theyidentified as the five most important factors and the five least important factors for bankselection. The five most important factors were: convenient ATM locations, the locationavailability of ATMs, the bank’s reputation, 24 hour availability of ATM services, and theavailability of parking. The five least important factors to the college students in thisarea were: the recommendation of friends, the recommendation of relatives, being ableto bank by mail, and the reception received at the bank. A study among the customersof both conventional and Islamic banks in Jordan (Erol, Kaynak & EI-B dour, 1990)suggested that the factors customers emphasized most in bank selection were fast andefficient service, a bank’s reputation, the friendliness of bank personnel and the bank’sconfidentiality policies. Another study (Haron, Ahmed & Planisek, 1994) on bankcustomers of various religious groups in Malaysia indicated that customers consideredthe same factors as those in Jordan did in the bank selection process.
Table 1: Factors customers consider in selecting bank and their relative importance in different parts of the world
162 Journal of Business and Management – Vol. 15, No. 2, 2009
As demonstrated by the above discussions, the factors bank customers consideredwhen selecting their banks and the degree of importance they place on them variesbased on the economic, social and cultural set up in different countries. Taking thesedifferences into consideration, the following table was constructed to show the differentfactors that bank customers in different parts of the world consider in selecting a bank,as well as the varying degree of importance they place on these factors.
From Table 1, it is evident that though most factors are commonly used by bankcustomers in different countries for selecting their banks, the emphasis on differentfactors largely varies among the customers of different parts of the world. As mentionedearlier, though the banking industry has been growing as an industry for the last twodecades, the existing literature lacks comprehensive studies on the bank selectioncriteria used by bank customers in Bangladesh. In this context, this study attempts toinvestigate the factors bank customers in Bangladesh consider when selecting theirbanks and the relative importance they place on these factors in doing so.
Objective of the Study
The overall objective of this study is to evaluate the general pattern of preferencefor different kinds of banks by different types of customers, as well as identify therelative importance that the bank customers place on different factors in choosingtheir bank. The following are the specific objectives of the study:
1. Evaluate whether there is a difference in the use of different kinds of banksamong the customers of different gender, age, income, and level of education.
2. Determine the relative importance placed by the bank customers on differentbank factors in selecting a bank.
3. Group the wide range of factors under a few broad categories on the basis of theirhomogeneity and based on a customer’s preference.
Methodology
Selection of VariablesThe primary base of the selection of variables was the extensive review of relevant
literature. As mentioned earlier, the existing literatures described the bank selection ina completely different context from that in Bangladesh. Therefore, three differentrounds of focus group interviews were carried out in order to get a tentative idea aboutthe bank selection criteria of the customers in Bangladesh. One focus group consistedof 6 branch managers of different banks in Khulna, while the other 2 groups consistedof customers of different private and government banks in Khulna city. From the inputof literature review and the focus group interview, 26 variables were selected and usedin the pilot survey on 30 bank customers. After the pilot survey, 18 variables (Table 3)were finally selected for the study.
163Jahiruddin and Haque
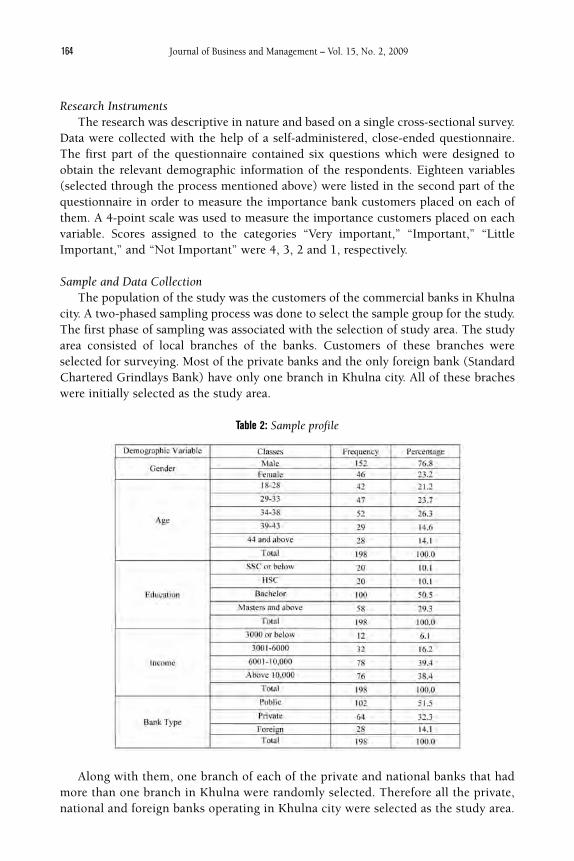
Research InstrumentsThe research was descriptive in nature and based on a single cross-sectional survey.
Data were collected with the help of a self-administered, close-ended questionnaire.The first part of the questionnaire contained six questions which were designed toobtain the relevant demographic information of the respondents. Eighteen variables(selected through the process mentioned above) were listed in the second part of thequestionnaire in order to measure the importance bank customers placed on each ofthem. A 4-point scale was used to measure the importance customers placed on eachvariable. Scores assigned to the categories “Very important,” “Important,” “LittleImportant,” and “Not Important” were 4, 3, 2 and 1, respectively.
Sample and Data CollectionThe population of the study was the customers of the commercial banks in Khulna
city. A two-phased sampling process was done to select the sample group for the study.The first phase of sampling was associated with the selection of study area. The studyarea consisted of local branches of the banks. Customers of these branches wereselected for surveying. Most of the private banks and the only foreign bank (StandardChartered Grindlays Bank) have only one branch in Khulna city. All of these bracheswere initially selected as the study area.
Table 2: Sample profile
Along with them, one branch of each of the private and national banks that hadmore than one branch in Khulna were randomly selected. Therefore all the private,national and foreign banks operating in Khulna city were selected as the study area.
164 Journal of Business and Management – Vol. 15, No. 2, 2009

The second stage of sampling was associated with the selection of the sample of bankcustomers. Selected branches were visited first and questionnaires were distributedamong the customers present in the banks during the visit. The number ofquestionnaires distributed among the customers was 464. Among the questionnairesthe researcher received, 230 were sent back through personal visit, postal mailand/or fax. Thirty-two of the returned questionnaires were also eliminated in thescreening process, which resulted in a sample size of 198 and a response rate of42.67%. The following tables show the profile of the sample according to differentdemographic characteristics.
Data Analysis TechniquesBoth descriptive and inferential statistical techniques were used to analyze the data.
Descriptive statistics such as mean, standard deviation and ranking were used topresent summary statistics of the study variables. Among the Inferential statistics, achi-square test was used for comparison and drawing other inference about thevariables. All the tests were made with a 95% confidence level.
The reliability coefficient (Cronbach's Alpha) of the obtained data on the bankselection variables was 0.8594, which indicates a high reliability of the data(Nunnally, 1978).
Results and Discussion
The first part of this section discussed the preference level for public, nationalprivate, and foreign banks among people with different demographic features. Thesecond part focused on the relative importance customers place on the 18 variablesselected for the study. In the last part of the analysis, the 18 variables were categorizedand placed under four generic classes based on their homogeneity. This alsohighlighted the relative importance bank customers placed on the different variablesconsisting of homogenous factors.
Choice of Bank by Different Demographic GroupsAs mentioned before, respondents were categorized according to 4 different
demographic characteristics: Gender, Age, Income, and Education. Table 3 shows theusage pattern of different types of banks by the people in these different demographics.
Table 3 shows that a public bank was preferred by females more than males, whilemale customers tended to choose the private and foreign banks more than the femalecustomers. Chi-square and the significance level show that this difference is significant.
The bank type referenced by the customers of different age groups is more or lesssimilar. A public bank is preferred the most by the customers of all five age groups.With the exception of the customers from age 39 to 44, the second preference of allthe age groups was the national private banks. Customers aged 39 to 44 also preferredforeign banks more than the private banks. As shown by the chi-square value and thesignificance level, there was no significant difference among the customers of differentage groups regarding their choice of bank type. This was shown the most significantlyin a customer’s bank preference from the view point of their educational background.
165Jahiruddin and Haque
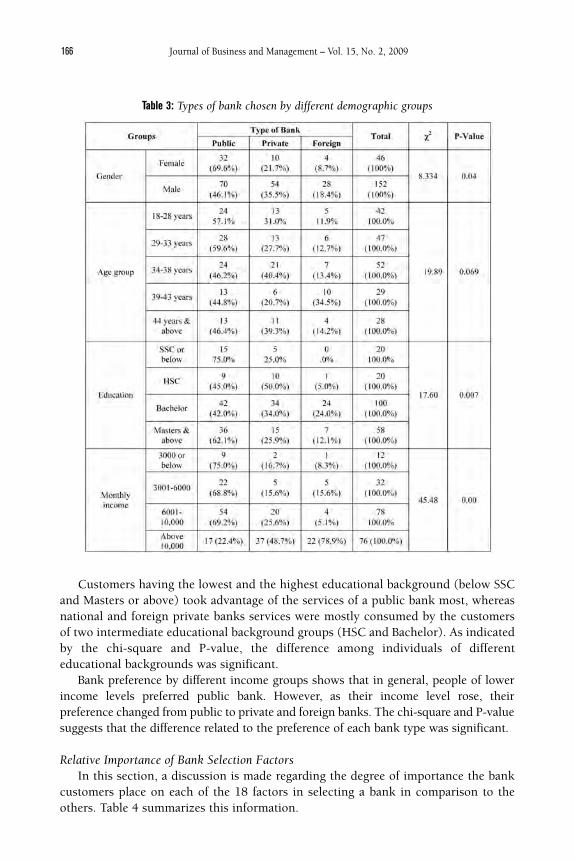
Table 3: Types of bank chosen by different demographic groups
Customers having the lowest and the highest educational background (below SSCand Masters or above) took advantage of the services of a public bank most, whereasnational and foreign private banks services were mostly consumed by the customersof two intermediate educational background groups (HSC and Bachelor). As indicatedby the chi-square and P-value, the difference among individuals of differenteducational backgrounds was significant.
Bank preference by different income groups shows that in general, people of lowerincome levels preferred public bank. However, as their income level rose, theirpreference changed from public to private and foreign banks. The chi-square and P-valuesuggests that the difference related to the preference of each bank type was significant.
Relative Importance of Bank Selection FactorsIn this section, a discussion is made regarding the degree of importance the bank
customers place on each of the 18 factors in selecting a bank in comparison to theothers. Table 4 summarizes this information.
166 Journal of Business and Management – Vol. 15, No. 2, 2009
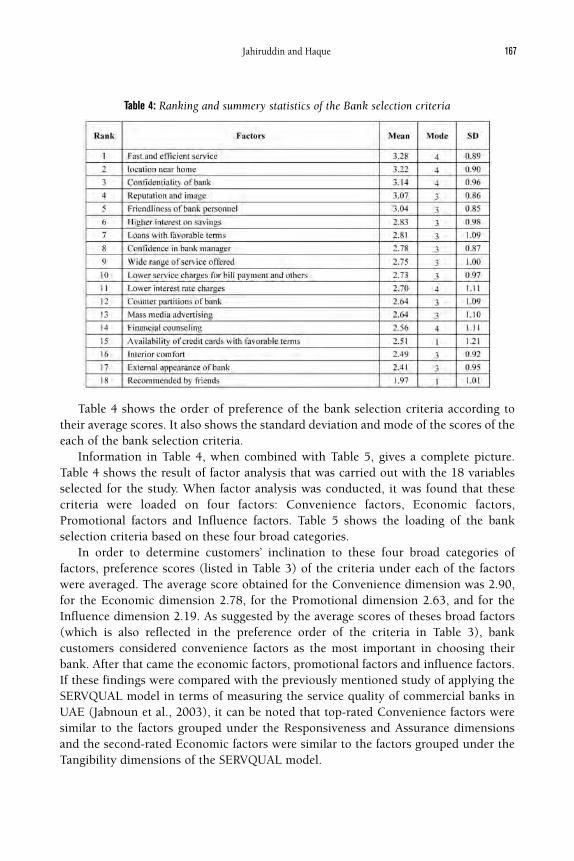
Table 4: Ranking and summery statistics of the Bank selection criteria
Table 4 shows the order of preference of the bank selection criteria according totheir average scores. It also shows the standard deviation and mode of the scores of theeach of the bank selection criteria.
Information in Table 4, when combined with Table 5, gives a complete picture.Table 4 shows the result of factor analysis that was carried out with the 18 variablesselected for the study. When factor analysis was conducted, it was found that thesecriteria were loaded on four factors: Convenience factors, Economic factors,Promotional factors and Influence factors. Table 5 shows the loading of the bankselection criteria based on these four broad categories.
In order to determine customers’ inclination to these four broad categories offactors, preference scores (listed in Table 3) of the criteria under each of the factorswere averaged. The average score obtained for the Convenience dimension was 2.90,for the Economic dimension 2.78, for the Promotional dimension 2.63, and for theInfluence dimension 2.19. As suggested by the average scores of theses broad factors(which is also reflected in the preference order of the criteria in Table 3), bankcustomers considered convenience factors as the most important in choosing theirbank. After that came the economic factors, promotional factors and influence factors.If these findings were compared with the previously mentioned study of applying theSERVQUAL model in terms of measuring the service quality of commercial banks inUAE (Jabnoun et al., 2003), it can be noted that top-rated Convenience factors weresimilar to the factors grouped under the Responsiveness and Assurance dimensionsand the second-rated Economic factors were similar to the factors grouped under theTangibility dimensions of the SERVQUAL model.
167Jahiruddin and Haque
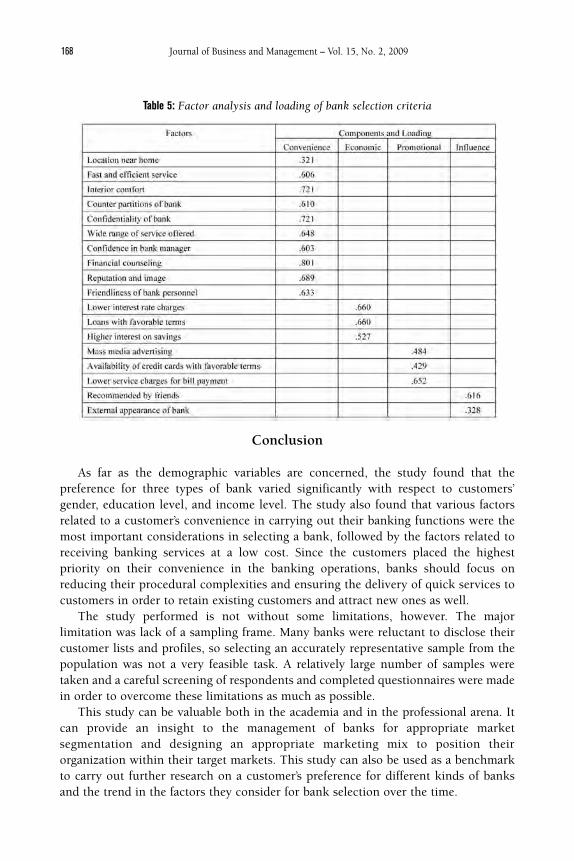
Table 5: Factor analysis and loading of bank selection criteria
Conclusion
As far as the demographic variables are concerned, the study found that thepreference for three types of bank varied significantly with respect to customers’gender, education level, and income level. The study also found that various factorsrelated to a customer’s convenience in carrying out their banking functions were themost important considerations in selecting a bank, followed by the factors related toreceiving banking services at a low cost. Since the customers placed the highestpriority on their convenience in the banking operations, banks should focus onreducing their procedural complexities and ensuring the delivery of quick services tocustomers in order to retain existing customers and attract new ones as well.
The study performed is not without some limitations, however. The majorlimitation was lack of a sampling frame. Many banks were reluctant to disclose theircustomer lists and profiles, so selecting an accurately representative sample from thepopulation was not a very feasible task. A relatively large number of samples weretaken and a careful screening of respondents and completed questionnaires were madein order to overcome these limitations as much as possible.
This study can be valuable both in the academia and in the professional arena. Itcan provide an insight to the management of banks for appropriate marketsegmentation and designing an appropriate marketing mix to position theirorganization within their target markets. This study can also be used as a benchmarkto carry out further research on a customer’s preference for different kinds of banksand the trend in the factors they consider for bank selection over the time.
168 Journal of Business and Management – Vol. 15, No. 2, 2009
References
Almossawi, M. (2001). Bank selection criteria employed by college students inBahrain: an empirical analysis. International Journal of Bank Marketing, 19 (3): 115-125.
Bangladesh Bank (2006). Bangladesh Bank, Central Bank of Bangladesh [Online].Available: http://www.bangladeshbank.org.
Boyd, W.L., Leonard, M. & White, C. (1994). Customer preferences for financialservices: an analysis. International Journal of Bank Marketing, 12(1): 9-15.
Buttle, F. (1996). SERVQUAL: review, critique, research agenda. European Journal ofMarketing, 30(1): 8-32.
Cronbach, L.J. (1951). Coefficient Alpha and the internal structure of tests.Psychometrika, 16: 297-334
Erol, C., Kaynak, E. & EI-B dour, R. (1990). Conventional and Islamic banks:patronage behavior of Jordanian Customers. International Journal of BankMarketing, 8(4): 25-35.
Gupta, Y. & Torkzadeh, G. (1988). Redesigning bank service: systems for effectivemarketing. Long Range Planning, 21(6).
Haron, S., Ahmed, N. & Planisek, S. (1994). Bank patronage factors of Muslims andnon- Muslims customers. International Journal of Bank Marketing, 12(1): 32-40.
Holstius, K. & Kaynak, E. (1995). Retail banking in Nordic countries: the case ofFinland. International Journal of Bank Marketing, 13(8): 10-20.
Jabnoun, N. & Al-Tamimi, H.A.H. (2003). Measuring perceived service quality at UAEcommercial banks. The International Journal of Quality & Reliability Management,20(4/5): 458-472.
Kaufman, G.G. (1967). A Survey of business Firms and Households View of a CommercialBank, Report to the Federal Reserve Bank of Chicago.
Kaynak, E. & Harcar, D. (2004). American consumers attitudes towards commercialbanks: A comparison of local and national bank customers by use ofgeodemographic segmentation. International Journal of Bank Marketing, 23(1):73-89.
Kennington, C., Hill, J. & Rakowska, A. (1996). Consumer selection criteria for banksin Poland. The International Journal of Bank Marketing, 14 (4): 11-22.
Laroche, M., Rosenblatt, J.A. & Manaing, T. (1986). Services used and factorsconsidered important in selecting a bank: an investigation across diversedemographic segments. International Journal of Bank Marketing, 4(1): 35-55.
Mason, J.B. & Mayer, M.L. (1974). Differences between high and low income savingsand checking account customers. The Magazine of Bank Administration, 65 (June):48-52.
Nunnally, J. C. (1978). Psychometric theory (2nd ed). New York: McGraw-HillRobinson, S. (1999). Measuring service quality: current thinking and future
requirements. Marketing intelligence and planning, 32(1): 21-32.Zineldin, M. (1996). Bank strategic positioning and some determinants of bank
selection. International Journal of Bank Marketing, 14(6): 12-22.
169Jahiruddin and Haque

170 Journal of Business and Management – Vol. 15, No. 2, 2009

Impact of Firm Performance onChanges in Strategic Resource
Allocation Decisions
Hao Ma
University of Illinois – Springfield
China Center for Economic Research – Peking University
Ranjan Karri
University of Illinois – Springfield
We tested the effect of prior firm performance on changes in strategic resourceallocation decisions under the environmental conditions of an economicrecession. Results from a study of commercial banks suggest that the effect offirm performance on changes in resource allocation in response toenvironmental change is curvilinear and nonmonotonic. Firms with middle-level performance, however, tend to respond to changes in the environmentwith changes in strategic resource allocations, while both poor-performingfirms and high performing firms demonstrate little such changes in responseto environmental change.
When, why, and how firms initiate and implement strategic changes needs to beunderstood more clearly in the field of strategic management (Rajagopalan &Spreitzer, 1996). Although previous studies have contributed to our knowledge of thephenomenon of strategic change in different contexts (e.g., Boeker, 1989, 1997;Chandler, 1962; Gersick, 1991; Ginsberg, 1988; Kraatz & Zajac, 2001), at least twoimportant questions remain unresolved.
First, are there systematic patterns of change that firms undertake in adapting tochanges in macroeconomic conditions? Prior studies examined firms’ responses toenvironmental shocks (Meyer, 1982) and environmental transformations (Grimm &Smith, 1991; Haveman, 1992; Smith & Grimm, 1987). However, how firms respond tomacroeconomic conditions remains poorly understood. Specifically, given that resource
171Ma and Karri

allocation is one of the most important strategic decisions (Hofer & Schendel, 1978),how do firms change their strategic resource allocation decisions in response to changesin macroeconomic conditions?
Second, what is the effect of a firm’s prior performance on organizational change? Onthe one hand, firms with performance below the historical norms are more likely to takerisks and make changes (Greve, 1998). This view suggests that firms maintain their statusquo until faced with failure. Poor performance is likely to trigger corrective actions suchas organizational change (Cyert & March, 1963; Pfeffer & Salancik, 1978). On the otherhand, poorly performing firms may avoid changes due to a shortage of resources(Cameron & Whetton, 1987) or pessimistic perceptions (Staw, Sandelands & Dutton,1981). Given the equivocal conclusions about the influence of performance onorganizational change, a logical question to ask would be “is the effect of performance onorganizational change linear?” Several studies examined the impact of strategic changeon firm performance when faced with a change in a macroenvironmental condition suchas deregulation (Haveman, 1992; Kim & McIntosh, 1999). However, the influence of afirm’s performance on strategic change did not receive much empirical attention.
The macroeconomic condition discussed in this particular study is economicrecession. In general, such macroeconomic conditions are likely to place a systematicnegative effect on the performance levels of firms. Our empirical context is thecommercial banking sector in the states of Kansas, Nebraska and Oklahoma that wereaffected severely by recession. The banks in these states were relatively free from anyconfounding effects of other macroenvironmental factors in the banking industry suchas currency markets and derivatives markets. The purpose of our study is to observehow firms react to such environmental stimuli. More specifically, this paper addressestwo questions:
1) During a period when the economy moves from growth into recession, do firmsadapt to the economic conditions by making changes in strategic resourceallocation decisions?
2) How does firm performance affect changes in strategic resource allocationdecisions under economic recession? Is the performance effect linear?
We integrate theoretical perspectives of strategic choice (Child, 1972; Hrebiniak &Joyce, 1985), organizational inertia, and threat rigidity (Freeman & Hannan, 1984;Staw et al., 1981) to study the effects of firm performance on firm level strategicresource allocation decisions in response to change in macroeconomic conditions.
Theoretical Background and Hypotheses
Strategic Choice, Inertia, Threat-rigidity and Changes in Strategic Resource AllocationDecisions
Whether organizations undertake changes and adapt to changes in theirenvironments has long been a focal concern for researchers in various fields such asstrategy (Ginsberg, 1988; Rajagopalan & Spreitzer, 1996), organization theory (Astely
172 Journal of Business and Management – Vol. 15, No. 2, 2009
& Van de Ven, 1983; Haveman, 1992), and sociology (Freeman & Hannan, 1984). Acentral debate around the question is adaptation vs. inertia or strategic choice vs.determinism (Hrebiniak & Joyce, 1985).
The strategic choice perspective (Andrews, 1971; Child, 1972) argues thatorganizations (or general managers) purposefully adapt to environmental changes andthat strategic choice is the primary link between organizations and their environments(Miles & Snow, 1978). In particular, Andrews (1971) suggests that organizationsmaintain an organization-environment fit to achieve superior performance. Accordingto the strategic choice perspective, these firms should undertake strategic change inresponse to environmental changes in order to achieve better organization-environment fit and superior performance.
The other side of the debate, the perspective on inertia or determinism (Freeman& Hannan, 1984), argues that previous success may lead to organizational forces forstability and inertia. These forces act to guard the status quo and resist organizationalchanges. Another school of thought within the inertia perspective argues that poorperformance can also lead to inertia and hamper organizational changes (Staw et al.,1981). The inertia perspective emphasizes the organizational forces that hinderorganizational adaptability and focuses on the role of organization specific attributes,such as firm history and previous or current organizational performance (Boeker,1989; Cameron & Whetton, 1987; Dutton & Duncan, 1987).
Economic recession, an environmental condition which poses challenges to almostevery firm, represents an interesting setting for investigating the power of the strategicchoice and inertia perspectives in explaining strategic change. Because economicrecession is a systematic environmental phenomenon, the threat rigidity-inertia (Stawet al., 1981) and success-inertia (Freeman & Hannan, 1984) arguments that are largelyspecific to a firm's own history, may not be a good explanation of a typical firm'sstrategic change under recession. Rather, as the macroeconomic environment movesfrom growth into recession, it is relatively evident to every firm that a strategic changemay be necessary. According to the strategic choice perspective, firms adapt theirresource allocations and deployment to match the economic reality of recession. Weexpect a systematic trend of firms changing their resource allocation decisions inresponse to economic recession. Therefore, we hypothesize:
H1: Firms undertake changes in strategic resource allocation decisions in response toeconomic recession.
Given the general tendency of firms undertaking organizational changes inresponse to the economic recession, do all firms respond to the recession in the sameway? As suggested by the literature, especially by the inertia perspective (Staw et al.,1981; Freeman & Hannan, 1984), firm performance is an important determinant ofthe organizational changes of individual firms. Similarly, although not directly citingperformance, Kraatz and Zajac (2001) demonstrated that a firm’s excess resourcescould help buffer its technical core from environmental changes and reduce thetendency for change. It will be theoretically interesting and practically relevant tountangle the linkage between firm performance and its changes in strategic decisions
173Ma and Karri
under changing economic conditions.
Firm Performance and Changes in Strategic Resource Allocation DecisionsLiterature concerning the performance effects on strategic change remains
controversial (Boeker & Goodstein, 1991). Cyert and March (1963) argued that adecline in performance led to corrective managerial actions. Following this argument,when poor performance signals a mismatch between an organization and itsenvironmental conditions, organizational changes should take place. Previous studieson executive succession have shown that poor performance leads to organizationalchanges (Boeker & Goodstein, 1991; Salancik & Pfeffer, 1980). Other researchersfound that poor performance was related to changes in business level strategies(Boeker, 1989; Zajac & Kraatz, 1993). This suggests a negative correlation betweenfirm performance and its strategic change. Such a negative correlation is consistentwith the prediction of the strategic choice perspective. Under an economic recession,poorly performing firms should have an added incentive to engage in strategic actionsin order to achieve a better fit with the environment.
In contrast, other researchers argue that the implementation of organizationalchanges is not cost-free, and strategic actions are often characterized by irreversiblecommitment of resources (Caves, 1984). Organizations need a certain level ofresources to initiate and implement changes, even though growth reinforcesorganizations to continue operations with relatively few changes (Hedberg, 1981).Conceptual work (Dutton & Duncan, 1987) and empirical studies (Cameron &Whetton, 1987) indicate that poorly performing organizations often lack the resourcesto implement changes, and they even resist change because of pessimistic perceptionsof the situations when facing resource shortages.
Given the above conflicting arguments, an interesting question arises as to howpoor the performance should be for a firm in order to resist change or undertakechange. In other words, is the performance-strategic change relationship linear?Indeed, those who argue that poor performance leads to organizational changes,discuss the poor performance effects in comparison to the effects of satisfactory and/orgood performance. Those who argue that poor performance can hinder organizationalchanges focus their attention more on extremely poor performers, such as firms whosesituations were so discouraging that the managerial perception might have regardedthe situation beyond repair. In either case, those researchers implicitly assumed alinear relationship between performance and organizational change, and focused theirtheorization on different levels but not on the whole range of firm performance.
One exception is a study that found a curvilinear relationship between pastperformance and changes in corporate aggressiveness, as measured by the change inthe firm’s emphasis on product and market development and change in the firm’s riskposture (Fombrun & Ginsberg, 1990). Low performers and high performers are lesslikely to change than firms with intermediate levels of performance. Another recentstudy found that firms in the personal computer manufacturing industry, with largedeviations in performance from the norm, are most likely to adopt a new technologicalpath. This usually occurs following a change in the technological environment withthe advent of open-standard architecture that occurred in 1981 (Hendron, Bednar &
174 Journal of Business and Management – Vol. 15, No. 2, 2009
Henderson, 2005). To reconcile the conflicting arguments, we propose a nonlinearrelationship between firm performance and strategic change through the wholespectrum of performance level. Therefore, we hypothesize:
H2a: The relationship between firm performance and changes in strategic resourceallocation decisions is curvilinear.
We argue for a threshold level of performance, below which firms lack the minimalresources to initiate and implement changes. The further the performance runs belowthis threshold level, the more severe the lack of resources for change will be. Therefore,for firms below this level, we expect a positive association between performance andstrategic change. That is, the worse a firm’s performance is, the less likely it will beable to undertake the necessary changes.
Above that threshold level, even if the performance is poor, a firm may still havethe resources to initiate and implement organizational changes. Poor performancedrives firms into a problem-motivated search (March & Simon, 1958) and realignmentof a firm with its environment, providing the necessary pressure for change. Highperformers either find their initial resource allocation to be in line with the changedenvironment, or find the performance level satisfactory enough to resist any change.The latter can happen even when general managers (Pettigrew, 1973) have detectedthe mismatch between an organization and its environment. Above the threshold level,we expect a negative relationship between performance and changes in strategicresource allocation decisions. Therefore, we hypothesize:
H2b: There exists a threshold level of firm performance: 1) Below which the relationship between firm performance and changes instrategic resource allocation decisions is positive, and 2) Above which the relationship between firm performance and changes instrategic resource allocation decisions is negative.
Method
The Empirical Setting The commercial banking industry is the empirical setting for theory testing in this
study. First, this industry bears the responsibility of generating and recirculating the flowof activity for the economy through deposits and loans to institutions and individuals. Asan indicator of the growth of the economy as a whole, this industry is vulnerable to thefluctuations in the macroeconomic environment. Therefore, it is interesting to see howcommercial banks in this important industry cope with recessionary conditions. Second,the commercial banking industry is a regulated industry. As per Federal regulatoryagencies, such as the Federal Reserve Board and Federal Deposits Insurance Corporation(FDIC), every insured commercial bank in the U.S. is required to report in detail abouttheir operations and financial status on a quarterly basis. Thus, data on this industry areconsistently reported allowing us to observe the changes in banks’ resource allocationsunder various economic conditions (economic recession for this study in particular).
175Ma and Karri

Sample and Data The sample of this study included all the commercial banks in the states of Kansas,
Nebraska and Oklahoma; states that were severely affected by the economic recessionof 2001. Kansas, Nebraska and Oklahoma were traditionally unit-branch bankingstates. Prior to deregulation, there were several restrictions on intrastate branching andinterstate banking (Strahan, 2003). Even after deregulation, the commercial banks inthese states were not under the ownership of bank holding companies that may havehad corporate offices in other states or other countries. Consequently, our sampleconsists of firms that were relatively autonomous in their ability to make changes intheir strategic allocation decisions. Such a homogenous sample is appropriate to testthe hypothesized effects, thereby reducing the concerns of noise arising out of otherfactors that may contribute to changes in the firm.
Because our purpose is to understand how firms change their resource allocationin coping with economic recession, we set our first wave of data collection into therecession rather than at the advent of the recession. The standard index of economicconditions used in economics and by the federal government is the growth rate ofGDP, published by the U.S. Department of Commerce. According to the EconomicReport of the President (2002), the first three quarters of 2001 registered negativegrowth in GDP. The first quarter of 2000 (ending in March) was before the recessionstarted, and the first quarter of 2001 in March marked the period when the economywas fully into recession. It is reasonable to assume that a period of one year allowsenough time for the effects of recession to be obvious to the banks. We collected cross-sectional data for March 2000 and March 2001 in order to capture the period ofinterest for this study.
We studied the effects of bank performance levels in March of 2000 on the changesin resource allocation decisions in March of 2001. In general, there are time lagsbetween decisions made about resource allocation and changes in the actual patternsof resource allocation due to different durations of loans and different maturity periodsof securities. Banks typically report and evaluate their operations on a quarterly basisand therefore, one year should be a reasonable time lag to observe a bank’s ability tocope with the recession. The total number of commercial banks in the states of Kansas,Nebraska and Oklahoma in March 2001 was 935. This number included: 1) all of thebanks in operation; 2) banks either under merger and acquisition or nonindependentbanks that changed their names during this time period, and 3) banks with missingdata on key variables of our interest. We removed the latter two types of banks fromthe sample due to missing data. However, this did not change the overallcharacteristics of the sample. The final sample size was 929. All of the data for thisstudy was collected from the Call Reports filed quarterly by all insured commercialbanks to the FDIC. The data set included all of the items in income statements,balance sheets, as well as financial ratios.
Measures Strategic resource allocation decisions. One of the most important aspects in banking
management is the management of assets and liabilities (Johnson & Johnson, 1984).In this study, strategic resource allocation decision refers to the strategic posture of
176 Journal of Business and Management – Vol. 15, No. 2, 2009
commercial banks in managing their asset resources (Deephouse, 1996, 1999). Majoritems in bank assets include cash, securities, loans and lease financing (hereafterreferred to as loans), as well as premises (fixed assets), etc.
Loans and securities are the two major areas where banks hold their assets andderive income in the form of interest. Loans, though likely to provide higher interestthan securities, are subject to default risk. Such loans are termed as nonperformingloans in the banking industry. Investment on government treasury bonds and otherlow risk securities represents a relatively secure source of income. Securities andloans account for a large portion of bank assets. Therefore, resource allocationdecisions about the combination of security and loan assets reflects the strategicposture of the bank. The larger the proportion of loans relative to securities, the moreaggressive the bank is in its operation. We measured resource allocation decision (S)as the following ratio:
S= Securities / (Securities+Loans)
Under a recession, the default risk of nonperforming loans is typically high.Holding assets in loans is therefore, a relatively unattractive alternative since manybanks face the trouble of nonperforming loans and insolvency, which may lead to bankfailure. In the golden years of the 1990s, many banks and Savings & Loans (S&L)institutions issued a tremendous amount of careless loans (possibly for good reasonslike gaining market share) which contributed to their failure later on. The bailout ofS&L associations warned the bankers to clean up the mess in their balance sheetsrather than increase loan lending. Under this kind of recession, regulatory agenciesalso require stricter procedures in making loans, leading to more complicated creditinquiries and paperwork. This then restricts loan lending.
Bankers should be extremely cautious in making loans under an economicrecession and must find other ways to make profits. In addition, in banking literature,Johnson and Johnson (1984) suggest that banks should collect more income fromsecurities and restrict loans under recessionary conditions.
Change in Strategic Resource Allocation Decision. In this study, we define thedependent variable change in strategic resource allocation decision as a change in S,denoted as CS, measured as the change of S from 2000 to 2001:
CS=S2001 – S2000
An increase in S during 2001 indicates a bank's adaptation to the economicconditions in the direction of a better resource deployment-environment match.
Performance. The performance measure in this study is return on assets (ROA) inMarch 2000. ROA is measured as the net operating income after tax as a percentageof the average total assets, which is a widely used overall performance measure inbanking studies. It is also closely watched by bank management (Rhoades, 1985).
177Ma and Karri
Control Variables Initial pattern of strategic resource allocation. The initial pattern of strategic resource
allocation of March 2000 is used as a control variable, simply denoted as S2000. A lowinitial S may indicate a relatively poor match between a bank’s aggressive strategicposture in resource allocation retained from the relatively high growth period in the1990s and the onset of recessionary conditions during 2000. We expect that bankswith a low initial S change more than banks with a relatively high initial S (a relativelybetter match).
Firm size. According to the inertia perspective, large firms may resist changesciting bureaucratization as a primary reason. Large firms are also capable of bufferingthemselves from any environmental changes owing to the slack resources. Wetherefore control for the effects of size on changes in resource allocation decisions.Firm size, Z, is measured as the log of total bank assets, a typical way of measuring size(Hansen & Wernerfelt, 1989).
Loan Quality. Given our method of measuring strategic resource allocationdecisions, it may be possible that a certain S value is just an artifact of a bank's write-off policy and different loan quality. A high S value (i.e., a relatively small proportionof loans) may be caused by a bank's willingness to write off the nonperforming loans,while a low S value (i.e., a relatively large proportion of loans) may be due to the delayof a bank’s write-off. Although we purposefully use net loans rather than total loansin measuring S, for a more accurate interpretation of S, we control for the loan qualityeffect Q, measured as the ratio of nonperforming loans to total loans. The more theloans are classified as nonperforming loans (i.e., a high Q value), the less the totalamount of net loans. Thus, we predict a positive association between Q and S.
Data Analysis
Hypothesis 1 was tested by checking the direction of the change in S from 2001 to2000 and by the comparison of the means of S2001 and S2000. A significant positivechange in resource allocation (CS) indicated support for Hypothesis 1. In general,firms undertake changes in their resource allocations to achieve a better fit with theeconomic conditions of a recession.
Hypothesis 2a was tested using multiple regressions with a multiplicative(quadratic) term of performance. The control variables were S (resource allocationbetween loans and securities), Q (loan quality), and Z (size of the bank) during theyear 2000. Y in equation 1 below refers to the change in resource allocation pattern(CS) and X refers to performance (ROA):
Y=a+blX+b2X2+S+Q+Z+e (1)
Since we only test the significance of unstandardized coefficient b2 in the equation,multi-colinearity does not pose a severe problem (see Allison, 1977; Venkatraman,1989). A significant b2 indicated a curvilinear relation between performance andchanges in strategic resource allocation decisions.
Hypothesis 2b was tested using the first order derivative of equation (1) over X:
178 Journal of Business and Management – Vol. 15, No. 2, 2009

dY/dX=bl + 2b2X (2)
This tested the monotonicity of the X-Y relationship and the potentially differenteffects of X on Y through the range of X (see Schoonhoven, 1981 for in-depthdiscussions of this technique in the context of interaction).
Results
Descriptive statistics and correlations are presented in Table 1. Results of hierarchicalregression analysis are reported in Table 2. All the hypotheses were supported.
Table 1: Descriptive Statistics and Correlations
Hypothesis 1. A systematic positive change in S was found (mean CS=0.036), whichsupports H1. In general, firms change resource allocations in response toenvironmental changes. In this case the change was economic recession. Pairedsamples t-test procedure was applied to the means of S2001 and S2000, showing asignificant difference (p<0.01). This indicates a significant and positive change instrategic resource allocations in response to recession as we predicted.
Hypothesis 2a and 2b. The coefficient of ROA*ROA (square term) was significant atthe 0.01 level. The quadratic ROA effects made a significant contribution to the R2
(R2=0.04; p<0.01). This suggests that performance affected changes in strategicresource allocation decisions in a curvilinear fashion. We then checked themonotonicity of this quadratic performance.
dCS/dROA= 0.006 - 0.006ROA=0; ROA= 1.00%
179Ma and Karri
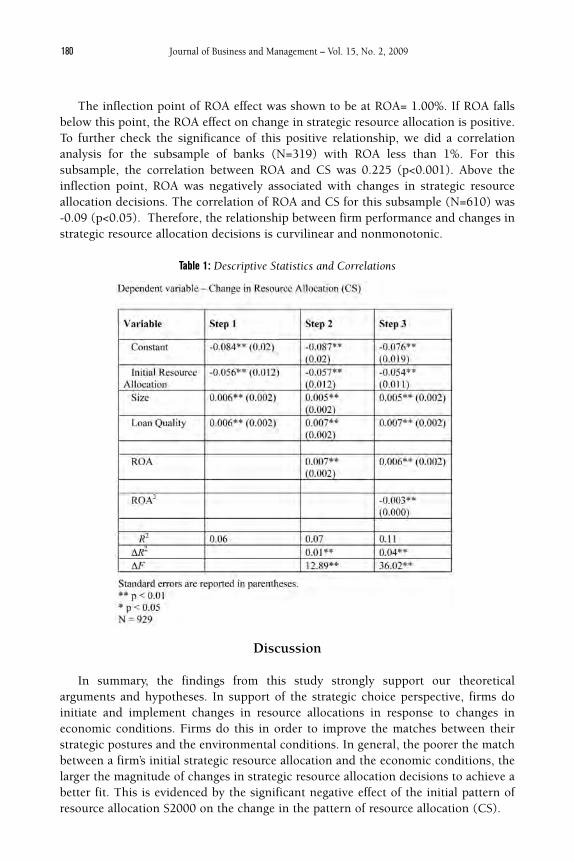
The inflection point of ROA effect was shown to be at ROA= 1.00%. If ROA fallsbelow this point, the ROA effect on change in strategic resource allocation is positive.To further check the significance of this positive relationship, we did a correlationanalysis for the subsample of banks (N=319) with ROA less than 1%. For thissubsample, the correlation between ROA and CS was 0.225 (p<0.001). Above theinflection point, ROA was negatively associated with changes in strategic resourceallocation decisions. The correlation of ROA and CS for this subsample (N=610) was-0.09 (p<0.05). Therefore, the relationship between firm performance and changes instrategic resource allocation decisions is curvilinear and nonmonotonic.
Table 1: Descriptive Statistics and Correlations
Discussion
In summary, the findings from this study strongly support our theoreticalarguments and hypotheses. In support of the strategic choice perspective, firms doinitiate and implement changes in resource allocations in response to changes ineconomic conditions. Firms do this in order to improve the matches between theirstrategic postures and the environmental conditions. In general, the poorer the matchbetween a firm’s initial strategic resource allocation and the economic conditions, thelarger the magnitude of changes in strategic resource allocation decisions to achieve abetter fit. This is evidenced by the significant negative effect of the initial pattern ofresource allocation S2000 on the change in the pattern of resource allocation (CS).
180 Journal of Business and Management – Vol. 15, No. 2, 2009
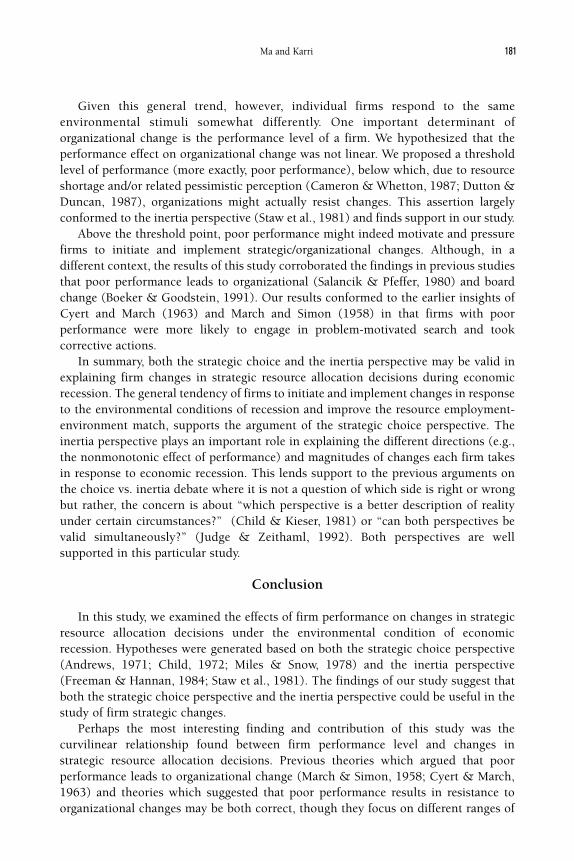
Given this general trend, however, individual firms respond to the sameenvironmental stimuli somewhat differently. One important determinant oforganizational change is the performance level of a firm. We hypothesized that theperformance effect on organizational change was not linear. We proposed a thresholdlevel of performance (more exactly, poor performance), below which, due to resourceshortage and/or related pessimistic perception (Cameron & Whetton, 1987; Dutton &Duncan, 1987), organizations might actually resist changes. This assertion largelyconformed to the inertia perspective (Staw et al., 1981) and finds support in our study.
Above the threshold point, poor performance might indeed motivate and pressurefirms to initiate and implement strategic/organizational changes. Although, in adifferent context, the results of this study corroborated the findings in previous studiesthat poor performance leads to organizational (Salancik & Pfeffer, 1980) and boardchange (Boeker & Goodstein, 1991). Our results conformed to the earlier insights ofCyert and March (1963) and March and Simon (1958) in that firms with poorperformance were more likely to engage in problem-motivated search and tookcorrective actions.
In summary, both the strategic choice and the inertia perspective may be valid inexplaining firm changes in strategic resource allocation decisions during economicrecession. The general tendency of firms to initiate and implement changes in responseto the environmental conditions of recession and improve the resource employment-environment match, supports the argument of the strategic choice perspective. Theinertia perspective plays an important role in explaining the different directions (e.g.,the nonmonotonic effect of performance) and magnitudes of changes each firm takesin response to economic recession. This lends support to the previous arguments onthe choice vs. inertia debate where it is not a question of which side is right or wrongbut rather, the concern is about “which perspective is a better description of realityunder certain circumstances?” (Child & Kieser, 1981) or “can both perspectives bevalid simultaneously?” (Judge & Zeithaml, 1992). Both perspectives are wellsupported in this particular study.
Conclusion
In this study, we examined the effects of firm performance on changes in strategicresource allocation decisions under the environmental condition of economicrecession. Hypotheses were generated based on both the strategic choice perspective(Andrews, 1971; Child, 1972; Miles & Snow, 1978) and the inertia perspective(Freeman & Hannan, 1984; Staw et al., 1981). The findings of our study suggest thatboth the strategic choice perspective and the inertia perspective could be useful in thestudy of firm strategic changes.
Perhaps the most interesting finding and contribution of this study was thecurvilinear relationship found between firm performance level and changes instrategic resource allocation decisions. Previous theories which argued that poorperformance leads to organizational change (March & Simon, 1958; Cyert & March,1963) and theories which suggested that poor performance results in resistance toorganizational changes may be both correct, though they focus on different ranges of
181Ma and Karri

the performance levels. Across the whole spectrum of firm performance levels, theperformance-organizational change relationship could be curvilinear. Our findingswere consistent with that of Fombrun and Ginsberg (1990), who found a curvilinearrelationship between prior firm performance and strategic posture of firms. However,the focus of the Fombrun and Ginsberg (1990) study was on business level strategiesthat involved changes in resource allocations and the context was the volatility ofindustry environment, not the macroenvironment.
This is the first study we are aware of which attempts to theoretically reconcile theprevious controversial arguments on the performance-organizational changerelationship (Cyert & March, 1963; Staw et al., 1981; Freeman & Hannan, 1984;Dutton & Duncan, 1987) and empirically demonstrate that the performance effect onstrategic/organizational change is not monotonic. This suggests that future researchshould form specific hypotheses and further investigate the effects of variousdeterminants of organizational/strategic changes (Schoonhoven, 1981).
Given the contribution of this study, we must conclude with caveats on thelimitations of this study and shall suggest directions for future research. First, thisstudy was performed on a sample drawn from the commercial banking industry inthree states in the environment of an economic recession. Due to different bankingregulations across state lines and different extents of recession, the results may not begeneralizable to banks in other states. A key assumption of our study was that allbanks recognize changes in the economic environment and the banks in the sample,in contrast to larger banks, may not be actively managing their securities portfolio bymaking interest rate bets. This supports our contention that securities (many of whichare government) are chosen to reduce default risk and in recessionary times, interestrates tend to fall, which raises the value of debt securities. The assumptions of ourstudy may not be valid in a sample with large banks.
Secondly, further research can test our theoretical arguments in otherenvironmental conditions (e.g., high growth-inflation) and use samples frommultiple industries. Third, as a first step towards testing our hypotheses, we focusedon one particular area of strategic change in this study (i.e. strategic resourceallocation). Multiple attributes and measures of strategic decisions should be adoptedas dependent variables in future research for a more extensive capture of thecomplexity of the phenomena involved in strategic/organizational change(Venkatraman & Grant, 1986).
In terms of managerial implications, the evidence of curvilinear relationshipbetween firm performance and change provides caution to managers from avoiding thepast performance trap. It also appears that past performance can be a trap for highperformers due to lack of motivation, while the past performance trap for poorperformance is due to lack of ability in terms of resources. While numerousprescriptive suggestions are in order for managers of both categories, we would like tounderscore the importance of resources especially that of slack resources. In the caseof high performers, unwillingness to make changes may result in a decrease in thelevel of slack resources that are required for day-to-day operations due to the negativeimpact of environmental change. Because past performance is not a trigger to changefor high performers, other organizational mechanisms should be in place to enable
182 Journal of Business and Management – Vol. 15, No. 2, 2009
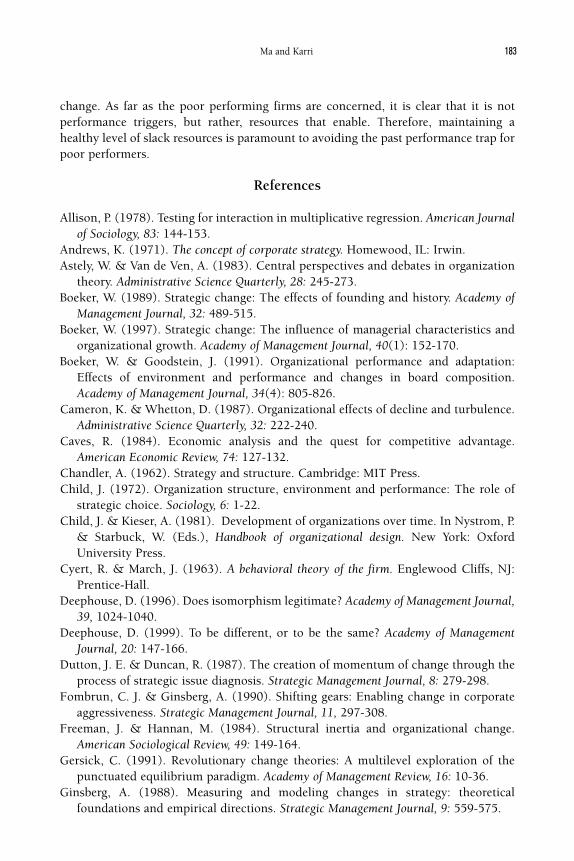
change. As far as the poor performing firms are concerned, it is clear that it is notperformance triggers, but rather, resources that enable. Therefore, maintaining ahealthy level of slack resources is paramount to avoiding the past performance trap forpoor performers.
References
Allison, P. (1978). Testing for interaction in multiplicative regression. American Journalof Sociology, 83: 144-153.
Andrews, K. (1971). The concept of corporate strategy. Homewood, IL: Irwin.Astely, W. & Van de Ven, A. (1983). Central perspectives and debates in organization
theory. Administrative Science Quarterly, 28: 245-273.Boeker, W. (1989). Strategic change: The effects of founding and history. Academy of
Management Journal, 32: 489-515.Boeker, W. (1997). Strategic change: The influence of managerial characteristics and
organizational growth. Academy of Management Journal, 40(1): 152-170.Boeker, W. & Goodstein, J. (1991). Organizational performance and adaptation:
Effects of environment and performance and changes in board composition.Academy of Management Journal, 34(4): 805-826.
Cameron, K. & Whetton, D. (1987). Organizational effects of decline and turbulence.Administrative Science Quarterly, 32: 222-240.
Caves, R. (1984). Economic analysis and the quest for competitive advantage.American Economic Review, 74: 127-132.
Chandler, A. (1962). Strategy and structure. Cambridge: MIT Press.Child, J. (1972). Organization structure, environment and performance: The role of
strategic choice. Sociology, 6: 1-22.Child, J. & Kieser, A. (1981). Development of organizations over time. In Nystrom, P.
& Starbuck, W. (Eds.), Handbook of organizational design. New York: OxfordUniversity Press.
Cyert, R. & March, J. (1963). A behavioral theory of the firm. Englewood Cliffs, NJ:Prentice-Hall.
Deephouse, D. (1996). Does isomorphism legitimate? Academy of Management Journal,39, 1024-1040.
Deephouse, D. (1999). To be different, or to be the same? Academy of ManagementJournal, 20: 147-166.
Dutton, J. E. & Duncan, R. (1987). The creation of momentum of change through theprocess of strategic issue diagnosis. Strategic Management Journal, 8: 279-298.
Fombrun, C. J. & Ginsberg, A. (1990). Shifting gears: Enabling change in corporateaggressiveness. Strategic Management Journal, 11, 297-308.
Freeman, J. & Hannan, M. (1984). Structural inertia and organizational change.American Sociological Review, 49: 149-164.
Gersick, C. (1991). Revolutionary change theories: A multilevel exploration of thepunctuated equilibrium paradigm. Academy of Management Review, 16: 10-36.
Ginsberg, A. (1988). Measuring and modeling changes in strategy: theoreticalfoundations and empirical directions. Strategic Management Journal, 9: 559-575.
183Ma and Karri
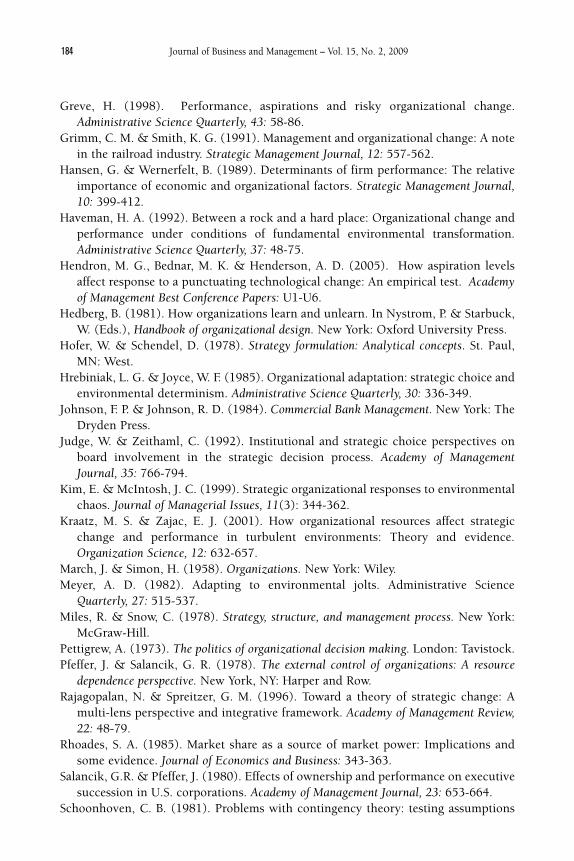
Greve, H. (1998). Performance, aspirations and risky organizational change.Administrative Science Quarterly, 43: 58-86.
Grimm, C. M. & Smith, K. G. (1991). Management and organizational change: A notein the railroad industry. Strategic Management Journal, 12: 557-562.
Hansen, G. & Wernerfelt, B. (1989). Determinants of firm performance: The relativeimportance of economic and organizational factors. Strategic Management Journal,10: 399-412.
Haveman, H. A. (1992). Between a rock and a hard place: Organizational change andperformance under conditions of fundamental environmental transformation.Administrative Science Quarterly, 37: 48-75.
Hendron, M. G., Bednar, M. K. & Henderson, A. D. (2005). How aspiration levelsaffect response to a punctuating technological change: An empirical test. Academyof Management Best Conference Papers: U1-U6.
Hedberg, B. (1981). How organizations learn and unlearn. In Nystrom, P. & Starbuck,W. (Eds.), Handbook of organizational design. New York: Oxford University Press.
Hofer, W. & Schendel, D. (1978). Strategy formulation: Analytical concepts. St. Paul,MN: West.
Hrebiniak, L. G. & Joyce, W. F. (1985). Organizational adaptation: strategic choice andenvironmental determinism. Administrative Science Quarterly, 30: 336-349.
Johnson, F. P. & Johnson, R. D. (1984). Commercial Bank Management. New York: TheDryden Press.
Judge, W. & Zeithaml, C. (1992). Institutional and strategic choice perspectives onboard involvement in the strategic decision process. Academy of ManagementJournal, 35: 766-794.
Kim, E. & McIntosh, J. C. (1999). Strategic organizational responses to environmentalchaos. Journal of Managerial Issues, 11(3): 344-362.
Kraatz, M. S. & Zajac, E. J. (2001). How organizational resources affect strategicchange and performance in turbulent environments: Theory and evidence.Organization Science, 12: 632-657.
March, J. & Simon, H. (1958). Organizations. New York: Wiley.Meyer, A. D. (1982). Adapting to environmental jolts. Administrative Science
Quarterly, 27: 515-537.Miles, R. & Snow, C. (1978). Strategy, structure, and management process. New York:
McGraw-Hill.Pettigrew, A. (1973). The politics of organizational decision making. London: Tavistock.Pfeffer, J. & Salancik, G. R. (1978). The external control of organizations: A resource
dependence perspective. New York, NY: Harper and Row.Rajagopalan, N. & Spreitzer, G. M. (1996). Toward a theory of strategic change: A
multi-lens perspective and integrative framework. Academy of Management Review,22: 48-79.
Rhoades, S. A. (1985). Market share as a source of market power: Implications andsome evidence. Journal of Economics and Business: 343-363.
Salancik, G.R. & Pfeffer, J. (1980). Effects of ownership and performance on executivesuccession in U.S. corporations. Academy of Management Journal, 23: 653-664.
Schoonhoven, C. B. (1981). Problems with contingency theory: testing assumptions
184 Journal of Business and Management – Vol. 15, No. 2, 2009

hidden within the language of contingency “theory.” Administrative ScienceQuarterly, 26: 349-377.
Smith, K. G. & Grimm, C. M. (1987). Environmental variation, strategic change andfirm performance. Strategic Management Journal, 8: 363-376.
Staw, B., Sandelands, L. & Dutton, J. (1981). Threat rigidity effects in organizationalbehavior: A multilevel analysis. Administrative Science Quarterly, 26: 501-524.
Strahan, P. E. (2003). The real effects of U.S. banking deregulation. Federal ReserveBank of St. Louis Review, 85(4): 111-128.
Venkatraman, N. (1989). The concept of fit in strategy research: Toward verbal andstatistical correspondence. Academy of Management Review, 14: 423-444.
Venkatraman, N. & Grant, J. (1986). Construct measurement in organizational strategyresearch: A critique and proposal. Academy of Management Review, 11: 71-87.
Zajac, E. J. & Kraatz, M. S. (1993). A diametric model of strategic change: Assessingthe antecedents and consequences of restructuring in the higher educationindustry. Strategic Management Journal, 14: 83-102.
185Ma and Karri

186 Journal of Business and Management – Vol. 15, No. 2, 2009
Invitation To Review Manuscripts
The review process is a critical step in publishing a quality journal. The editors ofthe Journal of Business and Management invite you to participate in the ongoingactivities necessary to make JBM a reputable scholarly outlet. If you would like us tosend you manuscripts to review, please complete the form below or email us with theinformation at [email protected].
Name ____________________________________________________________________
Address __________________________________________________________________
__________________________________________________________________________
__________________________________________________________________________
Email ____________________________________________________________________
Please list your major areas of interest:
Please indicate how many manuscripts you would be willing to review in anacademic year:
■ 1 ■ 2 ■ 3 ■ 4 ■ 5
Please return the form to:Amy E. Hurley-Hanson, Ph.D.
Cristina M. Giannantonio, Ph.D.Editors, Journal of Business and ManagementArgyros School of Business and Economics
Chapman UniversityOne University DriveOrange, CA 92866
FAX (714) 532-6081
J.B.M.

Subscription Form
The Journal of Business and Management is published by the Argryros School of
Business and Economics, Chapman University. It is sponsored by the Western
Decision Sciences Institute.
The annual subscription fee is $50.00 for individuals and $100.00 for institutions.
Your check or money order should be made out to CHAPMAN UNIVERSITY/JBM.
Please complete your mailing information below.
Name ________________________________________________________________________
Department ____________________________________________________________________
Address Line 1__________________________________________________________________
Address Line 2__________________________________________________________________
Address Line 3__________________________________________________________________
Tel ________________________________________________________________________
Fax________________________________________________________________________
Mail this form with your check or money order to:
Journal of Business and Management
Argyros School of Business and Economics
Chapman University
One University Drive
Orange, CA 92866
email: [email protected]
J.B.M.


ERRATA
A typographical error occurred in Volume 14, Number 1 of the Journal of Business of Management. Theerror occurred in article “Student-Manager Surrogacy in Supply Chain Decision Making” by Dr.Chanchai Tangpong and Dr. Young K. Ro, JBM, 14(1): 77-91. On page 85, the first paragraph in the“Discussion and Conclusions” section should have been omitted from this manuscript. The firstparagraph found on page 86 is the actual introductory paragraph in the “Discussion and Conclusions”section. Please note that the online version (at www.proquest.com)is correct and should be used forreferencing purposes.

NOTES

ISSN: 1535-668XEditorial Offices: Journal of Business and Management
Argyros School of Business and EconomicsChapman UniversityOne University DriveOrange, CA 92866
Fax: (714) 532-6081
E-mail: [email protected]
Submission information is available on our website: http://jbm.chapman.edu
The Journal of Business and Management is published by Chapman University’s Argyros School of Business and Economicswith the sponsorship of the Western Decision Sciences Institute. The primary editorial objective of the Journal of Businessand Management is to provide a forum for the dissemination of theory and research in all areas of business, management,and organizational decisions which would be of interest to academics and practitioners.
The views expressed in published articles are those of the authors and not necessarily those of the editors, editorial board,WDSI or Chapman University.
Copyright @ 2009 Argyros School of Business and Economics, Chapman University.

VOL. 15, NO. 2, 2009 JOURNAL of BUSINESS and MANAGEMENT CHAPMAN UNIVERSITY