Embed Size (px)
Citation preview
Jazz Performance Guide Page 1
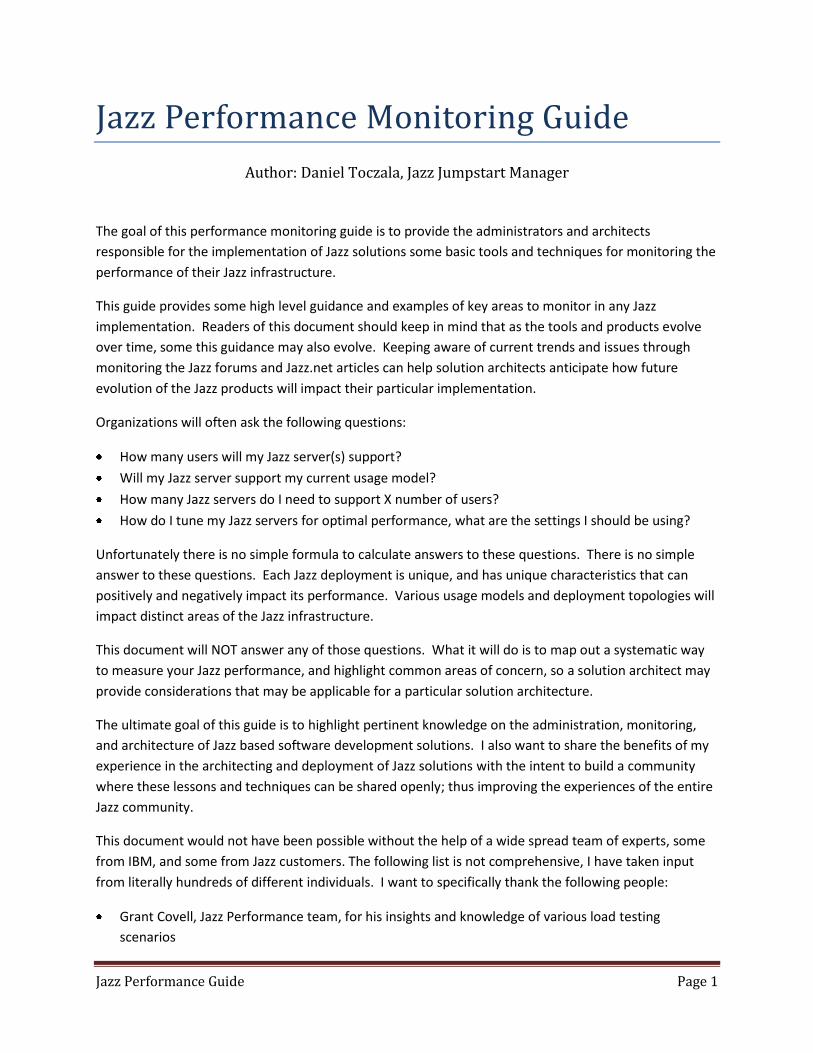
Jazz Performance Monitoring Guide
Author: Daniel Toczala, Jazz Jumpstart Manager
The goal of this performance monitoring guide is to provide the administrators and architects
responsible for the implementation of Jazz solutions some basic tools and techniques for monitoring the
performance of their Jazz infrastructure.
This guide provides some high level guidance and examples of key areas to monitor in any Jazz
implementation. Readers of this document should keep in mind that as the tools and products evolve
over time, some this guidance may also evolve. Keeping aware of current trends and issues through
monitoring the Jazz forums and Jazz.net articles can help solution architects anticipate how future
evolution of the Jazz products will impact their particular implementation.
Organizations will often ask the following questions:
How many users will my Jazz server(s) support?
Will my Jazz server support my current usage model?
How many Jazz servers do I need to support X number of users?
How do I tune my Jazz servers for optimal performance, what are the settings I should be using?
Unfortunately there is no simple formula to calculate answers to these questions. There is no simple
answer to these questions. Each Jazz deployment is unique, and has unique characteristics that can
positively and negatively impact its performance. Various usage models and deployment topologies will
impact distinct areas of the Jazz infrastructure.
This document will NOT answer any of those questions. What it will do is to map out a systematic way
to measure your Jazz performance, and highlight common areas of concern, so a solution architect may
provide considerations that may be applicable for a particular solution architecture.
The ultimate goal of this guide is to highlight pertinent knowledge on the administration, monitoring,
and architecture of Jazz based software development solutions. I also want to share the benefits of my
experience in the architecting and deployment of Jazz solutions with the intent to build a community
where these lessons and techniques can be shared openly; thus improving the experiences of the entire
Jazz community.
This document would not have been possible without the help of a wide spread team of experts, some
from IBM, and some from Jazz customers. The following list is not comprehensive, I have taken input
from literally hundreds of different individuals. I want to specifically thank the following people:
Grant Covell, Jazz Performance team, for his insights and knowledge of various load testing
scenarios

Jazz Performance Guide Page 2
Brianna Smith, a member of the Global Response Team, for her input, experiences, and fine
editorial eye.
My entire Jumpstart team, who have openly been sharing their experiences with each other, and
with the general public in their blogs and Jazz.net articles.
Jazz Performance Guide Page 3
Contents Introduction .................................................................................................................................................. 6
Jazz Performance .......................................................................................................................................... 7
Jazz Performance Basics............................................................................................................................ 7
Common Jazz Operations and Their Performance Impact ....................................................................... 9
Basic Jazz concepts .............................................................................................................................. 10
Any Operation ..................................................................................................................................... 10
Simple Work Item Manipulation ......................................................................................................... 10
Running a Query ................................................................................................................................. 10
Running Reports .................................................................................................................................. 11
Using Dashboards ............................................................................................................................... 12
Showing Plans ..................................................................................................................................... 12
Executing a Build ................................................................................................................................. 13
Linking Repository Objects .................................................................................................................. 15
Common Jazz Hardware Configurations and Their Impact on Performance .......................................... 15
The Jazz Client ..................................................................................................................................... 16
The IBM HTTP Server (IHS) .................................................................................................................. 17
The Jazz Applications and WebSphere (WAS)..................................................................................... 17
The Database Server ........................................................................................................................... 19
The Network........................................................................................................................................ 20
The LDAP Server .................................................................................................................................. 20
Virtualization ....................................................................................................................................... 20
The Operating Systems ....................................................................................................................... 22
Conclusions ............................................................................................................................................. 22
Monitoring the Health of Your Jazz Implementation ................................................................................. 25
Monitoring Tools ..................................................................................................................................... 25
Suggested Monitoring Techniques ......................................................................................................... 26
Tivoli APM Monitoring ........................................................................................................................ 26
DB2 Database Server Monitoring on Z................................................................................................ 26
JazzMon Monitoring ........................................................................................................................... 27
WebSphere Application Server Monitoring ........................................................................................ 27
Jazz Performance Guide Page 4
JazzMon Monitoring ........................................................................................................................... 31
Using WAIT to Capture Performance Issues ....................................................................................... 32
Using HTTP Watch ............................................................................................................................... 32
General Performance Monitoring ............................................................................................................... 33
Proactive Monitoring .................................................................................................................................. 35
Covering the Entire Solution Architecture – A Philosophy ..................................................................... 35
Daily Monitoring and Health Assessment ............................................................................................... 37
Step 1 - Initial Analysis of Data ........................................................................................................... 37
Step 1b - Initial Analysis of Data – Using the Introscope (APM) Monitor ........................................... 39
Step 2 – Diving Deeper into Network Issues ....................................................................................... 46
Step 3 – Looking for Database Issues .................................................................................................. 48
Step 3b – Looking for Database Issues – Using DB2 zOS Monitoring ................................................. 48
Step 4 – Analysis of Web Server Issues ............................................................................................... 48
Step 5 – Investigation of Jazz Application Issues ................................................................................ 49
Step 6 – Determination of Web Browser and Client Issues ................................................................ 50
Weekly Monitoring and Health Assessment ........................................................................................... 51
Weekly Frontend Response Ranges .................................................................................................... 51
Weekly License Usage ......................................................................................................................... 51
Weekly Repository Check ................................................................................................................... 51
Reactive Monitoring.................................................................................................................................... 53
Triage of Issues – A Philosophy ............................................................................................................... 53
Reactive Examples .................................................................................................................................. 55
End User Reported Performance Issue ............................................................................................... 55
Multiple Users Have Identified Performance Related Issues ............................................................. 57
Build Failure ........................................................................................................................................ 58
Potential Fixes for Common Issues ............................................................................................................. 60
WebSphere ............................................................................................................................................. 60
JVM Garbage Collection Pauses .......................................................................................................... 60
LTPA Timeout errors in the WAS Logs (systemOut.log) ...................................................................... 61
Inconsistent Jazz user settings ............................................................................................................ 62
Name Translation in the Solution Environment ......................................................................................... 63
Sample Jazz Performance Log ..................................................................................................................... 64

Jazz Performance Guide Page 5
Jazz Performance Guide Page 6
Introduction Monitoring performance can be a difficult task. Perceived user performance is a subjective measure,
and what may pass for acceptable performance for one group of users, may be completely unacceptable
for another set of users. We need to first agree on a set of objective measures for performance. These
measures need to be testable, and easily repeatable, so they can be monitored and evaluated over time.
Our next step is to then identify a set of secondary measures that can help explain the relative
performance of the various portions of the Jazz solution infrastructure, to help in the identification of
performance issues, and finally identify symptoms of performance problems and find a root cause for
those issues. Once a root cause is determined, steps to mitigate these performance bottlenecks can
then be explored.
The final piece of the puzzle is to institute a rigor and framework for the continuous monitoring and
identification of Jazz solution performance. Often performance issues will build over time, with a
system experiencing a slow degradation of performance as the factors contributing to the performance
issue get progressively worse. Having a systematic approach and historical data allows administrators
and a solution architect to be proactive in addressing issues.
Jazz Performance Guide Page 7
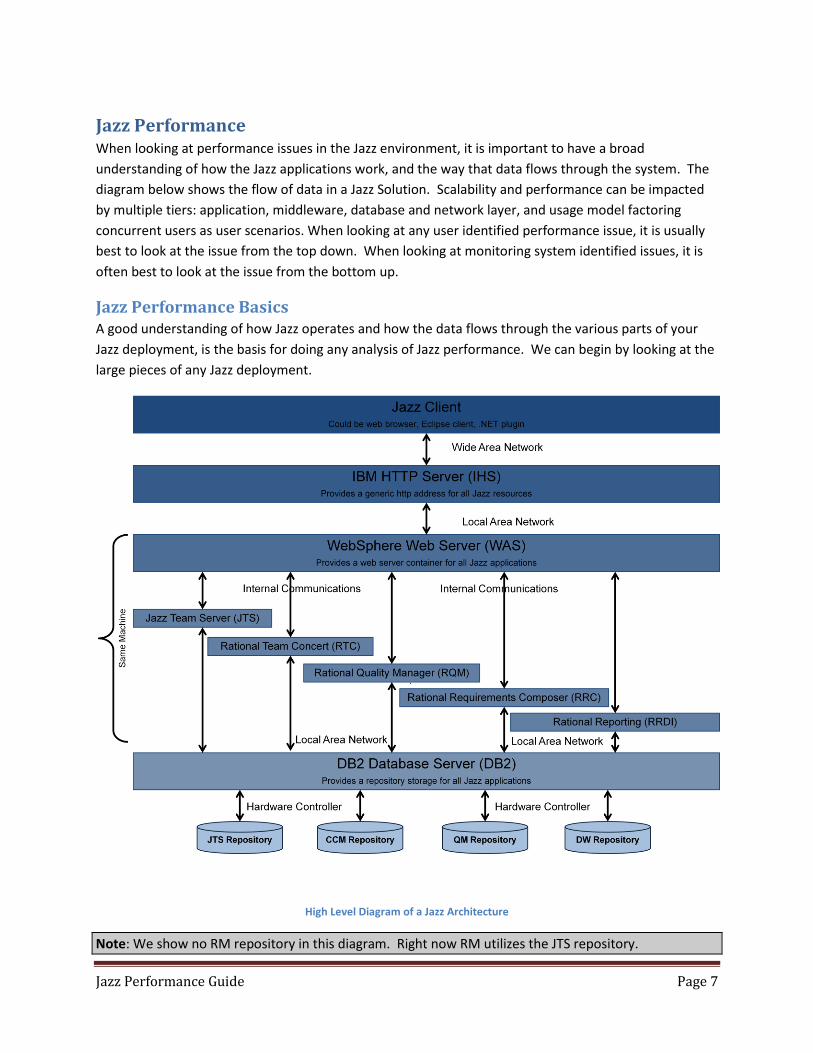
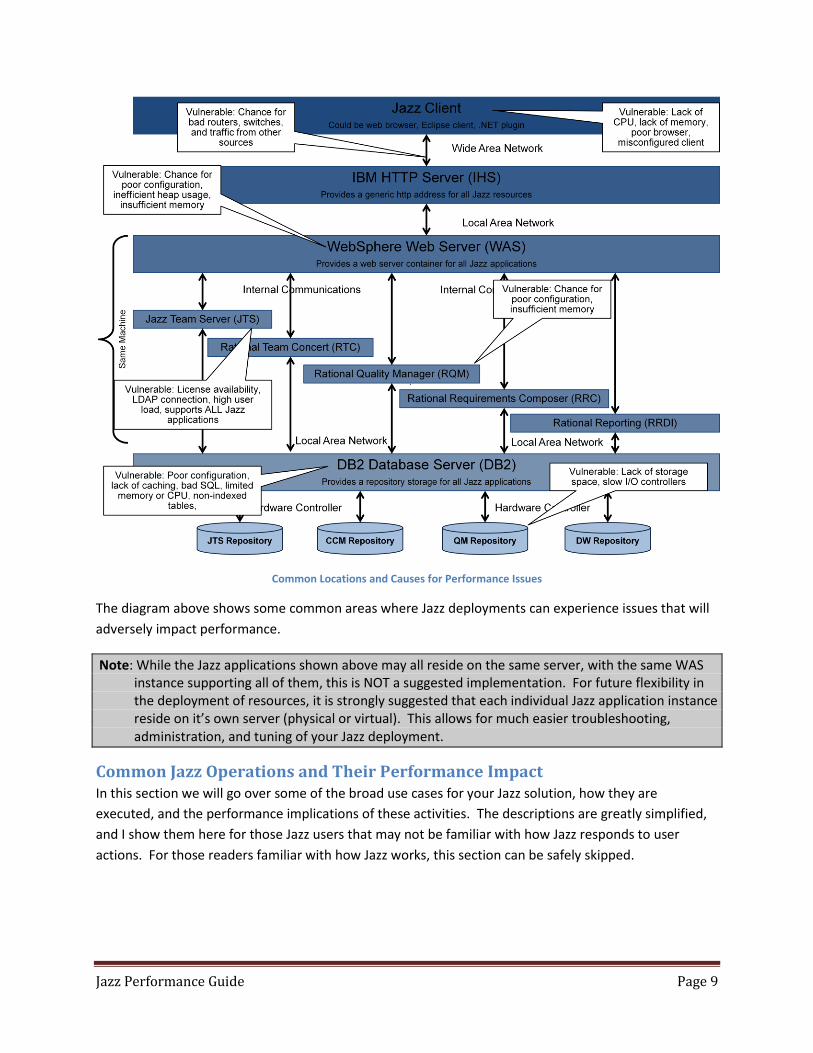
Jazz Performance When looking at performance issues in the Jazz environment, it is important to have a broad
understanding of how the Jazz applications work, and the way that data flows through the system. The
diagram below shows the flow of data in a Jazz Solution. Scalability and performance can be impacted
by multiple tiers: application, middleware, database and network layer, and usage model factoring
concurrent users as user scenarios. When looking at any user identified performance issue, it is usually
best to look at the issue from the top down. When looking at monitoring system identified issues, it is
often best to look at the issue from the bottom up.
Jazz Performance Basics A good understanding of how Jazz operates and how the data flows through the various parts of your
Jazz deployment, is the basis for doing any analysis of Jazz performance. We can begin by looking at the
large pieces of any Jazz deployment.
High Level Diagram of a Jazz Architecture
Note: We show no RM repository in this diagram. Right now RM utilizes the JTS repository.
Jazz Performance Guide Page 8
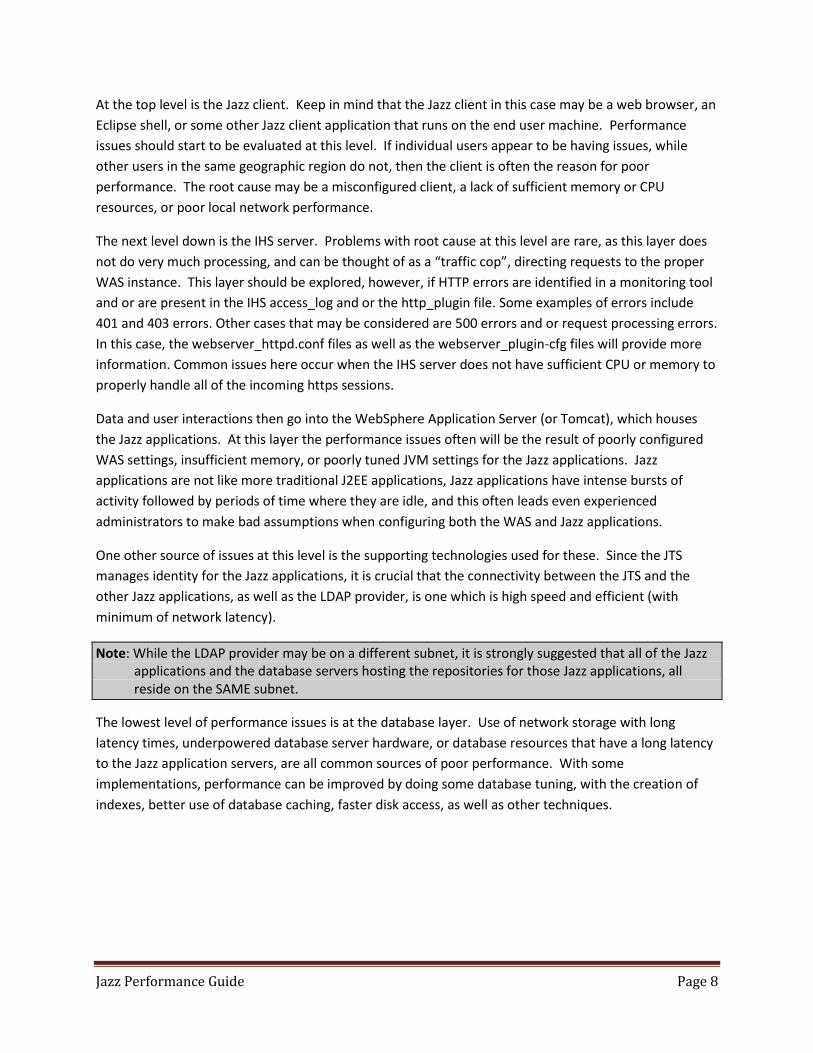
At the top level is the Jazz client. Keep in mind that the Jazz client in this case may be a web browser, an
Eclipse shell, or some other Jazz client application that runs on the end user machine. Performance
issues should start to be evaluated at this level. If individual users appear to be having issues, while
other users in the same geographic region do not, then the client is often the reason for poor
performance. The root cause may be a misconfigured client, a lack of sufficient memory or CPU
resources, or poor local network performance.
The next level down is the IHS server. Problems with root cause at this level are rare, as this layer does
not do very much processing, and can be thought of as a “traffic cop”, directing requests to the proper
WAS instance. This layer should be explored, however, if HTTP errors are identified in a monitoring tool
and or are present in the IHS access_log and or the http_plugin file. Some examples of errors include
401 and 403 errors. Other cases that may be considered are 500 errors and or request processing errors.
In this case, the webserver_httpd.conf files as well as the webserver_plugin-cfg files will provide more
information. Common issues here occur when the IHS server does not have sufficient CPU or memory to
properly handle all of the incoming https sessions.
Data and user interactions then go into the WebSphere Application Server (or Tomcat), which houses
the Jazz applications. At this layer the performance issues often will be the result of poorly configured
WAS settings, insufficient memory, or poorly tuned JVM settings for the Jazz applications. Jazz
applications are not like more traditional J2EE applications, Jazz applications have intense bursts of
activity followed by periods of time where they are idle, and this often leads even experienced
administrators to make bad assumptions when configuring both the WAS and Jazz applications.
One other source of issues at this level is the supporting technologies used for these. Since the JTS
manages identity for the Jazz applications, it is crucial that the connectivity between the JTS and the
other Jazz applications, as well as the LDAP provider, is one which is high speed and efficient (with
minimum of network latency).
Note: While the LDAP provider may be on a different subnet, it is strongly suggested that all of the Jazz applications and the database servers hosting the repositories for those Jazz applications, all reside on the SAME subnet.
The lowest level of performance issues is at the database layer. Use of network storage with long
latency times, underpowered database server hardware, or database resources that have a long latency
to the Jazz application servers, are all common sources of poor performance. With some
implementations, performance can be improved by doing some database tuning, with the creation of
indexes, better use of database caching, faster disk access, as well as other techniques.
Jazz Performance Guide Page 9
Common Locations and Causes for Performance Issues
The diagram above shows some common areas where Jazz deployments can experience issues that will
adversely impact performance.
Note: While the Jazz applications shown above may all reside on the same server, with the same WAS instance supporting all of them, this is NOT a suggested implementation. For future flexibility in the deployment of resources, it is strongly suggested that each individual Jazz application instance reside on it’s own server (physical or virtual). This allows for much easier troubleshooting, administration, and tuning of your Jazz deployment.
Common Jazz Operations and Their Performance Impact In this section we will go over some of the broad use cases for your Jazz solution, how they are
executed, and the performance implications of these activities. The descriptions are greatly simplified,
and I show them here for those Jazz users that may not be familiar with how Jazz responds to user
actions. For those readers familiar with how Jazz works, this section can be safely skipped.
Jazz Performance Guide Page 10
Basic Jazz concepts
Jazz is a collection of software development tools that are based on the principle of REST based services.
REST based systems store data with a unique URI, so that pieces of data may be referenced from simple
http requests. There are some very good descriptions of the basics of REST on the web. One of the best
ones was written by Ryan Tomayko, and is called “How I Explained REST to My Wife”.
Any Operation
The request for any Jazz resource begins from a client instance. The request for the object URI is sent
from the client, through any load balancers, reverse proxy servers and the IHS server, to the appropriate
Jazz application. This request (like all of the client requests) will need to be authenticated and a logon
prompt will be displayed if the user has not previously authenticated. In most instances, this
authentication password will be passed through to the appropriate LDAP resource for verification.
Once a request is authenticated, it is acted upon. The context of the user is established, and the user
role and permissions are used in conjunction with the context of the operation, to determine if the user
has appropriate permissions to access the data. If the user does have permissions, the request then is
converted into the appropriate SQL statement, and this request for the data is sent to the database
server. Once the response from the database server is received by the application, the data is presented
back to the client based on the process for the project in question.
Simple Work Item Manipulation
The user act of retrieving and working with a work item, regardless of client type, is a pretty simple use
case. The user clicks on a link, or in some other way indicates a work item for display. Sometimes
calculations need to be done in order to determine the appropriate URI to request. This request follows
the typical Any Operation use case above, and the data is then returned to the client.
The user can then attempt to modify the state and/or attributes of the object in question. The allowed
actions are governed by the process associated with the project that “owns” the work item, coupled
with the identity and role of the user with respect to the project. The user can manipulate the data, and
will then send the entire object back to the Jazz application for updating. Once the required permissions
and data validation are performed, the Jazz application will convert the data into an appropriate SQL
statement, and this is then sent to the database server.
Running a Query
The user act of executing a query, regardless of client type, is quite similar to simple work item
manipulation. The user clicks on a query link, or in some other way indicates a query for execution. The
request goes to the jazz server, and the request follows the typical Any Operation use case above, and
the data is then returned to the client.
The big difference is that a query will often return multiple rows of data. For example a user may want
to see all of the work items that are in an open state that they are owner of. This makes the generation
of the appropriate SQL to retrieve data more complex, and can often return more data than a simple
query for a single work item.
Jazz Performance Guide Page 11
Running Reports
Users will request the running of reports from any of the Jazz clients. These requests will go and fetch
the definition of the report, and apply user supplied parameters to the reporting engine. The reporting
engine will then issue one or more queries to the database. Reports can be intensive users of Jazz
server resources, because they may issue multiple queries to be able to collect the data needed for a
report. Once the responses (data sets) for all of the queries have been returned to the Jazz application,
the reporting engine needs to generate the actual report and render the results. All of this processing is
done “on demand”, when the report is requested.
Reports have the potential to be intensive in their consumption of Jazz server resources, because they
may issue multiple queries in order to collect the data needed for a report. In addition, poorly authored
reports may contain multiple table joins in their queries, which can greatly increase the size of the data
set that needs to be retrieved from the database.
Note: Reports have the potential to be huge consumers of Jazz system resources. A poorly written report can generate unnecessarily complex SQL, or can execute multiple table joins, which can greatly increase the size of the data set returned. This has additional implications because not only must all of this data be retrieved from the database (in the case of BIRT based reports), it then must be processed by the reporting engine. A little additional effort to generate efficient report templates, and to use the data warehouse, can greatly reduce the load on your Jazz infrastructure. A best practice is to test the report generation in a test environment mimicking data structure that is in the production environment. This step is helpful as one can understand how much data may be returned and the impact on Jazz system resources. An additional best practice is to completely avoid the use of BIRT based reports.
When using reports, it is strongly suggested that the Rational Reporting for Development Intelligence
(RRDI) tools be used. This application uses a data warehouse to store trend and historical data. Reports
which utilize historical and trend data can then be authored, and when executed, will create multiple
queries against the data warehouse, which will have little impact on the Jazz application servers.
When using RRDI, a set of ETL jobs are run on a periodic basis. ETL stands for Extract/Transform/Load.
These will extract data from the various Jazz application servers, transform that data, and then load it
into the data warehouse. Note that when these ETL jobs are executing, they place an additional load on
the Jazz applications, which must supply data from the current Jazz application repositories.
Note: When using RRDI, it is important to know when the ETL jobs are scheduled to be run, and to try to coordinate these times with times of low system load. ETL jobs can be scheduled at various different intervals, but most organizations find that a daily run of the ETL jobs will give adequate granularity for most historical and trend types of reports.
Jazz Performance Guide Page 12
Using Dashboards
Dashboards are quite useful for team members, stakeholders, and just about every user of the Jazz
tools. Dashboards can potentially put significant load (on a per user basis) on the Jazz infrastructure.
Dashboards will contain a series of widgets containing query results, HTML, reports, and other data. The
reason that dashboards can put load on a system is because when the user brings up the dashboard, the
queries and processing for EVERY widget on the tab are sent to the server. So a dashboard with 15 work
item widgets on it will generate 15 different queries when the dashboard is brought up. The dashboard
will also reissue these queries after some amount of time, in order to keep the data being displayed to
the user “fresh”.
Note: Because dashboards will refresh their contents, it is always good to be in the habit of looking at your dashboard, and then moving on to other things in your browser. Hidden tabs and browser sessions with Jazz dashboards will continue to refresh themselves, generating workload for data that is never utilized. In general this is not a huge worry, but if ALL of your users get into bad habits with dashboards, it can have an impact on performance. So use your dashboards, but shut down web browser tabs/pages once you are done using your dashboard.
Dashboards can also contain reports. Reports can be even more intensive users of Jazz server resources,
because they may issue multiple queries to be able to collect the data needed for a report. The request
then needs to generate the actual report and render the results. All of this processing is done “on
demand”, when the dashboard tab is displayed.
Note: Because reports on dashboards can consume system resources, some organizations provide links to reports, and let users run their reports one at a time. Dashboards with multiple reports can potentially put unnecessary load on the system.
In a typical environment, where every team may have 5 – 10 queries on their dashboard, and perhaps a
burndown or open work item report, the impact on the system is not significant enough to noticeably
impact performance. These situations are highlighted because in extreme cases these can end up
putting unnecessary load on the Jazz system resources.
Note: A dashboard with 12 reports that scroll off the bottom of a typical browser window is an example of one of the worst offenders of all. The user can only see 4 reports, and often doesn’t scroll down to see the reports at the bottom of the page. One user accessing this dashboard has the same impact as 12 individual users all requesting reports at the same time.
Showing Plans
Many Jazz users utilize plans as their initial view into a project. When a user requests a plan, the request
is sent to the Jazz server and the usual authentication, permission, and context setting is done. The Jazz
server will then generate a series of SQL requests to the database to retrieve all of the work items that
need to be displayed for a plan. Once the data sets have been returned, all of this data is returned to
the client.
Jazz Performance Guide Page 13
If the client is a web browser, a JavaScript routine is then run, which will properly display and render the
plan for the end user. The use of JavaScript on the web client to do this work is because plans are active
elements, and users can interactively modify multiple work items when doing drag and drop operations
and other modifications while looking at a plan. Once the list of work items is received, further queries
are generated to retrieve information on the specific work items.
Note: Since the JavaScript being executed for plans is fairly complex, the performance of the JavaScript engine in the browser has a direct impact on the perceived end user performance. Curious users might want to measure the performance differences between the various different web browsers using a tool like Firebug or HttpWatch. For more information on using these tools to check web browser performance, see the blog post, “Keep an http watch on your Jazz server”.
Since a plan retrieves data for multiple work items, it is like a large query in the way that it requests data
and gets large collections of data returned to it. The main difference is that this data is not just returned
to the end user in the form of rows of data. Instead the plan display must do some amount of JavaScript
processing in the web browser to render the final plan display for the user, similar to the way that the
reporting engine will need to use the data returned to it to render a diagram for the report.
Plans can be slow when they become very large, due to the large amounts of data that need to be
returned from the database, and the subsequent JavaScript processing in the web browser.
Note: At the present time it is an accepted best practice to limit plans to less than 250 plan items. Larger plans can take a long time to display, and most of the time a user cannot conceptually grasp more than a few dozen plan items at a time.
Executing a Build
The execution of large builds of software from the SCM repository has the potential to be an expensive
operation, in terms of system resources and performance. The entire process can be started through
either an explicit user request for the execution of a build, or a build may be initiated by a particular
event (like a nightly build at a particular time, or a continuous integration build triggered by the delivery
of code changes).
Once the build execution request is generated, the Jazz Build Engine (or JBE) will go and execute the
requested build. This is typically accomplished via an Ant script. Builds impact the system primarily in
the large amounts of data that is transferred by the build. In the case where a code base with 500MB of
source code needs to get built, the same build can have different impacts based on different factors.
Note: Some organizations use the JBE as a link to their own build orchestration technology (like Maven or Hudson). Take care when linking in other build orchestration technologies. Some of them will poll the build engine every second for the status of the build, which results in excessive traffic and excessive entries in the log files.
Jazz Performance Guide Page 14
In the earlier example, many organizations will want to always produce “clean” builds. A “clean” build is
a build executed from a workspace with no previous contents (or a “clean” workspace), which is then
populated with artifacts from a particular baseline of artifacts. The population of artifacts results in a
lookup of baseline information, followed by a series of REST calls to the database to retrieve the specific
objects (typically source files) and put them into the workspace. Once the workspace has been
populated, then the source files can be compiled and a set of build artifacts are then produced in the
workspace.
A different variant of this is the incremental build. In an incremental build, the workspace for the last
time the build was done is reused. This has all of the files pre-populated in it. Once the baseline to be
used is identified, the system can then determine which files have changed between the current
baseline target, and the previous baseline that was built in the workspace. The workspace is then
updated only with the files that have changed since the last build. This results in a much lower volume
of data being transferred to and from the database. In some cases, with some technologies, only the
changed artifacts need to be recompiled.
Note: “Clean” builds should not always be avoided. Builds for production environments, or release candidates, should be done using clean builds. This guarantees that nobody has inadvertently corrupted or changed the validity of the build workspace, which is critical for these types of operations. Incremental builds should be used if you are practicing continuous integration (CI). Even in the case where CI is being done, it might be a good idea to do a clean build over the weekend just to ensure that nobody has added files to the build workspace that are not under SCM control
Builds have a couple of phases. During the first phase, data is being requested from the database, as the
source files are returned and populated into the build workspace. During this phase, there is extensive
communication load and database traffic as the Jazz application calculates the correct versions of files to
return, and then retrieves and transfers these files. This phase has the largest impact on the
performance of the Jazz solution.
The second phase is the actual compilation and packaging of the compilation results. End users will
often focus on how long a build takes to execute. You can impact build times by paying attention to
each of these factors. Improving Jazz performance can help reduce build times incurred during the first
phase. Improving and streamlining build scripts and build processes can help reduce the amount of time
taken during the second build phase.
Jazz Performance Guide Page 15
Another factor to keep in mind is the use of an SCM Caching Proxy (sometimes referred to as a Squid
Proxy) to help improve build performance. SCM Caching proxies can be implemented in a variety of
ways, some software based (like the Apache Squid solution), while others are hardware based (with
products like Riverbed and other WAN accelerators). Since Jazz is REST based, each of the objects (in
this case source files) is represented by a unique URL. A caching proxy placed between the build
machine and the Jazz repository will cache copies of the source files that do not change often, thus
eliminating the need to retrieve these files from the repository. This not only results in a shorter round
trip for the requests, it also places a much lesser load on the database server housing the Jazz
repository. For build machines at locations that are geographically distant from the Jazz server
machines and repositories, an SCM proxy server at the local site will also reduce the need to copy files
over the WAN, eliminating the major contributors to network latency.
Note: For more information on setting up an SCM Caching Proxy, see the article on Jazz.net entitled “Using Content Caching Proxies for Jazz Source Control”
Linking Repository Objects
Some Jazz based operation involve the linking of various Jazz objects. These links are often used to
indicate the relationships between these objects in the repository. Since the objects in the Jazz
repository are REST based objects, creating the link merely involves saving a pointer to the URI of the
related object. This can be thought of as a hyperlink, because that is what it is.
Things do get tricky with some of the relationships represented within the Jazz solution environment.
Certain types of relationships are bi-directional, the parent/child relationship is a classic example of this.
In these instances, not only is a link created from one object to the other, but an additional backlink is
created in the other direction. In a parent/child relationship, you may be in the parent work object, and
you will create a link to a child object. A parent-to-child relationship is established by the hyperlink,
indicating that the other work item is a child of this parent. Immediately after this action, a backlink is
created in the child object, indicating that the original object is related to the child object in a child-to-
parent relationship.
Creating relationships typically has very little impact on overall Jazz performance.
Common Jazz Hardware Configurations and Their Impact on Performance In this section I will go over some of the broad principles to keep in mind when deploying and
configuring the hardware supporting your Jazz solution. As I begin looking at the various elements of
the physical Jazz architecture, it is probably a good idea to remind ourselves of the basic pieces of a Jazz
solution architecture.
Jazz Performance Guide Page 16
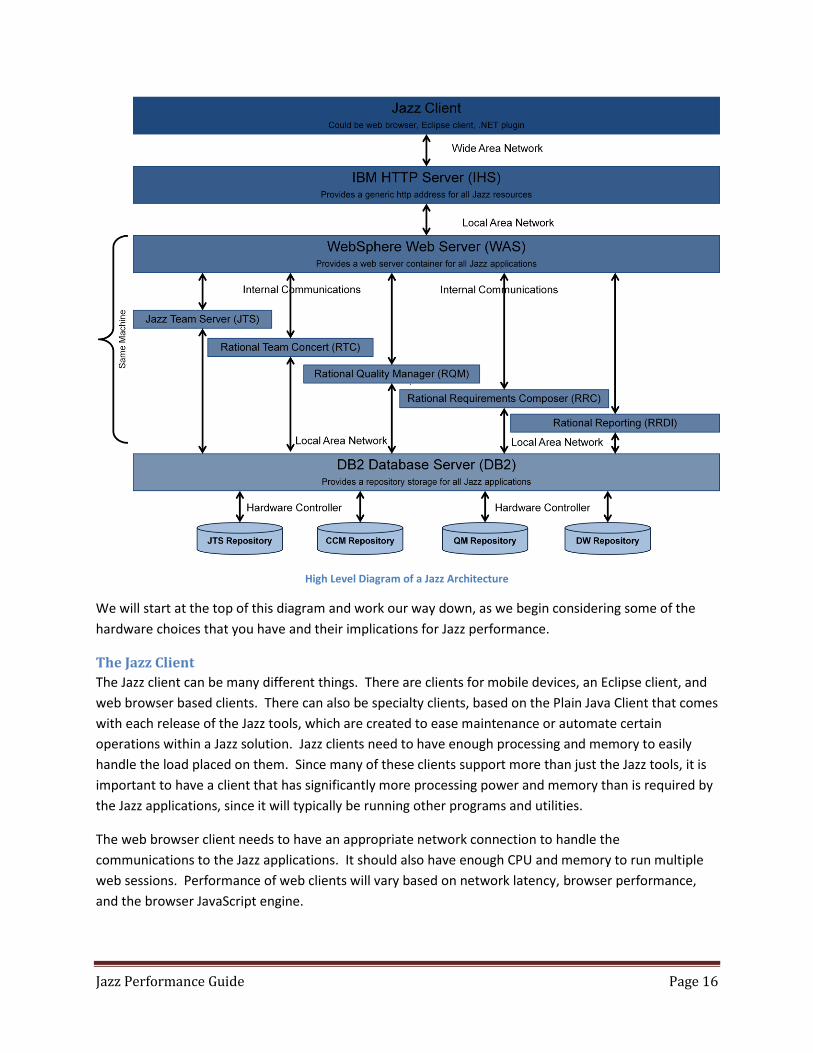
High Level Diagram of a Jazz Architecture
We will start at the top of this diagram and work our way down, as we begin considering some of the
hardware choices that you have and their implications for Jazz performance.
The Jazz Client
The Jazz client can be many different things. There are clients for mobile devices, an Eclipse client, and
web browser based clients. There can also be specialty clients, based on the Plain Java Client that comes
with each release of the Jazz tools, which are created to ease maintenance or automate certain
operations within a Jazz solution. Jazz clients need to have enough processing and memory to easily
handle the load placed on them. Since many of these clients support more than just the Jazz tools, it is
important to have a client that has significantly more processing power and memory than is required by
the Jazz applications, since it will typically be running other programs and utilities.
The web browser client needs to have an appropriate network connection to handle the
communications to the Jazz applications. It should also have enough CPU and memory to run multiple
web sessions. Performance of web clients will vary based on network latency, browser performance,
and the browser JavaScript engine.
Jazz Performance Guide Page 17
The IBM HTTP Server (IHS)
The IHS server accepts all of the traffic bound for the Jazz applications, and routes it to the appropriate
WebSphere (or Tomcat) instance that is hosting a Jazz application. Often the web server will be
configured as a reverse proxy server, and hiding the implementation details of the Jazz application
servers.
Note: For more on reverse proxy servers and setting up a reverse proxy server, see the series of three articles on Jazz.net, “Configuring Enterprise CLM Proxies Part 1”, “Configuring Enterprise CLM Proxies Part 2”, and “Configuring Enterprise CLM Proxies Part3”
The primary issues and concerns with the performance of the IHS server are primarily concerned with
being able to handle the volume of requests coming into it, and the ability to resolve SSH certificates.
The things that you can control that will impact the performance of the Jazz solution are the
specifications of the hardware supporting the IHS server, and the session pool settings in IHS. I suggest
a minimum of 2 CPUs (or 4vCPUs) and 4GB of memory on an IHS server. This amount of resources or
larger is typical in well performing Jazz environments.
The session pool settings should be left at the default values unless there is reason to believe that the
IHS server is impacting performance and the user experience. By default, IHS will support 2000
concurrent connections. When looking at these settings, it has been our experience that defaults are
almost always the best configuration, and the only parameters that in my experience where specific
situations required refinement are the Max Connections and Connection Timeout parameters in IHS.
Note: To learn more about the IHS session pool settings, see the IBM Infocenter for WAS. You may also want to review this technote, which includes performance considerations when IHS fronts the Jazz application server: http://publib.boulder.ibm.com/httpserv/ihsdiag/ihs_performance.html , and
http://www-01.ibm.com/support/docview.wss?uid=swg21167658.
The Jazz Applications and WebSphere (WAS)
I group these two things together because they will reside on the same hardware. The Jazz applications
can be thought of as running inside of a WAS instance. When dealing with Jazz solution performance
issues, most of your investigations will begin here. The logs for the WAS instance and the Jazz
applications will often be the first places where issues may be surfaced. This also happens to be where
most configuration mistakes and poor root cause determinations are made.
Many of the issues are often a result of a poorly configured WebSphere web container and Jazz
application, or insufficient physical resource allocation for this portion of the solution architecture. A
typical node in a distributed enterprise topology will have a single WAS instance supporting a single Jazz
application. It is strongly suggested that you architect your Jazz solution in this way, because it allows
you more flexibility in the following areas:
Performance issues can be isolated and debugged more effectively
Hardware resources can be easily added, if needed
Jazz Performance Guide Page 18
Resources can be moved more easily with no need for using server rename (when used in
conjunction with a reverse proxy)
New server instances can be deployed more easily (since you know the performance, allocation, and
configuration characteristics of your existing well-behaved application instances)
In this straightforward approach, the following guidelines are helpful in determining the hardware
resources to allocate, and for configuring the WAS and Jazz applications:
Allocate at least 2 dual core CPUs per WAS container/Jazz application. If using virtualization,
allocate at least 4 vCPUs.
Have a machine with at least 6GB of memory available, and allocate at least 2GB of this memory to
the JVM inside of WAS. The preferred configuration has a machine with 8GB of memory, with 4GB
of this being assigned to the JVM.
Note: The exception to this is the RRDI application. Due to the heavy load that some organizations can place on the reporting infrastructure, your requirements for CPU and memory may need to increase for your RRDI instance.
If using a virtual machine (VM), make sure that the machine is not over-subscribed. In other words,
make sure that the images running your WAS/Jazz application servers have memory and CPU
allocated to them, and are not sharing it with other VM’s.
Note: Some may ask if using virtual machines is worthwhile, since I suggest not sharing the resources assigned to the WAS/Application VM. I find that it is worthwhile in that it allows you to easily add or remove memory or CPU from a VM, and also provides some portability, since the VM can be moved onto different physical hardware without any configuration changes.
For the JVM, you should use the default settings for WAS. I suggest using the settings indicated in the
Infocenter for the various Jazz products. In most Jazz implementations, IBM suggests use of the
following settings:
-Xmx4G -Xms4G -Xmn512M -Xgcpolicy:gencon -Xcompressedrefs -Xgc:preferredHeapBase=0x100000000 The garbage collection algorithm used above is referred to as gencon, and it will perform optimally for
most situations. In some cases, with particular workloads, it has been found that a modification of the
garbage collection algorithm can be beneficial for performance. For a discussion of the various garbage
collection algorithms and their impact on performance, read Java technology, IBM style: Garbage
collection policies, Part 1 on the IBM Support website.
Jazz Performance Guide Page 19
Note: When allocating memory to the JVM (or JVM’s) on a particular server, a good rule of thumb is that the amount of memory allocated to the JVM’s should be, at most, half of all of the available memory. The system also needs memory for OS related activity and node agent (web server) operations. The settings shown here are a valid starting point for a system that has 8 GB of available memory.
Note: The JVM settings shown above are valid for Windows and Linux servers. Servers with other operating systems may use slightly different settings. It is always best to check the Infocenter: Setting up WebSphere Application Server for the suggested settings. These are here as an example, and to explain the various switches.
The load on the system is determined by the workload, which is variable and depends on the users and
the usage models. Planning your server needs based on concurrent user counts will not be accurate, but
I understand that it is often the only measure that some organizations have available to them.
Note: When doing initial planning for a Jazz deployment, limit concurrent user sessions on any given Jazz instance to the following: RTC 200-500, RQM 100-150, RRC 100-150, JTS 400-2000. PLEASE NOTE THAT THESE ARE “EDUCATED GUESSES”! These are conservative “rule of thumb” estimates. You should base any real planning of hardware resources for the deployment of your Jazz solution on the workload that you see on your system, since workloads for different deployments will vary widely. (For example, systems which handle both builds and SCM – planning activities for RTC may require additional resources in the JVM nursery. One of the best ways to evaluate what JVM settings are applicable is to monitor the JVM heap while under load.)
Note: RRC must share a repository with the JTS. This does not mean that they need to reside on the same WAS instance. For versions prior to RRC 4.0.1, an upper limit of 200 concurrent users per RRC instance is a good rule of thumb. For RRC 4.0.1 and beyond, an upper limit of 400 concurrent users per RRC instance is a good rule of thumb. Another good rule of thumb is not to exceed 200 projects on a single Jazz application server.
The Database Server
The database server is the portion of most Jazz solutions that is often out of the control of most solution
architects and Jazz administrators. Often the choice of database vendor will be a corporate directive,
and you will be told the database technology that you will be using. If you decide to support your own
database, you can choose the database technology that you want. Keep in mind that Jazz licenses also
carry an entitlement for the use of DB2 Workgroup edition as part of the Jazz licensing agreement.
However, there are some general things that you can do to help improve the performance of your Jazz
solution. These suggestions are valid for all of the database technologies that support Jazz.
Jazz Performance Guide Page 20
Make sure that your database has sufficient physical memory and enough allocated memory to
perform a lot of data transfers. All of the REST based objects will need to be stored and retrieved
here, and the rest of the solution architecture depends on the repository. Don’t try to cut costs,
make sure that the foundation for your solution is solid.
Your database should be on a dedicated server. While it is technically possible to install the
database software onto the same machine as other software, the load on the database is heavy
(since almost every user action implies multiple database events, like queries, inserts, or
modifications). Deploy the database on a dedicated database server.
The storage device for the database is also important. The database storage should be fast storage.
The server should have many fast disks combined in a RAID configuration for optimal performance
and reliability. See jazz.net article entitled, “Tuning the Rational Team Concert 3.0 Server”, for
further details.
Monitor the performance of your database. Do not go overboard with monitoring, since excessive
monitoring can lead to performance degradation of the database software. Monitor the amount of
data (inbound and outbound), the number of queries over time, and some measure of the amount
of time from the receipt of a SQL request to the time a response is generated.
The Network
The key performance indicator for a network is speed. Bandwidth is only a concern if the lack of
bandwidth causes a reduction in speed. The key thing to find out is if your organization monitors it’s
network, and find out if there is any way to review the monitoring data in order to indentify bottlenecks.
Often a slowdown in Jazz performance can be traced to a general network slowdown. The ability to
access the network performance data will help you determine if the network is having an adverse
impact on the CLM solution performance, and also help you eliminate network issues when
troubleshooting problems.
The LDAP Server
Most Jazz architects and administrators will have no control over the LDAP configuration used to
support identity authentication. You should just monitor the connectivity to the LDAP resources
provided, and make sure that you have an established procedure for onboarding new users of the Jazz
solution. This planning will allow you to make allowances for any corporate procedures surrounding
changes to LDAP.
Virtualization
Virtualization can cause major performance issues with Jazz solutions when it is improperly
implemented. When used properly, it can provide great benefits in terms of scalability and
maintenance. Below, the good, bad and ugly are described.
Good Virtualization
Good virtualization occurs when Jazz servers are deployed in virtual machines (VMs) that have sufficient
resources (as described earlier) allocated to them. A proper allocation of memory, vCPUs, and disk is
essential. In addition, the total amount of virtual resources on a particular physical machine should not
exceed the physical resources available.
Jazz Performance Guide Page 21
What is meant by that last statement, “…the total amount of virtual resources on a particular physical
machine should not exceed the physical resources available”? An example might help. Assume a large
physical server with 8 quad core CPU’s (for a total of 32 cores), and 64 GB of memory. In an
environment where the total amount of virtual resources is more than the physical resources we might
have some 20 different virtual machines, with each machine being allocated 4 cores, and 8 GB of
memory. Some simple math shows that these virtual machines have a total number of resources
equaling 80 cores (4 cores x 20 machines, which is more than the 32 cores available). More simple math
shows that the virtual machines have 160 GB of memory allocated to them, which is more than the 64
GB available on the physical hardware. This is a situation that some term as being “over subscribed”.
Note: Be careful when talking about CPU’s and virtual machines. Most of us talk about CPU’s, while virtual machines focus on cores. Since most physical machines contain CPUs which are dual core (or even quad core). A single CPU will often represent multiple cores. When allocating computing resources on a virtual machine, you will allocate vCPU’s. Each vCPU represents a single core. So it would take 2 vCPU’s to simulate the processing power of a single dual core CPU.
In a good environment, the physical hardware above would be expected to host no more than 8
machines, each with 4 cores and 8 GB allocated to the virtual instance. Even in this situation, the
hypervisor may need to do some context switching (since the hypervisor itself needs processing power
and memory), but the amount of that would be minimal.
So why use virtualization with your Jazz solution? Virtualization allows you to easily grow your Jazz
servers if the need arises. Assume you have allocated the 4 cores and 8 GB of memory discussed above.
If you determine that you need more JVM heap space, and you would like to maintain the even split
between JVM memory and system memory, then you would need to allocate more memory to the Jazz
server. If this was a physical machine, you would need to determine if more memory can be installed,
and then order and install the additional memory. With a virtual machine, you merely need to allocate
more memory resource to the virtual machine.
What if allocating more memory leads you to become over subscribed? Here is where virtualization
shows it’s other benefit. You can still allocate more memory to your Jazz server. Due to the portability
of virtual machines, you can then move one or more of the existing virtual machines to another piece of
hardware. This allows you to easily move the physical location of your virtual machines, without
impacting the logical organization of you Jazz servers. Machines can keep their URL/URI, while being
physically moved around, allowing you to avoid having to do a server rename operation. This allows you
to have a highly flexible Jazz implementation and, when coupled with a reverse proxy, allows you to hide
the implementation details from your end users.
Bad Virtualization
Bad virtualization follows all of the characteristics of the good virtualization described above. It is
different though, because the administrator forgot about disk I/O and network bandwidth. In our good
example above, with 8 VMs running on the same physical hardware, if the network connection is shared
between all VMs, then each is getting roughly 1/8 of the normal network bandwidth. This can have an
incredible impact on Jazz performance.
Jazz Performance Guide Page 22
Disk I/O is important too. Jazz applications in a good architecture, with a separate database server
hosting the application repositories, will still need to perform reads and writes to their local disk. Some
of this is due to the indexing used to provide quicker access to artifacts. Often virtual machines will
share disk I/O controllers, which runs into the same issues encountered with sharing network
bandwidth.
Ugly Virtualization
Jazz machines are one of literally hundreds of active servers that have been virtualized on a single
physical machine. The physical machine does not have the resources to service more than half of the
virtualized machines simultaneously. In this case the hypervisor spends all of it’s time swapping active
machines into the active state, and then back out again as other machines queue up for the resources.
In this scenario, the Jazz server CPU may not show as being fully utilized, but that is because requests
have been dropped due to a lack of response.
The Operating Systems
Jazz works on a variety of operating systems. Some people will suggest that one operating system will
perform better than another, but a typical Jazz solution, with sufficient hardware and network
resources, will not show noticeable performance differences based on the operating system deployed.
A Jazz administrator should take care to keep the operating system properly patched, and make sure
that they have left sufficient memory for OS operations (like network communications and file
manipulation) when allocating memory to the JVM that hosts the Jazz application. I suggest leaving half
of the available memory on the machine hosting the Jazz application allocated to the OS, and the other
half allocated to the JVM supporting the Jazz application.
Conclusions This section of the document includes observations regarding the impact of hardware and software
configurations on the systems supporting the Jazz infrastructure.
It is important to keep in mind that there is no single “right” configuration for a Jazz solution. Different
organizations will have different usage models, different workloads, different processes, and different
software development cultures. In addition, the people using the Jazz infrastructure will change over
time. There may be new employees, new processes, and more efficient ways of doing things.
However, while every Jazz solution will be unique, and have its own characteristics, the general concepts
should hold true. It is important to have an idea of some of the characteristics of how Jazz provides its
capabilities, so future scaling needs can be better anticipated.
It is also important to keep in mind that Jazz performance is dependent on a number of different
variables. When dealing with Jazz deployments, you may make tuning changes which will greatly
improve performance, which you do not see immediate results from. That is because other areas of
your solution architecture are throttling performance.
Jazz Performance Guide Page 23
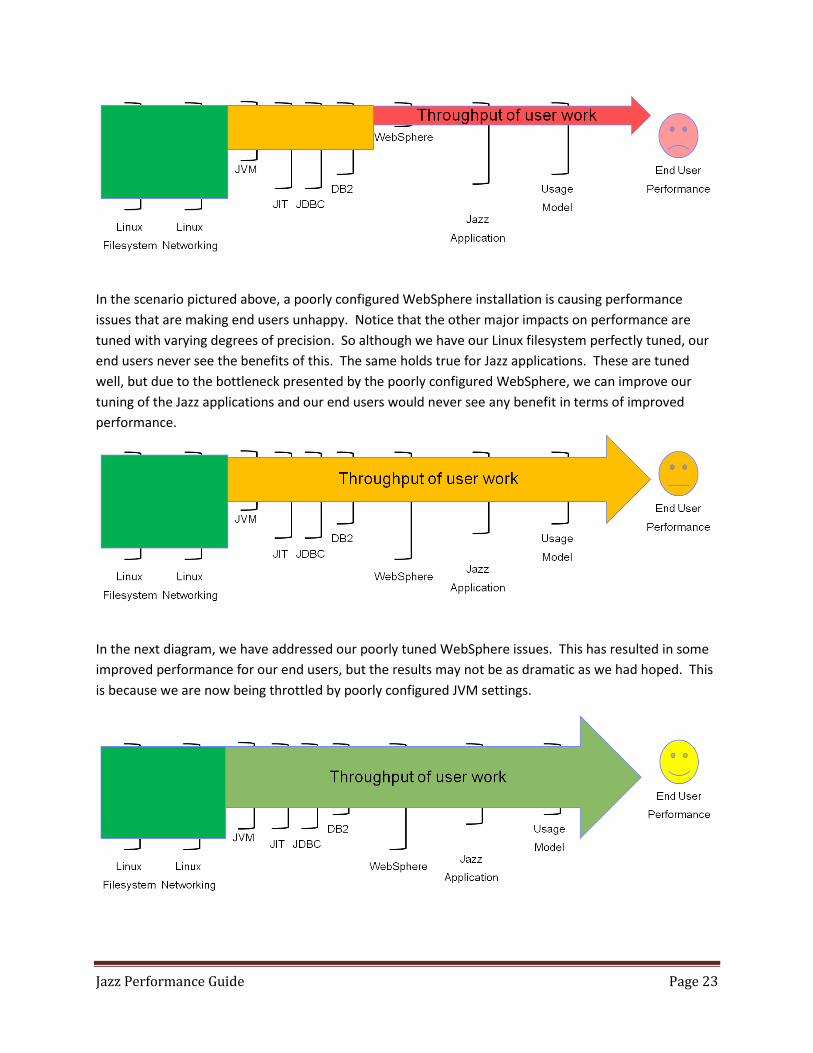
In the scenario pictured above, a poorly configured WebSphere installation is causing performance
issues that are making end users unhappy. Notice that the other major impacts on performance are
tuned with varying degrees of precision. So although we have our Linux filesystem perfectly tuned, our
end users never see the benefits of this. The same holds true for Jazz applications. These are tuned
well, but due to the bottleneck presented by the poorly configured WebSphere, we can improve our
tuning of the Jazz applications and our end users would never see any benefit in terms of improved
performance.
In the next diagram, we have addressed our poorly tuned WebSphere issues. This has resulted in some
improved performance for our end users, but the results may not be as dramatic as we had hoped. This
is because we are now being throttled by poorly configured JVM settings.
Jazz Performance Guide Page 24
So once we address the poorly configured JVM, we realize additional improvements in performance, and
our end users appear to be satisfied. At this point, if we wanted to further improve performance, we
would need to address the bottlenecks in both DB2 and our usage model (the way that we use the Jazz
applications). These are often the toughest scenarios to deal with, since isolated changes seem to have
either no impact, or a negative impact. When you see this happening in your environment, then you
should believe that you have multiple chokepoints.
The key thing to remember is that as you relieve pressure from one area of the architecture, you will
increase the pressure on other areas. So if we increase the throughput at the web server layer, we end
up putting more pressure on the backend database, since more requests are now passing through to
this layer within any given time period. I have heard it compared to a balloon filled with water, as you
squeeze one end, the other end expands.
When working on Jazz solution performance, realize that at some point you will reach a point of
diminishing returns. Tune your various areas of the architecture for best performance, but also realize
when it is time to stop tuning, and time to scale with more infrastructure and/or Jazz application
instances.
Jazz Performance Guide Page 25
Monitoring the Health of Your Jazz Implementation The best way to ensure the reliability and continued high performance of you Jazz solution is to monitor
the performance of the solution infrastructure. The key here is to measure both end user perceived
performance, as well as some key performance metrics of the individual pieces of the Jazz solution, so
you can build up knowledge on what the key performance indicators are for YOUR specific environment.
This article is just a guide. It is meant as a solid starting point for the deployment and monitoring of
your Jazz solution. We expect that as time goes on, your monitoring focus will shift, as you learn the
unique properties and predictive performance metrics that apply to your solution.
Monitoring Tools This is a brief introduction to some of the monitoring tools that we have seen in Jazz implementations.
This list does not imply any support for, or endorsement of, these tools and technologies. It is provided
as a quick introduction to these technologies, so you have an idea of the capabilities and intended uses
of these various technologies.
Tivoli APM – The IBM/Tivoli tools offer IM Application Performance Management (APM), a tool
that allows you to monitor the performance of your various applications. For more information
on APM, see the IBM Website for more details.
DB2 stats: This information will provide details related to queries and the CPU consumption.
Statistics will be kept in the cache until cleared. This information will help you understand which
queries take the most CPU usage and we can evaluate if the queries require optimization. It also
allows us to potentially identify where indexes may be used to help improve database
performance.
o From WAS – an external look at DB2 execution, it measures request/response times
from the Jazz Application
o From DB2 – an internal look at the performance and audit data
JazzMon: Analysis of RTC internal process execution. This information may be compared against
Jazz.Net as well as help provide trend analysis at a server level. Although it can be used across
servers, you will need to ensure the server topology and workload patterns are the same, as
different instances may show different patterns.
WebSphere PMI: PMI may be used to help monitor the WAS webserver container and evaluate
thread pool usage count. PMI can be set up to measure multiple things in the application
container, and I make some good starting suggestions later in this guide.
WAIT: Pinpoint bottlenecks in workloads with a central Java component. (Input is one or more
java core files. Gathering java cores can impact the performance of the server, and should only
be completed to target critical performance related issues.) See
http://snappy.watson.ibm.com/wait/, and http://dtoczala.wordpress.com/2012/03/30/jazz-
performance-part-4-why-wait-see-what-your-jazz-server-is-doing/.
Jazz Performance Guide Page 26
MustGather: Must gather provides monitoring details for WebSphere, WAIT data, as well as
pertinent traces, logs and java cores. More details regarding MustGather may be found here:
WAIT
Firebug: Allows one to inspect, edit and monitor CSS, HTML, JavaScript and Net requests in any
web page. (This helps monitor specific actions that are slow for users via web clients)
HTTP Watch: Allows one to inspect and monitor CSS, HTML, JavaScript and Net requests in any
web page (See tool at http://www.httpwatch.com/). HTTP Watch which will work with both
Internet Explorer and Firefox web browsers.
Suggested Monitoring Techniques This section contains some of the suggested monitoring settings to use with the various pieces of the
Jazz infrastructure. As monitoring tools are added to the list above, the basic settings should be
updated in this section. What follows is a example of what can be monitored, as other key performance
indicators are discovered, I anticipate that this section will be updated.
Tivoli APM Monitoring
I have no guidance on this, and would really like to see it working smoothly in a real production system.
Once I see it working effectively in a real production environment, then I will be glad to share my
experiences.
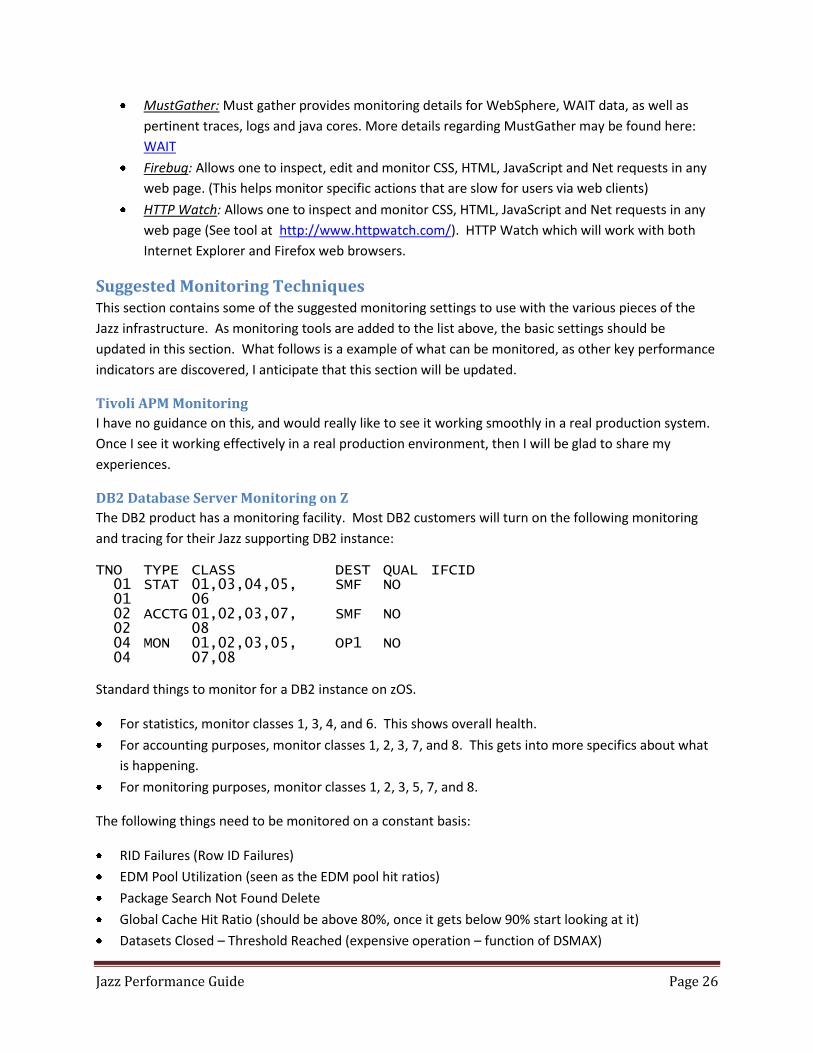
DB2 Database Server Monitoring on Z
The DB2 product has a monitoring facility. Most DB2 customers will turn on the following monitoring
and tracing for their Jazz supporting DB2 instance:
TNO TYPE CLASS DEST QUAL IFCID 01 STAT 01,03,04,05, SMF NO 01 06 02 ACCTG 01,02,03,07, SMF NO 02 08 04 MON 01,02,03,05, OP1 NO 04 07,08 Standard things to monitor for a DB2 instance on zOS.
For statistics, monitor classes 1, 3, 4, and 6. This shows overall health.
For accounting purposes, monitor classes 1, 2, 3, 7, and 8. This gets into more specifics about what
is happening.
For monitoring purposes, monitor classes 1, 2, 3, 5, 7, and 8.
The following things need to be monitored on a constant basis:
RID Failures (Row ID Failures)
EDM Pool Utilization (seen as the EDM pool hit ratios)
Package Search Not Found Delete
Global Cache Hit Ratio (should be above 80%, once it gets below 90% start looking at it)
Datasets Closed – Threshold Reached (expensive operation – function of DSMAX)
Jazz Performance Guide Page 27
Timeouts and Deadlocks – should be close to 0
Lock Escalations – should be close to 0
Connection Rejections – should be close to 0
Short on Storage – should be 0
Buffer Pool Concurrence Parallelism – all of these should be close to 0
Pre-fetch disabled – No Read Engine – should be 0
For more details and specific information on DB2 v9 monitoring on z/OS, see “DB2 V9.1 for z/OS
Command Reference” at http://www-01.ibm.com/support/docview.wss?uid=pub1sc18984406. For
details and specific information on DB2 v10 monitoring on z/OS, see “DB2 V10 for z/OS Command
Reference” at http://www-01.ibm.com/support/docview.wss?uid=pub1sc19297204.
JazzMon Monitoring
JazzMon is a tool used to determine the frequency and relative length of time involved with a variety of
Jazz application services. JazzMon is invoked at the command line to collect data from the Jazz
application servers. Since it can be run from the command line, launching it should be scripted. These
scripts should run on some OS scheduler, and the tool should be collecting data every day.
Data collections are named with a naming convention, with the host system, date and time on the
resulting zip file. JazzMon parameters should been set to pull data from the JTS, CCM, QM, and RM
instances. A good sample interval to use for collection is every 15 minutes. WinZip is used to zip up the
files, which are located on machine where the JazzMon utility is installed. Because JazzMon uses http to
communicate with the Jazz applications, there is no need to install any additional software on the Jazz
infrastructure. JazzMon can just be installed on the administrators own machine.
JazzMon reports are useful when compared with other JazzMon reports. The Jazz Administrator can
look at reports from different time periods, and compare the relative call frequency, as well as the
average run times, of the Jazz services that are most frequently used. A sharp increase in the utilization
of a particular Jazz service may indicate a significant change in the usage patterns of the users working
within that Jazz application. Because this historical comparison can be useful, it is recommended that
JazzMon data be kept for a significant length of time (preferably a year), but results can be stored
anywhere (they do not need to remain on the machine on which they were run).
JazzMon reports will not indicate a root cause for any performance problem, and will rarely be useful in
determining application performance as a root cause. What they are useful for is in the characterization
of the workload on a particular Jazz application, and can be helpful when looking for areas to debug
when performance issues have been isolated to the Jazz application.
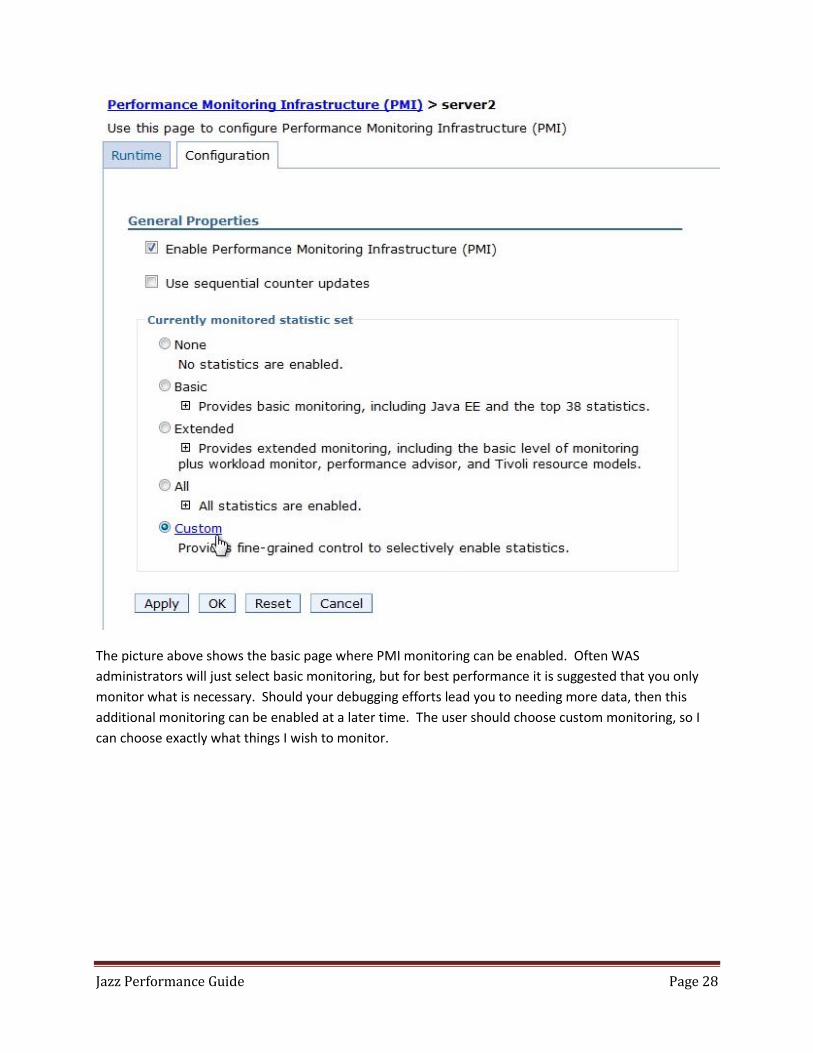
WebSphere Application Server Monitoring
The WAS product has a monitoring facility known as Performance Monitoring Infrastructure (PMI),
which can be accessed by a WAS administrator. The following settings are IBM suggested things to
monitor with WAS.
Jazz Performance Guide Page 28
The picture above shows the basic page where PMI monitoring can be enabled. Often WAS
administrators will just select basic monitoring, but for best performance it is suggested that you only
monitor what is necessary. Should your debugging efforts lead you to needing more data, then this
additional monitoring can be enabled at a later time. The user should choose custom monitoring, so I
can choose exactly what things I wish to monitor.
Jazz Performance Guide Page 29
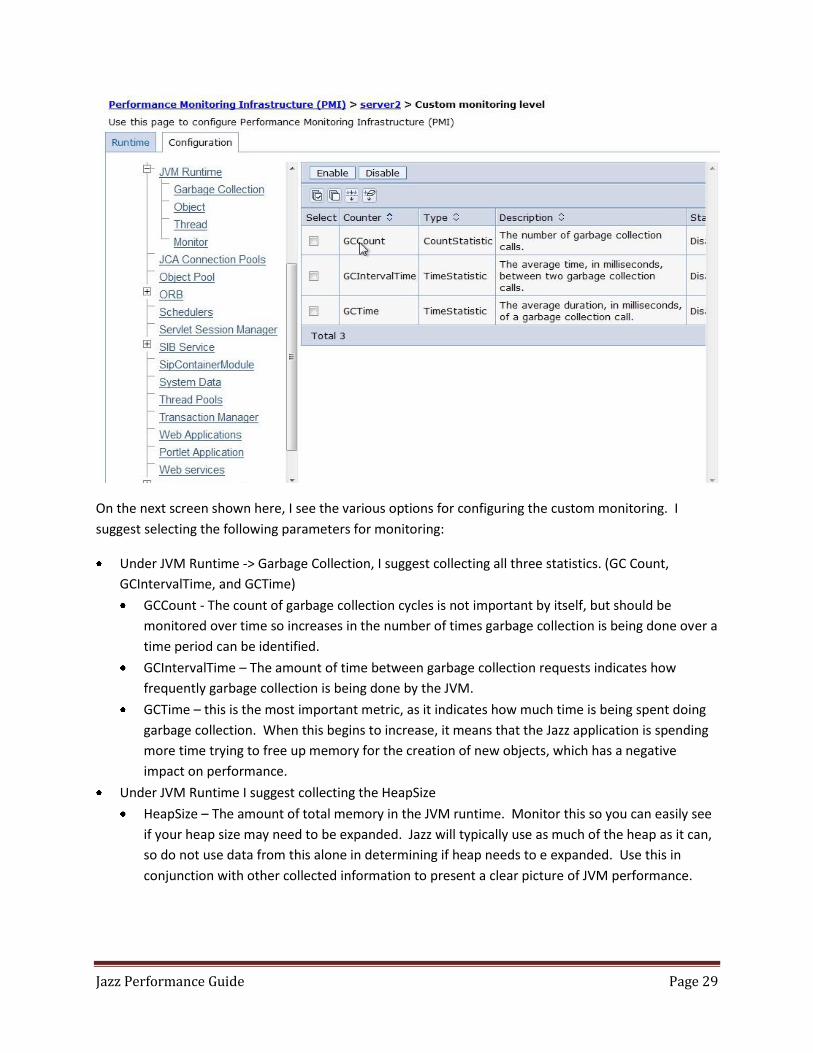
On the next screen shown here, I see the various options for configuring the custom monitoring. I
suggest selecting the following parameters for monitoring:
Under JVM Runtime -> Garbage Collection, I suggest collecting all three statistics. (GC Count,
GCIntervalTime, and GCTime)
GCCount - The count of garbage collection cycles is not important by itself, but should be
monitored over time so increases in the number of times garbage collection is being done over a
time period can be identified.
GCIntervalTime – The amount of time between garbage collection requests indicates how
frequently garbage collection is being done by the JVM.
GCTime – this is the most important metric, as it indicates how much time is being spent doing
garbage collection. When this begins to increase, it means that the Jazz application is spending
more time trying to free up memory for the creation of new objects, which has a negative
impact on performance.
Under JVM Runtime I suggest collecting the HeapSize
HeapSize – The amount of total memory in the JVM runtime. Monitor this so you can easily see
if your heap size may need to be expanded. Jazz will typically use as much of the heap as it can,
so do not use data from this alone in determining if heap needs to e expanded. Use this in
conjunction with other collected information to present a clear picture of JVM performance.
Jazz Performance Guide Page 30
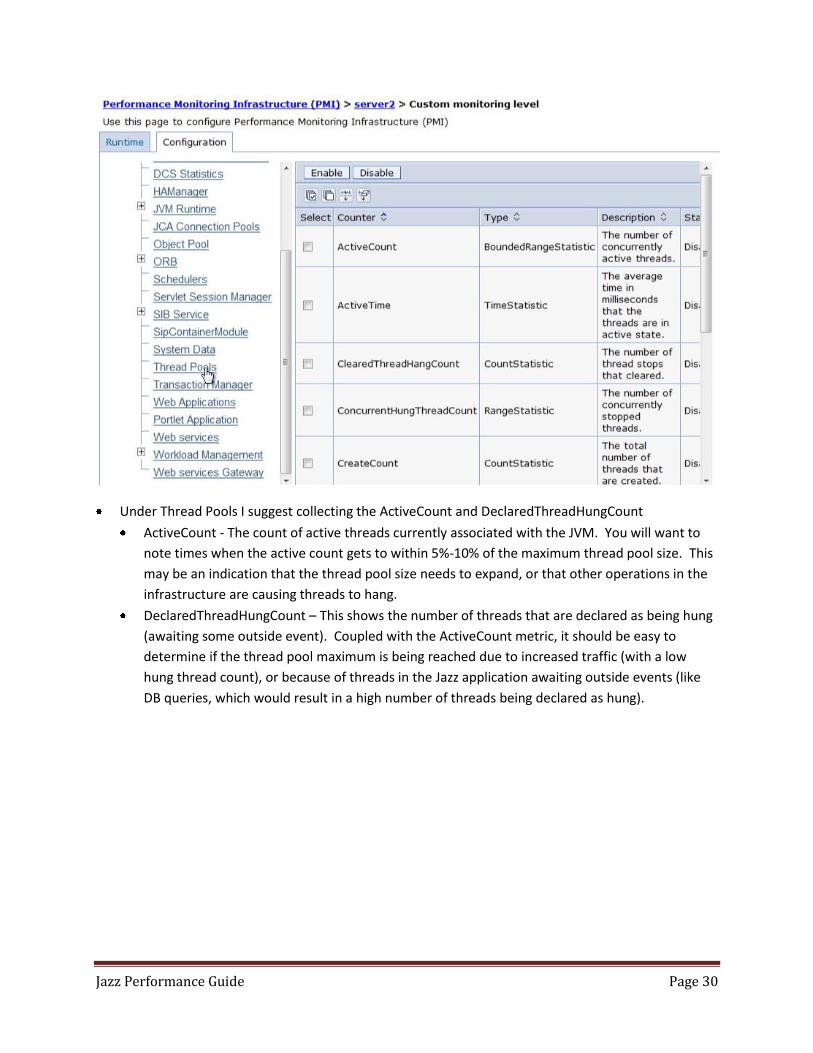
Under Thread Pools I suggest collecting the ActiveCount and DeclaredThreadHungCount
ActiveCount - The count of active threads currently associated with the JVM. You will want to
note times when the active count gets to within 5%-10% of the maximum thread pool size. This
may be an indication that the thread pool size needs to expand, or that other operations in the
infrastructure are causing threads to hang.
DeclaredThreadHungCount – This shows the number of threads that are declared as being hung
(awaiting some outside event). Coupled with the ActiveCount metric, it should be easy to
determine if the thread pool maximum is being reached due to increased traffic (with a low
hung thread count), or because of threads in the Jazz application awaiting outside events (like
DB queries, which would result in a high number of threads being declared as hung).
Jazz Performance Guide Page 31
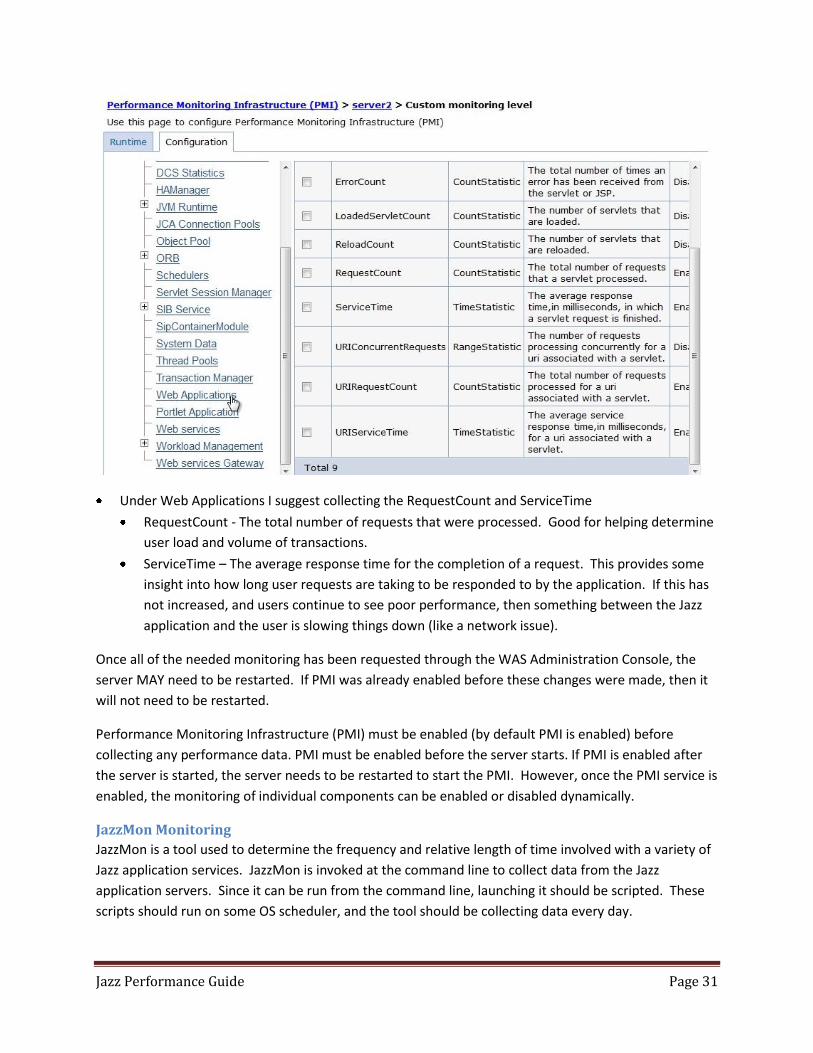
Under Web Applications I suggest collecting the RequestCount and ServiceTime
RequestCount - The total number of requests that were processed. Good for helping determine
user load and volume of transactions.
ServiceTime – The average response time for the completion of a request. This provides some
insight into how long user requests are taking to be responded to by the application. If this has
not increased, and users continue to see poor performance, then something between the Jazz
application and the user is slowing things down (like a network issue).
Once all of the needed monitoring has been requested through the WAS Administration Console, the
server MAY need to be restarted. If PMI was already enabled before these changes were made, then it
will not need to be restarted.
Performance Monitoring Infrastructure (PMI) must be enabled (by default PMI is enabled) before
collecting any performance data. PMI must be enabled before the server starts. If PMI is enabled after
the server is started, the server needs to be restarted to start the PMI. However, once the PMI service is
enabled, the monitoring of individual components can be enabled or disabled dynamically.
JazzMon Monitoring
JazzMon is a tool used to determine the frequency and relative length of time involved with a variety of
Jazz application services. JazzMon is invoked at the command line to collect data from the Jazz
application servers. Since it can be run from the command line, launching it should be scripted. These
scripts should run on some OS scheduler, and the tool should be collecting data every day.
Jazz Performance Guide Page 32
Data collections are named with a naming convention, with the host system, date and time on the
resulting zip file. JazzMon parameters should been set to pull data from the JTS, CCM, QM, and RM
instances. A good sample interval to use for collection is every 15 minutes. WinZip is used to zip up the
files, which are located on machine where the JazzMon utility is installed. Because JazzMon uses http to
communicate with the Jazz applications, there is no need to install any additional software on the Jazz
infrastructure. JazzMon can just be installed on the administrators own machine.
JazzMon reports are useful when compared with other JazzMon reports. The Jazz Administrator can
look at reports from different time periods, and compare the relative call frequency, as well as the
average run times, of the Jazz services that are most frequently used. A sharp increase in the utilization
of a particular Jazz service may indicate a significant change in the usage patterns of the users working
within that Jazz application. Because this historical comparison can be useful, it is recommended that
JazzMon data be kept for a significant length of time (preferably a year), but results can be stored
anywhere (they do not need to remain on the machine on which they were run).
JazzMon reports will not indicate a root cause for any performance problem, and will rarely be useful in
determining application performance as a root cause. What they are useful for is in the characterization
of the workload on a particular Jazz application, and can be helpful when looking for areas to debug
when performance issues have been isolated to the Jazz application.
Using WAIT to Capture Performance Issues
For an example of using WAIT to capture performance issues, see the blog posting, “Jazz Performance
Part 4 – Why WAIT, see what your Jazz server is doing”.
Using HTTP Watch
For an example of using HTTP Watch to monitor web browser performance, see the blog posting, “Jazz
Performance Part 5 – Keep an http watch on your Jazz Server”.
Jazz Performance Guide Page 33
General Performance Monitoring Many organizations do not begin to put a monitoring plan into place until they begin having
performance issues. A “reactive” approach to analyze performance problems is problematic, because
you don’t have a baseline of good data to compare to. It really just allows you to make a more educated
guess about your performance issues, since you do have actual data – you just don’t have anything to
compare and contrast it against. A reactive approach will attempt to evaluate the cause after the fact.
Details may be stale at best or may not be available. Users are frustrated, and have already begun to
classify issues incorrectly. Administrators feel helpless and overwhelmed. The entire dynamic is full of
negative energy, frustration, and misinformation.
It is best if monitoring is implemented along with the Jazz solution. When debugging and looking at
performance issues in any environment, the availability of historical data is critical. We have all been in
situations where user complaints are vague, or ill defined. We have all been in situations where
someone has said, “Performance seemed to decline about a month ago… or two months ago. I’m really
not sure”. In these cases, objective historical data can be used to help pinpoint specific inflection points.
I try to be very careful when I go down this path of reasoning. People will hear my statement of,
“Believe the data”, and will immediately leap to the conclusion that I have meant, “Don’t trust the
users”. This is wrong. The perceived user performance is EXACTLY the thing that we want to monitor
and have a positive impact upon. You need to balance the subjective nature of user reported
performance issues, with the objective data collected from a well monitored environment. Keep in
mind that monitoring is not the goal – the goal here is to:
Have the ability to intelligently address and respond to user reported performance issues in the Jazz
environment.
Have to ability to detect and proactively address performance and availability issues in the Jazz
environment
Have the ability to extrapolate current usage patterns to make intelligent assumptions and
predictions of future infrastructure needs
In order to do this effectively, I tend to break the situations and tasks faced by a Jazz administrator into
two major categories. The first is the “reactive” category. In the reactive category, the Jazz
administrator is responding and reacting to an unexpected issue in the Jazz environment. Typically this
is in response to a user reported issue with the Jazz solution.
If I continue down the “reactive” path, my first goal is to try and gather as much data as possible and
correlate potential data patterns. From these data patterns I may be able to isolate usage patterns that
impact performance, network topology – configuration, and potential application limitations which have
an effect on performance. I can now narrow my search, and begin to eliminate portions of the
architecture as potential root causes.
Jazz Performance Guide Page 34
One of the best mechanisms that I have found is to attempt to identify specific end user actions that are
ill performing. In the past, I have received information that performance often degrades during large
build processes by the remote development teams. I have also received details that when large files
(virtual machine images) are downloaded in a particular location, that the location would experience
poor performance. The ability to recreate these issues, or predict their occurrence, allows me to collect
additional data that can be extremely valuable for the determination of root causes, and the debugging
of these issues.
Once you have the root cause, you can think about how to address the issue. The way that you address
issues can take many forms. In could result in system tuning, allocation of additional hardware
resources, changes to the usage models, infrastructure upgrades, or just user education. Often it will be
a combination of these things.
The second major category is what I call the “proactive” category. In the proactive category we look at
trends in the historical data, to help us identify areas of the infrastructure that may be reaching
capacity, and to help predict where future performance issues may arise, or where additional hardware
may need to be allocated.
The proactive category is much slower paced, and not as immediate as the reactive category. It is just as
important (and some would argue that it is MORE important). You want to be able to identify key
performance indicators in your environment, and detail how to avoid problems before they occur. Since
most organizations budget hardware growth on an annual basis, the proactive activity becomes even
more important, as the data is used to justify the budget for additional hardware resources, middleware
upgrades, and other capital expenditures.
The following two sections focus on both proactive and reactive monitoring.
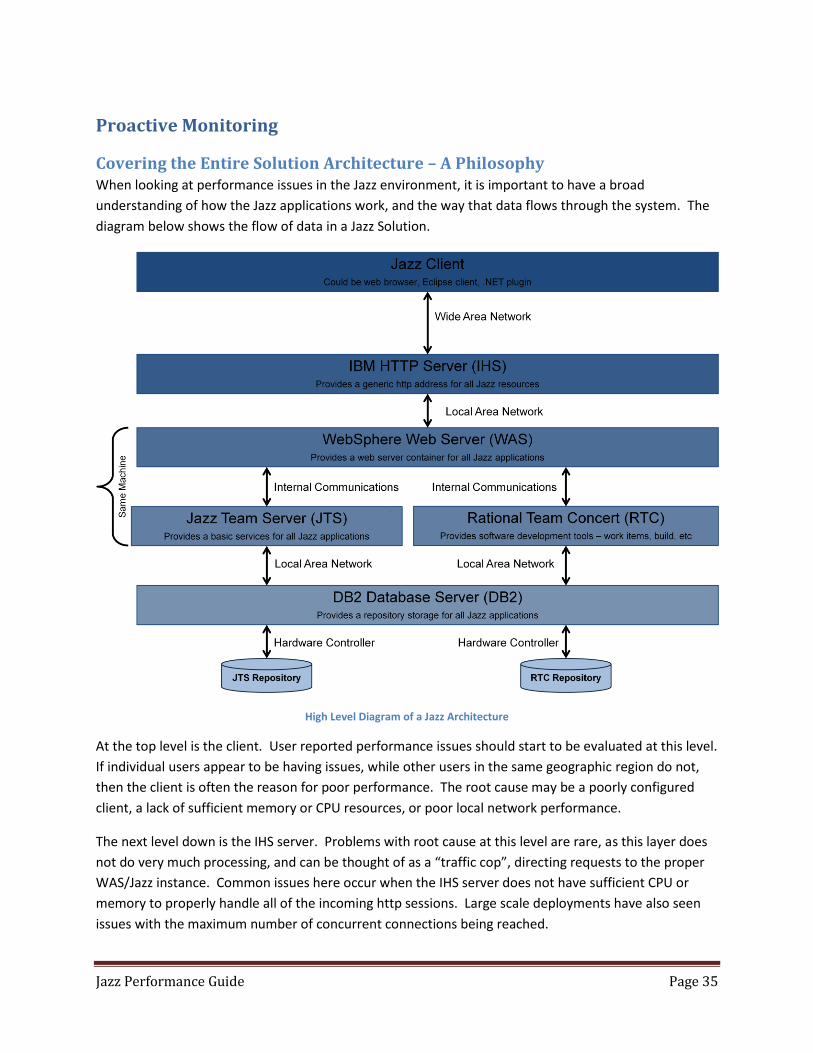
Jazz Performance Guide Page 35
Proactive Monitoring
Covering the Entire Solution Architecture – A Philosophy When looking at performance issues in the Jazz environment, it is important to have a broad
understanding of how the Jazz applications work, and the way that data flows through the system. The
diagram below shows the flow of data in a Jazz Solution.
High Level Diagram of a Jazz Architecture
At the top level is the client. User reported performance issues should start to be evaluated at this level.
If individual users appear to be having issues, while other users in the same geographic region do not,
then the client is often the reason for poor performance. The root cause may be a poorly configured
client, a lack of sufficient memory or CPU resources, or poor local network performance.
The next level down is the IHS server. Problems with root cause at this level are rare, as this layer does
not do very much processing, and can be thought of as a “traffic cop”, directing requests to the proper
WAS/Jazz instance. Common issues here occur when the IHS server does not have sufficient CPU or
memory to properly handle all of the incoming http sessions. Large scale deployments have also seen
issues with the maximum number of concurrent connections being reached.
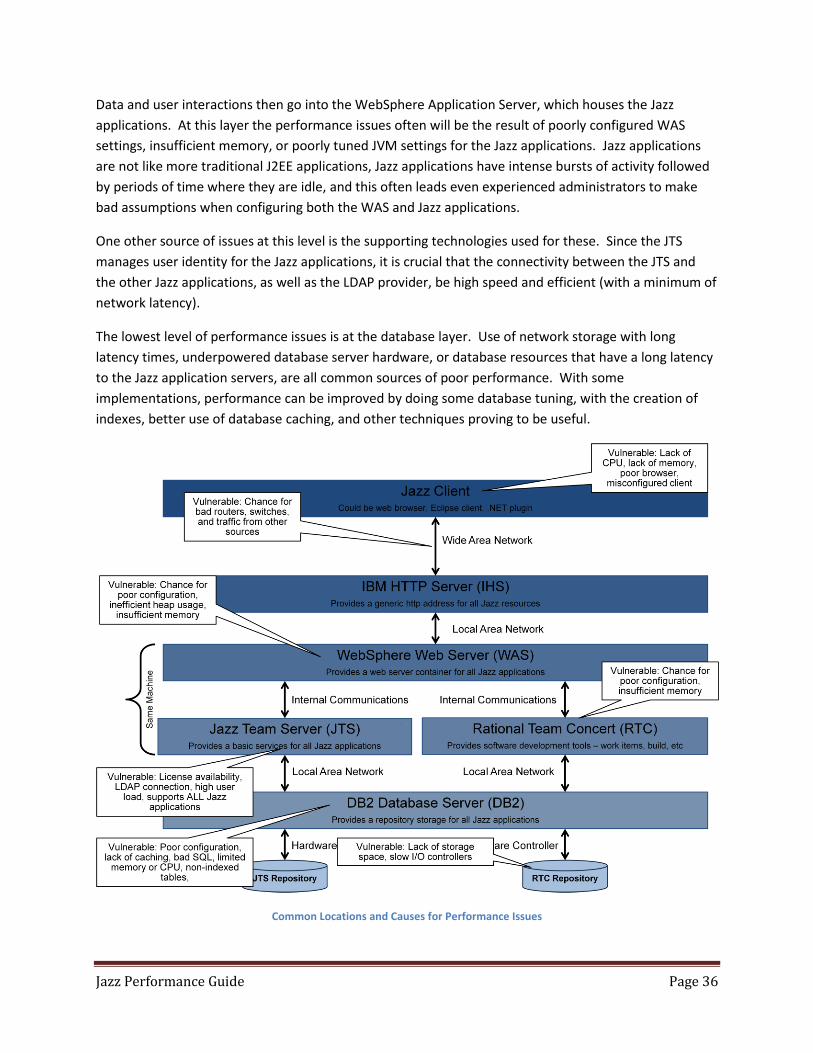
Jazz Performance Guide Page 36
Data and user interactions then go into the WebSphere Application Server, which houses the Jazz
applications. At this layer the performance issues often will be the result of poorly configured WAS
settings, insufficient memory, or poorly tuned JVM settings for the Jazz applications. Jazz applications
are not like more traditional J2EE applications, Jazz applications have intense bursts of activity followed
by periods of time where they are idle, and this often leads even experienced administrators to make
bad assumptions when configuring both the WAS and Jazz applications.
One other source of issues at this level is the supporting technologies used for these. Since the JTS
manages user identity for the Jazz applications, it is crucial that the connectivity between the JTS and
the other Jazz applications, as well as the LDAP provider, be high speed and efficient (with a minimum of
network latency).
The lowest level of performance issues is at the database layer. Use of network storage with long
latency times, underpowered database server hardware, or database resources that have a long latency
to the Jazz application servers, are all common sources of poor performance. With some
implementations, performance can be improved by doing some database tuning, with the creation of
indexes, better use of database caching, and other techniques proving to be useful.
Common Locations and Causes for Performance Issues
Jazz Performance Guide Page 37
Daily Monitoring and Health Assessment This section outlines activities for monitoring and analyzing the health of the Jazz solution environment
on a daily basis. It serves as a starting point for the diagnosis and root cause determination of any
problems in the environment, but is not meant to be used to provide guidance for in-depth debugging of
the specific components in the environment.
Step 1 - Initial Analysis of Data
Initial analysis of data will begin by collecting the data from the various monitoring tools at your
disposal. Since this is often a repetitive and mechanical process, it should be automated. The key here
is to pull all of your data together into one single location, so you can easily compare and correlate data
from your various monitoring systems.
The key data to collect, and to pay attention to, is data that simulates the user experience. There are
various tools that will measure the length of time needed to perform certain user actions in a Jazz
environment. If these tools are not available to you, you can script something to do this for yourself.
Using the REST API you can run sessions throughout that day that measure the response time for a
particular scenario of events. One good scenario to try is to follow this scenario for each of your
deployed Jazz applications:
Simulate a user login
Navigate to a test project
Run a query on the test project
Get a single work item from the project
Log out
You should be able to do this for any Jazz application, just choose an appropriate context, and make sure
that you have a small test project on each Jazz application instance. The test project should be small,
since we are testing response times and not load. The other users in the environment will provide a
variable load throughout the day, and you may see your response times vary based on this load. We
suggest running this monitoring task (sometimes called a synthetic transaction) once every 5 or 10
minutes throughout the day, and saving the time to execute each step, so you can get a pattern of Jazz
solution performance throughout the day. If you have multiple sites of end users, try to run these from
each site of significance.
This data should be reviewed for spikes, with the threshold for attention based on the service level
agreements (SLAs) and the culture of your organization. Due to the differences in latency and
infrastructure, the baseline of performance for each site will be different. As time goes on, and
experience with the tool improves, individual thresholds for each location may be considered.
Putting this data into a spreadsheet, and differentiating response times based on location and time of
day, allows an administrator to easily visualize the end user perceived performance throughout the day.
It allows you to compare different locations, and to notice times where performance consistently seems
to degrade.
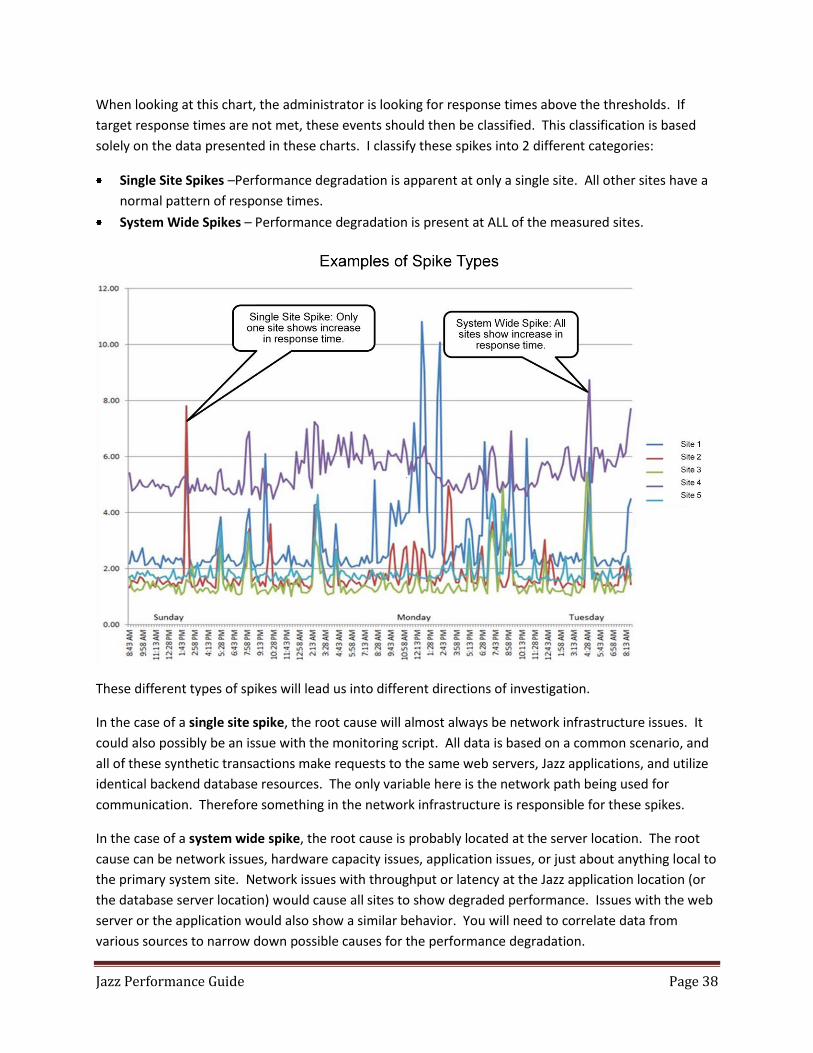
Jazz Performance Guide Page 38
When looking at this chart, the administrator is looking for response times above the thresholds. If
target response times are not met, these events should then be classified. This classification is based
solely on the data presented in these charts. I classify these spikes into 2 different categories:
Single Site Spikes –Performance degradation is apparent at only a single site. All other sites have a
normal pattern of response times.
System Wide Spikes – Performance degradation is present at ALL of the measured sites.
These different types of spikes will lead us into different directions of investigation.
In the case of a single site spike, the root cause will almost always be network infrastructure issues. It
could also possibly be an issue with the monitoring script. All data is based on a common scenario, and
all of these synthetic transactions make requests to the same web servers, Jazz applications, and utilize
identical backend database resources. The only variable here is the network path being used for
communication. Therefore something in the network infrastructure is responsible for these spikes.
In the case of a system wide spike, the root cause is probably located at the server location. The root
cause can be network issues, hardware capacity issues, application issues, or just about anything local to
the primary system site. Network issues with throughput or latency at the Jazz application location (or
the database server location) would cause all sites to show degraded performance. Issues with the web
server or the application would also show a similar behavior. You will need to correlate data from
various sources to narrow down possible causes for the performance degradation.
Jazz Performance Guide Page 39
If no significant frequency of response times over the thresholds defined are seen during the daily
inspection, the Jazz Administrator can conclude that the system is running in a well behaved manner. If
spikes have been identified, and due to their nature a root cause has been established, then the Jazz
Administrator should note this in their Jazz performance log (see appendix).
The Jazz Administrator may note that there are spikes for which a definitive root cause cannot be
established. In this case the sites impacted and the times of the spike events need to be noted, so they
can be correlated with other data.
Summary:
Single site spike = local network issue at site showing spike
All-site spike = further investigation needed
Using synthetic transactions is a good way to monitor end user performance. Make sure to monitor
transactions to all jazz application instances, from each major user site.
Step 1b - Initial Analysis of Data – Using the Introscope (APM) Monitor
Some customers have access to the Introscope monitoring tools. Initial analysis of data can be
automated utilizing the Introscope (APM) monitor. This data should be looked at for a variety of
conditions. APM reports can contain a wide variety of data, all of which should be correlated with other
data that is being collected. We’ll go over some of the reports and graphs in a typical APM Jazz report,
and note what an administrator should be looking for.
Note that while the examples shown are from an actual Introscope APM implementation, the data can
be collected and rendered using other tools, or through custom monitoring scripts and report
generation. The graphs shown here are used to illustrate the specific areas where Jazz Administrators
should be vigilant in their monitoring, and the types of anomalies that they should be looking for.
I fully expect that samples and examples from other monitoring tools will be included in this section of
the document, once they become available to me.
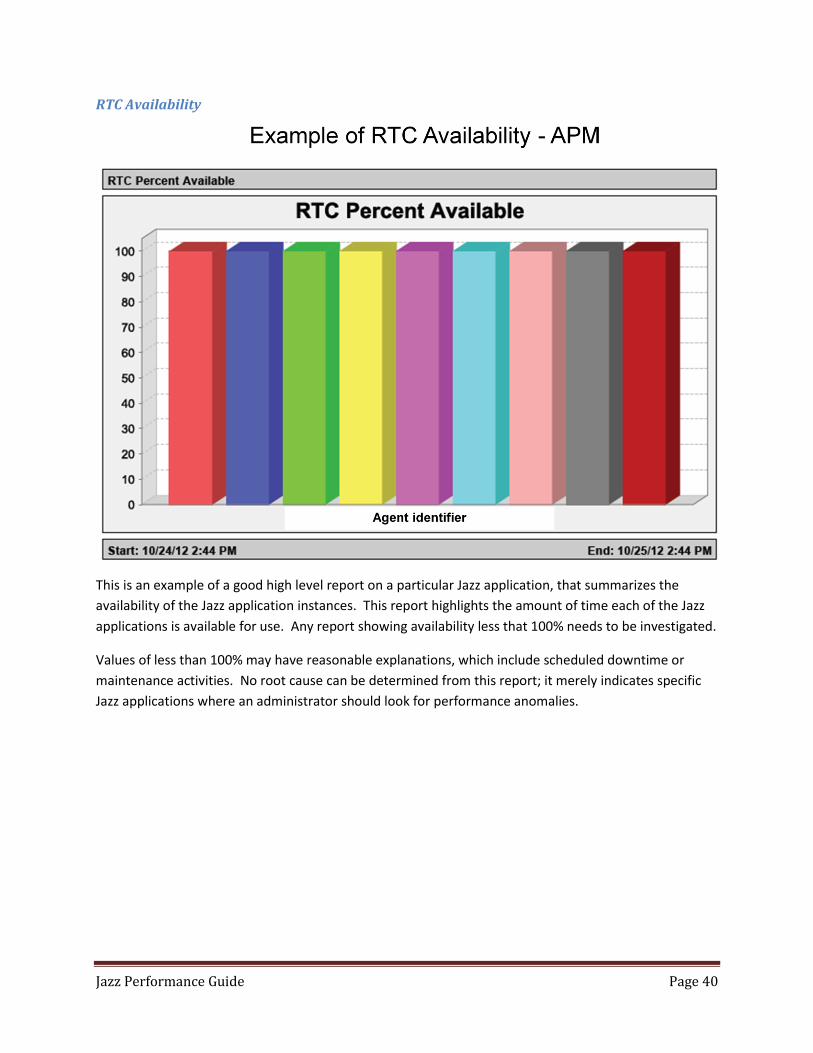
Jazz Performance Guide Page 40
RTC Availability
This is an example of a good high level report on a particular Jazz application, that summarizes the
availability of the Jazz application instances. This report highlights the amount of time each of the Jazz
applications is available for use. Any report showing availability less that 100% needs to be investigated.
Values of less than 100% may have reasonable explanations, which include scheduled downtime or
maintenance activities. No root cause can be determined from this report; it merely indicates specific
Jazz applications where an administrator should look for performance anomalies.
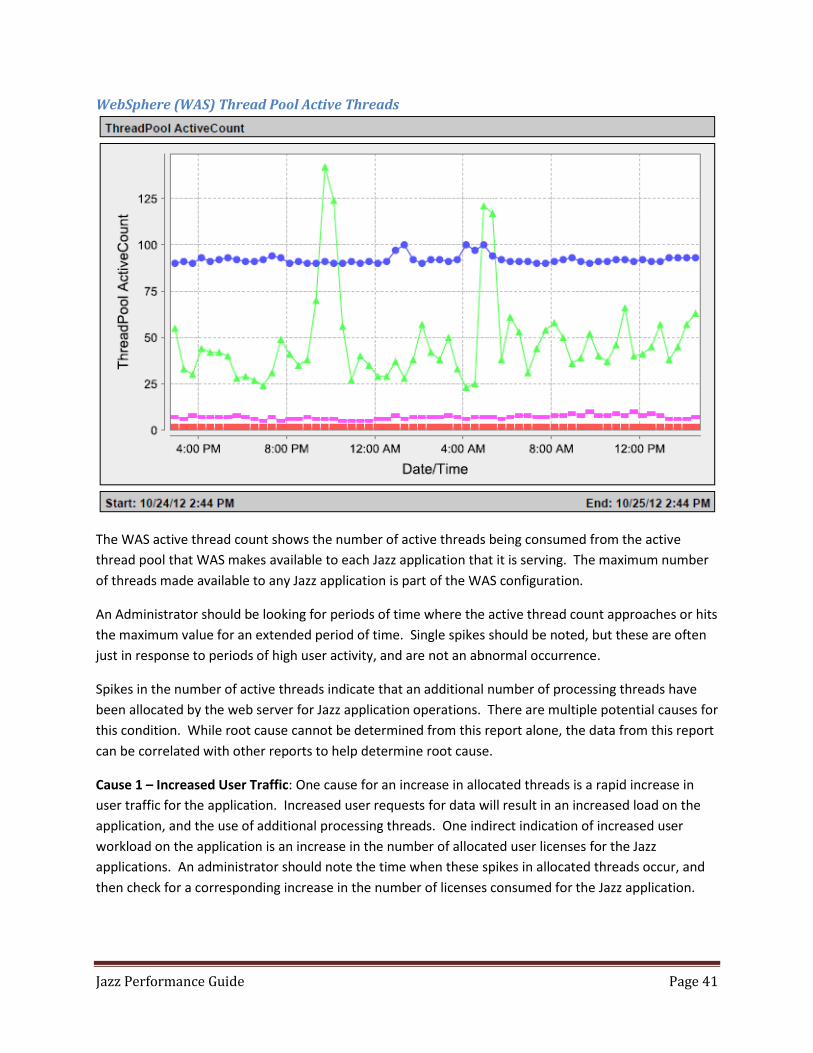
Jazz Performance Guide Page 41
WebSphere (WAS) Thread Pool Active Threads
The WAS active thread count shows the number of active threads being consumed from the active
thread pool that WAS makes available to each Jazz application that it is serving. The maximum number
of threads made available to any Jazz application is part of the WAS configuration.
An Administrator should be looking for periods of time where the active thread count approaches or hits
the maximum value for an extended period of time. Single spikes should be noted, but these are often
just in response to periods of high user activity, and are not an abnormal occurrence.
Spikes in the number of active threads indicate that an additional number of processing threads have
been allocated by the web server for Jazz application operations. There are multiple potential causes for
this condition. While root cause cannot be determined from this report alone, the data from this report
can be correlated with other reports to help determine root cause.
Cause 1 – Increased User Traffic: One cause for an increase in allocated threads is a rapid increase in
user traffic for the application. Increased user requests for data will result in an increased load on the
application, and the use of additional processing threads. One indirect indication of increased user
workload on the application is an increase in the number of allocated user licenses for the Jazz
applications. An administrator should note the time when these spikes in allocated threads occur, and
then check for a corresponding increase in the number of licenses consumed for the Jazz application.
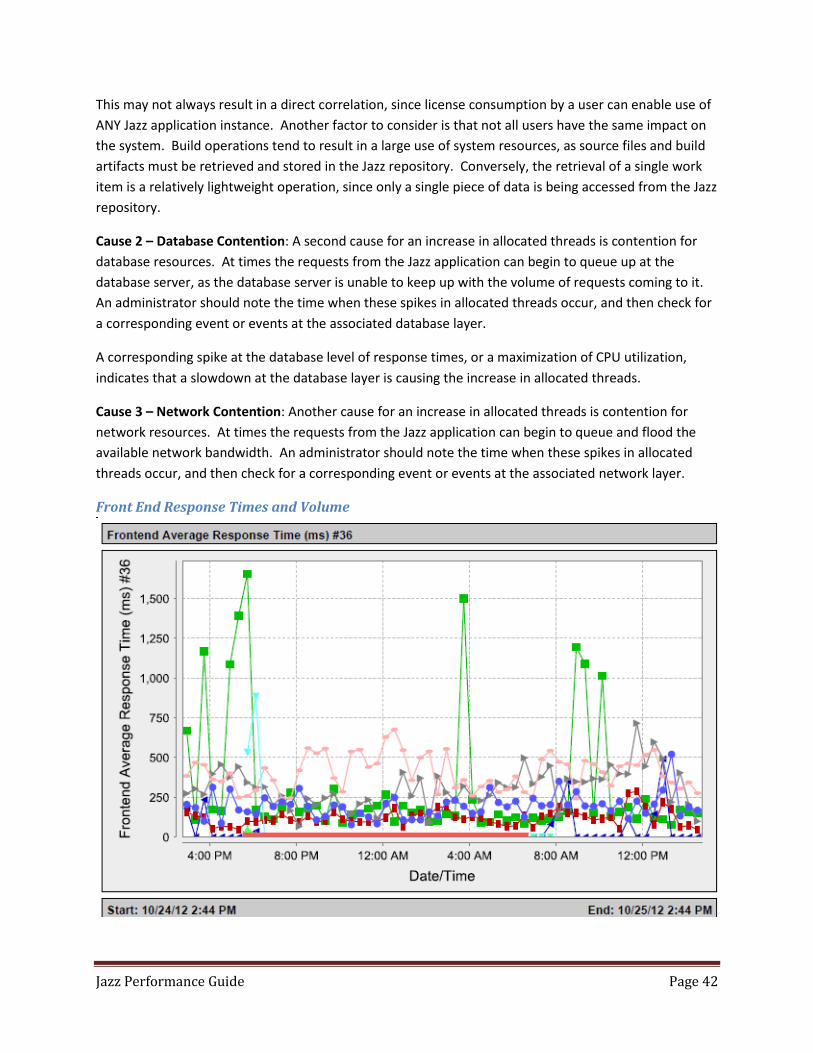
Jazz Performance Guide Page 42
This may not always result in a direct correlation, since license consumption by a user can enable use of
ANY Jazz application instance. Another factor to consider is that not all users have the same impact on
the system. Build operations tend to result in a large use of system resources, as source files and build
artifacts must be retrieved and stored in the Jazz repository. Conversely, the retrieval of a single work
item is a relatively lightweight operation, since only a single piece of data is being accessed from the Jazz
repository.
Cause 2 – Database Contention: A second cause for an increase in allocated threads is contention for
database resources. At times the requests from the Jazz application can begin to queue up at the
database server, as the database server is unable to keep up with the volume of requests coming to it.
An administrator should note the time when these spikes in allocated threads occur, and then check for
a corresponding event or events at the associated database layer.
A corresponding spike at the database level of response times, or a maximization of CPU utilization,
indicates that a slowdown at the database layer is causing the increase in allocated threads.
Cause 3 – Network Contention: Another cause for an increase in allocated threads is contention for
network resources. At times the requests from the Jazz application can begin to queue and flood the
available network bandwidth. An administrator should note the time when these spikes in allocated
threads occur, and then check for a corresponding event or events at the associated network layer.
Front End Response Times and Volume
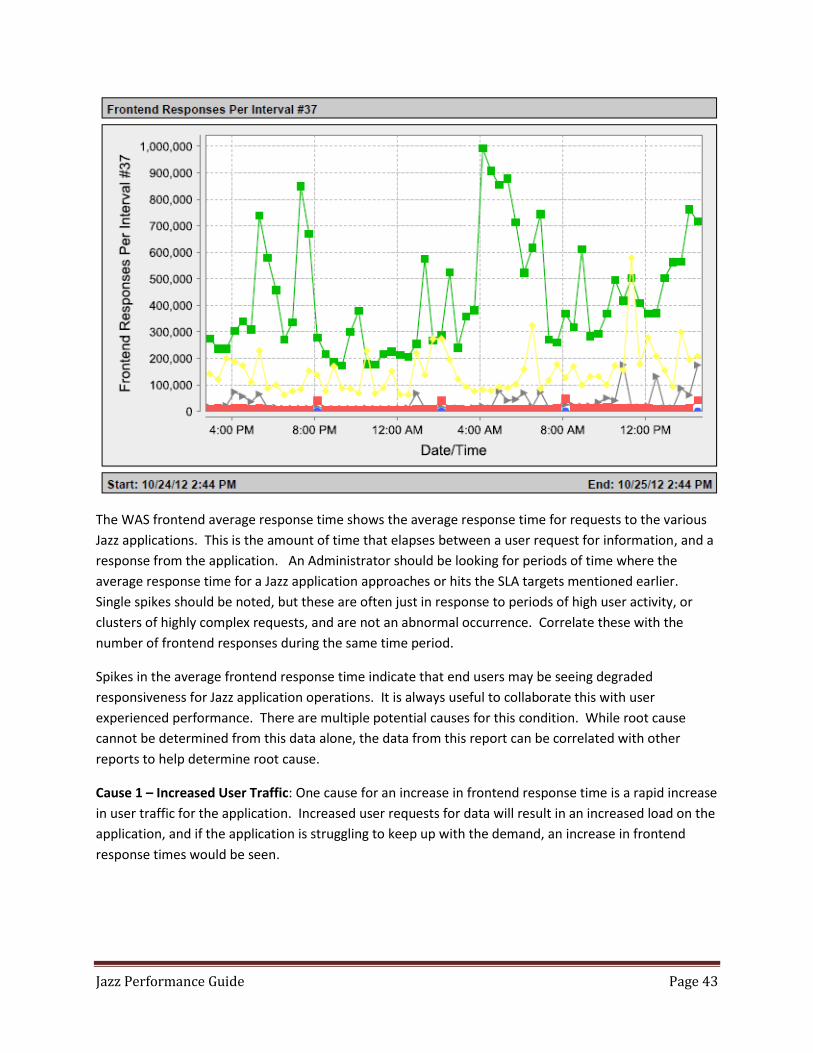
Jazz Performance Guide Page 43
The WAS frontend average response time shows the average response time for requests to the various
Jazz applications. This is the amount of time that elapses between a user request for information, and a
response from the application. An Administrator should be looking for periods of time where the
average response time for a Jazz application approaches or hits the SLA targets mentioned earlier.
Single spikes should be noted, but these are often just in response to periods of high user activity, or
clusters of highly complex requests, and are not an abnormal occurrence. Correlate these with the
number of frontend responses during the same time period.
Spikes in the average frontend response time indicate that end users may be seeing degraded
responsiveness for Jazz application operations. It is always useful to collaborate this with user
experienced performance. There are multiple potential causes for this condition. While root cause
cannot be determined from this data alone, the data from this report can be correlated with other
reports to help determine root cause.
Cause 1 – Increased User Traffic: One cause for an increase in frontend response time is a rapid increase
in user traffic for the application. Increased user requests for data will result in an increased load on the
application, and if the application is struggling to keep up with the demand, an increase in frontend
response times would be seen.
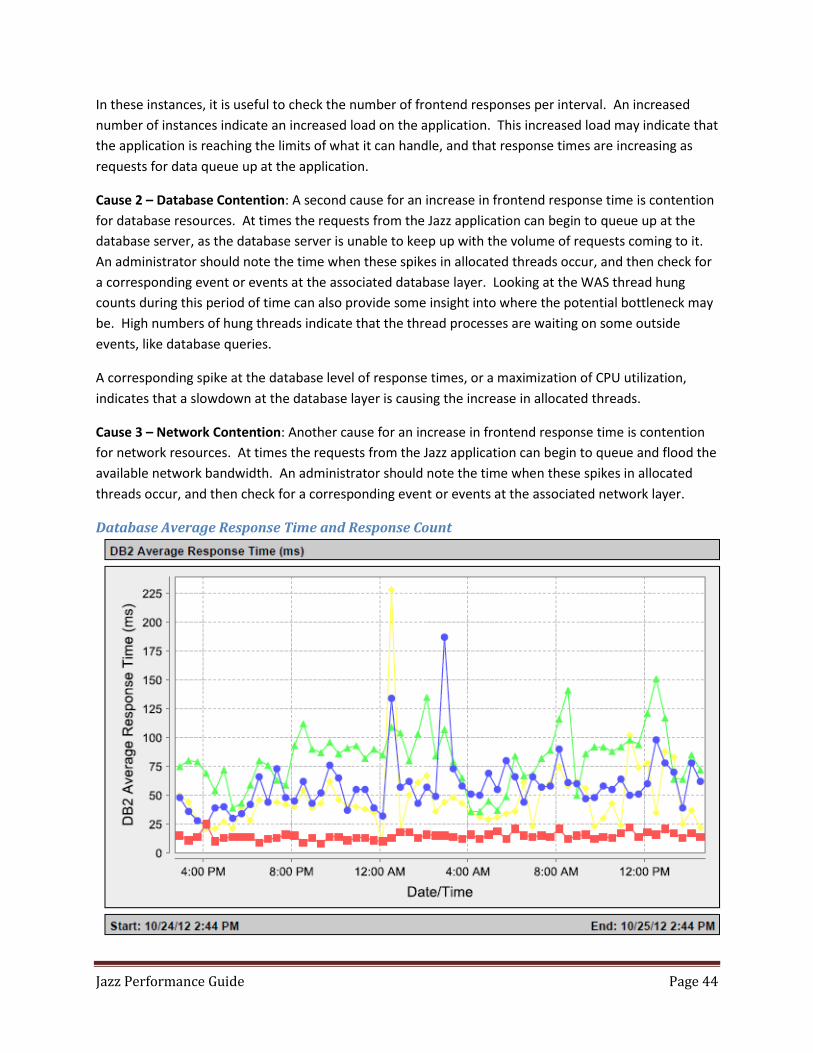
Jazz Performance Guide Page 44
In these instances, it is useful to check the number of frontend responses per interval. An increased
number of instances indicate an increased load on the application. This increased load may indicate that
the application is reaching the limits of what it can handle, and that response times are increasing as
requests for data queue up at the application.
Cause 2 – Database Contention: A second cause for an increase in frontend response time is contention
for database resources. At times the requests from the Jazz application can begin to queue up at the
database server, as the database server is unable to keep up with the volume of requests coming to it.
An administrator should note the time when these spikes in allocated threads occur, and then check for
a corresponding event or events at the associated database layer. Looking at the WAS thread hung
counts during this period of time can also provide some insight into where the potential bottleneck may
be. High numbers of hung threads indicate that the thread processes are waiting on some outside
events, like database queries.
A corresponding spike at the database level of response times, or a maximization of CPU utilization,
indicates that a slowdown at the database layer is causing the increase in allocated threads.
Cause 3 – Network Contention: Another cause for an increase in frontend response time is contention
for network resources. At times the requests from the Jazz application can begin to queue and flood the
available network bandwidth. An administrator should note the time when these spikes in allocated
threads occur, and then check for a corresponding event or events at the associated network layer.
Database Average Response Time and Response Count
Jazz Performance Guide Page 45
The database average response time shows the average response time for requests to the database
hosting the Jazz repositories that support the various Jazz applications. The average time for a response
to an application operation needs to be less than 150 milliseconds, in order for the Jazz applications to
perform all of their processing and operations, and to return data and information to the end user.
An Administrator should be looking for periods of time where the average response time approaches or
hits the 150 millisecond target. Single spikes should be noted, but these are often just in response to
clusters of highly complex SQL requests, and may not be an abnormal occurrence.
Spikes in the database average response time indicate that end users may be seeing degraded
responsiveness for their Jazz application operations. There are multiple potential causes for this
condition. While root cause cannot be determined from this data alone, the data from this report can
be correlated with other reports to help determine root cause.
Cause 1 – Database Contention: One cause for an increase in database response time is contention for
database resources. At times the requests from the Jazz application can begin to queue up at the
database server, as the database server is unable to keep up with the volume of requests coming to it.
An administrator should note the time when these spikes in response time occur, and then check for a
corresponding event or events within the other database specific metrics.
Cause 2 – Malformed or Inefficient Queries: Another cause for an increase in database response time is
malformed and non-optimal SQL queries. The Jazz applications are driven by user actions, and they use
a dynamic query building engine to build specific queries based on the user actions and requests.
Certain user requests to the Jazz application can cause this dynamic query engine to produce queries
that may not be optimal. The queries may not be well scoped, and may retrieve more data than is
needed. An administrator should note the time when these spikes in database response times occur,
and then check for a corresponding event or events within the database specific metrics.
In these cases, the simple indexing of particular database tables within the Jazz repository can address
the performance issue. Use the database specific metrics and diagnostics to help determine when these
conditions are being encountered, and when this can help address performance issues.
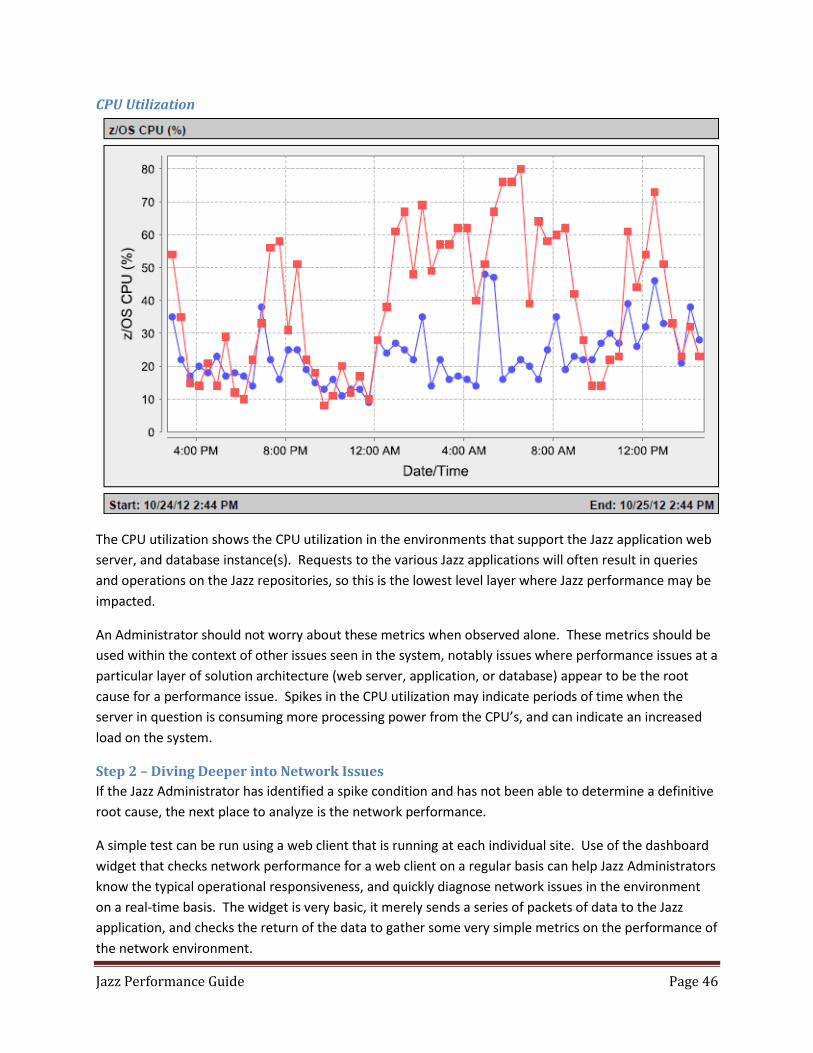
Jazz Performance Guide Page 46
CPU Utilization
The CPU utilization shows the CPU utilization in the environments that support the Jazz application web
server, and database instance(s). Requests to the various Jazz applications will often result in queries
and operations on the Jazz repositories, so this is the lowest level layer where Jazz performance may be
impacted.
An Administrator should not worry about these metrics when observed alone. These metrics should be
used within the context of other issues seen in the system, notably issues where performance issues at a
particular layer of solution architecture (web server, application, or database) appear to be the root
cause for a performance issue. Spikes in the CPU utilization may indicate periods of time when the
server in question is consuming more processing power from the CPU’s, and can indicate an increased
load on the system.
Step 2 – Diving Deeper into Network Issues
If the Jazz Administrator has identified a spike condition and has not been able to determine a definitive
root cause, the next place to analyze is the network performance.
A simple test can be run using a web client that is running at each individual site. Use of the dashboard
widget that checks network performance for a web client on a regular basis can help Jazz Administrators
know the typical operational responsiveness, and quickly diagnose network issues in the environment
on a real-time basis. The widget is very basic, it merely sends a series of packets of data to the Jazz
application, and checks the return of the data to gather some very simple metrics on the performance of
the network environment.
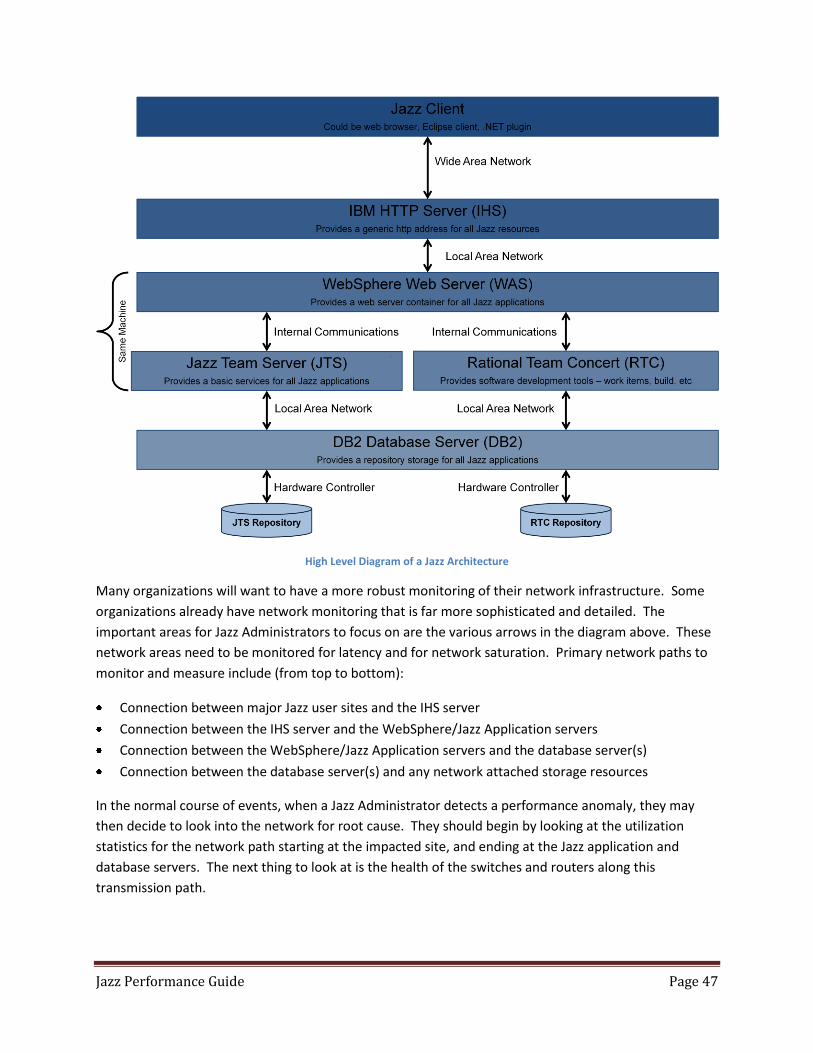
Jazz Performance Guide Page 47
High Level Diagram of a Jazz Architecture
Many organizations will want to have a more robust monitoring of their network infrastructure. Some
organizations already have network monitoring that is far more sophisticated and detailed. The
important areas for Jazz Administrators to focus on are the various arrows in the diagram above. These
network areas need to be monitored for latency and for network saturation. Primary network paths to
monitor and measure include (from top to bottom):
Connection between major Jazz user sites and the IHS server
Connection between the IHS server and the WebSphere/Jazz Application servers
Connection between the WebSphere/Jazz Application servers and the database server(s)
Connection between the database server(s) and any network attached storage resources
In the normal course of events, when a Jazz Administrator detects a performance anomaly, they may
then decide to look into the network for root cause. They should begin by looking at the utilization
statistics for the network path starting at the impacted site, and ending at the Jazz application and
database servers. The next thing to look at is the health of the switches and routers along this
transmission path.
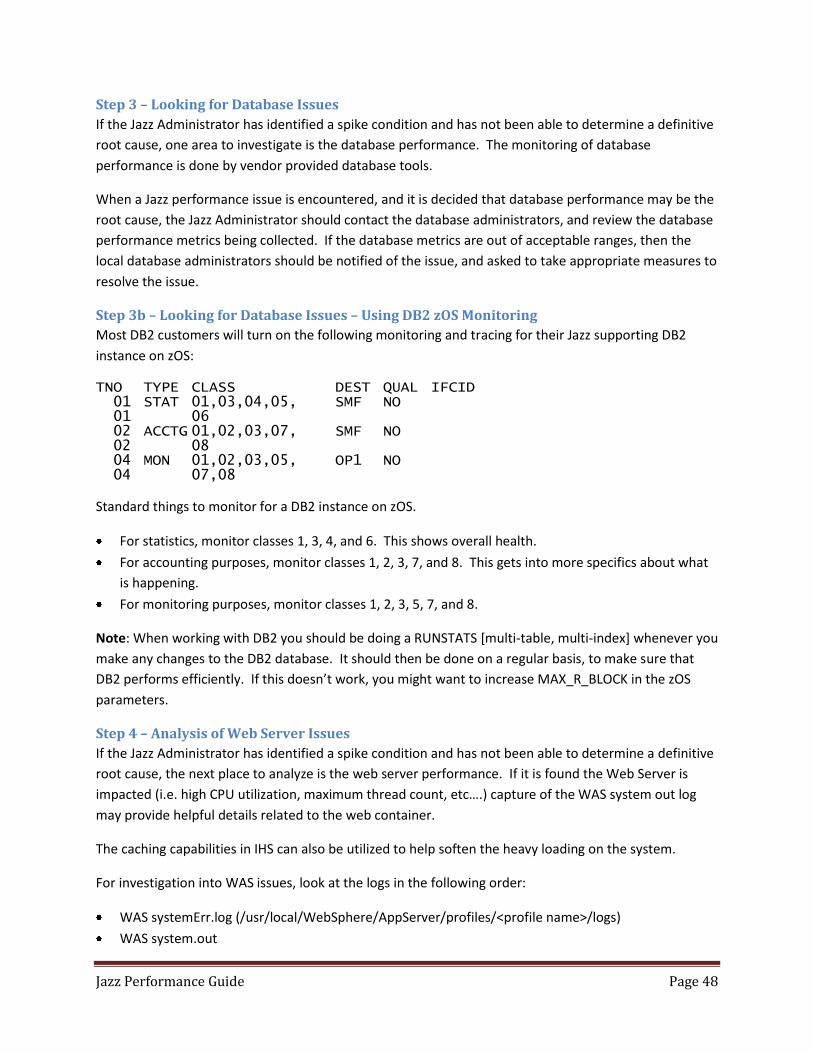
Jazz Performance Guide Page 48
Step 3 – Looking for Database Issues
If the Jazz Administrator has identified a spike condition and has not been able to determine a definitive
root cause, one area to investigate is the database performance. The monitoring of database
performance is done by vendor provided database tools.
When a Jazz performance issue is encountered, and it is decided that database performance may be the
root cause, the Jazz Administrator should contact the database administrators, and review the database
performance metrics being collected. If the database metrics are out of acceptable ranges, then the
local database administrators should be notified of the issue, and asked to take appropriate measures to
resolve the issue.
Step 3b – Looking for Database Issues – Using DB2 zOS Monitoring
Most DB2 customers will turn on the following monitoring and tracing for their Jazz supporting DB2
instance on zOS:
TNO TYPE CLASS DEST QUAL IFCID 01 STAT 01,03,04,05, SMF NO 01 06 02 ACCTG 01,02,03,07, SMF NO 02 08 04 MON 01,02,03,05, OP1 NO 04 07,08 Standard things to monitor for a DB2 instance on zOS.
For statistics, monitor classes 1, 3, 4, and 6. This shows overall health.
For accounting purposes, monitor classes 1, 2, 3, 7, and 8. This gets into more specifics about what
is happening.
For monitoring purposes, monitor classes 1, 2, 3, 5, 7, and 8.
Note: When working with DB2 you should be doing a RUNSTATS [multi-table, multi-index] whenever you
make any changes to the DB2 database. It should then be done on a regular basis, to make sure that
DB2 performs efficiently. If this doesn’t work, you might want to increase MAX_R_BLOCK in the zOS
parameters.
Step 4 – Analysis of Web Server Issues
If the Jazz Administrator has identified a spike condition and has not been able to determine a definitive
root cause, the next place to analyze is the web server performance. If it is found the Web Server is
impacted (i.e. high CPU utilization, maximum thread count, etc….) capture of the WAS system out log
may provide helpful details related to the web container.
The caching capabilities in IHS can also be utilized to help soften the heavy loading on the system.
For investigation into WAS issues, look at the logs in the following order:
WAS systemErr.log (/usr/local/WebSphere/AppServer/profiles/<profile name>/logs)
WAS system.out
Jazz Performance Guide Page 49
IHS plugin log (/opt/IBM/httpserver/Plugins/config/<servername>/systemOut.log)
IHS system.out
When looking at these logs, the Jazz Administrator should be looking for warnings and errors, the
informational messages should be ignored. From the WAS console, the tracing of WAS operations can
be enabled and disabled. It is suggested that ALL tracing be turned off during production usage.
In the first logfile (the WAS systemErr.log), the administrator will be able to see stack traces of error
conditions. These can be hard to decipher, but may hold clues to what is occurring within the system.
The key here is to capture the thread ID, any user or URI information, and any timestamp information.
In some instances you will be able to see a descriptive error message that can highlight your root cause.
In the second logfile (the WAS system.out), the hexadecimal number at the beginning of the log entry
identifies the thread ID. Initially the administrator should be looking at entries indicated with “W”
(warning), or “E” (error). “I” messages are informational. The key here is to capture the thread ID, any
user or URI information, and any timestamp information. In some instances you will be able to see a
descriptive error message that can highlight your root cause.
In the third logfile (the IHS plugin log), the hexadecimal number at the beginning of the log entry
identifies the thread ID. Initially the administrator should be looking at entries indicated with “W”
(warning), or “E” (error). “I” messages are informational.
In the last logfile (the IHS system.out), the hexadecimal number at the beginning of the log entry
identifies the thread ID. Initially the administrator should be looking at entries indicated with “W”
(warning), or “E” (error). “I” messages are informational.
If the administrator does not have a definitive direction after tracing through these logfiles, then it is
essential that the administrator record the log errors, their timestamps, and any other pertinent
information. This data can then be used to correlate these events with related events that can be seen
in the investigation of the Jazz application issues (in the next section).
Often Jazz Administrators will increase the size of the WAS thread pool to address throughput and
performance issues. Increasing the thread pool results in WAS having to manage and maintain the
threads, and incurs additional overhead doing this. Often the maximum will be set to be close to the
maximum expected number of concurrent users in WAS installations.
Step 5 – Investigation of Jazz Application Issues
If the Jazz Administrator has identified a spike condition and has not been able to determine a definitive
root cause, and the other causes have not been able to be definitively identified, then the Jazz
application performance must be assessed.
There may be instances whereby review of the Jazz application requires obtaining logs and or java cores
from the server. As part of validating the application obtaining the JTS log may prove helpful. If the
application server is hung, obtain the java cores from the time frame of the server hang.
Jazz Performance Guide Page 50
Jazz Administrators should also take a look at the daily JazzMon data, and compare this to the JazzMon
data from previous days.
Jazz Log Files
Jazz log files will contain various different pieces of information, based on the level of logging chosen.
This is set in the logj4.properties file, in the server/conf/jts directory. Administrators should be familiar
with these files, because they have the ability to enable various types of application logging that can
help determine what the Jazz applications are doing.
Some more advanced administrators may want to monitor the informational (INFO) and warning
messages (WARN) messages. Administrators should be aware of error (ERROR) messages in the various
Jazz application logs. Some of these may be self explanatory, while others should be looked at in more
detail.
Researching these errors can be done on Jazz.net, often a quick search of the forums will give an
administrator not only some background on the error message in question, but will also indicate ways to
address the issue.
Step 6 – Determination of Web Browser and Client Issues
Often user complaints on specific issues will not be able to be correlated with monitored problems
anywhere else in the system. In these cases, it is often useful to try to isolate and analyze issues with
the clients being used, either the Eclipse client or the browser being used.
One of the easiest ways to determine exactly what is happening at the web client is to use one of the
web browser based tools that gives you insight into what is happening within the browser itself. One of
the frequent complaints that many Jazz users will have is the amount of time needed to display plans in
the browser. Some of the time needed to do this is due to the large amounts of data needed, but the
majority of the time is spent in the JavaScript processing of the information.
Each browser will have a different tool. For Firefox, you should use the Firebug tool. This tool will break
down all incoming traffic, and show the amount of time spent on sending requests, getting responses,
and on JavaScript processing and rendering.
Using F12 in an Internet Explorer browser will bring up the Internet Explorer debugging tools.
Another good option is to use HTTPWatch (http://www.httpwatch.com/) , which will work with both the
Internet Explorer and Firefox web browsers.
The key to doing this level of performance monitoring is to watch the time stamp for three events:
When a request goes out to the Jazz application
When ALL of the response data has returned to the browser
When the JavaScript engine has finished processing, and the web page is displayed to the user

Jazz Performance Guide Page 51
Weekly Monitoring and Health Assessment This section is for the weekly monitoring and assessment of the health of the Jazz solution environment.
This outlined scenario serves as a starting point for the ongoing monitoring of any problems in the
environment, with a focus on identification of long term trends in the environment. This can prove
useful for capacity planning, as well as in the identification of larger systemic issues.
Weekly Frontend Response Ranges
Initial analysis of data will begin with the checking of the average frontend response times for each Jazz
application. A general range of data should be noted for each week of operation. Using these weekly
ranges of response times, coupled with the volume of frontend requests, a Jazz Administrator should
look to see where Jazz applications are beginning to trend towards limits. This is an indication that the
load on the application is approaching the point where administrators should consider eliminating the
creation of any new projects on that particular Jazz application server.
Weekly License Usage
Jazz administrators should check the license usage on the system on a weekly basis. This data cannot
currently be retrieved on a historical basis at the current time. Once a mechanism for obtaining license
usage over time becomes available in the Jazz Team Server, this section should indicate how an
administrator can accomplish this task.
License usage can be checked interactively, through use of the licensing tab on the administration panel.
You can also use
https://<server>/jts/admin#action=com.ibm.team.repository.admin.floatingLicenseReports, to see the
license usage at any point in time.
When examining license usage, be aware that you will see peaks and valleys of usage. The key metric to
focus on is the peak usage, since these indicate periods where end users may not be able to do their
work due to a lack of proper licenses. Average license usage is not a useful metric, since it does not
reflect lack of service to your end user community.
Weekly Repository Check
On a weekly basis, the Jazz administrator should be checking the size of the repositories for each of the
Jazz applications. The size of the repositories should be noted each week, and a historical trend of
repository size for each application instance can be monitored. Along with this data, a record of new
projects that have migrated and launched on the individual Jazz applications should also be kept.
Repository size can be monitored on the database server, by noting the full physical size of the
repositories. Be sure to inform the databse administrator of the growth in repository size, since they
may require a relocation of the databases supporting the Jazz infrastructure at some point in the future,
or the procurement of additional hardware (CPU and/or memory), to support the additional load.
Jazz Performance Guide Page 52
Repository size can also be monitored by the Jazz administrator, who can create a repository size report
for each Jazz application. To do this, the administrator will need to create a new report based on the
Data Warehouse Metrics report template. Remember that you will need to do this for each Jazz
application instance.
Monitoring the trends in repository growth is critical. As users begin to migrate onto the Jazz
infrastructure, experienced Jazz administrators are able to easily predict the growth in repository size
based on the number of new projects and users that are moving into the Jazz development
environment. Since there is currently no way to effectively “split” a single Jazz application repository
into two smaller repositories, Jazz administrators MUST be proactive, and should quickly deploy new
application server instances as usage grows.
Having the historical data available allows a Jazz administrator to determine what normal repository
growth should be for a given Jazz application repository, and can provide a good guide for the planning
of future hardware needs.
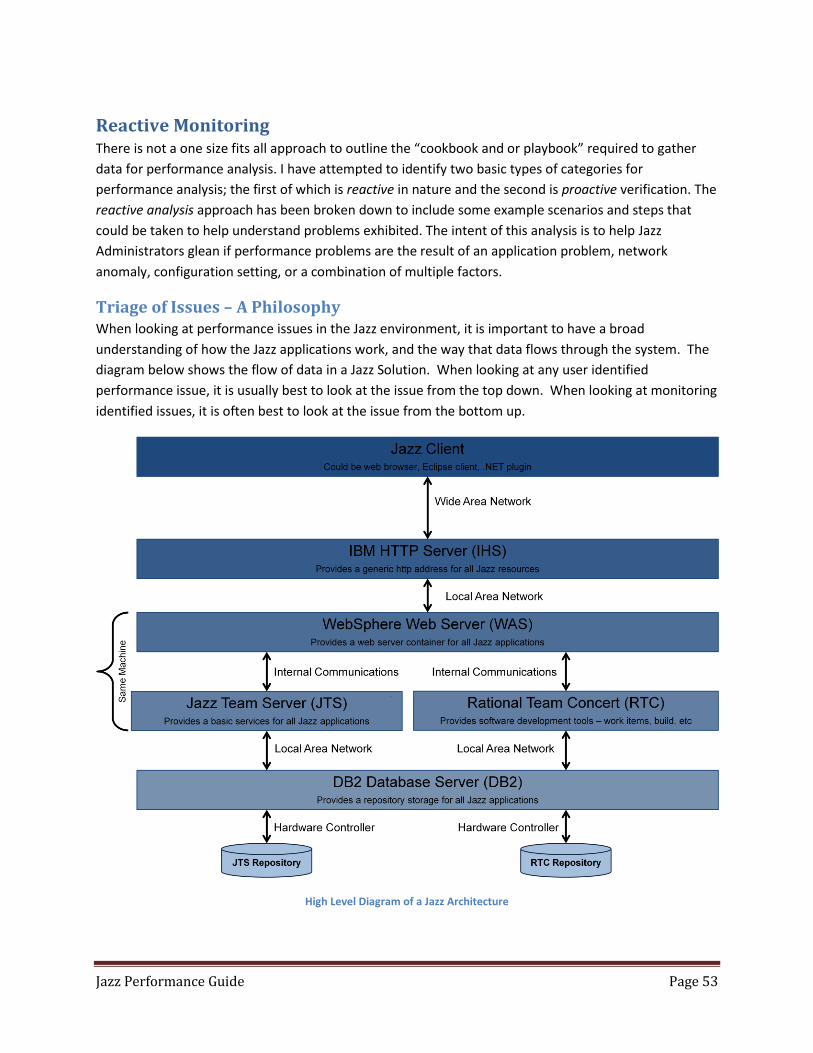
Jazz Performance Guide Page 53
Reactive Monitoring There is not a one size fits all approach to outline the “cookbook and or playbook” required to gather
data for performance analysis. I have attempted to identify two basic types of categories for
performance analysis; the first of which is reactive in nature and the second is proactive verification. The
reactive analysis approach has been broken down to include some example scenarios and steps that
could be taken to help understand problems exhibited. The intent of this analysis is to help Jazz
Administrators glean if performance problems are the result of an application problem, network
anomaly, configuration setting, or a combination of multiple factors.
Triage of Issues – A Philosophy When looking at performance issues in the Jazz environment, it is important to have a broad
understanding of how the Jazz applications work, and the way that data flows through the system. The
diagram below shows the flow of data in a Jazz Solution. When looking at any user identified
performance issue, it is usually best to look at the issue from the top down. When looking at monitoring
identified issues, it is often best to look at the issue from the bottom up.
High Level Diagram of a Jazz Architecture

Jazz Performance Guide Page 54
At the top level is the client. Performance issues should start to be evaluated at this level. If individual
users appear to be having issues, while other users in the same geographic region do not, then the client
is often the reason for poor performance. The root cause may be misconfigured client settings, a lack of
sufficient memory or CPU resources, or poor local network performance.
The next level down is the IHS server. Problems with root cause at this level are rare, as this layer does
not do very much processing, and can be thought of as a “traffic cop”, directing requests to the proper
WAS instance. Common issues here occur when the IHS server does not have sufficient CPU or memory
to properly handle all of the incoming http sessions.
Data and user interactions then go into the WebSphere Application Server, which houses the Jazz
applications. At this layer the performance issues often will be the result of poorly configured WAS
settings, insufficient memory, or poorly tuned JVM settings for the Jazz applications.
One other source of issues at this level is the supporting technologies used for these. Since the JTS
manages identity for the Jazz applications, it is crucial that the connectivity between the JTS and the
other Jazz applications, as well as the LDAP provider, be high speed and efficient (with a minimum of
network latency).
The lowest level of performance issues is at the database layer. Use of network storage with long
latency times, underpowered database server hardware, or database resources that have a long latency
to the Jazz application servers, are all common sources of poor performance. With some
implementations, performance can be improved by doing some database tuning, with the creation of
indexes, better use of database caching, and other techniques proving to be useful.
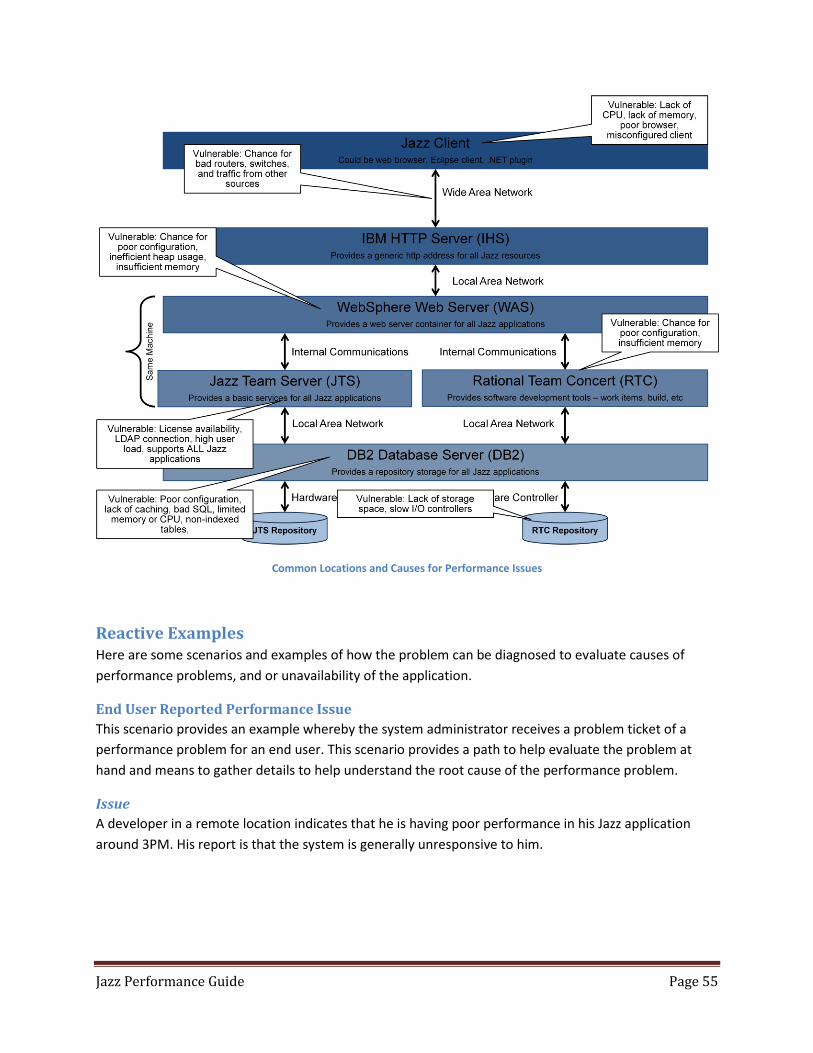
Jazz Performance Guide Page 55
Common Locations and Causes for Performance Issues
Reactive Examples Here are some scenarios and examples of how the problem can be diagnosed to evaluate causes of
performance problems, and or unavailability of the application.
End User Reported Performance Issue
This scenario provides an example whereby the system administrator receives a problem ticket of a
performance problem for an end user. This scenario provides a path to help evaluate the problem at
hand and means to gather details to help understand the root cause of the performance problem.
Issue
A developer in a remote location indicates that he is having poor performance in his Jazz application
around 3PM. His report is that the system is generally unresponsive to him.
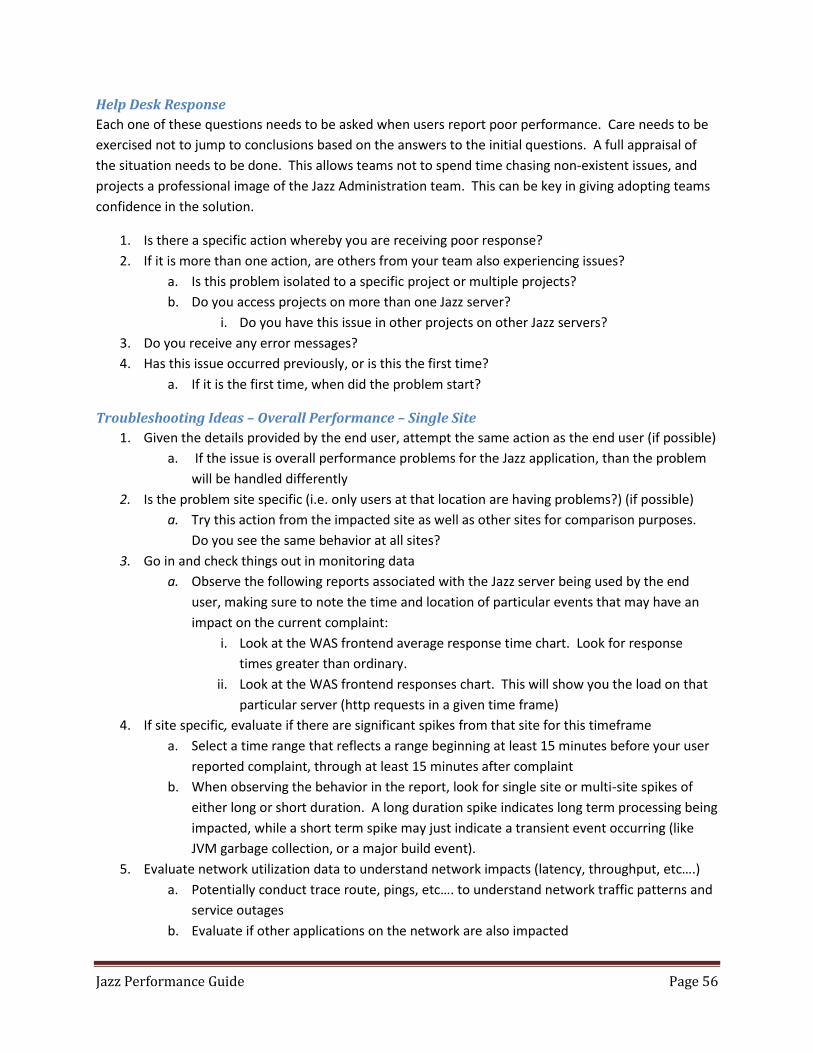
Jazz Performance Guide Page 56
Help Desk Response
Each one of these questions needs to be asked when users report poor performance. Care needs to be
exercised not to jump to conclusions based on the answers to the initial questions. A full appraisal of
the situation needs to be done. This allows teams not to spend time chasing non-existent issues, and
projects a professional image of the Jazz Administration team. This can be key in giving adopting teams
confidence in the solution.
1. Is there a specific action whereby you are receiving poor response?
2. If it is more than one action, are others from your team also experiencing issues?
a. Is this problem isolated to a specific project or multiple projects?
b. Do you access projects on more than one Jazz server?
i. Do you have this issue in other projects on other Jazz servers?
3. Do you receive any error messages?
4. Has this issue occurred previously, or is this the first time?
a. If it is the first time, when did the problem start?
Troubleshooting Ideas – Overall Performance – Single Site
1. Given the details provided by the end user, attempt the same action as the end user (if possible)
a. If the issue is overall performance problems for the Jazz application, than the problem
will be handled differently
2. Is the problem site specific (i.e. only users at that location are having problems?) (if possible)
a. Try this action from the impacted site as well as other sites for comparison purposes.
Do you see the same behavior at all sites?
3. Go in and check things out in monitoring data
a. Observe the following reports associated with the Jazz server being used by the end
user, making sure to note the time and location of particular events that may have an
impact on the current complaint:
i. Look at the WAS frontend average response time chart. Look for response
times greater than ordinary.
ii. Look at the WAS frontend responses chart. This will show you the load on that
particular server (http requests in a given time frame)
4. If site specific, evaluate if there are significant spikes from that site for this timeframe
a. Select a time range that reflects a range beginning at least 15 minutes before your user
reported complaint, through at least 15 minutes after complaint
b. When observing the behavior in the report, look for single site or multi-site spikes of
either long or short duration. A long duration spike indicates long term processing being
impacted, while a short term spike may just indicate a transient event occurring (like
JVM garbage collection, or a major build event).
5. Evaluate network utilization data to understand network impacts (latency, throughput, etc….)
a. Potentially conduct trace route, pings, etc…. to understand network traffic patterns and
service outages
b. Evaluate if other applications on the network are also impacted
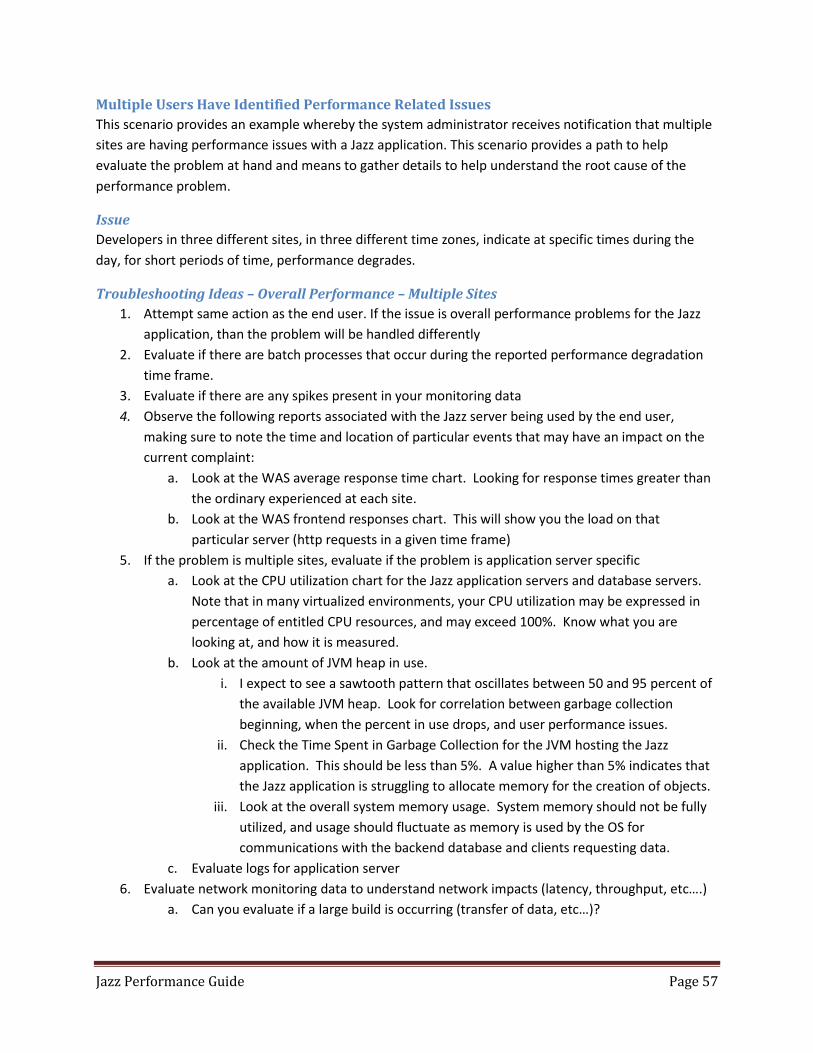
Jazz Performance Guide Page 57
Multiple Users Have Identified Performance Related Issues
This scenario provides an example whereby the system administrator receives notification that multiple
sites are having performance issues with a Jazz application. This scenario provides a path to help
evaluate the problem at hand and means to gather details to help understand the root cause of the
performance problem.
Issue
Developers in three different sites, in three different time zones, indicate at specific times during the
day, for short periods of time, performance degrades.
Troubleshooting Ideas – Overall Performance – Multiple Sites
1. Attempt same action as the end user. If the issue is overall performance problems for the Jazz
application, than the problem will be handled differently
2. Evaluate if there are batch processes that occur during the reported performance degradation
time frame.
3. Evaluate if there are any spikes present in your monitoring data
4. Observe the following reports associated with the Jazz server being used by the end user,
making sure to note the time and location of particular events that may have an impact on the
current complaint:
a. Look at the WAS average response time chart. Looking for response times greater than
the ordinary experienced at each site.
b. Look at the WAS frontend responses chart. This will show you the load on that
particular server (http requests in a given time frame)
5. If the problem is multiple sites, evaluate if the problem is application server specific
a. Look at the CPU utilization chart for the Jazz application servers and database servers.
Note that in many virtualized environments, your CPU utilization may be expressed in
percentage of entitled CPU resources, and may exceed 100%. Know what you are
looking at, and how it is measured.
b. Look at the amount of JVM heap in use.
i. I expect to see a sawtooth pattern that oscillates between 50 and 95 percent of
the available JVM heap. Look for correlation between garbage collection
beginning, when the percent in use drops, and user performance issues.
ii. Check the Time Spent in Garbage Collection for the JVM hosting the Jazz
application. This should be less than 5%. A value higher than 5% indicates that
the Jazz application is struggling to allocate memory for the creation of objects.
iii. Look at the overall system memory usage. System memory should not be fully
utilized, and usage should fluctuate as memory is used by the OS for
communications with the backend database and clients requesting data.
c. Evaluate logs for application server
6. Evaluate network monitoring data to understand network impacts (latency, throughput, etc….)
a. Can you evaluate if a large build is occurring (transfer of data, etc…)?
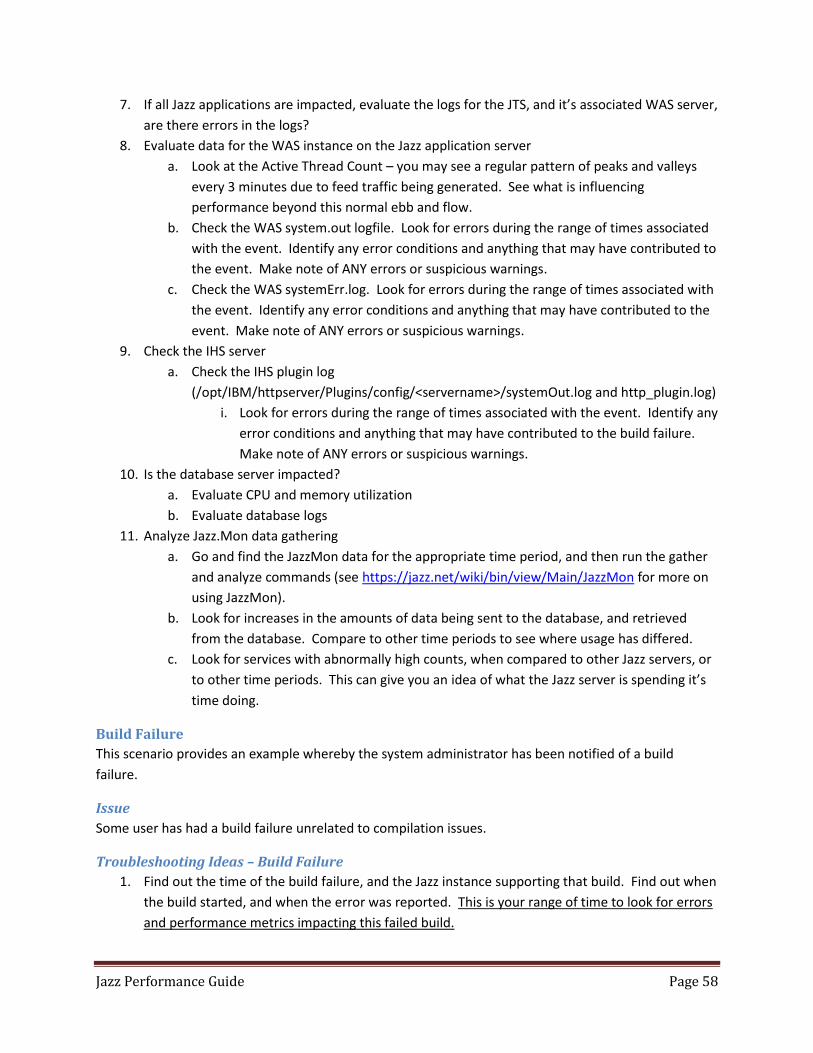
Jazz Performance Guide Page 58
7. If all Jazz applications are impacted, evaluate the logs for the JTS, and it’s associated WAS server,
are there errors in the logs?
8. Evaluate data for the WAS instance on the Jazz application server
a. Look at the Active Thread Count – you may see a regular pattern of peaks and valleys
every 3 minutes due to feed traffic being generated. See what is influencing
performance beyond this normal ebb and flow.
b. Check the WAS system.out logfile. Look for errors during the range of times associated
with the event. Identify any error conditions and anything that may have contributed to
the event. Make note of ANY errors or suspicious warnings.
c. Check the WAS systemErr.log. Look for errors during the range of times associated with
the event. Identify any error conditions and anything that may have contributed to the
event. Make note of ANY errors or suspicious warnings.
9. Check the IHS server
a. Check the IHS plugin log
(/opt/IBM/httpserver/Plugins/config/<servername>/systemOut.log and http_plugin.log)
i. Look for errors during the range of times associated with the event. Identify any
error conditions and anything that may have contributed to the build failure.
Make note of ANY errors or suspicious warnings.
10. Is the database server impacted?
a. Evaluate CPU and memory utilization
b. Evaluate database logs
11. Analyze Jazz.Mon data gathering
a. Go and find the JazzMon data for the appropriate time period, and then run the gather
and analyze commands (see https://jazz.net/wiki/bin/view/Main/JazzMon for more on
using JazzMon).
b. Look for increases in the amounts of data being sent to the database, and retrieved
from the database. Compare to other time periods to see where usage has differed.
c. Look for services with abnormally high counts, when compared to other Jazz servers, or
to other time periods. This can give you an idea of what the Jazz server is spending it’s
time doing.
Build Failure
This scenario provides an example whereby the system administrator has been notified of a build
failure.
Issue
Some user has had a build failure unrelated to compilation issues.
Troubleshooting Ideas – Build Failure
1. Find out the time of the build failure, and the Jazz instance supporting that build. Find out when
the build started, and when the error was reported. This is your range of time to look for errors
and performance metrics impacting this failed build.
Jazz Performance Guide Page 59
2. On the Jazz server where the build accessed the Jazz infrastructure, open up the Jazz application
log file, in the /logs subdirectory.
a. Look for errors range of times associated with the build. Identify any error conditions
and anything that may have contributed to the build failure. Make note of ANY errors
or suspicious warnings.
b. Check the CRJAZxx log codes, and find out what the underlying cause of the issue could
be. Make note of error codes and explanations.
3. Check the WAS system.out logfile.
a. Look for errors during the range of times associated with the build. Identify any error
conditions and anything that may have contributed to the build failure. Make note of
ANY errors or suspicious warnings
4. Check the WAS systemErr.log.
a. Look for errors during the range of times associated with the build. Identify any error
conditions and anything that may have contributed to the build failure. Make note of
ANY errors or suspicious warnings
5. Check the IHS plugin log (/opt/IBM/httpserver/Plugins/config/<servername>/systemOut.log and
http_plugin.log)
a. Look for errors during the range of times associated with the build. Identify any error
conditions and anything that may have contributed to the build failure. Make note of
ANY errors or suspicious warnings
b. For lib_httpresponse errors discovered, look at TCP/IP connections and logs to
determine if network connectivity or database connectivity has been compromised.
6. Check the IHS server logs
a. Look for errors during the range of times associated with the build. Identify any error
conditions and anything that may have contributed to the build failure. Make note of
ANY errors or suspicious warnings
7. At this point, you have checked logfiles for the web server and the Jazz application. Now you
need to check for end user impact, using your basic response time data.
a. Select a time range that reflects a range beginning one hour before your build time
range, through one hour after your build time range
b. When observing the behavior in the report, look for single site or multi-site spikes of
either long or short duration. A long duration spike indicates long term processing being
impacted, while a short term spike may just indicate.
c. If no spikes are present, then the interactive users are not experiencing any
performance issues when the build failure occurred.
Jazz Performance Guide Page 60
Potential Fixes for Common Issues This section will highlight some commonly seen issues in Jazz environments, and the steps to take when
encountering these issues. As more issues are encountered, it is strongly suggested that this section be
updated, in order to preserve “institutional knowledge” about how to address these issues.
WebSphere
JVM Garbage Collection Pauses
The JVM in which the Jazz applications run uses JVM memory for the creation of objects in memory.
Since this JVM allocates and deallocates memory on an continuous basis, at some point the JVM must
stop and do “garbage collection”, where it goes through its allocated memory and marks areas that have
been deallocated as being available. These “garbage collection” periods essentially halt application
processing when they occur.
Since applications have a variety of needs and requirements for memory, a number of “garbage
collection” algorithms are available to an application running within WebSphere. For more information
on algorithms available, and their benefits, read Java technology, IBM style: Garbage collection policies,
Part 1 on the IBM Support website.
In most Jazz implementations, IBM suggests use of the following settings:
-Xmx4G -Xms4G -Xmn512M -Xgcpolicy:gencon -Xcompressedrefs -Xgc:preferredHeapBase=0x100000000
Explanation:
-Xmx sets the maximum memory size for the JVM. In this case, it is 4GB.
-Xms sets the initial JVM heap size. In this case, it is also 4GB. It is strongly suggested that this
should ALWAYS be equal to the –Xmx parameter.
-XMn sets the initial size of the new area (or nursery) in the JVM when using a “gencon” garbage
collection policy. In this case it is 512M. For Jazz applications, a suggested ratio of 1:8 is suggested,
with this value being 1/8 of the value specified for the maximum memory size.
-Xgcpolicy:gencon sets the garbage collection policy. In this case I suggest the “gencon” policy.
Note that some customers have seen improved performance when using the “optthruput” option.
For more information on the relative merits of the various garbage collection algorithms, read Java
technology, IBM style: Garbage collection policies, Part 1 on the IBM Support website.
-Xcompressedrefs sets the JVM to use 32-bit values for references.
Xgc:preferredHeapBase=0x100000000 sets the base starting point for the JVM heap at the 1GB
boundary.
Jazz Performance Guide Page 61
Note: When allocating memory to the JVM (or JVM’s) on a particular server, a good rule of thumb is that the amount of memory allocated to the JVM’s should be, at most, half of all of the available memory. The system also needs memory for OS related activity and node agent (web server) operations. The settings shown here are a valid starting point for a system that has 8 GB of available memory.
Note: The JVM settings shown above are valid for Windows and Linux servers. Servers with other operating systems may use slightly different settings. It is always best to check the Infocenter: Setting up WebSphere Application Server for the suggested settings. These are here as an example, and to explain the various switches.
LTPA Timeout errors in the WAS Logs (systemOut.log)
This is caused by the LTPA (which provides SSO authentication capabilities) tokens being either expired,
or corrupted. These errors can be addressed in three ways. The first approach is to force the token to
be reestablished, the second is to adjust the LTPA timeout, and the third is to just ignore these errors.
For more information on this, see the LTPA Token Expired error in WebSphere Logs with Rational Team
Concert article on the IBM Support website. A nasty side effect of this error is that the WebSphere logs
grow quite large, as multiple entries are produced every second.
Approach #1 – Force Token
You can remove the LTPA Tokens which should eliminate the duplicate messages. To do this, do the
following:
Stop WebSphere
Remove the LTPA key at
WAS_HOME/profiles/profileName/config/cells/cellName/nodes/nodeName/ltpa
Restart WebSphere
Approach #2 – Adjust LTPA Timeout
You can also adjust the timeout for the LTPA, by following the procedure below:
Click Launch WebSphere Admin Console to start the WebSphere Application Server console.
In the WebSphere Application Server console navigation pane, click Security > Global security.
In the Authentication area of the Global security page, click the LTPA link.
In the LTPA timeout area of the LTPA page, edit the value for the LTPA timeout (make it an
arbitrarily large number) and click OK.
In the Messages area at the top of the Global security page, click the Save link and log out of the
WebSphere Application Server console.
Follow these steps only on the application nodes. I have found that nodes fail to come up if jceks is
removed from the deployment manager and proxy node.
Jazz Performance Guide Page 62
Inconsistent Jazz user settings
Some Jazz users have seen instances where user ID’s seem to get mismatched (i.e. User A logs into Jazz ,
and gets User B’s profile settings). This is caused by corrupted entries in the WAS LDAP cache.
Approach #1 – Clear WAS LDAP cache
When restarting WAS, it is considered a best practice to clean out the cache in WAS LDAP directory each
time. This will ensure that there is no ongoing issue with user ID’s getting mismatched.
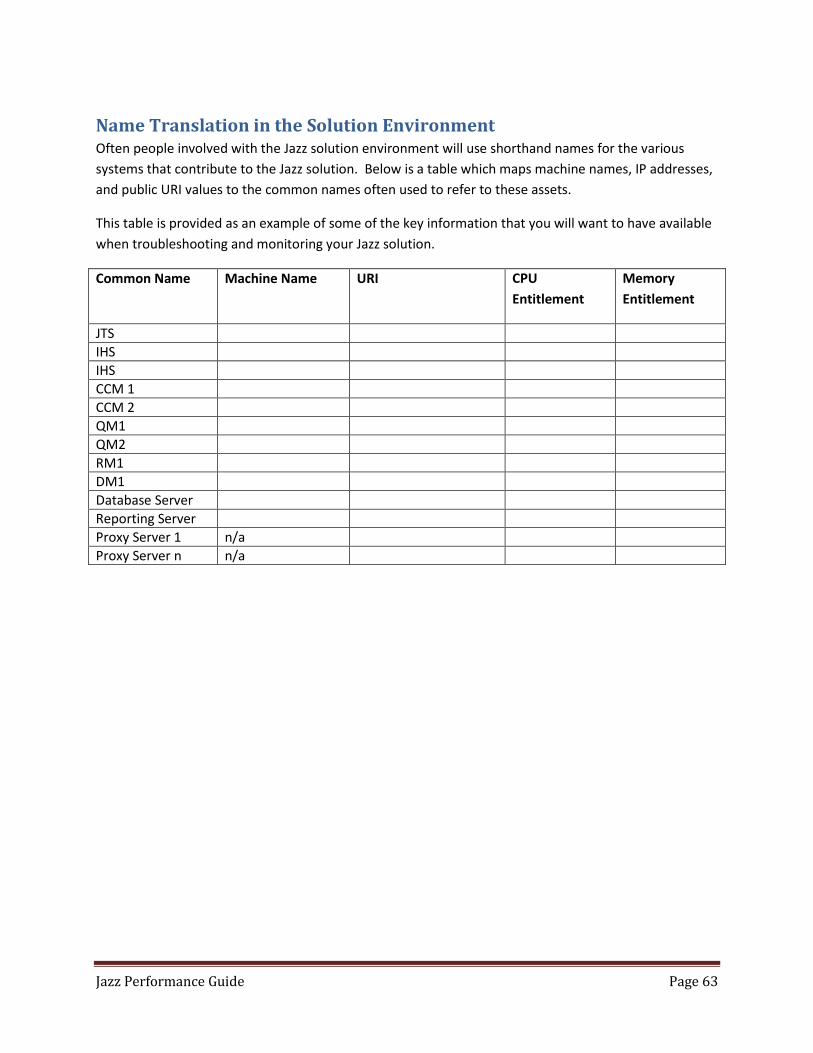
Jazz Performance Guide Page 63
Name Translation in the Solution Environment Often people involved with the Jazz solution environment will use shorthand names for the various
systems that contribute to the Jazz solution. Below is a table which maps machine names, IP addresses,
and public URI values to the common names often used to refer to these assets.
This table is provided as an example of some of the key information that you will want to have available
when troubleshooting and monitoring your Jazz solution.
Common Name Machine Name URI CPU
Entitlement
Memory
Entitlement
JTS
IHS
IHS
CCM 1
CCM 2
QM1
QM2
RM1
DM1
Database Server
Reporting Server
Proxy Server 1 n/a
Proxy Server n n/a
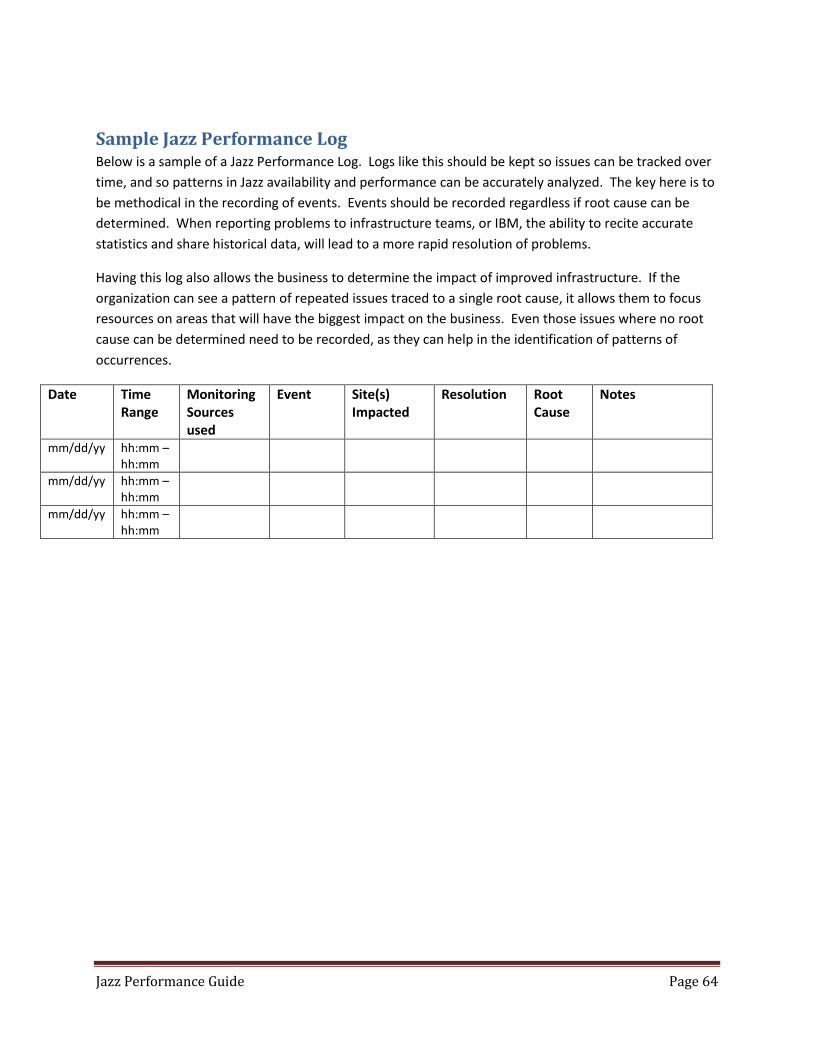
Jazz Performance Guide Page 64
Sample Jazz Performance Log Below is a sample of a Jazz Performance Log. Logs like this should be kept so issues can be tracked over
time, and so patterns in Jazz availability and performance can be accurately analyzed. The key here is to
be methodical in the recording of events. Events should be recorded regardless if root cause can be
determined. When reporting problems to infrastructure teams, or IBM, the ability to recite accurate
statistics and share historical data, will lead to a more rapid resolution of problems.
Having this log also allows the business to determine the impact of improved infrastructure. If the
organization can see a pattern of repeated issues traced to a single root cause, it allows them to focus
resources on areas that will have the biggest impact on the business. Even those issues where no root
cause can be determined need to be recorded, as they can help in the identification of patterns of
occurrences.
Date Time Range
Monitoring Sources used
Event Site(s) Impacted
Resolution Root Cause
Notes
mm/dd/yy hh:mm – hh:mm
mm/dd/yy hh:mm – hh:mm
mm/dd/yy hh:mm – hh:mm