Embed Size (px)
Citation preview
Deutsche Bank Markets Research
Global
Quantitative Strategy
Signal Processing
Date 24 April 2013
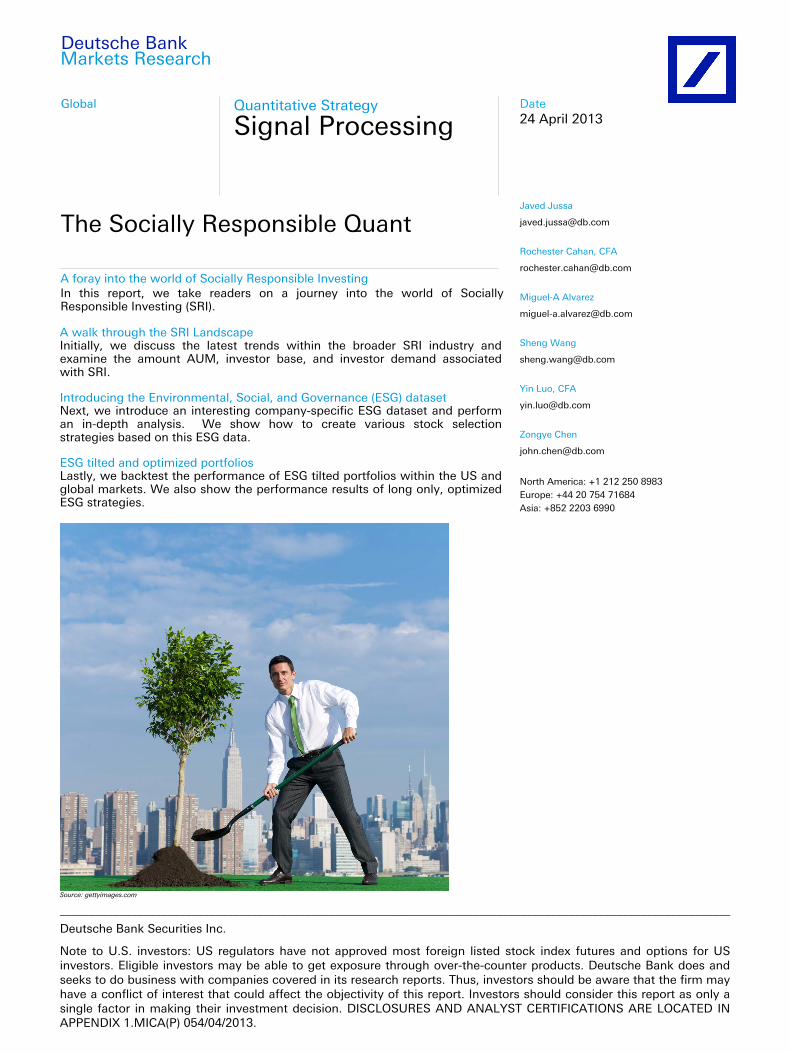
The Socially Responsible Quant
A foray into the world of Socially Responsible Investing
________________________________________________________________________________________________________________
Deutsche Bank Securities Inc.
Note to U.S. investors: US regulators have not approved most foreign listed stock index futures and options for US investors. Eligible investors may be able to get exposure through over-the-counter products. Deutsche Bank does and seeks to do business with companies covered in its research reports. Thus, investors should be aware that the firm may have a conflict of interest that could affect the objectivity of this report. Investors should consider this report as only asingle factor in making their investment decision. DISCLOSURES AND ANALYST CERTIFICATIONS ARE LOCATED IN APPENDIX 1.MICA(P) 054/04/2013.
Javed Jussa
Rochester Cahan, CFA
Miguel-A Alvarez
Sheng Wang
Yin Luo, CFA
Zongye Chen
North America: +1 212 250 8983Europe: +44 20 754 71684Asia: +852 2203 6990
In this report, we take readers on a journey into the world of Socially Responsible Investing (SRI).
A walk through the SRI Landscape Initially, we discuss the latest trends within the broader SRI industry and examine the amount AUM, investor base, and investor demand associated with SRI.
Introducing the Environmental, Social, and Governance (ESG) dataset Next, we introduce an interesting company-specific ESG dataset and perform an in-depth analysis. We show how to create various stock selection strategies based on this ESG data.
ESG tilted and optimized portfolios Lastly, we backtest the performance of ESG tilted portfolios within the US and global markets. We also show the performance results of long only, optimized ESG strategies.
Source: gettyimages.com
24 April 2013
Signal Processing
Page 2 Deutsche Bank Securities Inc.
Table Of Contents
A letter to our readers .................................................................... 3
The World of Socially Responsible Investing ................................. 4 An introductory note by the President, Deutsche Bank Americas Foundation ................. 4 The ABC’s of ESG ............................................................................................................... 4 Investors are rethinking ESG .............................................................................................. 5 Common ESG screening criteria ........................................................................................ 5 ESG regulation is in flavour ................................................................................................ 7 ESG investing is advancing ................................................................................................ 7
The Latest Trends and Styles ......................................................... 8 Major trends in ESG investments ....................................................................................... 8 The ongoing ESG debate .................................................................................................. 10
The ESG Dataset Symposium ...................................................... 12 Understanding the underlying ESG scoring process is critical ........................................ 12 How are companies rated? .............................................................................................. 12 The five step process ........................................................................................................ 13 Step 2: Company Data Collection .................................................................................... 14 Step 3: Company interviews ............................................................................................ 15 Step 4: Analysis and Rating ............................................................................................. 15 Step 5: Reality Check........................................................................................................ 16 Ongoing monitoring ......................................................................................................... 16
An Exposition into ESG ................................................................ 17 A snapshot of the dataset ................................................................................................ 17 The ESG coverage is expansionary .................................................................................. 18 Some colour on ESG sectors ............................................................................................ 21 Country coverage ............................................................................................................. 23
Forming ESG Alpha Factors ......................................................... 26 ESG prudence comes at a price ....................................................................................... 26 Controlling for factor tilts ................................................................................................. 27 A preview of our ESG factor universe .............................................................................. 28
The Backtesting Results ............................................................... 30 Monthly back testing performance of the US market ..................................................... 30 Monthly back testing performance of the Global market ................................................ 32 Does ESG perform better for longer holding periods? ..................................................... 35
ESG Titled Portfolios ..................................................................... 37 Performance of the universe ............................................................................................ 37 Performance of tilted ESG portfolios ................................................................................ 40
Optimal ESG Portfolios ................................................................. 43 US portfolio performance ................................................................................................. 43 Global portfolio performance ........................................................................................... 44 ESG and low volatility strategies ...................................................................................... 44
Special Thanks ............................................................................. 46
References .................................................................................... 47
24 April 2013
Signal Processing
Deutsche Bank Securities Inc. Page 3
A letter to our readers The infamous buzz words: “The Financial Crisis” has been associated with almost any and every recent economic event from the bankruptcies of giant global financial institutions to the debt crisis plagued by European nations. Politicians, lobbyists, senators, government officials, and regulators use these words as a punching bag to cast blame for the calamitous events that ensued as a result of “The Financial Crisis”. Undoubtedly, this blame has been pointed towards large financial institutions and to some extent investors.
These buzz words have also given rise to potentially more “socially minded” public interest groups. Through national and even international public rallies and demonstrations, the intent of such organizations is to stem public outcry and push public interests to the forefront of government mandates. Government officials have responded by ratcheting up regulation on executive compensation and wider governance and social issues.
At the same time, a paradigm shift is occurring amongst socially minded consumers, entrepreneurs, companies, leaders, and investors. These groups are demanding that large public companies integrate socially minded values and principles into their culture, operations, and business practices. As such there has been exponential growth in the popularity for Socially Responsible Investing (SRI). As a global quant research team, we have seen a significant increase in client demand among quant funds, hedge funds, mutual funds, and pension funds for SRI performance metrics and products.
As such, in this report, we take an in-depth look at SRI. We begin by an examination of the broader SRI industry and discuss the various growing trends and segments. Next, we describe an interesting environmental, social, and governance (ESG) dataset provided by MSCI ESG Research. We employ this ESG dataset to analyze the performance and efficacy of ESG based factors and portfolio strategies. Lastly, we discuss how to create and implement ESG tilted portfolios.
In this report, we do not touch upon the ensuing debate to whether public companies should be responsible for pursuing ESG efforts or whether these companies should solely focus on maximizing shareholder value? Or whether these two initiatives are naturally one and the same? Although, this would make an interesting and hotly debated discussion, we take a more pragmatic and empirical approach and allow our readers to form their own opinions. We hope you enjoy the remainder of the report.
Regards,
Yin, Rocky, Miguel, Javed, John, and Sheng Deutsche Bank North American Quantitative Strategy
24 April 2013
Signal Processing
Page 4 Deutsche Bank Securities Inc.
The World of Socially Responsible Investing
An introductory note by the President, Deutsche Bank Americas Foundation
Socially Responsible Investing (SRI) has come of age as a distinct asset class. A new generation of individual and institutional investors is increasingly recognizing the responsibility and opportunity, they have put their capital to work to affect positive social and environmental change. This momentum is not only being led by sympathetic mission driven institutions like universities, foundations and pension funds but high net worth individuals, as well, many of whom have generated their own wealth and are keen to support others’ entrepreneurial efforts that can lead to positive outcomes for society.
The backdrop for this new form of “conscience capitalism” is an appreciation for the limitations of government and traditional charity to meet the demands of increasingly complex world. Challenges ranging from poverty to climate change are now being tackled by entrepreneurial initiatives, which like more conventional enterprises; require access to capital to reach sustainability and scale.
In my role as head of the Deutsche Bank’s Community Development Finance Group I have had the opportunity to participate in helping to grow a remarkable portfolio of social enterprises that are bringing educational opportunities to the poor in Africa, reliable solar lighting to displacement camps in Haiti, access to small loans for woman entrepreneurs throughout Latin America and creating fresh food outlets in areas of high concentrated poverty in the United States. We have placed more than $2 billion in capital and are profoundly impressed with the credit quality of these loans and investments as well as the impact they are having in improving communities and lives.
This report is a welcome addition to the literature that can make this industry better known and understood.
Gary Hattem Managing Director, Deutsche Bank Community Development Finance Group President, Deutsche Bank Americas Foundation
The ABC’s of ESG
ESG (Environmental, Social, and Governance) is an investment approach that takes into account the environmental, social and governance impact when making investment-related decisions. The ESG philosophy can take on many forms. It can be as simple as screening out companies from an investor’s universe that rank poorly on ESG criteria. Or the ESG philosophy can take on a much more rigorous approach where investors incorporate specific ESG data towards companies or industries as an integral component of their investment analysis and decision process. The acronym SRI (Social Responsible Investing) is often coined with ESG. The areas concerned with SRI can typically be summarized under environment, social, and governance pillars. In this research, we use SRI and ESG interchangeably.
24 April 2013
Signal Processing
Deutsche Bank Securities Inc. Page 5
ESG or SRI is not a new investment philosophy albeit ESG investing has gained increasingly popularity from investment managers during the past five years. This is undoubtedly due to the multitude of governance issues faced by the financial industry as a result of the financial crisis. In fact, the origins of the ESG philosophy date back to the 17th century. During this time, the roots of ESG were primarily religiously motivated. Interestingly, back in the 17th century, a religious movement known as the Quakers or Friends preached the basic tenants of ESG. The Quakers were known for their refusal to participate in war, opposition to slavery, and the opposition to alcohol. Some Quakers went on to form institutions exemplifying such principles.
Investors are rethinking ESG
Fast forwarding to more recent times, many cataclysmic events have made investors reconsider or revisit their approach to ESG. On April 26, 1986, reactor four at the Chernobyl Nuclear Power Plant in the Ukraine exploded causing one of the worst nuclear accidents in history. Large quantities of radioactive particles rose into the atmosphere and spread to Western Soviet Union and Europe. Some studies have stated that the Chernobyl accident caused a major public health impact lasting 20 years after the explosion. On March 24, 1989 an Exxon Valdez oil tanker bound for Long Beach, California struck the Bligh Reef and caused 11 million gallons of oil to spill affecting approximately 1,300 miles of shoreline. These and other events arguably caused the onset of the ESG uprising when investors began to rethink SRI. Proponents of ESG investing would argue that avoiding such companies or industries would not only boost investment returns, but also, in turn, force companies to be more diligent towards environment, social and governance matters. Understandably, this is a hotly debated subject area. The aim of this report is to illustrate more empirical and objective evidence on ESG investing so that investors can better assess the merits of ESG investment adoption.
Common ESG screening criteria
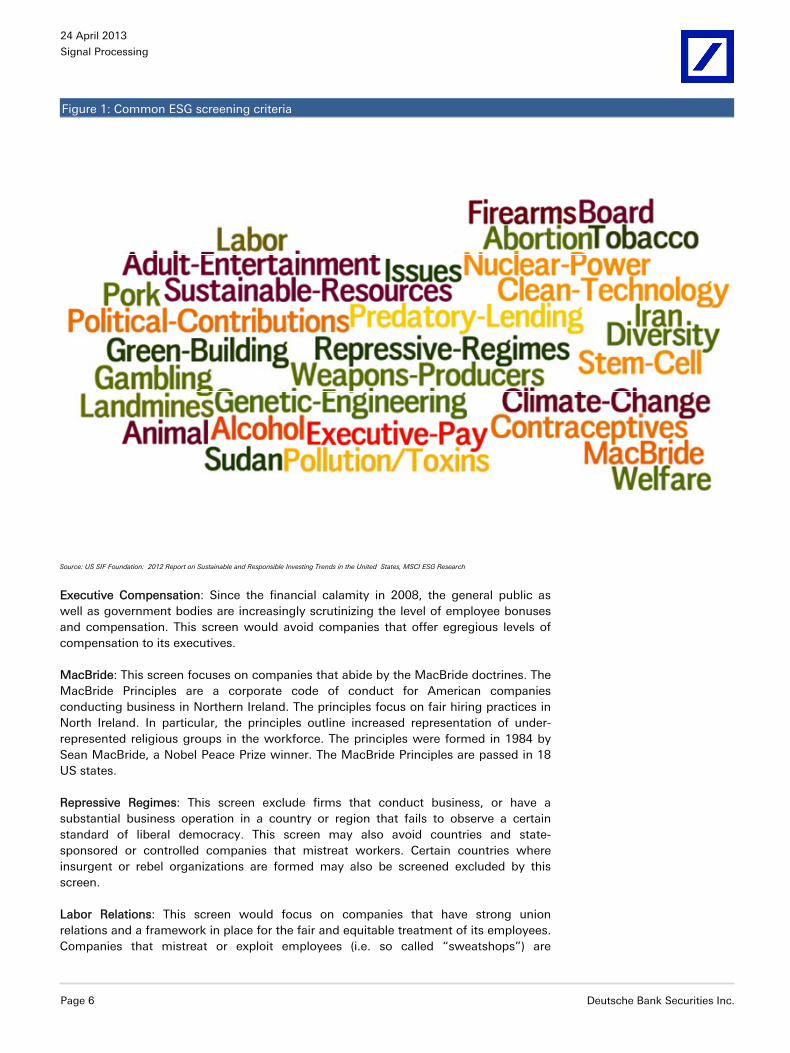
What does a typical ESG screen look like? Figure 1 shows some of the most commonly cited ESG criteria used for screening companies. As you can see, this list spans a wide array of criteria from sustainability, nuclear power, tobacco to animal testing, human rights, and affordable housing. A criterion likely exists for almost any type of ESG concern. Most of these criteria are relatively self explanatory; however, it’s worthwhile to point out a few, more notable ones.
24 April 2013
Signal Processing
Page 6 Deutsche Bank Securities Inc.
Figure 1: Common ESG screening criteria
Source: US SIF Foundation: 2012 Report on Sustainable and Responsible Investing Trends in the United States, MSCI ESG Research
Executive Compensation: Since the financial calamity in 2008, the general public as well as government bodies are increasingly scrutinizing the level of employee bonuses and compensation. This screen would avoid companies that offer egregious levels of compensation to its executives.
MacBride: This screen focuses on companies that abide by the MacBride doctrines. The MacBride Principles are a corporate code of conduct for American companies conducting business in Northern Ireland. The principles focus on fair hiring practices in North Ireland. In particular, the principles outline increased representation of under-represented religious groups in the workforce. The principles were formed in 1984 by Sean MacBride, a Nobel Peace Prize winner. The MacBride Principles are passed in 18 US states.
Repressive Regimes: This screen exclude firms that conduct business, or have a substantial business operation in a country or region that fails to observe a certain standard of liberal democracy. This screen may also avoid countries and state-sponsored or controlled companies that mistreat workers. Certain countries where insurgent or rebel organizations are formed may also be screened excluded by this screen.
Labor Relations: This screen would focus on companies that have strong union relations and a framework in place for the fair and equitable treatment of its employees. Companies that mistreat or exploit employees (i.e. so called “sweatshops”) are
24 April 2013
Signal Processing
Deutsche Bank Securities Inc. Page 7
screened out. In addition, companies that endanger the health and safety of its workforce are also excluded.
Diversity: This screen searches for companies that actively encourage fair practices and recruitment for minorities, LGBT employees, disabled workers, veterans, women and under-represented individuals.
ESG regulation is in flavour
The regulatory umbrellas governing the global investment community has been slowly tilting in favor of socially responsible investors. Several countries in Europe (including the United Kingdom) have passed laws requiring pension funds to disclose ESG related policy and information.
More recently, in 2010, the Dodd-Frank Financial Reform Law allows shareholders to hold an advisory vote on executive compensation packages. The law further stipulates that public companies must provide disclosure around pay disparity, payments made to foreign governments, mine safety and other ESG related issues.
Beyond regulatory bodies, other organizations have formed that advocate SRI principles. The Carbon Disclosure Project (CDP) was established in the United Kingdom in 2000. They work alongside 3000 companies (and on behalf of 600 institutional investors) to measure, disclose and reduce their carbon footprint. Such data is made available to institutional investors and policy makers.1
ESG investing is advancing
Like most quantitative and fundamental strategies, the ESG investment approach has evolved over time. Initially, ESG strategies involved excluding companies that belonged to a particular industry or sector from an investable universe. For example, Green Funds may exclude oil and mining companies from their investable universe. Similarly, Faith-based funds may exclude companies that sell pork products or companies associated with abortion practices.
Over time, ESG strategies evolved into more inclusion based screening. This means that investment managers would seek out companies that rated well based on ESG criteria. For example, funds investing in nuclear energy may seek out companies that exemplify strong governance, safety, operational, and environmental principles. This is of course accompanied alongside rigorous financial analysis. More recently, more sophisticated and systematic investors are attempting to use ESG datasets to potentially uncover hidden alpha.
Another growing and popular trend within the ESG investment community is shareholder activism and resolution. Many faith-based investment funds, labor funds and endowments engage in discussions with portfolio companies on ESG related initiatives. Proposals by shareholders can be submitted for a vote at the company’s annual meeting. Typically, shareholders submit resolutions regarding governance, social responsibility or executive compensation. Shareholder resolutions allow investment managers to willfully engages and influence companies ESG policy. One of the most famous shareholder resolution cases was with Dow Chemical in 1972 to protest the use of napalm, a petroleum jelly used in warfare.
1 See US SIF Foundation: 2012 Report on Sustainable and Responsible Investing Trends in the United States
24 April 2013
Signal Processing
Page 8 Deutsche Bank Securities Inc.
The Latest Trends and Styles
Major trends in ESG investments
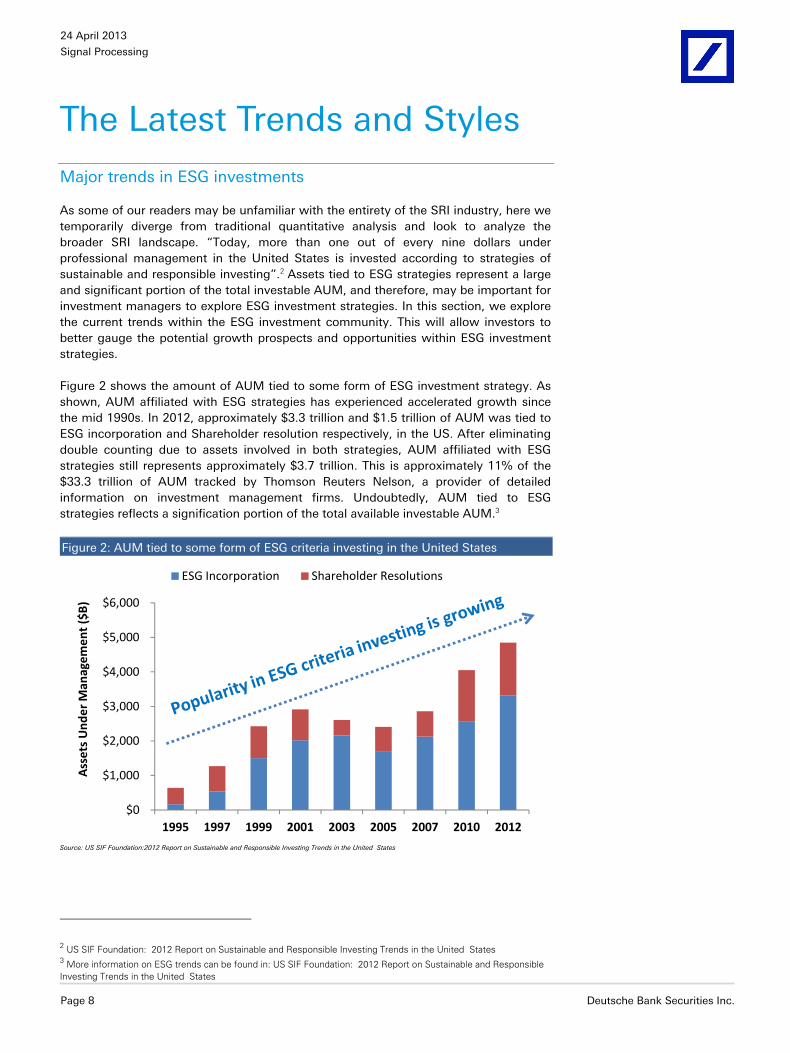
As some of our readers may be unfamiliar with the entirety of the SRI industry, here we temporarily diverge from traditional quantitative analysis and look to analyze the broader SRI landscape. “Today, more than one out of every nine dollars under professional management in the United States is invested according to strategies of sustainable and responsible investing”.2 Assets tied to ESG strategies represent a large and significant portion of the total investable AUM, and therefore, may be important for investment managers to explore ESG investment strategies. In this section, we explore the current trends within the ESG investment community. This will allow investors to better gauge the potential growth prospects and opportunities within ESG investment strategies.
Figure 2 shows the amount of AUM tied to some form of ESG investment strategy. As shown, AUM affiliated with ESG strategies has experienced accelerated growth since the mid 1990s. In 2012, approximately $3.3 trillion and $1.5 trillion of AUM was tied to ESG incorporation and Shareholder resolution respectively, in the US. After eliminating double counting due to assets involved in both strategies, AUM affiliated with ESG strategies still represents approximately $3.7 trillion. This is approximately 11% of the $33.3 trillion of AUM tracked by Thomson Reuters Nelson, a provider of detailed information on investment management firms. Undoubtedly, AUM tied to ESG strategies reflects a signification portion of the total available investable AUM.3
Figure 2: AUM tied to some form of ESG criteria investing in the United States
$0
$1,000
$2,000
$3,000
$4,000
$5,000
$6,000
1995 1997 1999 2001 2003 2005 2007 2010 2012
Ass
ets
Und
er M
anag
emen
t ($
B)
ESG Incorporation Shareholder Resolutions
Source: US SIF Foundation:2012 Report on Sustainable and Responsible Investing Trends in the United States
2 US SIF Foundation: 2012 Report on Sustainable and Responsible Investing Trends in the United States 3 More information on ESG trends can be found in: US SIF Foundation: 2012 Report on Sustainable and Responsible Investing Trends in the United States
24 April 2013
Signal Processing
Deutsche Bank Securities Inc. Page 9
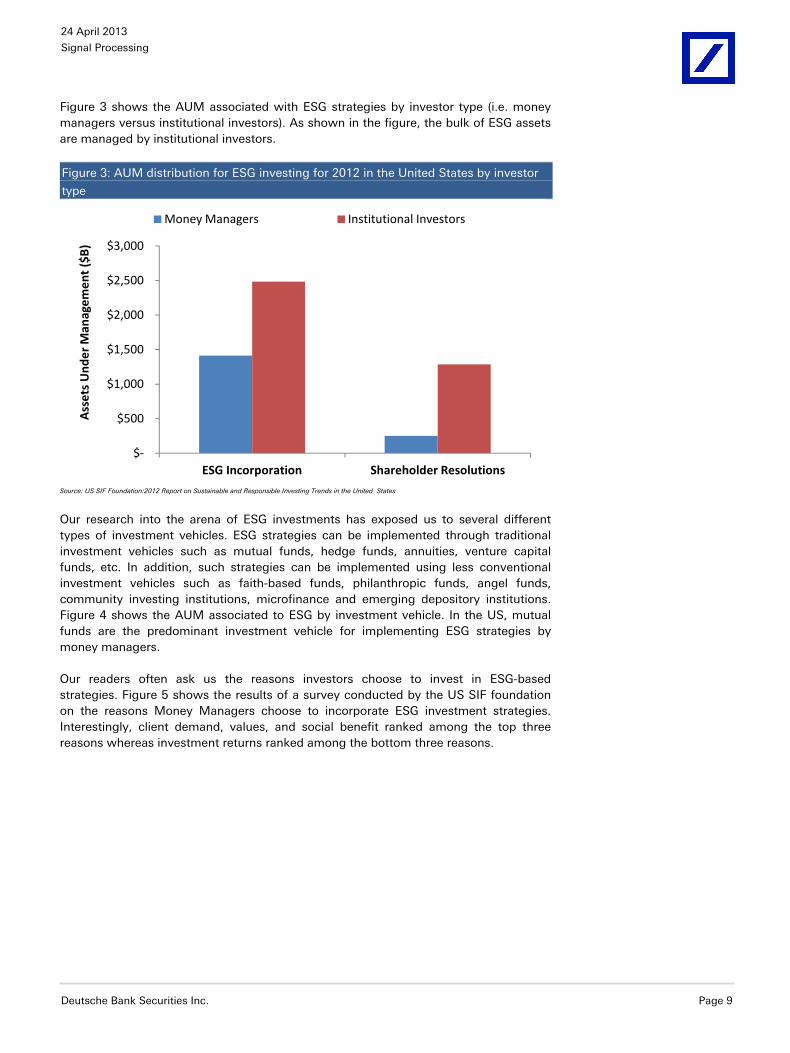
Figure 3 shows the AUM associated with ESG strategies by investor type (i.e. money managers versus institutional investors). As shown in the figure, the bulk of ESG assets are managed by institutional investors.
Figure 3: AUM distribution for ESG investing for 2012 in the United States by investor
type
$-
$500
$1,000
$1,500
$2,000
$2,500
$3,000
ESG Incorporation Shareholder Resolutions
Ass
ets
Und
er M
anag
emen
t ($
B)
Money Managers Institutional Investors
Source: US SIF Foundation:2012 Report on Sustainable and Responsible Investing Trends in the United States
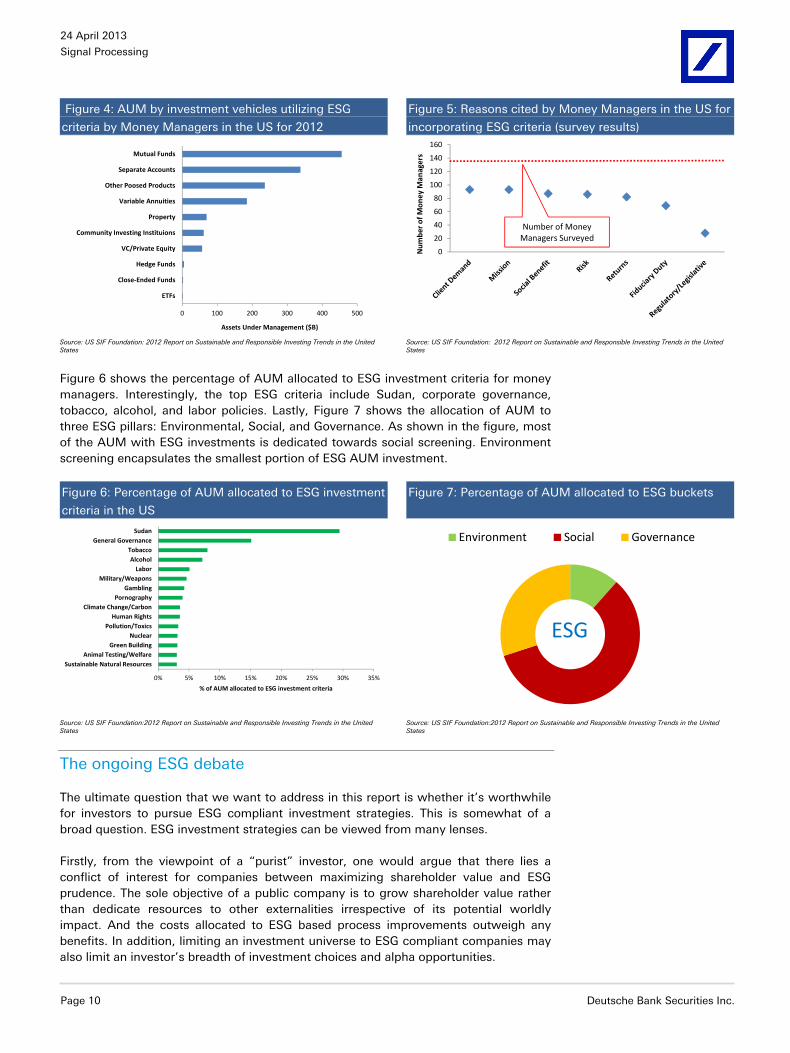
Our research into the arena of ESG investments has exposed us to several different types of investment vehicles. ESG strategies can be implemented through traditional investment vehicles such as mutual funds, hedge funds, annuities, venture capital funds, etc. In addition, such strategies can be implemented using less conventional investment vehicles such as faith-based funds, philanthropic funds, angel funds, community investing institutions, microfinance and emerging depository institutions. Figure 4 shows the AUM associated to ESG by investment vehicle. In the US, mutual funds are the predominant investment vehicle for implementing ESG strategies by money managers.
Our readers often ask us the reasons investors choose to invest in ESG-based strategies. Figure 5 shows the results of a survey conducted by the US SIF foundation on the reasons Money Managers choose to incorporate ESG investment strategies. Interestingly, client demand, values, and social benefit ranked among the top three reasons whereas investment returns ranked among the bottom three reasons.
24 April 2013
Signal Processing
Page 10 Deutsche Bank Securities Inc.
Figure 4: AUM by investment vehicles utilizing ESG
criteria by Money Managers in the US for 2012
Figure 5: Reasons cited by Money Managers in the US for
incorporating ESG criteria (survey results)
0 100 200 300 400 500
ETFs
Close-Ended Funds
Hedge Funds
VC/Private Equity
Community Investing Instituions
Property
Variable Annuities
Other Poosed Products
Separate Accounts
Mutual Funds
Assets Under Management ($B)
0
20
40
60
80
100
120
140
160
Num
ber o
f Mon
ey M
anag
ers
Number of Money Managers Surveyed
Source: US SIF Foundation: 2012 Report on Sustainable and Responsible Investing Trends in the United States Source: US SIF Foundation: 2012 Report on Sustainable and Responsible Investing Trends in the United
States
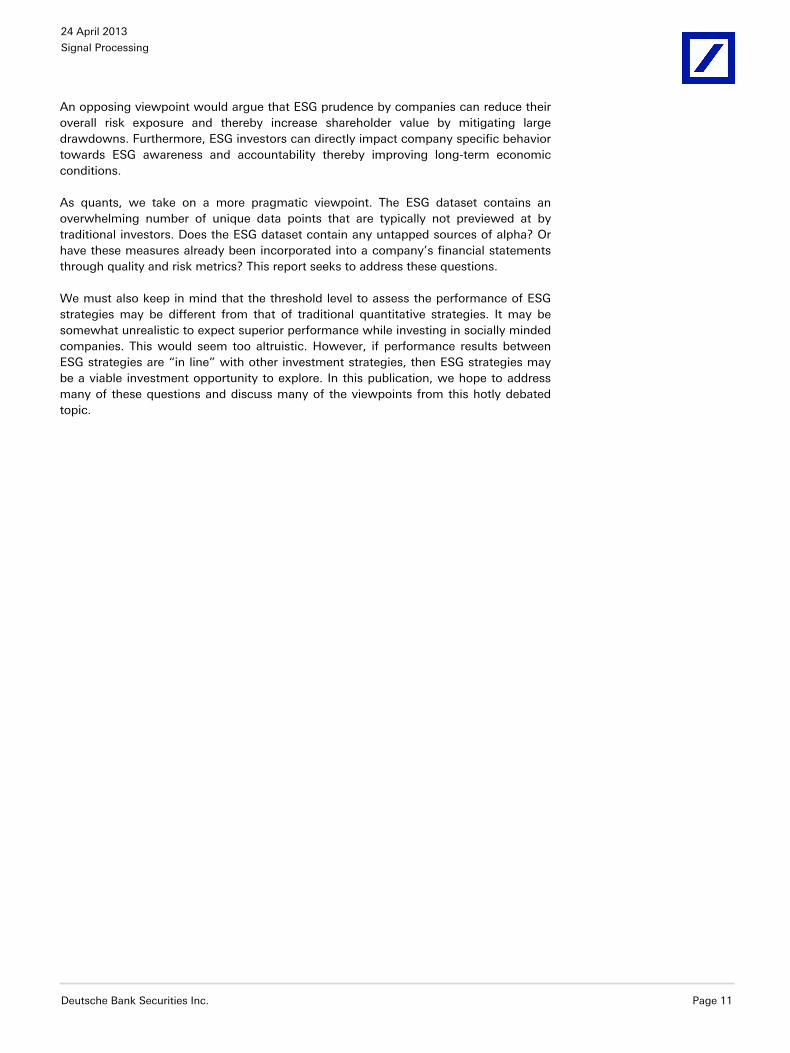
Figure 6 shows the percentage of AUM allocated to ESG investment criteria for money managers. Interestingly, the top ESG criteria include Sudan, corporate governance, tobacco, alcohol, and labor policies. Lastly, Figure 7 shows the allocation of AUM to three ESG pillars: Environmental, Social, and Governance. As shown in the figure, most of the AUM with ESG investments is dedicated towards social screening. Environment screening encapsulates the smallest portion of ESG AUM investment.
Figure 6: Percentage of AUM allocated to ESG investment
criteria in the US
Figure 7: Percentage of AUM allocated to ESG buckets
0% 5% 10% 15% 20% 25% 30% 35%
Sustainable Natural ResourcesAnimal Testing/Welfare
Green BuildingNuclear
Pollution/ToxicsHuman Rights
Climate Change/CarbonPornography
GamblingMilitary/Weapons
LaborAlcohol
TobaccoGeneral Governance
Sudan
% of AUM allocated to ESG investment criteria
Environment Social Governance
ESG
Source: US SIF Foundation:2012 Report on Sustainable and Responsible Investing Trends in the United States Source: US SIF Foundation:2012 Report on Sustainable and Responsible Investing Trends in the United
States
The ongoing ESG debate
The ultimate question that we want to address in this report is whether it’s worthwhile for investors to pursue ESG compliant investment strategies. This is somewhat of a broad question. ESG investment strategies can be viewed from many lenses.
Firstly, from the viewpoint of a “purist” investor, one would argue that there lies a conflict of interest for companies between maximizing shareholder value and ESG prudence. The sole objective of a public company is to grow shareholder value rather than dedicate resources to other externalities irrespective of its potential worldly impact. And the costs allocated to ESG based process improvements outweigh any benefits. In addition, limiting an investment universe to ESG compliant companies may also limit an investor’s breadth of investment choices and alpha opportunities.
24 April 2013
Signal Processing
Deutsche Bank Securities Inc. Page 11
An opposing viewpoint would argue that ESG prudence by companies can reduce their overall risk exposure and thereby increase shareholder value by mitigating large drawdowns. Furthermore, ESG investors can directly impact company specific behavior towards ESG awareness and accountability thereby improving long-term economic conditions.
As quants, we take on a more pragmatic viewpoint. The ESG dataset contains an overwhelming number of unique data points that are typically not previewed at by traditional investors. Does the ESG dataset contain any untapped sources of alpha? Or have these measures already been incorporated into a company’s financial statements through quality and risk metrics? This report seeks to address these questions.
We must also keep in mind that the threshold level to assess the performance of ESG strategies may be different from that of traditional quantitative strategies. It may be somewhat unrealistic to expect superior performance while investing in socially minded companies. This would seem too altruistic. However, if performance results between ESG strategies are “in line” with other investment strategies, then ESG strategies may be a viable investment opportunity to explore. In this publication, we hope to address many of these questions and discuss many of the viewpoints from this hotly debated topic.
24 April 2013
Signal Processing
Page 12 Deutsche Bank Securities Inc.
The ESG Dataset Symposium Understanding the underlying ESG scoring process is critical
There are countless academic and practitioner papers discussing the merits of using ESG data for stock selection, as a screening tool, as an alpha factor, or a risk factor. The results of these studies are mixed, at best. This could be due to a variety of reasons. However, the various discrepancies in the academic findings may be a result of the construction of the underlying ESG data.
There are several vendors that provide ESG data. Although there are some commonalities in the collection and rating process of ESG data, each vendor typically employs a somewhat different methodology and framework. As a result, ESG ratings and findings can differ depending on the selected vendor. An ESG vendor’s ability to tap into unique ESG data sources or informational sets may be a competitive advantage. As such, it is critical that investment managers understand the process by which a vendor gathers and rates companies based on ESG metrics. In this section, we conduct an in-depth analysis on how MSCI ESG Research collects, constructs and rates companies based on ESG data.4
How are companies rated?
MSCI ESG scores are designed to assist investment managers with the screening and analysis of companies based on sustainability factors as opposed to conventional financial metrics. MSCI ESG scores attempt to gauges a company’s impact on environmental, social, and governance pillars. MSCI provides overall ESG industry adjusted scores for companies that are predominantly apart of the MSCI World Index with data commencing from 1999 onwards. In addition, MSCI provides more granular scores and weights for each sustainability pillar: Environmental, Social, and Governance.
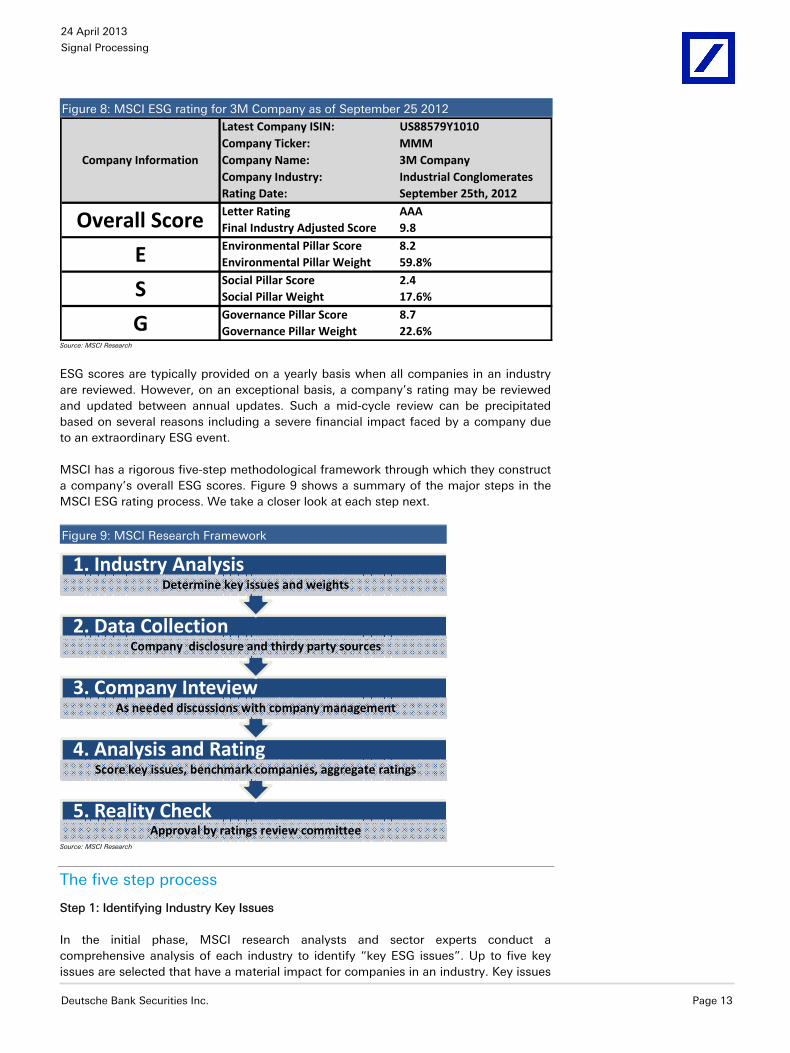
Figure 8 shows a snapshot of the MSCI ESG score for 3M Company. MSCI provides an overall ESG numeric and letter score. The overall score is based on a scale of 0 (i.e. CCC) to 10 (i.e. AAA) where the highest ranked companies receive a rating of 10 and lowest ranked companies receive a rating of 0. The overall score is industry adjusted and compares how well a company ranks among its industry peers in terms of ESG criteria. The overall ESG score is derived from the underlying ESG pillars (i.e. Environmental, Social, and Governance). Each underlying ESG pillar is given a score and a weight.
4 More detailed information on the MSCI ESG methodology can be found in: Intangible Value Assessment (IVA) Methodology, November 2012
24 April 2013
Signal Processing
Deutsche Bank Securities Inc. Page 13
Figure 8: MSCI ESG rating for 3M Company as of September 25 2012
Latest Company ISIN: US88579Y1010Company Ticker: MMMCompany Name: 3M CompanyCompany Industry: Industrial ConglomeratesRating Date: September 25th, 2012Letter Rating AAAFinal Industry Adjusted Score 9.8Environmental Pillar Score 8.2Environmental Pillar Weight 59.8%Social Pillar Score 2.4Social Pillar Weight 17.6%Governance Pillar Score 8.7Governance Pillar Weight 22.6%
E
S
G
Company Information
Overall Score
Source: MSCI Research
ESG scores are typically provided on a yearly basis when all companies in an industry are reviewed. However, on an exceptional basis, a company’s rating may be reviewed and updated between annual updates. Such a mid-cycle review can be precipitated based on several reasons including a severe financial impact faced by a company due to an extraordinary ESG event.
MSCI has a rigorous five-step methodological framework through which they construct a company’s overall ESG scores. Figure 9 shows a summary of the major steps in the MSCI ESG rating process. We take a closer look at each step next.
Figure 9: MSCI Research Framework
5. Reality CheckApproval by ratings review committee
4. Analysis and RatingScore key issues, benchmark companies, aggregate ratings
3. Company InteviewAs needed discussions with company management
2. Data CollectionCompany disclosure and thirdy party sources
1. Industry Analysis Determine key issues and weights
Source: MSCI Research
The five step process
Step 1: Identifying Industry Key Issues
In the initial phase, MSCI research analysts and sector experts conduct a comprehensive analysis of each industry to identify “key ESG issues”. Up to five key issues are selected that have a material impact for companies in an industry. Key issues
24 April 2013
Signal Processing
Page 14 Deutsche Bank Securities Inc.
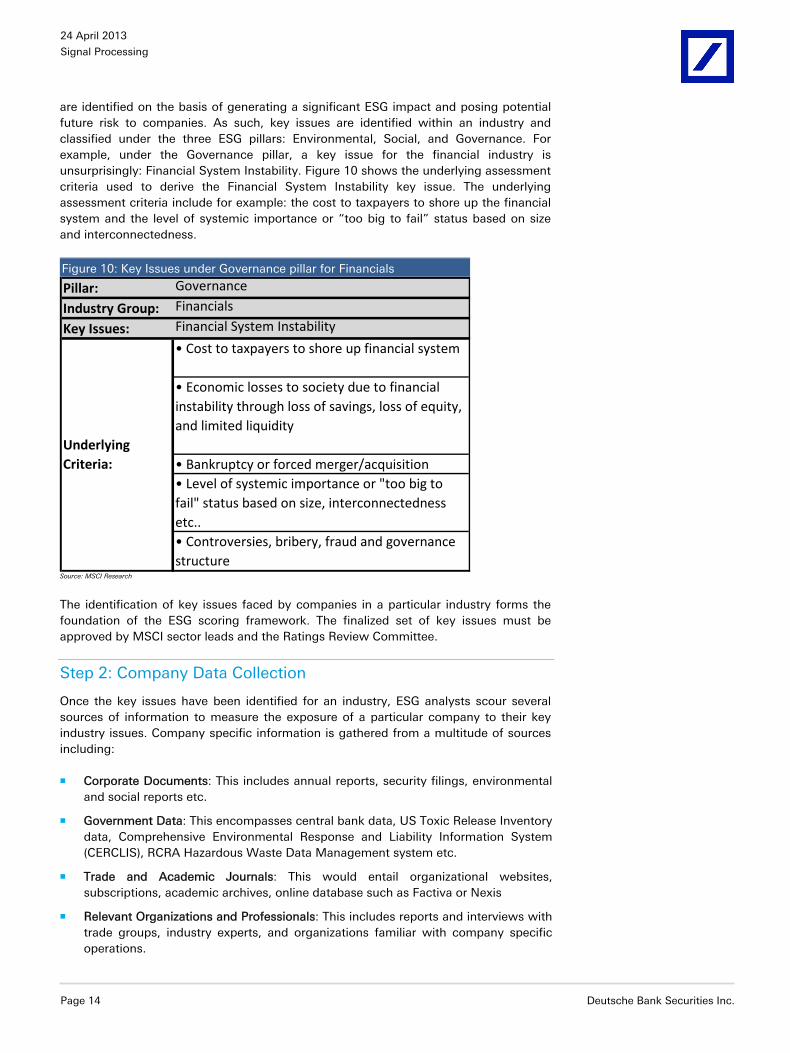
are identified on the basis of generating a significant ESG impact and posing potential future risk to companies. As such, key issues are identified within an industry and classified under the three ESG pillars: Environmental, Social, and Governance. For example, under the Governance pillar, a key issue for the financial industry is unsurprisingly: Financial System Instability. Figure 10 shows the underlying assessment criteria used to derive the Financial System Instability key issue. The underlying assessment criteria include for example: the cost to taxpayers to shore up the financial system and the level of systemic importance or “too big to fail” status based on size and interconnectedness.
Figure 10: Key Issues under Governance pillar for Financials
Pillar: Governance
Industry Group: Financials
Key Issues: Financial System Instability
• Cost to taxpayers to shore up financial system
• Economic losses to society due to financial instability through loss of savings, loss of equity, and limited liquidity
• Bankruptcy or forced merger/acquisition• Level of systemic importance or "too big to fail" status based on size, interconnectedness etc..• Controversies, bribery, fraud and governance structure
Underlying Criteria:
Source: MSCI Research
The identification of key issues faced by companies in a particular industry forms the foundation of the ESG scoring framework. The finalized set of key issues must be approved by MSCI sector leads and the Ratings Review Committee.
Step 2: Company Data Collection
Once the key issues have been identified for an industry, ESG analysts scour several sources of information to measure the exposure of a particular company to their key industry issues. Company specific information is gathered from a multitude of sources including:
Corporate Documents: This includes annual reports, security filings, environmental and social reports etc.
Government Data: This encompasses central bank data, US Toxic Release Inventory data, Comprehensive Environmental Response and Liability Information System (CERCLIS), RCRA Hazardous Waste Data Management system etc.
Trade and Academic Journals: This would entail organizational websites, subscriptions, academic archives, online database such as Factiva or Nexis
Relevant Organizations and Professionals: This includes reports and interviews with trade groups, industry experts, and organizations familiar with company specific operations.
24 April 2013
Signal Processing
Deutsche Bank Securities Inc. Page 15
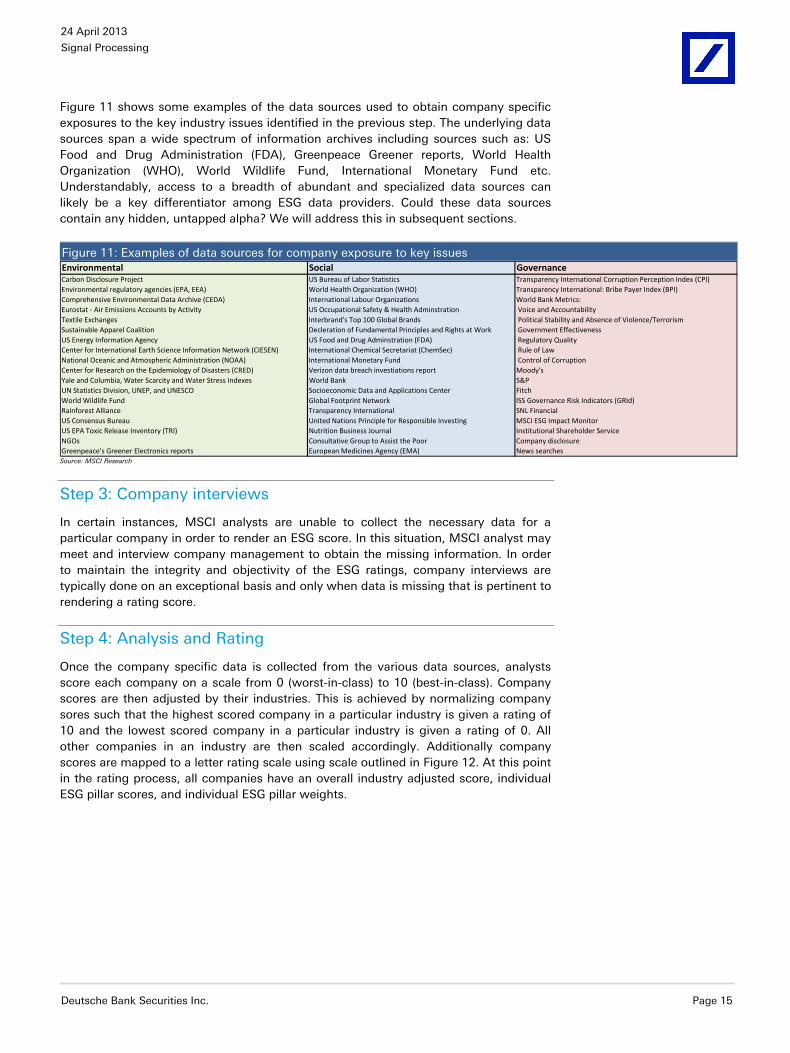
Figure 11 shows some examples of the data sources used to obtain company specific exposures to the key industry issues identified in the previous step. The underlying data sources span a wide spectrum of information archives including sources such as: US Food and Drug Administration (FDA), Greenpeace Greener reports, World Health Organization (WHO), World Wildlife Fund, International Monetary Fund etc. Understandably, access to a breadth of abundant and specialized data sources can likely be a key differentiator among ESG data providers. Could these data sources contain any hidden, untapped alpha? We will address this in subsequent sections.
Figure 11: Examples of data sources for company exposure to key issues Environmental Social GovernanceCarbon Disclosure Project US Bureau of Labor Statistics Transparency International Corruption Perception Index (CPI)Environmental regulatory agencies (EPA, EEA) World Health Organization (WHO) Transparency International: Bribe Payer Index (BPI)Comprehensive Environmental Data Archive (CEDA) International Labour Organizations World Bank Metrics:Eurostat - Air Emissions Accounts by Activity US Occupational Safety & Health Adminstration Voice and AccountabilityTextile Exchanges Interbrand's Top 100 Global Brands Political Stability and Absence of Violence/TerrorismSustainable Apparel Coalition Decleration of Fundamental Principles and Rights at Work Government EffectivenessUS Energy Information Agency US Food and Drug Adminstration (FDA) Regulatory QualityCenter for International Earth Science Information Network (CIESEN) International Chemical Secretariat (ChemSec) Rule of LawNational Oceanic and Atmospheric Administration (NOAA) International Monetary Fund Control of CorruptionCenter for Research on the Epidemiology of Disasters (CRED) Verizon data breach investiations report Moody'sYale and Columbia, Water Scarcity and Water Stress Indexes World Bank S&PUN Statistics Division, UNEP, and UNESCO Socioeconomic Data and Applications Center FitchWorld Wildlife Fund Global Footprint Network ISS Governance Risk Indicators (GRId)Rainforest Alliance Transparency International SNL FinancialUS Consensus Bureau United Nations Principle for Responsible Investing MSCI ESG Impact MonitorUS EPA Toxic Release Inventory (TRI) Nutrition Business Journal Institutional Shareholder ServiceNGOs Consultative Group to Assist the Poor Company disclosureGreenpeace's Greener Electronics reports European Medicines Agency (EMA) News searchesSource: MSCI Research
Step 3: Company interviews
In certain instances, MSCI analysts are unable to collect the necessary data for a particular company in order to render an ESG score. In this situation, MSCI analyst may meet and interview company management to obtain the missing information. In order to maintain the integrity and objectivity of the ESG ratings, company interviews are typically done on an exceptional basis and only when data is missing that is pertinent to rendering a rating score.
Step 4: Analysis and Rating
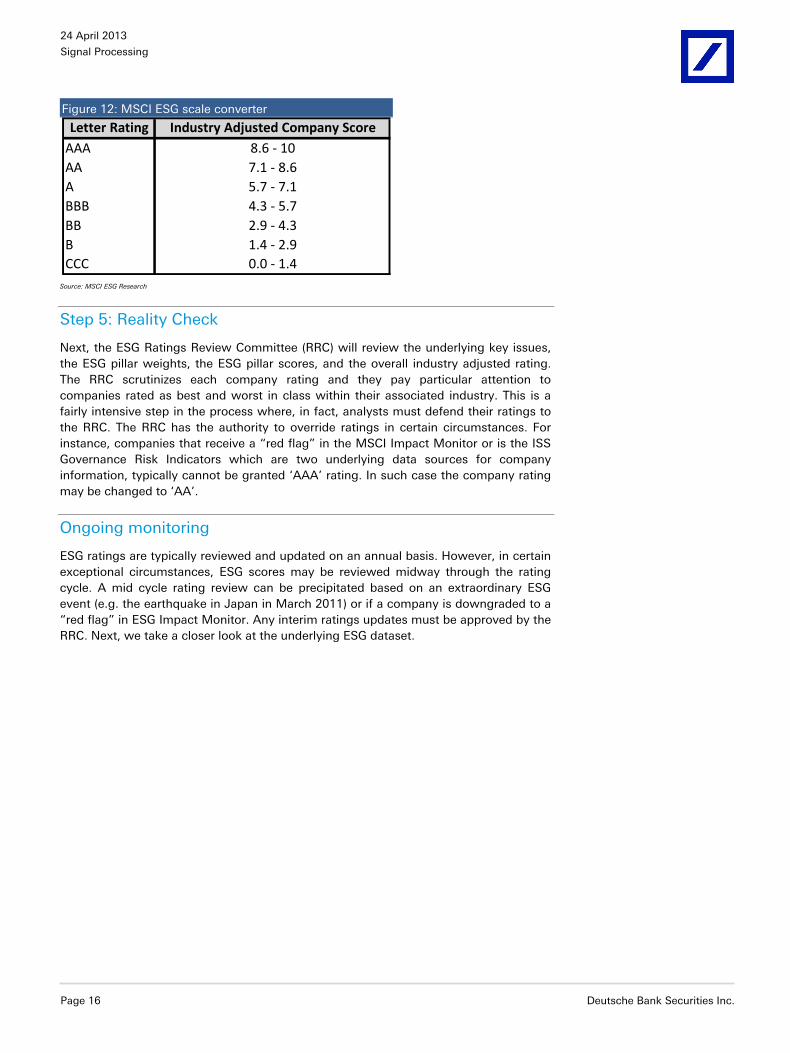
Once the company specific data is collected from the various data sources, analysts score each company on a scale from 0 (worst-in-class) to 10 (best-in-class). Company scores are then adjusted by their industries. This is achieved by normalizing company sores such that the highest scored company in a particular industry is given a rating of 10 and the lowest scored company in a particular industry is given a rating of 0. All other companies in an industry are then scaled accordingly. Additionally company scores are mapped to a letter rating scale using scale outlined in Figure 12. At this point in the rating process, all companies have an overall industry adjusted score, individual ESG pillar scores, and individual ESG pillar weights.
24 April 2013
Signal Processing
Page 16 Deutsche Bank Securities Inc.
Figure 12: MSCI ESG scale converter
Letter Rating Industry Adjusted Company ScoreAAA 8.6 - 10AA 7.1 - 8.6A 5.7 - 7.1BBB 4.3 - 5.7BB 2.9 - 4.3B 1.4 - 2.9CCC 0.0 - 1.4
Source: MSCI ESG Research
Step 5: Reality Check
Next, the ESG Ratings Review Committee (RRC) will review the underlying key issues, the ESG pillar weights, the ESG pillar scores, and the overall industry adjusted rating. The RRC scrutinizes each company rating and they pay particular attention to companies rated as best and worst in class within their associated industry. This is a fairly intensive step in the process where, in fact, analysts must defend their ratings to the RRC. The RRC has the authority to override ratings in certain circumstances. For instance, companies that receive a “red flag” in the MSCI Impact Monitor or is the ISS Governance Risk Indicators which are two underlying data sources for company information, typically cannot be granted ‘AAA’ rating. In such case the company rating may be changed to ‘AA’.
Ongoing monitoring
ESG ratings are typically reviewed and updated on an annual basis. However, in certain exceptional circumstances, ESG scores may be reviewed midway through the rating cycle. A mid cycle rating review can be precipitated based on an extraordinary ESG event (e.g. the earthquake in Japan in March 2011) or if a company is downgraded to a “red flag” in ESG Impact Monitor. Any interim ratings updates must be approved by the RRC. Next, we take a closer look at the underlying ESG dataset.
24 April 2013
Signal Processing
Deutsche Bank Securities Inc. Page 17
An Exposition into ESG
A snapshot of the dataset
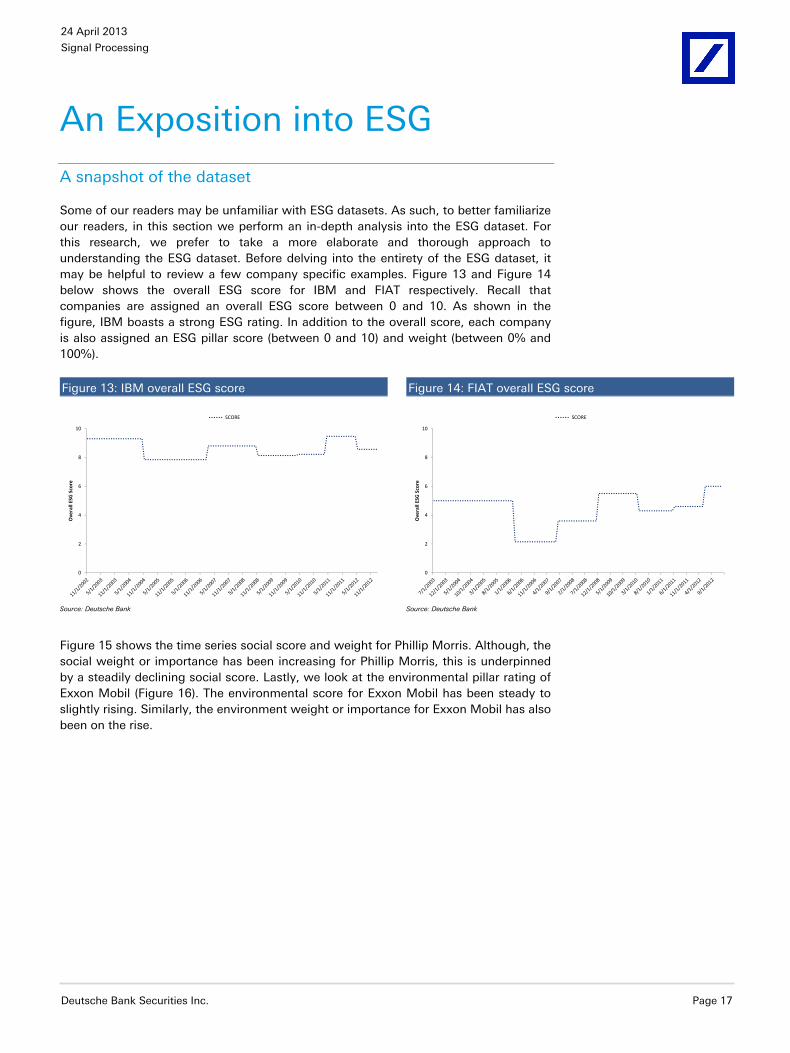
Some of our readers may be unfamiliar with ESG datasets. As such, to better familiarize our readers, in this section we perform an in-depth analysis into the ESG dataset. For this research, we prefer to take a more elaborate and thorough approach to understanding the ESG dataset. Before delving into the entirety of the ESG dataset, it may be helpful to review a few company specific examples. Figure 13 and Figure 14 below shows the overall ESG score for IBM and FIAT respectively. Recall that companies are assigned an overall ESG score between 0 and 10. As shown in the figure, IBM boasts a strong ESG rating. In addition to the overall score, each company is also assigned an ESG pillar score (between 0 and 10) and weight (between 0% and 100%).
Figure 13: IBM overall ESG score Figure 14: FIAT overall ESG score
0
2
4
6
8
10
Ove
rall
ESG
Sco
re
SCORE
0
2
4
6
8
10
Ove
rall
ESG
Sco
reSCORE
Source: Deutsche Bank Source: Deutsche Bank
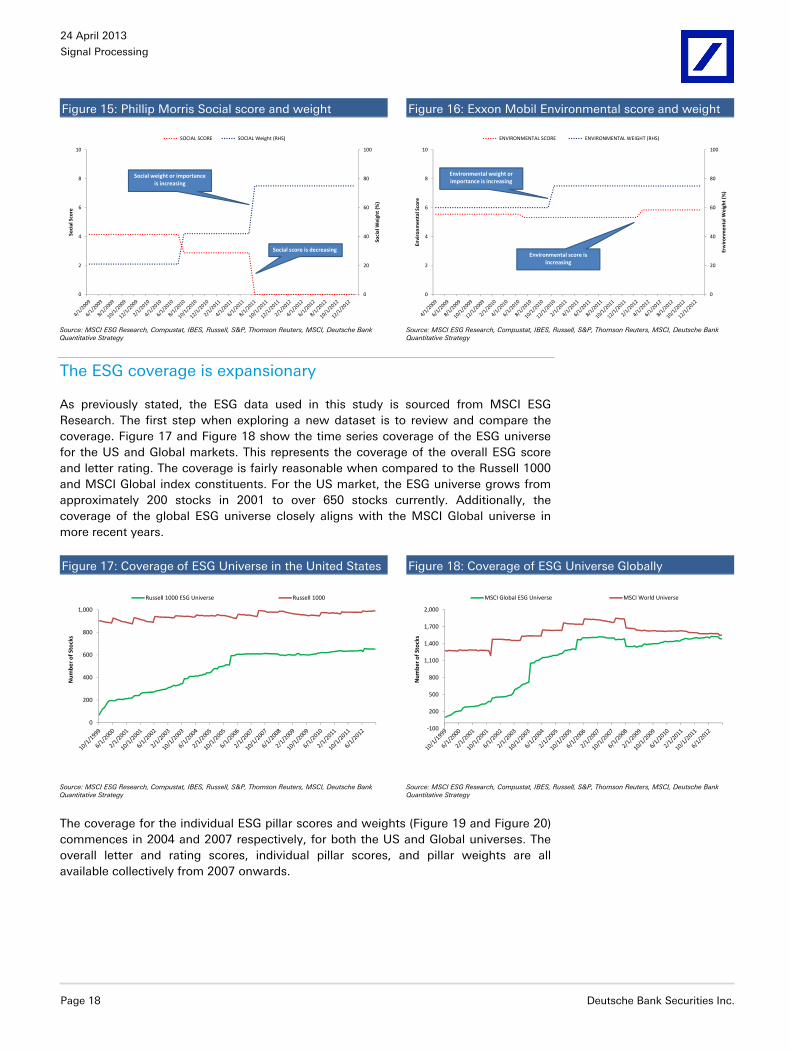
Figure 15 shows the time series social score and weight for Phillip Morris. Although, the social weight or importance has been increasing for Phillip Morris, this is underpinned by a steadily declining social score. Lastly, we look at the environmental pillar rating of Exxon Mobil (Figure 16). The environmental score for Exxon Mobil has been steady to slightly rising. Similarly, the environment weight or importance for Exxon Mobil has also been on the rise.
24 April 2013
Signal Processing
Page 18 Deutsche Bank Securities Inc.
Figure 15: Phillip Morris Social score and weight Figure 16: Exxon Mobil Environmental score and weight
0
20
40
60
80
100
0
2
4
6
8
10
Soci
al W
eigh
t (%
)
Soci
al S
core
SOCIAL SCORE SOCIAL Weight (RHS)
Social weight or importance is increasing
Social score is decreasing
0
20
40
60
80
100
0
2
4
6
8
10
Envi
ronm
enta
l Wei
ght
(%)
Envi
ronm
enta
l Sco
re
ENVIRONMENTAL SCORE ENVIRONMENTAL WEIGHT (RHS)
Environmental score is increasing
Environmental weight or importance is increasing
Source: MSCI ESG Research, Compustat, IBES, Russell, S&P, Thomson Reuters, MSCI, Deutsche Bank Quantitative Strategy Source: MSCI ESG Research, Compustat, IBES, Russell, S&P, Thomson Reuters, MSCI, Deutsche Bank
Quantitative Strategy
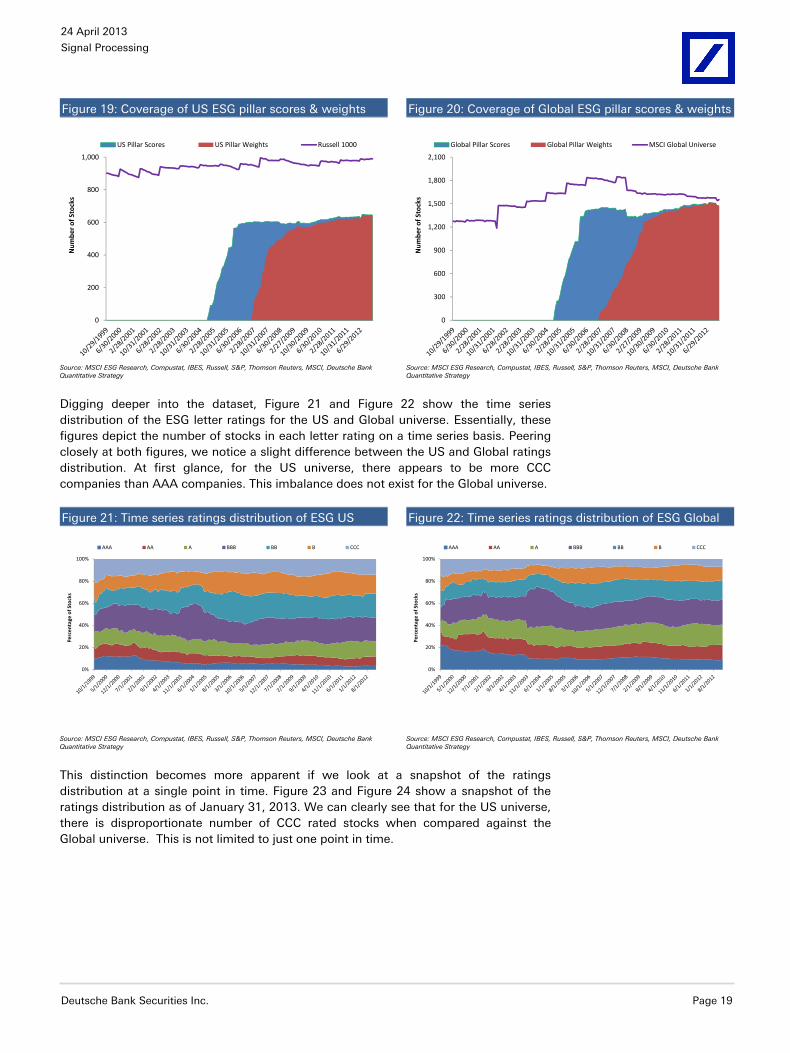
The ESG coverage is expansionary
As previously stated, the ESG data used in this study is sourced from MSCI ESG Research. The first step when exploring a new dataset is to review and compare the coverage. Figure 17 and Figure 18 show the time series coverage of the ESG universe for the US and Global markets. This represents the coverage of the overall ESG score and letter rating. The coverage is fairly reasonable when compared to the Russell 1000 and MSCI Global index constituents. For the US market, the ESG universe grows from approximately 200 stocks in 2001 to over 650 stocks currently. Additionally, the coverage of the global ESG universe closely aligns with the MSCI Global universe in more recent years.
Figure 17: Coverage of ESG Universe in the United States Figure 18: Coverage of ESG Universe Globally
0
200
400
600
800
1,000
Num
ber o
f Sto
cks
Russell 1000 ESG Universe Russell 1000
-100
200
500
800
1,100
1,400
1,700
2,000
Num
ber o
f Sto
cks
MSCI Global ESG Universe MSCI World Universe
Source: MSCI ESG Research, Compustat, IBES, Russell, S&P, Thomson Reuters, MSCI, Deutsche Bank Quantitative Strategy Source: MSCI ESG Research, Compustat, IBES, Russell, S&P, Thomson Reuters, MSCI, Deutsche Bank
Quantitative Strategy
The coverage for the individual ESG pillar scores and weights (Figure 19 and Figure 20) commences in 2004 and 2007 respectively, for both the US and Global universes. The overall letter and rating scores, individual pillar scores, and pillar weights are all available collectively from 2007 onwards.
24 April 2013
Signal Processing
Deutsche Bank Securities Inc. Page 19
Figure 19: Coverage of US ESG pillar scores & weights Figure 20: Coverage of Global ESG pillar scores & weights
0
200
400
600
800
1,000
Num
ber o
f Sto
cks
US Pillar Scores US Pillar Weights Russell 1000
0
300
600
900
1,200
1,500
1,800
2,100
Num
ber o
f Sto
cks
Global Pillar Scores Global Pillar Weights MSCI Global Universe
Source: MSCI ESG Research, Compustat, IBES, Russell, S&P, Thomson Reuters, MSCI, Deutsche Bank Quantitative Strategy Source: MSCI ESG Research, Compustat, IBES, Russell, S&P, Thomson Reuters, MSCI, Deutsche Bank
Quantitative Strategy
Digging deeper into the dataset, Figure 21 and Figure 22 show the time series distribution of the ESG letter ratings for the US and Global universe. Essentially, these figures depict the number of stocks in each letter rating on a time series basis. Peering closely at both figures, we notice a slight difference between the US and Global ratings distribution. At first glance, for the US universe, there appears to be more CCC companies than AAA companies. This imbalance does not exist for the Global universe.
Figure 21: Time series ratings distribution of ESG US Figure 22: Time series ratings distribution of ESG Global
0%
20%
40%
60%
80%
100%
Perc
enta
ge o
f Sto
cks
AAA AA A BBB BB B CCC
0%
20%
40%
60%
80%
100%
Perc
enta
ge o
f Sto
cks
AAA AA A BBB BB B CCC
Source: MSCI ESG Research, Compustat, IBES, Russell, S&P, Thomson Reuters, MSCI, Deutsche Bank Quantitative Strategy Source: MSCI ESG Research, Compustat, IBES, Russell, S&P, Thomson Reuters, MSCI, Deutsche Bank
Quantitative Strategy
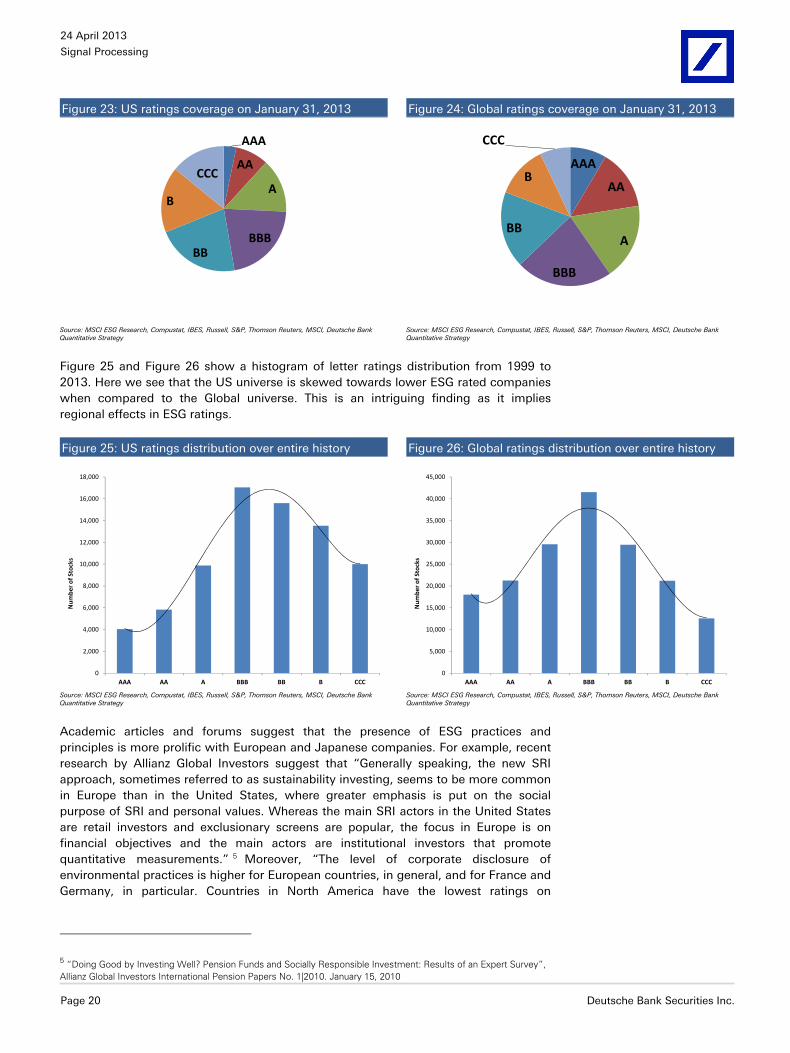
This distinction becomes more apparent if we look at a snapshot of the ratings distribution at a single point in time. Figure 23 and Figure 24 show a snapshot of the ratings distribution as of January 31, 2013. We can clearly see that for the US universe, there is disproportionate number of CCC rated stocks when compared against the Global universe. This is not limited to just one point in time.
24 April 2013
Signal Processing
Page 20 Deutsche Bank Securities Inc.
Figure 23: US ratings coverage on January 31, 2013 Figure 24: Global ratings coverage on January 31, 2013
AAA
AA
A
BBBBB
B
CCC
AAA
AA
A
BBB
BB
B
CCC
Source: MSCI ESG Research, Compustat, IBES, Russell, S&P, Thomson Reuters, MSCI, Deutsche Bank Quantitative Strategy Source: MSCI ESG Research, Compustat, IBES, Russell, S&P, Thomson Reuters, MSCI, Deutsche Bank
Quantitative Strategy
Figure 25 and Figure 26 show a histogram of letter ratings distribution from 1999 to 2013. Here we see that the US universe is skewed towards lower ESG rated companies when compared to the Global universe. This is an intriguing finding as it implies regional effects in ESG ratings.
Figure 25: US ratings distribution over entire history Figure 26: Global ratings distribution over entire history
0
2,000
4,000
6,000
8,000
10,000
12,000
14,000
16,000
18,000
AAA AA A BBB BB B CCC
Num
ber o
f Sto
cks
0
5,000
10,000
15,000
20,000
25,000
30,000
35,000
40,000
45,000
AAA AA A BBB BB B CCC
Num
ber o
f Sto
cks
Source: MSCI ESG Research, Compustat, IBES, Russell, S&P, Thomson Reuters, MSCI, Deutsche Bank Quantitative Strategy Source: MSCI ESG Research, Compustat, IBES, Russell, S&P, Thomson Reuters, MSCI, Deutsche Bank
Quantitative Strategy
Academic articles and forums suggest that the presence of ESG practices and principles is more prolific with European and Japanese companies. For example, recent research by Allianz Global Investors suggest that “Generally speaking, the new SRI approach, sometimes referred to as sustainability investing, seems to be more common in Europe than in the United States, where greater emphasis is put on the social purpose of SRI and personal values. Whereas the main SRI actors in the United States are retail investors and exclusionary screens are popular, the focus in Europe is on financial objectives and the main actors are institutional investors that promote quantitative measurements.” 5 Moreover, “The level of corporate disclosure of environmental practices is higher for European countries, in general, and for France and Germany, in particular. Countries in North America have the lowest ratings on
5 “Doing Good by Investing Well? Pension Funds and Socially Responsible Investment: Results of an Expert Survey”, Allianz Global Investors International Pension Papers No. 1|2010. January 15, 2010
24 April 2013
Signal Processing
Deutsche Bank Securities Inc. Page 21
environmental measures, implying lower disclosure and/or lower adherence to environmental standards.”6
These finding also holds merit on an intuitive basis. Japanese auto and technology manufacturing tends to be associated with high quality, long lasting, and technically modern and mainstream. The principles of ISO 9000, Six Sigma, Total Quality Management (TQM), lean manufacturing tend to be associated with Japanese production systems. Additionally, European cars tend to be associated with high quality, sturdiness and ergonomically built. This may help explain the distinction in the distribution of ratings between the US and Global universe. At this stage, we merely point out this natural regional effect. As an aside, regional or country exposures can be dealt with during the factor or portfolio construction phase. We discuss this in more detail in subsequent sections.
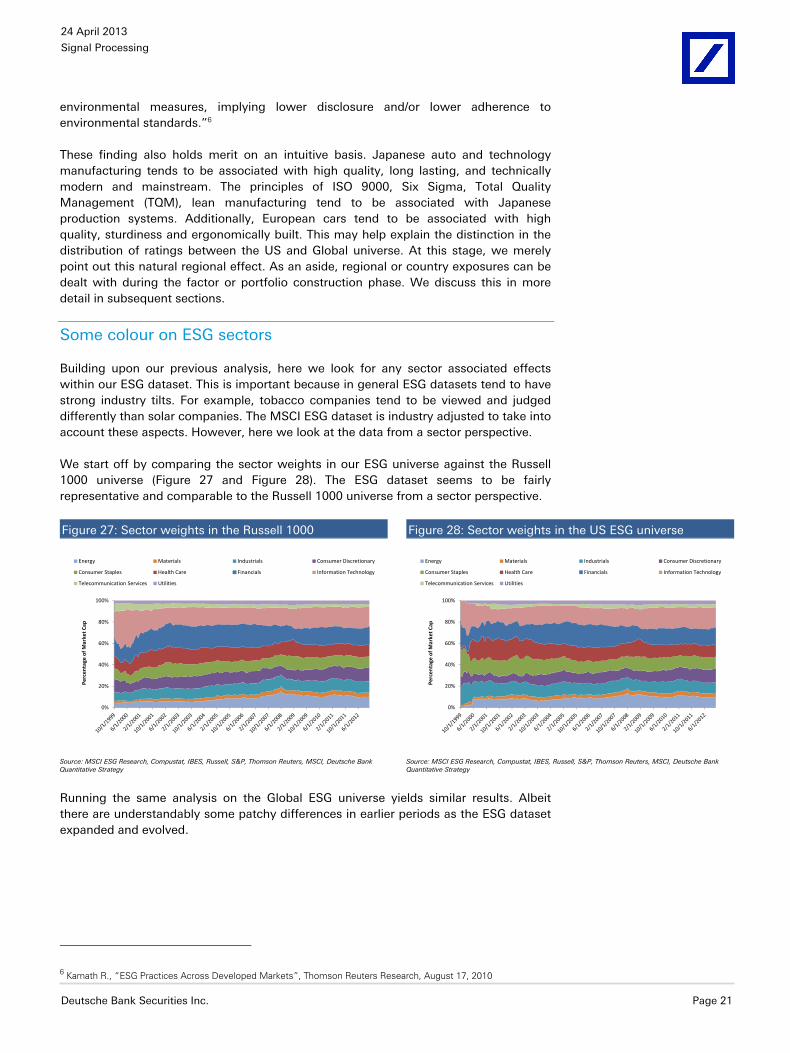
Some colour on ESG sectors
Building upon our previous analysis, here we look for any sector associated effects within our ESG dataset. This is important because in general ESG datasets tend to have strong industry tilts. For example, tobacco companies tend to be viewed and judged differently than solar companies. The MSCI ESG dataset is industry adjusted to take into account these aspects. However, here we look at the data from a sector perspective.
We start off by comparing the sector weights in our ESG universe against the Russell 1000 universe (Figure 27 and Figure 28). The ESG dataset seems to be fairly representative and comparable to the Russell 1000 universe from a sector perspective.
Figure 27: Sector weights in the Russell 1000 Figure 28: Sector weights in the US ESG universe
0%
20%
40%
60%
80%
100%
Perc
enta
ge o
f Mar
ket C
ap
Energy Materials Industrials Consumer Discretionary
Consumer Staples Health Care Financials Information Technology
Telecommunication Services Utilities
0%
20%
40%
60%
80%
100%
Perc
enta
ge o
f Mar
ket C
ap
Energy Materials Industrials Consumer Discretionary
Consumer Staples Health Care Financials Information Technology
Telecommunication Services Utilities
Source: MSCI ESG Research, Compustat, IBES, Russell, S&P, Thomson Reuters, MSCI, Deutsche Bank Quantitative Strategy Source: MSCI ESG Research, Compustat, IBES, Russell, S&P, Thomson Reuters, MSCI, Deutsche Bank
Quantitative Strategy
Running the same analysis on the Global ESG universe yields similar results. Albeit there are understandably some patchy differences in earlier periods as the ESG dataset expanded and evolved.
6 Kamath R., “ESG Practices Across Developed Markets”, Thomson Reuters Research, August 17, 2010
24 April 2013
Signal Processing
Page 22 Deutsche Bank Securities Inc.
Figure 29: Sector weights in the MSCI Global Figure 30: Sector weights in the Global ESG universe
0%
20%
40%
60%
80%
100%
Perc
enta
ge o
f USD
Mar
ket C
ap
Energy Materials Industrials
Consumer Discretionary Consumer Staples Health Care
Financials Information Technology Telecommunication Services
Utilities
0%
20%
40%
60%
80%
100%
Perc
enta
ge o
f USD
Mar
ket C
ap
Energy Materials Industrials
Consumer Discretionary Consumer Staples Health Care
Financials Information Technology Telecommunication Services
Utilities
Source: MSCI ESG Research, Compustat, IBES, Russell, S&P, Thomson Reuters, MSCI, Deutsche Bank Quantitative Strategy Source: MSCI ESG Research, Compustat, IBES, Russell, S&P, Thomson Reuters, MSCI, Deutsche Bank
Quantitative Strategy
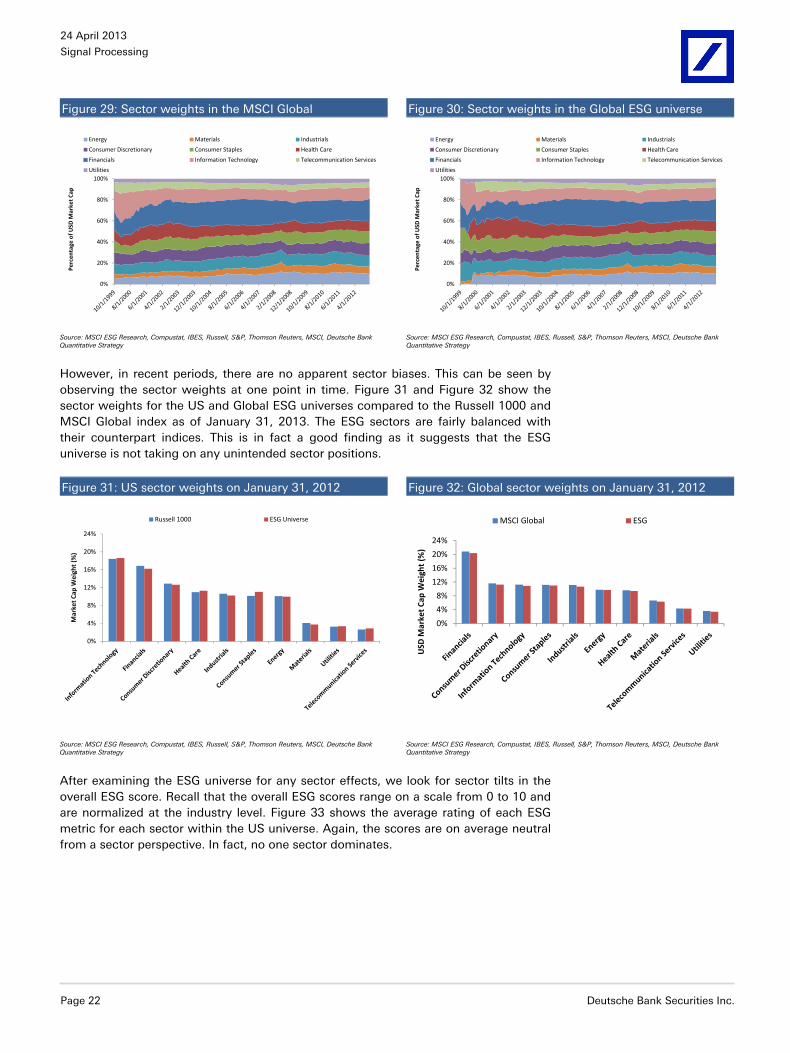
However, in recent periods, there are no apparent sector biases. This can be seen by observing the sector weights at one point in time. Figure 31 and Figure 32 show the sector weights for the US and Global ESG universes compared to the Russell 1000 and MSCI Global index as of January 31, 2013. The ESG sectors are fairly balanced with their counterpart indices. This is in fact a good finding as it suggests that the ESG universe is not taking on any unintended sector positions.
Figure 31: US sector weights on January 31, 2012 Figure 32: Global sector weights on January 31, 2012
0%
4%
8%
12%
16%
20%
24%
Mar
ket C
ap W
eigh
t (%
)
Russell 1000 ESG Universe
0%
4%
8%
12%
16%
20%
24%
USD
Mar
ket
Cap
Wei
ght
(%)
MSCI Global ESG
Source: MSCI ESG Research, Compustat, IBES, Russell, S&P, Thomson Reuters, MSCI, Deutsche Bank Quantitative Strategy Source: MSCI ESG Research, Compustat, IBES, Russell, S&P, Thomson Reuters, MSCI, Deutsche Bank
Quantitative Strategy
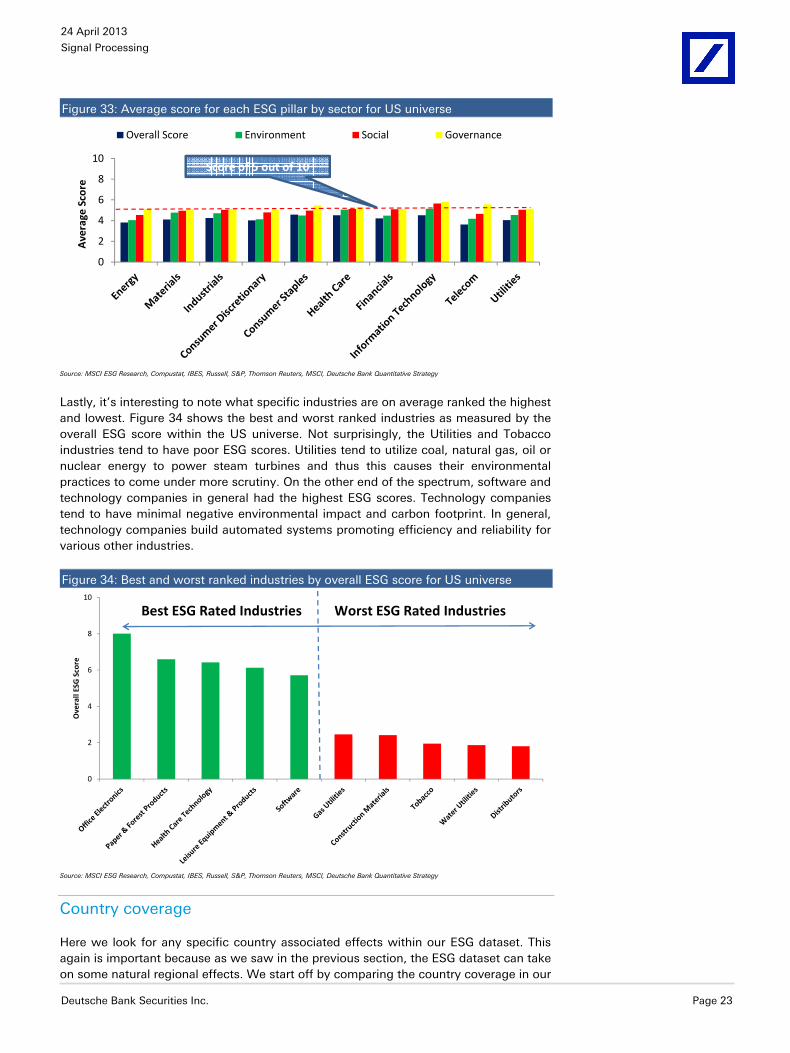
After examining the ESG universe for any sector effects, we look for sector tilts in the overall ESG score. Recall that the overall ESG scores range on a scale from 0 to 10 and are normalized at the industry level. Figure 33 shows the average rating of each ESG metric for each sector within the US universe. Again, the scores are on average neutral from a sector perspective. In fact, no one sector dominates.
24 April 2013
Signal Processing
Deutsche Bank Securities Inc. Page 23
Figure 33: Average score for each ESG pillar by sector for US universe
0
2
4
6
8
10
Ave
rage
Sco
re
Overall Score Environment Social Governance
Score of 5 out of 10
Source: MSCI ESG Research, Compustat, IBES, Russell, S&P, Thomson Reuters, MSCI, Deutsche Bank Quantitative Strategy
Lastly, it’s interesting to note what specific industries are on average ranked the highest and lowest. Figure 34 shows the best and worst ranked industries as measured by the overall ESG score within the US universe. Not surprisingly, the Utilities and Tobacco industries tend to have poor ESG scores. Utilities tend to utilize coal, natural gas, oil or nuclear energy to power steam turbines and thus this causes their environmental practices to come under more scrutiny. On the other end of the spectrum, software and technology companies in general had the highest ESG scores. Technology companies tend to have minimal negative environmental impact and carbon footprint. In general, technology companies build automated systems promoting efficiency and reliability for various other industries.
Figure 34: Best and worst ranked industries by overall ESG score for US universe
0
2
4
6
8
10
Ove
rall
ESG
Sco
re
Best ESG Rated Industries Worst ESG Rated Industries
Source: MSCI ESG Research, Compustat, IBES, Russell, S&P, Thomson Reuters, MSCI, Deutsche Bank Quantitative Strategy
Country coverage
Here we look for any specific country associated effects within our ESG dataset. This again is important because as we saw in the previous section, the ESG dataset can take on some natural regional effects. We start off by comparing the country coverage in our
24 April 2013
Signal Processing
Page 24 Deutsche Bank Securities Inc.
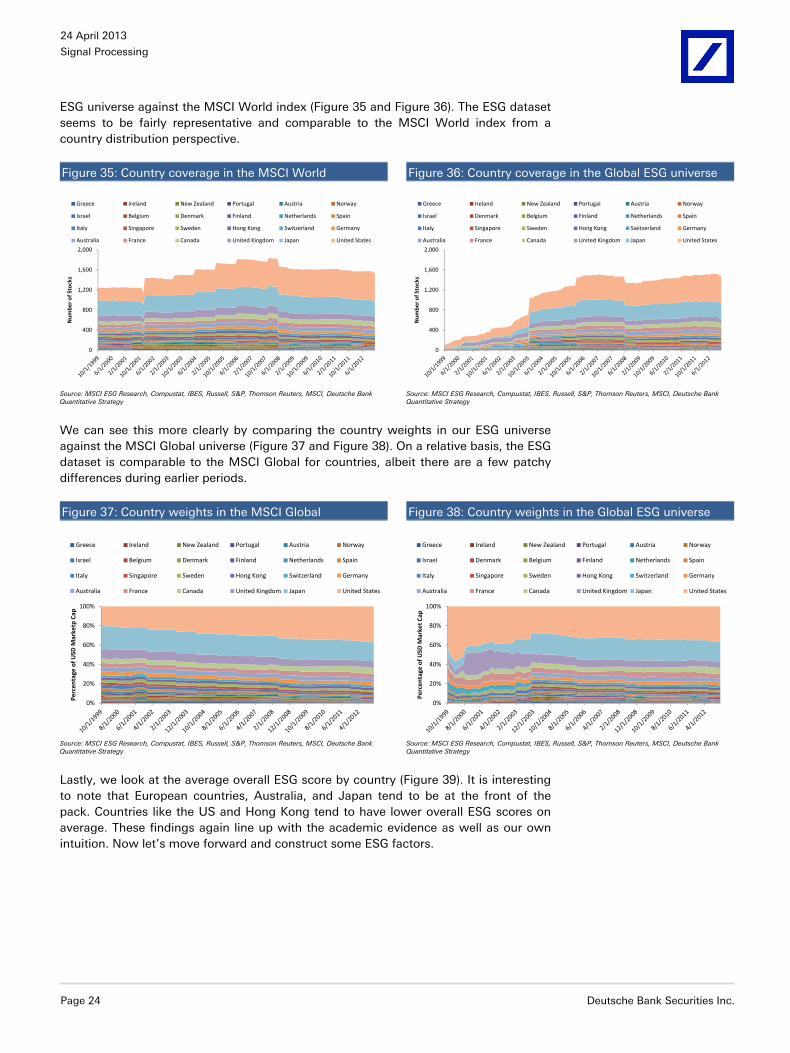
ESG universe against the MSCI World index (Figure 35 and Figure 36). The ESG dataset seems to be fairly representative and comparable to the MSCI World index from a country distribution perspective.
Figure 35: Country coverage in the MSCI World Figure 36: Country coverage in the Global ESG universe
0
400
800
1,200
1,600
2,000
Num
ber o
f Sto
cks
Greece Ireland New Zealand Portugal Austria Norway
Israel Belgium Denmark Finland Netherlands Spain
Italy Singapore Sweden Hong Kong Switzerland Germany
Australia France Canada United Kingdom Japan United States
0
400
800
1,200
1,600
2,000
Num
ber o
f Sto
cks
Greece Ireland New Zealand Portugal Austria Norway
Israel Denmark Belgium Finland Netherlands Spain
Italy Singapore Sweden Hong Kong Switzerland Germany
Australia France Canada United Kingdom Japan United States
Source: MSCI ESG Research, Compustat, IBES, Russell, S&P, Thomson Reuters, MSCI, Deutsche Bank Quantitative Strategy Source: MSCI ESG Research, Compustat, IBES, Russell, S&P, Thomson Reuters, MSCI, Deutsche Bank
Quantitative Strategy
We can see this more clearly by comparing the country weights in our ESG universe against the MSCI Global universe (Figure 37 and Figure 38). On a relative basis, the ESG dataset is comparable to the MSCI Global for countries, albeit there are a few patchy differences during earlier periods.
Figure 37: Country weights in the MSCI Global Figure 38: Country weights in the Global ESG universe
0%
20%
40%
60%
80%
100%
Perc
enta
ge o
f USD
Mar
ketp
Cap
Greece Ireland New Zealand Portugal Austria Norway
Israel Belgium Denmark Finland Netherlands Spain
Italy Singapore Sweden Hong Kong Switzerland Germany
Australia France Canada United Kingdom Japan United States
0%
20%
40%
60%
80%
100%
Perc
enta
ge o
f USD
Mar
ket C
ap
Greece Ireland New Zealand Portugal Austria Norway
Israel Denmark Belgium Finland Netherlands Spain
Italy Singapore Sweden Hong Kong Switzerland Germany
Australia France Canada United Kingdom Japan United States
Source: MSCI ESG Research, Compustat, IBES, Russell, S&P, Thomson Reuters, MSCI, Deutsche Bank Quantitative Strategy Source: MSCI ESG Research, Compustat, IBES, Russell, S&P, Thomson Reuters, MSCI, Deutsche Bank
Quantitative Strategy
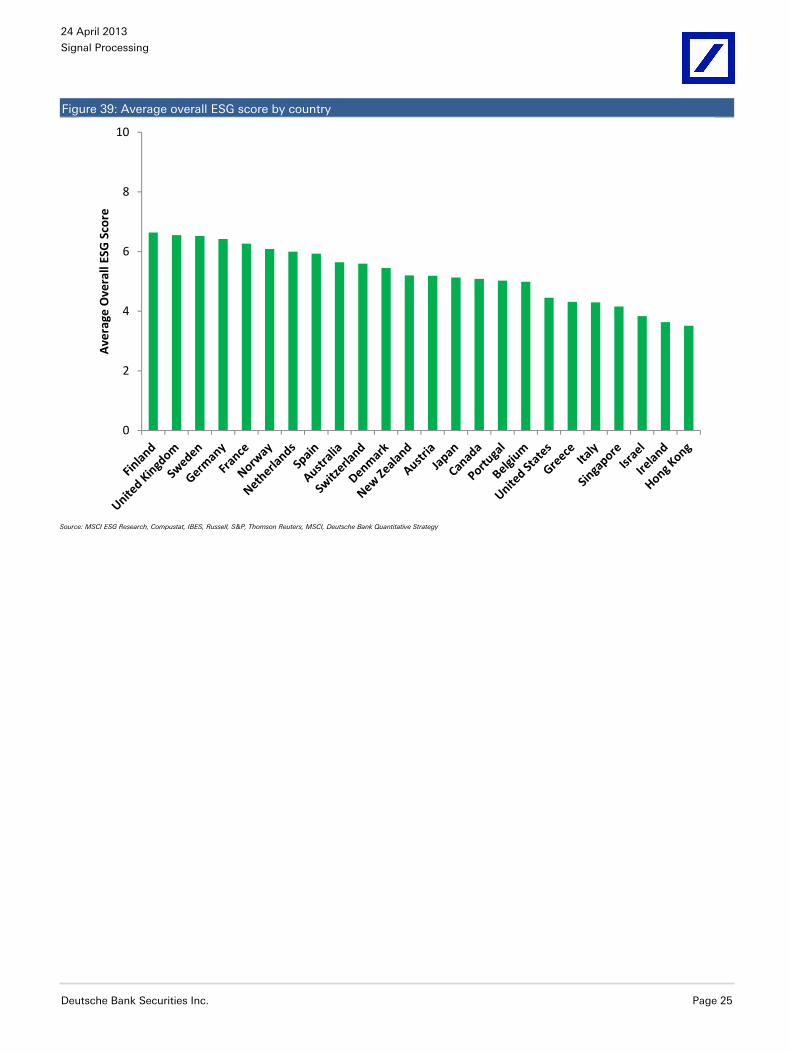
Lastly, we look at the average overall ESG score by country (Figure 39). It is interesting to note that European countries, Australia, and Japan tend to be at the front of the pack. Countries like the US and Hong Kong tend to have lower overall ESG scores on average. These findings again line up with the academic evidence as well as our own intuition. Now let’s move forward and construct some ESG factors.
24 April 2013
Signal Processing
Deutsche Bank Securities Inc. Page 25
Figure 39: Average overall ESG score by country
0
2
4
6
8
10
Ave
rage
Ove
rall
ESG
Sco
re
Source: MSCI ESG Research, Compustat, IBES, Russell, S&P, Thomson Reuters, MSCI, Deutsche Bank Quantitative Strategy
24 April 2013
Signal Processing
Page 26 Deutsche Bank Securities Inc.
Forming ESG Alpha Factors
ESG prudence comes at a price
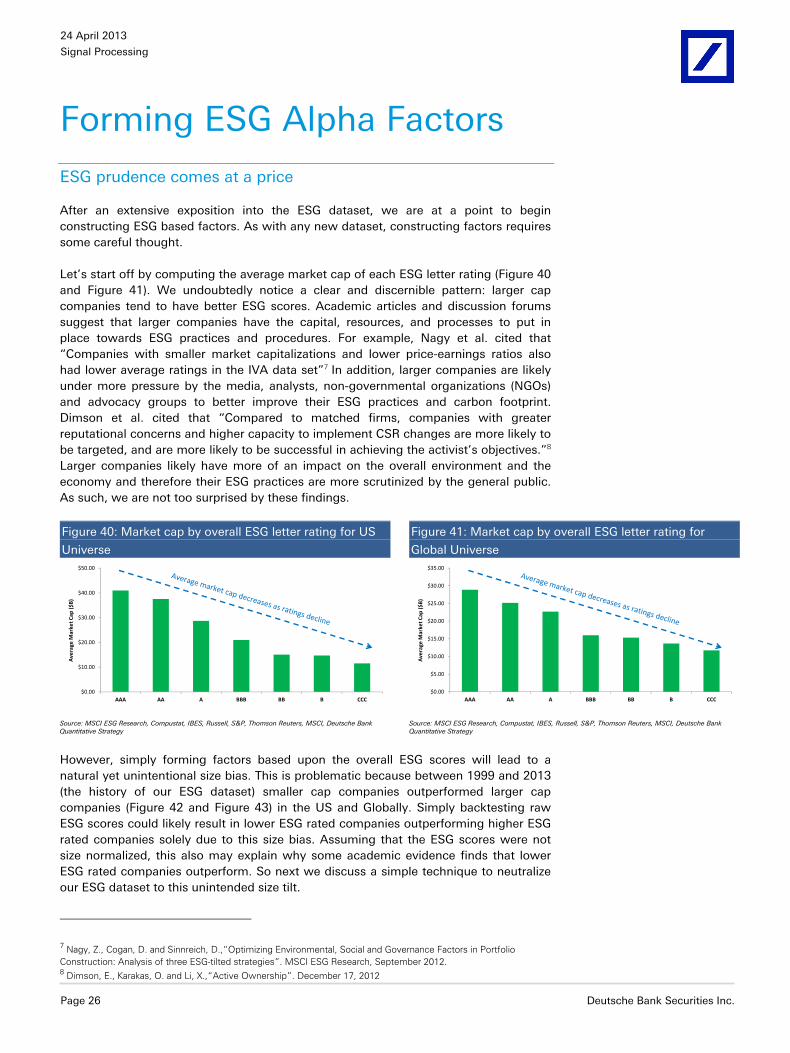
After an extensive exposition into the ESG dataset, we are at a point to begin constructing ESG based factors. As with any new dataset, constructing factors requires some careful thought.
Let’s start off by computing the average market cap of each ESG letter rating (Figure 40 and Figure 41). We undoubtedly notice a clear and discernible pattern: larger cap companies tend to have better ESG scores. Academic articles and discussion forums suggest that larger companies have the capital, resources, and processes to put in place towards ESG practices and procedures. For example, Nagy et al. cited that “Companies with smaller market capitalizations and lower price-earnings ratios also had lower average ratings in the IVA data set”7 In addition, larger companies are likely under more pressure by the media, analysts, non-governmental organizations (NGOs) and advocacy groups to better improve their ESG practices and carbon footprint. Dimson et al. cited that “Compared to matched firms, companies with greater reputational concerns and higher capacity to implement CSR changes are more likely to be targeted, and are more likely to be successful in achieving the activist’s objectives.”8 Larger companies likely have more of an impact on the overall environment and the economy and therefore their ESG practices are more scrutinized by the general public. As such, we are not too surprised by these findings.
Figure 40: Market cap by overall ESG letter rating for US
Universe
Figure 41: Market cap by overall ESG letter rating for
Global Universe
$0.00
$10.00
$20.00
$30.00
$40.00
$50.00
AAA AA A BBB BB B CCC
Ave
rage
Mar
ket C
ap ($
B)
$0.00
$5.00
$10.00
$15.00
$20.00
$25.00
$30.00
$35.00
AAA AA A BBB BB B CCC
Ave
rage
Mar
ket C
ap ($
B)
Source: MSCI ESG Research, Compustat, IBES, Russell, S&P, Thomson Reuters, MSCI, Deutsche Bank Quantitative Strategy Source: MSCI ESG Research, Compustat, IBES, Russell, S&P, Thomson Reuters, MSCI, Deutsche Bank
Quantitative Strategy
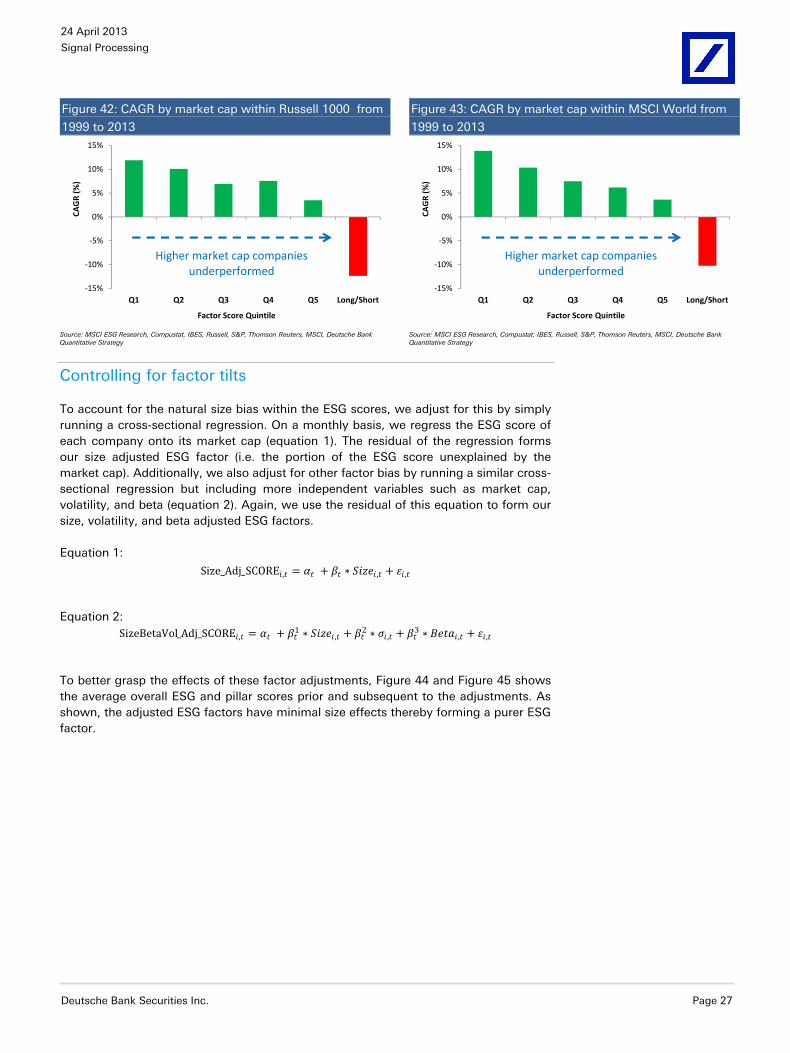
However, simply forming factors based upon the overall ESG scores will lead to a natural yet unintentional size bias. This is problematic because between 1999 and 2013 (the history of our ESG dataset) smaller cap companies outperformed larger cap companies (Figure 42 and Figure 43) in the US and Globally. Simply backtesting raw ESG scores could likely result in lower ESG rated companies outperforming higher ESG rated companies solely due to this size bias. Assuming that the ESG scores were not size normalized, this also may explain why some academic evidence finds that lower ESG rated companies outperform. So next we discuss a simple technique to neutralize our ESG dataset to this unintended size tilt.
7 Nagy, Z., Cogan, D. and Sinnreich, D.,“Optimizing Environmental, Social and Governance Factors in Portfolio Construction: Analysis of three ESG-tilted strategies”. MSCI ESG Research, September 2012. 8 Dimson, E., Karakas, O. and Li, X.,“Active Ownership”. December 17, 2012
24 April 2013
Signal Processing
Deutsche Bank Securities Inc. Page 27
Size_Adj_SCORE , = + ∗ , + ,
SizeBetaVol_Adj_SCORE , = + 1 ∗ , + 2 ∗ , + 3 ∗ , + ,
Figure 42: CAGR by market cap within Russell 1000 from
1999 to 2013
Figure 43: CAGR by market cap within MSCI World from
1999 to 2013
-15%
-10%
-5%
0%
5%
10%
15%
Q1 Q2 Q3 Q4 Q5 Long/Short
CAG
R (%
)
Factor Score Quintile
Higher market cap companies underperformed
-15%
-10%
-5%
0%
5%
10%
15%
Q1 Q2 Q3 Q4 Q5 Long/Short
CAG
R (%
)
Factor Score Quintile
Higher market cap companies underperformed
Source: MSCI ESG Research, Compustat, IBES, Russell, S&P, Thomson Reuters, MSCI, Deutsche Bank Quantitative Strategy Source: MSCI ESG Research, Compustat, IBES, Russell, S&P, Thomson Reuters, MSCI, Deutsche Bank
Quantitative Strategy
Controlling for factor tilts
To account for the natural size bias within the ESG scores, we adjust for this by simply running a cross-sectional regression. On a monthly basis, we regress the ESG score of each company onto its market cap (equation 1). The residual of the regression forms our size adjusted ESG factor (i.e. the portion of the ESG score unexplained by the market cap). Additionally, we also adjust for other factor bias by running a similar cross-sectional regression but including more independent variables such as market cap, volatility, and beta (equation 2). Again, we use the residual of this equation to form our size, volatility, and beta adjusted ESG factors.
Equation 1:
Equation 2:
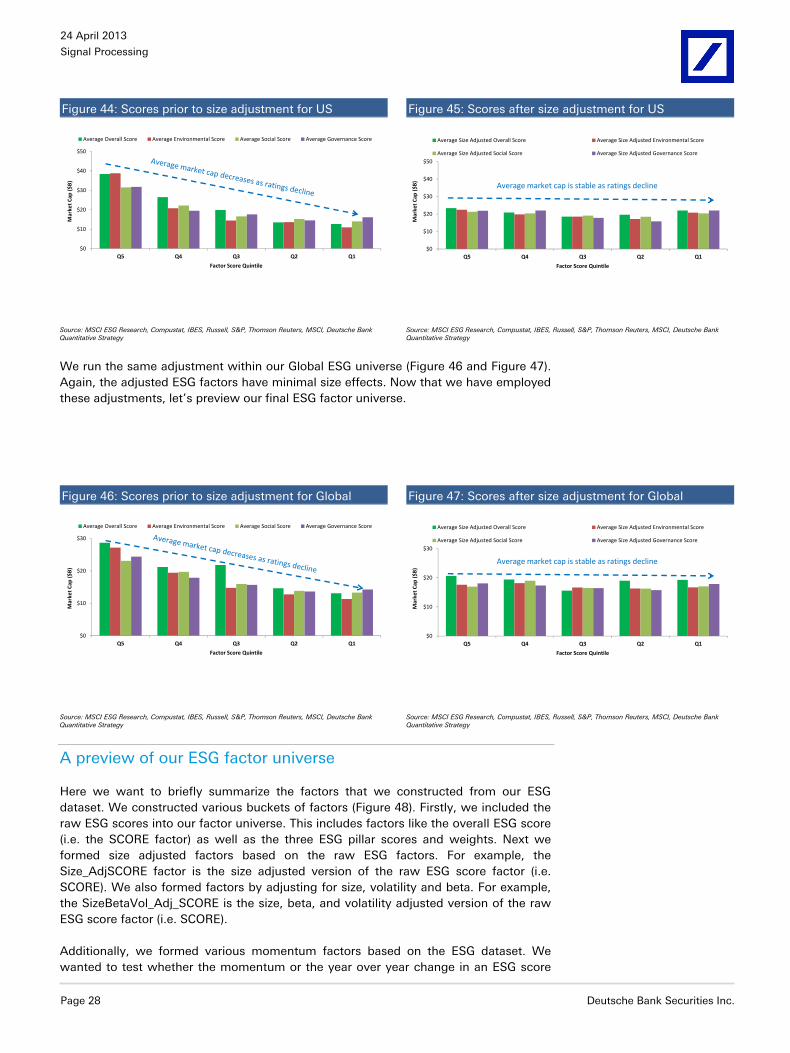
To better grasp the effects of these factor adjustments, Figure 44 and Figure 45 shows the average overall ESG and pillar scores prior and subsequent to the adjustments. As shown, the adjusted ESG factors have minimal size effects thereby forming a purer ESG factor.
24 April 2013
Signal Processing
Page 28 Deutsche Bank Securities Inc.
Figure 44: Scores prior to size adjustment for US Figure 45: Scores after size adjustment for US
$0
$10
$20
$30
$40
$50
Q5 Q4 Q3 Q2 Q1
Mar
ket C
ap ($
B)
Factor Score Quintile
Average Overall Score Average Environmental Score Average Social Score Average Governance Score
$0
$10
$20
$30
$40
$50
Q5 Q4 Q3 Q2 Q1
Mar
ket C
ap ($
B)
Factor Score Quintile
Average Size Adjusted Overall Score Average Size Adjusted Environmental Score
Average Size Adjusted Social Score Average Size Adjusted Governance Score
Average market cap is stable as ratings decline
Source: MSCI ESG Research, Compustat, IBES, Russell, S&P, Thomson Reuters, MSCI, Deutsche Bank Quantitative Strategy Source: MSCI ESG Research, Compustat, IBES, Russell, S&P, Thomson Reuters, MSCI, Deutsche Bank
Quantitative Strategy
We run the same adjustment within our Global ESG universe (Figure 46 and Figure 47). Again, the adjusted ESG factors have minimal size effects. Now that we have employed these adjustments, let’s preview our final ESG factor universe.
Figure 46: Scores prior to size adjustment for Global Figure 47: Scores after size adjustment for Global
$0
$10
$20
$30
Q5 Q4 Q3 Q2 Q1
Mar
ket C
ap ($
B)
Factor Score Quintile
Average Overall Score Average Environmental Score Average Social Score Average Governance Score
$0
$10
$20
$30
Q5 Q4 Q3 Q2 Q1
Mar
ket C
ap ($
B)
Factor Score Quintile
Average Size Adjusted Overall Score Average Size Adjusted Environmental Score
Average Size Adjusted Social Score Average Size Adjusted Governance Score
Average market cap is stable as ratings decline
Source: MSCI ESG Research, Compustat, IBES, Russell, S&P, Thomson Reuters, MSCI, Deutsche Bank Quantitative Strategy Source: MSCI ESG Research, Compustat, IBES, Russell, S&P, Thomson Reuters, MSCI, Deutsche Bank
Quantitative Strategy
A preview of our ESG factor universe
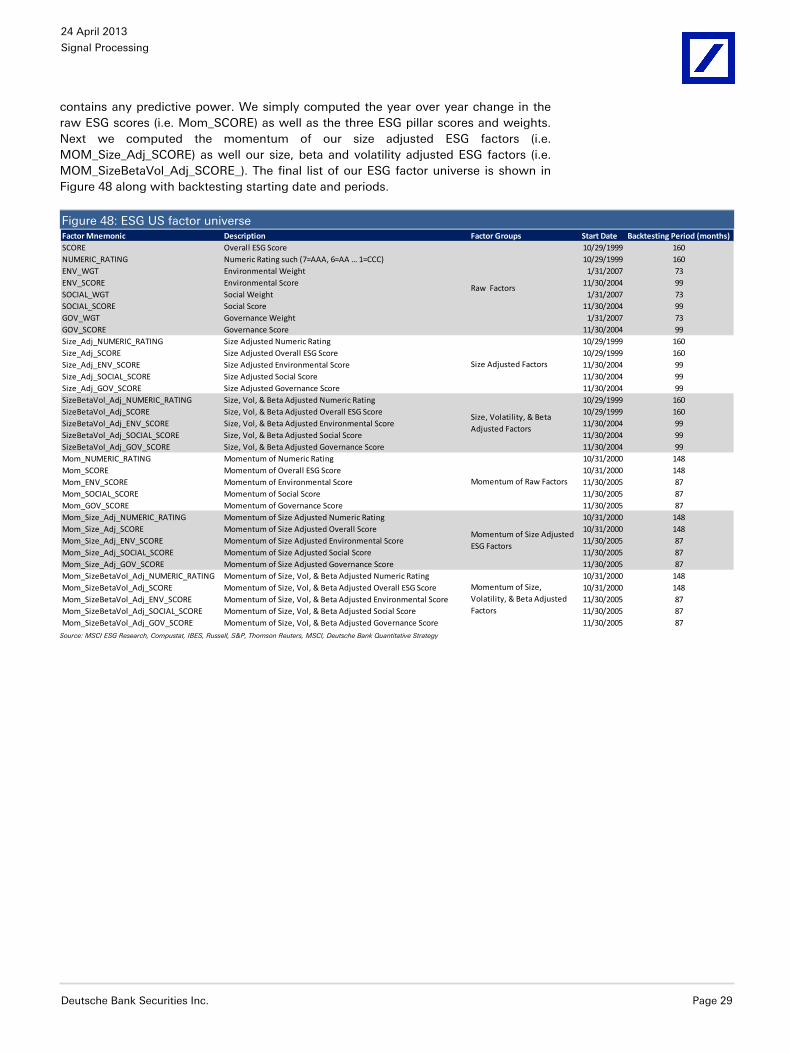
Here we want to briefly summarize the factors that we constructed from our ESG dataset. We constructed various buckets of factors (Figure 48). Firstly, we included the raw ESG scores into our factor universe. This includes factors like the overall ESG score (i.e. the SCORE factor) as well as the three ESG pillar scores and weights. Next we formed size adjusted factors based on the raw ESG factors. For example, the Size_AdjSCORE factor is the size adjusted version of the raw ESG score factor (i.e. SCORE). We also formed factors by adjusting for size, volatility and beta. For example, the SizeBetaVol_Adj_SCORE is the size, beta, and volatility adjusted version of the raw ESG score factor (i.e. SCORE).
Additionally, we formed various momentum factors based on the ESG dataset. We wanted to test whether the momentum or the year over year change in an ESG score
24 April 2013
Signal Processing
Deutsche Bank Securities Inc. Page 29
contains any predictive power. We simply computed the year over year change in the raw ESG scores (i.e. Mom_SCORE) as well as the three ESG pillar scores and weights. Next we computed the momentum of our size adjusted ESG factors (i.e. MOM_Size_Adj_SCORE) as well our size, beta and volatility adjusted ESG factors (i.e. MOM_SizeBetaVol_Adj_SCORE_). The final list of our ESG factor universe is shown in Figure 48 along with backtesting starting date and periods.
Figure 48: ESG US factor universe Factor Mnemonic Description Factor Groups Start Date Backtesting Period (months)SCORE Overall ESG Score 10/29/1999 160NUMERIC_RATING Numeric Rating such (7=AAA, 6=AA … 1=CCC) 10/29/1999 160ENV_WGT Environmental Weight 1/31/2007 73ENV_SCORE Environmental Score 11/30/2004 99SOCIAL_WGT Social Weight 1/31/2007 73SOCIAL_SCORE Social Score 11/30/2004 99GOV_WGT Governance Weight 1/31/2007 73GOV_SCORE Governance Score 11/30/2004 99Size_Adj_NUMERIC_RATING Size Adjusted Numeric Rating 10/29/1999 160Size_Adj_SCORE Size Adjusted Overall ESG Score 10/29/1999 160Size_Adj_ENV_SCORE Size Adjusted Environmental Score 11/30/2004 99Size_Adj_SOCIAL_SCORE Size Adjusted Social Score 11/30/2004 99Size_Adj_GOV_SCORE Size Adjusted Governance Score 11/30/2004 99SizeBetaVol_Adj_NUMERIC_RATING Size, Vol, & Beta Adjusted Numeric Rating 10/29/1999 160SizeBetaVol_Adj_SCORE Size, Vol, & Beta Adjusted Overall ESG Score 10/29/1999 160SizeBetaVol_Adj_ENV_SCORE Size, Vol, & Beta Adjusted Environmental Score 11/30/2004 99SizeBetaVol_Adj_SOCIAL_SCORE Size, Vol, & Beta Adjusted Social Score 11/30/2004 99SizeBetaVol_Adj_GOV_SCORE Size, Vol, & Beta Adjusted Governance Score 11/30/2004 99Mom_NUMERIC_RATING Momentum of Numeric Rating 10/31/2000 148Mom_SCORE Momentum of Overall ESG Score 10/31/2000 148Mom_ENV_SCORE Momentum of Environmental Score 11/30/2005 87Mom_SOCIAL_SCORE Momentum of Social Score 11/30/2005 87Mom_GOV_SCORE Momentum of Governance Score 11/30/2005 87Mom_Size_Adj_NUMERIC_RATING Momentum of Size Adjusted Numeric Rating 10/31/2000 148Mom_Size_Adj_SCORE Momentum of Size Adjusted Overall Score 10/31/2000 148Mom_Size_Adj_ENV_SCORE Momentum of Size Adjusted Environmental Score 11/30/2005 87Mom_Size_Adj_SOCIAL_SCORE Momentum of Size Adjusted Social Score 11/30/2005 87Mom_Size_Adj_GOV_SCORE Momentum of Size Adjusted Governance Score 11/30/2005 87Mom_SizeBetaVol_Adj_NUMERIC_RATING Momentum of Size, Vol, & Beta Adjusted Numeric Rating 10/31/2000 148Mom_SizeBetaVol_Adj_SCORE Momentum of Size, Vol, & Beta Adjusted Overall ESG Score 10/31/2000 148Mom_SizeBetaVol_Adj_ENV_SCORE Momentum of Size, Vol, & Beta Adjusted Environmental Score 11/30/2005 87Mom_SizeBetaVol_Adj_SOCIAL_SCORE Momentum of Size, Vol, & Beta Adjusted Social Score 11/30/2005 87Mom_SizeBetaVol_Adj_GOV_SCORE Momentum of Size, Vol, & Beta Adjusted Governance Score 11/30/2005 87
Momentum of Size, Volatility, & Beta Adjusted Factors
Raw Factors
Size Adjusted Factors
Size, Volatility, & Beta Adjusted Factors
Momentum of Raw Factors
Momentum of Size Adjusted ESG Factors
Source: MSCI ESG Research, Compustat, IBES, Russell, S&P, Thomson Reuters, MSCI, Deutsche Bank Quantitative Strategy
24 April 2013
Signal Processing
Page 30 Deutsche Bank Securities Inc.
The Backtesting Results
Monthly back testing performance of the US market
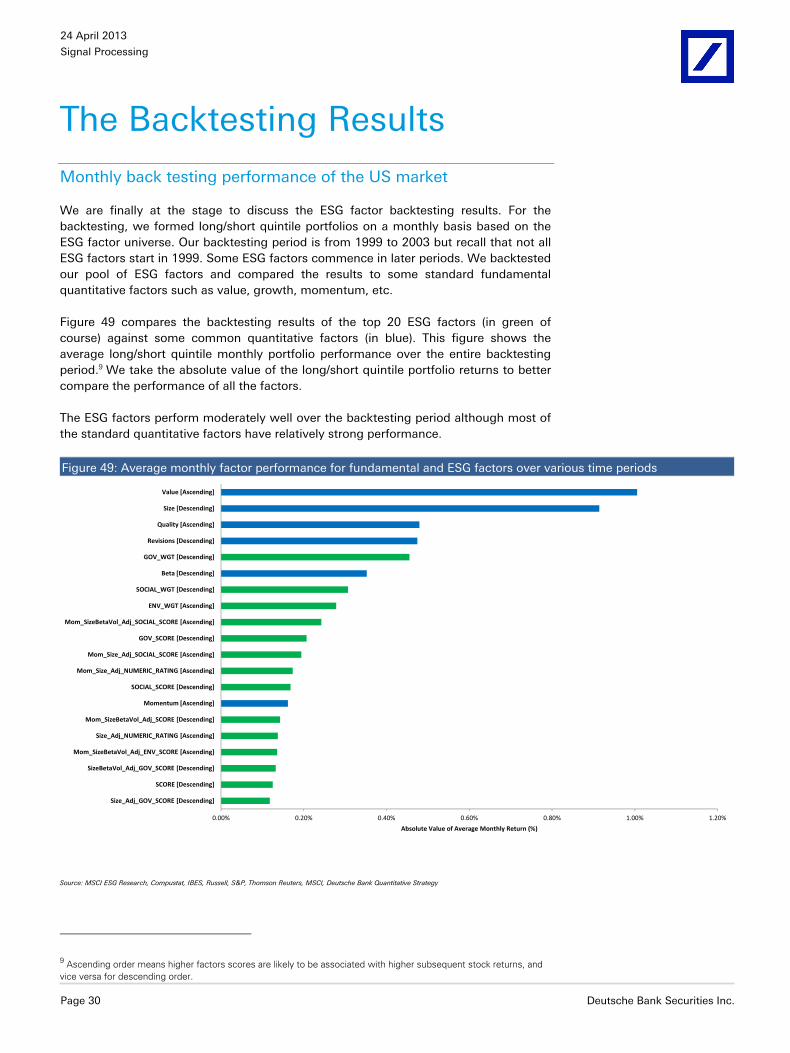
We are finally at the stage to discuss the ESG factor backtesting results. For the backtesting, we formed long/short quintile portfolios on a monthly basis based on the ESG factor universe. Our backtesting period is from 1999 to 2003 but recall that not all ESG factors start in 1999. Some ESG factors commence in later periods. We backtested our pool of ESG factors and compared the results to some standard fundamental quantitative factors such as value, growth, momentum, etc.
Figure 49 compares the backtesting results of the top 20 ESG factors (in green of course) against some common quantitative factors (in blue). This figure shows the average long/short quintile monthly portfolio performance over the entire backtesting period.9 We take the absolute value of the long/short quintile portfolio returns to better compare the performance of all the factors.
The ESG factors perform moderately well over the backtesting period although most of the standard quantitative factors have relatively strong performance.
Figure 49: Average monthly factor performance for fundamental and ESG factors over various time periods
0.00% 0.20% 0.40% 0.60% 0.80% 1.00% 1.20%
Size_Adj_GOV_SCORE [Descending]
SCORE [Descending]
SizeBetaVol_Adj_GOV_SCORE [Descending]
Mom_SizeBetaVol_Adj_ENV_SCORE [Ascending]
Size_Adj_NUMERIC_RATING [Ascending]
Mom_SizeBetaVol_Adj_SCORE [Descending]
Momentum [Ascending]
SOCIAL_SCORE [Descending]
Mom_Size_Adj_NUMERIC_RATING [Ascending]
Mom_Size_Adj_SOCIAL_SCORE [Ascending]
GOV_SCORE [Descending]
Mom_SizeBetaVol_Adj_SOCIAL_SCORE [Ascending]
ENV_WGT [Ascending]
SOCIAL_WGT [Descending]
Beta [Descending]
GOV_WGT [Descending]
Revisions [Descending]
Quality [Ascending]
Size [Descending]
Value [Ascending]
Absolute Value of Average Monthly Return (%)
Source: MSCI ESG Research, Compustat, IBES, Russell, S&P, Thomson Reuters, MSCI, Deutsche Bank Quantitative Strategy
9 Ascending order means higher factors scores are likely to be associated with higher subsequent stock returns, and vice versa for descending order.
24 April 2013
Signal Processing
Deutsche Bank Securities Inc. Page 31
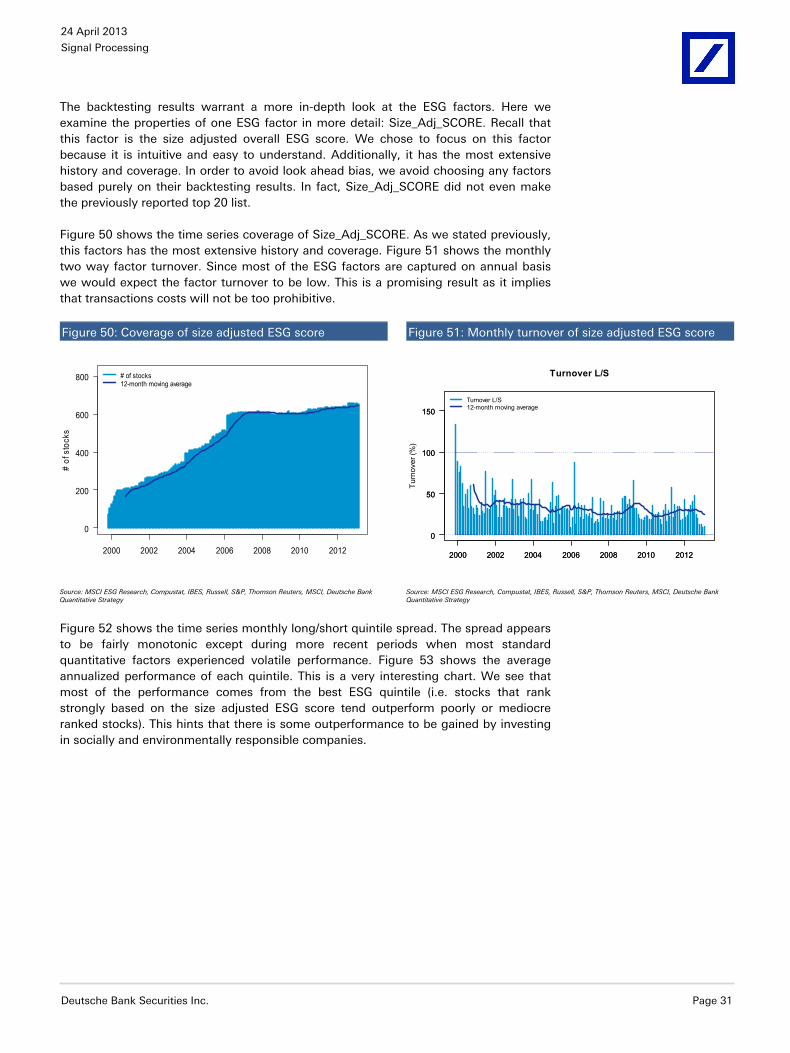
The backtesting results warrant a more in-depth look at the ESG factors. Here we examine the properties of one ESG factor in more detail: Size_Adj_SCORE. Recall that this factor is the size adjusted overall ESG score. We chose to focus on this factor because it is intuitive and easy to understand. Additionally, it has the most extensive history and coverage. In order to avoid look ahead bias, we avoid choosing any factors based purely on their backtesting results. In fact, Size_Adj_SCORE did not even make the previously reported top 20 list.
Figure 50 shows the time series coverage of Size_Adj_SCORE. As we stated previously, this factors has the most extensive history and coverage. Figure 51 shows the monthly two way factor turnover. Since most of the ESG factors are captured on annual basis we would expect the factor turnover to be low. This is a promising result as it implies that transactions costs will not be too prohibitive.
Figure 50: Coverage of size adjusted ESG score Figure 51: Monthly turnover of size adjusted ESG score
2000 2002 2004 2006 2008 2010 2012
0
200
400
600
800
# of
sto
cks
# of stocks12-month moving average
2000 2002 2004 2006 2008 2010 2012
0
50
100
150
Turnover L/S
Turn
over
(%)
2000 2002 2004 2006 2008 2010 2012
0
50
100
150Turnover L/S12-month moving average
Source: MSCI ESG Research, Compustat, IBES, Russell, S&P, Thomson Reuters, MSCI, Deutsche Bank Quantitative Strategy Source: MSCI ESG Research, Compustat, IBES, Russell, S&P, Thomson Reuters, MSCI, Deutsche Bank
Quantitative Strategy
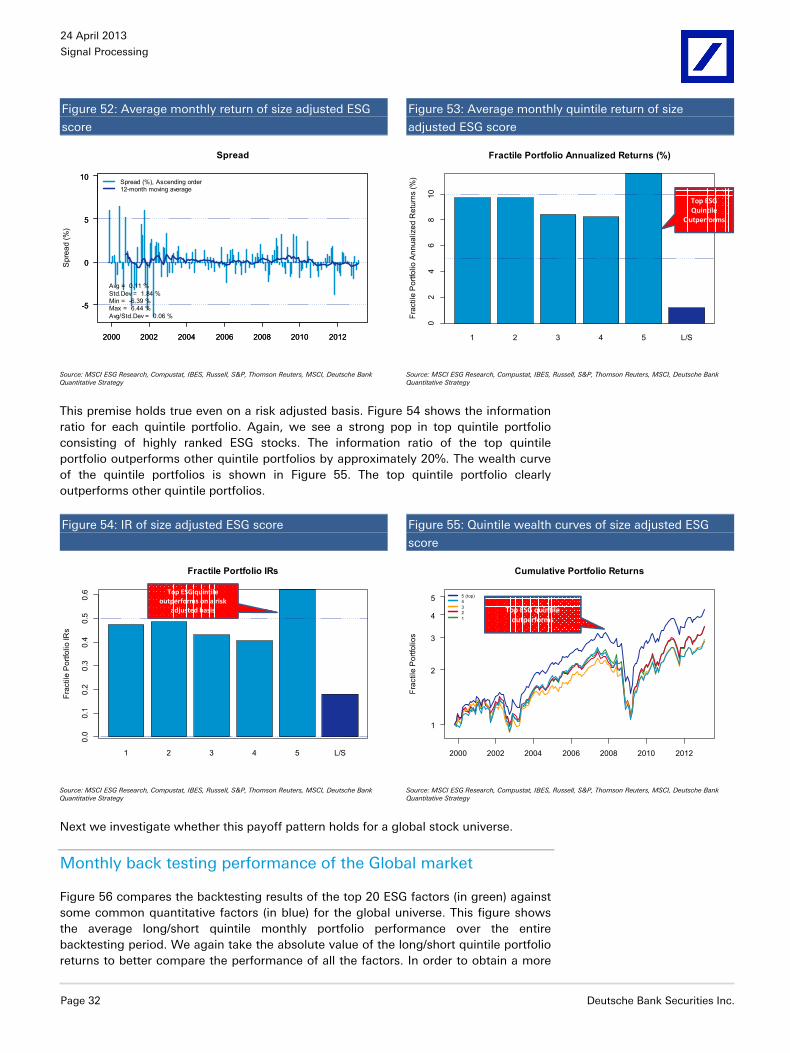
Figure 52 shows the time series monthly long/short quintile spread. The spread appears to be fairly monotonic except during more recent periods when most standard quantitative factors experienced volatile performance. Figure 53 shows the average annualized performance of each quintile. This is a very interesting chart. We see that most of the performance comes from the best ESG quintile (i.e. stocks that rank strongly based on the size adjusted ESG score tend outperform poorly or mediocre ranked stocks). This hints that there is some outperformance to be gained by investing in socially and environmentally responsible companies.
24 April 2013
Signal Processing
Page 32 Deutsche Bank Securities Inc.
Figure 52: Average monthly return of size adjusted ESG
score
Figure 53: Average monthly quintile return of size
adjusted ESG score
2000 2002 2004 2006 2008 2010 2012
-5
0
5
10
Spread
Spr
ead
(%)
2000 2002 2004 2006 2008 2010 2012
-5
0
5
10Spread (%), Ascending order12-month moving average
Avg = 0.11 %Std.Dev = 1.84 %Min = -6.39 %Max = 6.44 %Avg/Std.Dev = 0.06 %
1 2 3 4 5 L/S
Fractile Portfolio Annualized Returns (%)
Frac
tile
Por
tfolio
Ann
ualiz
ed R
etur
ns (%
)
02
46
810
Top ESGQuintile
Outperforms
Source: MSCI ESG Research, Compustat, IBES, Russell, S&P, Thomson Reuters, MSCI, Deutsche Bank Quantitative Strategy Source: MSCI ESG Research, Compustat, IBES, Russell, S&P, Thomson Reuters, MSCI, Deutsche Bank
Quantitative Strategy
This premise holds true even on a risk adjusted basis. Figure 54 shows the information ratio for each quintile portfolio. Again, we see a strong pop in top quintile portfolio consisting of highly ranked ESG stocks. The information ratio of the top quintile portfolio outperforms other quintile portfolios by approximately 20%. The wealth curve of the quintile portfolios is shown in Figure 55. The top quintile portfolio clearly outperforms other quintile portfolios.
Figure 54: IR of size adjusted ESG score
Figure 55: Quintile wealth curves of size adjusted ESG
score
1 2 3 4 5 L/S
Fractile Portfolio IRs
Frac
tile
Por
tfolio
IRs
0.0
0.1
0.2
0.3
0.4
0.5
0.6 Top ESG quintile
outperforms on a risk adjusted basis
Cumulative Portfolio Returns
Frac
tile
Por
tfolio
s
2000 2002 2004 2006 2008 2010 2012
1
2
3
4
5 5 (top)4321
Top ESG quintile outperforms
Source: MSCI ESG Research, Compustat, IBES, Russell, S&P, Thomson Reuters, MSCI, Deutsche Bank Quantitative Strategy Source: MSCI ESG Research, Compustat, IBES, Russell, S&P, Thomson Reuters, MSCI, Deutsche Bank
Quantitative Strategy
Next we investigate whether this payoff pattern holds for a global stock universe.
Monthly back testing performance of the Global market
Figure 56 compares the backtesting results of the top 20 ESG factors (in green) against some common quantitative factors (in blue) for the global universe. This figure shows the average long/short quintile monthly portfolio performance over the entire backtesting period. We again take the absolute value of the long/short quintile portfolio returns to better compare the performance of all the factors. In order to obtain a more
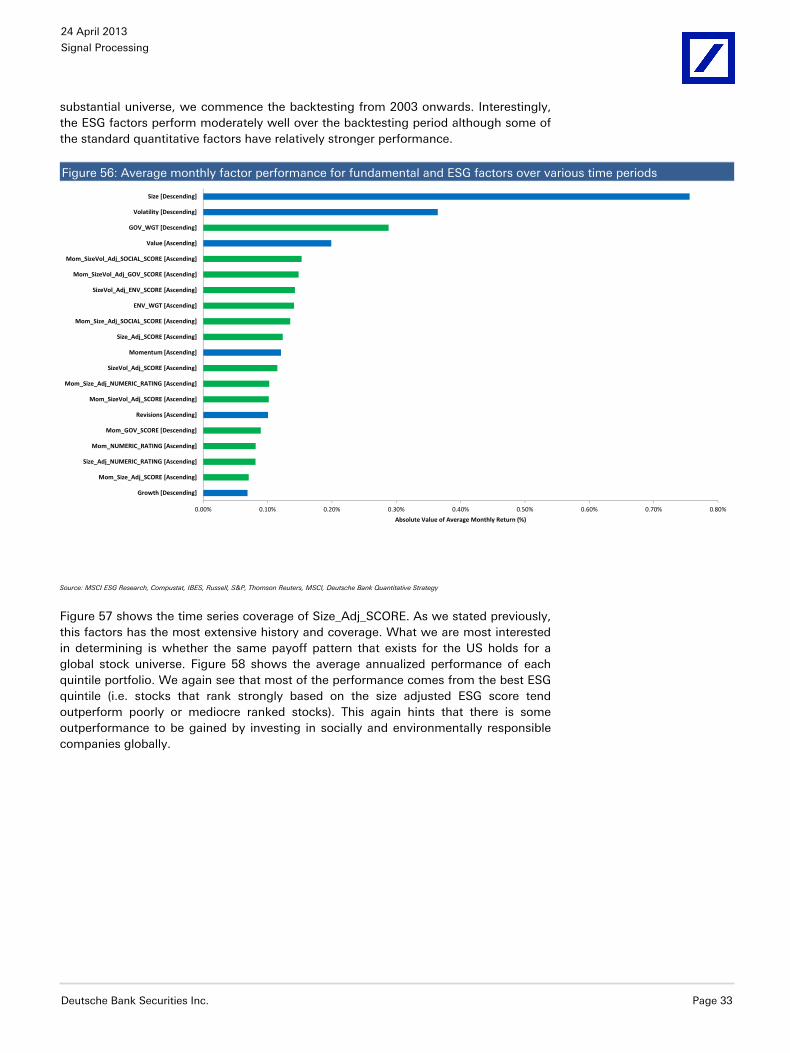
24 April 2013
Signal Processing
Deutsche Bank Securities Inc. Page 33
substantial universe, we commence the backtesting from 2003 onwards. Interestingly, the ESG factors perform moderately well over the backtesting period although some of the standard quantitative factors have relatively stronger performance.
Figure 56: Average monthly factor performance for fundamental and ESG factors over various time periods
0.00% 0.10% 0.20% 0.30% 0.40% 0.50% 0.60% 0.70% 0.80%
Growth [Descending]
Mom_Size_Adj_SCORE [Ascending]
Size_Adj_NUMERIC_RATING [Ascending]
Mom_NUMERIC_RATING [Ascending]
Mom_GOV_SCORE [Descending]
Revisions [Ascending]
Mom_SizeVol_Adj_SCORE [Ascending]
Mom_Size_Adj_NUMERIC_RATING [Ascending]
SizeVol_Adj_SCORE [Ascending]
Momentum [Ascending]
Size_Adj_SCORE [Ascending]
Mom_Size_Adj_SOCIAL_SCORE [Ascending]
ENV_WGT [Ascending]
SizeVol_Adj_ENV_SCORE [Ascending]
Mom_SizeVol_Adj_GOV_SCORE [Ascending]
Mom_SizeVol_Adj_SOCIAL_SCORE [Ascending]
Value [Ascending]
GOV_WGT [Descending]
Volatility [Descending]
Size [Descending]
Absolute Value of Average Monthly Return (%)
Source: MSCI ESG Research, Compustat, IBES, Russell, S&P, Thomson Reuters, MSCI, Deutsche Bank Quantitative Strategy
Figure 57 shows the time series coverage of Size_Adj_SCORE. As we stated previously, this factors has the most extensive history and coverage. What we are most interested in determining is whether the same payoff pattern that exists for the US holds for a global stock universe. Figure 58 shows the average annualized performance of each quintile portfolio. We again see that most of the performance comes from the best ESG quintile (i.e. stocks that rank strongly based on the size adjusted ESG score tend outperform poorly or mediocre ranked stocks). This again hints that there is some outperformance to be gained by investing in socially and environmentally responsible companies globally.
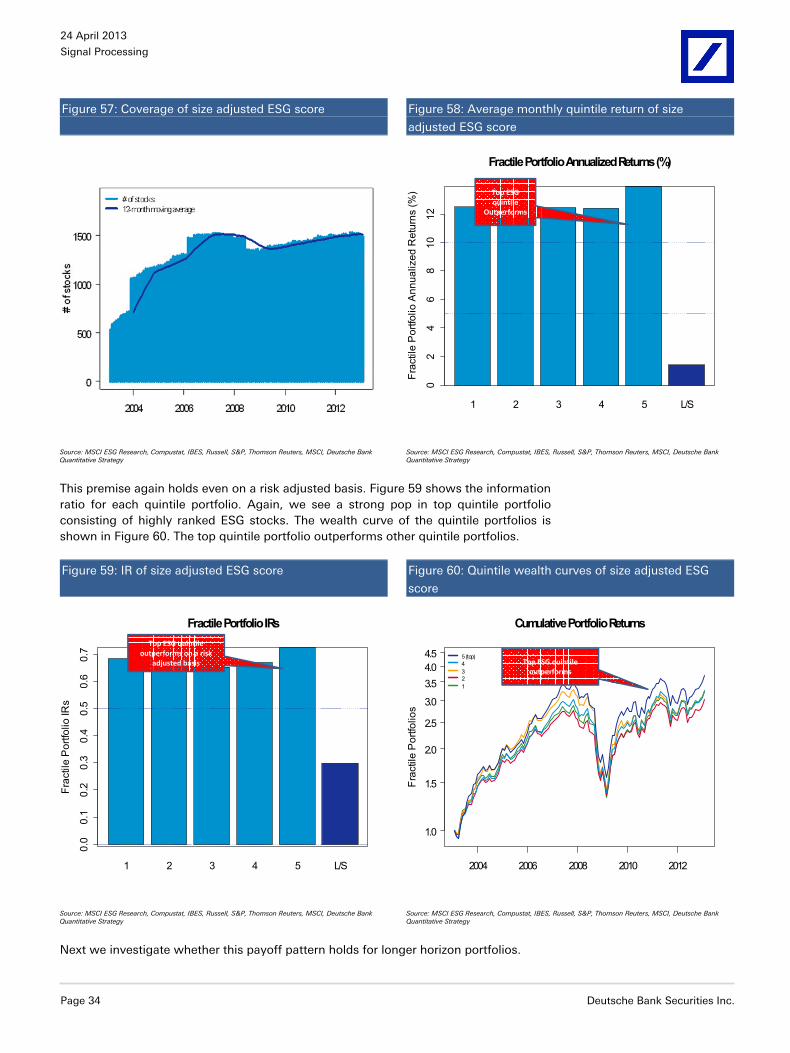
24 April 2013
Signal Processing
Page 34 Deutsche Bank Securities Inc.
Figure 57: Coverage of size adjusted ESG score
Figure 58: Average monthly quintile return of size
adjusted ESG score
1 2 3 4 5 L/S
Fractile Portfolio Annualized Returns (%)
Frac
tile
Por
tfolio
Ann
ualiz
ed R
etur
ns (%
)
02
46
810
12
Top ESGquintile
Outperforms
Source: MSCI ESG Research, Compustat, IBES, Russell, S&P, Thomson Reuters, MSCI, Deutsche Bank Quantitative Strategy Source: MSCI ESG Research, Compustat, IBES, Russell, S&P, Thomson Reuters, MSCI, Deutsche Bank
Quantitative Strategy
This premise again holds even on a risk adjusted basis. Figure 59 shows the information ratio for each quintile portfolio. Again, we see a strong pop in top quintile portfolio consisting of highly ranked ESG stocks. The wealth curve of the quintile portfolios is shown in Figure 60. The top quintile portfolio outperforms other quintile portfolios.
Figure 59: IR of size adjusted ESG score
Figure 60: Quintile wealth curves of size adjusted ESG
score
1 2 3 4 5 L/S
Fractile Portfolio IRs
Frac
tile
Por
tfolio
IRs
0.0
0.1
0.2
0.3
0.4
0.5
0.6
0.7
Top ESG quintile outperforms on a risk
adjusted basis
Cumulative Portfolio Returns
Frac
tile
Por
tfolio
s
2004 2006 2008 2010 2012
1.0
1.5
2.0
2.5
3.0
3.54.04.5 5 (top)
4321
Top ESG quintile outperforms
Source: MSCI ESG Research, Compustat, IBES, Russell, S&P, Thomson Reuters, MSCI, Deutsche Bank Quantitative Strategy Source: MSCI ESG Research, Compustat, IBES, Russell, S&P, Thomson Reuters, MSCI, Deutsche Bank
Quantitative Strategy
Next we investigate whether this payoff pattern holds for longer horizon portfolios.

24 April 2013
Signal Processing
Deutsche Bank Securities Inc. Page 35
Does ESG perform better for longer holding periods?
Here we backtest the same ESG factors but on an annual basis for the US universe. The availability of the ESG data is typically provided on an annual basis. As such, backtesting the ESG factors on an annual basis is likely the next logical step. Figure 61 compares the annual backtesting results of the top 20 ESG factors (in green) against some common quantitative factors (in blue). The figure shows the average long/short quintile annual portfolio performance over the entire backtesting period. We take the absolute value of the long/short quintile portfolio returns to better compare the performance of all the factors. Similar to the monthly backtesting results, ESG factors backtested annually performed moderately well over the backtesting period although most of the standard quantitative factors have relatively strong performance.
Figure 61: Average yearly US factor performance for fundamental and ESG factors over various time periods
0.0% 2.0% 4.0% 6.0% 8.0% 10.0% 12.0% 14.0%
Mom_Size_Adj_SOCIAL_SCORE [Ascending]
Size_Adj_SOCIAL_SCORE [Descending]
ENV_WGT [Descending]
GOV_WGT [Descending]
Mom_SizeBetaVol_Adj_SOCIAL_SCORE [Descending]
Mom_Size_Adj_GOV_SCORE [Ascending]
SOCIAL_SCORE [Descending]
Volatility [Descending]
Mom_SizeBetaVol_Adj_GOV_SCORE [Ascending]
Mom_SCORE [Ascending]
Mom_ENV_SCORE [Descending]
Mom_NUMERIC_RATING [Ascending]
Quality [Ascending]
Revisions [Descending]
Mom_SOCIAL_SCORE [Descending]
Beta [Descending]
Mom_GOV_SCORE [Descending]
Momentum [Descending]
Value [Ascending]
Size [Descending]
Absolute Value of Average Annual Return (%)
Source: MSCI ESG Research, Compustat, IBES, Russell, S&P, Thomson Reuters, MSCI, Deutsche Bank Quantitative Strategy
However, interestingly we find the best ranked ESG companies outperform poor or mediocre ranked companies on an absolute basis (Figure 62) as well as a risk adjusted basis (Figure 63). These findings substantiate that ESG factors can potentially best be used in the context of a tilted, long only portfolio rather than a traditional long/short quant portfolio. We explore this idea next.
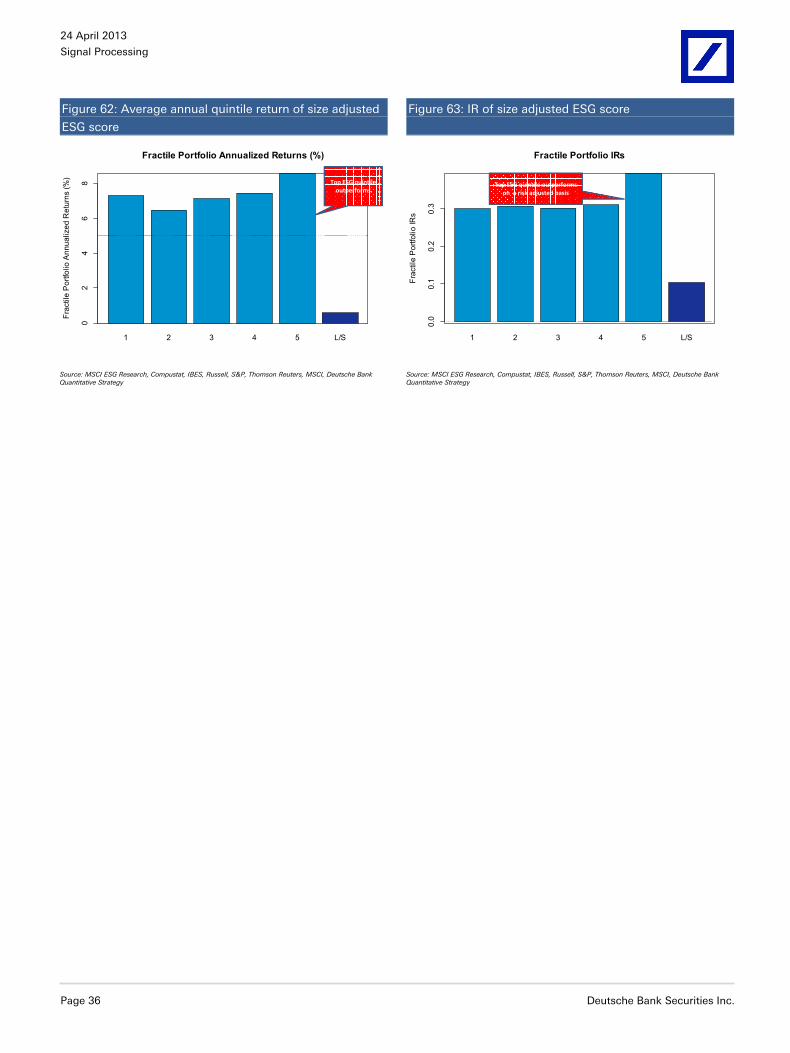
24 April 2013
Signal Processing
Page 36 Deutsche Bank Securities Inc.
Figure 62: Average annual quintile return of size adjusted
ESG score
Figure 63: IR of size adjusted ESG score
1 2 3 4 5 L/S
Fractile Portfolio Annualized Returns (%)
Frac
tile
Por
tfolio
Ann
ualiz
ed R
etur
ns (%
)
02
46
8 Top ESG quintile outperforms
1 2 3 4 5 L/S
Fractile Portfolio IRs
Frac
tile
Por
tfolio
IRs
0.0
0.1
0.2
0.3
Top ESG quintile outperforms on a risk adjusted basis
Source: MSCI ESG Research, Compustat, IBES, Russell, S&P, Thomson Reuters, MSCI, Deutsche Bank Quantitative Strategy Source: MSCI ESG Research, Compustat, IBES, Russell, S&P, Thomson Reuters, MSCI, Deutsche Bank
Quantitative Strategy
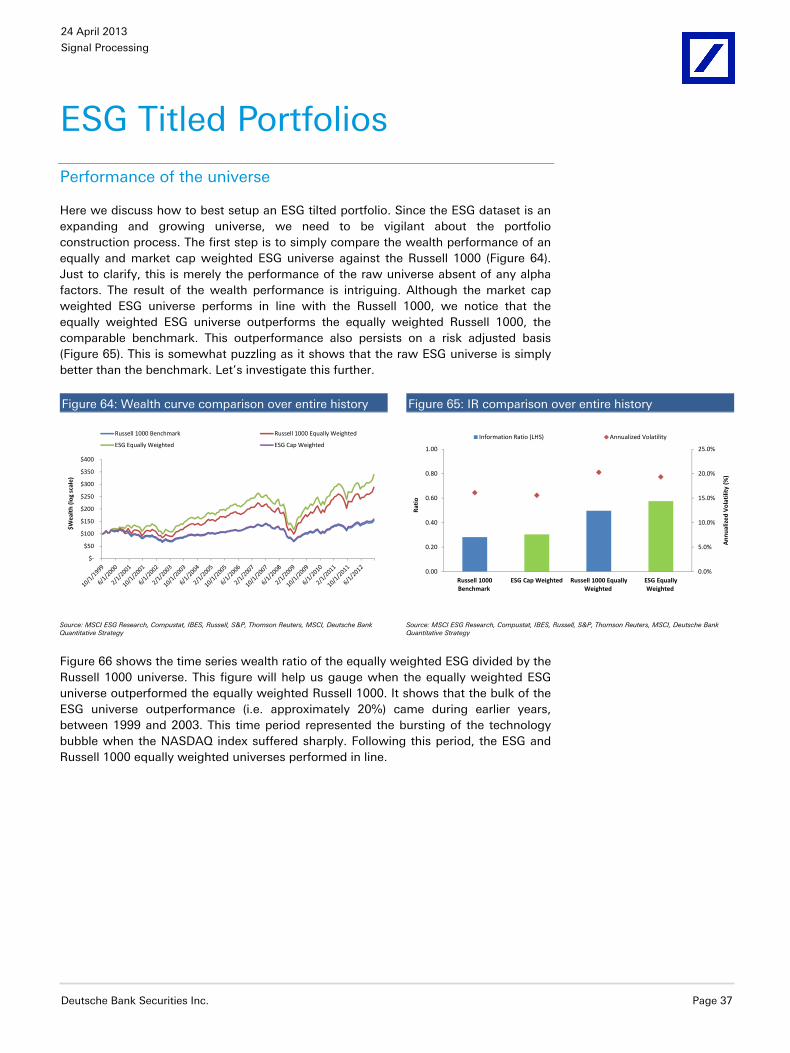
24 April 2013
Signal Processing
Deutsche Bank Securities Inc. Page 37
ESG Titled Portfolios
Performance of the universe
Here we discuss how to best setup an ESG tilted portfolio. Since the ESG dataset is an expanding and growing universe, we need to be vigilant about the portfolio construction process. The first step is to simply compare the wealth performance of an equally and market cap weighted ESG universe against the Russell 1000 (Figure 64). Just to clarify, this is merely the performance of the raw universe absent of any alpha factors. The result of the wealth performance is intriguing. Although the market cap weighted ESG universe performs in line with the Russell 1000, we notice that the equally weighted ESG universe outperforms the equally weighted Russell 1000, the comparable benchmark. This outperformance also persists on a risk adjusted basis (Figure 65). This is somewhat puzzling as it shows that the raw ESG universe is simply better than the benchmark. Let’s investigate this further.
Figure 64: Wealth curve comparison over entire history Figure 65: IR comparison over entire history
$-
$50
$100
$150
$200
$250
$300
$350
$400
$Wea
lth
(log
scal
e)
Russell 1000 Benchmark Russell 1000 Equally Weighted
ESG Equally Weighted ESG Cap Weighted
0.0%
5.0%
10.0%
15.0%
20.0%
25.0%
0.00
0.20
0.40
0.60
0.80
1.00
Russell 1000 Benchmark
ESG Cap Weighted Russell 1000 Equally Weighted
ESG Equally Weighted
Ann
ualiz
ed V
olat
ility
(%
)
Rati
o
Information Ratio (LHS) Annualized Volatility
Source: MSCI ESG Research, Compustat, IBES, Russell, S&P, Thomson Reuters, MSCI, Deutsche Bank Quantitative Strategy Source: MSCI ESG Research, Compustat, IBES, Russell, S&P, Thomson Reuters, MSCI, Deutsche Bank
Quantitative Strategy
Figure 66 shows the time series wealth ratio of the equally weighted ESG divided by the Russell 1000 universe. This figure will help us gauge when the equally weighted ESG universe outperformed the equally weighted Russell 1000. It shows that the bulk of the ESG universe outperformance (i.e. approximately 20%) came during earlier years, between 1999 and 2003. This time period represented the bursting of the technology bubble when the NASDAQ index suffered sharply. Following this period, the ESG and Russell 1000 equally weighted universes performed in line.
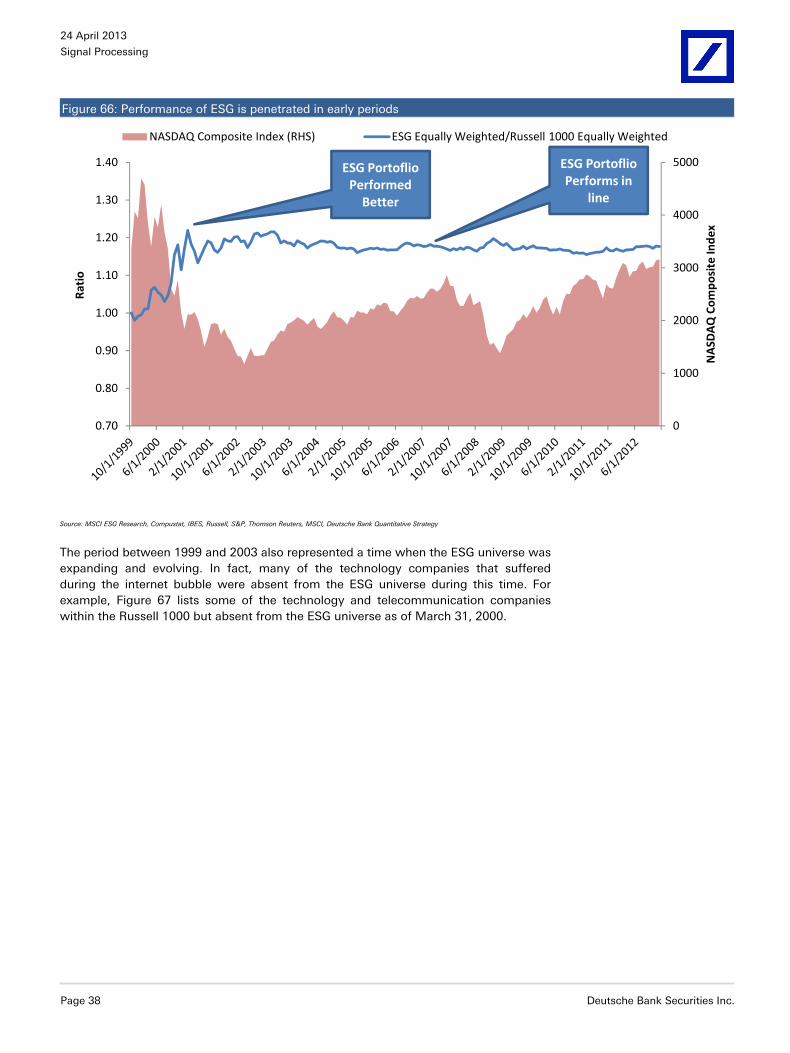
24 April 2013
Signal Processing
Page 38 Deutsche Bank Securities Inc.
Figure 66: Performance of ESG is penetrated in early periods
0
1000
2000
3000
4000
5000
0.70
0.80
0.90
1.00
1.10
1.20
1.30
1.40
NA
SDA
Q C
ompo
site
Inde
x
Rati
o
NASDAQ Composite Index (RHS) ESG Equally Weighted/Russell 1000 Equally Weighted
ESG Portoflio Performed
Better
ESG Portoflio Performs in
line
Source: MSCI ESG Research, Compustat, IBES, Russell, S&P, Thomson Reuters, MSCI, Deutsche Bank Quantitative Strategy
The period between 1999 and 2003 also represented a time when the ESG universe was expanding and evolving. In fact, many of the technology companies that suffered during the internet bubble were absent from the ESG universe during this time. For example, Figure 67 lists some of the technology and telecommunication companies within the Russell 1000 but absent from the ESG universe as of March 31, 2000.
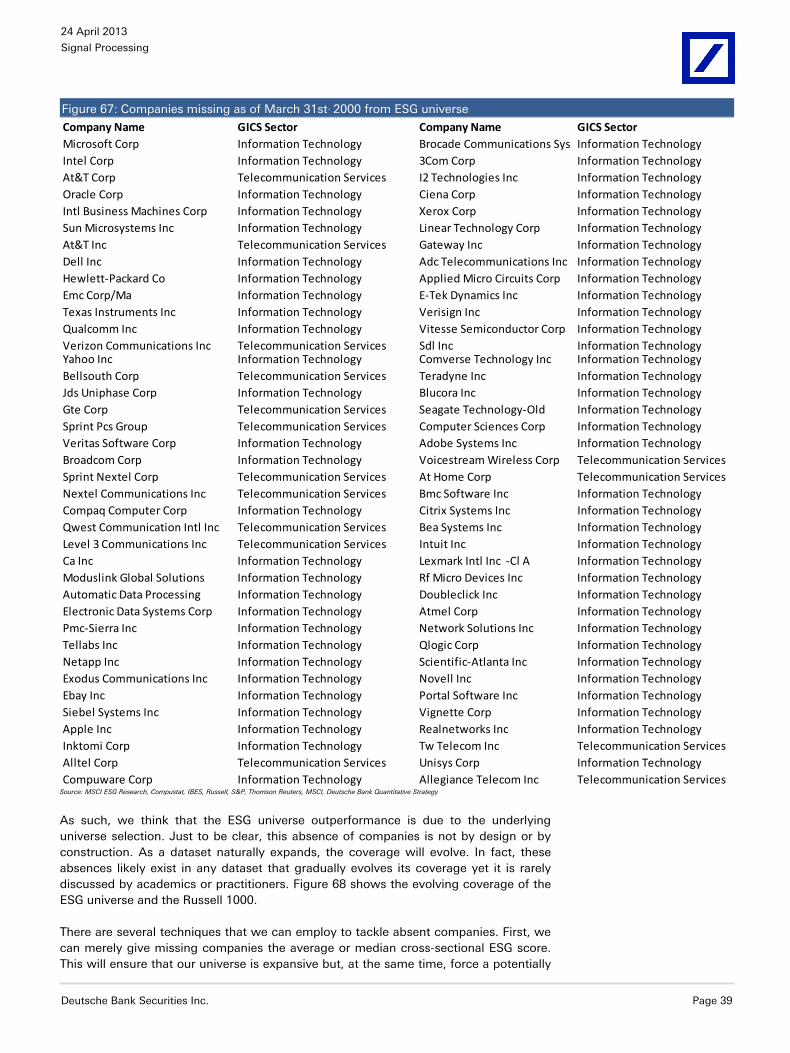
24 April 2013
Signal Processing
Deutsche Bank Securities Inc. Page 39
Figure 67: Companies missing as of March 31stst 2000 from ESG universe
Company Name GICS Sector Company Name GICS SectorMicrosoft Corp Information Technology Brocade Communications Sys Information TechnologyIntel Corp Information Technology 3Com Corp Information TechnologyAt&T Corp Telecommunication Services I2 Technologies Inc Information TechnologyOracle Corp Information Technology Ciena Corp Information TechnologyIntl Business Machines Corp Information Technology Xerox Corp Information TechnologySun Microsystems Inc Information Technology Linear Technology Corp Information TechnologyAt&T Inc Telecommunication Services Gateway Inc Information TechnologyDell Inc Information Technology Adc Telecommunications Inc Information TechnologyHewlett-Packard Co Information Technology Applied Micro Circuits Corp Information TechnologyEmc Corp/Ma Information Technology E-Tek Dynamics Inc Information TechnologyTexas Instruments Inc Information Technology Verisign Inc Information TechnologyQualcomm Inc Information Technology Vitesse Semiconductor Corp Information TechnologyVerizon Communications Inc Telecommunication Services Sdl Inc Information TechnologyYahoo Inc Information Technology Comverse Technology Inc Information TechnologyBellsouth Corp Telecommunication Services Teradyne Inc Information TechnologyJds Uniphase Corp Information Technology Blucora Inc Information TechnologyGte Corp Telecommunication Services Seagate Technology-Old Information TechnologySprint Pcs Group Telecommunication Services Computer Sciences Corp Information TechnologyVeritas Software Corp Information Technology Adobe Systems Inc Information TechnologyBroadcom Corp Information Technology Voicestream Wireless Corp Telecommunication ServicesSprint Nextel Corp Telecommunication Services At Home Corp Telecommunication ServicesNextel Communications Inc Telecommunication Services Bmc Software Inc Information TechnologyCompaq Computer Corp Information Technology Citrix Systems Inc Information TechnologyQwest Communication Intl Inc Telecommunication Services Bea Systems Inc Information TechnologyLevel 3 Communications Inc Telecommunication Services Intuit Inc Information TechnologyCa Inc Information Technology Lexmark Intl Inc -Cl A Information TechnologyModuslink Global Solutions Information Technology Rf Micro Devices Inc Information TechnologyAutomatic Data Processing Information Technology Doubleclick Inc Information TechnologyElectronic Data Systems Corp Information Technology Atmel Corp Information TechnologyPmc-Sierra Inc Information Technology Network Solutions Inc Information TechnologyTellabs Inc Information Technology Qlogic Corp Information TechnologyNetapp Inc Information Technology Scientific-Atlanta Inc Information TechnologyExodus Communications Inc Information Technology Novell Inc Information TechnologyEbay Inc Information Technology Portal Software Inc Information TechnologySiebel Systems Inc Information Technology Vignette Corp Information TechnologyApple Inc Information Technology Realnetworks Inc Information TechnologyInktomi Corp Information Technology Tw Telecom Inc Telecommunication ServicesAlltel Corp Telecommunication Services Unisys Corp Information TechnologyCompuware Corp Information Technology Allegiance Telecom Inc Telecommunication Services
Source: MSCI ESG Research, Compustat, IBES, Russell, S&P, Thomson Reuters, MSCI, Deutsche Bank Quantitative Strategy
As such, we think that the ESG universe outperformance is due to the underlying universe selection. Just to be clear, this absence of companies is not by design or by construction. As a dataset naturally expands, the coverage will evolve. In fact, these absences likely exist in any dataset that gradually evolves its coverage yet it is rarely discussed by academics or practitioners. Figure 68 shows the evolving coverage of the ESG universe and the Russell 1000.
There are several techniques that we can employ to tackle absent companies. First, we can merely give missing companies the average or median cross-sectional ESG score. This will ensure that our universe is expansive but, at the same time, force a potentially
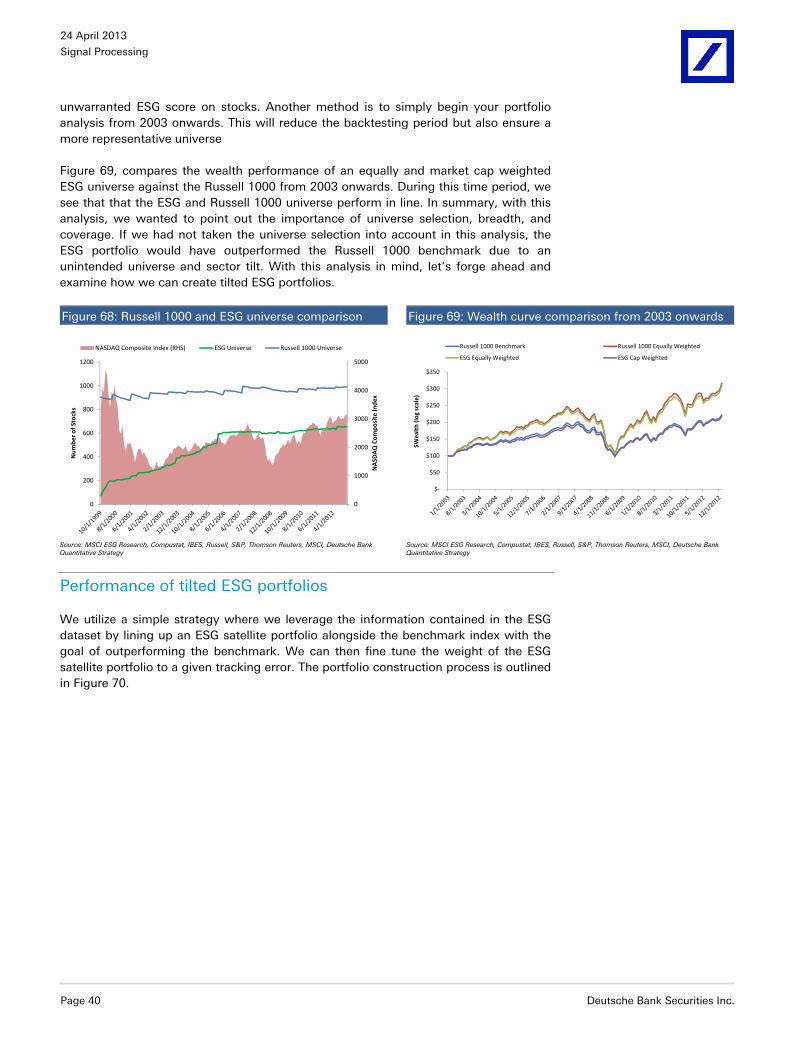
24 April 2013
Signal Processing
Page 40 Deutsche Bank Securities Inc.
unwarranted ESG score on stocks. Another method is to simply begin your portfolio analysis from 2003 onwards. This will reduce the backtesting period but also ensure a more representative universe
Figure 69, compares the wealth performance of an equally and market cap weighted ESG universe against the Russell 1000 from 2003 onwards. During this time period, we see that that the ESG and Russell 1000 universe perform in line. In summary, with this analysis, we wanted to point out the importance of universe selection, breadth, and coverage. If we had not taken the universe selection into account in this analysis, the ESG portfolio would have outperformed the Russell 1000 benchmark due to an unintended universe and sector tilt. With this analysis in mind, let’s forge ahead and examine how we can create tilted ESG portfolios.
Figure 68: Russell 1000 and ESG universe comparison Figure 69: Wealth curve comparison from 2003 onwards
0
200
400
600
800
1000
1200
0
1000
2000
3000
4000
5000
Num
ber o
f Sto
cks
NA
SDA
Q C
ompo
site
Inde
x
NASDAQ Composite Index (RHS) ESG Universe Russell 1000 Universe
$-
$50
$100
$150
$200
$250
$300
$350
$Wea
lth
(log
scal
e)
Russell 1000 Benchmark Russell 1000 Equally Weighted
ESG Equally Weighted ESG Cap Weighted
Source: MSCI ESG Research, Compustat, IBES, Russell, S&P, Thomson Reuters, MSCI, Deutsche Bank Quantitative Strategy Source: MSCI ESG Research, Compustat, IBES, Russell, S&P, Thomson Reuters, MSCI, Deutsche Bank
Quantitative Strategy
Performance of tilted ESG portfolios
We utilize a simple strategy where we leverage the information contained in the ESG dataset by lining up an ESG satellite portfolio alongside the benchmark index with the goal of outperforming the benchmark. We can then fine tune the weight of the ESG satellite portfolio to a given tracking error. The portfolio construction process is outlined in Figure 70.
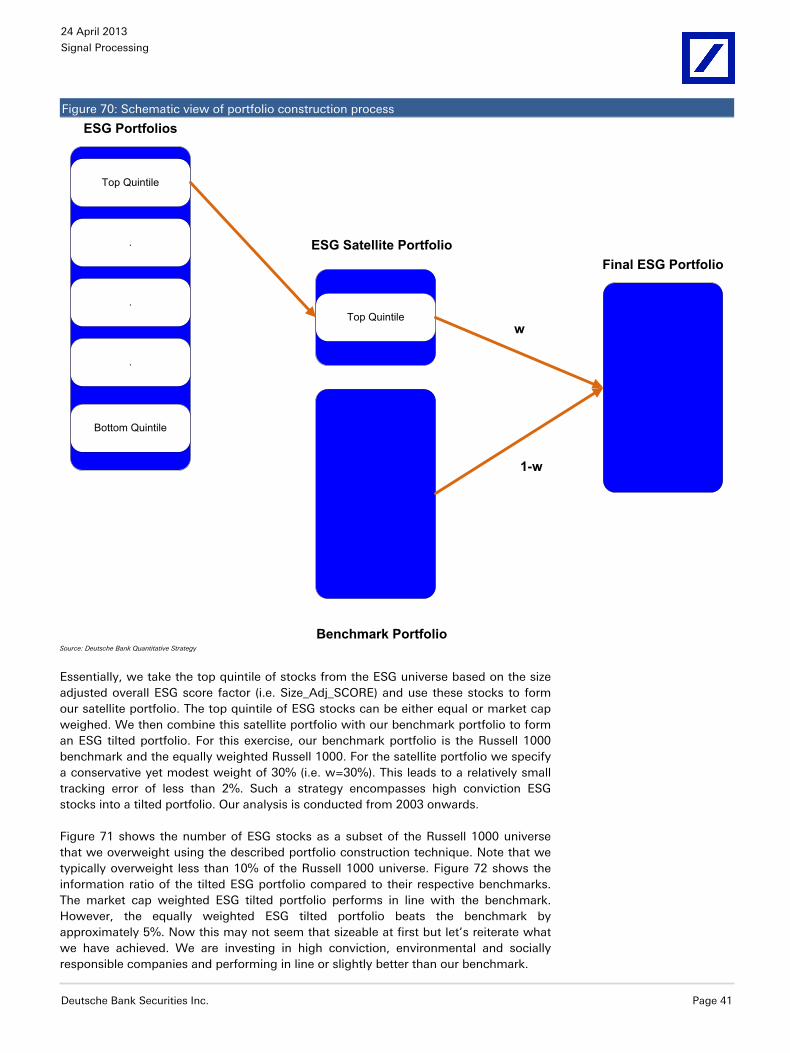
24 April 2013
Signal Processing
Deutsche Bank Securities Inc. Page 41
Figure 70: Schematic view of portfolio construction process
1-w
w
Top Quintile
.
.
.
Bottom Quintile
ESG Portfolios
Top Quintile
ESG Satellite Portfolio
Benchmark Portfolio
Final ESG Portfolio
Source: Deutsche Bank Quantitative Strategy
Essentially, we take the top quintile of stocks from the ESG universe based on the size adjusted overall ESG score factor (i.e. Size_Adj_SCORE) and use these stocks to form our satellite portfolio. The top quintile of ESG stocks can be either equal or market cap weighed. We then combine this satellite portfolio with our benchmark portfolio to form an ESG tilted portfolio. For this exercise, our benchmark portfolio is the Russell 1000 benchmark and the equally weighted Russell 1000. For the satellite portfolio we specify a conservative yet modest weight of 30% (i.e. w=30%). This leads to a relatively small tracking error of less than 2%. Such a strategy encompasses high conviction ESG stocks into a tilted portfolio. Our analysis is conducted from 2003 onwards.
Figure 71 shows the number of ESG stocks as a subset of the Russell 1000 universe that we overweight using the described portfolio construction technique. Note that we typically overweight less than 10% of the Russell 1000 universe. Figure 72 shows the information ratio of the tilted ESG portfolio compared to their respective benchmarks. The market cap weighted ESG tilted portfolio performs in line with the benchmark. However, the equally weighted ESG tilted portfolio beats the benchmark by approximately 5%. Now this may not seem that sizeable at first but let’s reiterate what we have achieved. We are investing in high conviction, environmental and socially responsible companies and performing in line or slightly better than our benchmark.
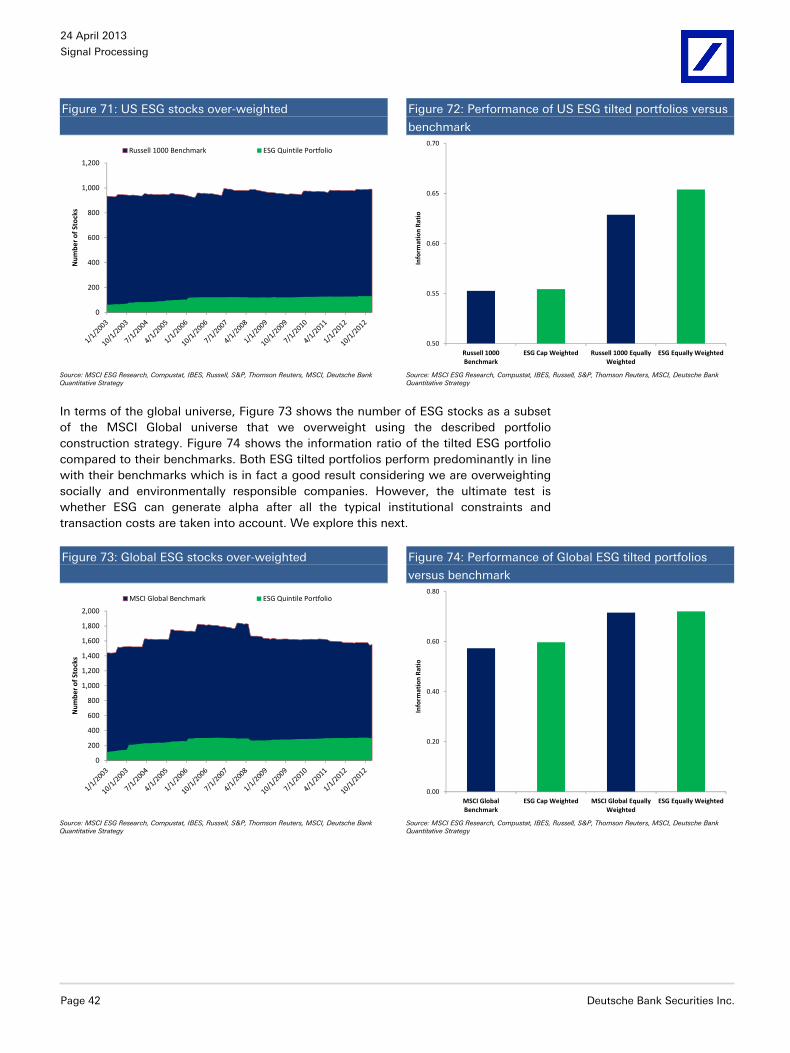
24 April 2013
Signal Processing
Page 42 Deutsche Bank Securities Inc.
Figure 71: US ESG stocks over-weighted
Figure 72: Performance of US ESG tilted portfolios versus
benchmark
0
200
400
600
800
1,000
1,200
Num
ber o
f Sto
cks
Russell 1000 Benchmark ESG Quintile Portfolio
0.50
0.55
0.60
0.65
0.70
Russell 1000 Benchmark
ESG Cap Weighted Russell 1000 Equally Weighted
ESG Equally Weighted
Info
rmat
ion
Rati
o
Source: MSCI ESG Research, Compustat, IBES, Russell, S&P, Thomson Reuters, MSCI, Deutsche Bank Quantitative Strategy Source: MSCI ESG Research, Compustat, IBES, Russell, S&P, Thomson Reuters, MSCI, Deutsche Bank
Quantitative Strategy
In terms of the global universe, Figure 73 shows the number of ESG stocks as a subset of the MSCI Global universe that we overweight using the described portfolio construction strategy. Figure 74 shows the information ratio of the tilted ESG portfolio compared to their benchmarks. Both ESG tilted portfolios perform predominantly in line with their benchmarks which is in fact a good result considering we are overweighting socially and environmentally responsible companies. However, the ultimate test is whether ESG can generate alpha after all the typical institutional constraints and transaction costs are taken into account. We explore this next.
Figure 73: Global ESG stocks over-weighted
Figure 74: Performance of Global ESG tilted portfolios
versus benchmark
0
200
400
600
800
1,000
1,200
1,400
1,600
1,800
2,000
Num
ber o
f Sto
cks
MSCI Global Benchmark ESG Quintile Portfolio
0.00
0.20
0.40
0.60
0.80
MSCI Global Benchmark
ESG Cap Weighted MSCI Global Equally Weighted
ESG Equally Weighted
Info
rmat
ion
Rati
o
Source: MSCI ESG Research, Compustat, IBES, Russell, S&P, Thomson Reuters, MSCI, Deutsche Bank Quantitative Strategy Source: MSCI ESG Research, Compustat, IBES, Russell, S&P, Thomson Reuters, MSCI, Deutsche Bank
Quantitative Strategy
24 April 2013
Signal Processing
Deutsche Bank Securities Inc. Page 43
Optimal ESG Portfolios
US portfolio performance
In this section, we perform a real world portfolio simulation that encompasses all the typical institutional constraints and transaction costs. We form our portfolio based on the size adjusted overall ESG score factor (i.e. Size_Adj_SCORE). We utilize the Axioma optimizer and risk models to simulate a long only portfolio and compare the results to the Russell 1000 and MSCI World. We assign the median ESG score for stocks that do not have an overall size adjusted ESG score. We employ the following constraints in the optimization:
Long only.
20bps transaction cost per trade.
Maximum & minimum active asset weight differential of 3% and -3% respectively.
Maximum & minimum active beta differential of 10% and -10% respectively.
Maximum & minimum active sector weight differential of 10% and -10% respectively.
Target tracking error is 5%.
Maximum & minimum active country weight differential of 10% and -10% respectively (for global portfolio only).
Two way turnover constraint of 10%, 15%, and 20% per month.
The results are very interesting. On a risk adjusted basis, the US ESG portfolio outperforms the benchmark (Figure 75) with an information ratio of 0.77. This is persistent even at a very low two-way turnover constraint of 20% per month. In addition, the US ESG portfolio outperforms a standard quality portfolio based on ROE on a risk adjusted basis (Figure 76). A standard quality portfolio is a good benchmark to compare against an ESG strategy.
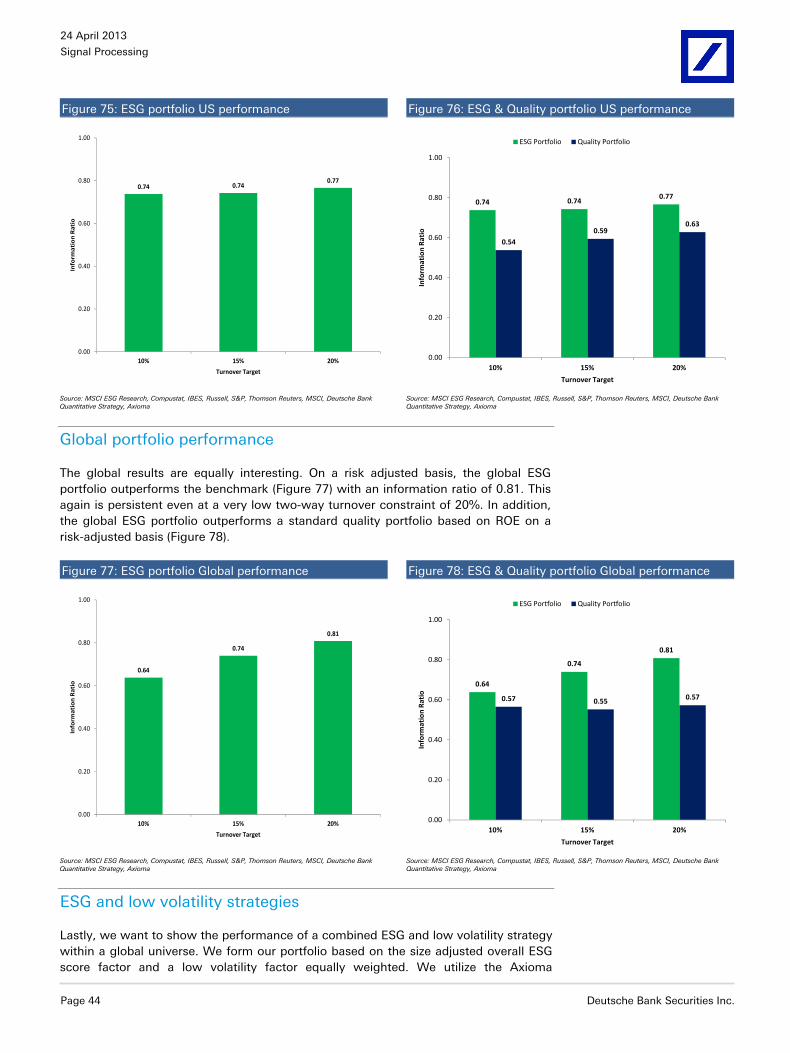
24 April 2013
Signal Processing
Page 44 Deutsche Bank Securities Inc.
Figure 75: ESG portfolio US performance Figure 76: ESG & Quality portfolio US performance
0.74 0.740.77
0.00
0.20
0.40
0.60
0.80
1.00
10% 15% 20%
Info
rmat
ion
Rat
io
Turnover Target
0.74 0.740.77
0.54
0.590.63
0.00
0.20
0.40
0.60
0.80
1.00
10% 15% 20%
Info
rmat
ion
Rati
o
Turnover Target
ESG Portfolio Quality Portfolio
Source: MSCI ESG Research, Compustat, IBES, Russell, S&P, Thomson Reuters, MSCI, Deutsche Bank Quantitative Strategy, Axioma Source: MSCI ESG Research, Compustat, IBES, Russell, S&P, Thomson Reuters, MSCI, Deutsche Bank
Quantitative Strategy, Axioma
Global portfolio performance
The global results are equally interesting. On a risk adjusted basis, the global ESG portfolio outperforms the benchmark (Figure 77) with an information ratio of 0.81. This again is persistent even at a very low two-way turnover constraint of 20%. In addition, the global ESG portfolio outperforms a standard quality portfolio based on ROE on a risk-adjusted basis (Figure 78).
Figure 77: ESG portfolio Global performance Figure 78: ESG & Quality portfolio Global performance
0.64
0.74
0.81
0.00
0.20
0.40
0.60
0.80
1.00
10% 15% 20%
Info
rmat
ion
Rat
io
Turnover Target
0.64
0.74
0.81
0.57 0.55 0.57
0.00
0.20
0.40
0.60
0.80
1.00
10% 15% 20%
Info
rmat
ion
Rati
o
Turnover Target
ESG Portfolio Quality Portfolio
Source: MSCI ESG Research, Compustat, IBES, Russell, S&P, Thomson Reuters, MSCI, Deutsche Bank Quantitative Strategy, Axioma Source: MSCI ESG Research, Compustat, IBES, Russell, S&P, Thomson Reuters, MSCI, Deutsche Bank
Quantitative Strategy, Axioma
ESG and low volatility strategies
Lastly, we want to show the performance of a combined ESG and low volatility strategy within a global universe. We form our portfolio based on the size adjusted overall ESG score factor and a low volatility factor equally weighted. We utilize the Axioma
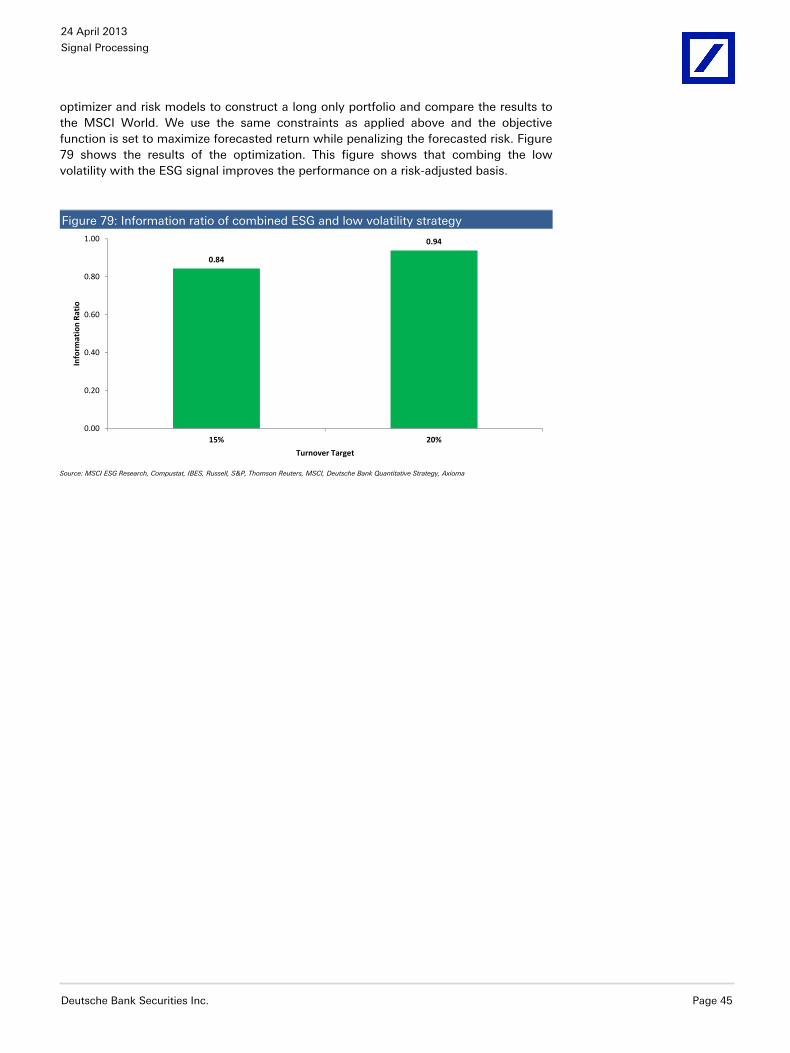
24 April 2013
Signal Processing
Deutsche Bank Securities Inc. Page 45
optimizer and risk models to construct a long only portfolio and compare the results to the MSCI World. We use the same constraints as applied above and the objective function is set to maximize forecasted return while penalizing the forecasted risk. Figure 79 shows the results of the optimization. This figure shows that combing the low volatility with the ESG signal improves the performance on a risk-adjusted basis.
Figure 79: Information ratio of combined ESG and low volatility strategy
0.84
0.94
0.00
0.20
0.40
0.60
0.80
1.00
15% 20%
Info
rmat
ion
Rati
o
Turnover Target
Source: MSCI ESG Research, Compustat, IBES, Russell, S&P, Thomson Reuters, MSCI, Deutsche Bank Quantitative Strategy, Axioma
24 April 2013
Signal Processing
Page 46 Deutsche Bank Securities Inc.
Special Thanks We would like to express a special thank you to the MSCI ESG Research team for their assistance with the ESG dataset. In particular, we would like to thank Noel Friedman, Hewson Baltzell, and Ken Frankel. Additionally, we would like to express our gratitude to US SIF, The Forum for Sustainable and Responsible Investment for their report on the Sustainable and Responsible Investing Trends in the US for 2012. In particular, we would like to thank Meg Voorhes. Lastly, we would like to thank Gary Hattem, President of the Deutsche Bank Americas Foundation for his assistance and support.
24 April 2013
Signal Processing
Deutsche Bank Securities Inc. Page 47
References Boersch, A. [2010]. “Doing Good by Investing Well? Pension Funds and Socially Responsible Investment: Results of an Expert Survey”, Allianz Global Investors International Pension Papers No. 1/2010. January 15, 2010, SSRN paper, available at http://ssrn.com/abstract=1607730 Dimson, E., Karakas, O. and Li, X. [2012]. “Active Ownership”. December 17, 2012. Available at SSRN: http://ssrn.com/abstract=2154724 “Does Socially Responsible Investing Hurt Investment Returns?”. Phillips, Hager & North Investment Management, 12 October 2007. Fuerst, F., Cajias, M., McAllister, P. and Nanda, A. [2011]. “Do Responsible Real Estate Companies Outperform Their Peers?”, August 26, 2011. Available at SSRN: http://ssrn.com/abstract=1808701 Fulton, M. Kahn, B. and Sharples, C. [2012]. “Sustainable Investment: Establishing Long-Term Value and Performance”, DB Climate Change Advisors, June 2012. Glac, K. [2010]. “The Influence of Shareholders on Corporate Social Responsibility”, Opus College of Business, University of St. Thomas, Working Paper no. 2, 2010, http://www.cebcglobal.org/ Halvorssen, A.M. [2010]. “Addressing Climate Change Through the Norwegian Sovereign Wealth Fund (SWF) - Using Responsible Investments to Encourage Corporations to take ESG Issues into Account in their Decision-Making”, International and Comparative Corporate Law Journal, Forthcoming; University of Oslo Faculty of Law Research Paper No. 2010-06.21 Nov, 2010, Available at SSRN: http://ssrn.com/abstract=1712799 Harper, V. [2010]. “Enlightened Shareholder Value': Corporate Governance Beyond the Shareholder-Stakeholder Divide”. Journal of Corporation Law, Vol. 36, No. 1, p. 59, 2010. August 11, 2010. Available at SSRN: http://ssrn.com/abstract=1476116 Hawn, O. and Ioannou, I. [2012]. “Do Actions Speak Louder than Words? The Case of Corporate Social Responsibility (CSR)”. July 6, 2012. Available at SSRN: http://ssrn.com/abstract=2101775 Hoepner, A. [2009]. “Future Scenarios of Responsible Investment Processes across Asset Classes: A Morphologic Analysis”. Available at SSRN: http://ssrn.com/abstract=488234 Hoepner, A. [2010]. “Portfolio diversification and environmental, social or governance criteria: Must responsible investments really be poorly diversified?”. Available at SSRN: http://ssrn.com/abstract=599334 Huppé, G. [2011]. “Alpha's Tale: The Economic Value of CSR (July 30, 2011). Principles for Responsible Investment”, Academic Conference, September 2011. Available at SSRN: http://ssrn.com/abstract=1969583 “Intangible Value Assessment (IVA) Rating History 2007-present”, MSCI ESG Research, September 2012. “Intangible Value Assessment (IVA) Methodology”, MSCI ESG Research, November 2012. “Integrating ESG into Mainstream Portfolios”, Responsible Investor, November 2008.
24 April 2013
Signal Processing
Page 48 Deutsche Bank Securities Inc.
Kreider, J. [2008]. “Responsible Investments: An Analysis of Socially Responsible U.S. Mutual Funds”, Lipper Fiduciary Research, November 2008. Marsat, S. and Williams, B. [2011]. “CSR and Market Valuation: International Evidence” (March 1, 2011). International Conference of the French Finance Association (AFFI). May 2011. Available at SSRN: http://ssrn.com/abstract=1833581 Matt, B and Stroh, C. [2012]. “Companies most favored by Socially Responsible Investors”, IPREO SRI Leaders Report, Fall 2012. Nagy, Z., Cogan, D. and Sinnreich, D. [2012]. “Optimizing Environmental, Social and Governance Factors in Portfolio Construction: Analysis of three ESG-tilted strategies”. MSCI ESG Research, September 2012. “Report on Sustainable and Responsible Investing Trends in the United States”, US SIF Foundation, 2012. “RI Screened Funds Report (Europe)”, Responsible Investor, April 2011. Roy, H. and Gitman, L. [2012]. “Trends in ESG Integration in Investments”, BSR, August 2012. “Sustainability Trends in US Alternative Investments”, US SIF Foundation, October 2011. Ter Horst, J., Zhang, Ch. and Renneboog, L. [2007]. “Socially Responsible Investments: Methodology, Risk Exposure and Performance” (June 2007). TILEC Discussion Paper No. 2007-013; ECGI - Finance Working Paper No. 175/2007. Available at SSRN: http://ssrn.com/abstract=985267 Varma, A. and Nofsinger, J.R. [2012]. “Socially Responsible Funds and Market Crises”. Midwest Finance Association 2013 Annual Meeting Paper. September 6, 2012. Available at SSRN: http://ssrn.com/abstract=2142343 Viviani, J. and Revelli, C., “Determinants of the Financial Performance of SRI: What Methods for What Effects? An International Evidence” (May 1, 2011). International Conference of the French Finance Association (AFFI), May 2011. Available at SSRN: http://ssrn.com/abstract=1833463
Kamath R.[2010], “ESG Parctices Across Developed Markets”, Thomson Reuters Research, August 17, 2010. Available at: http://thomsonreuters.com/content/financial/pdf/news_content/esg_across_developed_markets.pdf
24 April 2013
Signal Processing
Deutsche Bank Securities Inc. Page 49
Appendix 1
Important Disclosures Additional information available upon request For disclosures pertaining to recommendations or estimates made on securities other than the primary subject of this research, please see the most recently published company report or visit our global disclosure look-up page on our website at http://gm.db.com/ger/disclosure/DisclosureDirectory.eqsr
Analyst Certification
The views expressed in this report accurately reflect the personal views of the undersigned lead analyst(s). In addition, the undersigned lead analyst(s) has not and will not receive any compensation for providing a specific recommendation or view in this report. Javed Jussa/Rochester Cahan/Miguel-A Alvarez/Sheng Wang/Yin Luo/Zongye Chen
Hypothetical Disclaimer
Backtested, hypothetical or simulated performance results have inherent limitations. Unlike an actual performance record based on trading actual client portfolios, simulated results are achieved by means of the retroactive application of a backtested model itself designed with the benefit of hindsight. Taking into account historical events the backtesting of performance also differs from actual account performance because an actual investment strategy may be adjusted any time, for any reason, including a response to material, economic or market factors. The backtested performance includes hypothetical results that do not reflect the reinvestment of dividends and other earnings or the deduction of advisory fees, brokerage or other commissions, and any other expenses that a client would have paid or actually paid. No representation is made that any trading strategy or account will or is likely to achieve profits or losses similar to those shown. Alternative modeling techniques or assumptions might produce significantly different results and prove to be more appropriate. Past hypothetical backtest results are neither an indicator nor guarantee of future returns. Actual results will vary, perhaps materially, from the analysis.
24 April 2013
Signal Processing
Page 50 Deutsche Bank Securities Inc.
Regulatory Disclosures
1.Important Additional Conflict Disclosures
Aside from within this report, important conflict disclosures can also be found at https://gm.db.com/equities under the "Disclosures Lookup" and "Legal" tabs. Investors are strongly encouraged to review this information before investing.
2. Short-Term Trade Ideas
Deutsche Bank equity research analysts sometimes have shorter-term trade ideas (known as SOLAR ideas) that are consistent or inconsistent with Deutsche Bank's existing longer term ratings. These trade ideas can be found at the SOLAR link at http://gm.db.com.
3. Country-Specific Disclosures
Australia and New Zealand: This research, and any access to it, is intended only for "wholesale clients" within the meaning of the Australian Corporations Act and New Zealand Financial Advisors Act respectively. Brazil: The views expressed above accurately reflect personal views of the authors about the subject company(ies) and its(their) securities, including in relation to Deutsche Bank. The compensation of the equity research analyst(s) is indirectly affected by revenues deriving from the business and financial transactions of Deutsche Bank. In cases where at least one Brazil based analyst (identified by a phone number starting with +55 country code) has taken part in the preparation of this research report, the Brazil based analyst whose name appears first assumes primary responsibility for its content from a Brazilian regulatory perspective and for its compliance with CVM Instruction # 483. EU countries: Disclosures relating to our obligations under MiFiD can be found at http://www.globalmarkets.db.com/riskdisclosures. Japan: Disclosures under the Financial Instruments and Exchange Law: Company name - Deutsche Securities Inc. Registration number - Registered as a financial instruments dealer by the Head of the Kanto Local Finance Bureau (Kinsho) No. 117. Member of associations: JSDA, Type II Financial Instruments Firms Association, The Financial Futures Association of Japan, Japan Investment Advisers Association. Commissions and risks involved in stock transactions - for stock transactions, we charge stock commissions and consumption tax by multiplying the transaction amount by the commission rate agreed with each customer. Stock transactions can lead to losses as a result of share price fluctuations and other factors. Transactions in foreign stocks can lead to additional losses stemming from foreign exchange fluctuations. "Moody's", "Standard & Poor's", and "Fitch" mentioned in this report are not registered credit rating agencies in Japan unless Japan or "Nippon" is specifically designated in the name of the entity. Russia: This information, interpretation and opinions submitted herein are not in the context of, and do not constitute, any appraisal or evaluation activity requiring a license in the Russian Federation.
GRCM2013PROD029047
David Folkerts-Landau Global Head of Research
Marcel Cassard
Global Head CB&S Research
Ralf Hoffmann & Bernhard Speyer Co-Heads
DB Research
Guy Ashton Chief Operating Officer
Research
Richard Smith Associate Director Equity Research
Asia-Pacific
Fergus Lynch Regional Head
Germany Andreas Neubauer
Regional Head
North America Steve Pollard
Regional Head
International Locations
Deutsche Bank AG Deutsche Bank Place Level 16 Corner of Hunter & Phillip Streets Sydney, NSW 2000 Australia Tel: (61) 2 8258 1234
Deutsche Bank AG Große Gallusstraße 10-14 60272 Frankfurt am Main Germany Tel: (49) 69 910 00
Deutsche Bank AG Filiale Hongkong International Commerce Centre, 1 Austin Road West,Kowloon, Hong Kong Tel: (852) 2203 8888
Deutsche Securities Inc. 2-11-1 Nagatacho Sanno Park Tower Chiyoda-ku, Tokyo 100-6171 Japan Tel: (81) 3 5156 6770
Deutsche Bank AG London 1 Great Winchester Street London EC2N 2EQ United Kingdom Tel: (44) 20 7545 8000
Deutsche Bank Securities Inc. 60 Wall Street New York, NY 10005 United States of America Tel: (1) 212 250 2500
Global Disclaimer The information and opinions in this report were prepared by Deutsche Bank AG or one of its affiliates (collectively "Deutsche Bank"). The information herein is believed to be reliable and has been obtained from public sources believed to be reliable. Deutsche Bank makes no representation as to the accuracy or completeness of such information.
Deutsche Bank may engage in securities transactions, on a proprietary basis or otherwise, in a manner inconsistent with the view taken in this research report. In addition, others within Deutsche Bank, including strategists and sales staff, may take a view that is inconsistent with that taken in this research report.
Deutsche Bank may be an issuer, advisor, manager, distributor or administrator of, or provide other services to, an ETF included in this report, for which it receives compensation.
Opinions, estimates and projections in this report constitute the current judgement of the author as of the date of this report. They do not necessarily reflect the opinions of Deutsche Bank and are subject to change without notice. Deutsche Bank has no obligation to update, modify or amend this report or to otherwise notify a recipient thereof in the event that any opinion, forecast or estimate set forth herein, changes or subsequently becomes inaccurate. Prices and availability of financial instruments are subject to change without notice. This report is provided for informational purposes only. It is not an offer or a solicitation of an offer to buy or sell any financial instruments or to participate in any particular trading strategy. Target prices are inherently imprecise and a product of the analyst judgement.
As a result of Deutsche Bank’s March 2010 acquisition of BHF-Bank AG, a security may be covered by more than one analyst within the Deutsche Bank group. Each of these analysts may use differing methodologies to value the security; as a result, the recommendations may differ and the price targets and estimates of each may vary widely.
In August 2009, Deutsche Bank instituted a new policy whereby analysts may choose not to set or maintain a target price of certain issuers under coverage with a Hold rating. In particular, this will typically occur for "Hold" rated stocks having a market cap smaller than most other companies in its sector or region. We believe that such policy will allow us to make best use of our resources. Please visit our website at http://gm.db.com to determine the target price of any stock.
The financial instruments discussed in this report may not be suitable for all investors and investors must make their own informed investment decisions. Stock transactions can lead to losses as a result of price fluctuations and other factors. If a financial instrument is denominated in a currency other than an investor's currency, a change in exchange rates may adversely affect the investment.
All prices are those current at the end of the previous trading session unless otherwise indicated. Prices are sourced from local exchanges via Reuters, Bloomberg and other vendors. Data is sourced from Deutsche Bank and subject companies.
Past performance is not necessarily indicative of future results. Deutsche Bank may with respect to securities covered by this report, sell to or buy from customers on a principal basis, and consider this report in deciding to trade on a proprietary basis.
Derivative transactions involve numerous risks including, among others, market, counterparty default and illiquidity risk. The appropriateness or otherwise of these products for use by investors is dependent on the investors' own circumstances including their tax position, their regulatory environment and the nature of their other assets and liabilities and as such investors should take expert legal and financial advice before entering into any transaction similar to or inspired by the contents of this publication. Trading in options involves risk and is not suitable for all investors. Prior to buying or selling an option investors must review the "Characteristics and Risks of Standardized Options," at http://www.theocc.com/components/docs/riskstoc.pdf If you are unable to access the website please contact Deutsche Bank AG at +1 (212) 250-7994, for a copy of this important document.
The risk of loss in futures trading, foreign or domestic, can be substantial. As a result of the high degree of leverage obtainable in futures trading, losses may be incurred that are greater than the amount of funds initially deposited.
Unless governing law provides otherwise, all transactions should be executed through the Deutsche Bank entity in the investor's home jurisdiction. In the U.S. this report is approved and/or distributed by Deutsche Bank Securities Inc., a member of the NYSE, the NASD, NFA and SIPC. In Germany this report is approved and/or communicated by Deutsche Bank AG Frankfurt authorized by the BaFin. In the United Kingdom this report is approved and/or communicated by Deutsche Bank AG London, a member of the London Stock Exchange and regulated by the Financial Services Authority for the conduct of investment business in the UK and authorized by the BaFin. This report is distributed in Hong Kong by Deutsche Bank AG, Hong Kong Branch, in Korea by Deutsche Securities Korea Co. This report is distributed in Singapore by Deutsche Bank AG, Singapore Branch or Deutsche Securities Asia Limited, Singapore Branch, and recipients in Singapore of this report are to contact Deutsche Bank AG, Singapore Branch or Deutsche Securities Asia Limited, Singapore Branch in respect of any matters arising from, or in connection with, this report. Where this report is issued or promulgated in Singapore to a person who is not an accredited investor, expert investor or institutional investor (as defined in the applicable Singapore laws and regulations), Deutsche Bank AG, Singapore Branch or Deutsche Securities Asia Limited, Singapore Branch accepts legal responsibility to such person for the contents of this report. In Japan this report is approved and/or distributed by Deutsche Securities Inc. The information contained in this report does not constitute the provision of investment advice. In Australia, retail clients should obtain a copy of a Product Disclosure Statement (PDS) relating to any financial product referred to in this report and consider the PDS before making any decision about whether to acquire the product. Deutsche Bank AG Johannesburg is incorporated in the Federal Republic of Germany (Branch Register Number in South Africa: 1998/003298/10). Additional information relative to securities, other financial products or issuers discussed in this report is available upon request. This report may not be reproduced, distributed or published by any person for any purpose without Deutsche Bank's prior written consent. Please cite source when quoting.
Copyright © 2013 Deutsche Bank AG