Embed Size (px)
Citation preview
Javana: A System for BuildingCustomized Java Program Analysis Tools
Jonas Maebe Dries Buytaert Lieven Eeckhout Koen De BosschereELIS, Ghent University, Belgium
{jmaebe,dbuytaer,leeckhou,kdb}@elis.UGent.be
AbstractUnderstanding the behavior of applications running on high-levellanguage virtual machines, as is the case in Java, is non-trivial be-cause of the tight entanglement at the lowest execution level be-tween the application and the virtual machine. This paper proposesJavana, a system for building Java program analysis tools. Javanaprovides an easy-to-use instrumentation infrastructure that allowsfor building customized profiling tools very quickly.
Javana runs a dynamic binary instrumentation tool underneaththe virtual machine. The virtual machine communicates with theinstrumentation layer through an event handling mechanism forbuilding a vertical map that links low-level native instruction point-ers and memory addresses to high-level language concepts such asobjects, methods, threads, lines of code, etc. The dynamic binaryinstrumentation tool then intercepts all memory accesses and in-structions executed and provides the Javana end user with high-level language information for all memory accesses and nativelyexecuted instructions.
We demonstrate the power of Javana through a number of ap-plications: memory address tracing, vertical cache simulation andobject lifetime computation. For each of these applications, the in-strumentation specification requires only a small number of linesof code. Developing similarly powerful profiling tools within a vir-tual machine (as done in current practice) is both time-consumingand error-prone; in addition, the accuracy of the obtained profilingresults might be questionable as we show in this paper.
Categories and Subject Descriptors D.2.5 [Testing and Debug-ging]: Tracing; D.3.4 [Processors]: Run-time Environments
General Terms Experimentation, Measurement, Performance
Keywords Customized Program Analysis Tool, Java, Aspect-Oriented Instrumentation
1. IntroductionUnderstanding the behavior of software is of primary importanceto improve its performance. Application and system software de-velopers need a good understanding of an application’s behavior inorder to optimize overall system performance. Analyzing the be-havior of applications written in languages such as C and C++ is a
Permission to make digital or hard copies of all or part of this work for personal orclassroom use is granted without fee provided that copies are not made or distributedfor profit or commercial advantage and that copies bear this notice and the full citationon the first page. To copy otherwise, to republish, to post on servers or to redistributeto lists, requires prior specific permission and/or a fee.OOPSLA’06 October 22–26, 2006, Portland, Oregon, USA.Copyright c© 2006 ACM 1-59593-348-4/06/0010. . . $5.00.
well understood problem. However, understanding the behavior ofmodern software that relies on a runtime system, also called a vir-tual machine (VM), is much more challenging. The popularity ofhigh-level language virtualization software has grown significantlyover the recent years with programming environments such as Javaand .NET. The reasons for the increased popularity of high-levellanguage virtual machines are portability, security, robustness, au-tomatic memory management, etc. Virtualization though makes thebehavior of modern software fairly hard to understand because ofthe tight entanglement between the application and the virtualiza-tion software.
1.1 The Javana conceptThis paper proposes Javana, a system for building customized Javaprogram analysis tools. Javana comes with an easy-to-use instru-mentation framework so that only a few lines of instrumentationcode need to be programmed for building powerful profiling tools.The Javana instrumentation framework provides the end user withboth high-level and low-level information. The high-level informa-tion relates to the Java application and the VM, such as thread IDs,method IDs, source code line numbers, object IDs, object types,etc. The low-level information consists of instruction pointers andmemory addresses. Running the Java application of interest withinthe Javana system along with user-specified instrumentation rou-tines then collects the desired profiles of the Java application.
The Javana system consists of a VM along with a dynamic bi-nary instrumentation tool that runs underneath the VM. The virtualmachine communicates with the dynamic binary instrumentationtool through an event handling mechanism. The virtual machineinforms the instrumentation layer about a number of events, forexample when an object is created, moved or collected, or whena method gets compiled or re-compiled, etc. The dynamic binaryinstrumentation tool then catches these events and subsequentlybuilds a vertical map that links instruction pointer and memory ad-dresses to high-level language concepts.
The dynamic binary instrumentation tool also captures all na-tively executed machine instructions during a profiling run withinJavana; this includes instructions executed in native functionscalled through the Java Native Interface (JNI). Instrumenting allnatively executed machine instructions causes a substantial slow-down, however, it enables Javana to know for all native instruc-tions from what method and thread the instruction comes and towhat line of source code the instruction corresponds; and for all ac-cessed memory locations, Javana knows what objects are accessed.
The Javana concept is also easy to transfer to other virtual ma-chines and other dynamic binary instrumentation tools; building aJavana system is easy to do. Only a few lines of code need to beadded to the virtual machine to make the virtual machine Javana-enabled as we demonstrate through our proof-of-concept imple-mentation that combines the Jikes RVM [1] with DIOTA [16, 17].
Our proof-of-concept Javana implementation is publicly availableat http://www.elis.ugent.be/javana/.
1.2 ApplicationsJavana enables the building of vertical profiling tools, i.e., profil-ing tools that crosscut the Java application, the VM and the nativeexecution layers. Vertical profiling tools are invaluable for gaininginsight into the overall performance and behavior of a Java appli-cation. When looking at the lowest level of the execution stack,i.e., when looking at the individual instructions executed on thehost machine, it is hard to understand the application’s behaviorbecause of the fact that the virtualization software gets intermixedwith application code.
However, when the goal is deep understanding of the applica-tion’s behavior, the lowest level of the execution stack really is thelevel to look at. Vertical profiling enables gaining such insightsand Javana makes vertical profiling easy to do. Building equallypowerful profiling tools without Javana is both tedious and error-prone; modifying the virtual machine by adding instrumentationcode changes the code and data layout which perturbs the nativeexecution behavior substantially. Dynamic binary instrumentationunderneath the virtual machine as done in Javana alleviates this is-sue.
In this paper we demonstrate the power of Javana through threeapplications. Our first application is memory address tracing. A re-cent study published by Shuf et al. [21] analyzed the memory be-havior of Java applications based on memory address traces. Theyinstrumented the virtual machine to trace all heap accesses, but didnot trace stack accesses. We found that on average 58% of all mem-ory accesses in a Java application are non-heap accesses. As such,not including non-heap accesses in a memory behavior analysisstudy may significantly skew the overall results. The Javana systemcaptures all memory accesses and consequently is more accurate.
In our second application we build a vertical profiling tool foranalyzing the memory hierarchy behavior of Java applications. Thiscache performance profiling tool tracks cache miss rates per ob-ject type and per method and thus allows for quickly computingthe top most cache miss causing lines of code, the top most cachemiss causing object types, etc. This is invaluable information foran application developer who wants to optimize the memory per-formance of his software. Again, we want to emphasize how easythis profiling tool was to set up — only a few lines of instrumenta-tion code are needed.
Our third application shows how easy it is to build an objectlifetime analysis tool in Javana. Previous work [20] has shown thatobject lifetime is an important characteristic which can be used foranalyzing and optimizing the memory behavior of Java applica-tions. Computing an object’s lifetime, although conceptually sim-ple, is challenging in practice without Javana because the virtualmachine needs to be adjusted in numerous ways in order to trackall possible accesses to all objects, including accesses that occurthrough the Java Native Interface (JNI). This requires an in-depthunderstanding of the virtual machine. Computing object lifetimedistributions with Javana on the other hand, is easy to set up and inaddition, is guaranteed to deliver accurate object lifetimes.
1.3 Paper organizationThis paper is organized as follows. We first detail on the Javana sys-tem and subsequently describe the Javana instrumentation languagethat we developed as part of the Javana system. We then quantifyJavana’s performance and demonstrate how powerful Javana is forquickly building customized Java program analysis tools. Finally,we discuss related work and conclude the paper.
Operating system
Hardware
Binary instrumentation
Virtual machine
Java API
Java application
Instrumentationspecification
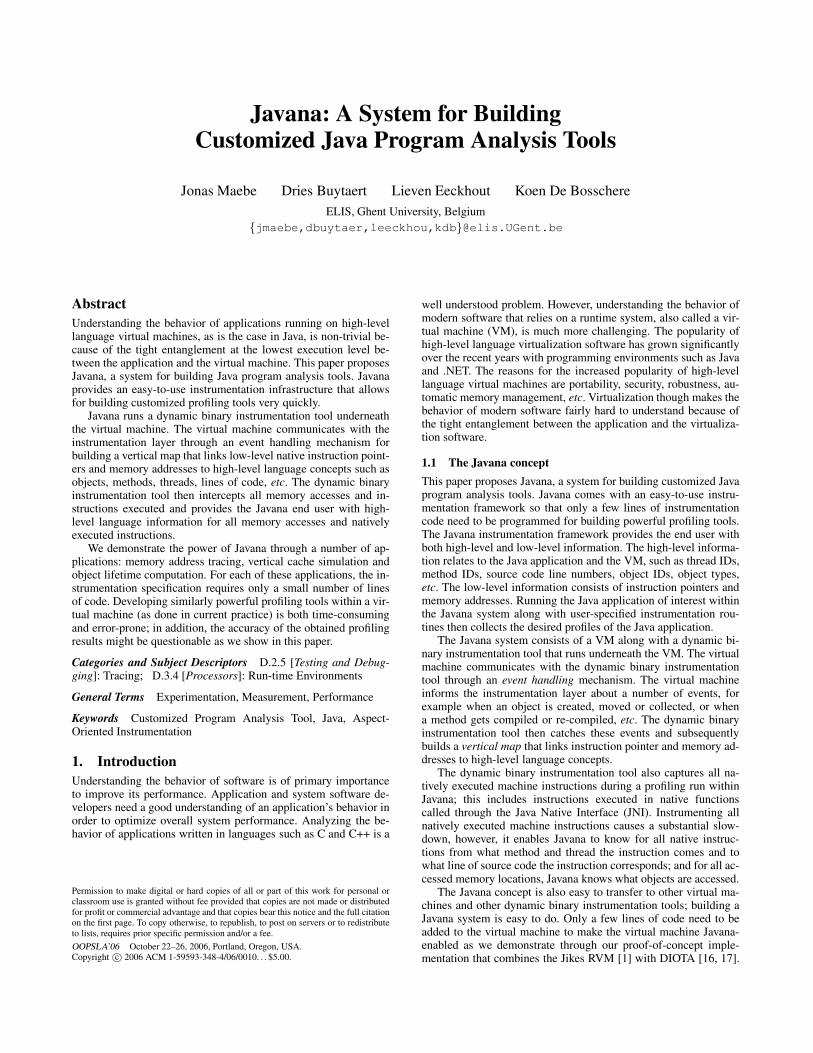
Figure 1. The Javana system for profiling Java applications.
2. The Javana systemFigure 1 illustrates the basic concept of the Javana system. The topof the execution stack shows a Java application that is to be profiled.The Java application together with a number of Java libraries runson top of a virtual machine. The virtual machine translates Javabytecode instructions into native instructions. A dynamic binaryinstrumentation tool resides beneath the virtual machine and tracksall native instructions executed by the virtual machine.
The key point of the Javana system is that the virtual machineinforms the dynamic binary instrumentation tool through an eventhandling mechanism whenever an object is created, moved, ordeleted; or a method is compiled, or re-compiled; or a thread is cre-ated, switched or terminated. The dynamic binary instrumentationtool then uses these events to build vertical maps that associate na-tive instruction pointers and memory addresses with objects, meth-ods, threads, etc. The dynamic binary instrumentation tool also in-tercepts all memory accesses during the execution of the Java appli-cation on the virtual machine. This includes instructions executedin native JNI functions, but excludes kernel-level system calls aswill be discussed later. Using the vertical maps, the binary instru-mentation tool associates native machine addresses to high-levelconcepts such as objects, methods, etc. This high-level informationalong with the low-level information is then made available to theend user through the Javana instrumentation framework.
The remainder of this section discusses the Javana system inmore detail. We discuss the events that are triggered by the vir-tual machine, the dynamic binary instrumentation layer in the Ja-vana system, the event handling mechanism, the vertical instru-mentation, the perturbation of the Javana system and finally ourJavana proof-of-concept implementation. All of the subsections be-low give more-or-less a general description of what the issues arefor building a Javana system; the final subsection then discusses ourown proof-of-concept implementation.
2.1 Events triggered by the virtual machineThe Javana system requires that the virtual machine is instrumentedto trigger events. These events communicate information betweenthe virtual machine and the dynamic binary instrumentation tool.Our current Javana system supports the following events:
• Class loading: When a new class is loaded and a new objecttype becomes available, the new class name is communicatedto the binary instrumentation tool.
• Object allocation: When a new object is allocated, the object’stype and memory location (object starting address and its size)are communicated.

• Object relocation: When an object is copied by the garbagecollector, the object’s new location is communicated to theinstrumentation tool.
• Method compilation: When a method is compiled, its name,memory location and a ‘code to line number’ map are com-municated to the instrumentation tool.
• Method recompilation: When a method is recompiled, themethod’s location and ‘code to line number’ map are updatedin the binary instrumentation tool.
• Method relocation: When code is moved by the garbage collec-tor, the code’s new location in memory is communicated.
• Memory freed during garbage collection: When memory isfreed, the address range of the freed memory space is commu-nicated to the binary instrumentation tool.
• Java thread creation: When a new Java thread is created, thethread’s ID and name are communicated.
• Java thread switch: When a Java thread switch occurs, the newlyscheduled Java thread’s ID is communicated.
• Java thread termination: When a Java thread has ended execu-tion, this is communicated to the dynamic binary instrumenta-tion tool.
• Java thread stack switch: When a Java thread stack is relocated,the thread ID, the old stack location and the new stack locationare communicated.
Note that this event list is just an example event list that could betracked within a Javana system. Additional events could be definedand added to this list if desired; implementing events in a virtualmachine is easy to do. We found though that this list of eventsis sufficient for our purpose of building powerful Java programanalysis tools, as will be shown in the remainder of this paper.
2.2 Dynamic binary instrumentationA dynamic binary instrumentation tool takes as input a binary andan instrumentation specification. The binary is the program of in-terest; this is the Java application running on a virtual machine inour case. The instrumentation specification indicates what needsto be instrumented in the binary; this is going to drive the cus-tomized profiling. The dynamic binary instrumentation tool theninstruments the program of interest at run time. Upon the first exe-cution of a given code fragment, the instrumentation tool reads theoriginal code, modifies it according to the instrumentation specifi-cation and stores the result as part of the instrumented binary. Theinstrumented version of the code is then executed and the desiredprofiling information is collected while executing the instrumentedbinary.
The data memory addresses referenced by the loads and storesin the instrumented binary are identical to the uninstrumented bi-nary. By keeping the original binary in memory at its original ad-dress while generating the instrumented binary elsewhere, the in-strumented binary obtains correct data values from the originaluninstrumented binary in case data-in-code is read. The instrumen-tation tool also keeps track of correspondences between instructionpointers in the original binary versus the instrumented binary. Bydoing so, the instrumentation routines see instruction pointers andmemory addresses as if they were generated during the executionof the original binary.
Running a dynamic binary instrumentation tool underneath avirtual machine requires that the instrumentation tool can deal withself-modifying code. The reason is that most virtual machines im-plement a dynamic optimizer that detects and (re-)optimizes fre-quently executed code fragments. A similar issue occurs when
garbage is collected; copying collectors may copy code from onememory location to another. This requires that the dynamic instru-mentation tool invalidates the old code fragment and replaces itwith an instrumented version of the newly generated code frag-ment.
Previous work [16] has proposed various approaches to instru-menting self-modifying code. These approaches vary in granular-ity for tracking self-modifying code: some approaches track mem-ory page level accesses, other approaches track individual memoryoperations. The bottom line is that all of them cause a substantialslowdown in execution time of the instrumented binary, in somecases to up to a factor 20. However, since the virtual machine com-municates with the dynamic binary instrumentation tool throughan event handling mechanism, we can optimize the self-modifyingcode support. We use the information provided by the event han-dling to invalidate an old code fragment and to replace it with aninstrumented version of the new code fragment. This eliminates theslowdown for supporting self-modifying code almost completely.
Note that the dynamic binary instrumentation tool does not trackkernel-level system calls. This limits the use of Javana to user-spaceinstrumentation.
2.3 Event handlingThe virtual machine triggers events by calling empty functions;these empty functions are native C functions. The dynamic binaryinstrumentation tool intercepts such function calls and in responsecalls the appropriate event handlers. Event handlers can accept ar-guments because the arguments placed on the stack by the virtualmachine are available to the binary instrumentation tool as well. Forexample, when allocating an object, the virtual machine calls theAllocateObject function with a number of arguments, namelythe object type t, its address m and its size s. The dynamic bi-nary instrumentation tool intercepts such events by inspecting thetarget addresses of the function calls. If the target address corre-sponds to the AllocateObject function in the above example— the dynamic binary instrumentation tool knows this function byname from the symbol information of the virtual machine — thedynamic binary instrumentation tool transfers control to the appro-priate event handler which in turn reads the arguments from thestack and adds this information to its internal data structures. Whenthe event handler has finished execution, control is transfered to thereturn address of the event’s function call, i.e., the instrumented bi-nary gets control again.
Event handling enables the dynamic instrumentation tool tobuild the vertical map. In the above example with the Allocate-Object event, the event handler adds the following informationto the vertical map: an object of type t is allocated in the memoryaddress range m to m+s. Similar event handlers exist for all theevents mentioned in section 2.1.
2.4 Vertical instrumentationThe dynamic instrumentation tool captures all native instructionsand memory accesses from both the application and the virtualmachine during the execution of a Java application within Javana.The vertical map then enables the dynamic binary instrumentationtool to know for each memory access what object is being accessedand what the object’s type is; and for every instruction pointer,the dynamic binary instrumentation tool knows to what method,to what line of source code and to what thread the instructioncorresponds. The end result is that Javana allows for easily trackingall Java object accesses, which is much harder to do without avertical map and dynamic binary instrumentation support.
In our proof-of-concept Javana system we keep track of the ver-tical map using two AVL trees — an AVL tree is a self-balancingbinary search tree. The first AVL tree, the method tree, contains
mapping information between instruction pointers and method in-formation. A node in the method tree is identified by an instructionpointer address range that corresponds to a line of source code. In-struction pointer ranges that are not represented in the method treedo not correspond to a Java source code line. The second AVL treecalled the object tree contains object information. A node in theobject tree identifies an object based on the object’s address range,i.e., the object’s address and size. The remaining address rangesrefer to non-objects.
Note that the method and object trees are accessed very fre-quently during a profiling run. For example, for every memory ac-cess the object tree needs to be searched for the corresponding ob-ject. This is very time-consuming and has a big impact on the over-all profiling overhead. We therefore optimized the accessing of themethod and object trees by adding a caching mechanism that tracksrecently accessed object and method information. We obtain an av-erage hit rate for the object and method tree caches of 67% and99%, respectively. In addition, we further optimize the miss caseby searching the tree starting from the previous hit. This reducesthe tree search time thanks to spatial locality.
2.5 PerturbationAn important property of any instrumentation framework is thatthe results that are obtained during profiling may not suffer fromperturbation. The end user wants the instrumentation frameworkto be completely transparent to its user, i.e., the instrumentationframework should not impact the results from profiling.
More in particular, in our Javana system, care needs to be takenso that the profiling results are not perturbed by the event handlingmechanism. Recall that the virtual machine triggers events by call-ing an empty method using a number of arguments. Computingthe arguments, pushing them onto the stack, and finally calling theempty method introduces some overhead. Since the dynamic binaryinstrumentation tool instruments all natively executed instructions,the instructions executed for triggering an event in the virtual ma-chine get instrumented as well. In order to alleviate this issue, andto remove any perturbation because of the event handling mecha-nism, we communicate the address ranges of the virtual machinecode for event triggering. As such, the dynamic binary instrumen-tation tool knows that the code executed in these address rangesneeds to be disregarded.
Another issue is that many virtual machines use the notion ofabsolute time to trigger various internal events. This could be thecase for detecting hot code that needs to be scheduled for optimiza-tion. Detecting hot code can be done by sampling the call stack;when the number of samples of a given method gets above a giventhreshold, the method is considered for optimization. The Javathread scheduling also relies on the notion of time. Java threads gettime quanta for execution and when a time quantum has finished,another Java thread can be scheduled. Running a virtual machinewithin a Javana system causes the virtual machine to run slower,and by consequence, this affects timer-based virtual machine eventssuch as code optimization and Java thread scheduling. This can besolved by using deterministic replay techniques [3]. In fact, it iscommon practice in virtual machine research to solve the code op-timization non-determinism by having the virtual machine write outits recompilation strategy during an uninstrumented run, and thenreuse this recompilation strategy during the instrumented run.
2.6 A proof-of-concept Javana systemThe Javana system is a general framework for building a systemfor building customized Java program analysis tools. Any virtualmachine could be employed in this framework and any dynamicbinary instrumentation tool could be used as well. In our experi-
mental framework, we use the Jikes RVM as our virtual machineand we use DIOTA as our dynamic binary instrumentation tool.
2.6.1 Jikes RVMThe Jikes Research Virtual Machine [1] is an open source Javavirtual machine written almost entirely in Java. Jikes RVM usesa compilation-only scheme (no interpretation) for translating Javabytecodes to native machine instructions. In our experiments weuse the FastAdaptive profile: all methods are initially compiledusing a baseline compiler, and hot methods are recompiled usingan optimizing compiler.
Making the Jikes RVM Javana-enabled was easy. We only hadto insert around two hundred lines of code (including comments)into the virtual machine in order to trigger the events interceptedby the dynamic binary instrumentation tool. More specifically,we added an event to the class loader, to the object allocator, toall garbage collectors when an object or code is being moved ordeleted, to all compilers and optimizers when a method is beingcompiled or optimized, and to the thread management system whena thread is created, switched or terminated.
There is one peculiarity with instrumenting the Jikes RVM itselfthat needs special attention — this is because the Jikes RVM iswritten in Java. Instrumentation cannot be activated until the virtualmachine is properly booted. This means that there are some virtualmachine methods and objects that cannot be communicated to thebinary instrumentation tool during virtual machine startup. This canbe solved by communicating these virtual machine methods andobjects as soon as the virtual machine is properly booted. Fromthen on, the instrumentation tool intercepts all method calls andobject accesses during the program execution.
2.6.2 DIOTAThe dynamic binary instrumentation tool that we use in our proof-of-concept Javana system is DIOTA [17]. DIOTA stands for Dy-namic Instrumentation, Optimization and Transformation of Ap-plications and is a dynamic binary instrumentation framework foruse on the Linux operating system running on x86-compatible pro-cessors. Its functionality includes intercepting memory operations,code execution, signals, system calls and functions based on theirname or address, as well as the ability to instrument self-modifyingcode [16].
DIOTA is implemented as a dynamic shared library that canbe hooked up to any program. The main library of DIOTA con-tains a generic dynamic binary instrumentation infrastructure. Thisgeneric instrumentation framework can be used by so-called back-ends that specify the particular instrumentation of interest thatneeds to be done. The backend that we currently use is a memoryoperation tracing backend, i.e., this backend instruments all mem-ory operations.
The general operation of DIOTA is very similar to that of otherdynamic binary instrumentation frameworks such as PIN [15] andValgrind [18]. All of these operate in a similar way as described insection 2.2.
3. The Javana languageA system for building customized Java program analysis tools alsorequires an easy-to-use instrumentation framework. The instrumen-tation framework is the environment in which the end user willbuild its profiling tools. In this paper, we introduce the Javana in-strumentation language for building Java program profiling tools.The Javana instrumentation language is inspired by the Aspect-Oriented Programming (AOP) paradigm because AOP matches theneeds in instrumentation very well.

time qualifier := before | afterparams := location t const t * loc , type t const * type , void ** userdataobject operation := create (params) | copy (params, params) | delete (params)object event := object:object operationmemory operation := read (params) | write (params) | access (params)memory operation target := object | nonobject | anymemory event := memory operation target:memory operationevent := time qualifier memory event | object event {advice code}
Figure 2. The grammar of the Javana instrumentation language.
3.1 Aspect-Oriented ProgrammingAspect-oriented programming (AOP) [13] is best known in the con-text of high-level languages and software design methodologies,ranging from UML [24] and AspectJ for Java [12] to AspectC++for C++ [22] to TinyC2 for C [26]. The basic idea of aspect-orientedprogramming originally came from the observation that not allfunctionality in a programming model can be cleanly separated intoobjects or modules. Some requirements crosscut entire class hier-archies, multiple modules and complete programs. Aspect-orientedprogramming allows for specifying a desired functionality that con-cerns the whole program in a modular implementation.
Logging an application’s execution is one of the best knownexamples. Implementing a logging facility in a traditional mannerwithout AOP requires that logging code is inserted all over theprogram. This is very time-consuming, error-prone and hard tomaintain from a software development point of view. AOP onthe other hand allows for extracting this logging facility into aseparate module, that is then woven by a weaver with the rest of theprogram at compile time or even at run time. AOP thus significantlyimproves software maintainability.
In general, an AOP language consists of joinpoints, pointcutsand finally the advice. A joinpoint specifies where and when onecan interfere in the structure or execution of a program. This canrange from source code line numbers to syntactical constructionsto even run time events. A pointcut is a collection of joinpoints.Typically, a symbolic name can be associated with a pointcut forlater reference. Finally, the advice is code that is associated witha pointcut. The advice will be executed whenever the conditionsspecified by the pointcut are fulfilled.
The general idea of AOP languages of segregating crosscuttingconcerns in separate modules is also very much applicable to thelow-level instrumentation of programs at the machine code level.In fact, instrumenting a binary involves inserting additional codeacross the entire program in order to measure a program metricof interest [4, 14, 15, 18, 23]. Since the instrumentation itselfcan be completely segregated from the original program, AOP isa natural way for specifying instrumentation routines [19]. TheJavana instrumentation language is inspired by the AOP concept.
3.2 The Javana instrumentation languageThe Javana instrumentation language is a domain-specific languagedeveloped for the purpose of instrumenting programs written inobject-oriented languages such as Java. It combines support for rec-ognizing native execution information along with high-level lan-guage concepts such as objects, object types, methods, lines ofcode, threads, etc.
The grammar of the Javana instrumentation language is shownin Figure 2. A joinpoint that describes an event in the Javanainstrumentation language consists of a time qualifier followed by amemory event or an object event, followed by the advice code. Thetime qualifier specifies when the event should be triggered. Thiscan be before or after the event of interest. The events that can betriggered are memory events or object events. For each of those, a
struct mem_access_t {int ip; /* instruction pointer */int addr; /* memory address being accessed*/int size; /* number of bytes accessed */int ld_st; /* load or store ? */int thread_ID; /* thread ID */
}
struct location_t {struct mem_access_t *ma; /* pointer to
mem_access_t structure */int method_ID; /* method ID */char* method_name; /* method’s name */int line_number; /* line number in given method */
}
struct type_t {int type_ID; /* object class ID */char* type_name; /* object class name */
}
Figure 3. Data structures provided in the Javana instrumentationlanguage.
number of parameters are given. These parameters can then be usedby the advice code. The advice code is the instrumentation code inC inserted by the end user.
Javana also comes with a translator for converting the Javana in-strumentation statements as specified in Figure 2 into C-statementswhile keeping the advice code (that is written in C) untouched. Thetranslated instrumentation specification is then linked with DIOTAand the Jikes RVM for driving the profiling run.
We now discuss the object and memory events, the parametersthat are provided with these events and finally the Javana direc-tives. Example instrumentation specifications clarifying how to usethe Javana instrumentation language in practice will be given insection 5.
3.2.1 Object eventsAn object event consists of the keyword object followed byan object operation. The object operation can be the creation(create), copying (copy) or deletion (delete) of an object.
3.2.2 Memory eventsA memory event consists of memory operation target and the mem-ory operation itself. The memory operation target can be an object,memory not belonging to an object or any of those. This allowsthe end user to focus the instrumentation of memory accesses toobjects only, non-objects only, or to both objects and non-objects.The memory operation specifies the type of memory access thatshould be instrumented. This allows the end user to focus on reads,writes or both.
3.2.3 ParametersThe parameters that are provided by the Javana instrumentationlanguage are shown in Figure 3. These parameters can be usedin the advice code for driving the instrumentation. The first pa-
rameter is a data structure that collects information concerningthe ‘location’ of the object or memory event. This is done in thelocation t structure. The first element in this structure is apointer to a mem access t structure. This latter structure con-tains (i) the instruction pointer of the native instruction performingthe object or memory operation, (ii) the object’s memory locationor in case of a memory operation, the memory location being ac-cessed, (iii) the size of the object or in case of a memory operation,the number of bytes accessed in memory, (iv) whether this mem-ory access is a load or store operation—note this has no meaningin case of an object operation, and finally (v) the thread ID of thethread performing the object or memory operation. The second andthird element in the location t data structure are the methodID and the method name performing the object or memory opera-tion, respectively. The fourth and final element is the source codeline number in the given method that corresponds to this object ormemory operation.
The second parameter in the parameter list is a pointer to a datastructure that specifies information concerning the ‘type’ of theobject or memory operation. This type t structure holds a typeID and a type name of the object or memory operation. This meansthat for every object being created, copied, deleted or accessed,the Javana instrumentation language provides the end user withinformation concerning the object’s type.
The third parameter in the parameter list (void **userdata)allows the end user to maintain object-specific information. Theend user may for example set up a data structure for a given object;the pointer to this data structure can be stored through this thirdparameter. The binary instrumentation tool then makes sure thatthis pointer is available for all object and memory operations thatrefer to that same object.
3.2.4 Javana directivesThe Javana instrumentation language also comes with a number ofdirectives that can be specified at the beginning of the instrumenta-tion specification file. There are two directives in our current imple-mentation, namely #pragma requires method info and#pragma requires object info. The purpose of thesedirectives is to improve performance, i.e., to reduce the over-head of the vertical instrumentation. The #pragma requiresmethod info directive informs the dynamic binary instrumenta-tion tool that the method ID, the method name and source code linenumber should be kept track of during binary instrumentation. The#pragma requires object info directive informs the dy-namic binary instrumentation tool that the object type ID and theobject type name should be kept track of.
The user can decide not to include any of these two directivesin the instrumentation specification, to include only one of these,or to include both. This will affect the amount of information thatcan be gathered during a profiling run as well as the amount ofoverhead experienced during profiling. For example, if a user is in-terested in measuring the cache miss rate per method and per sourcecode line number, then there is no benefit in collecting per-objectinformation. The user can then use the #pragma requiresmethod info to disable tracking object-related information dur-ing the instrumentation run. This will limit the slowdown duringvertical profiling.
4. Javana performanceThis section quantifies the slowdown of the Javana system.
4.1 Experimental setupIn our evaluation of Javana’s performance we use the SPECjvm98benchmark suite, the SPECjbb2000 benchmark as well as the Da-
Capo benchmarks, see Table 1. The SPECjvm98 benchmark suite1
is a client-side Java benchmark suite consisting of seven bench-marks. We run all SPECjvm98 benchmarks with the largest inputset (-s100). SPECjbb20002 emulates the middle-tier of a three-tier system; the pseudojbb variant of the SPECjbb2000 bench-mark that we use in our analysis runs for a fixed amount of work,i.e., for a fixed number of transactions, in contrast to SPECjbb2000which runs for a fixed amount of time. The DaCapo benchmarksuite3 is an open-source benchmark suite designed for memorymanagement research; we use release version beta050224. All ofthe SPECjvm98 benchmarks are run on the Jikes RVM using a64MB heap and the generational mark-sweep (GenMS) garbagecollector; pseudojbb and the DaCapo benchmarks are run with a500MB heap. Our measurements are done on a 2.8GHz Intel Pen-tium 4 system with a 512KB L2 cache and 1GB main memory.The operating system on which we run our experiments is GentooLinux with a 2.6.10 kernel.
4.2 Javana overhead analysisRunning a Java application within Javana obviously introducesoverhead. There are a number of contributors to the overall over-head:
• First, the dynamic binary instrumentation tool that runs under-neath the virtual machine causes overhead.
• Second, the event handling mechanism that communicateshigh-level language concepts from the virtual machine to thedynamic binary instrumentation tool also causes overhead. Inaddition, the event handler needs to process this information forupdating the vertical map in the dynamic binary instrumenta-tion tool.
• Third, executing instrumented code requires that the binary in-strumentation tool searches the vertical map for every memorylocation accessed.
• And finally, executing the instrumentation code itself as imple-mented by the end user of the Javana system also causes addi-tional overhead.
We will now quantify the overhead caused by each of these fouroverhead contributors.
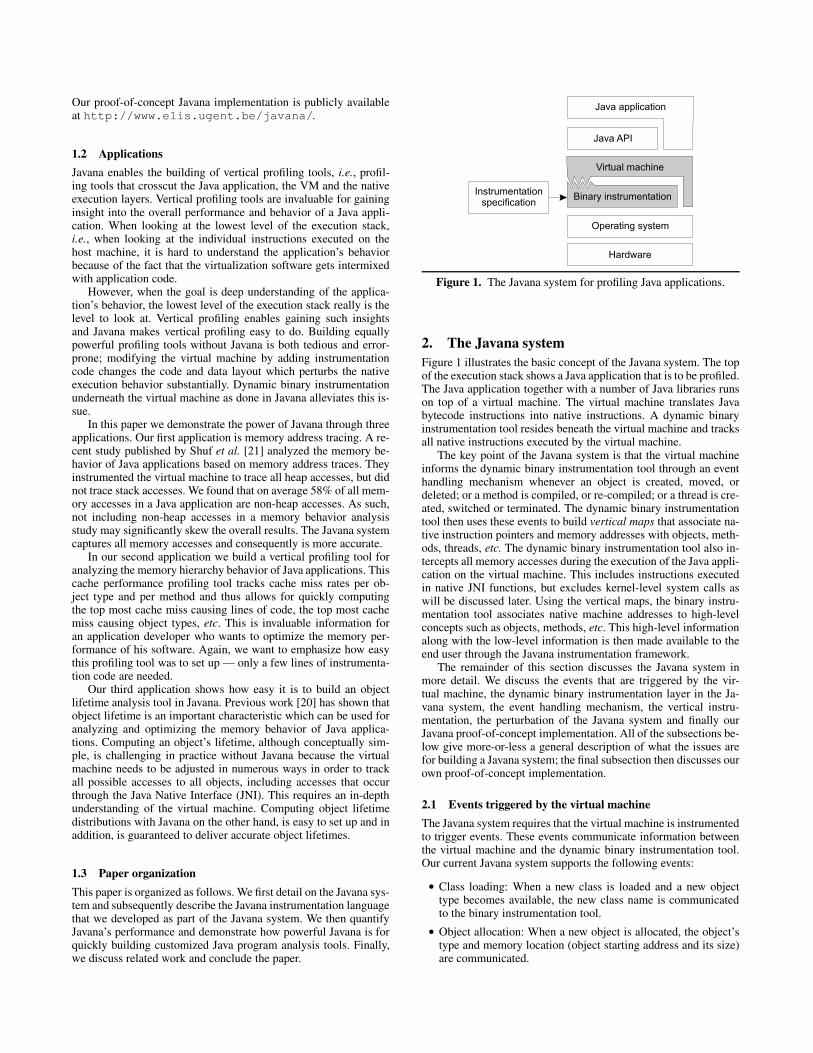
4.2.1 Dynamic binary instrumentation overheadWe first quantify the overhead of the binary instrumentation (bulletone from above). There are two contributors to this overhead. First,whenever a control transfer occurs to a computed address, thisaddress must be looked up in the binary instrumentation engine inorder to transfer control to the corresponding instrumented code.The overhead that we observe for DIOTA in our Javana systemranges from 1.5X to 5.5X, see Figure 4.
The second contributor is due to calling an instrumentation rou-tine for all natively executed memory operations. We quantify thisoverhead by calling a dummy (empty) function for each memoryoperation. The overhead varies between a factor 12X and 53X de-pending on the benchmark, see Figure 4. This overhead is inherentto dynamic binary instrumentation. Other dynamic binary instru-mentation tools such as PIN [15] and Valgrind [18] show similaroverheads.
4.2.2 Vertical instrumentation overheadWe now quantify the overhead caused by the event handling mech-anism and by searching the vertical map for every memory location
1 http://www.spec.org/jvm98/2 http://www.spec.org/jbb2000/3 http://www-ali.cs.umass.edu/DaCapo/gcbm.html
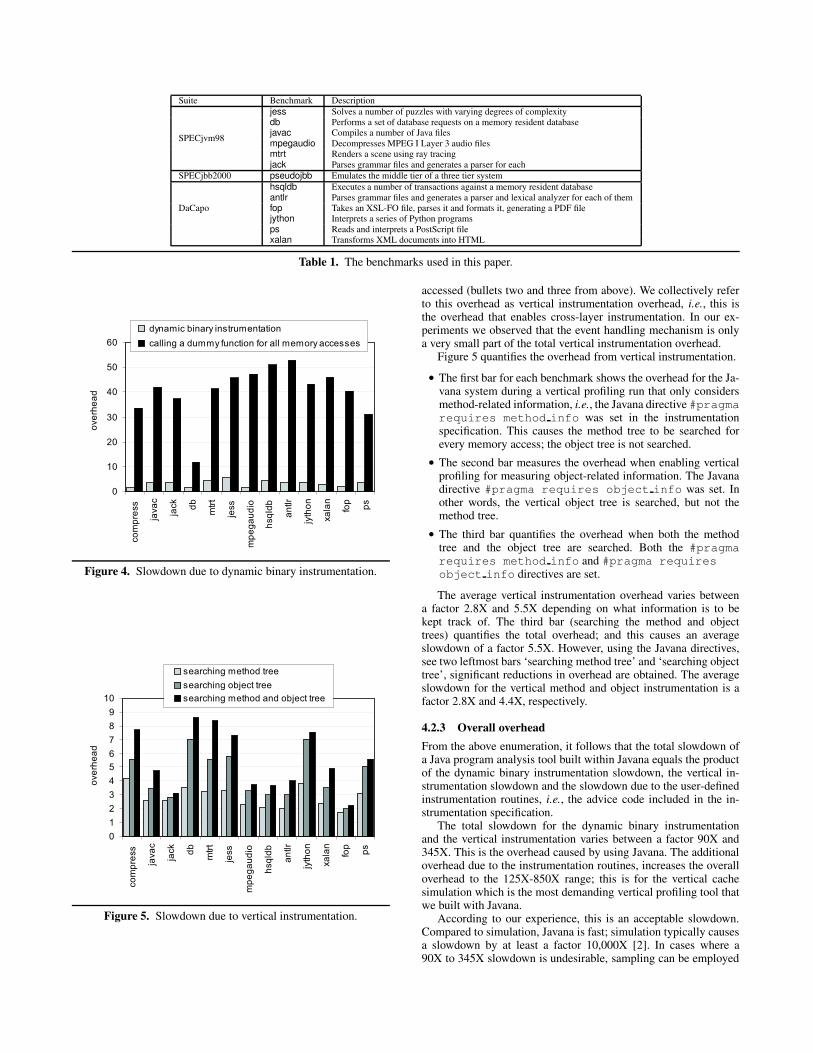
Suite Benchmark Description
SPECjvm98
jess Solves a number of puzzles with varying degrees of complexitydb Performs a set of database requests on a memory resident databasejavac Compiles a number of Java filesmpegaudio Decompresses MPEG I Layer 3 audio filesmtrt Renders a scene using ray tracingjack Parses grammar files and generates a parser for each
SPECjbb2000 pseudojbb Emulates the middle tier of a three tier system
DaCapo
hsqldb Executes a number of transactions against a memory resident databaseantlr Parses grammar files and generates a parser and lexical analyzer for each of themfop Takes an XSL-FO file, parses it and formats it, generating a PDF filejython Interprets a series of Python programsps Reads and interprets a PostScript filexalan Transforms XML documents into HTML
Table 1. The benchmarks used in this paper.
0
10
20
30
40
50
60
co
mp
ress
java
c
jack
db
mtr
t
jess
mp
eg
au
dio
hsq
ldb
an
tlr
jyth
on
xa
lan
fop
ps
ove
rhe
ad
dynam ic binary ins trumentation
calling a dummy function for all memory accesses
Figure 4. Slowdown due to dynamic binary instrumentation.
0
1
2
3
4
5
6
7
8
9
10
co
mp
ress
java
c
jack
db
mtr
t
jess
mp
eg
au
dio
hsq
ldb
an
tlr
jyth
on
xa
lan
fop
ps
ove
rhe
ad
searching method tree
searching object tree
searching method and object tree
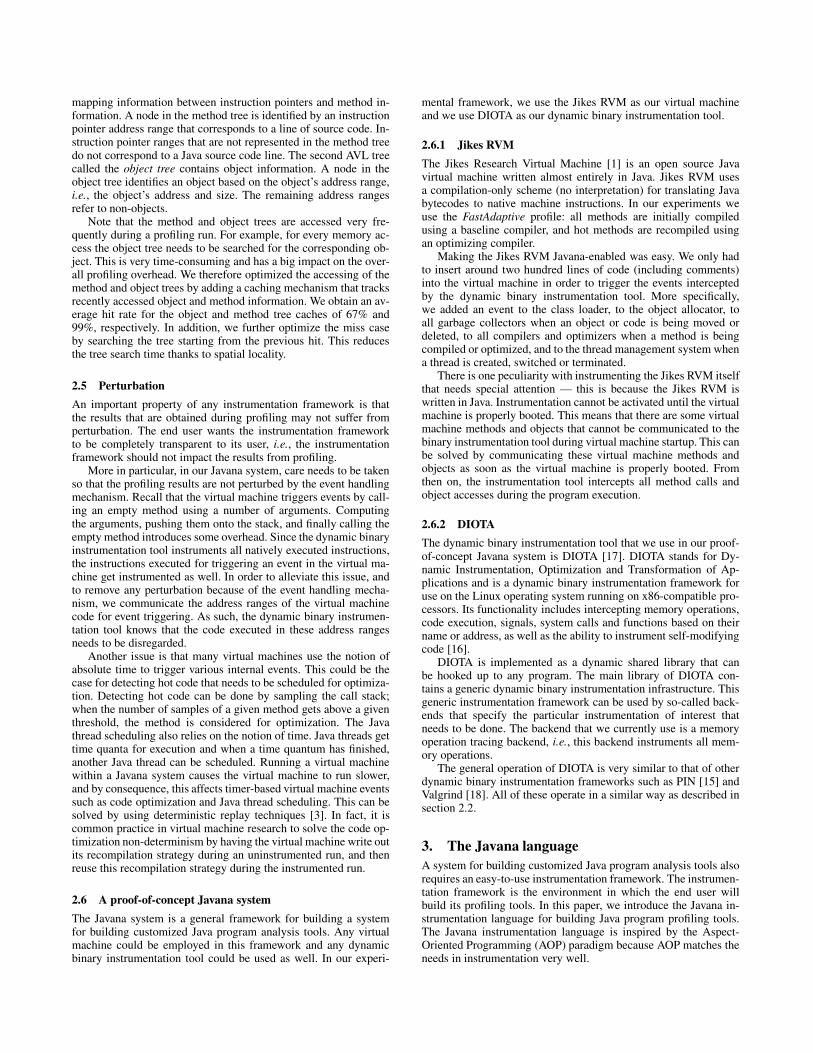
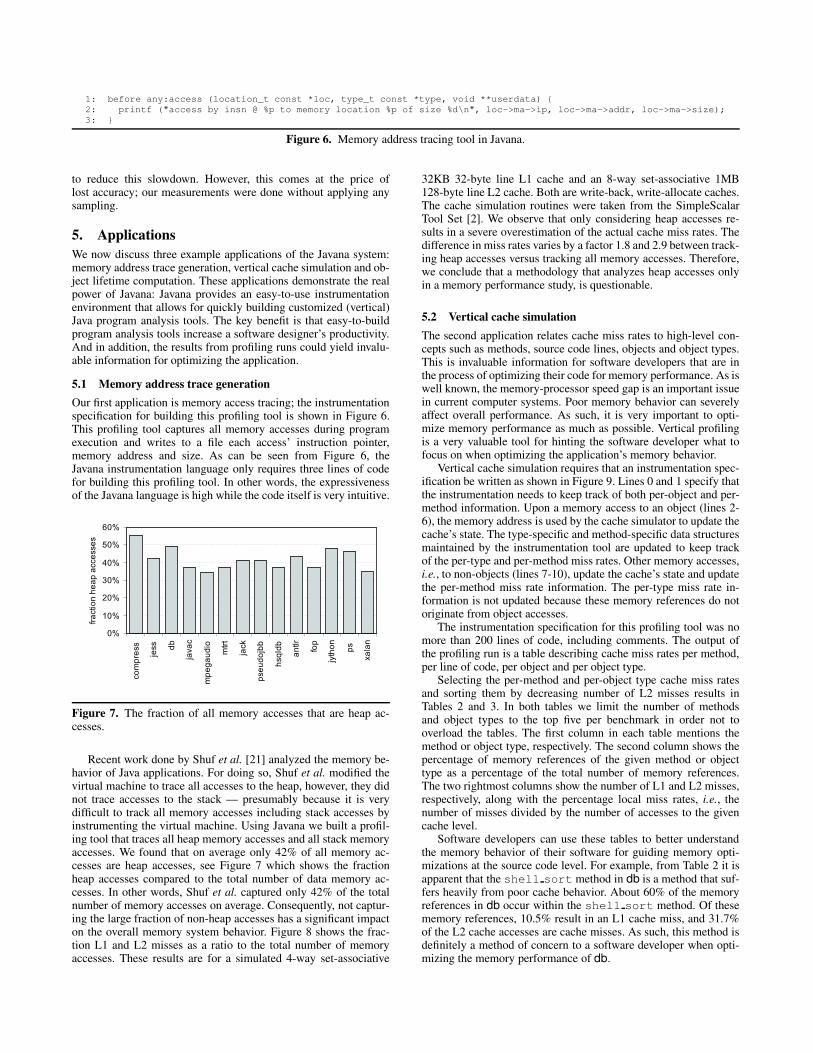
Figure 5. Slowdown due to vertical instrumentation.
accessed (bullets two and three from above). We collectively referto this overhead as vertical instrumentation overhead, i.e., this isthe overhead that enables cross-layer instrumentation. In our ex-periments we observed that the event handling mechanism is onlya very small part of the total vertical instrumentation overhead.
Figure 5 quantifies the overhead from vertical instrumentation.
• The first bar for each benchmark shows the overhead for the Ja-vana system during a vertical profiling run that only considersmethod-related information, i.e., the Javana directive #pragmarequires method info was set in the instrumentationspecification. This causes the method tree to be searched forevery memory access; the object tree is not searched.
• The second bar measures the overhead when enabling verticalprofiling for measuring object-related information. The Javanadirective #pragma requires object info was set. Inother words, the vertical object tree is searched, but not themethod tree.
• The third bar quantifies the overhead when both the methodtree and the object tree are searched. Both the #pragmarequires method info and #pragma requiresobject info directives are set.
The average vertical instrumentation overhead varies betweena factor 2.8X and 5.5X depending on what information is to bekept track of. The third bar (searching the method and objecttrees) quantifies the total overhead; and this causes an averageslowdown of a factor 5.5X. However, using the Javana directives,see two leftmost bars ‘searching method tree’ and ‘searching objecttree’, significant reductions in overhead are obtained. The averageslowdown for the vertical method and object instrumentation is afactor 2.8X and 4.4X, respectively.
4.2.3 Overall overheadFrom the above enumeration, it follows that the total slowdown ofa Java program analysis tool built within Javana equals the productof the dynamic binary instrumentation slowdown, the vertical in-strumentation slowdown and the slowdown due to the user-definedinstrumentation routines, i.e., the advice code included in the in-strumentation specification.
The total slowdown for the dynamic binary instrumentationand the vertical instrumentation varies between a factor 90X and345X. This is the overhead caused by using Javana. The additionaloverhead due to the instrumentation routines, increases the overalloverhead to the 125X-850X range; this is for the vertical cachesimulation which is the most demanding vertical profiling tool thatwe built with Javana.
According to our experience, this is an acceptable slowdown.Compared to simulation, Javana is fast; simulation typically causesa slowdown by at least a factor 10,000X [2]. In cases where a90X to 345X slowdown is undesirable, sampling can be employed
1: before any:access (location_t const *loc, type_t const *type, void **userdata) {2: printf ("access by insn @ %p to memory location %p of size %d\n", loc->ma->ip, loc->ma->addr, loc->ma->size);3: }
Figure 6. Memory address tracing tool in Javana.
to reduce this slowdown. However, this comes at the price oflost accuracy; our measurements were done without applying anysampling.
5. ApplicationsWe now discuss three example applications of the Javana system:memory address trace generation, vertical cache simulation and ob-ject lifetime computation. These applications demonstrate the realpower of Javana: Javana provides an easy-to-use instrumentationenvironment that allows for quickly building customized (vertical)Java program analysis tools. The key benefit is that easy-to-buildprogram analysis tools increase a software designer’s productivity.And in addition, the results from profiling runs could yield invalu-able information for optimizing the application.
5.1 Memory address trace generationOur first application is memory access tracing; the instrumentationspecification for building this profiling tool is shown in Figure 6.This profiling tool captures all memory accesses during programexecution and writes to a file each access’ instruction pointer,memory address and size. As can be seen from Figure 6, theJavana instrumentation language only requires three lines of codefor building this profiling tool. In other words, the expressivenessof the Javana language is high while the code itself is very intuitive.
0%
10%
20%
30%
40%
50%
60%
co
mp
ress
jess
db
java
c
mp
eg
au
dio
mtr
t
jack
pse
ud
ojb
b
hsq
ldb
an
tlr
fop
jyth
on
ps
xa
lan
fra
ctio
nh
ea
pa
cce
sse
s
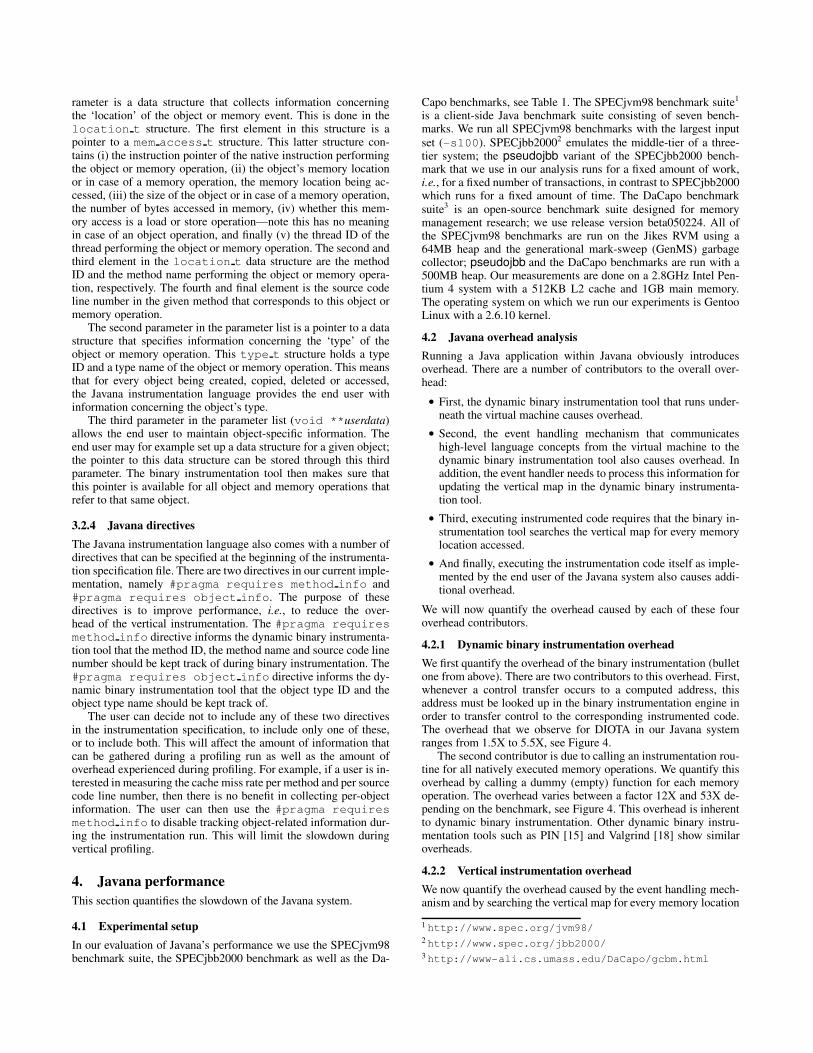
Figure 7. The fraction of all memory accesses that are heap ac-cesses.
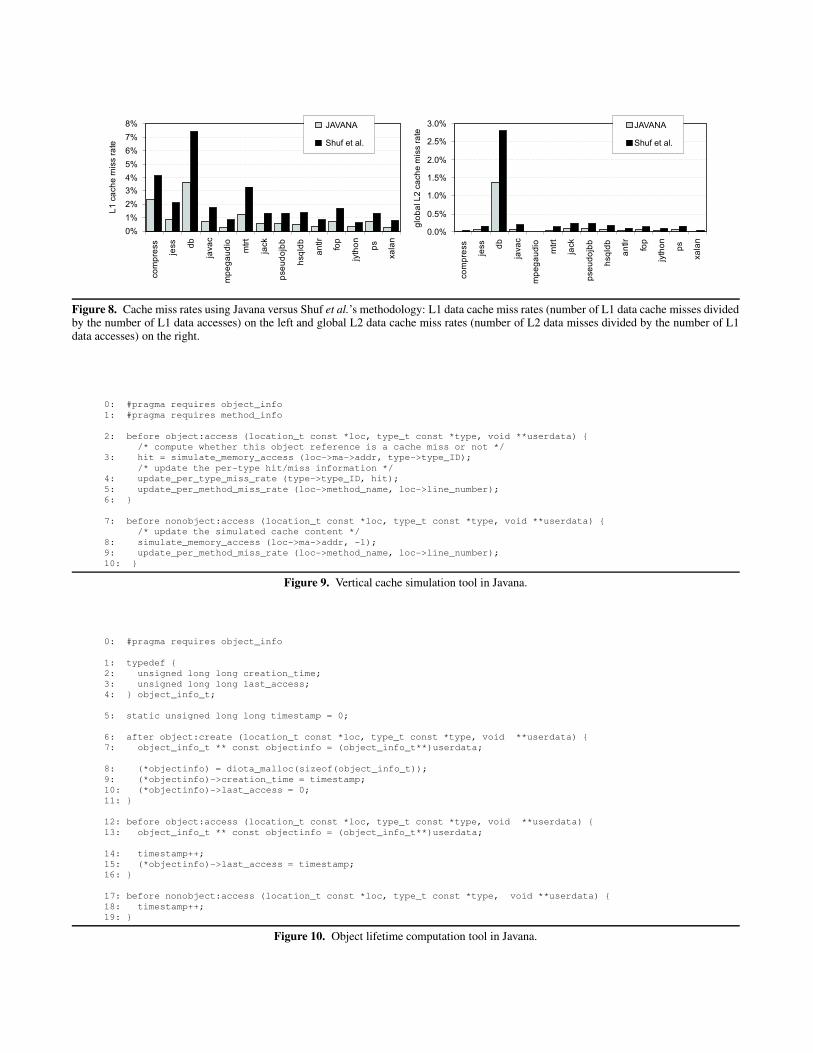
Recent work done by Shuf et al. [21] analyzed the memory be-havior of Java applications. For doing so, Shuf et al. modified thevirtual machine to trace all accesses to the heap, however, they didnot trace accesses to the stack — presumably because it is verydifficult to track all memory accesses including stack accesses byinstrumenting the virtual machine. Using Javana we built a profil-ing tool that traces all heap memory accesses and all stack memoryaccesses. We found that on average only 42% of all memory ac-cesses are heap accesses, see Figure 7 which shows the fractionheap accesses compared to the total number of data memory ac-cesses. In other words, Shuf et al. captured only 42% of the totalnumber of memory accesses on average. Consequently, not captur-ing the large fraction of non-heap accesses has a significant impacton the overall memory system behavior. Figure 8 shows the frac-tion L1 and L2 misses as a ratio to the total number of memoryaccesses. These results are for a simulated 4-way set-associative
32KB 32-byte line L1 cache and an 8-way set-associative 1MB128-byte line L2 cache. Both are write-back, write-allocate caches.The cache simulation routines were taken from the SimpleScalarTool Set [2]. We observe that only considering heap accesses re-sults in a severe overestimation of the actual cache miss rates. Thedifference in miss rates varies by a factor 1.8 and 2.9 between track-ing heap accesses versus tracking all memory accesses. Therefore,we conclude that a methodology that analyzes heap accesses onlyin a memory performance study, is questionable.
5.2 Vertical cache simulationThe second application relates cache miss rates to high-level con-cepts such as methods, source code lines, objects and object types.This is invaluable information for software developers that are inthe process of optimizing their code for memory performance. As iswell known, the memory-processor speed gap is an important issuein current computer systems. Poor memory behavior can severelyaffect overall performance. As such, it is very important to opti-mize memory performance as much as possible. Vertical profilingis a very valuable tool for hinting the software developer what tofocus on when optimizing the application’s memory behavior.
Vertical cache simulation requires that an instrumentation spec-ification be written as shown in Figure 9. Lines 0 and 1 specify thatthe instrumentation needs to keep track of both per-object and per-method information. Upon a memory access to an object (lines 2-6), the memory address is used by the cache simulator to update thecache’s state. The type-specific and method-specific data structuresmaintained by the instrumentation tool are updated to keep trackof the per-type and per-method miss rates. Other memory accesses,i.e., to non-objects (lines 7-10), update the cache’s state and updatethe per-method miss rate information. The per-type miss rate in-formation is not updated because these memory references do notoriginate from object accesses.
The instrumentation specification for this profiling tool was nomore than 200 lines of code, including comments. The output ofthe profiling run is a table describing cache miss rates per method,per line of code, per object and per object type.
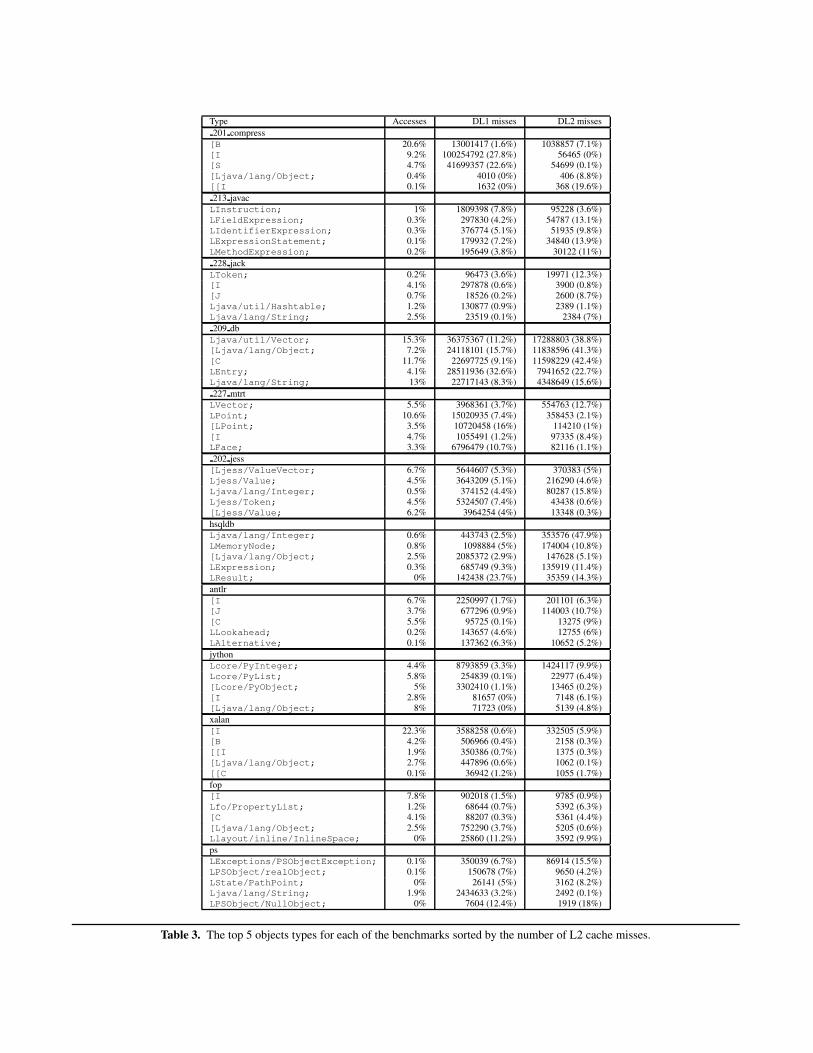
Selecting the per-method and per-object type cache miss ratesand sorting them by decreasing number of L2 misses results inTables 2 and 3. In both tables we limit the number of methodsand object types to the top five per benchmark in order not tooverload the tables. The first column in each table mentions themethod or object type, respectively. The second column shows thepercentage of memory references of the given method or objecttype as a percentage of the total number of memory references.The two rightmost columns show the number of L1 and L2 misses,respectively, along with the percentage local miss rates, i.e., thenumber of misses divided by the number of accesses to the givencache level.
Software developers can use these tables to better understandthe memory behavior of their software for guiding memory opti-mizations at the source code level. For example, from Table 2 it isapparent that the shell sort method in db is a method that suf-fers heavily from poor cache behavior. About 60% of the memoryreferences in db occur within the shell sort method. Of thesememory references, 10.5% result in an L1 cache miss, and 31.7%of the L2 cache accesses are cache misses. As such, this method isdefinitely a method of concern to a software developer when opti-mizing the memory performance of db.
0%
1%
2%
3%
4%
5%
6%
7%
8%
co
mp
ress
jess
db
java
c
mp
eg
au
dio
mtr
t
jack
pse
ud
ojb
b
hsq
ldb
an
tlr
fop
jyth
on
ps
xa
lan
L1
ca
ch
em
iss
rate
JAVANA
Shuf et al.
0.0%
0.5%
1.0%
1.5%
2.0%
2.5%
3.0%
co
mp
ress
jess
db
java
c
mp
eg
au
dio
mtr
t
jack
pse
ud
ojb
b
hsq
ldb
an
tlr
fop
jyth
on
ps
xa
lan
glo
ba
lL
2ca
ch
em
iss
rate
JAVANA
Shuf et al.
Figure 8. Cache miss rates using Javana versus Shuf et al.’s methodology: L1 data cache miss rates (number of L1 data cache misses dividedby the number of L1 data accesses) on the left and global L2 data cache miss rates (number of L2 data misses divided by the number of L1data accesses) on the right.
0: #pragma requires object_info1: #pragma requires method_info
2: before object:access (location_t const *loc, type_t const *type, void **userdata) {/* compute whether this object reference is a cache miss or not */
3: hit = simulate_memory_access (loc->ma->addr, type->type_ID);/* update the per-type hit/miss information */
4: update_per_type_miss_rate (type->type_ID, hit);5: update_per_method_miss_rate (loc->method_name, loc->line_number);6: }
7: before nonobject:access (location_t const *loc, type_t const *type, void **userdata) {/* update the simulated cache content */
8: simulate_memory_access (loc->ma->addr, -1);9: update_per_method_miss_rate (loc->method_name, loc->line_number);10: }
Figure 9. Vertical cache simulation tool in Javana.
0: #pragma requires object_info
1: typedef {2: unsigned long long creation_time;3: unsigned long long last_access;4: } object_info_t;
5: static unsigned long long timestamp = 0;
6: after object:create (location_t const *loc, type_t const *type, void **userdata) {7: object_info_t ** const objectinfo = (object_info_t**)userdata;
8: (*objectinfo) = diota_malloc(sizeof(object_info_t));9: (*objectinfo)->creation_time = timestamp;10: (*objectinfo)->last_access = 0;11: }
12: before object:access (location_t const *loc, type_t const *type, void **userdata) {13: object_info_t ** const objectinfo = (object_info_t**)userdata;
14: timestamp++;15: (*objectinfo)->last_access = timestamp;16: }
17: before nonobject:access (location_t const *loc, type_t const *type, void **userdata) {18: timestamp++;19: }
Figure 10. Object lifetime computation tool in Javana.
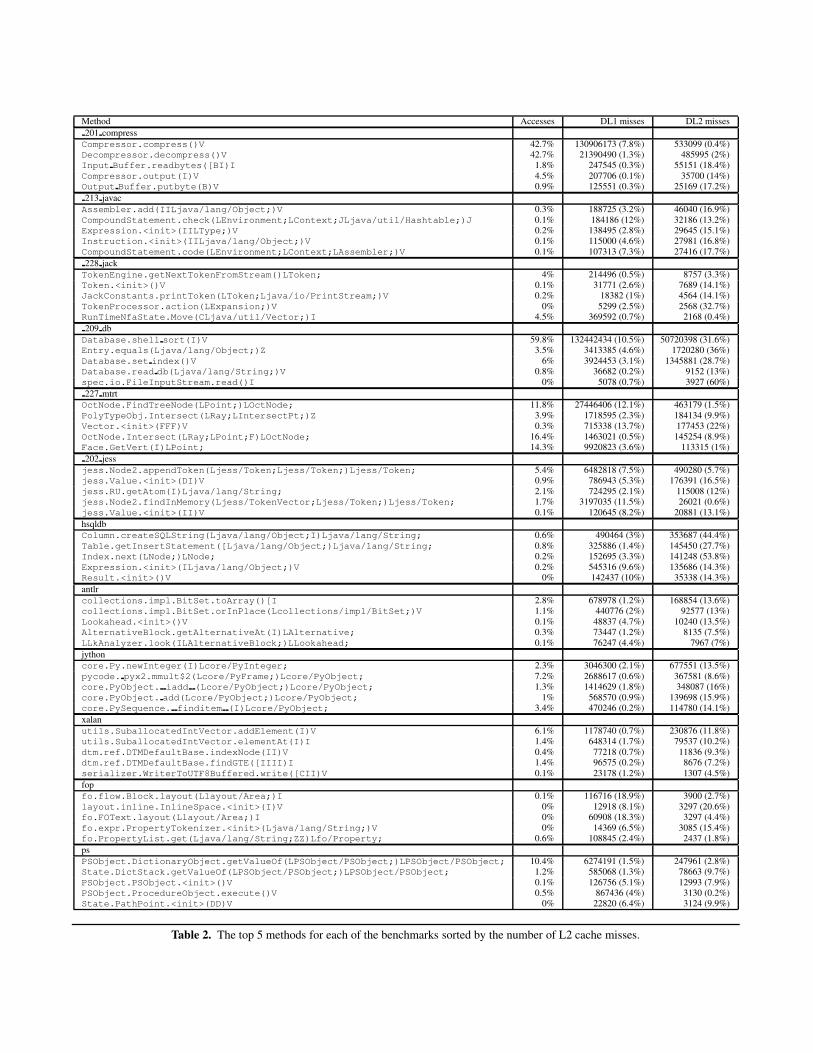
Method Accesses DL1 misses DL2 misses201 compressCompressor.compress()V 42.7% 130906173 (7.8%) 533099 (0.4%)Decompressor.decompress()V 42.7% 21390490 (1.3%) 485995 (2%)Input Buffer.readbytes([BI)I 1.8% 247545 (0.3%) 55151 (18.4%)Compressor.output(I)V 4.5% 207706 (0.1%) 35700 (14%)Output Buffer.putbyte(B)V 0.9% 125551 (0.3%) 25169 (17.2%)213 javacAssembler.add(IILjava/lang/Object;)V 0.3% 188725 (3.2%) 46040 (16.9%)CompoundStatement.check(LEnvironment;LContext;JLjava/util/Hashtable;)J 0.1% 184186 (12%) 32186 (13.2%)Expression.<init>(IILType;)V 0.2% 138495 (2.8%) 29645 (15.1%)Instruction.<init>(IILjava/lang/Object;)V 0.1% 115000 (4.6%) 27981 (16.8%)CompoundStatement.code(LEnvironment;LContext;LAssembler;)V 0.1% 107313 (7.3%) 27416 (17.7%)228 jackTokenEngine.getNextTokenFromStream()LToken; 4% 214496 (0.5%) 8757 (3.3%)Token.<init>()V 0.1% 31771 (2.6%) 7689 (14.1%)JackConstants.printToken(LToken;Ljava/io/PrintStream;)V 0.2% 18382 (1%) 4564 (14.1%)TokenProcessor.action(LExpansion;)V 0% 5299 (2.5%) 2568 (32.7%)RunTimeNfaState.Move(CLjava/util/Vector;)I 4.5% 369592 (0.7%) 2168 (0.4%)209 dbDatabase.shell sort(I)V 59.8% 132442434 (10.5%) 50720398 (31.6%)Entry.equals(Ljava/lang/Object;)Z 3.5% 3413385 (4.6%) 1720280 (36%)Database.set index()V 6% 3924453 (3.1%) 1345881 (28.7%)Database.read db(Ljava/lang/String;)V 0.8% 36682 (0.2%) 9152 (13%)spec.io.FileInputStream.read()I 0% 5078 (0.7%) 3927 (60%)227 mtrtOctNode.FindTreeNode(LPoint;)LOctNode; 11.8% 27446406 (12.1%) 463179 (1.5%)PolyTypeObj.Intersect(LRay;LIntersectPt;)Z 3.9% 1718595 (2.3%) 184134 (9.9%)Vector.<init>(FFF)V 0.3% 715338 (13.7%) 177453 (22%)OctNode.Intersect(LRay;LPoint;F)LOctNode; 16.4% 1463021 (0.5%) 145254 (8.9%)Face.GetVert(I)LPoint; 14.3% 9920823 (3.6%) 113315 (1%)202 jessjess.Node2.appendToken(Ljess/Token;Ljess/Token;)Ljess/Token; 5.4% 6482818 (7.5%) 490280 (5.7%)jess.Value.<init>(DI)V 0.9% 786943 (5.3%) 176391 (16.5%)jess.RU.getAtom(I)Ljava/lang/String; 2.1% 724295 (2.1%) 115008 (12%)jess.Node2.findInMemory(Ljess/TokenVector;Ljess/Token;)Ljess/Token; 1.7% 3197035 (11.5%) 26021 (0.6%)jess.Value.<init>(II)V 0.1% 120645 (8.2%) 20881 (13.1%)hsqldbColumn.createSQLString(Ljava/lang/Object;I)Ljava/lang/String; 0.6% 490464 (3%) 353687 (44.4%)Table.getInsertStatement([Ljava/lang/Object;)Ljava/lang/String; 0.8% 325886 (1.4%) 145450 (27.7%)Index.next(LNode;)LNode; 0.2% 152695 (3.3%) 141248 (53.8%)Expression.<init>(ILjava/lang/Object;)V 0.2% 545316 (9.6%) 135686 (14.3%)Result.<init>()V 0% 142437 (10%) 35338 (14.3%)antlrcollections.impl.BitSet.toArray()[I 2.8% 678978 (1.2%) 168854 (13.6%)collections.impl.BitSet.orInPlace(Lcollections/impl/BitSet;)V 1.1% 440776 (2%) 92577 (13%)Lookahead.<init>()V 0.1% 48837 (4.7%) 10240 (13.5%)AlternativeBlock.getAlternativeAt(I)LAlternative; 0.3% 73447 (1.2%) 8135 (7.5%)LLkAnalyzer.look(ILAlternativeBlock;)LLookahead; 0.1% 76247 (4.4%) 7967 (7%)jythoncore.Py.newInteger(I)Lcore/PyInteger; 2.3% 3046300 (2.1%) 677551 (13.5%)pycode. pyx2.mmult$2(Lcore/PyFrame;)Lcore/PyObject; 7.2% 2688617 (0.6%) 367581 (8.6%)core.PyObject. iadd (Lcore/PyObject;)Lcore/PyObject; 1.3% 1414629 (1.8%) 348087 (16%)core.PyObject. add(Lcore/PyObject;)Lcore/PyObject; 1% 568570 (0.9%) 139698 (15.9%)core.PySequence. finditem (I)Lcore/PyObject; 3.4% 470246 (0.2%) 114780 (14.1%)xalanutils.SuballocatedIntVector.addElement(I)V 6.1% 1178740 (0.7%) 230876 (11.8%)utils.SuballocatedIntVector.elementAt(I)I 1.4% 648314 (1.7%) 79537 (10.2%)dtm.ref.DTMDefaultBase.indexNode(II)V 0.4% 77218 (0.7%) 11836 (9.3%)dtm.ref.DTMDefaultBase.findGTE([IIII)I 1.4% 96575 (0.2%) 8676 (7.2%)serializer.WriterToUTF8Buffered.write([CII)V 0.1% 23178 (1.2%) 1307 (4.5%)fopfo.flow.Block.layout(Llayout/Area;)I 0.1% 116716 (18.9%) 3900 (2.7%)layout.inline.InlineSpace.<init>(I)V 0% 12918 (8.1%) 3297 (20.6%)fo.FOText.layout(Llayout/Area;)I 0% 60908 (18.3%) 3297 (4.4%)fo.expr.PropertyTokenizer.<init>(Ljava/lang/String;)V 0% 14369 (6.5%) 3085 (15.4%)fo.PropertyList.get(Ljava/lang/String;ZZ)Lfo/Property; 0.6% 108845 (2.4%) 2437 (1.8%)psPSObject.DictionaryObject.getValueOf(LPSObject/PSObject;)LPSObject/PSObject; 10.4% 6274191 (1.5%) 247961 (2.8%)State.DictStack.getValueOf(LPSObject/PSObject;)LPSObject/PSObject; 1.2% 585068 (1.3%) 78663 (9.7%)PSObject.PSObject.<init>()V 0.1% 126756 (5.1%) 12993 (7.9%)PSObject.ProcedureObject.execute()V 0.5% 867436 (4%) 3130 (0.2%)State.PathPoint.<init>(DD)V 0% 22820 (6.4%) 3124 (9.9%)
Table 2. The top 5 methods for each of the benchmarks sorted by the number of L2 cache misses.
Type Accesses DL1 misses DL2 misses201 compress[B 20.6% 13001417 (1.6%) 1038857 (7.1%)[I 9.2% 100254792 (27.8%) 56465 (0%)[S 4.7% 41699357 (22.6%) 54699 (0.1%)[Ljava/lang/Object; 0.4% 4010 (0%) 406 (8.8%)[[I 0.1% 1632 (0%) 368 (19.6%)213 javacLInstruction; 1% 1809398 (7.8%) 95228 (3.6%)LFieldExpression; 0.3% 297830 (4.2%) 54787 (13.1%)LIdentifierExpression; 0.3% 376774 (5.1%) 51935 (9.8%)LExpressionStatement; 0.1% 179932 (7.2%) 34840 (13.9%)LMethodExpression; 0.2% 195649 (3.8%) 30122 (11%)228 jackLToken; 0.2% 96473 (3.6%) 19971 (12.3%)[I 4.1% 297878 (0.6%) 3900 (0.8%)[J 0.7% 18526 (0.2%) 2600 (8.7%)Ljava/util/Hashtable; 1.2% 130877 (0.9%) 2389 (1.1%)Ljava/lang/String; 2.5% 23519 (0.1%) 2384 (7%)209 dbLjava/util/Vector; 15.3% 36375367 (11.2%) 17288803 (38.8%)[Ljava/lang/Object; 7.2% 24118101 (15.7%) 11838596 (41.3%)[C 11.7% 22697725 (9.1%) 11598229 (42.4%)LEntry; 4.1% 28511936 (32.6%) 7941652 (22.7%)Ljava/lang/String; 13% 22717143 (8.3%) 4348649 (15.6%)227 mtrtLVector; 5.5% 3968361 (3.7%) 554763 (12.7%)LPoint; 10.6% 15020935 (7.4%) 358453 (2.1%)[LPoint; 3.5% 10720458 (16%) 114210 (1%)[I 4.7% 1055491 (1.2%) 97335 (8.4%)LFace; 3.3% 6796479 (10.7%) 82116 (1.1%)202 jess[Ljess/ValueVector; 6.7% 5644607 (5.3%) 370383 (5%)Ljess/Value; 4.5% 3643209 (5.1%) 216290 (4.6%)Ljava/lang/Integer; 0.5% 374152 (4.4%) 80287 (15.8%)Ljess/Token; 4.5% 5324507 (7.4%) 43438 (0.6%)[Ljess/Value; 6.2% 3964254 (4%) 13348 (0.3%)hsqldbLjava/lang/Integer; 0.6% 443743 (2.5%) 353576 (47.9%)LMemoryNode; 0.8% 1098884 (5%) 174004 (10.8%)[Ljava/lang/Object; 2.5% 2085372 (2.9%) 147628 (5.1%)LExpression; 0.3% 685749 (9.3%) 135919 (11.4%)LResult; 0% 142438 (23.7%) 35359 (14.3%)antlr[I 6.7% 2250997 (1.7%) 201101 (6.3%)[J 3.7% 677296 (0.9%) 114003 (10.7%)[C 5.5% 95725 (0.1%) 13275 (9%)LLookahead; 0.2% 143657 (4.6%) 12755 (6%)LAlternative; 0.1% 137362 (6.3%) 10652 (5.2%)jythonLcore/PyInteger; 4.4% 8793859 (3.3%) 1424117 (9.9%)Lcore/PyList; 5.8% 254839 (0.1%) 22977 (6.4%)[Lcore/PyObject; 5% 3302410 (1.1%) 13465 (0.2%)[I 2.8% 81657 (0%) 7148 (6.1%)[Ljava/lang/Object; 8% 71723 (0%) 5139 (4.8%)xalan[I 22.3% 3588258 (0.6%) 332505 (5.9%)[B 4.2% 506966 (0.4%) 2158 (0.3%)[[I 1.9% 350386 (0.7%) 1375 (0.3%)[Ljava/lang/Object; 2.7% 447896 (0.6%) 1062 (0.1%)[[C 0.1% 36942 (1.2%) 1055 (1.7%)fop[I 7.8% 902018 (1.5%) 9785 (0.9%)Lfo/PropertyList; 1.2% 68644 (0.7%) 5392 (6.3%)[C 4.1% 88207 (0.3%) 5361 (4.4%)[Ljava/lang/Object; 2.5% 752290 (3.7%) 5205 (0.6%)Llayout/inline/InlineSpace; 0% 25860 (11.2%) 3592 (9.9%)psLExceptions/PSObjectException; 0.1% 350039 (6.7%) 86914 (15.5%)LPSObject/realObject; 0.1% 150678 (7%) 9650 (4.2%)LState/PathPoint; 0% 26141 (5%) 3162 (8.2%)Ljava/lang/String; 1.9% 2434633 (3.2%) 2492 (0.1%)LPSObject/NullObject; 0% 7604 (12.4%) 1919 (18%)
Table 3. The top 5 objects types for each of the benchmarks sorted by the number of L2 cache misses.
Source code DL1 accesses DL1 misses DL2 accesses DL2 misses1 void shell sort(int fn) {2 int i, j, n, gap;3 String s1, s2;4 Entry e;56 if (index == null) set index(); 67 0 (0%) 0 0 (0%)7 n = index.length; 134 1 (0%) 1 0 (0%)89 for (gap = n/2; gap > 0; gap/=2) 938 0 (0%) 0 (0%)
10 for (i = gap; i < n; i++) 12276499 910 (0%) 1083 3 (0%)11 for (j = i-gap; j >=0; j-=gap) { 23064743 8179 (0%) 9615 33 (0%)12 s1 = (String)index[j].items.elementAt(fn); 157553557 29772665 (19%) 36551726 6095594 (17%)13 s2 = (String)index[j+gap].items.elementAt(fn); 157553557 24036992 (15%) 29456752 15581062 (53%)1415 if (s1.compareTo(s2) <= 0) break; 45015302 128 (0%) 153 1 (0%)1617 e = index[j]; 32322537 219 (0%) 228 0 (0%)18 index[j] = index[j+gap]; 75419253 2654 (0%) 3228 811 (25%)19 index[j+gap] = e; 43096716 0 (0%) 0 0 (0%)20 }21 fnum = fn; 67 61 (91%) 73 61 (84%)22 }
Table 4. The shell sort method from db annotated with cache miss information. The number of L1 and L2 misses differ from thenumbers given Table 2; the reason is that the numbers in this table were obtained using the baseline compiler whereas the numbers in Table 2were obtained using the adaptive compiler; the line numbers returned by the adaptive compiler in Jikes are inaccurate.
Table 3 shows per-object type miss rates for the various bench-marks. The poor cache behavior for db seems to be apparent acrossa number of object types. For example, this table shows that thecache behavior for the Vector class is relatively poor with an L1cache miss rate of 11.4% and an L2 miss rate of 38.6%. Note thatour framework also allows for going even one step further, namelyto tracking down miss rates to individual objects. This would allowthe software developer to isolate the source of the poor memory be-havior. We do not include an example of per-object miss rates herein this paper, however, this could be easily done in Javana.
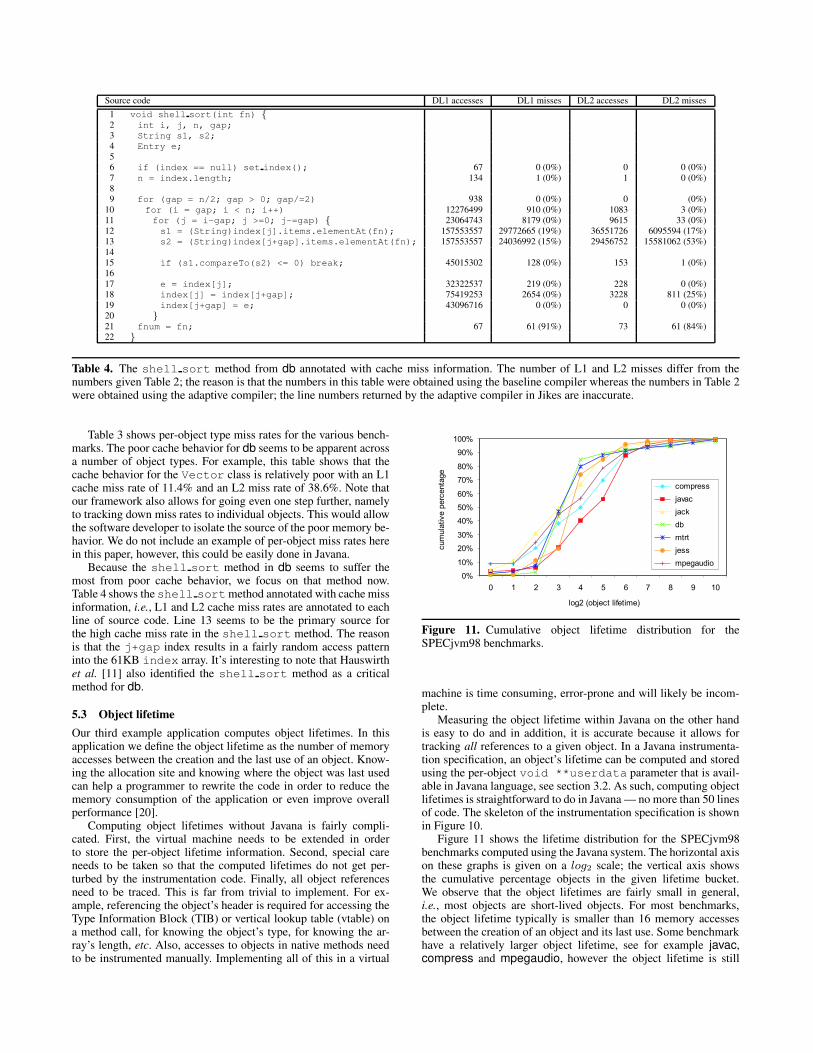
Because the shell sort method in db seems to suffer themost from poor cache behavior, we focus on that method now.Table 4 shows the shell sortmethod annotated with cache missinformation, i.e., L1 and L2 cache miss rates are annotated to eachline of source code. Line 13 seems to be the primary source forthe high cache miss rate in the shell sort method. The reasonis that the j+gap index results in a fairly random access patterninto the 61KB index array. It’s interesting to note that Hauswirthet al. [11] also identified the shell sort method as a criticalmethod for db.
5.3 Object lifetimeOur third example application computes object lifetimes. In thisapplication we define the object lifetime as the number of memoryaccesses between the creation and the last use of an object. Know-ing the allocation site and knowing where the object was last usedcan help a programmer to rewrite the code in order to reduce thememory consumption of the application or even improve overallperformance [20].
Computing object lifetimes without Javana is fairly compli-cated. First, the virtual machine needs to be extended in orderto store the per-object lifetime information. Second, special careneeds to be taken so that the computed lifetimes do not get per-turbed by the instrumentation code. Finally, all object referencesneed to be traced. This is far from trivial to implement. For ex-ample, referencing the object’s header is required for accessing theType Information Block (TIB) or vertical lookup table (vtable) ona method call, for knowing the object’s type, for knowing the ar-ray’s length, etc. Also, accesses to objects in native methods needto be instrumented manually. Implementing all of this in a virtual
0%
10%
20%
30%
40%
50%
60%
70%
80%
90%
100%
0 1 2 3 4 5 6 7 8 9 10
log2 (object lifetime)
cum
ula
tive
perc
enta
ge
compress
javac
jack
db
mtrt
jess
mpegaudio
Figure 11. Cumulative object lifetime distribution for theSPECjvm98 benchmarks.
machine is time consuming, error-prone and will likely be incom-plete.
Measuring the object lifetime within Javana on the other handis easy to do and in addition, it is accurate because it allows fortracking all references to a given object. In a Javana instrumenta-tion specification, an object’s lifetime can be computed and storedusing the per-object void **userdata parameter that is avail-able in Javana language, see section 3.2. As such, computing objectlifetimes is straightforward to do in Javana — no more than 50 linesof code. The skeleton of the instrumentation specification is shownin Figure 10.
Figure 11 shows the lifetime distribution for the SPECjvm98benchmarks computed using the Javana system. The horizontal axison these graphs is given on a log2 scale; the vertical axis showsthe cumulative percentage objects in the given lifetime bucket.We observe that the object lifetimes are fairly small in general,i.e., most objects are short-lived objects. For most benchmarks,the object lifetime typically is smaller than 16 memory accessesbetween the creation of an object and its last use. Some benchmarkhave a relatively larger object lifetime, see for example javac,compress and mpegaudio, however the object lifetime is still

0%
2%
4%
6%
8%
10%
12%
14%
16%
18%
20%com
pre
ss
javac
jack
db
mtr
t
jess
mpegaudio
hsqld
b
antlr
jyth
on
xala
n
fop
ps
perc
enta
ge
obje
cts
incorrect lifetime
Figure 12. Evaluating the accuracy of object lifetime computa-tions without Javana: the percentage objects for which a non-Javanainstrumentation results in incorrect lifetime computations.
very small in absolute terms, i.e., the object lifetime is rarely morethan 64 memory accesses.
In order to evaluate the accuracy of object lifetime computa-tions without Javana, we have set up the following experiment. Wecompute the object lifetimes under two scenarios. The first scenariocomputes the object lifetime when taking into account all memoryaccesses as done using out-of-the-box Javana. The second scenariocomputes the object lifetime while excluding all object accessesfrom non-Java code; this excludes all the object accesses from na-tive JNI functions. This second scenario emulates current practiceof building an object lifetime measurement tool within the virtualmachine, without Javana. The results are shown in Figure 12. Thegraph shows the percentage of objects for which an incorrect life-time is computed in current practice, i.e., when not including ac-cesses to objects through JNI functions. We observe large errorpercentages for a couple of benchmarks, namely fop (4%), antlr(6.5%) and ps (19%). As such, we conclude that current practiceof computing object lifetime without Javana can yield incorrect re-sults, and this could be misleading when optimizing the code basedon these measurements.
6. Related workWe now discuss related work. We first discuss binary instrumenta-tion tools followed by bytecode-level instrumentation approaches.Finally, we detail on existing vertical profiling approaches usinghardware performance counters.
6.1 Binary instrumentation toolsA large body of work exists on instrumentation. A number of staticinstrumentation tools have been proposed such as ATOM [23],EEL [14] and FIT [4]. Static instrumentation tools take a binary andstore an instrumented version of the binary on disk. Executing theinstrumented binary then generates the desired profile information.Static instrumentation cannot be used for analyzing Java applica-tions because it cannot deal with dynamically generated code.
Dynamic instrumentation on the other hand does not have thatlimitation. Well known examples of dynamic binary instrumenta-tion frameworks are Valgrind [18], PIN [15] and DIOTA [16, 17].
One specific tool within Valgrind’s tool set is Cachegrind whichis a cache profiler that provides limited vertical profiling capabili-
ties. However, Cachegrind is unable to vertically profile Java appli-cations, nor is it capable of mapping cache miss rates to objects orobject types.
6.2 Bytecode-level profilingA number of Java bytecode-level profiling tools have been pre-sented in the recent literature. These bytecode-level profiling toolsdiffer from the Javana system in that Javana allows for building ver-tical profiling tools, whereas bytecode-level profiling tools instru-ment the intermediate bytecode level. We discuss two bytecode-level profiling tools now.
Dufour et al. [7] studied the dynamic behavior of Java applica-tions in an architecture-independent way. To do so, they built a toolcalled *J [8] that uses the Java Virtual Machine Profiling Interface(JVMPI) to collect a wide set of bytecode-level Java program char-acteristics. The Java metrics that they collect are related to programsize and structure, the occurrence of various data structures (such asarrays, pointers, etc.), polymorphism, memory usage, concurrencyand synchronization.
Dmitriev [5] presents a Java bytecode-level profiling tool calledJFluid. JFluid can be attached to a running Java application. The at-tached JFluid then injects instrumentation bytecodes into the meth-ods of the running Java program. The instrumentation bytecodescollect profiling information online. When desired, JFluid can bedetached from the running application.
6.3 Vertically profiling Java applicationsSome very recent work focused on vertical profiling of Java appli-cations. The purpose of these approaches is to link microprocessorperformance to the Java application and the virtual machine. How-ever, they do not allow for building customized vertical profilingtools.
Hauswirth et al. [11] and the earlier work by Sweeney et al. [25]presented a vertical profiling approach that correlates hardware per-formance counter values to manually inserted software monitors inorder to keep track of the program’s execution across all layers. Thelow-level and high-level information is collected at a fairly coarsegranularity, i.e., hardware performance counter values and softwaremonitor values are measured at every thread switch. Hauswirth etal. measure various hardware performance metrics during multi-ple runs yielding multiple traces. And because of non-determinismduring the execution, these traces subsequently need to be aligned.Although being much faster than Javana, there are two importantlimitations with this approach. First, aligning traces is challengingand caution is required in order not to get out of sync [10]. Second,the granularity is very coarse-grained — one performance numberper thread switch. This allows for analyzing coarse-grained perfor-mance variations but does not allow for analyzing the fine-grainedperformance issues we target.
Georges et al. [9] also provided a limited form of vertical pro-filing by linking microprocessor-level metrics obtained from hard-ware performance counters to method-level phases in Java. This al-lows for analyzing Java applications at a finer granularity than thevertical profiling approach by Hauswirth et al. [10, 11], however,the granularity is still much more coarse-grained than the granular-ity that we can achieve using Javana.
The commercially available tool VTune [6] from Intel alsoallows for profiling Java applications. The VTune tool sampleshardware performance counters to profile an application and toannotate source code with cache miss rate information. However,given the fact that VTune relies on sampling it is questionablewhether this allows for fine-grained profiling information with littleoverhead and perturbation of the results.
All of these vertical profiling approaches rely on a micropro-cessor’s performance counters. This limits the scope of these tech-

niques to evaluating Java system performance on existing micro-processors. These approaches do not allow for building customizedvertical Java program analysis tools as the Javana system does.
7. SummaryUnderstanding the behavior of Java application is non-trivial be-cause of the tight entanglement of the application and the virtualmachine at the lowest machine-code level. This paper proposed Ja-vana, a system for quickly building Java program analysis tools. Ja-vana is publicly available at http://www.elis.ugent.be/javana/. Javana runs a dynamic binary instrumentation tool un-derneath a virtual machine. The virtual machine communicateswith the dynamic binary instrumentation tool using an event han-dling mechanism. This event handling mechanism enables the dy-namic binary instrumentation layer to build a so called verticalmap. A vertical map keeps track of correspondences between high-level language concepts such as objects, methods, threads, etc., andlow-level native instruction pointers and memory addresses. Thisvertical map provides the Javana end user with high-level informa-tion concerning every memory access the dynamic binary instru-mentation tool intercepts. As a result, Javana is capable of trackingall memory references and all natively executed instructions and toprovide high-level information for each of those.
Javana also comes with an easy-to-use Javana instrumentationlanguage. The Javana language provides the Javana user with low-level and high-level information that enables the Javana user toquickly build powerful Java program analysis tools that crosscutthe Java application, the VM and the native execution layer.
The first key property of Javana is that Java program analysistools can be built very quickly. To demonstrate the real power ofJavana we presented three example applications: memory addresstracing, vertical cache simulation and object lifetime computation.For each of these applications, the core instrumentation specifica-tion was only a few lines of code.
The second key property of Javana is that the profiling resultsare guaranteed to be highly accurate (by construction) because thedynamic binary instrumentation layer tracks every single nativelyexecuted instruction. Current practice is typically one of manuallyinstrumenting the virtual machine which is both time-consumingand error-prone. In addition, the accuracy of the profiling resultsmight be questionable because it is hard to instrument a virtualmachine in such a way that all memory accesses are tracked, aswe have shown through our example applications.
8. AcknowledgmentsThe authors would like to thank the anonymous reviewers for theirvaluable comments, as well as Hans Vandierendonck for integrat-ing the SimpleScalar cache simulator into our Javana instrumenta-tion specification. Jonas Maebe and Dries Buytaert are supportedby a grant from the Institute for the Promotion of Innovation byScience and Technology in Flanders (IWT). Lieven Eeckhout is aPostdoctoral Fellow of the Fund for Scientific Research—Flanders(Belgium) (FWO—Vlaanderen). This research is also supported inpart by Ghent University, the HiPEAC Network of Excellence andthe European SARC project No. 27648.
References[1] B. Alpern, C. R. Attanasio, J. J. Barton, M. G. Burke, P. Cheng, J.-D.
Choi, A. Cocchi, S. J. Fink, D. Grove, M. Hind, S. F. Hummel,D. Lieber, V. Litvinov, M. F. Mergen, T. Ngo, J. R. Russell,V. Sarkar, M. J. Serrano, J. C. Shepherd, S. E. Smith, V. C. Sreedhar,H. Srinivasan, and J. Whaley. The Jalapeno Virtual Machine. IBMSystems Journal, 39(1):211–238, 2000.
[2] D. C. Burger and T. M. Austin. The SimpleScalar Tool Set. ComputerArchitecture News, 1997. See also http://www.simplescalar
.com for more information.[3] J.-D. Choi, B. Alpern, T. Ngo, M. Sridharan, and J. Vlissides. A
perturbation-free replay platform for cross-optimized multithreadedapplications. In Proceedings of the 15th International Parallel andDistributed Processing Symposium (IPDPS), Apr. 2001.
[4] B. De Bus, D. Chanet, B. De Sutter, L. Van Put, and K. De Bosschere.The design and implementation of FIT: A flexible instrumentationtoolkit. In Proceedings of the ACM-SIGPLAN-SIGSOFT Workshopon Program Analysis for Software Tools and Engineering (PASTE),pages 29–34, June 2004.
[5] M. Dmitriev. Selective profiling of Java applications using dynamicbytecode instrumentation. In Proceedings of the 2004 IEEEInternational Symposium on Performance Analysis of Systems andSoftware (ISPASS), pages 141–150, Mar. 2004.
[6] J. Donnell. Java Performance Profiling using the VTune PerformanceAnalyzer. Intel, 2004.
[7] B. Dufour, K. Driesen, L. Hendren, and C. Verbrugge. Dynamicmetrics for Java. In Proceedings of the 18th Annual ACM SIGPLANConference on Object-Oriented Programming, Languages, Applica-tions and Systems (OOPSLA), pages 149–168, Oct. 2003.
[8] B. Dufour, L. Hendren, and C. Verbrugge. *J: A tool for dynamicanalysis of Java programs. In Companion of the 18th Annual ACMSIGPLAN Conference on Object-Oriented Programming, Languages,Applications and Systems (OOPSLA), pages 306–307, Oct. 2003.
[9] A. Georges, D. Buytaert, L. Eeckhout, and K. De Bosschere.Method-level phase behavior in Java workloads. In Proceedingsof the 19th Annual ACM SIGPLAN Conference on Object-OrientedProgramming, Systems and Languages (OOPSLA), pages 270–287,Oct. 2004.
[10] M. Hauswirth, A. Diwan, P. S. Sweeney, and M. C. Mozer.Automating vertical profiling. In Proceedings of the 20th AnnualACM SIGPLAN Conference on Object-Oriented Programming,Systems and Languages (OOPSLA), pages 281–296, Oct. 2005.
[11] M. Hauswirth, P. S. Sweeney, A. Diwan, and M. Hind. Verticalprofiling: Understanding the behavior of object-oriented applications.In Proceedings of the 19th Annual ACM SIGPLAN Conference onObject-Oriented Programming, Systems and Languages (OOPSLA),pages 251–269, Oct. 2004.
[12] G. Kiczales, E. Hilsdale, J. Hugunin, M. Kersten, J. Palm, and W. G.Griswold. An overview of AspectJ. Proceedings of the 15th EuropeanConference on Object-Oriented Programming (ECOOP), pages 327–355, June 2001.
[13] G. Kiczales, J. Lamping, A. Menhdhekar, C. Maeda, C. Lopes,J.-M. Loingtier, and J. Irwin. Aspect-oriented programming.In Proceedings of the European Conference on Object-OrientedProgramming (ECOOP), pages 220–242, 1997.
[14] J. R. Larus and E. Schnarr. EEL: Machine-independent executableediting. In Proceedings of the ACM SIGPLAN InternationalConference on Programming Language Design and Implementation(PLDI), pages 291–300, 1995.
[15] C.-K. Luk, R. Cohn, R. Muth, H. Patil, A. Klauser, G. Lowney,S. Wallace, V. J. Reddi, and K. Hazelwood. Pin: building customizedprogram analysis tools with dynamic instrumentation. In Proceedingsof the ACM SIGPLAN International Conference on ProgrammingLanguage Design and Implementation (PLDI), pages 190–200, June2005.
[16] J. Maebe and K. De Bosschere. Instrumenting self-modifying code.In Proceedings of the Fifth International Workshop on AutomatedDebugging (AADEBUG), pages 103–113, Sept. 2003.
[17] J. Maebe, M. Ronsse, and K. De Bosschere. DIOTA: Dynamicinstrumentation, optimization and transformation of applications. InProceedings of the 2002 Workshop on Binary Translation (WBT)held in conjunction with the International Conference on ParallelArchitectures and Compilation Techniques (PACT), Sept. 2002.
[18] N. Nethercote and J. Seward. Valgrind: A program supervisionframework. In Electronic Notes in Theoretical Computer Science,volume 89. Elsevier, 2003.
[19] S. Reiss and M. Renieris. Languages for dynamic instrumentation.In Proceedings of the Workshop on Dynamic Analysis (WODA), May2003.
[20] R. Shaham, E. K. Kolodner, and M. Sagiv. Heap profiling for space-efficient Java. In Proceedings of the ACM SIGPLAN InternationalConference on Programming Language Design and Implementation(PLDI), pages 104–113, 2001.
[21] Y. Shuf, M. J. Serrano, M. Gupta, and J. P. Singh. Characterizingthe memory behavior of Java workloads: a structured view andopportunities for optimizations. In Proceedings of the 2001ACM SIGMETRICS International Conference on Measurement andModeling of Computer Systems, pages 194–205, June 2001.
[22] O. Spinczyk, A. Gal, and W. Schroder-Preikschat. AspectC++: anaspect-oriented extension to the C++ programming language. InCRPITS ’02: Proceedings of the Fortieth International Conferenceon Tools Pacific, pages 53–60, 2002.
[23] A. Srivastava and A. Eustace. ATOM: A system for buildingcustomized program analysis tools. Technical Report 94/2, WesternResearch Lab, Compaq, Mar. 1994.
[24] J. Suzuki and Y. Yamamoto. Extending UML with aspects: Aspectsupport in the design phase. In Proceedings of the Workshop onObject-Oriented Technology, pages 299–300, 1999.
[25] P. Sweeney, M. Hauswirth, B. Cahoon, P. Cheng, A. Diwan, D. Grove,and M. H. d. Using hardware performance monitors to understandthe behavior of Java applications. In Proceedings of the 3rd VirtualMachine Research and Technology Symposium (VM), pages 57–72,May 2004.
[26] C. Zhang and H.-A. Jacobsen. TinyC2: Towards building a dynamicweaving aspect language for C. In Proceedings of the Foundations ofAspect-Oriented Languages Workshop at AOSD 2003, Mar. 2003.