Embed Size (px)
Citation preview

187
Java-Powered Virtual Laboratories for Earthquake Engineering Education
by Yong Gao, Guangqiang Yang, Billie F. Spencer, Jr. and George C. Lee
Research Objectives
The objective of this MCEER educational project is to develop Java-based Virtual Laboratories for Earthquake Engineering (VLEE) as a Tri-Center col-laborative effort to produce online resources for earthquake engineering education. This task is a part of MCEER’s Center-wide effort to develop educational modules, in which various Java-Powered Virtual Laboratories (VLs) have been developed to provide a means for on-line interactive ex-periments. They are intended to provide a conceptual understanding of a wide range of topics related to earthquake engineering, including structural control using the tuned mass damper (TMD) and the hybrid mass damper (HMD), linear and nonlinear base isolation system, and nonlinear structural dynamic analysis of multi-story buildings. The VLEEs are available on-line at http://cee.uiuc.edu/sst/java/ and have been incorporated as a reference implementation of educational modules in the NEESgrid software (http://www.neesgrid.org/).
SponsorsSponsorsNational Science Foundation,
Earthquake Engineeering Research Centers Program
Research TeamResearch TeamB.F. Spencer, Jr., Nathan M.
and Anne M. Newmark Endowed Chair in Civil Engineering, Guangqiang Yang, Postdoctoral Research Associate, and Yong Gao, Ph.D. Candidate, Department of Civil and Environmental Engineering, University of Illinois at Urbana-Champaign
Yoshinori Sato, former Visiting Scholar, Toshiba Corporation, Japan
George C. Lee, Special Tasks Director, Multidisciplinary Center for Earthquake Engineering Research, and Samuel P. Capen Professor of Engineering, University of Buffalo
Educators must always strive to better prepare the next generation of structural engineers so that they may better understand and ef-
fectively deal with the design of earthquake resilient structures to reduce the loss of human lives and the negative impacts to society. One of the challenges of teaching students about the fundamentals of earthquake engineering is to give them an intuitive understanding of the dynamics of structures. Demonstrating the concepts of dynamics using static chalk boards or books is diffi cult. The best approach is through hands-on labora-tories. Unfortunately, few instructors have the necessary facilities readily available to demonstrate structural dynamic concepts. To overcome this diffi culty, a series of Java-Powered Virtual Laboratories (VLs) have been developed, as part of the MCEER Education Module Development task, in the Smart Structures Technology Laboratory (SSTL) of the University of Illinois at Urbana-Champaign.
To date, a total of fi ve VLs have been published on the internet. The structural control VL allows users to compare the effect of using two dif-ferent control systems to reduce structural response of an “uncontrolled” structure subject to earthquake excitations. The linear and nonlinear base isolation VLs allow users to study the effectiveness of base isolation to

188 Education
Previous Summaries
Previous Summaries
2001-2003:Dargush et al., http://mceer.buffalo.edu/publications/resaccom/0103/12dargush.pdf
These virtual laboratories constitute one of the fi rst efforts in the U.S. to develop on-line interactive educational tools to illustrate structural dynamic concepts for earthquake engineering. Graduate students and professional engineers will fi nd these modules useful in understanding the cutting edge techniques used to design earthquake resilient structures. About 500 visitors per month from around the world access the fi ve modules currently available on the Internet.
reduce the seismic demands on a structure. The focus of our 2003-04 efforts was the extension of a two degree-of-freedom nonlinear dynamic analysis VL to accom-modate multi-story buildings with an arbitrary number of degrees-of-freedom. These VLs provide users with wide fl exibility to understand the dynamic performance of build-ing structures subject to earth-quake loading.
Technical SummaryThe virtual laboratories were
programmed using Java. The Java programming language (Newman, 1996) offers signifi cant advantages because of its minimal dependence on the operational platform. There-fore, these Java-powered VLs can be accessed universally through the Internet. Using the Java lan-guage minimizes administration maintenance for the VL once it has been developed and published on the Internet. If additional updating is required, it can be made locally and updated on the Internet. When remote users access the VL the next time, the updated version will be automatically downloaded and executed. In addition, these VLs’ interactive interface, optimized with Java programming, signifi-cantly increases the effi ciency of presenting and, in turn, of under-
standing a wide range of topics in earthquake engineering.
Computational analysis of the dynamic problems in these virtual simulations utilizes several state-of-the-art numerical algorithms. In the structural control VL, the lin-ear dynamic analysis problems are solved by the Runge-Kutta method. The algebraic Ricatti equation as-sociated with the LQR controller design was solved using the Gen-eralized Eigenproblem Algorithms given by Arnold and Laub (1984). In the base isolation and nonlinear dynamic analysis VLs, the General-ized α – method was employed to solve the hysteretic bilinear stiff-ness problem, and the Runge-Kutta method was applied to handle all other linear and nonlinear analysis (Tedesco et al., 1998; Belytschko and Hughes, 1983; Berg, 1989).
In the subsequent sections of this paper, an overview of each VL is provided, followed by ex-amples on how these VLs can be utilized to facilitate understanding of different special topics. Finally, conclusions and future research are presented.
Structural Control Virtual Laboratory
This structural control VL allows users to compare the effect of us-ing two different control systems
Java-Powered Virtual Laboratories for Earthquake Engineering Education 189
to reduce the structural response of an “uncontrolled” structure sub-jected to earthquake excitation. The two control systems, chosen because of the widespread inter-est in this class of systems (Soong, 1990; Housner et al., 1994; Fujino et al., 1996), are the tuned mass damper (TMD) and the hybrid mass damper (HMD).
This virtual laboratory allows users to vary the control system properties and control objectives and to perform “what if” studies so as to better understand the control design process to miti-gate the earthquake response. This VL can calculate and animate the structural responses under the El Centro, Hachinohe, Northridge and Kobe earthquakes, as well as
determine the transfer functions of the uncontrolled and controlled systems. Three cases are consid-ered: (i) TMD/HMD Locked: the auxiliary mass is rigidly attached to the structure; (ii) Tuned Mass Damper (TMD): the auxiliary mass is attached to the structure by a spring and damper; and (iii) Hybrid Mass Damper (HMD): in addition to spring and damper utilized in the previous case, a control actuator is installed between the auxiliary mass and the structure. In all of these cases, the structure is modeled as a single-degree-of-freedom linear system.
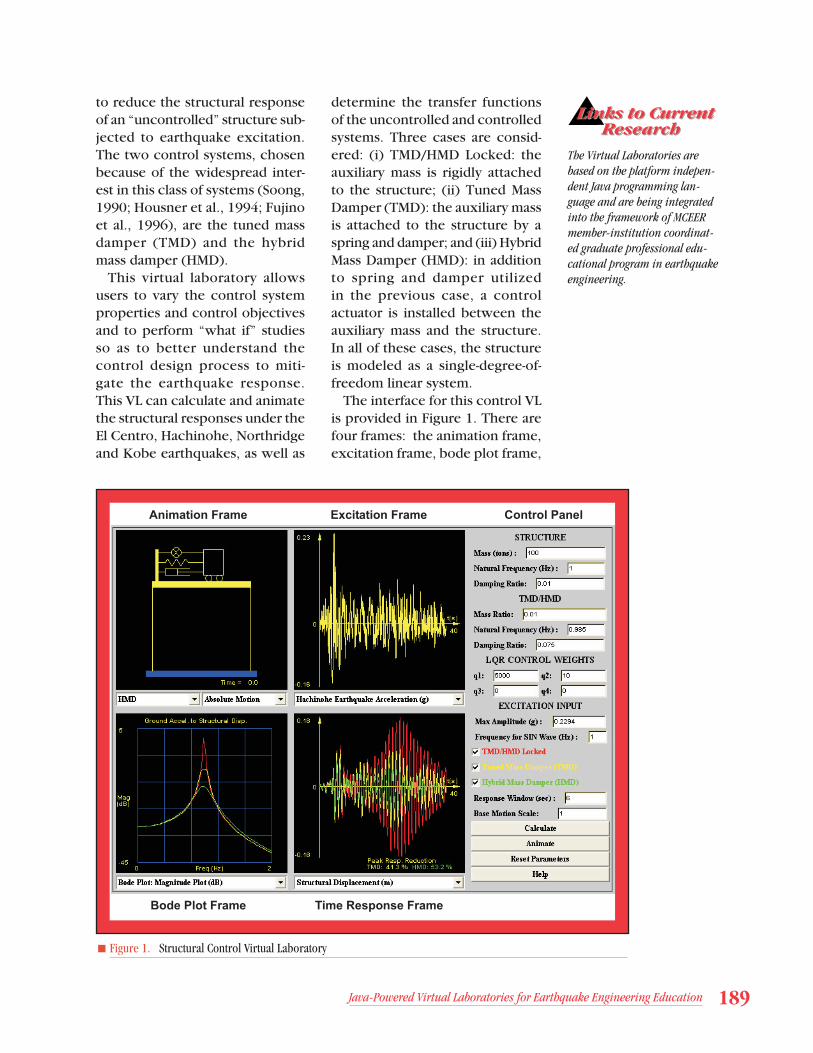
The interface for this control VL is provided in Figure 1. There are four frames: the animation frame, excitation frame, bode plot frame,
Animation Frame Excitation Frame Control Panel
Bode Plot Frame Time Response Frame
■ Figure 1. Structural Control Virtual Laboratory
Links to CurrentResearch
Links to CurrentResearch
The Virtual Laboratories are based on the platform indepen-dent Java programming lan-guage and are being integrated into the framework of MCEER member-institution coordinat-ed graduate professional edu-cational program in earthquake engi neering.
190 Education
and time response frame on the left of the user interface. On the right, the control panel is utilized to conduct structural analysis and input parameters. A description of each of these components is given below.
The control panel on the right of the interface has the following information:• Mass: total mass of the struc-
ture.• Natural Frequency: natural
frequency of the structure.• Damping Ratio: damping ratio
of the structure.• TMD/HMD Mass Ratio: ratio
between the auxiliary mass to the structure mass.
• TMD/HMD Frequency: natural frequency of the TMD/HMD system.
• TMD/HMD Damping Ratio: damping ratio of the TMD/HMD system.
• LQR Control Weights: an LQR controller for HMD system is calculated based on a qua-dratic performance index that weights the responses. The parameters q1 - q4 weight the following responses: q1 is the structure displacement, q2 is the HMD displacement, q3 is the structure velocity and q4 is the HMD velocity.
• Checkboxes: click the check-box to select/deselect the re-sponse to be displayed.
• Response Window: width of the excitation/time response frames (in seconds) used dur-ing the animation.
• Base Motion Scale: scale used for the ground motion during the animation. The ground displacements are multiplied by this value before being dis-played in the animation. This
scale factor does not affect the animation when the “Relative Motion” option is selected, nor does it affect any response cal-culation.
• Calculate: conduct calculation according to the current input parameters. When structure parameters, TMD/HMD param-eters or LQR control weights are changed, this button must be pushed to recalculate re-sponse.
• Animate: start/stop animation of the response.
• Reset Parameters: reset all the parameters to the default val-ues.
• Help: pop up the help page when this button is pushed.
On the left side of the interface, the animation frame allows the user to view the actual motion (either absolute or relative mo-tion of the structure) under cur-rent excitation. The excitation frame displays the time history of the excitation. The bode plot frame shows the transfer function between the ground acceleration and the response selected in the time response frame. The rela-tionship between the magnitude/phase of the transfer function and frequency can be displayed in this frame.
Various analytical results can be shown in the time response frame, including displacement, velocity and acceleration of the structure and TMD/HMD. The actuator force in the HMD system can be displayed as well. A peak reduction factor, which refl ects the reduced percentage of the maximum response compared to the “uncontrolled” case, is displayed for both the TMD and HMD control system in the lower

Java-Powered Virtual Laboratories for Earthquake Engineering Education 191
portion of this frame. As shown in this frame, not surprisingly, both TMD and HMD control systems can signifi cantly reduce the earth-quake response in this case with appropriate design.
Linear and Nonlinear Base Isolation Virtual Laboratories
Base isolation is another impor-tant strategy for protecting struc-tures from earthquakes. It attempts to isolate a structure from the ex-ternal ground excitations instead of dissipating the earthquake en-ergy within the structure. As a tes-tament to this strategy, buildings in the Kansai region of Japan with base isolation devices survived the devastating 1995 Kobe earthquake with little or no damage. This event has prompted great interest in base
isolation for seismic protection of civil structures.
To facilitate the understanding of a base isolation system, two virtual laboratories have been developed. A linear base isolation VL was fi rst developed as illustrated in Figure 2. A nonlinear base isolation VL, which includes the linear isolation case, was then developed for bet-ter understanding the behaviors of different isolation systems. There is another difference between the linear and nonlinear base isolation VLs: the linear base isolation VL can display transfer functions between the excitation acceleration and re-sponses while the nonlinear base isolation VL can’t. In this section, only the nonlinear base isolation VL will be carefully reviewed.
This nonlinear base isolation VL considers fi ve cases: (i) a conven-tional structure fi xed directly to
■ Figure 2. Linear Base Isolation Virtual Laboratory
192 Education
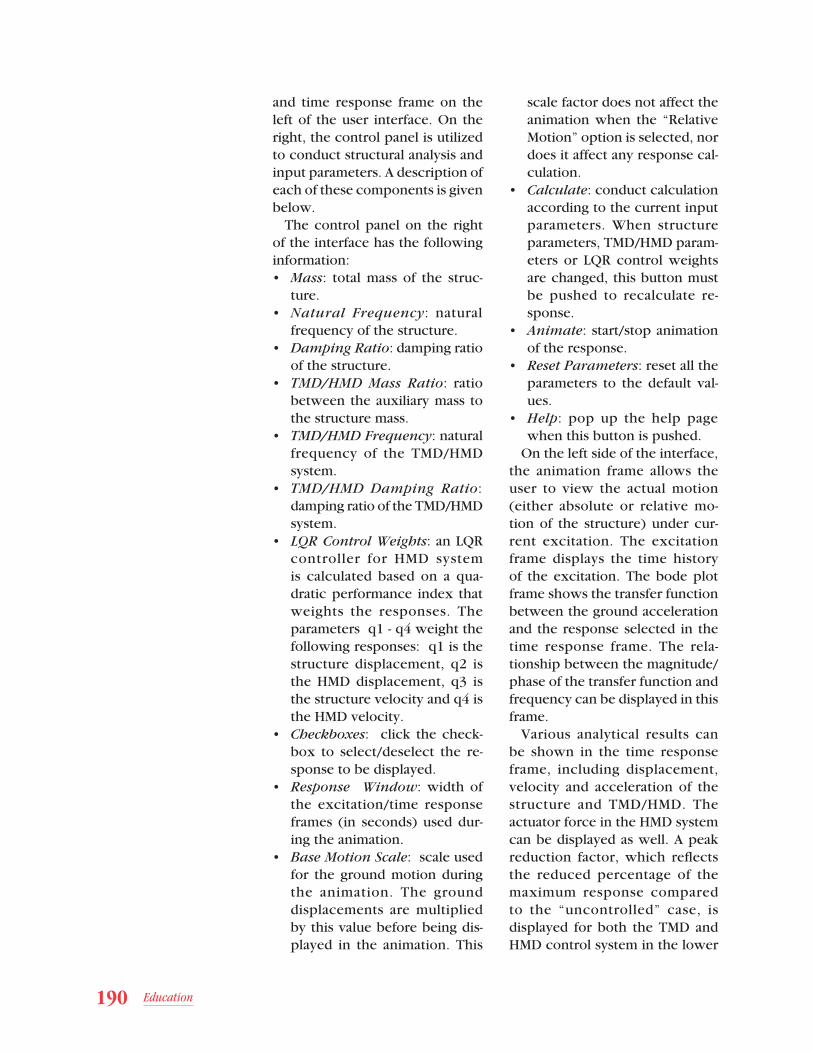
the ground; (ii) ~ (v) base isolated structures where the isolation system is installed between the structure and the ground to iso-late the earthquake energy. In all of these fi ve cases, the structure is modeled as a single-degree-of-freedom linear system. For cases (ii) ~ (v), four types of models are provided in this VL to describe the behavior of the isolator. These models (shown in Figure 3) are: (a) linear stiffness and linear viscous damping; (b) linear stiff-ness and nonlinear power-law damping; (c) hysteretic stiffness using the Bouc-Wen model and linear viscous damping; and (d) hysteretic bilinear stiffness and linear viscous damping. For types (a) and (b), buildings behave as lin-ear elastic structures. The damping force remains linear for type (a),
and follows the nonlinear power-law with respect to the velocity for type (b). The Bouc-Wen model and hysteretic bilinear model in types (c) and (d) are widely employed for modeling nonlinear behavior of isolators. By choosing various models describing the isolator, us-ers are able to analyze the structure response with different types of isolation systems.
The interface of the nonlinear base isolation VL is provided in Figure 4. Similar to the structural control VL, there are four frames on the left of the user interface, namely the animation frame, ex-citation frame, response spectra frame, and time response frame. On the right, there is a panel to control the structural analysis and input parameters. A description of each of these components is given below.
The control panel has the follow-ing information:• Mass: total mass of the struc-
ture.• Natural Frequency: natural
frequency of the structure.• Damping Ratio: damping ratio
of the structure.• Mass Ratio: ratio between the
base fl oor mass and structure mass.
• Isolation System Natural Frequency: natural frequency of the linear and nonlinear damping isolators assuming the structure is rigid. This is also the natural frequency for the hysteretic isolators when the displacement exceeds the yielding displacement.
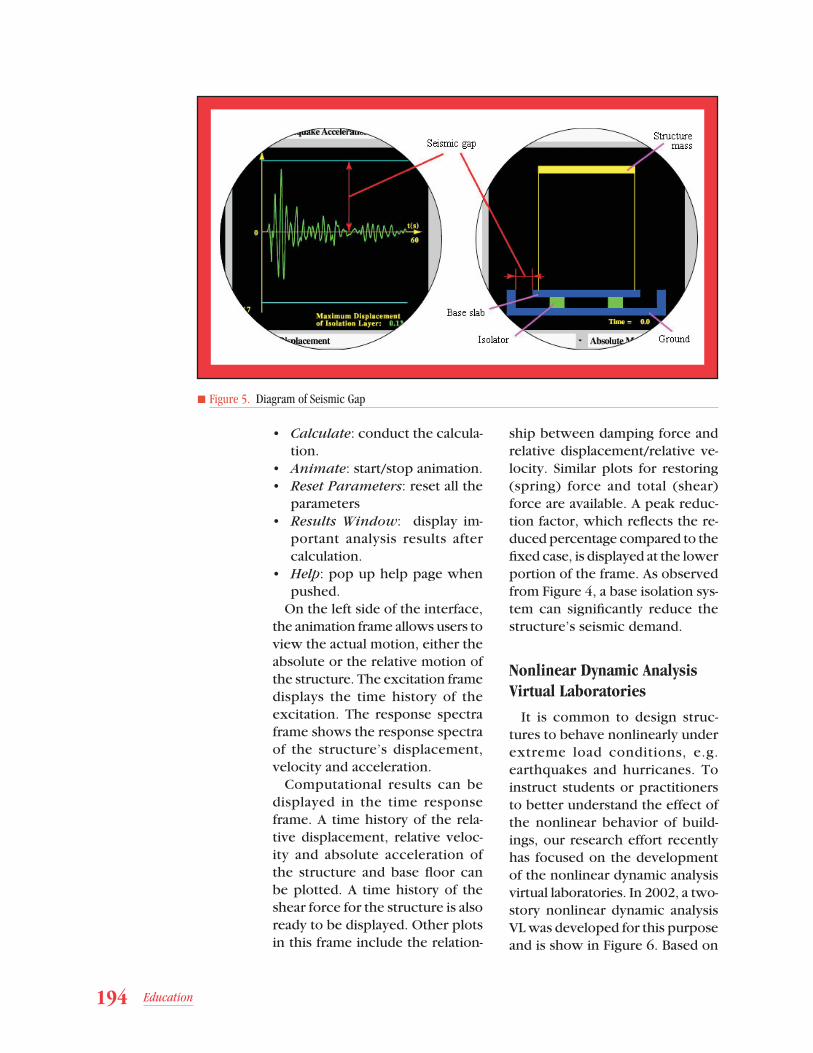
• Seismic Gap: the gap between the base slab and ground, as in-dicated in Figure 5. It should be greater than the maximum displacement of base slab.
■ Figure 3. Typical Relationship Between Force and Response for Different Nonlinearities

Java-Powered Virtual Laboratories for Earthquake Engineering Education 193
• Linear Isolator Damping Ratio: damping ratio of the linear and nonlinear damping isolation system assuming the structure is rigid.
• Nonlinear Damping: involu-tion coeffi cient for nonlinear damping isolator.
• Initial Natural Frequency: natural frequency of the hys-teretic isolators (Bouc-Wen and bilinear model) assuming the structure is rigid. This value is used to calculate the elastic stiffness of these two nonlinear stiffness models. The post yield-ing stiffness is computed based on the natural frequency under “Isolation System.”
• Yield Displacement: displace-ment when exceeded, the hysteretic isolators (Bouc-Wen
model and bilinear model) change from elastic to plastic region.
• Max Amplitude: maximum am-plitude of the earthquake accel-eration. By changing this value, excitation can be scaled.
• Frequency for Sine Wave: frequency component of the sinusoid excitation.
• Checkboxes: by checking one or more of the following check boxes, desired analysis results can be displayed.
• Response Window: width of the excitation/time response frames (in seconds) used dur-ing the animation.
• # Response Spectra Points: number of points used to draw response spectra curve.
Animation Frame Excitation Frame Control Panel
Response Spectra Frame Time Response Frame
■ Figure 4. Nonlinear Base Isolation Virtual Laboratory
194 Education
• Calculate: conduct the calcula-tion.
• Animate: start/stop animation.• Reset Parameters: reset all the
parameters• Results Window: display im-
portant analysis results after calculation.
• Help: pop up help page when pushed.
On the left side of the interface, the animation frame allows users to view the actual motion, either the absolute or the relative motion of the structure. The excitation frame displays the time history of the excitation. The response spectra frame shows the response spectra of the structure’s displacement, velocity and acceleration.
Computational results can be displayed in the time response frame. A time history of the rela-tive displacement, relative veloc-ity and absolute acceleration of the structure and base fl oor can be plotted. A time history of the shear force for the structure is also ready to be displayed. Other plots in this frame include the relation-
ship between damping force and relative displacement/relative ve-locity. Similar plots for restoring (spring) force and total (shear) force are available. A peak reduc-tion factor, which refl ects the re-duced percentage compared to the fi xed case, is displayed at the lower portion of the frame. As observed from Figure 4, a base isolation sys-tem can signifi cantly reduce the structure’s seismic demand.
Nonlinear Dynamic Analysis Virtual Laboratories
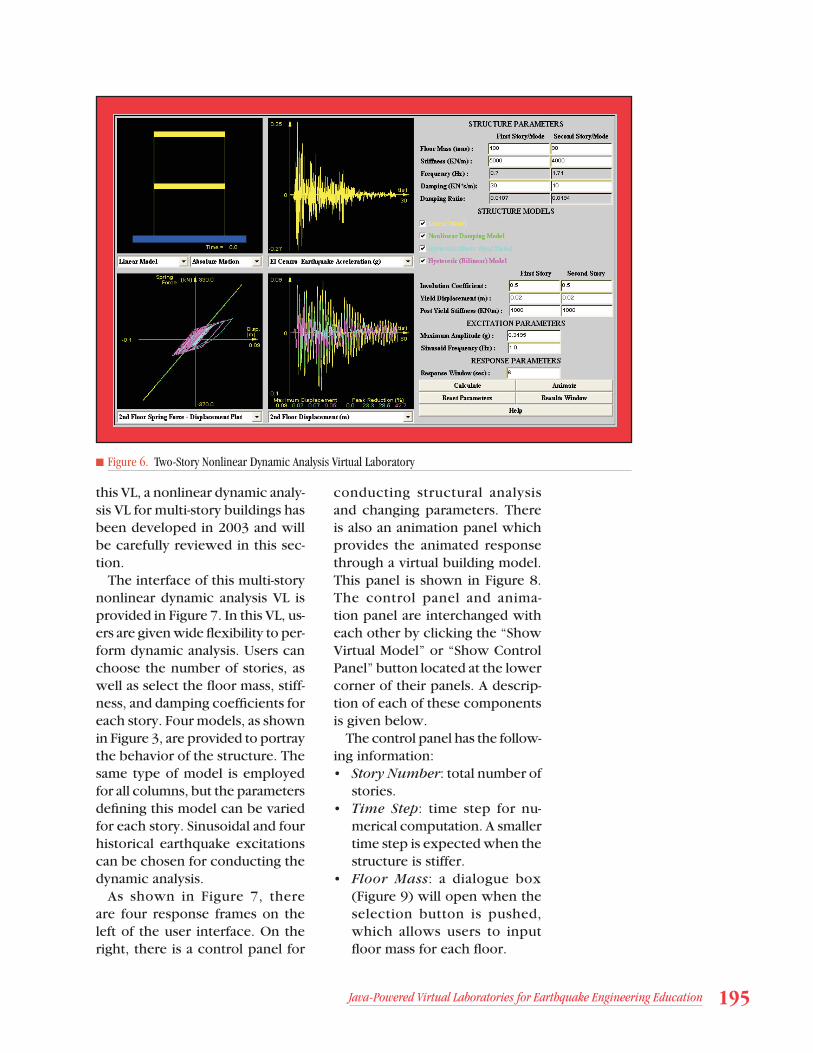
It is common to design struc-tures to behave nonlinearly under extreme load conditions, e.g. earthquakes and hurricanes. To instruct students or practitioners to better understand the effect of the nonlinear behavior of build-ings, our research effort recently has focused on the development of the nonlinear dynamic analysis virtual laboratories. In 2002, a two-story nonlinear dynamic analysis VL was developed for this purpose and is show in Figure 6. Based on
■ Figure 5. Diagram of Seismic Gap
Java-Powered Virtual Laboratories for Earthquake Engineering Education 195
this VL, a nonlinear dynamic analy-sis VL for multi-story buildings has been developed in 2003 and will be carefully reviewed in this sec-tion.
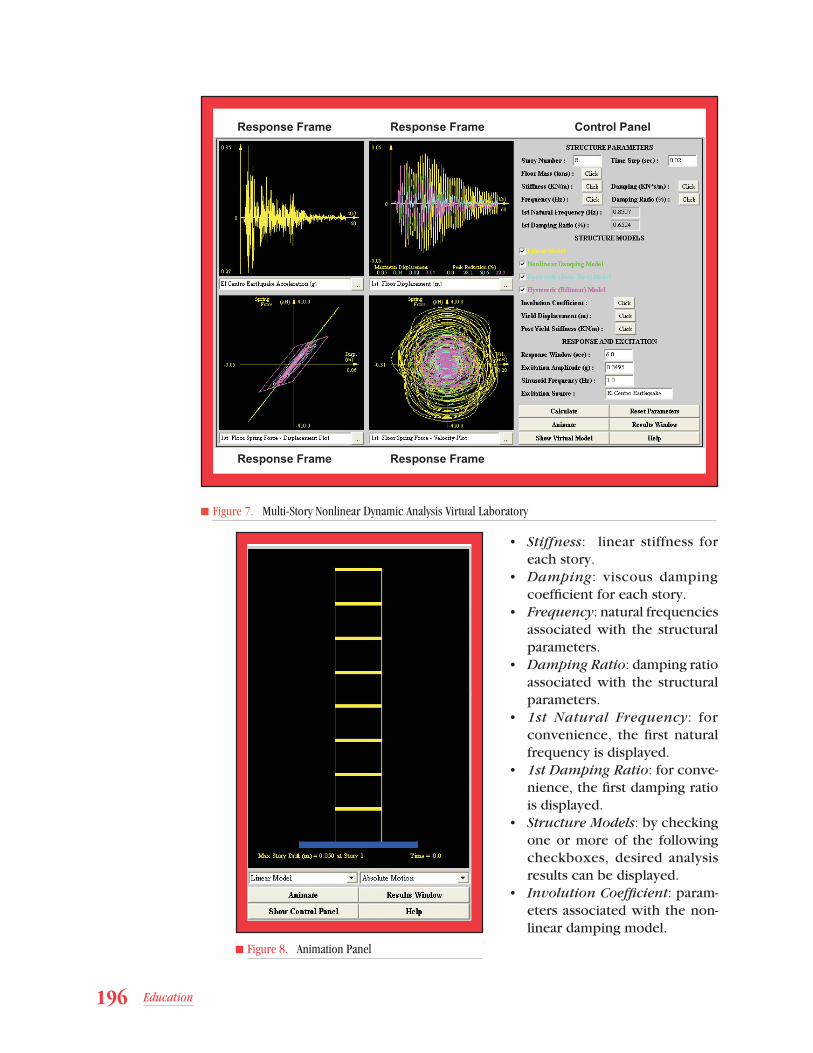
The interface of this multi-story nonlinear dynamic analysis VL is provided in Figure 7. In this VL, us-ers are given wide fl exibility to per-form dynamic analysis. Users can choose the number of stories, as well as select the fl oor mass, stiff-ness, and damping coeffi cients for each story. Four models, as shown in Figure 3, are provided to portray the behavior of the structure. The same type of model is employed for all columns, but the parameters defi ning this model can be varied for each story. Sinusoidal and four historical earthquake excitations can be chosen for conducting the dynamic analysis.
As shown in Figure 7, there are four response frames on the left of the user interface. On the right, there is a control panel for
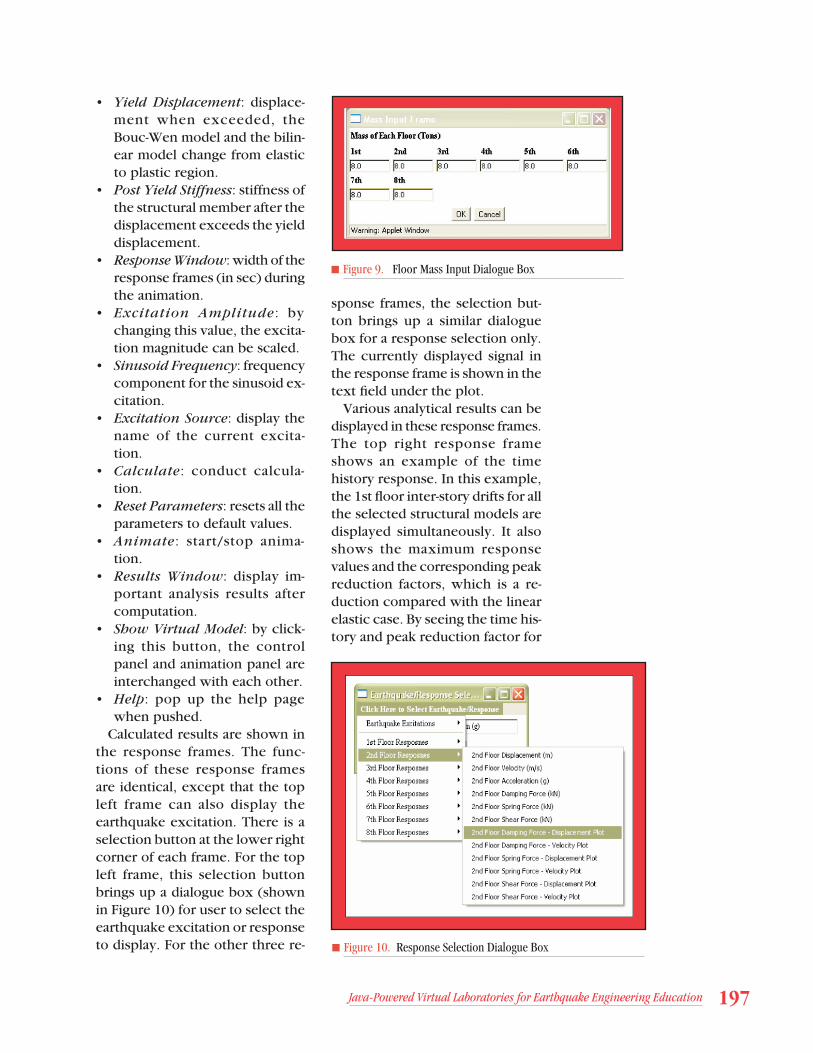
conducting structural analysis and changing parameters. There is also an animation panel which provides the animated response through a virtual building model. This panel is shown in Figure 8. The control panel and anima-tion panel are interchanged with each other by clicking the “Show Virtual Model” or “Show Control Panel” button located at the lower corner of their panels. A descrip-tion of each of these components is given below.
The control panel has the follow-ing information:• Story Number: total number of
stories.• Time Step: time step for nu-
merical computation. A smaller time step is expected when the structure is stiffer.
• Floor Mass: a dialogue box (Figure 9) will open when the selection button is pushed, which allows users to input fl oor mass for each fl oor.
■ Figure 6. Two-Story Nonlinear Dynamic Analysis Virtual Laboratory
196 Education
• Stiffness: linear stiffness for each story.
• Damping: viscous damping coeffi cient for each story.
• Frequency: natural frequencies associated with the structural parameters.
• Damping Ratio: damping ratio associated with the structural parameters.
• 1st Natural Frequency: for convenience, the fi rst natural frequency is displayed.
• 1st Damping Ratio: for conve-nience, the fi rst damping ratio is displayed.
• Structure Models: by checking one or more of the following checkboxes, desired analysis results can be displayed.
• Involution Coeffi cient: param-eters associated with the non-linear damping model.
■ Figure 8. Animation Panel
Response Frame Response Frame Control Panel
Response Frame Response Frame
■ Figure 7. Multi-Story Nonlinear Dynamic Analysis Virtual Laboratory
Java-Powered Virtual Laboratories for Earthquake Engineering Education 197
• Yield Displacement: displace-ment when exceeded, the Bouc-Wen model and the bilin-ear model change from elastic to plastic region.
• Post Yield Stiffness: stiffness of the structural member after the displacement exceeds the yield displacement.
• Response Window: width of the response frames (in sec) during the animation.
• Excitation Amplitude: by changing this value, the excita-tion magnitude can be scaled.
• Sinusoid Frequency: frequency component for the sinusoid ex-citation.
• Excitation Source: display the name of the current excita-tion.
• Calculate: conduct calcula-tion.
• Reset Parameters: resets all the parameters to default values.
• Animate: start/stop anima-tion.
• Results Window: display im-portant analysis results after computation.
• Show Virtual Model: by click-ing this button, the control panel and animation panel are interchanged with each other.
• Help: pop up the help page when pushed.
Calculated results are shown in the response frames. The func-tions of these response frames are identical, except that the top left frame can also display the earthquake excitation. There is a selection button at the lower right corner of each frame. For the top left frame, this selection button brings up a dialogue box (shown in Figure 10) for user to select the earthquake excitation or response to display. For the other three re-
sponse frames, the selection but-ton brings up a similar dialogue box for a response selection only. The currently displayed signal in the response frame is shown in the text fi eld under the plot.
Various analytical results can be displayed in these response frames. The top right response frame shows an example of the time history response. In this example, the 1st fl oor inter-story drifts for all the selected structural models are displayed simultaneously. It also shows the maximum response values and the corresponding peak reduction factors, which is a re-duction compared with the linear elastic case. By seeing the time his-tory and peak reduction factor for
■ Figure 9. Floor Mass Input Dialogue Box
■ Figure 10. Response Selection Dialogue Box

198 Education
different models simultaneously, users can easily appreciate the dif-ference among these models under the current excitation. Similar time history plots for relative velocity, absolute acceleration, spring force, damping force and shear force are also readily displayed by clicking the selection button in each of the four frames. In this example, the bottom two response frames dem-onstrate relationships between spring force and displacement, and between spring force and velocity. Similar plots for spring force and damping force can also be shown by clicking the selection button in any one of these four frames. As can be seen from the overview, this nonlinear dynamic analysis VL grants users wide fl exibly of the control over describing the structure, conducting analysis and viewing the results.
Verifi cation of the Virtual Laboratories
The computation engines for all fi ve VLs were fi rst programmed in Matlab and then converted into Java. The calculations were verifi ed by programming in two different ways with Matlab. One way is to program all the algorithms in Mat-lab language to numerically solve the dynamic equations. The other method is to utilize the exsiting al-gorithms in the Simulink Toolbox to solve the dynamic equations. By comparing results from these two approaches, the errors of compu-tation have been minimized. The programming was then translated into Java language. The book, Nu-
merical Recipes (Press et al., 1987), was very helpful for this translation. Accurate results have been obtained for these dynamic problems.
Use of the Virtual Laboratories
These interactive VLs have been well developed to fi t various purposes. They are unique tools to introduce various advanced earthquake engineering topics to senior undergraduates, graduate students and junior engineers. If an Internet connection is available during lectures, these VLs can be utilized to demonstrate differ-ent ideas and designs during the lectures, which will enhance the effi ciency of lecturing. These VLs can also be used as homework as-signments regarding specifi c earth-quake engineering topics. Young researchers are also expected to fi nd these VLs handy and helpful to gain extra experience on these advanced topics.
To demonstrate the concepts of these VLs, three sample laboratory sessions are included in this paper. Sample laboratory session A gives an example of how the structural control VL can be used to reduce earthquake response. Sample labo-ratory session B demonstrates the design of an isolator which can be described by a hysteretic bilinear model to reduce the structural response. Sample laboratory ses-sion C illustrates the nonlinear dynamic behavior of an 11-story building under the Kobe earth-quake excitation.
Related Web Sites
Related Web Sites
Virtual Laboratory for Earthquake Engineering:http://cee.uiuc.edu/sstl/java/
Multidisciplinary Center for Earthquake Engineering Research, Education:http://mceer.buffalo.edu/education/default.asp#vl
Java-Powered Virtual Laboratories for Earthquake Engineering Education 199
Sample Laboratory Session A
Problem
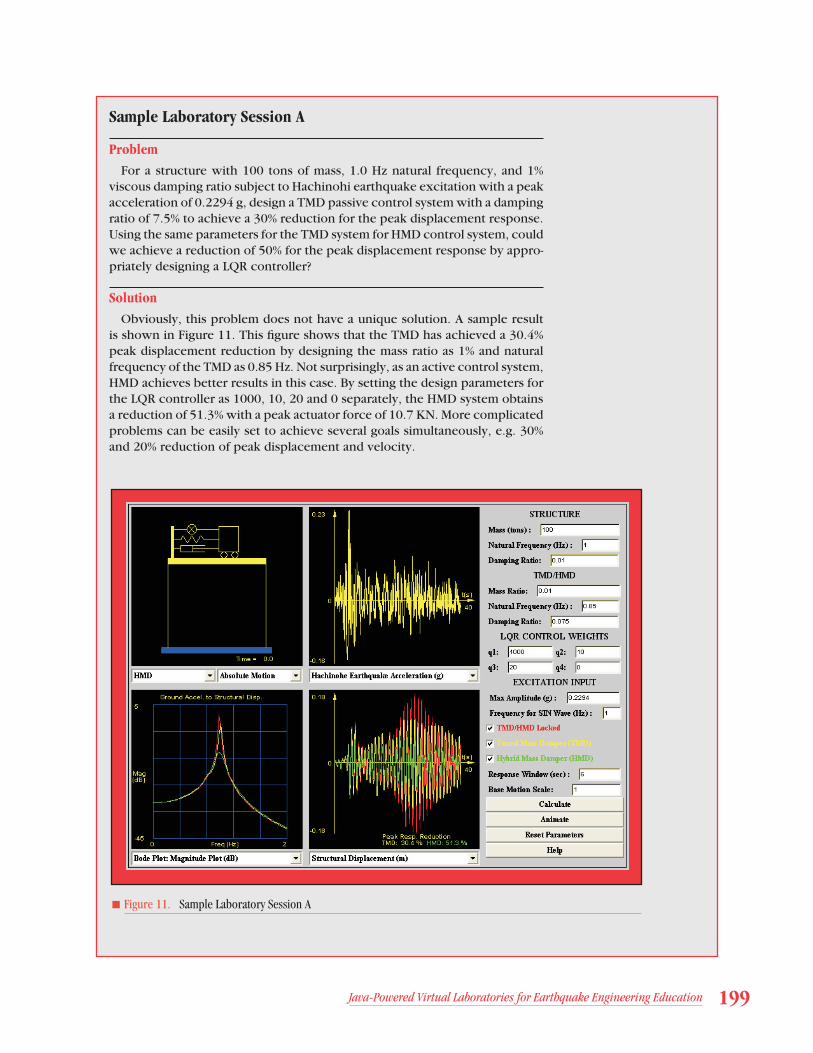
For a structure with 100 tons of mass, 1.0 Hz natural frequency, and 1% viscous damping ratio subject to Hachinohi earthquake excitation with a peak acceleration of 0.2294 g, design a TMD passive control system with a damping ratio of 7.5% to achieve a 30% reduction for the peak displacement response. Using the same parameters for the TMD system for HMD control system, could we achieve a reduction of 50% for the peak displacement response by appro-priately designing a LQR controller?
Solution
Obviously, this problem does not have a unique solution. A sample result is shown in Figure 11. This fi gure shows that the TMD has achieved a 30.4% peak displacement reduction by designing the mass ratio as 1% and natural frequency of the TMD as 0.85 Hz. Not surprisingly, as an active control system, HMD achieves better results in this case. By setting the design parameters for the LQR controller as 1000, 10, 20 and 0 separately, the HMD system obtains a reduction of 51.3% with a peak actuator force of 10.7 KN. More complicated problems can be easily set to achieve several goals simultaneously, e.g. 30% and 20% reduction of peak displacement and velocity.
■ Figure 11. Sample Laboratory Session A

200 Education
Sample Laboratory Session B
Problem
For a structure with 100 tons of mass, a natural frequency of 1.0 Hz, and viscous damping ratio of 1%, under El Centro earthquake excitation with a peak acceleration of 0.5 g, design an isolation system with mass ration of base fl oor to structure as 0.1 to achieve an 80% reduction of the structural peak dis-placement response. Note that the isolator can be described by the hysteretic Bouc-Wen model with a maximum allowable deformation of 20.0 cm.
Solution
One sample result is displayed in Figure 12. This fi gure shows that the isolation system achieves an 83.3% peak displacement reduction by designing initial natural frequency of 0.7 Hz, post yield stiffness of 0.3 Hz and a yield displacement of 2.0 cm. The maximum displacement of the base fl oor is 19.0 cm which is within the deformation limit of the isolator. It is impressive to see that the base isolation system reduces the seismic demand dramatically in the example.
■ Figure 12. Sample Laboratory Session B
Java-Powered Virtual Laboratories for Earthquake Engineering Education 201
Sample Laboratory Session C
Problem
An 11-story building with equivalent mass, stiffness and damping coeffi cient distributions as given in Table 1 is subjected to the Kobe ground motion re-cord with peak ground acceleration of 0.8337 g. The elastic maximum base shear and inter-story displacement are considered excessive and not suitable for design purposes. It is therefore required to determine the yield force and displacement of each story which is described by hysteretic bilinear model, preserving the given stiffness distribution, such that the ensuing maximum base shear and maximum inter-story displacements are 65% and 45% of the elastic values.
Solution
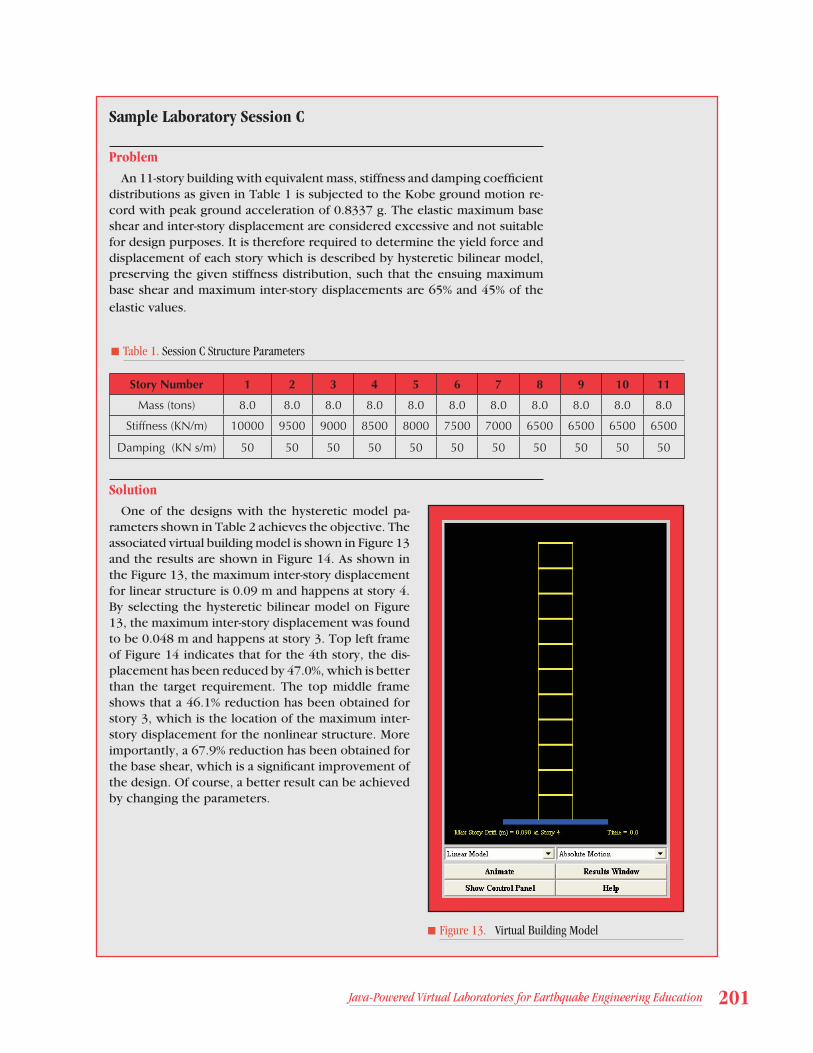
One of the designs with the hysteretic model pa-rameters shown in Table 2 achieves the objective. The associated virtual building model is shown in Figure 13 and the results are shown in Figure 14. As shown in the Figure 13, the maximum inter-story displacement for linear structure is 0.09 m and happens at story 4. By selecting the hysteretic bilinear model on Figure 13, the maximum inter-story displacement was found to be 0.048 m and happens at story 3. Top left frame of Figure 14 indicates that for the 4th story, the dis-placement has been reduced by 47.0%, which is better than the target requirement. The top middle frame shows that a 46.1% reduction has been obtained for story 3, which is the location of the maximum inter-story displacement for the nonlinear structure. More importantly, a 67.9% reduction has been obtained for the base shear, which is a signifi cant improvement of the design. Of course, a better result can be achieved by changing the parameters.
Story Number 1 2 3 4 5 6 7 8 9 10 11
Mass (tons) 8.0 8.0 8.0 8.0 8.0 8.0 8.0 8.0 8.0 8.0 8.0
Stiffness (KN/m) 10000 9500 9000 8500 8000 7500 7000 6500 6500 6500 6500
Damping (KN s/m) 50 50 50 50 50 50 50 50 50 50 50
■ Table 1. Session C Structure Parameters
■ Figure 13. Virtual Building Model

202 Education
Story Number 1 2 3 4 5 6 7 8 9 10 11
Initial Stiffness
(KN/m)10000 9500 9000 8500 8000 7500 7000 6500 6500 6500 6500
Post-yield Stiffness
(KN/m)3000 3000 3000 3000 3000 3000 3000 2500 2500 2500 2500
Yield Displacement
(cm)2.0 2.0 2.0 2.0 2.0 2.0 2.0 2.0 2.0 2.0 2.0
■ Table 2. Session C Bilinear Model Parameters
■ Figure 14. Sample Laboratory Session C
Conclusions and Future Research
A series of unique Java-Pow-ered Virtual Laboratories have been developed to facilitate the understanding of a wide range of topics in earthquake engineering and dynamic analysis. Participants are expected to gain fundamental understanding of these topics by conducting on-line numerical ex-periments using these interactive
VLs. These on-line VLs provide an excellent alternative way for students and practitioners to de-velop their knowledge of earth-quake engineering. By designing these VLs using Java programming, they can be accessed universally through the Internet and provide users with wide fl exibility to con-fi gure system parameters, conduct analysis, and view results. A total of fi ve VLs, including a structural control VL, two base isolation VLs
Java-Powered Virtual Laboratories for Earthquake Engineering Education 203
using linear and nonlinear devices, and two nonlinear dynamic analy-sis VLs for buildings have been published.
Current and continuing efforts emphasize the development of more realistic virtual laboratories which allow users to imitate real dynamic experiments step by step, including selecting sensor loca-tions, collecting data from sensors, designing anti-aliasing fi lters, and
Acknowledgements
This research was primarily supported by the Earthquake Engineering Research Centers Program of the National Science Foundation, under award number EEC-9701471 to the Multidisciplinary Center for Earthquake Engineering Research. This support is gratefully acknowledged.
References
Arnold W.F., III and Laub, A.J., (1984), “Generalized Eigenproblem Algorithms and Software for Algebraic Riccati Equations,” Proc. IEEE, 72, pp. 1746-1754.
Belytschko, T. and Hughes, T.J., (1983), Computational Methods for Transient Analysis, North-Holland.
Berg, G.V., (1989), Elements of Structural Dynamics, Prentice Hall.
Fujino, Y., Soong, T.T. and Spencer Jr., B.F., (1996), “Structural Control: Basic Concepts and Applications,” Proceedings of the ASCE Structures Congress XIV, Chicago, Illinois, pp. 1277-1287.
Housner, G.W., Masri, S.F. and Chassiakos, A.G., (1994), Proc. of the First World Conf. on Structural Control, Pasadena, CA.
Newman, A., (1996), Special Edition Using Java, Que Corporation, Indianapolis, IN.
Press, W.H., Flannery, B.P., Teukolsky, S.A. and Vetterling, W.T., (1987), Numerical Recipes: The Art of Scientifi c Computing, Cambridge University Press.
Soong, T.T., (1990), Active Structural Control, Theory and Practice, Longman Scientifi c and Technical, Essex, England.
Tedesco, J.W., McDougal, W.G. and Ross, C.A., (1998), Structural Dynamics: Theory and Applications, Addison-Wesley.
conducting FFT analysis, etc. The intention is to provide the users with a more realistic feeling of con-ducting a real experiment without dealing with wires and experimen-tal setups. These VLs are expected to be an effective complement to the teaching of structural dynam-ics and earthquake engineering analysis at institutions which lack the facilities to conduct dynamic experiments.