Embed Size (px)
Citation preview
InsertCustomSessionQR if Desired.
Java Monitoring and Diagnostic Tooling
Iris Baron IBM Java JIT on System Z [email protected]
Session ID: 16182
2
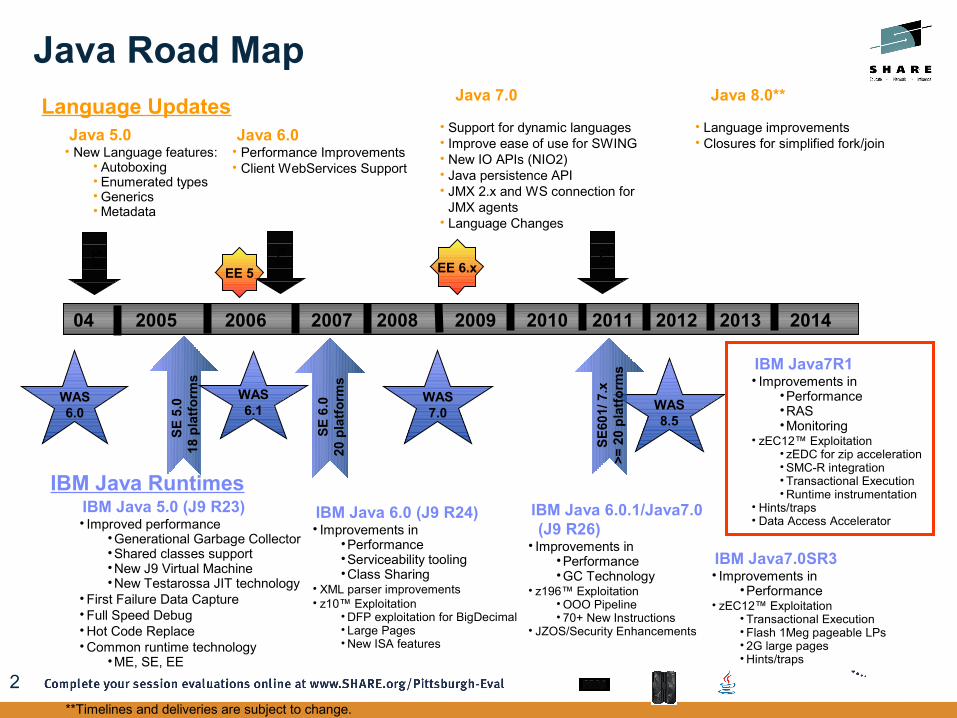
Language UpdatesJava 5.0
• New Language features:• Autoboxing• Enumerated types• Generics• Metadata
Java 6.0• Performance Improvements• Client WebServices Support
• Support for dynamic languages• Improve ease of use for SWING• New IO APIs (NIO2)• Java persistence API• JMX 2.x and WS connection for
JMX agents• Language Changes
Java 7.0
IBM Java RuntimesIBM Java 5.0 (J9 R23) • Improved performance
• Generational Garbage Collector• Shared classes support• New J9 Virtual Machine• New Testarossa JIT technology
• First Failure Data Capture• Full Speed Debug• Hot Code Replace• Common runtime technology
• ME, SE, EE
IBM Java 6.0 (J9 R24)• Improvements in
•Performance•Serviceability tooling•Class Sharing
• XML parser improvements• z10™ Exploitation
• DFP exploitation for BigDecimal• Large Pages• New ISA features
5.0
6.0
2005 2009
SE 5
.0
18 p
latfo
rms
SE 6
.020
pla
tform
s
EE 5
WAS6.1
WAS7.0
2006 2008
WAS6.0
200704
EE 6.x
**Timelines and deliveries are subject to change.
2010 2011
IBM Java 6.0.1/Java7.0 (J9 R26)
• Improvements in• Performance• GC Technology
• z196™ Exploitation• OOO Pipeline• 70+ New Instructions
• JZOS/Security Enhancements
WAS8.5
2012 2013 20147.0
• Language improvements • Closures for simplified fork/join
Java 8.0**
SE60
1/ 7
.x>=
20
plat
form
s
IBM Java7.0SR3• Improvements in
•Performance• zEC12™ Exploitation
• Transactional Execution• Flash 1Meg pageable LPs• 2G large pages• Hints/traps
IBM Java7R1• Improvements in
•Performance•RAS•Monitoring
• zEC12™ Exploitation• zEDC for zip acceleration• SMC-R integration• Transactional Execution• Runtime instrumentation
• Hints/traps• Data Access Accelerator
Java Road Map
3
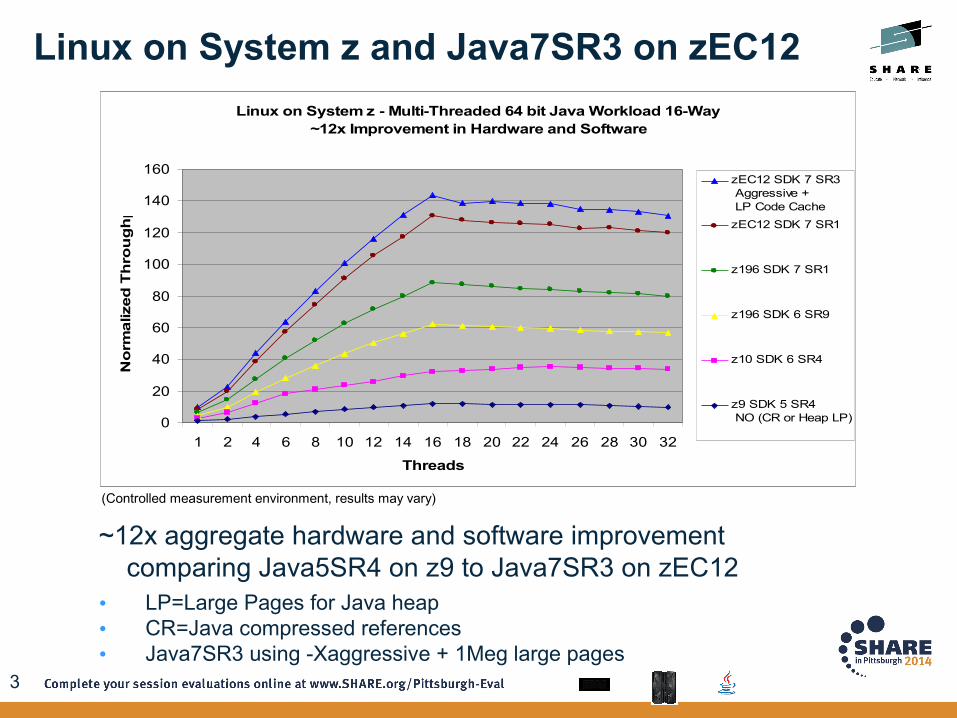
(Controlled measurement environment, results may vary)
Linux on System z - Multi-Threaded 64 bit Java Workload 16-Way ~12x Improvement in Hardware and Software
0
20
40
60
80
100
120
140
160
1 2 4 6 8 10 12 14 16 18 20 22 24 26 28 30 32
Threads
No
rmal
ized
Th
rou
gh
pu
t
zEC12 SDK 7 SR3 Aggressive + LP Code Cache zEC12 SDK 7 SR1
z196 SDK 7 SR1
z196 SDK 6 SR9
z10 SDK 6 SR4
z9 SDK 5 SR4 NO (CR or Heap LP)
~12x aggregate hardware and software improvement comparing Java5SR4 on z9 to Java7SR3 on zEC12
• LP=Large Pages for Java heap• CR=Java compressed references• Java7SR3 using -Xaggressive + 1Meg large pages
Linux on System z and Java7SR3 on zEC12
4
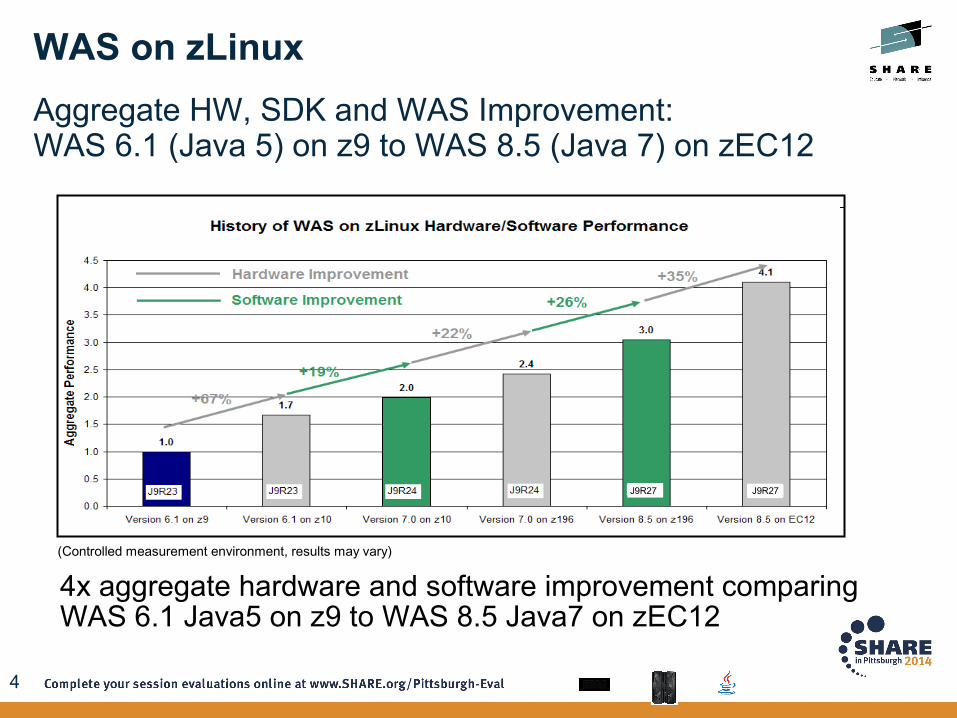
(Controlled measurement environment, results may vary)
Aggregate HW, SDK and WAS Improvement: WAS 6.1 (Java 5) on z9 to WAS 8.5 (Java 7) on zEC12
4x aggregate hardware and software improvement comparing WAS 6.1 Java5 on z9 to WAS 8.5 Java7 on zEC12
WAS on zLinux
J9R27J9R27
5
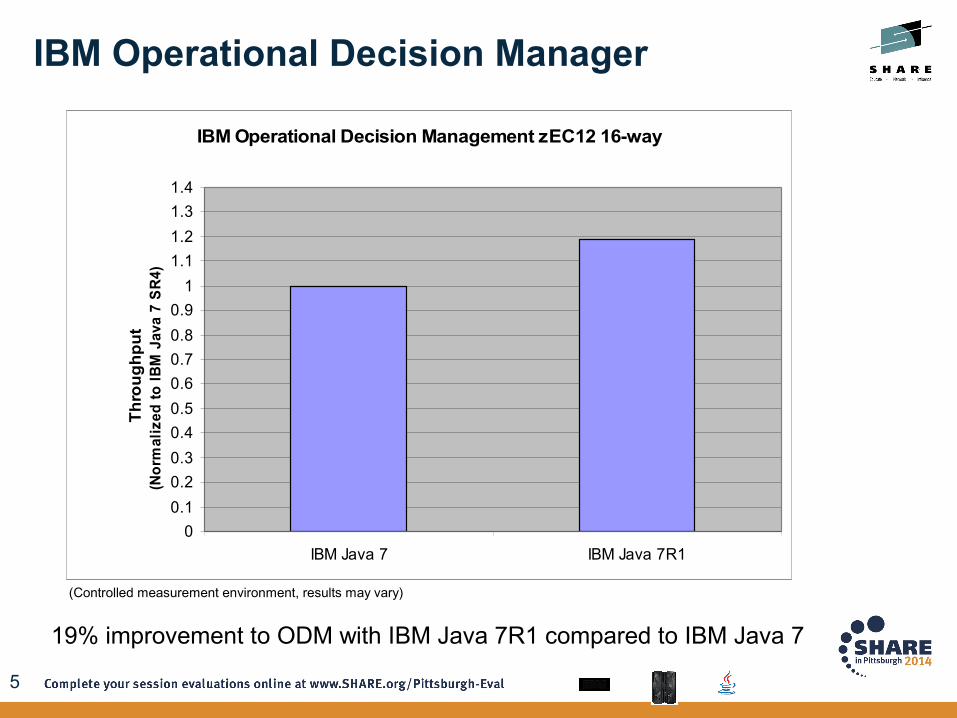
19% improvement to ODM with IBM Java 7R1 compared to IBM Java 7
IBM Operational Decision Management zEC12 16-way
00.10.20.30.40.50.60.70.80.9
11.11.21.31.4
IBM Java 7 IBM Java 7R1
Thro
ughp
ut
(Nor
mal
ized
to IB
M J
ava
7 SR
4)
IBM Operational Decision Manager
(Controlled measurement environment, results may vary)
6
Java Monitoring and Diagnostic ToolingAgenda
• IBM Monitoring and Diagnostic Tools for Java– Why use the tools?– Where to get the tools?
• IBM Recommended Java Troubleshooting Tools– Health Center– Garbage Collector and Memory Visualizer – Memory Analyzer
• Summary
7
• Tools simplify troubleshooting problems :
• IBM provides a free unified suite of tools to understand different aspects of Java applications
• Fully IBM supported·
Java Monitoring and Diagnostic ToolingWhy use the IBM Tools?
Possible problems:
Application coding errors
Environment variables
Performance tuning
Configuration problems
• Tools provide visualizations, analysis and recommendations
Fixing problems ...... is much easier with the right tool for the job!
8
• IBM Support AssistantA free application available at:http://www.ibm.com/software/support/isa
• Eclipse Market PlaceTools available to install directly into Eclipse
Java Monitoring and Diagnostic ToolingWhere to get the IBM Tools?
9
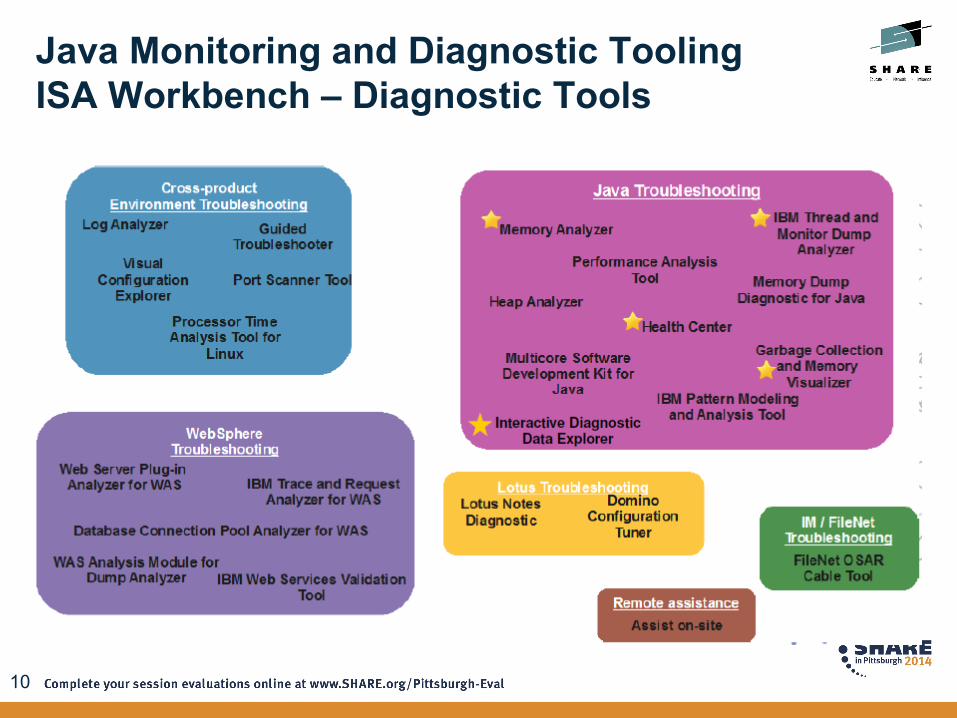
IBM Support Assistant (ISA) is a free application that :
• Provides the “toolbox” in which analysis and diagnostic tools resideOver one hundred “add-ons” available for various IBM products
• Provides Serviceability Tools across product familiesSimplifies software support
• Provides Search feature to query IBM and non-IBM knowledge banks
• Not a monitoring tool
Java Monitoring and Diagnostic ToolingWhat is IBM Support Assistant?
10
Java Monitoring and Diagnostic ToolingISA Workbench – Diagnostic Tools
11
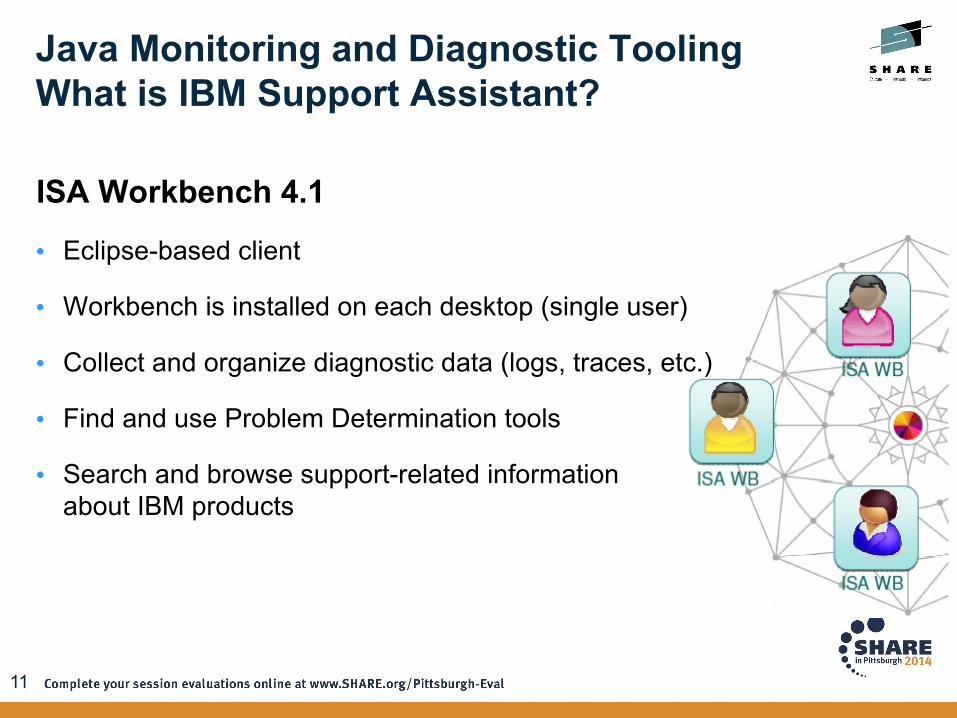
Java Monitoring and Diagnostic ToolingWhat is IBM Support Assistant?
ISA Workbench 4.1
• Eclipse-based client
• Workbench is installed on each desktop (single user)
• Collect and organize diagnostic data (logs, traces, etc.)
• Find and use Problem Determination tools
• Search and browse support-related informationabout IBM products
12
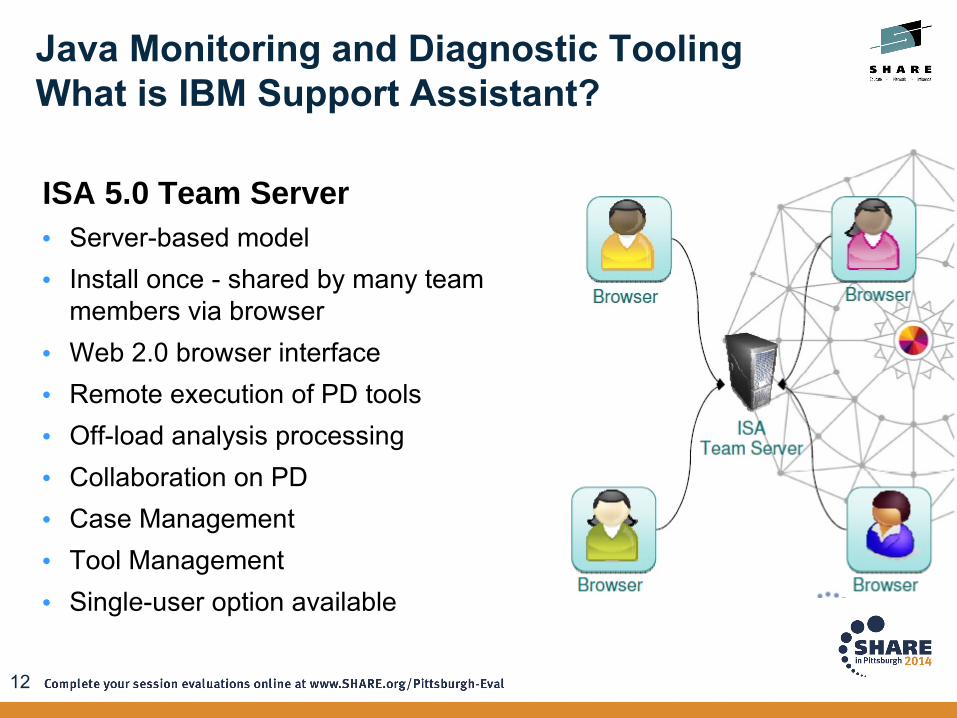
Java Monitoring and Diagnostic ToolingWhat is IBM Support Assistant?
ISA 5.0 Team Server• Server-based model• Install once - shared by many team
members via browser• Web 2.0 browser interface• Remote execution of PD tools• Off-load analysis processing• Collaboration on PD• Case Management• Tool Management• Single-user option available
13
Java Monitoring and Diagnostic ToolingAgenda
• IBM Monitoring and Diagnostic Tools for Java– Why use the tools?– Where to get the tools?
• IBM Recommended Java Troubleshooting Tools– Health Center– Garbage Collector and Memory Visualizer – Memory Analyzer
• Summary
14
Motivating questions:• What is my JVM doing? Is everything ok?
• Why is my application running slowly?
• Why is it not scaling?
• Am I using the right options?
Java Monitoring and Diagnostic ToolingHealth Center
15
• Live monitoring tool with very low overhead (< 1%)
• Suitable for all Java applications running on IBM’s JVM
• Provides insight into your application behaviour with visualization
• Diagnoses potential problems with recommendations
• Powerful API allowing embedding of Health Center into other applications
Java Monitoring and Diagnostic ToolingHealth Center
16
Health Center provides visualization and monitoring in the following application areas:
• Method profiling
• Lock analysis
• Garbage Collection
• Threading
• Memory Usage
• System environment
• Java class loading
• Object Allocations
• File I/O
Java Monitoring and Diagnostic ToolingHealth Center
17
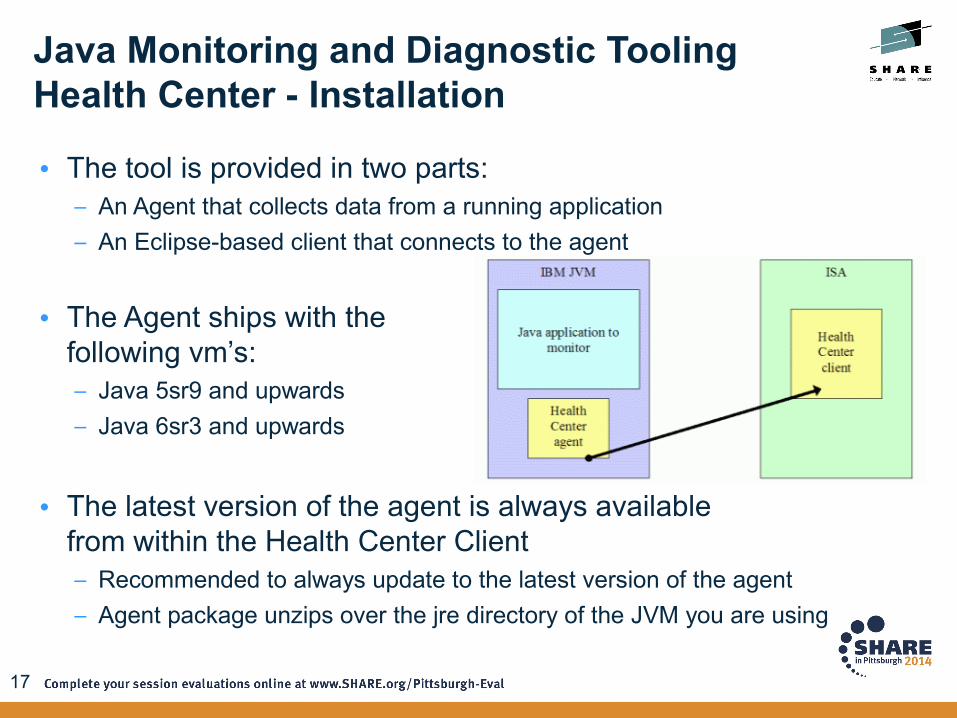
• The tool is provided in two parts: – An Agent that collects data from a running application – An Eclipse-based client that connects to the agent
• The Agent ships with the following vm’s:– Java 5sr9 and upwards– Java 6sr3 and upwards
• The latest version of the agent is always available from within the Health Center Client– Recommended to always update to the latest version of the agent– Agent package unzips over the jre directory of the JVM you are using
Java Monitoring and Diagnostic ToolingHealth Center - Installation
18
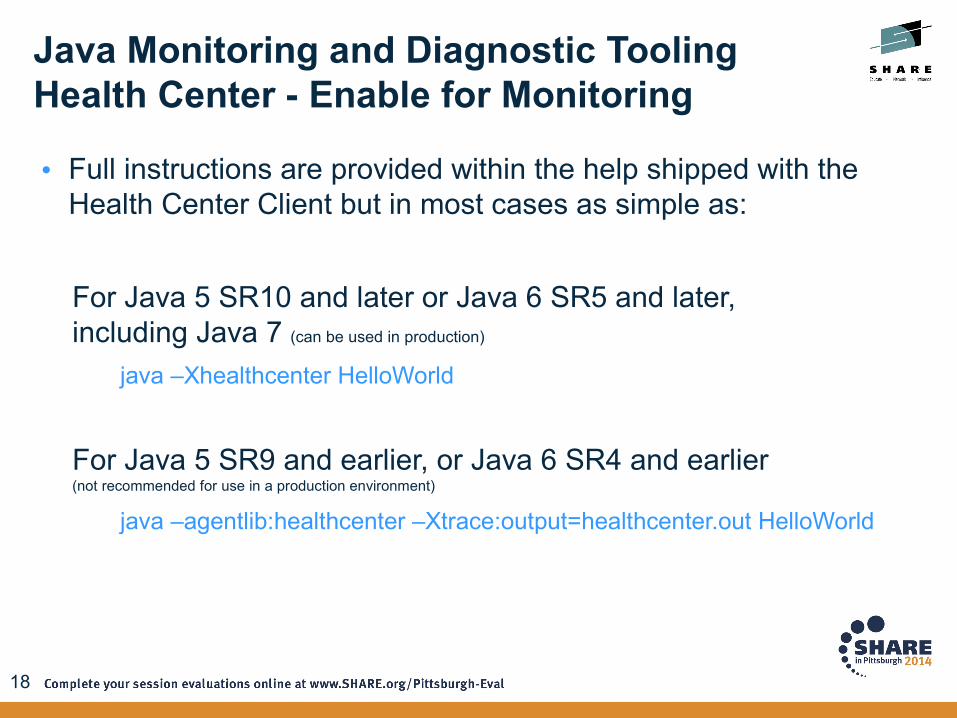
• Full instructions are provided within the help shipped with the Health Center Client but in most cases as simple as:
For Java 5 SR10 and later or Java 6 SR5 and later, including Java 7 (can be used in production)
java –Xhealthcenter HelloWorld
For Java 5 SR9 and earlier, or Java 6 SR4 and earlier (not recommended for use in a production environment)
java –agentlib:healthcenter –Xtrace:output=healthcenter.out HelloWorld
Java Monitoring and Diagnostic ToolingHealth Center - Enable for Monitoring
19
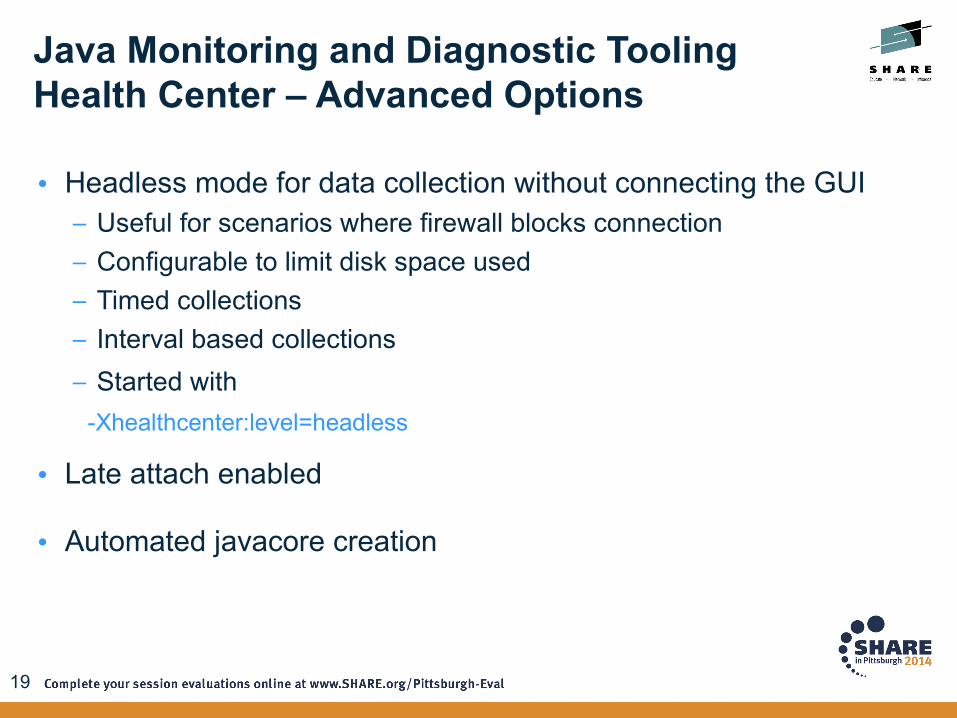
• Headless mode for data collection without connecting the GUI– Useful for scenarios where firewall blocks connection– Configurable to limit disk space used– Timed collections– Interval based collections– Started with
-Xhealthcenter:level=headless
• Late attach enabled
• Automated javacore creation
Java Monitoring and Diagnostic ToolingHealth Center – Advanced Options
20
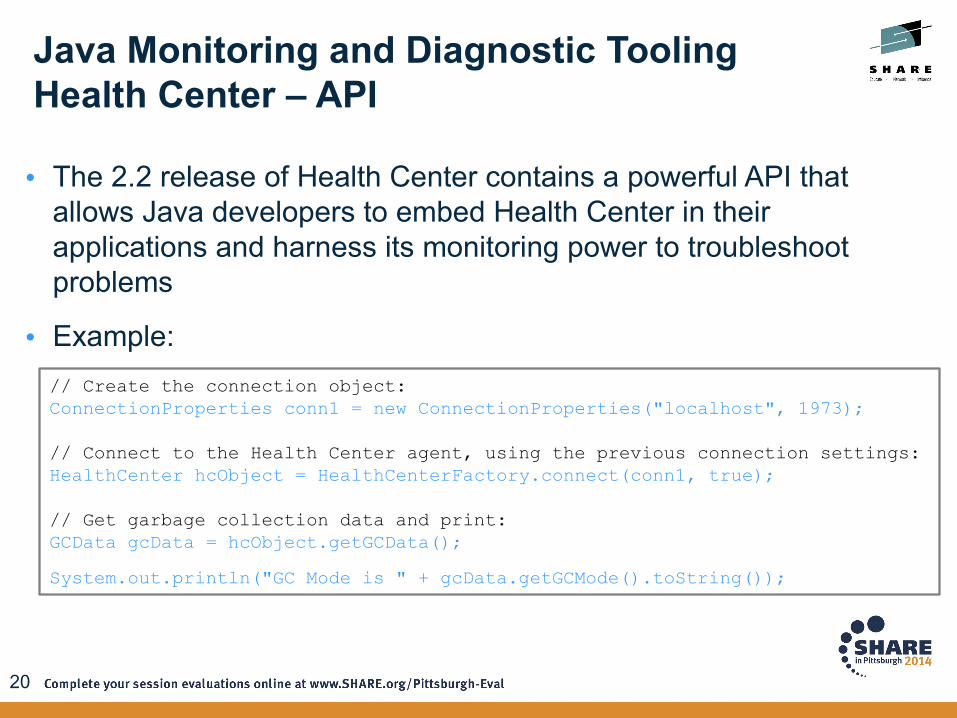
• The 2.2 release of Health Center contains a powerful API that allows Java developers to embed Health Center in their applications and harness its monitoring power to troubleshoot problems
• Example:
Java Monitoring and Diagnostic ToolingHealth Center – API
// Create the connection object: ConnectionProperties conn1 = new ConnectionProperties("localhost", 1973);
// Connect to the Health Center agent, using the previous connection settings: HealthCenter hcObject = HealthCenterFactory.connect(conn1, true);
// Get garbage collection data and print:GCData gcData = hcObject.getGCData(); System.out.println("GC Mode is " + gcData.getGCMode().toString());
21
Java Monitoring and Diagnostic ToolingHealth Center
DEMODEMO
22
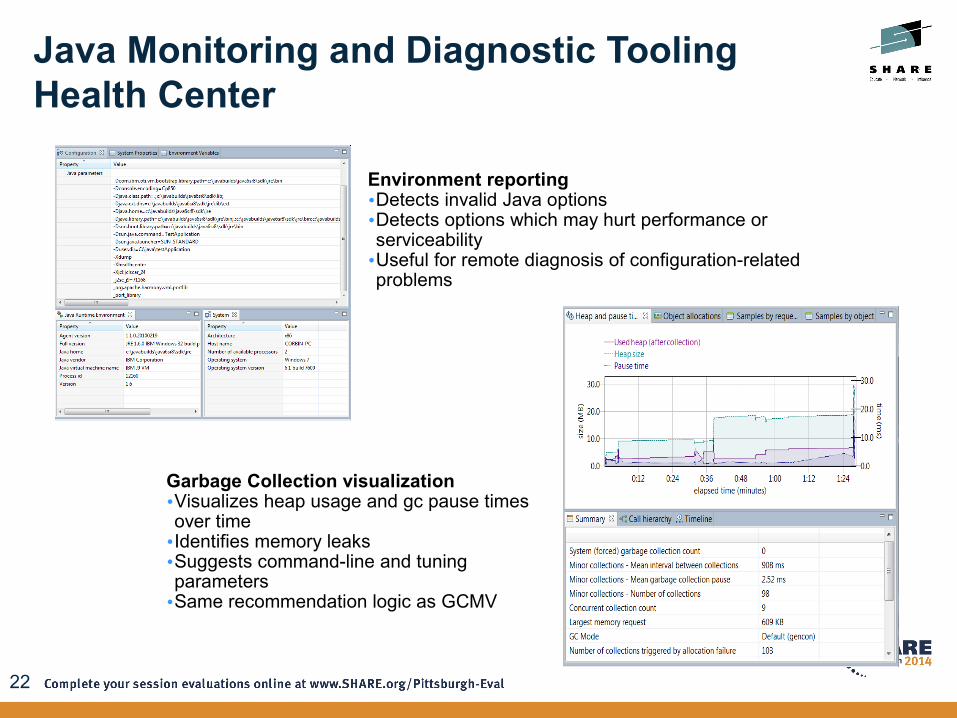
Environment reporting•Detects invalid Java options•Detects options which may hurt performance or serviceability•Useful for remote diagnosis of configuration-related problems
Garbage Collection visualization•Visualizes heap usage and gc pause times over time•Identifies memory leaks•Suggests command-line and tuning parameters•Same recommendation logic as GCMV
Java Monitoring and Diagnostic ToolingHealth Center
23
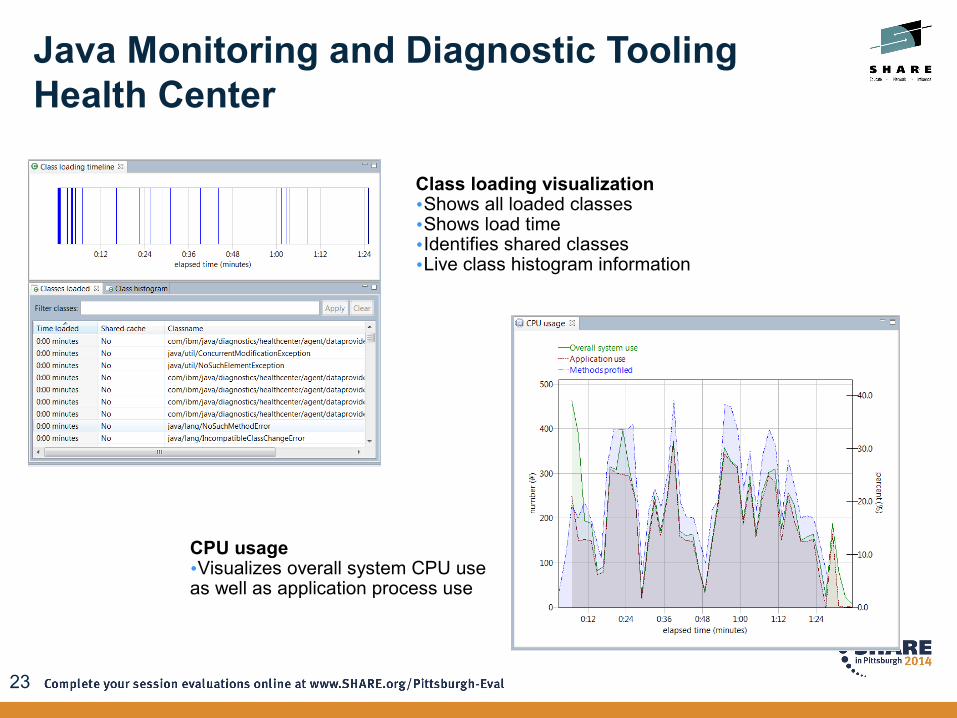
Class loading visualization•Shows all loaded classes•Shows load time•Identifies shared classes•Live class histogram information
CPU usage•Visualizes overall system CPU use as well as application process use
Java Monitoring and Diagnostic ToolingHealth Center
24
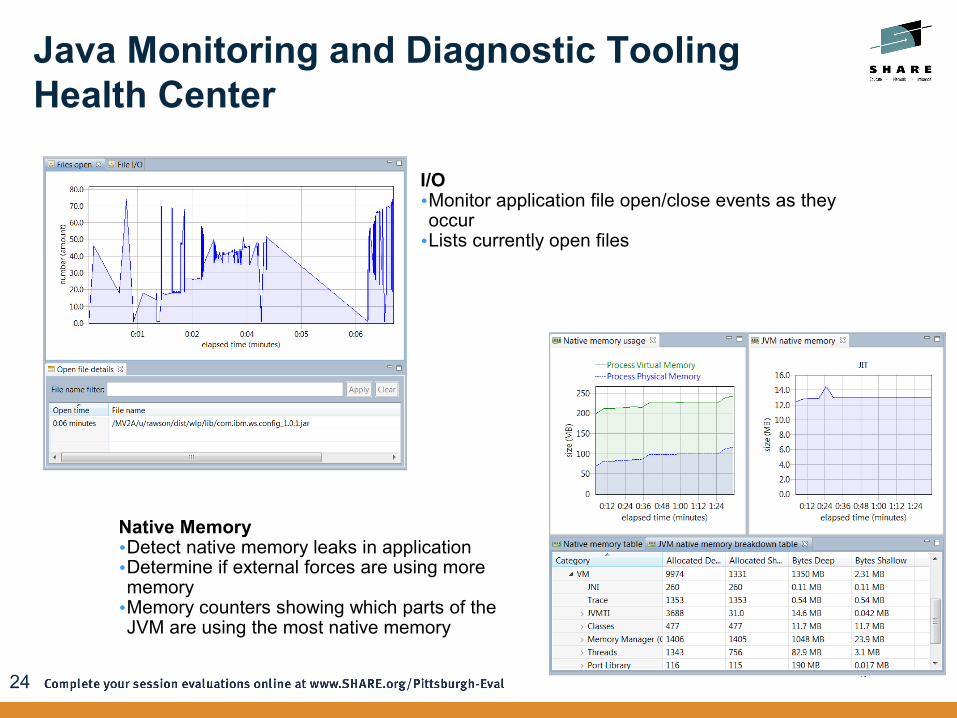
I/O•Monitor application file open/close events as they occur•Lists currently open files
Native Memory•Detect native memory leaks in application•Determine if external forces are using more memory•Memory counters showing which parts of the JVM are using the most native memory
Java Monitoring and Diagnostic ToolingHealth Center
25
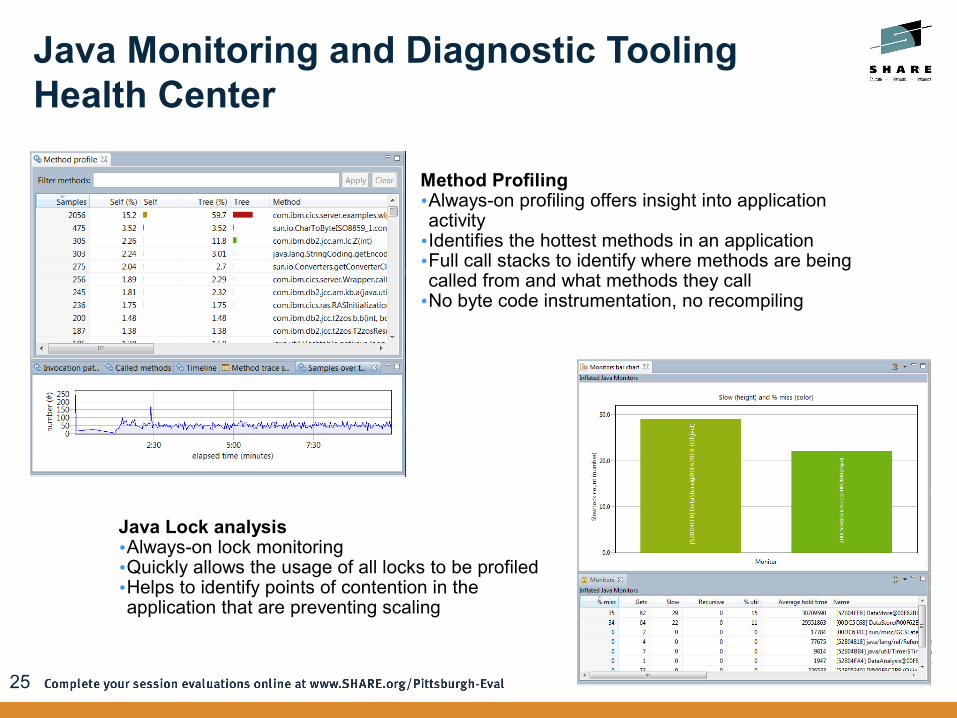
Method Profiling•Always-on profiling offers insight into application activity•Identifies the hottest methods in an application•Full call stacks to identify where methods are being called from and what methods they call•No byte code instrumentation, no recompiling
Java Lock analysis•Always-on lock monitoring•Quickly allows the usage of all locks to be profiled•Helps to identify points of contention in the application that are preventing scaling
Java Monitoring and Diagnostic ToolingHealth Center
26
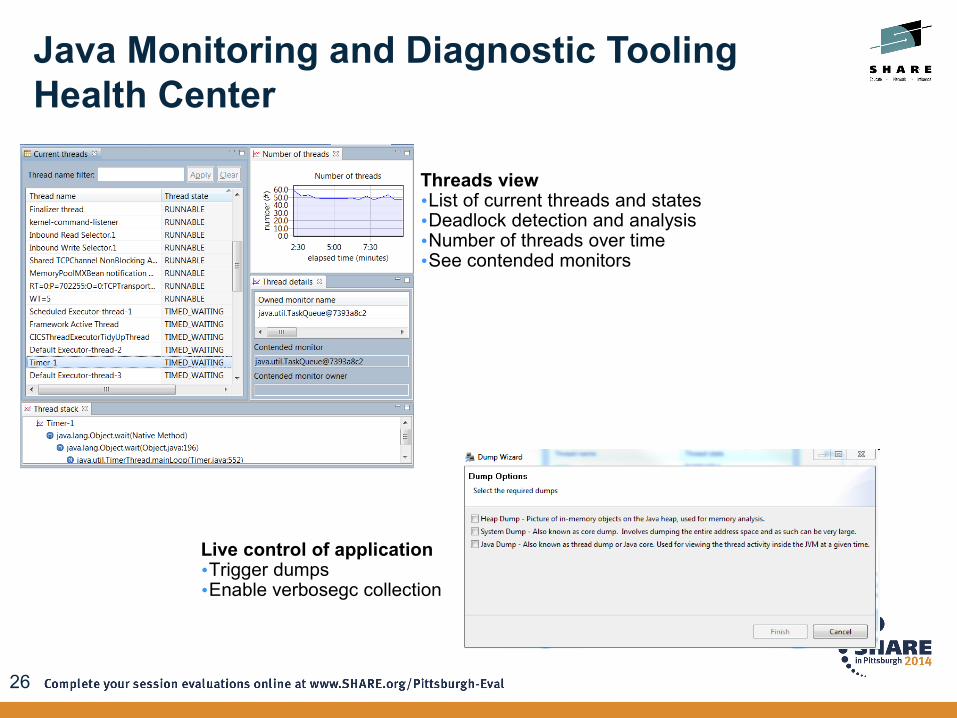
Threads view•List of current threads and states•Deadlock detection and analysis•Number of threads over time•See contended monitors
Live control of application•Trigger dumps•Enable verbosegc collection
Java Monitoring and Diagnostic ToolingHealth Center
27
Java Monitoring and Diagnostic ToolingAgenda
• IBM Monitoring and Diagnostic Tools for Java– Why use the tools?– Where to get the tools?
• IBM Recommended Java Troubleshooting Tools– Health Center– Garbage Collector and Memory Visualizer (GCMV)– Memory Analyzer
• Summary
28
Java Monitoring and Diagnostic ToolingGarbage Collector and Memory Visualizer (GCMV)
Motivating questions:– How is the GC behaving? Can I do better?– How much time is GC taking?– How much free memory does my JVM have?
Overview– Analyze Java verbose GC logs, providing insight into application behaviour– Uses ps -p $PID -o pid,vsz,rss output to plot native footprint– Visualize a wide range of GC data and Java heap statistics over time– Provides the ability to detect memory leaks and optimized GC – Recommendations use heuristics to guide you towards GC performance
tuning
29
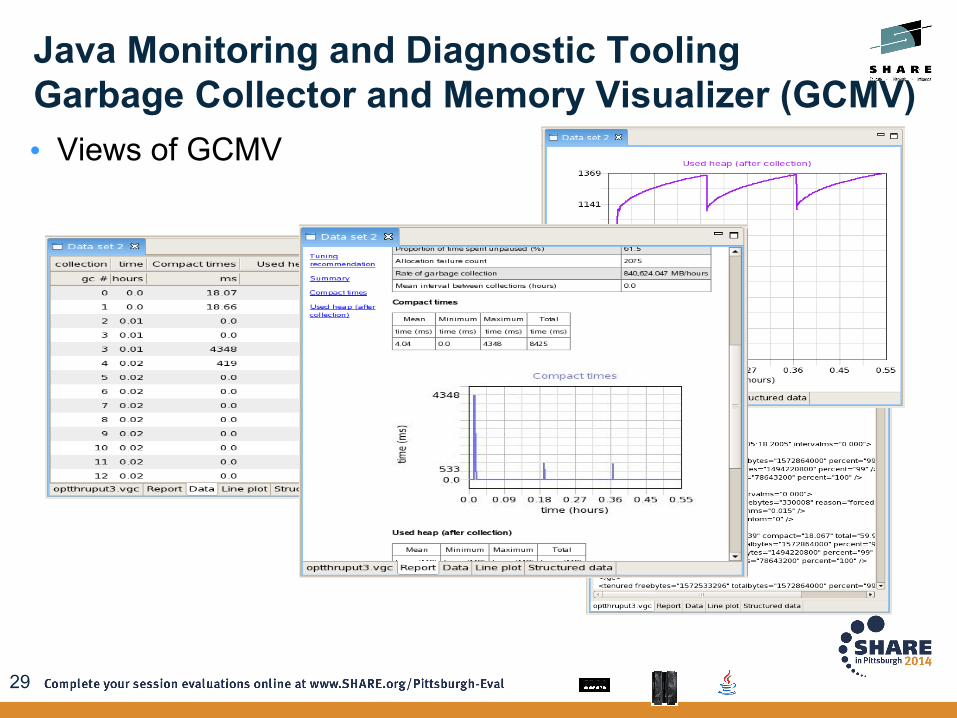
• Views of GCMV
Java Monitoring and Diagnostic ToolingGarbage Collector and Memory Visualizer (GCMV)
30
Java Monitoring and Diagnostic ToolingGarbage Collector and Memory Visualizer (GCMV)
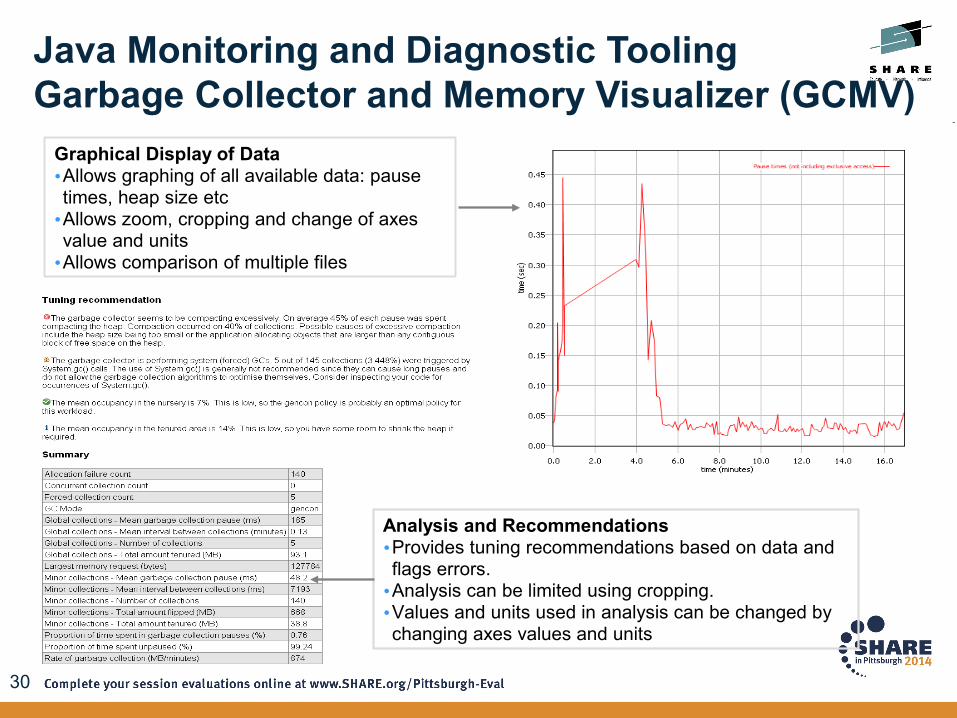
Graphical Display of Data•Allows graphing of all available data: pause times, heap size etc•Allows zoom, cropping and change of axes value and units•Allows comparison of multiple files
Analysis and Recommendations•Provides tuning recommendations based on data and flags errors.•Analysis can be limited using cropping.•Values and units used in analysis can be changed by changing axes values and units
31
Java Monitoring and Diagnostic ToolingAgenda
• IBM Monitoring and Diagnostic Tools for Java– Why use the tools?– Where to get the tools?
• IBM Recommended Java Troubleshooting Tools– Health Center– Garbage Collector and Memory Visualizer – Memory Analyzer
• Summary
32
Motivating questions:– Why did I run out of Java memory?– What’s in my Java heap? How can I explore it and get new insights?
Overview– Tool for analyzing heap dumps and identifying memory leaks from JVMs– Works with IBM system dumps, heapdumps and Sun HPROF binary dumps– Provides memory leak detection, footprint analysis:
Objects by Class, Dominator Tree Analysis, Path to GC Roots, Dominator Tree by Class Loader
– Shows areas of memory wastage:Collections, duplicate strings, substring/char arrays, constant value primitives
– Displays Stack trace with object references– Provides SQL like object query language (OQL)– Provides extension points to write analysis plugins
Java Monitring and Diagnostic ToolingMemory Analyzer
33
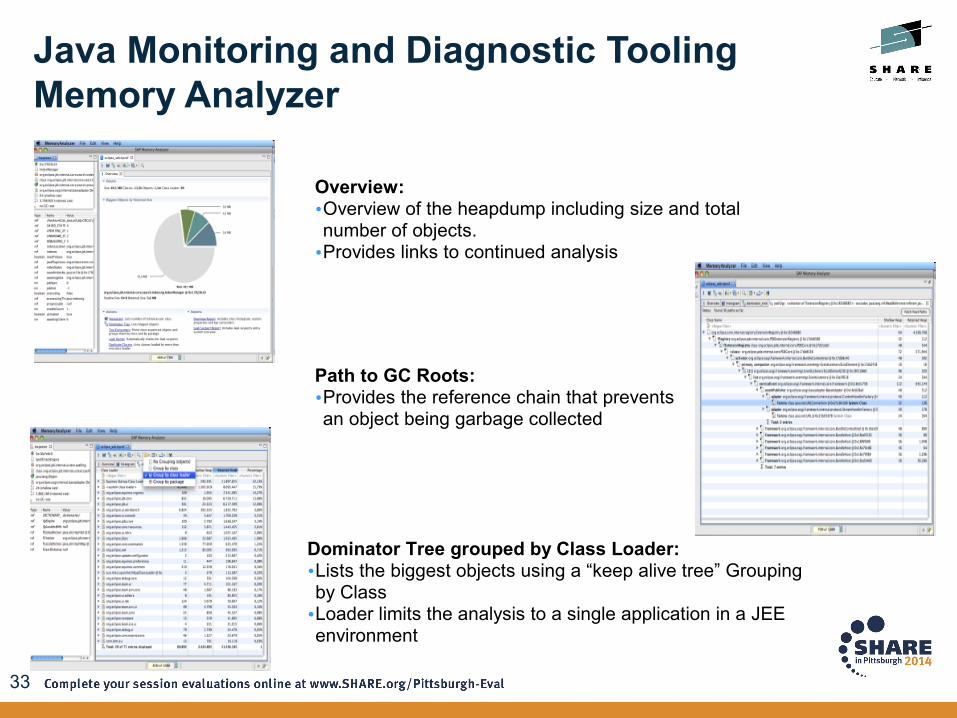
Overview:•Overview of the heapdump including size and total number of objects.•Provides links to continued analysis
Path to GC Roots:•Provides the reference chain that prevents an object being garbage collected
Dominator Tree grouped by Class Loader:•Lists the biggest objects using a “keep alive tree” Grouping by Class•Loader limits the analysis to a single application in a JEE environment
Java Monitoring and Diagnostic ToolingMemory Analyzer
34
Java Monitoring and Diagnostic ToolingAgenda
• IBM Monitoring and Diagnostic Tools for Java– Why use the tools?– Where to get the tools?
• IBM Recommended Java Troubleshooting Tools– Health Center– Garbage Collector and Memory Visualizer – Memory Analyzer
• Summary
35
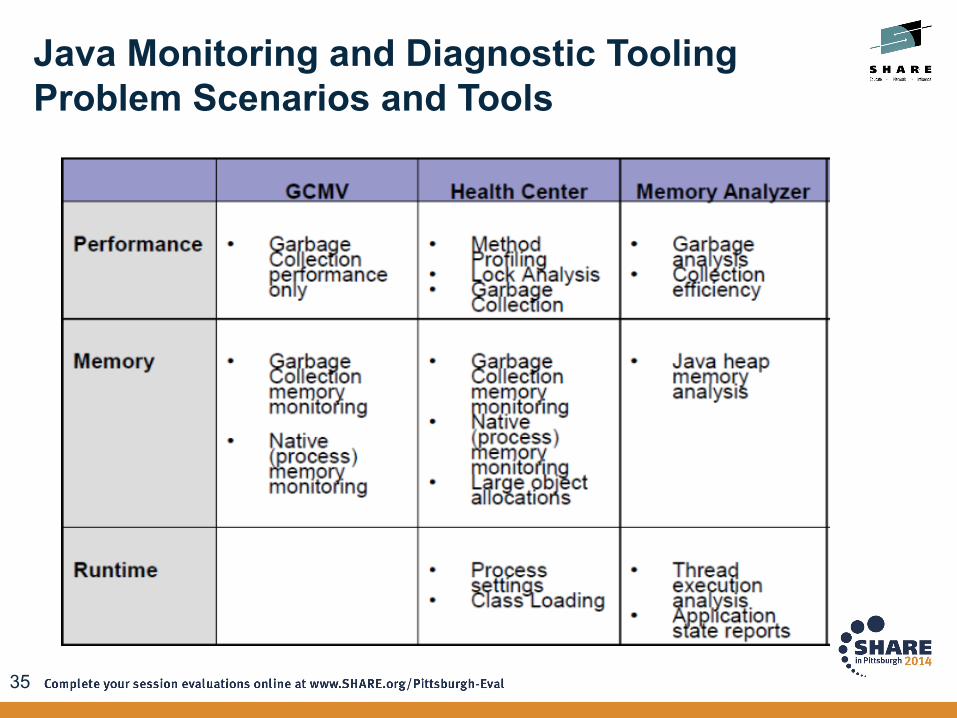
Java Monitoring and Diagnostic ToolingProblem Scenarios and Tools

37
© Copyright IBM Corporation 2012. All rights reserved. The information contained in these materials is provided for informational purposes only, and is provided AS IS without warranty of any kind, express or implied. IBM shall not be responsible for any damages arising out of the use of, or otherwise related to, these materials. Nothing contained in these materials is intended to, nor shall have the effect of, creating any warranties or representations from IBM or its suppliers or licensors, or altering the terms and conditions of the applicable license agreement governing the use of IBM software. References in these materials to IBM products, programs, or services do not imply that they will be available in all countries in which IBM operates. Product release dates and/or capabilities referenced in these materials may change at any time at IBM’s sole discretion based on market opportunities or other factors, and are not intended to be a commitment to future product or feature availability in any way. IBM, the IBM logo, Rational, the Rational logo, Telelogic, the Telelogic logo, and other IBM products and services are trademarks of the International Business Machines Corporation, in the United States, other countries or both. Other company, product, or service names may be trademarks or service marks of others.
38
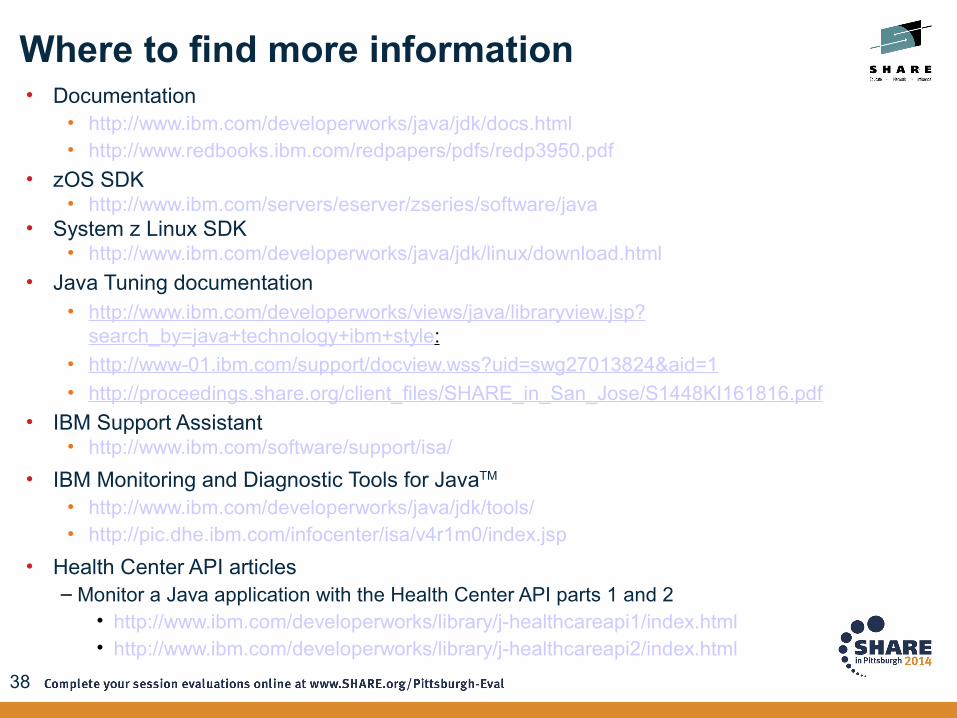
• Documentation• http://www.ibm.com/developerworks/java/jdk/docs.html• http://www.redbooks.ibm.com/redpapers/pdfs/redp3950.pdf
• zOS SDK• http://www.ibm.com/servers/eserver/zseries/software/java
• System z Linux SDK• http://www.ibm.com/developerworks/java/jdk/linux/download.html
• Java Tuning documentation• http://www.ibm.com/developerworks/views/java/libraryview.jsp?
search_by=java+technology+ibm+style:• http://www-01.ibm.com/support/docview.wss?uid=swg27013824&aid=1• http://proceedings.share.org/client_files/SHARE_in_San_Jose/S1448KI161816.pdf
• IBM Support Assistant• http://www.ibm.com/software/support/isa/
• IBM Monitoring and Diagnostic Tools for JavaTM
• http://www.ibm.com/developerworks/java/jdk/tools/• http://pic.dhe.ibm.com/infocenter/isa/v4r1m0/index.jsp
• Health Center API articles – Monitor a Java application with the Health Center API parts 1 and 2
• http://www.ibm.com/developerworks/library/j-healthcareapi1/index.html• http://www.ibm.com/developerworks/library/j-healthcareapi2/index.html
Where to find more information