Embed Size (px)
Citation preview
Technical Report NREL/TP-6A2-44853 March 2009
Solar Photovoltaic Financing: Residential Sector Deployment Jason Coughlin and Karlynn Cory
National Renewable Energy Laboratory 1617 Cole Boulevard, Golden, Colorado 80401-3393 303-275-3000 • www.nrel.gov
NREL is a national laboratory of the U.S. Department of Energy Office of Energy Efficiency and Renewable Energy Operated by the Alliance for Sustainable Energy, LLC
Contract No. DE-AC36-08-GO28308
Technical Report NREL/TP-6A2-44853 March 2009
Solar Photovoltaic Financing: Residential Sector Deployment Jason Coughlin and Karlynn Cory
Prepared under Task No. PVC7.8501
NOTICE
This report was prepared as an account of work sponsored by an agency of the United States government. Neither the United States government nor any agency thereof, nor any of their employees, makes any warranty, express or implied, or assumes any legal liability or responsibility for the accuracy, completeness, or usefulness of any information, apparatus, product, or process disclosed, or represents that its use would not infringe privately owned rights. Reference herein to any specific commercial product, process, or service by trade name, trademark, manufacturer, or otherwise does not necessarily constitute or imply its endorsement, recommendation, or favoring by the United States government or any agency thereof. The views and opinions of authors expressed herein do not necessarily state or reflect those of the United States government or any agency thereof.
Available electronically at http://www.osti.gov/bridge
Available for a processing fee to U.S. Department of Energy and its contractors, in paper, from:
U.S. Department of Energy Office of Scientific and Technical Information P.O. Box 62 Oak Ridge, TN 37831-0062 phone: 865.576.8401 fax: 865.576.5728 email: mailto:[email protected]
Available for sale to the public, in paper, from: U.S. Department of Commerce National Technical Information Service 5285 Port Royal Road Springfield, VA 22161 phone: 800.553.6847 fax: 703.605.6900 email: [email protected] online ordering: http://www.ntis.gov/ordering.htm
Printed on paper containing at least 50% wastepaper, including 20% postconsumer waste
iii
Acknowledgements
This work was funded by the U.S. Department of Energy’s (DOE) Solar Program and the authors wish to thank participating DOE staffers Tom Kimbis and Charles Hemmeline for providing useful insights and the overall direction of this project. The authors are also grateful for the guidance and helpful input of the project managers, Robert Margolis and Selya Price, of the National Renewable Energy Laboratory (NREL). The authors also thank Charles Coggeshall, an intern at NREL, who helped with preliminary research that set the foundation for this paper. We would also like to thank the individuals who reviewed various drafts of this report, including Doug Arent, Margaret Mann, and Paul Schwabe of NREL; Shaun Chapman of Vote Solar; Sarah Truitt of Sentech, Inc.; and Mark Bolinger and Ryan Wiser from the Lawrence Berkeley National Laboratory. The authors also thank the interviewees for reviewing our descriptions of their programs and activities in the market and providing additional clarifications. Thank you to representatives from the City of Berkeley, the City of Ellensburg, Washington, Clean Energy Associates, the Connecticut Clean Energy Fund, the Connecticut Solar Lease Program and its partners, REC Solar, Sacramento Municipal Utility District, SolarCity, State Farm Insurance, SunRun, Inc., and the Urban Fund, Inc. Finally, the authors also offer their deep gratitude to Jennifer Josey of the NREL Technical Communications Office for providing fantastic editorial support, and to NREL’s Jim Leyshon and Ray David for their graphic support.
iv
List of Acronyms
ACP Alternative Compliance Payment APS Arizona Public Service BEF Bonneville Environmental Foundation CCEF Connecticut Clean Energy Fund CSI California Solar Initiative CWU Central Washington University DOE U.S. Department of Energy DSIRE Database of State Incentives for Renewables and Efficiency EIA Energy Information Administration EPBB Expected Performance Based Buydown FIRST Financing Initiative for Renewable and Solar Technologies IRS Internal Revenue Service ITC Investment tax credit (federal) kW Kilowatt kWh Kilowatt-hour LEED Leadership in Energy and Environmental Design MW Megawatt MWh Megawatt-hour NREL National Renewable Energy Laboratory NYSERDA New York State Energy Research and Development Authority PBI Performance-based incentive PG&E Pacific Gas & Electric PPA Power purchase agreement PSE&G Public Service Enterprise Group PV Photovoltaic REC Renewable energy certificate RFP Request for proposals RPS Renewable portfolio standard SAM Solar Advisor Model SBC System benefit charge SCE Southern California Edison SDG&E San Diego Gas & Electric SEIA Solar Energy Industry Association SHW Solar hot water SMUD Sacramento Municipal Utility District SREC Solar renewable energy certificate
v
Executive Summary
Financing the cost of a residential photovoltaic (PV) system remains a challenge despite the various financial incentives available to homeowners at both the state and federal level. Traditionally, homeowners installing residential PV systems have used home equity loans, mortgage loans, or cash in combination with federal, state, and utility incentives to finance the total cost of the system, all of which are briefly described. More recently however, a number of new financial models have been developed to lower the financial burden associated with the installation of a residential PV system:
• Third-party ownership models like the solar lease and the residential power purchase agreement (PPA) can take advantage of more tax incentives than the homeowner to reduce the up-front costs of installing a PV system. In addition, these models can eliminate the operations and maintenance responsibilities for the homeowner—a very appealing concept for those intimidated by roof-top solar power. As a result, these third-party models are attractive alternatives to direct ownership of a residential PV system.
• The property tax assessment model offers long-term financing options for homeowners and facilitates the transfer of system ownership when the house is sold.
• Monetizing the value of the environmental attributes of PV through the sale of solar renewable energy certificates (SREC) creates a stream of cash that can be used to repay solar loans that financed the system.
In addition to these single homeowner solutions, a number of community-based solar programs have been developed across the country to lower the barriers to solar electricity:
• Communities can jointly finance large PV systems so that individual homeowners receive proportional ownership in the value of the electricity generated in return.
• Utilities can create programs to help finance new, large-scale, local PV projects on behalf of their customers. By supporting large, centrally-located generation, the utility can help capture the benefits of economies of scale, thus lowering costs for their customers interested in solar. In addition, the customers may not have to pay for the up-front costs of the system, they receive a credit for power generated, and can participate even if they live in a rental property or an apartment building (not suitable for new PV).
• Neighbors can band together to negotiate a collective installation agreement for many individual systems to take advantage of economies of scale.
An analysis examined the importance of various incentives, and the need for financing to support residential solar PV at three specific locations: 1) Sacramento, California, 2) Boulder, Colorado, and 3) Newark, New Jersey. The examples demonstrated the balance between costs and revenues. Although a PV system creates significant value over a 20-year period (up to 76-109% of the initial system cost, thanks to incentives and renewable attribute markets), the up-front financing cost is still significant. In the three examples, the up-front need for capital ranged from $12,000 in Newark to $23,000 in Sacramento. This report presents the information that homeowners and policy makers need to facilitate PV financing at the residential level. The full range of cash payments, bill savings, and tax incentives is covered, as well as potentially available solar attribute payments. Traditional financing is also compared to innovative solutions, many of which are borrowed from the commercial sector.

vi
Together, these mechanisms are evaluated for their effectiveness in making the economic case for a residential PV installation, given its high up-front costs. These programs are presently limited to select locations around the country. By calling attention to these innovative initiatives, this report aims to help policy makers understand the breadth of options that may benefit homeowners interested in installing a residential PV system. To prepare this report, NREL interviewed a number of industry professionals directly engaged in the implementation of these financial models and supplemented this information with in-house research.
vii
Table of Contents
List of Figures ............................................................................................................................... ix List of Tables ................................................................................................................................ ix
1.0 Introduction ............................................................................................................................. 1
2.0 PV Systems: Utility Bill Savings and Net Metering Benefits .............................................. 3
2.1 Electric Utility Bill Savings .................................................................................................3 2.2 Net Metering ........................................................................................................................5
3.0 Cash Incentives for Residential PV ....................................................................................... 7
3.1 California .............................................................................................................................9 3.1.1 PV Incentives for Existing Homes ............................................................................. 9
3.2 New York ...........................................................................................................................10 3.2.1 PV Incentives for Existing Homes ........................................................................... 10 3.2.2 New York Energy $martSM Loan Program .............................................................. 10
4.0 RECs Overview and Background ....................................................................................... 12
5.0 Tax Incentives Available for Residential PV ...................................................................... 14
5.1 Federal Tax Incentives for Residential Solar .....................................................................14 5.2 State and Local Tax Incentives for Residential Solar ........................................................15
5.2.1 Louisiana Solar and Wind Residential Tax Credit .................................................. 17 5.2.2 New York State Income Tax Credit ......................................................................... 17
6.0 Calculating Residential PV Systems’ Cost Over 20 years ................................................. 18
6.1 Average Cost for a Residential PV System .......................................................................18 6.2 Sales, Property, and State Income Taxes ...........................................................................18 6.3 Electricity Production Over 20 Years ................................................................................18 6.4 Initial System Cost .............................................................................................................19 6.5 Utility Bill Savings from Electricity Produced ..................................................................19 6.6 Cash Incentives ..................................................................................................................20 6.7 Federal Investment Tax Credit ...........................................................................................21 6.8 Summary of Incentives ......................................................................................................21
6.8.1 Sacramento, California ............................................................................................ 21 6.8.2 Boulder, Colorado .................................................................................................... 22 6.8.3 Newark, New Jersey ................................................................................................ 23
7.0 Traditional PV Financing .................................................................................................... 24
7.1 Tools to Estimate the Cost of a PV System .......................................................................24 7.1.1 New York and the Clean Power Estimator .............................................................. 24 7.1.2 The Solar Advisor Model ......................................................................................... 25
7.2 Traditional Finance Models for Residential PV ................................................................25 7.2.1 California Example: SunPower and New Resource Bank ....................................... 26
viii
8.0 Emerging Financial Structures for Residential PV ........................................................... 27 8.1 Residential PV Financing: Background and Challenges ...................................................27 8.2 Third-party Ownership and the Solar Lease ......................................................................28
8.2.1 SolarCity .................................................................................................................. 28 8.2.2 Connecticut Solar Lease Program ............................................................................ 30 8.2.3 Solar Lease Model Summary ................................................................................... 31
8.3 Third-party Ownership and the Power Purchase Agreement ............................................31 8.3.1 Third-party Ownership Example: SunRun, Inc. ...................................................... 32
8.4 Property Tax Assessment Model .......................................................................................33 8.4.1 Sustainable Energy Financing District: The City of Berkeley's FIRST Initiative ... 34
8.5 Using Renewable Energy Certificates as a Currency to Repay Loans ..............................35 8.5.1 New Jersey PSE&G Solar Loan Program ................................................................ 36
8.6 Summary of Residential Finance Models ..........................................................................37
9.0 Community Solar .................................................................................................................. 40 9.1 Ellensburg, Washington: Virtual Net Metering .................................................................40 9.2 Sacramento Municipal Utility District (SMUD) SolarShares Program .............................41 9.3 St. George, Utah: SunSmart Community Solar .................................................................42 9.4 Achieving Economies of Scale through Neighborhood Projects .......................................43
9.4.1 Downtown San Jose Solar Project ........................................................................... 43 9.4.2 SolarCity's Community Solar Discount Program .................................................... 43
9.5 Mosier Creek Homes, Oregon ...........................................................................................43
10.0 Conclusion ........................................................................................................................... 45
References .................................................................................................................................... 47
Appendix 1. Homeowners Insurance ........................................................................................ 54
ix
List of Figures
Figure 1. On-site generation and net metering................................................................................ 3 Figure 2. Average residential retail electricity price in August 2008 ............................................. 4 Figure 3. States with system benefit charged-funded programs for renewable energy .................. 8 Figure 4. State income tax credits and deductions for renewable energy ..................................... 15 Figure 5. State sales tax exemptions for renewable energy .......................................................... 16 Figure 6. States with local property tax exemptions for renewables ............................................ 16 Figure 7. Total PV system cost to Sacramento homeowner, including incentives ....................... 22 Figure 8. Total PV system cost to Boulder homeowner, including incentives ............................. 22 Figure 9. Total PV system cost to Newark homeowner, including incentives ............................. 23 Figure 10. The residential power purchase agreement ................................................................. 32 List of Tables
Table 1. Average Annual and 20-Year Electricity Production of 4 kW PV System .................... 19 Table 2. Electricity Production and 20-Year Electricity Cost of 4 kW PV System ..................... 19 Table 3. Levelized Present Value of Electricity Generated and the Resulting Up-front Cost
Offset ............................................................................................................................... 20 Table 4. Solar PV Net System Cost (2.5 kW DC) for Camillus, NY 13031 ................................ 25 Table 5. Advantages and Disadvantages of Residential Financing Structures ............................. 38

x
1
1.0 Introduction
Until market dynamics significantly improve the economics of PV installations, a number of near-term barriers need to be addressed to accelerate residential deployment of PV. Like other renewable energy technologies, the cost structure of PV is front-loaded, with a high initial investment followed by modest maintenance expenses and essentially zero fuel cost. This up-front cost barrier is being addressed to a certain degree by the availability of financial incentives and the emergence of new financial models which monetize these incentives in creative ways. If the right incentives and structures can be put into place, the opportunity for residential PV is significant. According to the U.S. Census Bureau's 2005 American Community Survey, there are an estimated 60,420,000 detached, owner-occupied, residential homes in the United States (U.S. Census Bureau 2006). Using data from the 2007 Buildings Energy Data Book, these homes consumed approximately 737 billion kWh of electricity in 2005.1
Under a basic revenue analysis, residential PV systems produce two commodities of value: 1) electricity and 2) the environmental attributes of that electricity. The production of these commodities can be financed directly by cash incentives provided by the state and local utility, federal and state tax credits, through the sales of renewable energy certificates (RECs), or indirectly by third parties who can more efficiently monetize these incentives for the benefit of the homeowner. While traditional models for financing residential systems are well-understood,
If only 1% of this electricity demand was generated by solar (assuming a capacity factor of 14%), approximately 6,000 MW of PV capacity would be needed. This is 40 times the 150 MW of grid-tied PV that was installed in the United States in 2007 (SEIA 2008). The installation of PV systems on single family, owner-occupied dwellings has been taking place for a number of decades at a modest level as homeowners seek to lower their utility bills, reduce their dependence on the retail utility grid, and demonstrate a commitment to the environment. Traditionally, homeowners have financed these systems with cash, home equity loans, or refinanced mortgage loans. However, since 2007, a number of new financing mechanisms have been introduced to the market place to address the high up-front costs of installing a PV system on a residential rooftop. Solar leases, residential power purchase agreements, property-tax assessment models, and renewable energy credit-based loans are now available. However, most of these new models are offered within a very limited geographic region, where local financial incentives make the economics of residential PV most attractive. There are also many promising community-based PV deployment models emerging across the country. These community-based models seek to address the needs of people who would like to "go solar" but lack either the financial resources for an individual system, live in homes with poor solar resources, or live in a rental property or apartment building where PV is not an option. Community solar projects are also springing up where neighbors join forces to negotiate discounts on PV purchase prices as a result of buying in bulk and coordinating the installations.
1 According to the 2007 Buildings Energy Data Book, the residential sector consumed 4.66 quadrillion btus in 2005. According to the 2005 American Community Survey, 54% of the 111 million residential homes in the United States are detached, owner-occupied dwellings. 54% of 4.66 quadrillion btus is equal to 2.5 quadrillion btus which was then converted to 737 billion kWh.
2
there are a host of new and creative financial structures that have been developed with the goal of broadening the access to PV-generated electricity at the residential level. This report examines the incentives available to reduce the cost of owning and operating a PV system and creative ways to combine them into a comprehensive financial package for residential PV systems. Section 2 examines the electric utility bill savings, including potential net metering credits from excess generation. Section 3 discusses the cash incentives available in certain jurisdictions that reduce the up-front costs associated with the installation of a PV system and provide on-going cash payments based on the output of the system. Section 4 explains the role of RECs while Section 5 wraps up the discussion on incentives by highlighting the role that tax incentives play in improving the economics of PV. Section 6 provides an analysis on how various incentives are combined in three states to highlight the importance of various cash incentives, tax credits, and solar RECs at the local level. Existing financing models are briefly reviewed in Section 7, followed by an in-depth examination in Section 8 of the emerging financial structures for homeowners and community-based solar initiatives. Community-based solar programs for people who rent, live in apartment buildings, or own homes with poor solar resources are discussed in Section 9.
3
2.0 PV Systems: Utility Bill Savings and Net Metering Benefits
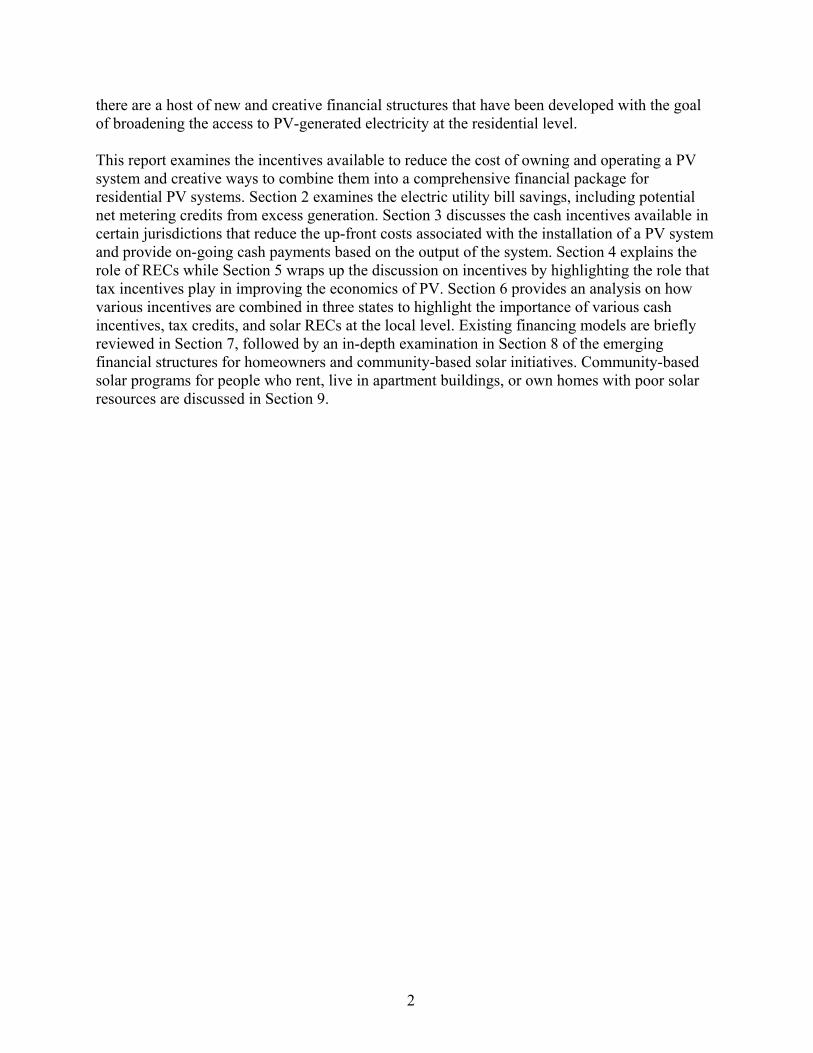
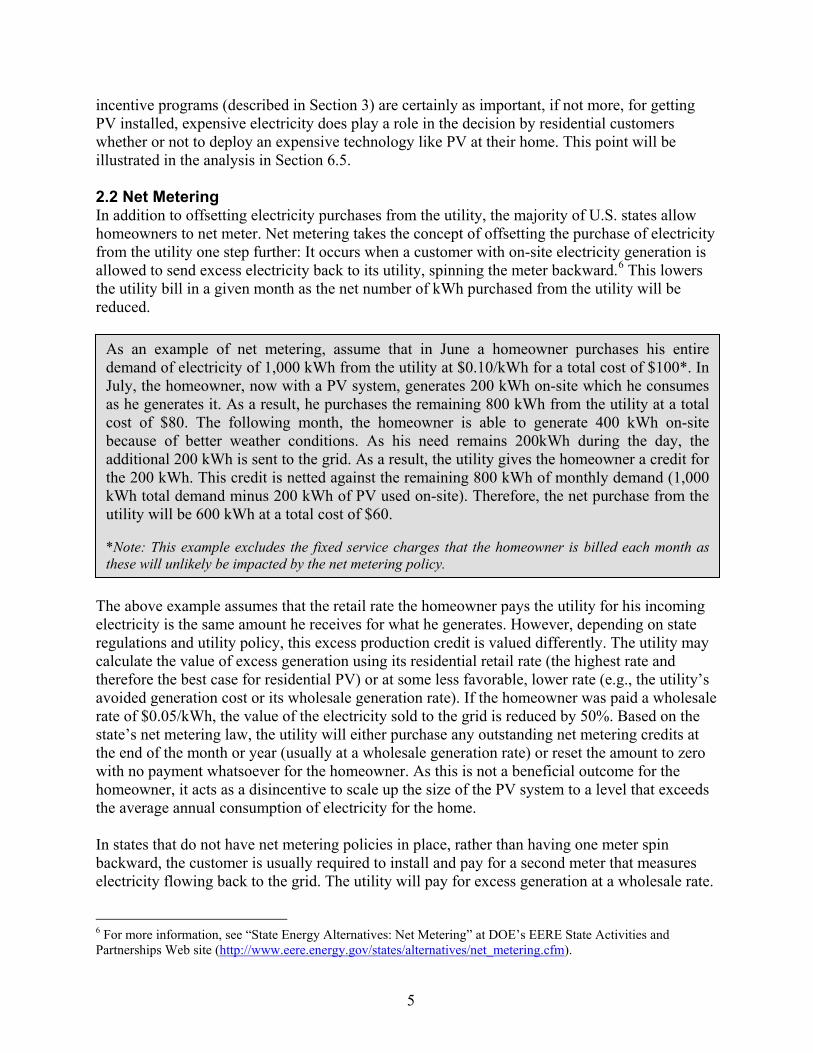
Homeowners primarily install PV systems to reduce their utility bills. Some also install the systems for environmental reasons. In cases where homes are not connected to the grid, PV often represents a primary option for power. For the majority of homes that are grid-connected, this section examines the concept of utility bill savings from the production of electricity on-site as well as the ability to generate net metering credits as a result of producing more electricity than what is needed at the home. 2.1 Electric Utility Bill Savings A PV system installed on a home is located “behind-the-meter,” meaning the on-site generation is fed directly into the house for its use (see Figure 1). Therefore, the electricity produced by the PV system reduces the amount that needs to be purchased from the local utility, or load-serving entity2 leading to a lower monthly utility bill.3
Figure 1. On-site generation and net metering
2 A load serving entity includes: 1) investor-owned utilities in regulated electricity markets; 2) default/standard offer utilities in restructured electricity markets (or deregulated generation markets); and 3) competitive retail electricity suppliers in restructured electricity markets. 3 This assumes all else is equal in terms of kWh consumed each month and the price paid per kWh. In addition, the homeowner should not plan on a reduction in the monthly fixed charge for utility service when calculating the savings from installing a PV system as these charges are unlikely to change by much, if at all.
4
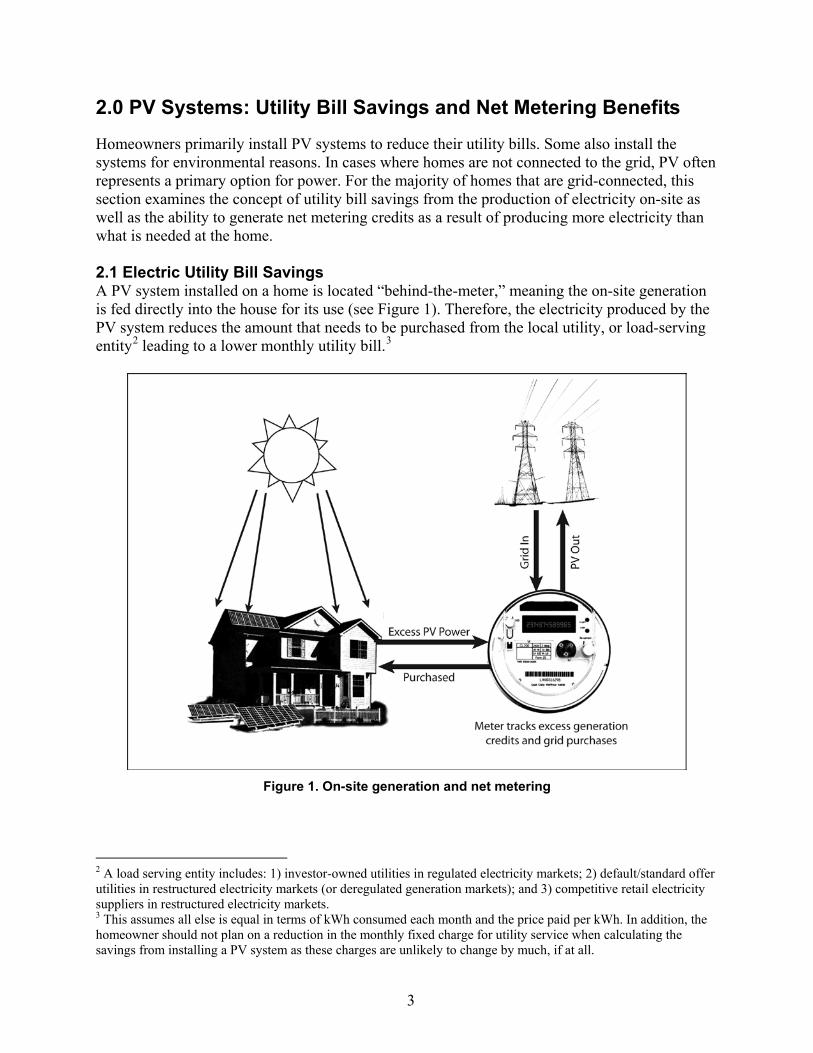
The actual residential retail rate per kWh avoided by generating on-site power depends on the location of the customer and possibly the season and time of day.4
Average Retail Price of ElectricityResidential Customers
(Cents per Kilowatthour)
Source: EIA Electric Power Monthly — Table 5.6.A — Average Retail Price of Electricity to Ultimate Customers by End-User Sector, by State for August 2008
20.9
7.8
8.6
15.1
11.2
17.0
36.0
10.8 11.1
8.9 11.1
8.77.6
9.9 8.3
8.8
9.1
9.9
10.6
13.811.9
10.0
9.1
10.6
10.0
11.711.8
10.8 9.1 10.8
8.0
8.7
11.2 10.9 11.110.4
12.1
10.0
10.87.5
12.0
20.9
16.1
16.0
14.7
18.018.2
14.514.4
18.0
17+15.0 - 16.913.0 - 14.911.0 - 12.9
9.0 - 10.97.0 - 8.9
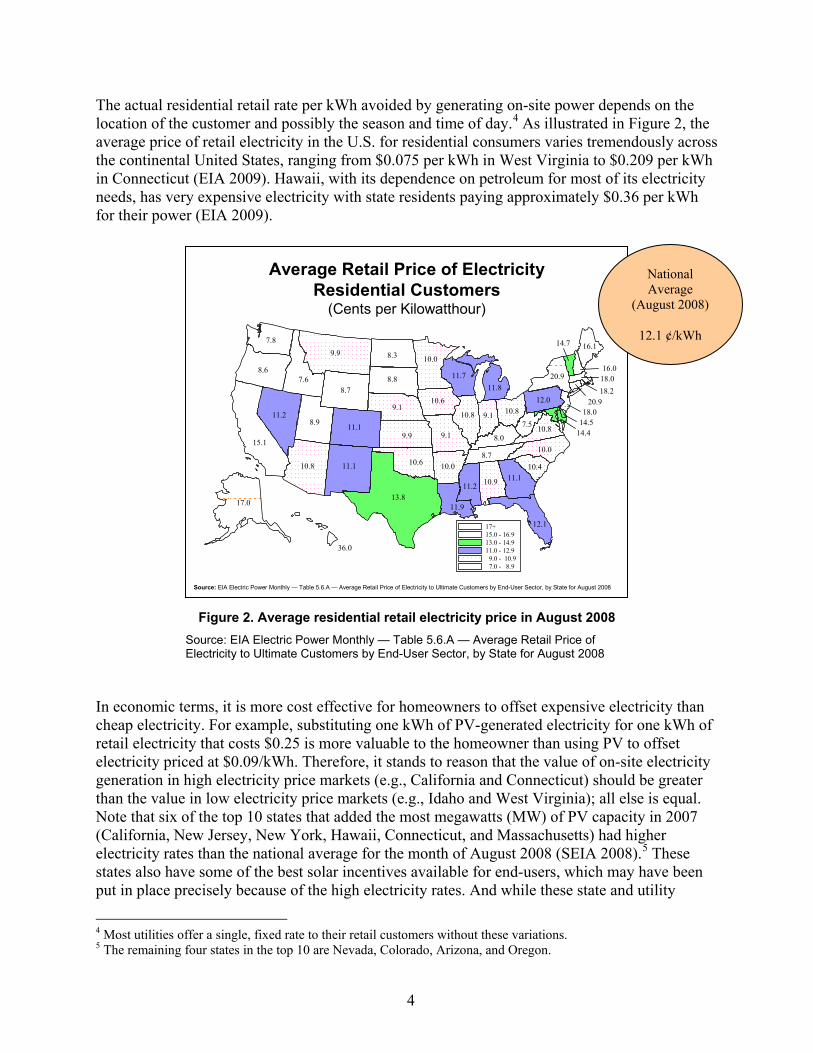
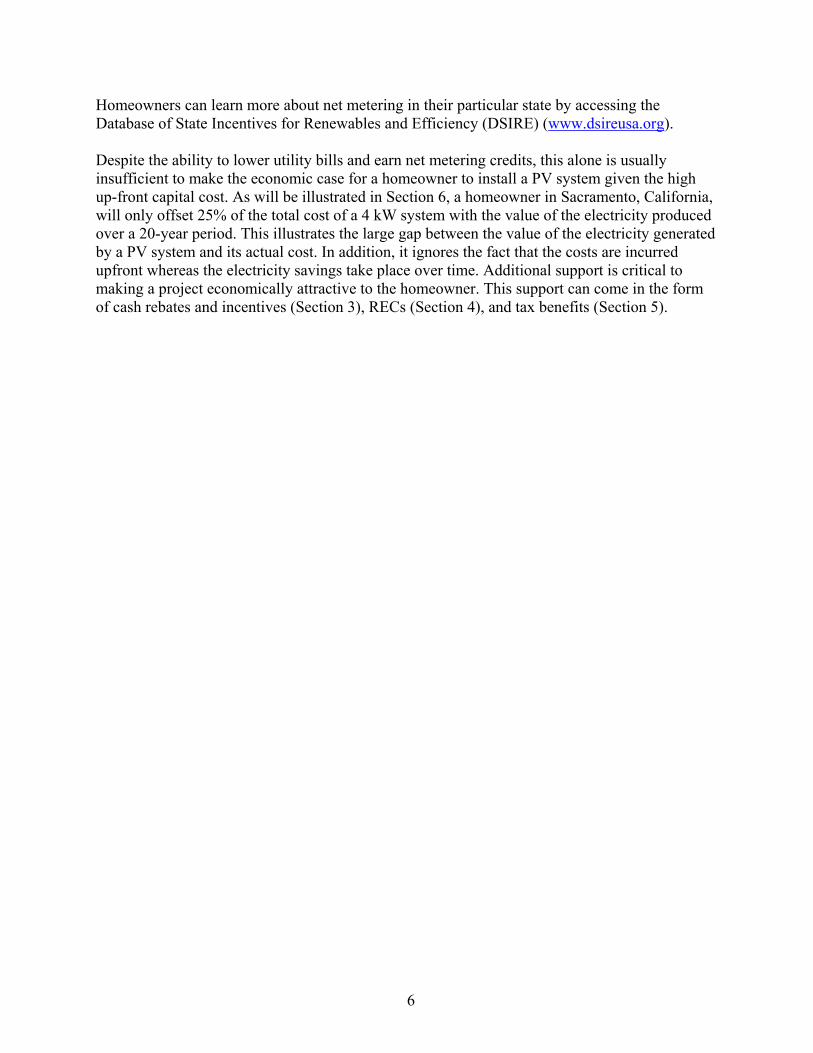
As illustrated in Figure 2, the average price of retail electricity in the U.S. for residential consumers varies tremendously across the continental United States, ranging from $0.075 per kWh in West Virginia to $0.209 per kWh in Connecticut (EIA 2009). Hawaii, with its dependence on petroleum for most of its electricity needs, has very expensive electricity with state residents paying approximately $0.36 per kWh for their power (EIA 2009).
Figure 2. Average residential retail electricity price in August 2008
Source: EIA Electric Power Monthly — Table 5.6.A — Average Retail Price of Electricity to Ultimate Customers by End-User Sector, by State for August 2008
In economic terms, it is more cost effective for homeowners to offset expensive electricity than cheap electricity. For example, substituting one kWh of PV-generated electricity for one kWh of retail electricity that costs $0.25 is more valuable to the homeowner than using PV to offset electricity priced at $0.09/kWh. Therefore, it stands to reason that the value of on-site electricity generation in high electricity price markets (e.g., California and Connecticut) should be greater than the value in low electricity price markets (e.g., Idaho and West Virginia); all else is equal. Note that six of the top 10 states that added the most megawatts (MW) of PV capacity in 2007 (California, New Jersey, New York, Hawaii, Connecticut, and Massachusetts) had higher electricity rates than the national average for the month of August 2008 (SEIA 2008).5
4 Most utilities offer a single, fixed rate to their retail customers without these variations. 5 The remaining four states in the top 10 are Nevada, Colorado, Arizona, and Oregon.
These states also have some of the best solar incentives available for end-users, which may have been put in place precisely because of the high electricity rates. And while these state and utility
National Average
(August 2008)
12.1 ¢/kWh
5
incentive programs (described in Section 3) are certainly as important, if not more, for getting PV installed, expensive electricity does play a role in the decision by residential customers whether or not to deploy an expensive technology like PV at their home. This point will be illustrated in the analysis in Section 6.5. 2.2 Net Metering In addition to offsetting electricity purchases from the utility, the majority of U.S. states allow homeowners to net meter. Net metering takes the concept of offsetting the purchase of electricity from the utility one step further: It occurs when a customer with on-site electricity generation is allowed to send excess electricity back to its utility, spinning the meter backward.6
The above example assumes that the retail rate the homeowner pays the utility for his incoming electricity is the same amount he receives for what he generates. However, depending on state regulations and utility policy, this excess production credit is valued differently. The utility may calculate the value of excess generation using its residential retail rate (the highest rate and therefore the best case for residential PV) or at some less favorable, lower rate (e.g., the utility’s avoided generation cost or its wholesale generation rate). If the homeowner was paid a wholesale rate of $0.05/kWh, the value of the electricity sold to the grid is reduced by 50%. Based on the state’s net metering law, the utility will either purchase any outstanding net metering credits at the end of the month or year (usually at a wholesale generation rate) or reset the amount to zero with no payment whatsoever for the homeowner. As this is not a beneficial outcome for the homeowner, it acts as a disincentive to scale up the size of the PV system to a level that exceeds the average annual consumption of electricity for the home.
This lowers the utility bill in a given month as the net number of kWh purchased from the utility will be reduced.
In states that do not have net metering policies in place, rather than having one meter spin backward, the customer is usually required to install and pay for a second meter that measures electricity flowing back to the grid. The utility will pay for excess generation at a wholesale rate.
6 For more information, see “State Energy Alternatives: Net Metering” at DOE’s EERE State Activities and Partnerships Web site (http://www.eere.energy.gov/states/alternatives/net_metering.cfm).
As an example of net metering, assume that in June a homeowner purchases his entire demand of electricity of 1,000 kWh from the utility at $0.10/kWh for a total cost of $100*. In July, the homeowner, now with a PV system, generates 200 kWh on-site which he consumes as he generates it. As a result, he purchases the remaining 800 kWh from the utility at a total cost of $80. The following month, the homeowner is able to generate 400 kWh on-site because of better weather conditions. As his need remains 200kWh during the day, the additional 200 kWh is sent to the grid. As a result, the utility gives the homeowner a credit for the 200 kWh. This credit is netted against the remaining 800 kWh of monthly demand (1,000 kWh total demand minus 200 kWh of PV used on-site). Therefore, the net purchase from the utility will be 600 kWh at a total cost of $60. *Note: This example excludes the fixed service charges that the homeowner is billed each month as these will unlikely be impacted by the net metering policy.
6
Homeowners can learn more about net metering in their particular state by accessing the Database of State Incentives for Renewables and Efficiency (DSIRE) (www.dsireusa.org). Despite the ability to lower utility bills and earn net metering credits, this alone is usually insufficient to make the economic case for a homeowner to install a PV system given the high up-front capital cost. As will be illustrated in Section 6, a homeowner in Sacramento, California, will only offset 25% of the total cost of a 4 kW system with the value of the electricity produced over a 20-year period. This illustrates the large gap between the value of the electricity generated by a PV system and its actual cost. In addition, it ignores the fact that the costs are incurred upfront whereas the electricity savings take place over time. Additional support is critical to making a project economically attractive to the homeowner. This support can come in the form of cash rebates and incentives (Section 3), RECs (Section 4), and tax benefits (Section 5).
7
3.0 Cash Incentives for Residential PV
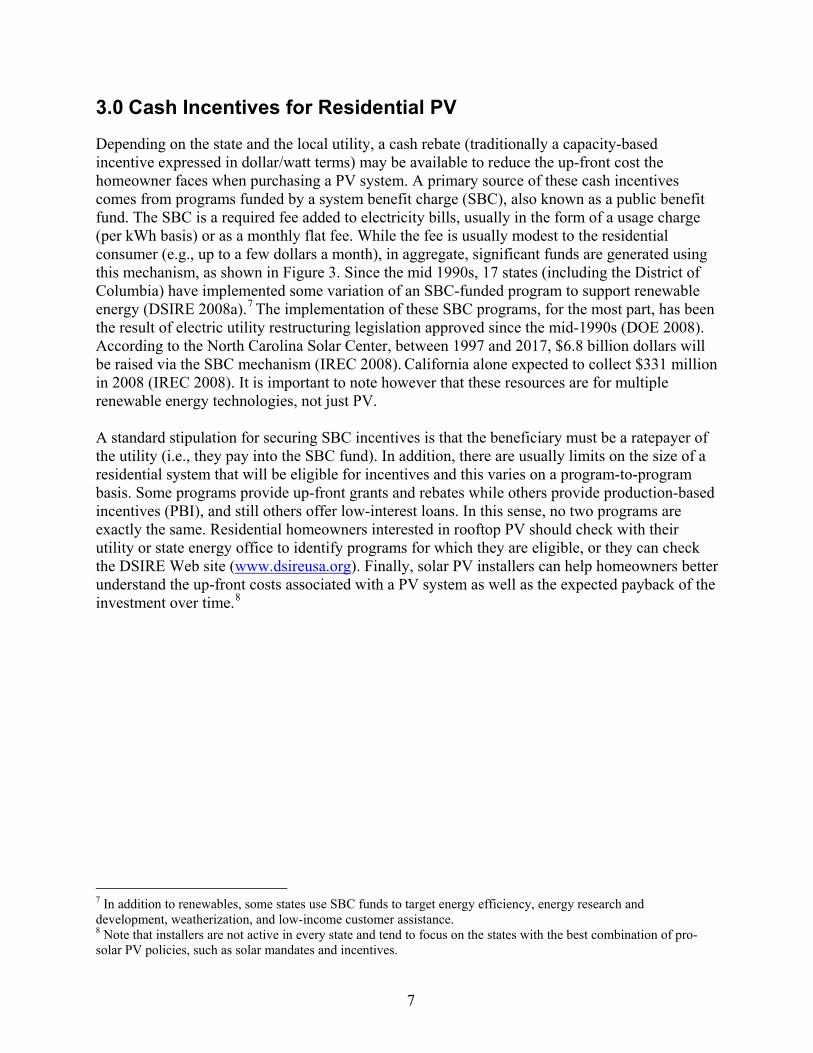
Depending on the state and the local utility, a cash rebate (traditionally a capacity-based incentive expressed in dollar/watt terms) may be available to reduce the up-front cost the homeowner faces when purchasing a PV system. A primary source of these cash incentives comes from programs funded by a system benefit charge (SBC), also known as a public benefit fund. The SBC is a required fee added to electricity bills, usually in the form of a usage charge (per kWh basis) or as a monthly flat fee. While the fee is usually modest to the residential consumer (e.g., up to a few dollars a month), in aggregate, significant funds are generated using this mechanism, as shown in Figure 3. Since the mid 1990s, 17 states (including the District of Columbia) have implemented some variation of an SBC-funded program to support renewable energy (DSIRE 2008a).7
A standard stipulation for securing SBC incentives is that the beneficiary must be a ratepayer of the utility (i.e., they pay into the SBC fund). In addition, there are usually limits on the size of a residential system that will be eligible for incentives and this varies on a program-to-program basis. Some programs provide up-front grants and rebates while others provide production-based incentives (PBI), and still others offer low-interest loans. In this sense, no two programs are exactly the same. Residential homeowners interested in rooftop PV should check with their utility or state energy office to identify programs for which they are eligible, or they can check the DSIRE Web site (
The implementation of these SBC programs, for the most part, has been the result of electric utility restructuring legislation approved since the mid-1990s (DOE 2008). According to the North Carolina Solar Center, between 1997 and 2017, $6.8 billion dollars will be raised via the SBC mechanism (IREC 2008). California alone expected to collect $331 million in 2008 (IREC 2008). It is important to note however that these resources are for multiple renewable energy technologies, not just PV.
www.dsireusa.org). Finally, solar PV installers can help homeowners better understand the up-front costs associated with a PV system as well as the expected payback of the investment over time.8
7 In addition to renewables, some states use SBC funds to target energy efficiency, energy research and development, weatherization, and low-income customer assistance. 8 Note that installers are not active in every state and tend to focus on the states with the best combination of pro-solar PV policies, such as solar mandates and incentives.
8
Figure 3. States with system benefit charged-funded programs for renewable energy
In addition to SBC-funded rebate programs, there are a number of other up-front cash incentives for residential homeowners around the country. For example, San Francisco has recently created a city-level rebate program that offers residents up to $6,000 to install a qualifying PV system (SFGOV 2008). Regardless of the source, receiving a cash rebate in many cases will determine whether or not a homeowner can afford to install a PV system if traditional sources of financing are used. For example, the Arizona Public Service utility (APS) offers a rebate of $3.00/watt for a residential PV system (APS 2008). Therefore, a ratepayer of APS could receive a rebate up to $12,000 on a 4 kW system; which equates to roughly $0.10 per kWh over a 20-year period.9
In addition to these up-front capacity-based incentives, PBIs are also available in certain locations around the country. PBIs help defray the on-going operating and financing costs of a PV system once it has been installed. California's PBI program will be described below for additional detail on this structure. To date, PBIs have traditionally been aimed at non-residential
With an initial installed cost of approximately $33,000, qualifying for a cash incentive equivalent to 36% of the investment will, in all likelihood, be the determining factor whether or not the homeowner can proceed with the project.
9 Using PV Watts 1.0 and assuming an annual degradation factor of 0.5%, a 4 kW system in Phoenix will produce 123,000 kWh. $12,000/123,000 = $0.097/kWh.
9
systems. This is changing as rebate programs adjust their policies to include residential systems in response to changing market conditions and as up-front, capacity-based incentives put pressure on program budgets (a fixed amount of money available for incentives can be spread out over a multi-year period versus paid out in year one). Capturing the full range of the different rebate and incentive programs across the United States is beyond the scope of this paper. However, a brief review of programs in a few states does illustrate the diversity of financial assistance available for homeowners interested in a residential PV installation. As two of the top five states for installed PV capacity in the country, thanks in part to their SBC-funded programs,10
The alternative to the EPBB is the PBI. The PBI is paid out on a monthly basis over a five-year period and is directly related to the number of kilowatt hours (kWh) of electricity produced by the PV system. As the high up-front cost traditionally presents the biggest barrier, it is likely that most residential customers will participate in the EPBB program even though the option to participate in the PBI program exists.
a brief overview of some of the programs in California and New York are presented below.
3.1 California The California Solar Initiative (CSI), funded by an SBC, aims to deploy 3,000 MW of new solar by 2017 (CSI 2009a). Over 10 years, an estimated $3.3 billion will be invested to meet this solar goal. Subsidizing the installation of residential PV systems plays an important role in achieving this 2017 target. 3.1.1 PV Incentives for Existing Homes For existing homes, CSI has two distinct incentive structures. The Expected Performance Based Buydown incentive (EPBB) provides a one-time, up-front payment on a per watt basis. The EPBB is adjusted for the expected performance of the PV system based on the characteristics of the system, including the slope of the roof which can impact the angle of the PV panels; the direction that the panels face (south, west, etc.); and whether or not trees or neighboring buildings shade the panels. This final rebate level adjustment is usually downward so that the dollar amount received by the homeowner is less than what an optimal system would receive.
11
As of February 2009, and according to the CSI statewide trigger point tracker, each utility was offering a different residential rebate (CSI 2009b). Residential utility customers of Pacific Gas & Electric (PG&E) were eligible for an EPBB of $1.55/watt. San Diego Gas & Electric (SDG&E) customers were eligible for an EPBB of $1.90/watt. Residential customers of Southern California
Both the EPBB and the PBI decrease over the 10-year life of the CSI Program. When the CSI was introduced in 2007, the EPBB for residential systems was $2.50/watt. However, it will eventually decline to zero once the target installation capacity for each utility’s service territory is reached. The PBI will exhibit a similar declining pattern over time as well.
10 According to the Prometheus Institute, the top five states in the country for installed PV in order are: California, New Jersey, Nevada, Colorado, and New York. Both Nevada and Colorado benefited from very large PV systems at 14 MW and 8 MW respectively, vaulting them into the top five in 2007. 11 As of January 1, 2008, the EPBB program is capped at systems up to 50 kW. The cap will drop to 30 kW in 2010.
10
Edison (SCE) were eligible for an EPBB of $2.20/watt. At these levels, a 4 kW system installed in the PG&E territory would be eligible for a maximum incentive payment of $6,200. The same 4 kW system installed in the SDG&E territory would be eligible for a maximum incentive payment of $7,600. Finally, the rebate would be $8,800 within the SCE territory. As noted, a homeowner can participate in the PBI program in lieu of taking the up-front incentive. For homeowners who were SCE utility customers as of February 2009, the PBI was 34¢/kWh. Residential customers of SDG&E and PG&E were eligible for a PBI of 26¢/kWh and 22¢/kWh, respectively. By making some assumptions, the value of the PBI can be compared to the EPBB. Over a five-year period, a 4 kW PV system located in San Diego would produce approximately 29,377 kWh of solar electricity.12
In addition to cash incentives, NYSERDA also offers an interest rate buy-down program to homeowners and both programs can be used simultaneously (NYSERDA 2007). In the buy-down program, the homeowner enters into an agreement to borrow money from a participating lender. NYSERDA will make a one-time payment to the lender to bring down the borrower’s
The present value of a 26¢/kWh PBI for this level of production is approximately $6,300, assuming a discount rate of 7%. This compares to an estimated EPBB for the same system of $7,600. While the EPBB appears to be the smarter choice for the homeowner, projects need to be evaluated independently. Certain PV systems may perform better than expected or degrade at a slower rate than assumed, increasing the actual PBI payments received over the five-year period. Conversely, as previously noted, the homeowner may not receive the full EPBB as the expected performance may be less than an optimally-sited system. However, the EPBB will likely be the best option if the homeowner needs the funds upfront to complement other sources of incentives to finance and install the system. 3.2 New York
The New York State Energy and Research Development Authority (NYSERDA) offers a range of programs to lower the cost of PV for residential homeowners. Cash incentives are paid directly to pre-qualified installers who pass the savings on to the homeowner. Incentives are offered on a first-come, first-serve basis until available funds are allocated, with a cap of 10 kW per system. Although NYSERDA had allocated all of its available funding ($13.8 million) for PV incentives as of August 2008, an additional $20.6 million was reallocated to the program on October 28, 2008, to continue to provide incentives for customer-sited PV (NYSERDA 2008a). 3.2.1 PV Incentives for Existing Homes NYSERDA offers a tiered system of incentives for the installation of PV on an existing home. A homeowner is eligible for an incentive of $4.00/watt, up to the first 5 kW (NYSERDA 2008b). The incentive declines to $3.00/watt for the next 5 kW, up to the limit of 10 kW (NYSERDA 2008b). For example, a 7 kW system would be eligible for a maximum incentive payment of $26,000 (5 kW at $4.00/watt and 2 kW at $3.00/watt). Again, as with most programs, the incentives will be adjusted for the expected performance of the system. 3.2.2 New York Energy $martSM Loan Program
12 According to PVWatts Version 1.0 (using default settings for San Diego), and assuming a 1% per annual degradation factor.
11
interest rate by up to 4%.13 For example, if a bank is willing to lend money to a homeowner for a PV system at a rate of 8%, the interest rate will be reduced to 4% after the NYSERDA buy-down. Loans are capped at $20,00014
13 The buy-down can be up to 6% of the total interest rate for ConEdison customers. 14 $30,000 for ConEdison customers.
with a maximum term of 10 years. As illustrated in this section, cash incentives, where available, can offset a considerable percentage of the cost of a residential PV system. In states like California and New York, homeowners are better positioned to finance a PV system than those states without similar incentive programs. Nonetheless, in most cases, additional incentives like RECs (see Section 4) and tax credits (see Section 5) are needed to further drive down the cost of residential PV to more affordable levels.
12
4.0 RECs Overview and Background
In addition to capacity-based and production-based incentives, there is an additional source of cash available to homeowners in certain markets in the United States: renewable energy certificates (RECs).15 RECs are separate from the actual electricity produced, and typically represent the “environmental attributes” of renewable electricity generation.16
The value of RECs is derived from the fact that they have become the dominant mechanism for compliance with Renewable Portfolio Standards (RPS) and for voluntary green power purchase programs. The RPS is a state-level mechanism enacted in 28 states and the District of Columbia that typically requires utilities to meet a certain percentage of its customer electricity demand with renewable energy sources.
One REC usually represents the environmental benefits (or “attributes”) of 1 megawatt-hour (MWh) of renewable electricity generation and is created as the system generates electricity. These attributes can have a significant cash value in certain markets, creating an opportunity for homeowners to sell them upfront or over time to offset the total cost of the PV system. A REC that represents 1 MWh of electricity produced by a solar system is called a solar REC, or SREC.
17 Under most RPS policies, utilities demonstrate compliance with the RPS using RECs purchased from renewable energy producers or marketers, or RECs they have generated themselves. States with specific solar set-asides, or tiers, as part of their RPS have the highest SREC prices available in markets today. The voluntary green power market is derived from the willingness of electricity consumers to pay an additional amount each month on their utility bills to support the development of renewable energy. The value of SRECs in voluntary markets is not as high as in mandatory markets, as the penalty price for non-compliance with the solar carve-out under an RPS is often set at a high level, driving up the SREC’s market price.18
Two examples of markets with a solar carve-out in its RPS are Colorado and New Jersey, both of which have led to high SREC prices. Within its Colorado franchise territory, Xcel Energy (the utility that serves the majority of the load in the state) provides two distinct cash incentives for residential customers who install a PV system. The first is a maximum up-front cash payment equivalent to $2/watt (an incentive described in Section 3). The second incentive is also an up-front payment, but in this case, Xcel is buying the SRECs that the system (up to 10 kW) will generate over 20 years at a price of up to $1.50/watt (Xcel 2008). This translates to an SREC payment of up to $6,000 for a 4 kW system, or approximately $54 for each MWh generated over a 20-year period.
19
15 RECs are also known as renewable energy credits, tradable renewable certificates, or green tags. 16 The definition of "attributes" can vary, but will likely include any future carbon trading credits, emission reduction credits, and emission allowances. 17 Some states have renewable energy goals rather than mandates. As such, renewable goals do not have mandatory compliance requirements. 18 The penalty price, often called an Alternative Compliance Payment (ACP), can also set a ceiling on SREC prices. For example, if the ACP is set at $700/MWh, it would make sense for the utility to purchase SRECs in the market at a price up to $700 but not in excess of it. 19 Using PV Watts Version 1.0 and the city of Boulder as a proxy for Colorado.
Xcel Energy uses these SRECs to meet its solar-specific requirements under Colorado's RPS.
13
New Jersey is piloting a different approach to SRECs. Up-front rebates were temporarily suspended and instead, residential PV owners, through intermediaries, can sell the SRECs generated over time to utilities that have solar RPS requirements (NJCEP 2008a). The state's clean energy program has created a REC tracking system (that includes SRECs) and an electronic bulletin board that helps on-site solar generators create and sell SRECs. Once generated and registered, sales of SRECs can be negotiated and sold directly using the electronic bulletin board. Alternatively, homeowners can contract with a REC broker or aggregator to sell the SRECs on their behalf (NJCEP 2008b).20
20A list of brokers and aggregators is available on the New Jersey Clean Energy Program Web site (
In February 2009, New Jersey reinitiated its up-front incentive program for residential systems up to 10 kW (NJCEP 2009). Rebates of $1.75/watt are available for homeowners who have completed an energy audit and $1.55/watt for those that haven't. The new rebate program will allow homeowners to combine an up-front cash incentive with the ongoing revenue generated by the sales of SRECs or with a loan that is repaid with SRECs (see Section 8). SRECs can play an important role in reducing the cost of owning and operating a PV system in states with the solar carve-out. As seen from the two examples in this section, however, the impacts of SREC payments can be very different depending on the structure of the program. In Colorado, SRECs have the same impact as cash rebates in that they lower the up-front costs associated with installing a PV system. In New Jersey, SRECs are more like utility bill savings and PBIs as they are converted into cash over time as a system generates electricity. If cash incentives are earned over time, the homeowner will face a greater up-front cost when installing a PV system vis-à-vis the up-front payment. Either way, when added to cash incentives and tax credits (discussed in Section 5), the total incentive package may be very attractive to homeowners.
http://www.njcleanenergy.com/).
14
5.0 Tax Incentives Available for Residential PV
Tax credits are the last significant area of financial incentives available to homeowners contemplating the purchase of a residential PV system. Tax credits are available in a number of forms, including federal income tax credits, state income tax credits, property tax exemptions, and sales tax exemptions. 5.1 Federal Tax Incentives for Residential Solar The Energy Policy Act of 2005 established a 30% investment tax credit (ITC) up to $2,000 for the purchase and installation of residential PV systems (DSIRE 2005).21
Under the aforementioned assumptions, as mentioned in Sections 3 and 4, Colorado’s Xcel Energy offers an up-front rebate of $2.00/watt and a REC payment of $1.50/watt. Therefore, a homeowner installing a 4 kW residential system with an initial cost of $33,000
With the recent reauthorization of the ITC by congress, the $2,000 cap was removed as of January 1, 2009 (Library of Congress 2008). The residential ITC will remain at the 30% level until the law expires on January 1, 2017, unless reauthorized or changed prior to that date (Library of Congress 2008). It is important to emphasize that tax credits like the ITC directly reduce taxes that are owed to the government whereas a less valuable tax deduction lowers the amount of income subject to taxes. Certain financial incentives may reduce the cost basis on which the 30% ITC is calculated, depending on whether or not these incentives are considered taxable income for the homeowner. While this report is not intended to provide legal advice, the definition of an energy conservation subsidy under section 136 of the U.S. Tax Code appears to imply that an up-front cash rebate would be excluded from the homeowner's taxable income (DSIRE 2008b). This is important since a non-taxable rebate must be subtracted from the cost basis of the PV system before calculating the ITC. However, the impact of an up-front SREC payment (where they exist) on the ITC is less clear. If the up-front SREC payment is considered taxable income, then it would not be subtracted from the cost basis to calculate the ITC. Conversely, if an up-front SREC rebate is not treated as taxable income, it would seem reasonable to subtract it from the cost basis to avoid the perception of double-dipping (benefiting from both a tax free payment and an income tax credit as a result of this payment). This illustrates that there is a level of uncertainty related to the tax aspects of the various rebates and incentive programs in the market; therefore, it is important to consult a tax adviser until there is additional guidance from the IRS. For the analysis in this report, the up-front SREC will be considered taxable income and therefore subtracted from the cost basis prior to calculating the ITC. The taxes paid on the SREC payment will also be considered.
22
21A summary of the Residential Solar and Fuel Cell Tax Credit Energy Policy Act of 2005 can be found at DSIRE (http://dsireusa.org/library/includes/incentive2.cfm?Incentive_Code=US37F&State=federal¤tpageid=1&ee=1&re=1) 22 Assumes an approximate cost of $8.30/watt.
could receive up to $14,000 in cash payments. As the rebate of $8,000 is not considered taxable income, it will be subtracted from the cost basis for the ITC calculation. The up-front REC payment of $6,000 is treated as taxable income and therefore won’t be subtracted from the cost basis. As a result, the final cost basis in this example is $25,000 and the ITC equals $7,500 or 23% of the initial cost of
15
the system. However, the net tax benefit would be partially offset by the taxes owed on the $6,000 SREC payment. In addition to the actual calculation of the available tax credits, all prospective residential PV owners should consider the timing of tax credits and their impacts on the installed cost of a PV system. Installation of the system triggers the ability to claim the tax credit, implying that the cost at the time of installation will not be reduced by 30%. Rather, the homeowner will recover 30% of the initial investment in the form of a tax credit when taxes are filed (typically in the following year). For example, if a homeowner installs a system in June, he will claim the credit when his taxes are filed (no later than April 15 of the next year), and the IRS processes his tax return.23
State Income Tax Credits & Deductions for Renewables
State offers Personal & Corporate Tax Incentives
State offers only Personal Tax IncentivesState offers only Corporate Tax Incentives
Puerto Rico
D.C.D.C
Source: Database of State Incentives for Renewables & Efficiency (DSIRE), December 2008
The homeowner can carry any unused tax credits forward one year if necessary.
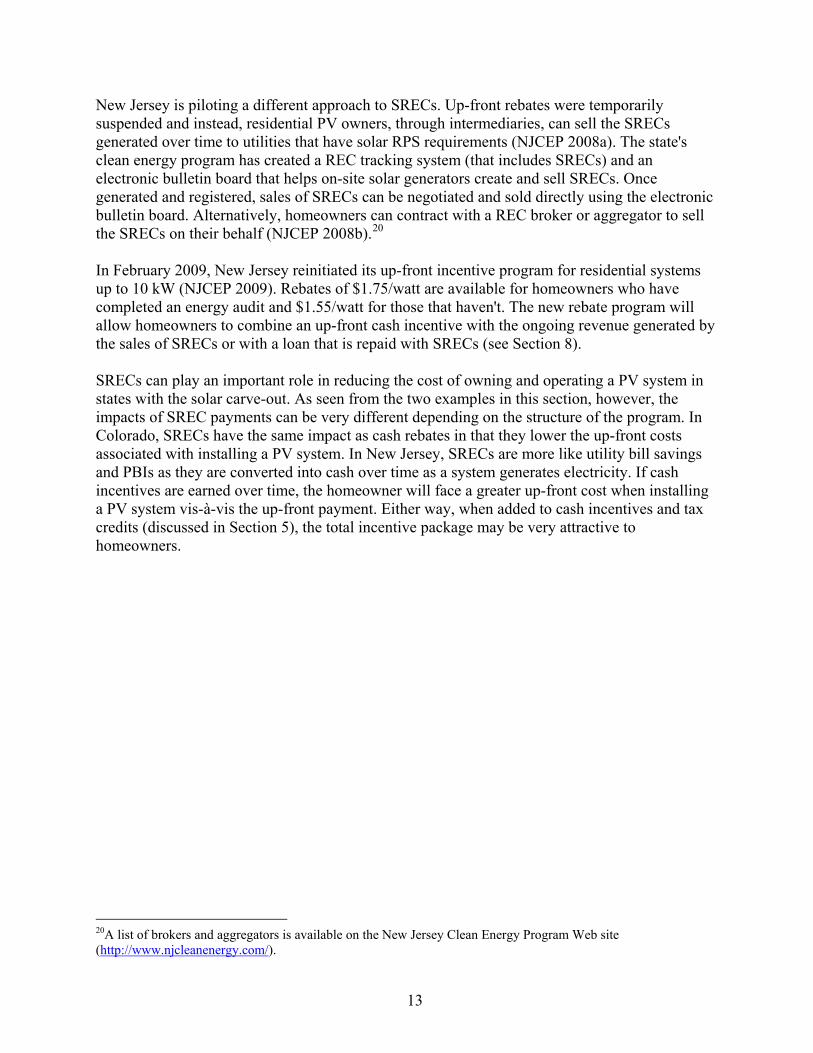
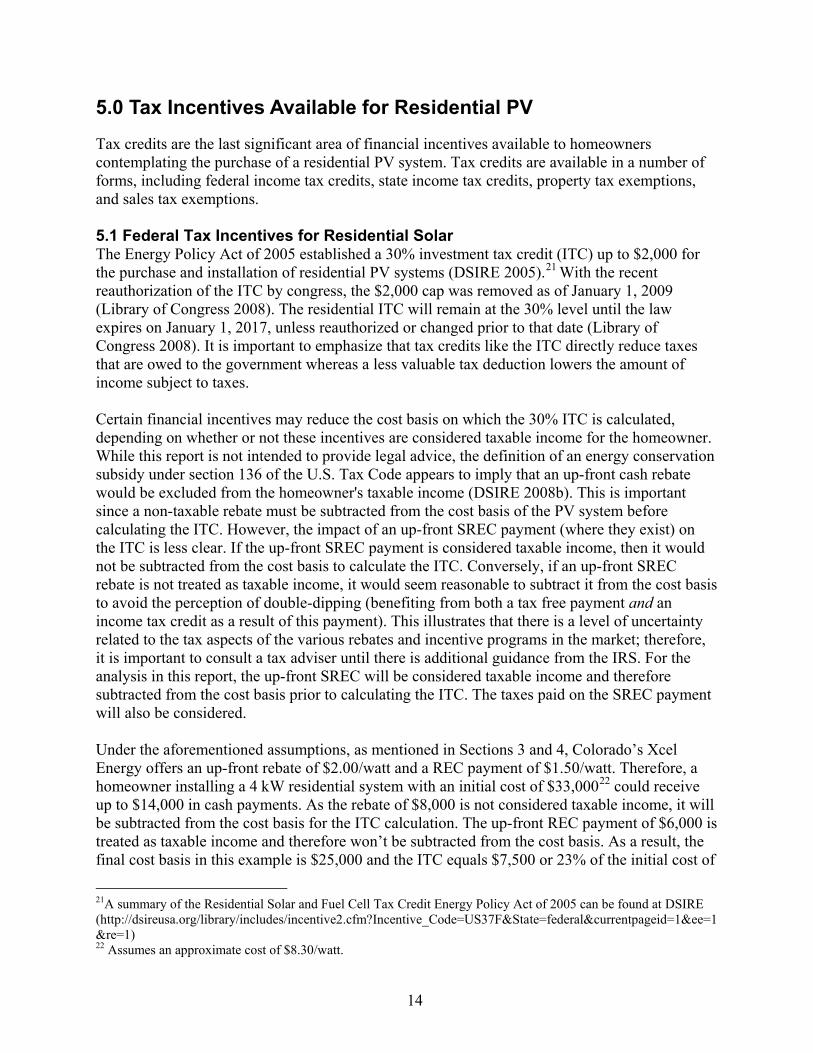
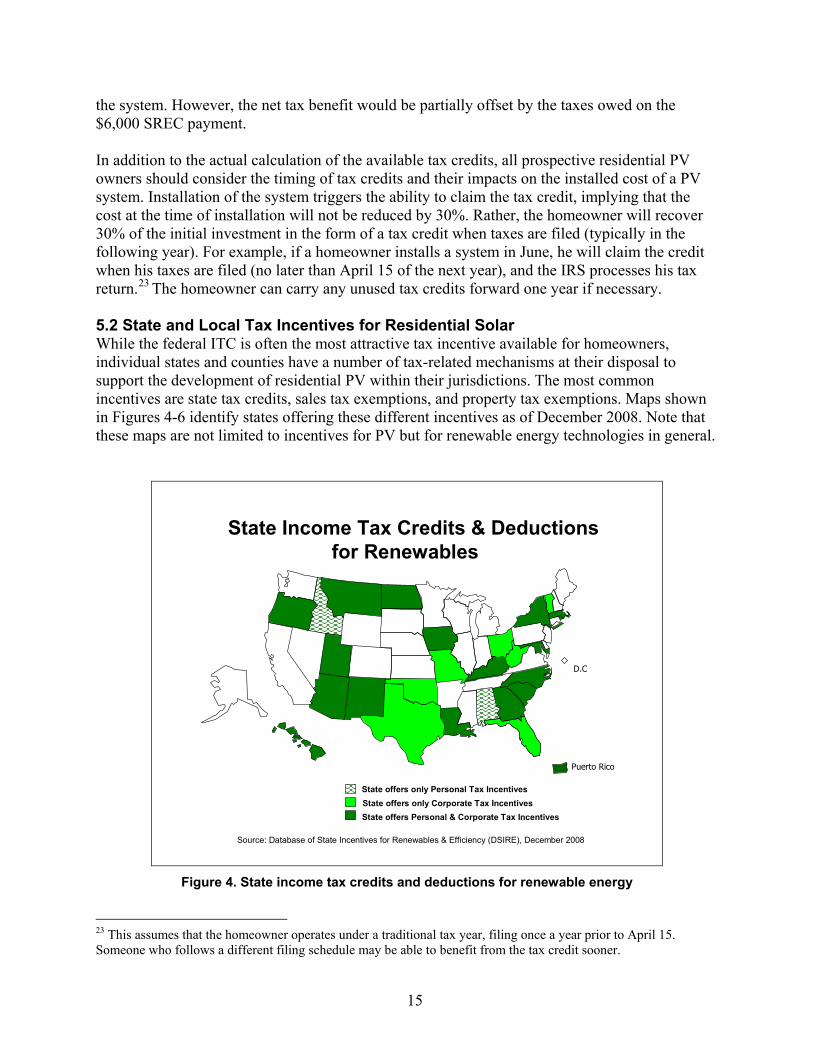
5.2 State and Local Tax Incentives for Residential Solar While the federal ITC is often the most attractive tax incentive available for homeowners, individual states and counties have a number of tax-related mechanisms at their disposal to support the development of residential PV within their jurisdictions. The most common incentives are state tax credits, sales tax exemptions, and property tax exemptions. Maps shown in Figures 4-6 identify states offering these different incentives as of December 2008. Note that these maps are not limited to incentives for PV but for renewable energy technologies in general.
Figure 4. State income tax credits and deductions for renewable energy
23 This assumes that the homeowner operates under a traditional tax year, filing once a year prior to April 15. Someone who follows a different filing schedule may be able to benefit from the tax credit sooner.
16
State Sales Tax Exemptions for Renewables
State has a Sales Tax ExemptionState has Local Option for Sales Tax Exemption
Puerto Rico
D.C.D.C
Source: Database of State Incentives for Renewables & Efficiency (DSIRE), December 2008
Figure 5. State sales tax exemptions for renewable energy
States with Local Property Tax Exemptions for Renewables
State has property tax exemption/assessment and local option
State gives localities the option to offer an exemptionState has property tax exemption or special assessment
Puerto Rico
D.C.D.C
Source: Database of State Incentives for Renewables & Efficiency (DSIRE), December 2008
Figure 6. States with local property tax exemptions for renewables
17
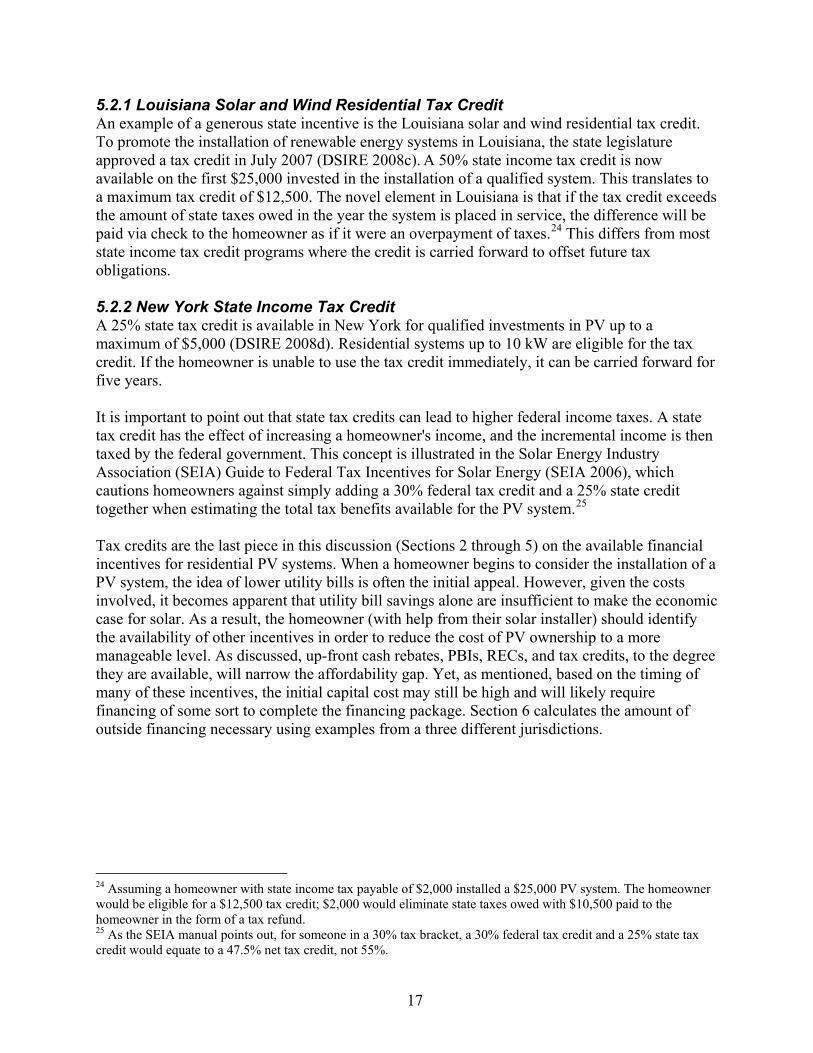
5.2.1 Louisiana Solar and Wind Residential Tax Credit An example of a generous state incentive is the Louisiana solar and wind residential tax credit. To promote the installation of renewable energy systems in Louisiana, the state legislature approved a tax credit in July 2007 (DSIRE 2008c). A 50% state income tax credit is now available on the first $25,000 invested in the installation of a qualified system. This translates to a maximum tax credit of $12,500. The novel element in Louisiana is that if the tax credit exceeds the amount of state taxes owed in the year the system is placed in service, the difference will be paid via check to the homeowner as if it were an overpayment of taxes.24
It is important to point out that state tax credits can lead to higher federal income taxes. A state tax credit has the effect of increasing a homeowner's income, and the incremental income is then taxed by the federal government. This concept is illustrated in the Solar Energy Industry Association (SEIA) Guide to Federal Tax Incentives for Solar Energy (SEIA 2006), which cautions homeowners against simply adding a 30% federal tax credit and a 25% state credit together when estimating the total tax benefits available for the PV system.
This differs from most state income tax credit programs where the credit is carried forward to offset future tax obligations.
5.2.2 New York State Income Tax Credit A 25% state tax credit is available in New York for qualified investments in PV up to a maximum of $5,000 (DSIRE 2008d). Residential systems up to 10 kW are eligible for the tax credit. If the homeowner is unable to use the tax credit immediately, it can be carried forward for five years.
25
24 Assuming a homeowner with state income tax payable of $2,000 installed a $25,000 PV system. The homeowner would be eligible for a $12,500 tax credit; $2,000 would eliminate state taxes owed with $10,500 paid to the homeowner in the form of a tax refund. 25 As the SEIA manual points out, for someone in a 30% tax bracket, a 30% federal tax credit and a 25% state tax credit would equate to a 47.5% net tax credit, not 55%.
Tax credits are the last piece in this discussion (Sections 2 through 5) on the available financial incentives for residential PV systems. When a homeowner begins to consider the installation of a PV system, the idea of lower utility bills is often the initial appeal. However, given the costs involved, it becomes apparent that utility bill savings alone are insufficient to make the economic case for solar. As a result, the homeowner (with help from their solar installer) should identify the availability of other incentives in order to reduce the cost of PV ownership to a more manageable level. As discussed, up-front cash rebates, PBIs, RECs, and tax credits, to the degree they are available, will narrow the affordability gap. Yet, as mentioned, based on the timing of many of these incentives, the initial capital cost may still be high and will likely require financing of some sort to complete the financing package. Section 6 calculates the amount of outside financing necessary using examples from a three different jurisdictions.
18
6.0 Calculating Residential PV Systems’ Cost Over 20 years
Utility bill savings, cash incentives, RECs, and tax credits have been identified as sources of capital to help offset the cost of owning and operating a residential PV system; however, each element was analyzed separately. In this section, hypothetical 4 kW systems in three states—California, Colorado, and New Jersey—are presented to demonstrate how these financial incentives are combined to lower the cost of the system and to calculate the residual amount that the homeowner must finance under a direct purchase scenario. 6.1 Average Cost for a Residential PV System The installed cost for a residential PV system on a per-watt basis can vary widely across the country. NREL’s Federal Energy Management Program has compiled average installed cost figures for 2007 using data from 5,885 installations in California and New Jersey that were less than 10 kW in size.26
In order to project the expected output of a 4 kW system over a 20-year period, representative cities in each of the three states were selected based on those available in the PV Watts solar calculator (Version 1.0).
The average installed cost for these systems was $8.32/watt. As a result, $8.30/watt is used as the basis for the calculations and a 4 kW system is assumed to have an installed cost of $33,000 prior to any incentives or rebates. Note that residential systems may be more or less expensive in specific cities or states, but any potential difference is ignored to simplify the calculation and allow for easier comparison between other location-specific factors.
6.2 Sales, Property, and State Income Taxes As noted in Section 5.2, states offer a number of tax-based incentives such as sales and property tax exemptions as well as income tax credits. While a few states have very attractive state tax credits, such as Louisiana, most states are less generous, including the three locations under study. As a result, these additional incentives will be ignored in the analysis. However, any additional tax incentives available at the state level that are not included in the analysis would lower the final cost of the system, modestly improving the results presented below.
6.3 Electricity Production Over 20 Years
27
26 This cost information was not published; it is being used to help federal agencies understand the cost of PV for deployment at their sites.
As a result, Sacramento, Boulder, and Newark were selected as proxies for California, Colorado, and New Jersey, respectively. In each case, the expected electricity production for a 4 kW system was calculated for a 12-month period and then projected over 20 years using a 1% annual degradation factor. The production results are shown in Table 1.
27 PVWatts allows users to develop performance estimates for grid-connected PV systems at locations throughout the United States. It is a tool developed by NREL and can be found at: http://rredc.nrel.gov/solar/codes_algs/PVWATTS/version1/.
19
Table 1. Average Annual and 20-Year Electricity Production of 4 kW PV System
City Annual average
electricity production (kWh)
20 years of electricity
production (kWh)
Sacramento 5,597 101,918
Boulder 5,834 106,233
Newark 4,732 86,156
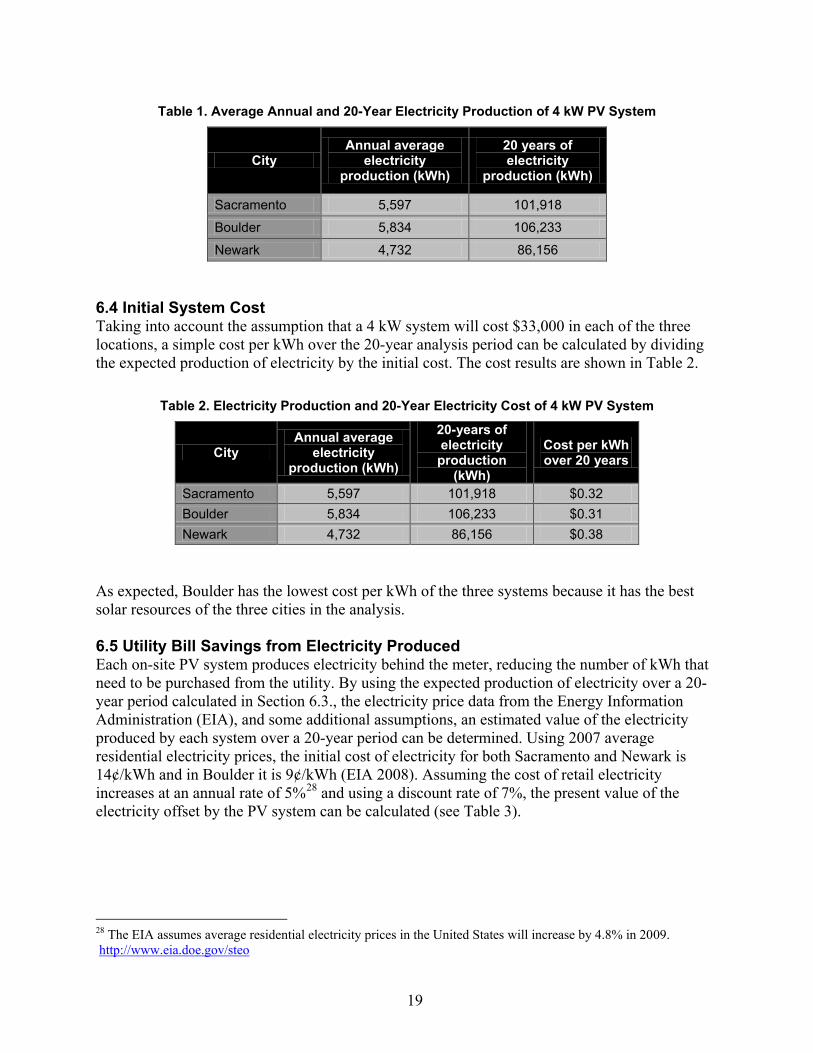
6.4 Initial System Cost Taking into account the assumption that a 4 kW system will cost $33,000 in each of the three locations, a simple cost per kWh over the 20-year analysis period can be calculated by dividing the expected production of electricity by the initial cost. The cost results are shown in Table 2.
Table 2. Electricity Production and 20-Year Electricity Cost of 4 kW PV System
City Annual average
electricity production (kWh)
20-years of electricity production
(kWh)
Cost per kWh over 20 years
Sacramento 5,597 101,918 $0.32 Boulder 5,834 106,233 $0.31 Newark 4,732 86,156 $0.38
As expected, Boulder has the lowest cost per kWh of the three systems because it has the best solar resources of the three cities in the analysis. 6.5 Utility Bill Savings from Electricity Produced Each on-site PV system produces electricity behind the meter, reducing the number of kWh that need to be purchased from the utility. By using the expected production of electricity over a 20-year period calculated in Section 6.3., the electricity price data from the Energy Information Administration (EIA), and some additional assumptions, an estimated value of the electricity produced by each system over a 20-year period can be determined. Using 2007 average residential electricity prices, the initial cost of electricity for both Sacramento and Newark is 14¢/kWh and in Boulder it is 9¢/kWh (EIA 2008). Assuming the cost of retail electricity increases at an annual rate of 5%28
28 The EIA assumes average residential electricity prices in the United States will increase by 4.8% in 2009.
and using a discount rate of 7%, the present value of the electricity offset by the PV system can be calculated (see Table 3).
http://www.eia.doe.gov/steo
20
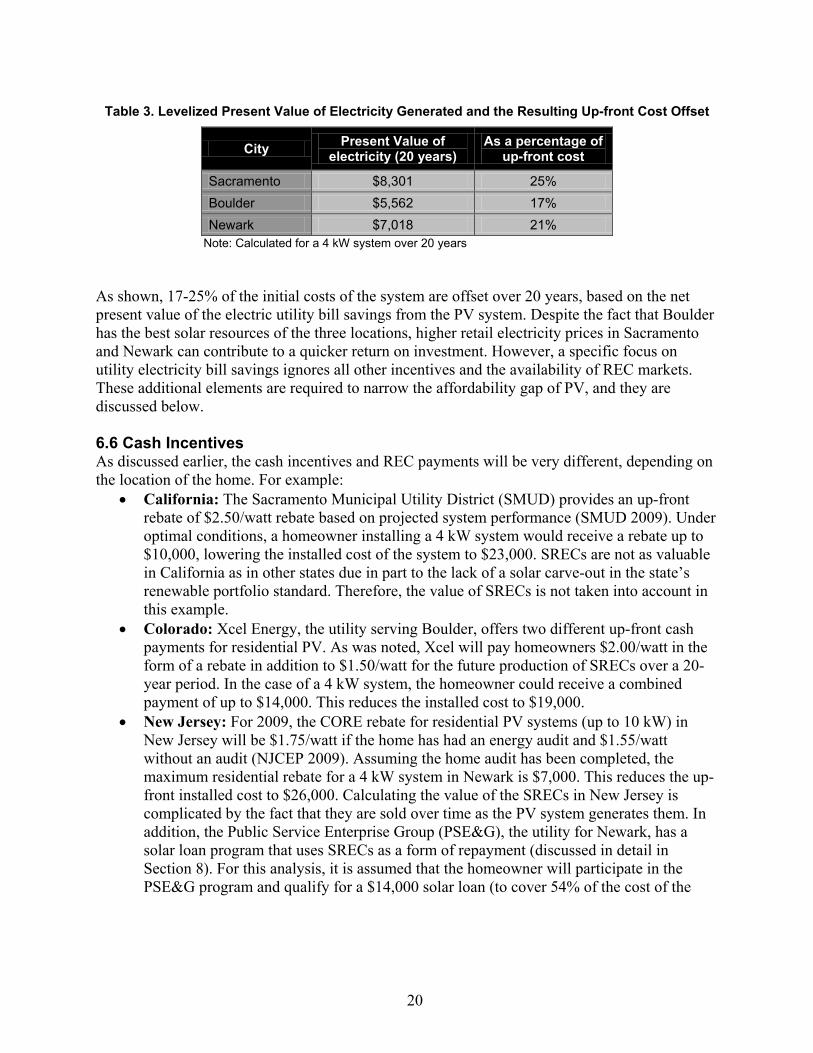
Table 3. Levelized Present Value of Electricity Generated and the Resulting Up-front Cost Offset
City Present Value of electricity (20 years)
As a percentage of up-front cost
Sacramento $8,301 25% Boulder $5,562 17% Newark $7,018 21%
Note: Calculated for a 4 kW system over 20 years As shown, 17-25% of the initial costs of the system are offset over 20 years, based on the net present value of the electric utility bill savings from the PV system. Despite the fact that Boulder has the best solar resources of the three locations, higher retail electricity prices in Sacramento and Newark can contribute to a quicker return on investment. However, a specific focus on utility electricity bill savings ignores all other incentives and the availability of REC markets. These additional elements are required to narrow the affordability gap of PV, and they are discussed below. 6.6 Cash Incentives As discussed earlier, the cash incentives and REC payments will be very different, depending on the location of the home. For example:
• California: The Sacramento Municipal Utility District (SMUD) provides an up-front rebate of $2.50/watt rebate based on projected system performance (SMUD 2009). Under optimal conditions, a homeowner installing a 4 kW system would receive a rebate up to $10,000, lowering the installed cost of the system to $23,000. SRECs are not as valuable in California as in other states due in part to the lack of a solar carve-out in the state’s renewable portfolio standard. Therefore, the value of SRECs is not taken into account in this example.
• Colorado: Xcel Energy, the utility serving Boulder, offers two different up-front cash payments for residential PV. As was noted, Xcel will pay homeowners $2.00/watt in the form of a rebate in addition to $1.50/watt for the future production of SRECs over a 20-year period. In the case of a 4 kW system, the homeowner could receive a combined payment of up to $14,000. This reduces the installed cost to $19,000.
• New Jersey: For 2009, the CORE rebate for residential PV systems (up to 10 kW) in New Jersey will be $1.75/watt if the home has had an energy audit and $1.55/watt without an audit (NJCEP 2009). Assuming the home audit has been completed, the maximum residential rebate for a 4 kW system in Newark is $7,000. This reduces the up-front installed cost to $26,000. Calculating the value of the SRECs in New Jersey is complicated by the fact that they are sold over time as the PV system generates them. In addition, the Public Service Enterprise Group (PSE&G), the utility for Newark, has a solar loan program that uses SRECs as a form of repayment (discussed in detail in Section 8). For this analysis, it is assumed that the homeowner will participate in the PSE&G program and qualify for a $14,000 solar loan (to cover 54% of the cost of the
21
system after taking into account the up-front rebate), which will be fully repaid by the SRECs generated by the system.29
6.7 Federal Investment Tax Credit In Section 5, the 30% ITC was discussed along with the removal of the $2,000 cap for residential systems. As was mentioned, certain incentives reduce the cost basis on which the ITC will be calculated, so the dollar amount of the ITC in each of the three examples will be different.
• California: The ITC calculation for Sacramento is straightforward. The up-front rebate of $10,000 must be subtracted from the initial cost of the system to determine the ITC cost basis. This translates to an ITC cost basis of $23,000 ($33,000 minus $10,000). As a result, the ITC is $6,900.
• Colorado: In Boulder, the cost basis is reduced by the $8,000 up-front rebate but not by the $6,000 SREC payment. The assumption here is that the SREC rebate is treated as taxable income. As a result, the cost basis in the Boulder example is $25,000 and the ITC is $7,500. However, as the SREC rebate is taxable, the net federal tax impact of this transaction would be $5,700.30
• New Jersey: In Newark, the cost basis will be reduced by $7,000; the value of the up-front rebate.
31
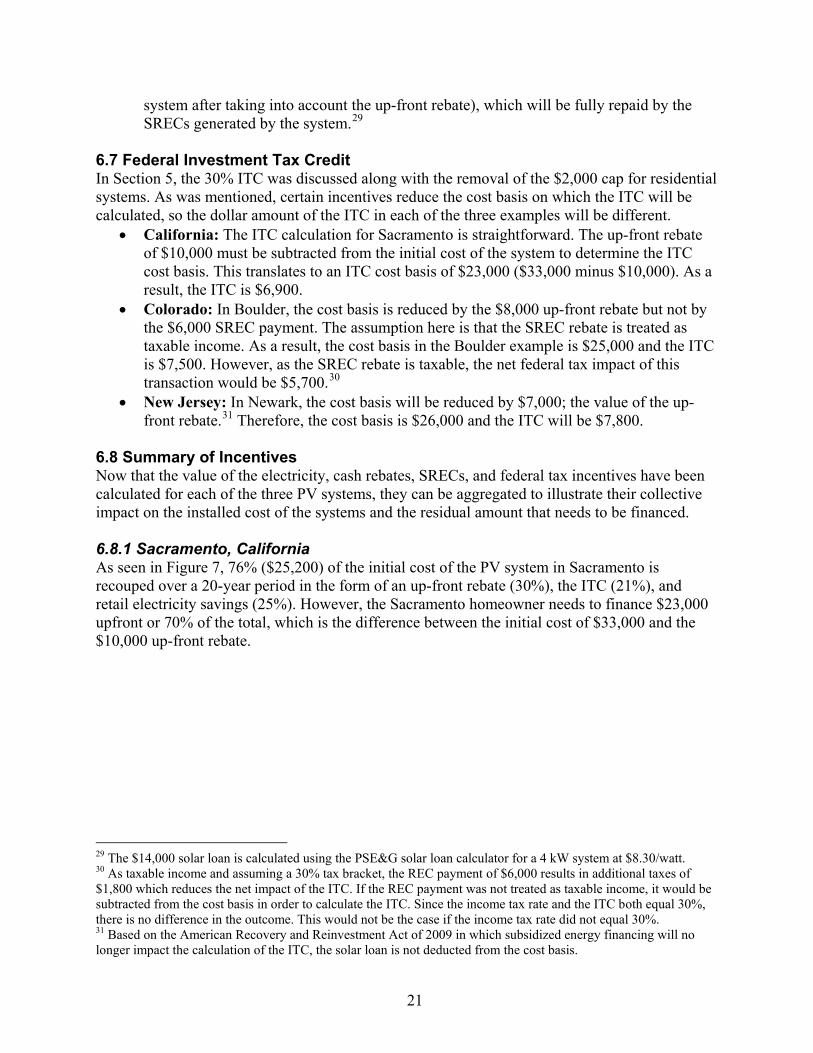
6.8 Summary of Incentives Now that the value of the electricity, cash rebates, SRECs, and federal tax incentives have been calculated for each of the three PV systems, they can be aggregated to illustrate their collective impact on the installed cost of the systems and the residual amount that needs to be financed. 6.8.1 Sacramento, California As seen in Figure 7, 76% ($25,200) of the initial cost of the PV system in Sacramento is recouped over a 20-year period in the form of an up-front rebate (30%), the ITC (21%), and retail electricity savings (25%). However, the Sacramento homeowner needs to finance $23,000 upfront or 70% of the total, which is the difference between the initial cost of $33,000 and the $10,000 up-front rebate.
Therefore, the cost basis is $26,000 and the ITC will be $7,800.
29 The $14,000 solar loan is calculated using the PSE&G solar loan calculator for a 4 kW system at $8.30/watt. 30 As taxable income and assuming a 30% tax bracket, the REC payment of $6,000 results in additional taxes of $1,800 which reduces the net impact of the ITC. If the REC payment was not treated as taxable income, it would be subtracted from the cost basis in order to calculate the ITC. Since the income tax rate and the ITC both equal 30%, there is no difference in the outcome. This would not be the case if the income tax rate did not equal 30%. 31 Based on the American Recovery and Reinvestment Act of 2009 in which subsidized energy financing will no longer impact the calculation of the ITC, the solar loan is not deducted from the cost basis.
22
Figure 7. Total PV system cost to Sacramento homeowner, including incentives
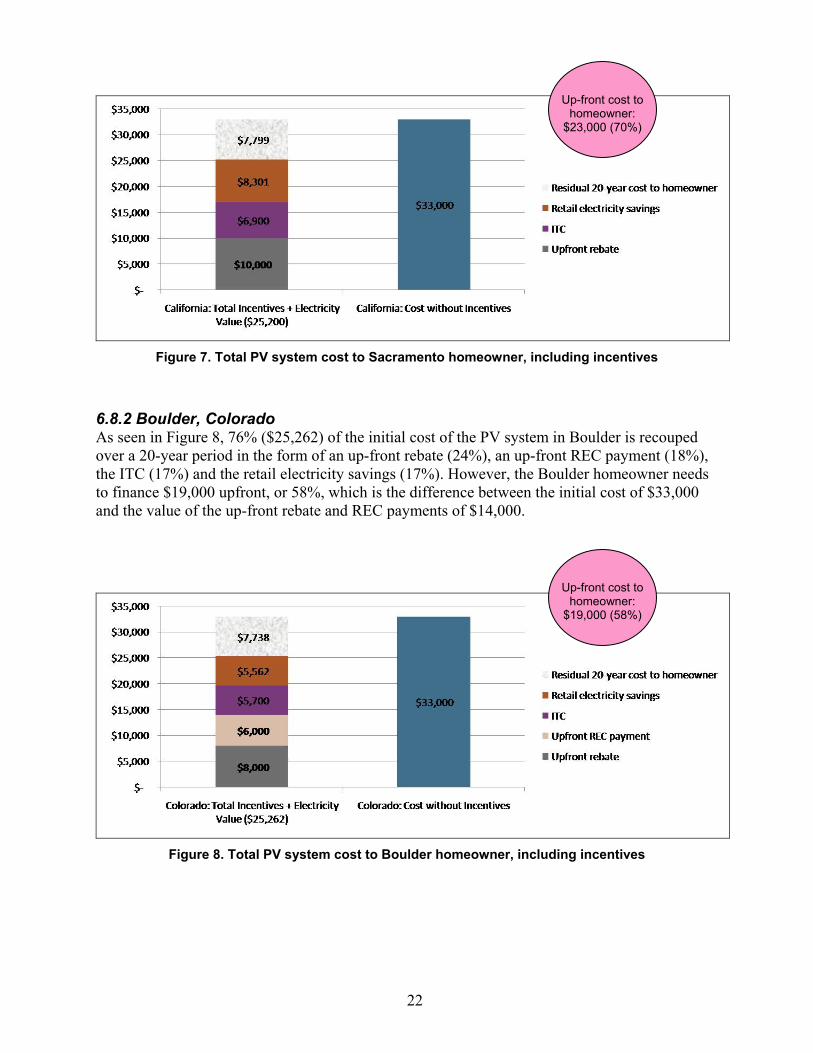
6.8.2 Boulder, Colorado As seen in Figure 8, 76% ($25,262) of the initial cost of the PV system in Boulder is recouped over a 20-year period in the form of an up-front rebate (24%), an up-front REC payment (18%), the ITC (17%) and the retail electricity savings (17%). However, the Boulder homeowner needs to finance $19,000 upfront, or 58%, which is the difference between the initial cost of $33,000 and the value of the up-front rebate and REC payments of $14,000.
Figure 8. Total PV system cost to Boulder homeowner, including incentives
Up-front cost to homeowner:
$23,000 (70%)
Up-front cost to homeowner:
$19,000 (58%)
23
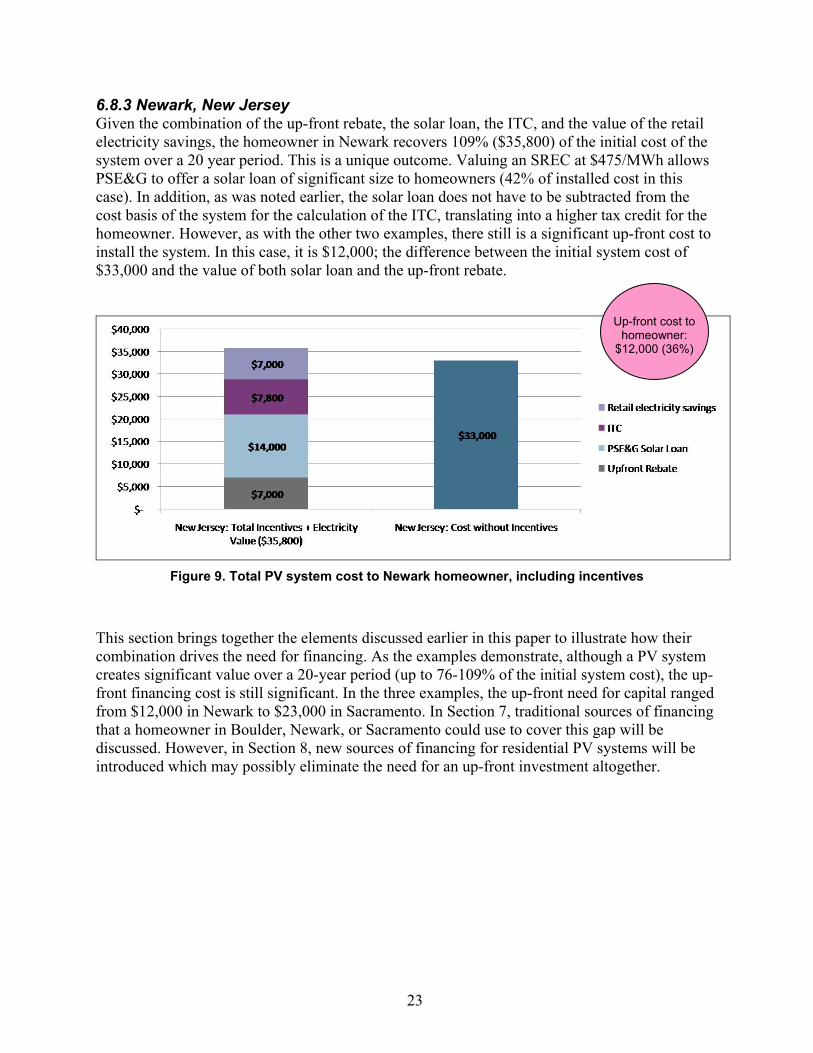
6.8.3 Newark, New Jersey Given the combination of the up-front rebate, the solar loan, the ITC, and the value of the retail electricity savings, the homeowner in Newark recovers 109% ($35,800) of the initial cost of the system over a 20 year period. This is a unique outcome. Valuing an SREC at $475/MWh allows PSE&G to offer a solar loan of significant size to homeowners (42% of installed cost in this case). In addition, as was noted earlier, the solar loan does not have to be subtracted from the cost basis of the system for the calculation of the ITC, translating into a higher tax credit for the homeowner. However, as with the other two examples, there still is a significant up-front cost to install the system. In this case, it is $12,000; the difference between the initial system cost of $33,000 and the value of both solar loan and the up-front rebate.
Figure 9. Total PV system cost to Newark homeowner, including incentives
This section brings together the elements discussed earlier in this paper to illustrate how their combination drives the need for financing. As the examples demonstrate, although a PV system creates significant value over a 20-year period (up to 76-109% of the initial system cost), the up-front financing cost is still significant. In the three examples, the up-front need for capital ranged from $12,000 in Newark to $23,000 in Sacramento. In Section 7, traditional sources of financing that a homeowner in Boulder, Newark, or Sacramento could use to cover this gap will be discussed. However, in Section 8, new sources of financing for residential PV systems will be introduced which may possibly eliminate the need for an up-front investment altogether.
Up-front cost to homeowner:
$12,000 (36%)
24
7.0 Traditional PV Financing
A homeowner considering the installation of rooftop PV will need to determine which of the many state and federal incentives are available for the project. Once all of the up-front incentives have been monetized, the remaining amount that needs to be financed can still be considerable as was illustrated in Section 6. And although PBIs can help pay for the financing over time, they are not available upfront and are not used to pay for the equipment initially. Traditionally, the amount that needs to be financed has been covered with some combination of cash, home equity loans, and/or refinanced mortgage loans. 7.1 Tools to Estimate the Cost of a PV System Since each state has unique up-front incentives and PV system performance is unique to each installation, the amount of money a homeowner needs upfront to pay for a PV system varies drastically from state to state. Solar PV installers play an important role in helping homeowners determine the amount needed upfront. In addition, there are a number of solar calculators available online that let homeowners develop a preliminary budget on their own for the cost of installing PV.32 These calculators are location-specific and incorporate relevant incentives and tax breaks in order to estimate the residual cost the homeowner will need to finance. For illustrative purposes, an example of the Clean Power Estimator for New York is presented below. A short description of the Solar Advisor Model is also included.33
32 An internet search for "solar calculator" for a given state will provide various options. Some of these calculators are hosted by state agencies such as the California Energy Commission whereas many are found on corporate internet sites such as SunPower's solar calculator. 33 This tool can be used for locations in the continental U.S., as long as the user inputs some critical assumptions.
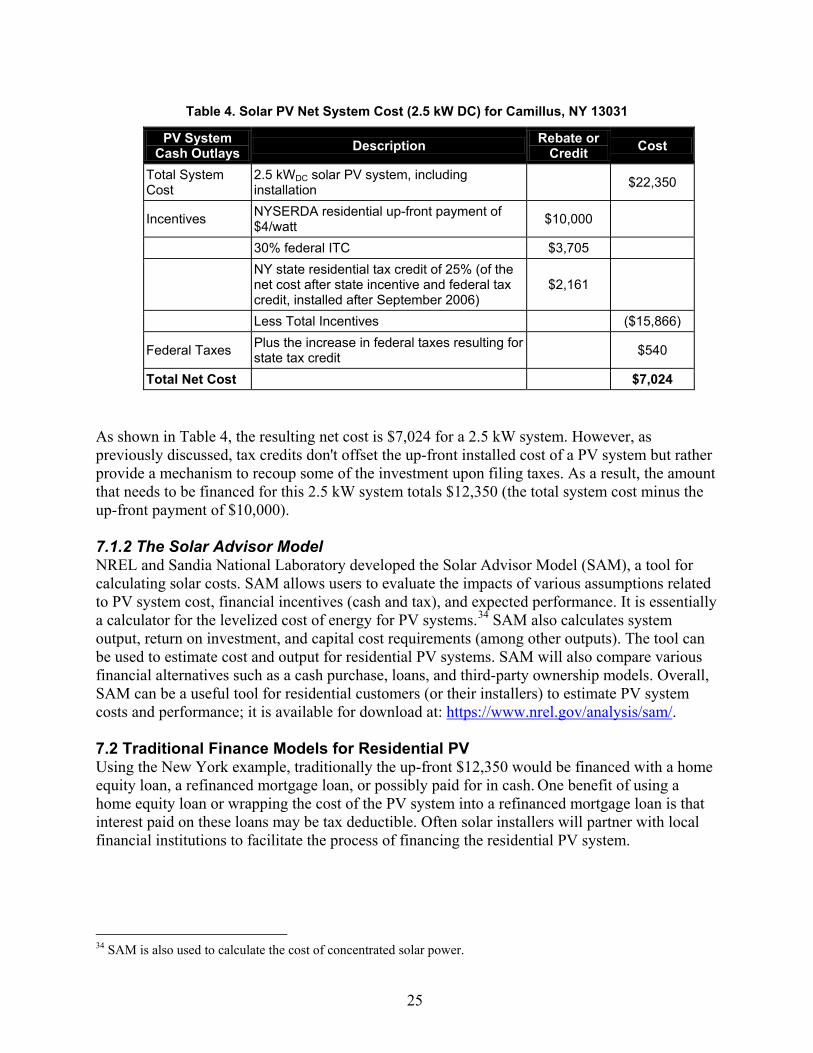
7.1.1 New York and the Clean Power Estimator Using the Clean Power Estimator, an online solar calculator made available on the NYSERDA Web site (and used by other states as well), a New York homeowner can calculate the value of both state and federal incentives to determine how much of the installed cost must be financed (NYSERDA 2008c). Table 4 illustrates the combined value for a 2.5 kW system of the $4.00/watt state incentive program for existing homes (up to the first 5 kW), the federal tax credit of 30%, and the 25% state income tax credit.
25
Table 4. Solar PV Net System Cost (2.5 kW DC) for Camillus, NY 13031
PV System Cash Outlays Description Rebate or
Credit Cost
Total System Cost
2.5 kWDC solar PV system, including installation $22,350
Incentives NYSERDA residential up-front payment of $4/watt $10,000
30% federal ITC $3,705
NY state residential tax credit of 25% (of the net cost after state incentive and federal tax credit, installed after September 2006)
$2,161
Less Total Incentives ($15,866)
Federal Taxes Plus the increase in federal taxes resulting for state tax credit $540
Total Net Cost $7,024
As shown in Table 4, the resulting net cost is $7,024 for a 2.5 kW system. However, as previously discussed, tax credits don't offset the up-front installed cost of a PV system but rather provide a mechanism to recoup some of the investment upon filing taxes. As a result, the amount that needs to be financed for this 2.5 kW system totals $12,350 (the total system cost minus the up-front payment of $10,000).
7.1.2 The Solar Advisor Model NREL and Sandia National Laboratory developed the Solar Advisor Model (SAM), a tool for calculating solar costs. SAM allows users to evaluate the impacts of various assumptions related to PV system cost, financial incentives (cash and tax), and expected performance. It is essentially a calculator for the levelized cost of energy for PV systems.34 SAM also calculates system output, return on investment, and capital cost requirements (among other outputs). The tool can be used to estimate cost and output for residential PV systems. SAM will also compare various financial alternatives such as a cash purchase, loans, and third-party ownership models. Overall, SAM can be a useful tool for residential customers (or their installers) to estimate PV system costs and performance; it is available for download at: https://www.nrel.gov/analysis/sam/. 7.2 Traditional Finance Models for Residential PV Using the New York example, traditionally the up-front $12,350 would be financed with a home equity loan, a refinanced mortgage loan, or possibly paid for in cash. One benefit of using a home equity loan or wrapping the cost of the PV system into a refinanced mortgage loan is that interest paid on these loans may be tax deductible. Often solar installers will partner with local financial institutions to facilitate the process of financing the residential PV system.
34 SAM is also used to calculate the cost of concentrated solar power.
26
7.2.1 California Example: SunPower and New Resource Bank SunPower, a primary producer and installer of PV technology in the marketplace (SunPower 2009), is one of many solar companies that has partnered with San Francisco-based New Resource Bank to finance the installation of residential PV systems in California (NRB 2006a). New Resource Bank offers homeowners fixed rate, solar home equity loans for terms of either 15 or 25 years. In order to qualify, homeowners must have an aggregate loan balance to home value of less than 75%, verifiable income, and a credit score of at least 680 (NRB 2006b). According to the bank's Web site in February 2009, interest rates for the program ranged from 6.5% to 7.5% depending on the financial situation of the homeowner (NRB 2006b). In addition to specialty programs designed with residential PV systems in mind, homeowners can draw on standard home equity lines of credit, take out a home equity loan, or pull cash out of a home mortgage refinance, much like they have done for any number of traditional home improvements. For the most part, all commercial banks and credit unions offer these products. And in this sense, financing the cost of a PV system is no different than financing the cost of remodeling the kitchen, adding a bathroom, or replacing the roof. The equity value of the home combined with the credit score of the homeowner are the primary determinants of how much can be borrowed. The question today is whether credit is available in the midst of the current crisis in the financial markets. With some banks failing, those who are weathering the storm are enacting stricter requirements for lending. Home equity lines previously available are being withdrawn and interest rates for consumers remain high despite actions by the Federal Reserve to lower them. In addition, falling home values limit the amount of equity that can be pledged as collateral for a loan. These conditions are likely to curtail the number of traditionally-financed PV systems through the first half of 2009, if not longer. Moreover, homeowners contemplating a cash purchase may be more reluctant to make high-dollar investments in the midst of the crisis. Ironically, under normal conditions, the recent eight-year extension of the residential ITC, combined with the elimination of the $2,000 cap, would have been a driver of a significant number of new residential PV systems. However, with the restriction on credit and the general economic malaise, the level of investment in residential PV in the near term remains uncertain.
27
8.0 Emerging Financial Structures for Residential PV
This section moves beyond the traditional financing models discussed in Section 7 to new models that may offer attractive alternatives for the homeowner, such as the third-party solar lease, the residential power purchase agreement, the property tax assessment model, and an SREC loan program. Together, they constitute the next generation of financial products that broaden the base of homeowners who can afford to install PV. In addition, these models may be better positioned in the current economic environment than the traditional financial solutions. 8.1 Residential PV Financing: Background and Challenges The primary premise of this paper is that traditional methods of financing residential PV have been insufficient to drive material levels of installed capacity at the residential level. In most cases, residential PV remains too expensive, with the high initial cost outweighing the future benefits. The operating and maintenance responsibilities can also be intimidating. Additionally, Americans change houses frequently,35
A parallel can be drawn between Energy Star appliances and PV installations.
meaning the economics of PV are not in the homeowner’s favor given its long-term payback period. Finally, there is a hassle factor that must be overcome to get people to make the investment.
36
As a result, new models to finance residential PV systems are emerging to address many of these challenges. The third-party ownership models such as the solar lease and the residential power purchase agreement (PPA) seek to lower the up-front cost barrier by leveraging commercial tax benefits, while simultaneously relieving the homeowner of maintenance responsibilities. The property tax assessment model also lowers the entry barriers while making systems easily transferable from one homeowner to the next, creating a smooth transition if the homeowner moves before the full economic value of a PV system is realized. Finally, in New Jersey, PSE&G has created an efficient way for homeowners to borrow against the environmental benefits of their PV systems instead of having to resort to traditional cash financing. Each of these new models are explored in this section in order to illustrate how traditional barriers to residential
The lifecycle costs are often quite compelling when it comes to replacing an old but still operating refrigerator or washer/dryer with a more efficient model. However, in addition to the up-front cost to buy a more efficient appliance, there are a series of transaction costs, while seemingly modest, that can be high enough to prevent the homeowner from making the purchase. Time has to be spent researching which model to buy and to shop for the right size and color. In addition, the homeowner may have to take time off from work to wait at home for the delivery, possibly deal with the disposal of the old appliance, and take time to mail in the receipt to get an Energy Star rebate. When all of these aspects are considered, combined with the fact that the old appliance still works and that monthly electricity savings may be modest, it is not necessarily surprising that many homeowners balk at what appears to be a smart, long-term investment. The decision to install a PV system is no different and the transaction costs can be even more intimidating.
35 The U.S. Census calculates that approximately 40 million people move in any given year. Mobility tables can be found at http://www.census.gov/population/www/socdemo/migrate.html. 36 Energy Star Appliance Ratings (http://www.energystar.gov/index.cfm?c=appliances.pr_appliances).
28
roof top PV are being addressed by both new and existing players in the market place; ideally leading to significant levels of newly-installed capacity. The third-party ownership models have an additional bonus—they take advantage of federal tax incentives available to commercial owners. Together, they are larger than those available to residential consumers. As of January 1, 2009, homeowners can take advantage of the full 30% ITC, similar to commercial owners (Library of Congress 2008). However, commercial PV owners also can depreciate the cost of the system; a benefit that a homeowner does not have. The installed cost of the system is depreciated, minus 50% of the ITC, over the first five years of ownership using the modified accelerated cost recovery system (DSIRE 2008e). According to a recent report by Lawrence Berkeley National Laboratory, the tax benefit of this depreciation is approximately equivalent to 26% of the installed cost of the system; 12% of which comes from the ability to accelerate it over the 5-year period (Bolinger 2009). These additional cost savings are assumed in the third-party ownership financing structures described below. 8.2 Third-party Ownership and the Solar Lease Leases have been used to finance capital equipment in the commercial sector and personal automobiles for many years, and are now being introduced to the residential PV market in a variety of different locations across the United States. While there are many forms of leasing, the concept is straightforward. Instead of purchasing a PV system, a homeowner enters into a contract with the lessor (owner) of a PV system and agrees to make monthly lease payments over a set period of time. The homeowner consumes the electricity generated by the leased system. If the local utility has a net metering policy in place, the homeowner will get credited for any excess electricity sent back to the grid. In an ideal situation,37
SolarCity, based in Foster City, California, is actively marketing its solar lease program in California, Oregon, and Arizona, with the bank, Morgan Stanley, acting as the tax investor and
this combination of a monthly lease payment and a lower monthly utility bill will be less than the utility bills the homeowner had been paying prior to installing the system. At the end of the lease period, there may be a purchase option that will give the homeowner the opportunity to buy the PV system. Alternatively, the homeowner may be able to extend the lease agreement or have the system removed from the roof. The lease agreement may also be enhanced by the lessor agreeing to provide on-going operations and maintenance services, including the cost of replacing the system’s inverter. This is an attractive feature for homeowners who want to benefit from solar power but are intimidated by the perceived maintenance aspects of PV system ownership. To date, the number of residential solar lease programs is limited. Two solar lease programs—SolarCity and the Connecticut Solar Lease Program—have been launched and are actively leasing systems to homeowners. These programs are highlighted below. A third program, freEner-g, based in the twin cities of Minnesota, is in the process of launching a pilot program for about 50 homes and small businesses in early 2009 (freEner-g 2009). 8.2.1 SolarCity
37 The high up-front cost of PV means this ideal is only achieved in states with some type of incentive (e.g., upfront, performance based, etc.) to support PV.
29
claiming the federal tax credits and depreciation benefits. The company is considering other expansion opportunities across the United States for 2009 (Arfin and Niver 2008). The most recent information can be found on the SolarCity Web site (www.solarcity.com). SolarCity offers many lease options. Homeowners can choose a no-money down option or make a down payment; the higher the down-payment, the lower the monthly lease payments. In addition to the cost of the system itself, the lease payment covers the cost of system monitoring, maintenance, and repair, including an inverter replacement if necessary. SolarCity guarantees a minimum level of electricity output (expressed in kWh terms) of the system as well. The company tends to concentrate on areas where high prevailing electricity rates and attractive incentives allow most customers to achieve savings from the outset of the lease. Pricing and deal structure vary based on local market conditions. For example, a 3.2 kW PV system in northern California may cost the homeowner $83/month and may reduce his utility bill by $125/month, for a net savings of $42/month. In Arizona, where utility rebates are more substantial but local utility rates are lower, a customer might pay only $43/month for the same 3.2 kW system, reducing utility bills by $53/month for a net savings of $10/month. SolarCity also varies the term length and annual escalator as local conditions dictate. In California and Arizona, leases usually run for 15 years with rate increases of 3.5% per year, whereas Oregon leases run for 10 years and have a 0% escalator. At the end of the lease term, the homeowner can renew the lease, purchase the system at its fair market value, or request that the system be removed at no cost. If the homeowner moves within the lease period, he/she has three potential options:
• Buy out the lease and include the system as part of the home being sold; • Move the system to the new home (at the homeowner’s expense) if it is within the same
utility district; or • Transfer the lease obligation to the incoming owner, as long as the new homeowner is
interested and meets SolarCity’s credit requirements. If a homeowner chooses to buy out the lease prior to the end of the lease term, SolarCity calculates a "make-whole" payment that it charges the homeowner, in addition to the fair market value of the system. The make-whole payment captures the return on the investment SolarCity and Morgan Stanley would have earned if the PV system had remained in place for the originally agreed upon 15-year term of the lease. As part of the lease contract, SolarCity must be added to the homeowner's insurance policy. The company reports that most customers have sufficient personal property coverage under their existing homeowner’s policy so that the panels can be insured at no additional cost. The lease product had its initial release in March 2008, and the company refined the price and service levels several times in response to customer feedback and competitive pressures. Leases now constitute the majority of the company’s residential revenues. Now that the federal ITC has been reauthorized at 30% through the end of 2016, the company expects to install well over 10 MW of leased systems in 2009.
30
8.2.2 Connecticut Solar Lease Program In August 2008, the Connecticut Clean Energy Fund (CCEF), along with its partners CT Solar Leasing, LLC (a subsidiary of U.S. Bancorp), AFC First Financial Corporation, and Gemstone Lease Management, LLC, announced a residential solar lease program for homeowners who meet certain household income requirements (200% or less of the area’s median income). This residential lease program is combined with CCEF rebates for residential PV systems to enhance the economic feasibility of the individual projects (CT Solar Lease 2008). More information is available at both the CCEF Web site (www.ctcleanenergy.com) and the Connecticut Solar Lease Web site (www.ctsolarlease.com). Gemstone and AFC are also actively developing solar lease programs in other states. The program terms for the Connecticut Solar Lease Program are:
• Zero down payment lease with a 15-year initial term • Fixed, monthly lease payments for the initial 15-year term • Estimated monthly payments are:
o $49/month for a 2 kW system o $97/month for a 4 kW system o $144/month for a 6 kW system.
• At the end of the 15-year lease agreement, the homeowner can: o Buy the system at its fair market value; o Extend the lease for five additional years at a reduced rate; or o Remove the system from the home (at the homeowner’s expense, which CT Solar
estimates will be approximately $3,000 at today’s prices). CT Solar expects many homeowners to extend their lease an additional five years at the end of the 15-year term. The monthly lease payment will be significantly less than the original payment because it will be based on the value of a depreciated asset (i.e., the future value of an older system). As noted, the current monthly lease payment for a 4 kW system is approximately $97 ($1,164/year). However, according to program administrators, it estimated to be $29 a month ($348/year) during the five-year extension period. The Connecticut Solar Lease Program is a state-sponsored initiative that directs homeowners to work with one of more than 20 pre-approved qualified installers versus the single installer model of SolarCity. The program requires installers to provide a five-year warranty on installation labor in addition to warranties on equipment of at least five years and a minimum 20-year power warranty on the panels. Under the Connecticut Solar Lease Program, the homeowner is responsible for maintenance and repairs, including any replacement of the inverter (which for a residential system can cost as much as $3,000-$4,000 at today's prices), although this may change in the future. Including free maintenance into the multi-installer model is more complicated than doing so in the single installer model. However, to offset some of the maintenance and repair burden, CT Solar creates a savings account for each homeowner under its Solar Dividends program. Fifty percent (50%) of the revenue generated by the sale of RECs—up to a price of $30/REC38
38 One REC equals one MWh of renewable energy generation.
—is deposited into an account for the homeowner, which can be used for future operation and maintenance costs (including inverter replacement), purchase of the
31
system at the end of the lease term, or removal of the system. If REC prices exceed $30, 100% of the proceeds above $30 go into the homeowner’s account. If the homeowner sells the house, the lease can be transferred to the new homeowner. There are no income limits on the transfer to the new homeowner; therefore, any homeowner will qualify as long as they have acceptable credit and can demonstrate that they can handle the lease payments. In order to cancel the lease agreement, the homeowner would have to prepay all future lease payments ("make-whole") in addition to covering the cost of having the system removed. In response to the removal of the residential ITC cap, CCEF reduced the level of residential rebates for PV, effective October 28, 2008, to $4/watt for the first 5 kW and $2.50/watt for the next 5 kW, up to 10 kW39
Third-party ownership using a power purchase agreement (PPA) is rapidly becoming the primary model for financing large PV systems in the commercial and public sectors, and it is beginning to emerge for residential customers as well (Guice and King 2008). Similar to the lease model described above, the third-party ownership model can fully monetize the federal PV tax incentives available to non-residential owners. In fact, the third-party ownership model is the
(CCEF 2008a). However, as of November 2008, due to a lack of funds, CCEF suspended the residential rebates for PV except for homeowners who participate in the solar lease program (CCEF 2008b). As a result, even with the removal of the ITC cap, the Connecticut homeowner likely will choose the solar lease option, given the loss of the up-front rebate. 8.2.3 Solar Lease Model Summary The emergence of the solar lease has created a new model to finance the cost of a residential PV system, particularly in markets where the lease can be combined with good PV incentives, and/or revenues from SREC sales. As the two examples in this report illustrate, the details of each lease program will vary across key dimensions such as fixed or adjustable lease payments, the term of the lease, and responsibility for system maintenance and repairs. The removal of the residential ITC cap increases the importance of promoting other aspects of the solar lease model, especially in those areas where the residential rebates for PV aren’t reduced or eliminated. Outsourcing the operation and maintenance of the PV system to the lessor (or installer), as in the case now with SolarCity and likely in the future for the Connecticut Solar Lease Program, is one advantage of the solar lease model. Some homeowners may prefer hassle-free solar electricity even if the cost per kWh is higher. In addition, homeowners may not have access to cash to pay for the PV system outright or are unable to qualify for a loan in today's market, so a solar lease may be their only financing option. Finally, the solar lease program administrator may be a more effective aggregator of SRECs. With more SRECs to sell, the program administrator can likely sell them at a higher price compared to the individual homeowner with just a few (or even just one) SRECs to sell each year. Therefore, in many cases, the solar lease may be the best choice for the homeowner. 8.3 Third-party Ownership and the Power Purchase Agreement
39 Rebates are adjusted, usually downward, based on the expected performance of the system. According to the CCEF, the average rebate is 93% of the full amount. This implies that a 4 kW system would receive an up-front rebate of $14,880 versus $16,000 for an optimal system (or $3.72/watt instead of $4/watt).
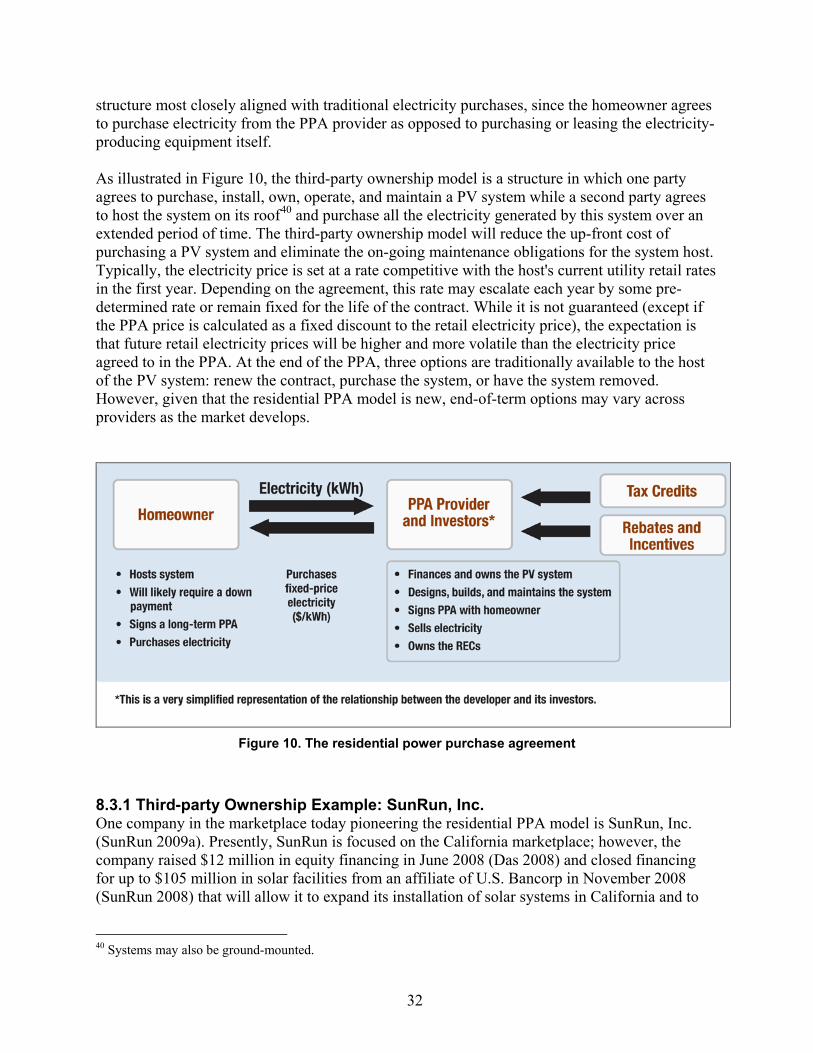
32
structure most closely aligned with traditional electricity purchases, since the homeowner agrees to purchase electricity from the PPA provider as opposed to purchasing or leasing the electricity-producing equipment itself. As illustrated in Figure 10, the third-party ownership model is a structure in which one party agrees to purchase, install, own, operate, and maintain a PV system while a second party agrees to host the system on its roof40 and purchase all the electricity generated by this system over an extended period of time. The third-party ownership model will reduce the up-front cost of purchasing a PV system and eliminate the on-going maintenance obligations for the system host. Typically, the electricity price is set at a rate competitive with the host's current utility retail rates in the first year. Depending on the agreement, this rate may escalate each year by some pre-determined rate or remain fixed for the life of the contract. While it is not guaranteed (except if the PPA price is calculated as a fixed discount to the retail electricity price), the expectation is that future retail electricity prices will be higher and more volatile than the electricity price agreed to in the PPA. At the end of the PPA, three options are traditionally available to the host of the PV system: renew the contract, purchase the system, or have the system removed. However, given that the residential PPA model is new, end-of-term options may vary across providers as the market develops.
Figure 10. The residential power purchase agreement
8.3.1 Third-party Ownership Example: SunRun, Inc. One company in the marketplace today pioneering the residential PPA model is SunRun, Inc. (SunRun 2009a). Presently, SunRun is focused on the California marketplace; however, the company raised $12 million in equity financing in June 2008 (Das 2008) and closed financing for up to $105 million in solar facilities from an affiliate of U.S. Bancorp in November 2008 (SunRun 2008) that will allow it to expand its installation of solar systems in California and to
40 Systems may also be ground-mounted.
33
other regions of the country. According to the company’s Web site, SunRun offers two solar service plans to homeowners: SunRun Total Solar and SunRun Power Plan (SunRun 2009b). Under the Total Solar option, the homeowner prepays 18 years worth of PV-generated electricity upfront. Depending on the size and characteristics of the system, this prepayment can range from $10,000 to $50,000 (Dyke 2009). No additional payments are required at any time after the initial payment. SunRun will install, own, insure, and maintain the system on the customer’s roof. The power production is guaranteed and the company will refund any prepaid amounts that are not actually generated by the PV system. The Power Plan requires a much smaller initial payment, which can range from $2,000 - $8,000 (SunRun 2009a). Again, SunRun installs, owns, insures, and maintains the system. Under the Power Plan however, each month the homeowner will purchase the electricity generated by the PV system from SunRun over the 18-year life of the agreement. As with the Total Solar option, the power production is guaranteed. Given that the Power Plan has a lower up-front cost, it is the more popular of the two plans offered by SunRun. The price the customer pays for the electricity is fixed for the life of the agreement whether it is prepaid as in the case of the Total Solar Plan or paid monthly under the Power Plan. Depending on the specifics of each installation, this fixed cost of electricity will be in the range of $0.135 - $0.30/kWh which compares favorably to peak retail utility rates in California (Dyke 2009). If future electricity rates increase over time, the value of this fixed priced power will become increasingly more attractive. If a residential customer needs to sell the house, SunRun offers three options:
• Assign the PPA to the buyer of the home; • Prepay the PPA (if using the Power Plan) and add this prepaid electricity to the sales
price of the home (or offer this free electricity as an incentive when selling the house); or • Purchase the PV system outright from SunRun and sell it with the house.
o Under this option, the new homeowner will be responsible for all maintenance, repairs, and insurance going forward.
8.4 Property Tax Assessment Model Two of the major barriers associated with residential PV systems are addressed by the property tax assessment model which is being piloted in Berkeley, California (Berkeley 2009), Palm Desert, California (Palm Desert 2009), and Boulder, Colorado (Boulder 2008). The first barrier is the initial cost; the second is the difficulty of recouping a 20-year investment when the average homeowner may move one or more times within that time frame. The basic structure under the property tax assessment model involves a city loaning homeowners the money required to install PV systems (and make energy efficiency investments). The city gets the money for the program by issuing long-term bonds, in the case of Berkeley and Boulder, or tapping into the city's general fund, in the case of Palm Desert. The city then makes loans to homeowners to finance the installation of their PV systems. These loans are repaid over a long period of time—20 years in the case of Berkeley—via a special property tax assessment collected annually or semi-annually, depending on the program. The homeowner will only pay a
34
modest administration fee upfront, eliminating the up-front cost barrier issue. If a homeowner sells the home before the loan is repaid, the PV system and the associated special property tax remain with the house. This addresses the second barrier: The homeowner only pays for (and benefits from) the PV system while living in the house. When the home is sold, the new homeowner assumes the costs (and the benefits) of the system until the property tax assessment is paid off or they move. As these programs are new and not fully deployed, it is too early to identify lessons learned from program design or implementation. However, the initial interest in the model is encouraging. Many cities and counties across the country are closely watching how Berkeley, Boulder, and Palm Desert implement these programs. It remains to be seen what the administration costs will be once the programs are up and running beyond the pilot phase, and how participating homes perform in the resale market. It is also unclear whether the bond-based models will be able to raise the necessary capital in today’s stressed financial market. Nonetheless, the property tax assessment model may become one of the primary mechanisms to finance residential PV systems going forward. The Berkeley model is described in detail below.
8.4.1 Sustainable Energy Financing District: The City of Berkeley's FIRST Initiative The city of Berkeley and the state of California have several unique taxing authority aspects that may or may not be replicable elsewhere. The basic property tax assessment model is structured after the State’s Mello-Roos Community Facilities Act of 1982 (DeSnoo 2008), which was created to allow for alternative financing mechanisms for community improvements and services (Mello-Roos 2008). Berkeley’s City Charter allows the city to finance the up-front cost of burying electric wires underground, on behalf of the utility, by issuing tax exempt bonds (Berkeley 2008). Residents in the neighborhoods where such projects are carried out repay the city over 20 years through a special line item assessment on their property tax bills. Using this authority, Berkeley established a Sustainable Energy Financing District, which creates a special tax financing law for energy improvements, such as energy efficiency and PV. In November 2007, the Berkeley City Council approved the concept of financing residential PV systems and other energy efficiency improvements through this system of special property taxes. Once established, the Financing Initiative for Renewable and Solar Technologies (FIRST) initiative will allow participating property owners to finance the up-front cost of installing energy improvements, including PV systems, with special, semi-annual tax payments. The goal of the program is to address the up-front financial burden associated with installing residential PV systems and other large-scale energy improvements (DeSnoo 2008). The city plans to issue long-term bonds to finance the total up-front cost of the systems. The debt service on the bonds and any administrative fees will be paid from a special assessment added to the homeowner's property tax bill over a 20-year period. The city will have a lien on the property which it can exercise if the homeowner fails to pay the special assessment. As property taxes have priority over other debts associated with the home, including the mortgage, these special tax liens should make the debt the city issues attractive to investors (Berkeley 2008). In May 2008, the City Council amended the city municipal code to allow residential PV systems to be financed using the special tax district model (Berkeley 2008a). On September 16, 2008, the
35
City Council unanimously approved the creation of the actual special tax district to allow the FIRST initiative to go forward (Barringer 2008). In November 2008, Berkeley opened the application process for the pilot phase of the program to test the concept before proceeding with a large-scale launch. A total of 38 projects have been selected for funding with individual projects capped at $37,500 per installation (Berkeley 2009). According to Berkeley's Mayor's Office, the interest rate on the loans during the pilot phase will be the 10-year U.S. Treasury rate of +3.25% (Berkeley 2008). The city will add a 1% per annum charge to this interest rate to cover the city's administrative costs. Using the Berkeley FIRST calculator, a $20,000 loan would be repaid over 20 years with semi-annual payments of $1,030 (Berkeley FIRST 2008b). This would be equal to a monthly payment of $172. The tax assessment will be offset by the monthly utility bill savings, reducing the net cost of participating in the program. The interest portion of the special assessment may also be tax deductible, creating additional savings. Researchers at the University of California at Berkeley have calculated that approximately 4,000 homes in the city are suitable for a PV system; however, it is not clear how many of these homeowners will be interested in participating in the program. The total investment for the program could reach $80 million dollars, if all 4,000 homes participated in the program with an average loan of approximately $20,000. If the assumption that an average system size in Berkeley is 3 kW, the total installed capacity financed by the program could theoretically reach 12 MW. It is still uncertain how widely FIRST can be replicated. Berkeley's city charter allows the property tax assessment finance model and it has been amended to include PV systems. As noted, Palm Desert, California, has launched a similar program and other cities in the state such as San Francisco, Santa Cruz, and Santa Monica are currently evaluating it as well (Bolinger 2008). While only 108 out of 478 cities in the state are charter cities (Berkeley 2008), California passed legislation (AB 811) on July 21, 2008, that will allow all cities in the state to offer a similar program using special tax assessments independent of charter status (Roosevelt 2008). However, outside of California (and Colorado), it is unclear how many cities and states have the necessary laws and regulations in place to allow the development of the property tax assessment model for PV. 8.5 Using Renewable Energy Certificates as a Currency to Repay Loans As discussed in Section 4, solar renewable energy certificates (SRECs) represent the environmental attributes of the solar electricity being generated by a PV system. Purchasers of these SRECs come from both the renewable portfolio standard (RPS) compliance market and the voluntary green power market. As a result, the ability to sell SRECs and use the proceeds to finance the installation of a PV system can be a key element in a total PV financing package.
36
8.5.1 New Jersey PSE&G Solar Loan Program41,42
41 A number of documents related to the solar loan program are available on PSE&G's Solar Loan Program
New Jersey has an aggressive RPS, where 22.5% of its electricity must come from renewable sources by 2020 (DSIRE 2008f). Of this, 2.12%—an estimated 1,500 MW—must come from solar. Utilities, including PSE&G, will use SRECs to demonstrate compliance with the state's RPS. One of the ways PSE&G will obtain these SRECs will be through a new solar loan program. In April 2008, PSE&G received approval from New Jersey regulators to offer a solar loan program to support the deployment of 30 MW of PV in the next two years. PSE&G has committed to invest $105 million in the program. Of the 30 MW, a total of 9 MW will be allocated to residential PV systems (6 MW for standard homes and 3 MW for multi-family, affordable housing) (PSE&G 2008a). The utility estimates that approximately 900 new residential systems will be financed by the solar loan program. On July 16, 2008, the utility formally opened the application process for residential systems (PSE&G 2008b). The PSE&G loan will cover up to 40-60% of the cost of a PV system. The loan will carry a fixed interest rate of 6.5% and have a 10-year term for residential borrowers (PSE&G 2008a). The solar panels must have a 20-year warranty. The loan size will be based on the expected total generation of SRECs so that the revenue from SREC sales closely matches the loan payments. The borrower will repay the loan by selling all SRECs generated by the PV system to the utility, supplemented by annual cash payments if the PV system does not generate enough SRECs (PSE&G 2009a). PSE&G has set a floor price for the SRECs of $475/MWh (47.5¢/kWh). The borrower will be able to sell at either this floor price or the market price, whichever is higher. If the SREC market prices are high enough that the loan is paid off before the end of the 10-year term, PSE&G has the option to continue to buy the RECs through the end of year 10, at 75% of the market value at that time (PSE&G 2008a). In order to sell the SRECs to PSE&G, the borrower must set up an electronic trading account through the New Jersey Solar Renewable Energy Certificate Program (NJCEP 2008b). Once the PV system is operational and the SREC account is set up, PSE&G will meter the production of SRECs from the PV system and credit the borrower's loan account accordingly. Finally, PSE&G will retain a security interest in the system and will have the right to remove it if the homeowner defaults on the loan. If a homeowner sells the house, he can either repay the outstanding amount of the loan at the closing, or transfer the loan obligation to the new homeowner. If the new owners pass a credit check, meet applicable criteria, and pay legal and administrative costs, they can assume the loan obligation for the remaining years of the loan (PSE&G 2009). Assuming the PV system remains on the roof, PSE&G retains the option to buy 100% of the SRECs that the system generates over the original 10-year term from the new homeowner.
Web site that can be found at: http://www.pseg.com/customer/solar/index.jsp. 42 Additional information was obtained from Albert Grisolia, a DSM Consultant with PSE&G via phone conversations and email exchanges in July 2008.
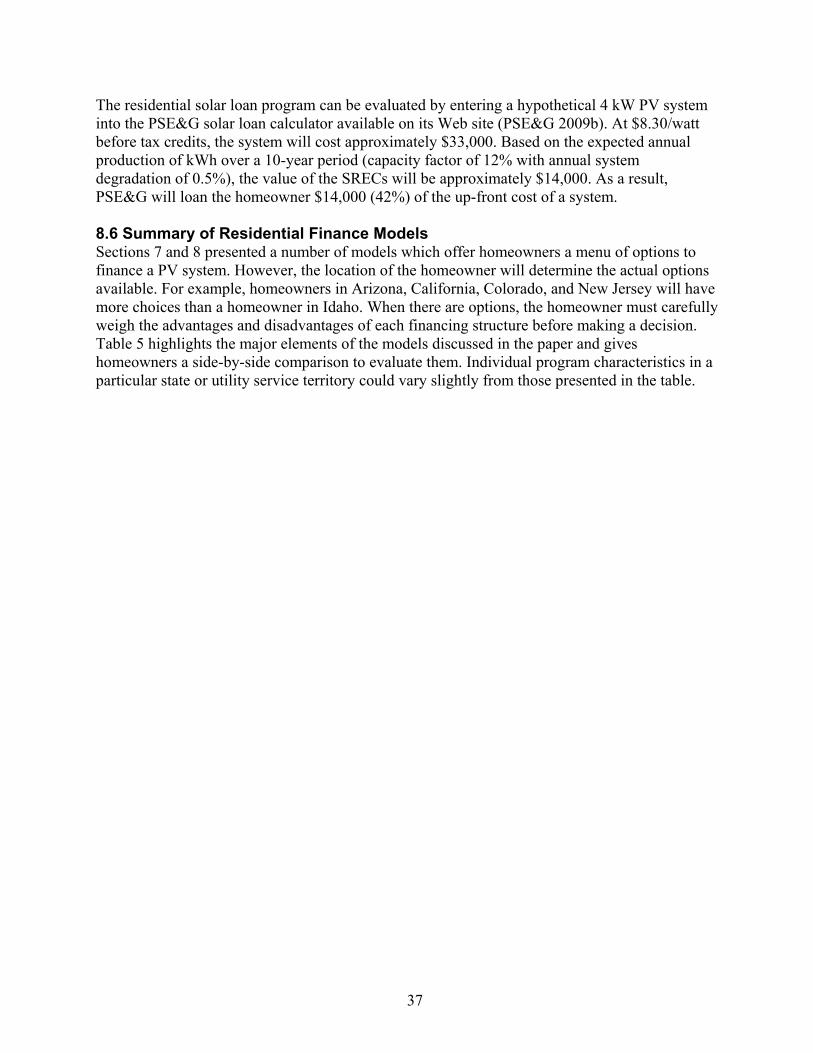
37
The residential solar loan program can be evaluated by entering a hypothetical 4 kW PV system into the PSE&G solar loan calculator available on its Web site (PSE&G 2009b). At $8.30/watt before tax credits, the system will cost approximately $33,000. Based on the expected annual production of kWh over a 10-year period (capacity factor of 12% with annual system degradation of 0.5%), the value of the SRECs will be approximately $14,000. As a result, PSE&G will loan the homeowner $14,000 (42%) of the up-front cost of a system. 8.6 Summary of Residential Finance Models Sections 7 and 8 presented a number of models which offer homeowners a menu of options to finance a PV system. However, the location of the homeowner will determine the actual options available. For example, homeowners in Arizona, California, Colorado, and New Jersey will have more choices than a homeowner in Idaho. When there are options, the homeowner must carefully weigh the advantages and disadvantages of each financing structure before making a decision. Table 5 highlights the major elements of the models discussed in the paper and gives homeowners a side-by-side comparison to evaluate them. Individual program characteristics in a particular state or utility service territory could vary slightly from those presented in the table.
38
Table 5. Advantages and Disadvantages of Residential Financing Structures43
Residential PV Matrix from
Homeowners’ Perspective
Purchase with Cash
Home Equity Loan
Solar Lease
Residential PPA
SunRun Power Plan
Property Tax
Model
PSE&G Solar REC
Loan Program
Up-front cost to homeowner 36-70% None/Low 0 - 20% 5-25% None/Low 36%
Homeowner has maintenance responsibilities
Yes Yes Depends
on program
No Yes Yes
Homeowner Pays for Inverter Replacement
Yes Yes Depends
on program
No Yes Yes
Likely impact on future utility bills* Lower Lower Lower Lower** Lower Lower
Required cash payments (above utility bills)
No Yes - loan payment
Yes - lease
payment
Yes - electricity payment
Yes - property
tax payment
No - although
annual true-ups possible
Ownership of PV system in Year 1 Yes Yes No No Yes Yes
Take residential federal tax credit Yes Yes No No Yes*** Yes***
* Compared to buying 100% of the electricity from the local utility. This does not mean that other costs, such as a loan or lease payment will be 100% offset by retail utility bill savings. ** The third-party PPA ownership model assumes that retail electricity prices will exceed the PPA price. While likely, unless structured as a fixed discount to retail prices, it is not guaranteed. *** Based on the proposed changes to the subsidized energy financing concept in the stimulus bill. As Table 5 illustrates, the mechanism selected to finance the installation of a PV system will have distinct cash flow implications. Certainly, using cash to purchase a system will have the largest impact on reducing monthly obligations, although it requires a large up-front cash outlay. The home equity loan and property tax assessment model significantly reduce the up-front payment (except for certain modest fees) but require monthly or semi-annual debt payments for 10-20 years in addition to on-going system maintenance obligations. The SREC loan appears to be a promising option, especially when combined with rebates, yet there will still be a residual amount to finance. The up-front costs associated with the solar lease and the residential PPA will vary across programs, yet the potential combination of low up-front costs and the opportunity to outsource the maintenance responsibilities are attractive. In summary, a homeowner with the luxury of many different options will need to determine which variables are the most critical. For 43 The authors recognize that most of these models are only offered in limited locations. The upfront cost calculations are derived from the cost calculations presented earlier in the report and should be considered rough estimates only.
39
most, but not all, this variable will be minimize the up-front costs. However, for homeowners in most states, the choice may simply be between a home equity loan and cash. As a result, just as no two homeowners are in exactly the same situation, no two solutions will be exactly the same. In the end, the long-term goal of PV installers is to promote widespread adoption of all of these models to create a market where there are a number of affordable options available, allowing homeowners to select the one that best meets their needs. Despite the promise of the new models described in this section, they all leave out a significant percentage of the population: those who would like to "go solar" but who rent; those who live in apartment buildings; those who own homes but have poor solar resources; or those who simply can't afford a full PV solution, but who want and can do more than participate in a voluntary green power program. For these people, community-based solar programs are an exciting development and the focus of Section 9.
40
9.0 Community Solar
Traditionally, residential PV has been discussed in the context of an individual homeowner installing a system on his or her rooftop independently of the neighbors. However, two trends are expanding the definition of residential PV: 1) the installation of a single large PV system, usually in coordination with the local municipal utility, with community members either purchasing proportional ownership in the system or subscribing to representational “shares” in it; and 2) community solar initiatives where neighbors join together to collectively install PV systems on their own homes and save money in the process. Community projects can lower the cost of PV systems on a per-watt basis given the benefits associated with economies of scale. These projects can also provide greater access to solar electricity by decoupling home ownership and adequate solar resources with the PV system itself.
9.1 Ellensburg, Washington: Virtual Net Metering In 2006, the City of Ellensburg’s municipal utility installed a 36 kW community PV system. In 2008, Ellensburg increased the size of the system by 21 kW to 57 kW and a third phase is scheduled for June 2009 for another 24-30kW, depending on the level of community contributions. Labeled the first community solar installation in the country, the utility solicited contributions from residents to finance the installation of the system (Nystedt 2008). The value proposition to the contributors was that in exchange for an up-front contribution to the PV installation, they’d receive a credit on their electric bill over the next 20 years. Every three months, the utility checks the PV system’s meter and records electricity production. Using the utility’s wholesale rate of $0.035/kWh, the city calculates the dollar value of electricity produced during those three months and divides it among the system’s contributors. As an example, if a resident’s contribution was equivalent to 3% of the cost of the system, he or she would get 3% of the value of the electricity generated by the system during the three month period. The city is presently working to qualify the community participants for the state’s solar production credit of $0.15/kWh which would significantly increase their return on investment and help stimulate greater community participation in the project (DSIRE 2008g). If a participating homeowner leaves the community, he or she can sell his share to another community member, sell it with the house, or donate it. All the city needs to know is what utility account should receive the future credits (Nystedt 2008). Initially, 73 utility customers contributed more than $120,000 to the community installation. The contributions ranged from $250 to $11,000 ($250 was the minimum allowable initial contribution). The system is installed on city-owned land in a high-visibility site near a major highway. The city will continue accepting contributions from their residential and commercial sectors over the next three years to expand the PV system to 165 kW. The city has retained ownership of the RECs and is also evaluating options to expand the program to city-owned rooftops. The $120,000 in initial contributions made by utility customers went primarily toward the purchase of the solar modules. In addition, the Bonneville Environmental Foundation (BEF) gave the city 40 additional solar modules (a $45,000 value). BEF is a non-profit organization that provides grants for renewable energy and watershed restoration activities with proceeds from the sale of voluntary RECs (Bonneville 2008). Finally, funds from the city's conservation and
41
renewable program were used to cover the remaining project costs ($135,000), including labor and materials for the solar system’s infrastructure, operations and maintenance, design development, and marketing. The goal of the Ellensburg project is to overcome many of the barriers associated with residential solar PV systems. These barriers include the high up-front cost of installing PV and owning a home that does not receive adequate solar resources due to shading, roof orientation, or pitch. In addition, there are community members who are interested in solar but rent or live in multi-tenant dwellings where PV installations are not feasible. The project was also designed as a middle ground between the voluntary green power programs where utility customers can pay $5-10 per month to support renewable energy programs and the $20,000-$30,000 investment required to install a PV system. Gary Nystedt, the community project’s manager at the municipal utility, framed it as a solution for residents that can afford $2,000 for PV but not $20,000, and who want to do more than just participate in a green power program. The city also saw the community solar program as a way to keep utility dollars in the community as Ellensburg imports all of its electricity. Finally, the utility has fully engaged Central Washington University (CWU), located in Ellensburg, which represents 40% of the demand for electricity in the service territory. CWU students are active participants in the community solar initiative with a least six university departments collaborating on projects such as marketing and outreach to attract more participants to expand the size of the system.
9.2 Sacramento Municipal Utility District (SMUD) SolarShares Program On July 15, 2008, the Sacramento Municipal Utility District (SMUD) inaugurated a 1 MW solar farm and concurrently launched its SolarShares Program. Using the third-party ownership model, SMUD signed a PPA with the solar developer enXco who built, owns, operates, and maintains the ground-mounted, thin-film PV system in the Sacramento area (Huang 2008). enXco will deliver 100% of the solar electricity generated by the system to the grid (SMUD 2008). SMUD customers can subscribe to "shares" in this large PV system to offset, on average, between 20% and 40% of their electricity consumption (Huang 2008). SMUD limits the number of shares that any individual customer can subscribe to, maximizing participation in the program as well as aligning the amount of kW purchased with each customer’s electricity consumption. Customers who are small users (those who use less than 6,000 kWh per year) can choose to participate in SolarShares starting at 0.5 kW up to 1 kW. Medium users, who typically consume 6,000-14,000 kWh per year, can sign up for amounts between 1 to 2 kW, and large users, who consume more than 14,000 kWh per year, can participate at levels from 2 to 4 kW. As of January 2009, 690 customers had enrolled in the program for the entire 1 MW system (Huang 2009). The majority of these customers are in the small and medium class, with 46% and 43% of participants, respectively (Huang 2009). SolarShares participants pay a fixed monthly rate in exchange for the electricity their percentage of the system generates. A customer can subscribe to as little as 0.5 kW for $10.75 a month. Subscribing to shares equivalent to 4 kW will cost $132 a month. In return, the customer will get a per-kWh credit for the electricity that his or her share of the system generates each month. The fee schedule is set up so that SMUD provides the greatest subsidy to customers in the small electricity consumption class to encourage conservation.
42
Once a customer subscribes to shares in the PV system, his or her monthly price will remain fixed for the life of the agreement, which is in place for the life of the SolarShares project (20 years). However, anytime after the first 12 months, the SolarShares customer can cancel the contract at no charge. Canceling within the first 12 months, however, results in a $100 fee as SMUD wants to prevent customers from joining the program only for the summer months when retail electricity rates are the highest. In addition, a customer is free to move throughout SMUD's franchise area and retain his or her subscription in the system. On an annual basis, at least initially, SMUD expects customers' monthly fees will exceed the credits they earn. However, it is possible that in the summer months, when electricity prices are high, the credits may more than offset the monthly fees. In the future, if electricity prices increase as projected, it is possible that the credit from the PV system will offset the fixed monthly charge on an annual basis as well. The SolarShares program builds on SMUD's green power program, Greenenergy, where customers make voluntary monthly payments to support renewable energy. However, SolarShares differs from the green power program in that the renewable electricity is 100% solar and 100% local, whereas the green power program includes multiple renewable technologies from multiple jurisdictions. In addition, SolarShares customers get a credit on their utility bills to partially offset the cost of participation in the program. Anyone can participate in the program and SMUD is marketing SolarShares broadly to include renters, apartment owners, and homeowners who, for a variety of reasons, cannot or decide against installing a PV system on their roofs. In addition to making solar electricity available to customers who are unable to participate in traditional residential PV programs, SMUD also sees the SolarShares model as a more efficient way to deploy significant MWs of PV when compared to multiple and modest-sized residential rooftop systems. 9.3. St. George, Utah: SunSmart Community Solar In partnership with the regional cooperative electric company, Dixie Escalante, the St. George Energy Services Department inaugurated a 100 kW community PV system in October 2008 (SunSmart 2008). Residents of St. George can purchase units in the SunSmart program in 0.5 kW and 1 kW increments for $3,000 and $6,000, respectively, up to 4 kW per customer. The participants will own their shares for 19 years, at which time the city will determine if it will extend the program and if so, what repairs are necessary. The repair costs will be passed on to the participants of the program if they decide to renew their participation. Each month, customers will receive per-kWh credits on their utility bills representing the amount of electricity generated by their share of the PV system. The credit is calculated at the retail rate of electricity. As demand for the program increases, the PV system will be expanded in 100 kW increments. One of the most unique aspects of the SunSmart program is that participants can take advantage of the 25% state tax credit available for PV systems in Utah. The interesting thing about this tax policy, supposedly the first of its kind in the country, is that a participant in the SunSmart program can take a tax credit for a PV system he does not own per se, and is not located on the participant’s property. The state tax credit has a cap of $2,000 which reduces the final cost of the 0.5 kW and the 1 kW increments to $2,250 and $4,000, respectively.
43
9.4 Achieving Economies of Scale through Neighborhood Projects Similar to many other capital purchases, buying PV systems and contracting for their installation as a group can result in significantly lower cost on a per-watt and per-system basis. And while not a community solar project in the manner described above, there are examples of neighbors banding together to collectively purchase and install PV systems in order to lower costs. While it usually takes a motivated neighbor to organize a group of homeowners to consider such a project, the benefits are worth the effort. Certain solar installers and equipment manufacturers will assist in this outreach as a way to increase their sales and they will offer discounts on these bulk purchases in return. Two examples of such community efforts are presented below.
9.4.1 Downtown San Jose Solar Project In San Jose, California, a group of neighbors formed a steering committee to investigate a group purchase of individual PV systems. The committee proceeded to develop a Request for Proposals (RFP) and held a competitive selection process with the goal of lowering the collective cost of the installed PV systems. Included in the RFP process was a request that the solar integrators submit proposals for three actual homes that were a representative cross-section of the community and which varied in terms of orientation, pitch, and shading (REC Solar 2008). Based on the information presented in the RFP responses, 34 homeowners decided to team up to pursue PV installations on their individual residences (Kamzan 2008). Solar developer REC Solar was selected to install all of the systems. In total, 137 kW of PV were installed, representing an average system size of 4 kW. Of the 34 homeowners, 26 financed their systems with SunRun via the residential PPA model (discussed in Section 8.3.1), whereas the remaining eight homeowners financed their systems through other means, including home equity loans from the aforementioned San Francisco-based New Resource Bank (Section 7.2.1). In both cases, homeowners received discounts on their systems as a result of the group effort. According to Marni Kamzan, one of the organizers of the project and now the Community Program Coordinator for REC Solar, the 34 homeowners collectively saved $60,000 by working together to install their PV systems (REC Solar 2008). 9.4.2 SolarCity's Community Solar Discount Program
Prior to releasing its solar lease products, SolarCity sold all of its systems via a cash purchase approach. To generate local marketing buzz and to help reduce logistics/installation costs, SolarCity organized community purchase programs, where discounts of 20-25% could be obtained if residents of a particular town banded together and agreed to purchase and install a minimum of 175 kW (Niver 2008). To date, 13 communities have taken part in the Community Solar Program. According to the company's Web site, discounts for community solar projects are still available, although now at a level of 15-20% (Solar City 2009).
9.5 Mosier Creek Homes, Oregon While the Mosier Creek project is distinct from the community solar projects described earlier in this section, its unique combination of PV and the residential PPA model warrant attention given the scope of this paper. Urban Fund, Inc., a residential developer in the Pacific Northwest, incorporated 28 roof-top PV and solar hot water (SHW) systems into a 34-unit, LEED-certified, new construction townhome development in Mosier, Oregon (DuBois 2007). Each PV system is approximately 3.2 kW. Instead of including the cost of the system into the sales price of the
44
townhome, the Urban Fund created a separate entity, Mosier Solar Services, LLC, to purchase, install, and operate the PV systems for five years (Mosier 2008). Mosier Solar sells electricity at 15% below retail to the homeowners under a five-year PPA contract and provide the solar hot water at no charge. By combining both federal and state incentives for solar, Mosier Creek was able to reduce the installed cost of the systems by 70%. This cost savings is much more than what individual homeowners could achieve by purchasing the systems individually, given the $2,000 cap on the federal ITC (at that time) and the inability to benefit from accelerated depreciation and other tax incentives. The Urban Fund also capped the returns that investors in Mosier Solar Services receive at 10% per annum to minimize costs to the homeowners (Mosier 2008). According to Peter Erikson, founder and managing principal of the Urban Fund, the additional cost of building to LEED-certified standards was $4,000 per unit. This investment in LEED certification reduced the energy consumption of each unit by 40%. The combined PV and SHW system covers 50% of the remaining energy needs of the unit for a total savings of 70% when compared to a similar unit that has no rooftop PV and SHW systems and is not LEED-certified. At the end of the five-year PPA term, residents have the option to purchase the system at the fair market value of the system; it is estimated that will be approximately $5,000 (actual value is determined after five years). Given the warranties on the system components and expected life of the systems (at least 20 years), Erickson believes all the homeowners will decide to purchase their systems. For an estimated cost of $5,000, the homeowner would be able to cover 50% of the unit's energy needs for the next 20 years. However, if a homeowner decides not to purchase the system after five years, Mosier Creek has the option of selling all the power the system generates to the utility. In that case, the homeowner would need to purchase 100% of his or her electricity from the utility. New homeowners also have the option to purchase the PV system upfront instead of signing the PPA. The Mosier Creek Project was completed in June 2007. Approximately one-third of the units sold relatively quickly prior to the housing market slump. With Countrywide Financial, a troubled mortgage company (and now part of Bank of America), as a primary housing lender in the area, subsequent sales have slowed in part to a reduction in financing options. According to Erikson, Countrywide did take into account the utility bill savings benefit that the prospective homeowners would have received as a result of the roof top PV and SHW when their mortgage debt capacity was calculated. Two and three bedroom units list currently for $350,000; one bedroom units list for $225,000. Community-based initiatives are an exciting concept that can bring PV within reach of many of those excluded from traditional rooftop solutions. Economies of scale are brought to bear in an industry where high costs still present an important barrier. As the examples demonstrate, there are many variations of the community solar model, and all of them have a role in accelerating the deployment of PV. In the long run, community solar models may be the preferred solution for many electricity consumers that want to benefit from solar power given the advantages highlighted in this section.
45
10.0 Conclusion
Increasing the rate at which PV systems are installed on existing homes can translate into a significant number of megawatts of new installed capacity. Adding a PV system to just 1% of single-family, owner-occupied residences would represent approximately 6,000 MW of new capacity. However, the high up-front cost of solar is still a significant challenge. The financial benefit of a lower utility bill as a result of installing a PV system is usually not enough of an economic incentive for the homeowner. Cash incentives, RECs, and tax credits are all critical to lowering the cost of a residential PV system. Even after taking advantage of all of these additional incentives however, there will still likely be a significant residual amount the homeowner must finance. Traditionally, this residual amount has been financed with cash, a home equity loan, or a refinanced mortgage loan. However, there are a number of new, creative financial models hitting the market with the goal of making solar more affordable to more homeowners, including:
• The solar lease, a third-party finance model, fully monetizes the available tax credits for PV available to non-residential owners and lowers up-front costs. The homeowner leases the system from the lessor and offsets the lease payments with a reduction in utility bills.
• The third-party, residential PPA model, like the solar lease, also maximizes available tax incentives and sells competitively priced electricity to the homeowner who hosts the system on his or her roof.
• The property tax assessment model is being piloted by a handful of cities and, if successful, will provide long-term financing for residential PV and address the transfer of ownership issue.
• PSE&G in New Jersey is making loans to its customers to install residential PV systems. These loans will be paid back over 10 years by selling back the RECs the PV systems generate, thereby minimizing the cash needed to repay the debt.
In addition to these individual residential models, there are a number of exciting community-based solar projects around the country that seek to provide broader access to PV, often with a focus on renters, those who live in multi-tenant buildings, those whose homes are poorly situated for solar, or those who can't afford PV systems on their own. Ellensburg, Washington, Sacramento, California, and St. George, Utah, are three cities where the local utilities are creating greater access to solar power for their customers. Community initiatives such as the Downtown San Jose Project are another way to create opportunities for savings based on the economies of scale inherent in large PV module purchases, and large-scale installations. Depending on the particular project, community members can join forces to install individual systems on their own roofs or they can jointly benefit from a single, large PV system in coordination with the local utility. Regardless of the mechanisms, community solar projects expand the universe of those who can benefit from solar electricity. A number of financial incentives for residential PV were described in this report, along with examples that showed how they can be combined with creative, new financing programs to expand the market. Unfortunately, at the present time, these programs are limited to select locations around the country. However, by calling attention to these initiatives and highlighting success stories, other states, cities, and utilities across the country may adopt them. In doing so,
46
homeowners would then have a menu of options available as they pursue the benefits of PV-generated electricity.
47
References
Arfin, D.; Niver, M. (June 5, 2008). Telephone interview. SolarCity. Arizona Public Service (APS) (2008). Renewable Incentive Program. APS online. Accessed April 6, 2008. http://www.aps.com/main/green/choice/choice_23.html?source=hme Barringer, F. (September 17, 2008). “Berkeley approves city-backed loans for solar panels.” New York Times online. Accessed September 2008. http://www.nytimes.com Bolinger, M. (February 2008). “Property Tax Assessments as a Finance Vehicle for Residential PV Installations: Opportunities and Potential Limitations.” Berkeley, CA: Lawrence Berkeley National Laboratory. Accessed August 2008. http://www.cleanenergystates.org/library/Reports/LBL_property-tax-finance_Feb08.pdf Bolinger, M. (January 2009). “Financing Non-Residential Photovoltaic Projects: Options and Implications.” Lawrence Berkeley National Laboratory technical report LBNL-1410E. http://eetd.lbl.gov/EA/EMP/reports/lbnl-1410e.pdf Bonneville Environmental Foundation (Bonneville) (2008). About BEF. (http://www.b-e-f.org/about/) Buildings Energy Data Book (2007). Residential Energy Consumption from September 2007. Buildings Energy Data Book online. http://buildingsdatabook.eere.energy.gov/docs/1.2.3.pdf California Solar Initiative Program Handbook (CSI) (January 2009a). San Francisco, CA: California Public Utilities Commission. Accessed February 4, 2009. http://www.gosolarcalifornia.ca.gov/documents/CSI_HANDBOOK.PDF California Solar Initiative (CSI) (February 2009b). Statewide Trigger Point Tracker. Accessed February 4, 2009. http://www.csi-trigger.com/ City and County of San Francisco (SFGOV) (June 2008). "Mayor Newsom Praises Passage of Nation's Largest Municipal Solar Energy Incentive Program." Press release, Office of the Mayor. http://www.sfgov.org/site/mayor_index.asp?id=82535 City of Berkeley (Berkeley) (2009). “Berkeley FIRST: Financing Initiative for Renewable and Solar Technology.” Office of the Mayor. Accessed February 2009. http://www.ci.berkeley.ca.us/ContentDisplay.aspx?id=26580 City of Berkeley (Berkeley) (2008a). “Berkeley FIRST: Financing Initiative for Renewable and Solar Technology, Frequently Asked Questions.” Office of the Mayor. Accessed November 2008. http://www.ci.berkeley.ca.us/ContentDisplay.aspx?id=27076. City of Berkeley (Berkeley) (2008b). “Berkeley FIRST: Payment Calculator." Accessed November 2008. http://www.berkeleyfirst.renewfund.com/node/105
48
City of Palm Desert (Palm Desert) (2009). "Energy Independence Program." Accessed February 2009. http://www.cityofpalmdesert.org/Index.aspx?page=484 Connecticut Clean Energy Fund (CCEF) (2008a). “Rebate Amount.” Connecticut Clean Energy Fund Web site. Accessed January 2009. http://www.ctcleanenergy.com/YourHome/SolarRebates/RebateAmounts/tabid/77/Default.aspx Connecticut Clean Energy Fund (CCEF) (2008b). “Power from the Sun: Notice of Funds Availability-Solar PV Rebate Program.” Connecticut Clean Energy Fund Web site. Accessed January 2009. http://www.ctcleanenergy.com/YourHome/SolarRebates/tabid/68/Default.aspx County of Boulder (Boulder) (2008). "ClimateSmart Program" http://www.bouldercounty.org/bocc/Ballot_Issues/2008/1A.htm#FAQ. CT Solar Lease (September 2008). “Connecticut's Special Solar Energy Leasing Plan for Homeowners.” Presented at the Clean Energy States Alliance on September 19, 2008. Accessed November 2008. http://www.ctsolarlease.com/ Das, A. (June 2008). “U.S residential solar start-up raises $12 million.” SunRun, Inc. http://www.sunrunhome.com/downloads/pdf/us_residential_solar_start_up_raises_12_million.pdf
Database of State Renewable and Efficiency Incentives (DSIRE) (2008a). “Public Benefit Funds for Renewable Energy.” Database of State Renewable and Efficiency Incentives online. Accessed April 2008. http://www.dsireusa.org/library/includes/seeallincentivetype.cfm?type=PBF¤tpageid=7&back=regtab&EE=0&RE=1 Database of State Renewable and Efficiency Incentives (DSIRE) (2008b). Residential Energy Conservation Subsidy Exclusion (Personal).” Database of State Renewable and Efficiency Incentives online. http://www.dsireusa.org/library/includes/incentive2.cfm?Incentive_Code=US03F&State=federal¤tpageid=1&ee=1&re=1 Database of State Renewable and Efficiency Incentives (DSIRE) (2008c). “Louisiana Incentives for Renewable Energy.” Database of Incentives for Renewables and Efficiency online. Accessed August 2008. http://dsireusa.org/library/includes/incentive2.cfm?Incentive_Code=LA11F&state=LA&CurrentPageID=1&RE=1&EE=1
Database of State Renewable and Efficiency Incentives (DSIRE) (2008d). “Solar and Fuel Cell Tax Credit - New York State.” Database of Incentives for Renewables and Efficiency online. Accessed August 2008. http://dsireusa.org/library/includes/incentive2.cfm?Incentive_Code=NY03F&state=NY&CurrentPageID=1&RE=1&EE=1
49
Database of State Renewable and Efficiency Incentives (DSIRE) (2008e). “Federal Incentives for Renewables and Efficiency: Modified Accelerated Cost-Recovery System (MACRS).” Database of State Incentives for Renewables and Efficiency online. Accessed August 2008. http://www.dsireusa.org/library/includes/incentive2.cfm?Incentive_Code=US06F&State=federal¤tpageid=1&ee=1&re=1 Database of State Renewable and Efficiency Incentives (DSIRE) (2008f). “New Jersey Incentives for Renewables and Efficiency: New Jersey Renewable Portfolio Standard.” Database for State Renewables and Efficiency online. Accessed August 2008. http://www.dsireusa.org/library/includes/incentive2.cfm?Incentive_Code=NJ05R&state=NJ&CurrentPageID=1&RE=1&EE=1 Database of State Renewable and Efficiency Incentives (DSIRE) (2008g). “Washington Renewable Energy Production Incentives.” Database for State Renewables and Efficiency online. Accessed August 2008. http://www.dsireusa.org/library/includes/incentive2.cfm?Incentive_Code=WA27F&state=WA&CurrentPageID=1&RE=1&EE=1 Database of State Renewable and Efficiency Incentives (DSIRE) (2005). “Residential Solar and Fuel Cell Tax Credit Energy Policy Act of 2005.” Database of State Renewable and Efficiency Incentives online. Accessed April 2008. http://dsireusa.org/library/includes/incentive2.cfm?Incentive_Code=US37F&State=federal¤tpageid=1&ee=1&re=1 DeSnoo, N. (July 2008). Email communication. City of Berkeley, CA. DuBois, D. (October-November 2007). “Affordable Solar: High-Performance Housing + Smart Investing." Home Power Magazine. pp. 30-37. Dyke, R. (February 2009). Email communication. SunRun, Inc. Energy Information Administration (EIA) (2009). State Energy Profiles. EIA online. http://tonto.eia.doe.gov/state/index.cfm Energy Information Administration (EIA) (2008). State Data Directory. EIA online. Accessed December 2008. http://www.eia.doe.gov/cneaf/electricity/page/sales_revenue.xls Erikson, P. (June-July 2008). Telephone interviews and email correspondence. Urban Fund, Founder and Managing Principal. freEner-g (2009). “About freEner-g” and “Frequently Asked Questions.” freEner-g Web site. Accessed January 2009. http://www.freener-g.com/index.html and http://www.freener-g.com/faq.html Guice, J.; King, J.D.H. (February 14, 2008). “Solar Power Services: How PPAs are Changing the PV Value Chain.” Greentech Media.
50
Huang, R. (July 16, 2008). “SolarShares: Solar for All.” Presented during a SEPA Teleconference on September 18, 2008. Interstate Renewable Energy Council (IREC) (March 2008). “Public Benefit Funds for Renewables (Estimated Funding).” Report by IREC and North Carolina Solar Center. Accessed April 2008. http://www.dsireusa.org/documents/summarymaps/PBF_Map.ppt Interstate Renewable Energy Council (IREC) (2007a). “Freeing the Grid: 2007 Edition.” Report No. 02-07, p. 30. New York, NY: Interstate Renewable Energy Council. http://www.newenergychoices.org/uploads/FreeingTheGrid2007_report.pdf Interstate Renewable Energy Council (IREC) (2007b). “Connecting to the Grid: A Guide to Distributed Generation Interconnection Issues.” 5th Edition, p. 28. New York, NY: Interstate Renewable Energy Council. http://www.irecusa.org/fileadmin/user_upload/ConnectDocs/IC_Guide.pdf Internal Revenue Service (IRS) (2008). “Residential Energy Efficient Property Credit Tax Form 5695.” Internal Revenue Service online. http://www.irs.ustreas.gov/pub/irs-pdf/f5695.pdf Kamzan, M. (July 2, 2008). Phone interview. Downtown San Jose Solar Project. Library of Congress (2008). “H.R. 1424 - Emergency Economic Stabilization Act of 2008.” Library of Congress online. http://thomas.loc.gov/cgi-bin/bdquery/z?d110:H.R.1424 Mello-Roos (2008). "What is Mello-Roos?" California Property Tax Information. Accessed February 2009 at http://www.mello-roos.com/pdf/mrpdf.pdf. Mosier Creek Homes (2008). “High Performance Housing / Small Town Lifestyle - Alternative Energy.” Mosier Creek Homes online. Accessed August 2008. http://www.mosiercreek.com/alt-energy.html New Resource Bank (NRB) (2006a). “Loans and Financing.” New Resource Bank online. Acessed August 2008. http://www.newresourcebank.com/personal-banking/loans-and-financing.php#solarhome
New Resource Bank (NRB) (2006b). “Solar Home Equity Financing.” New Resource Bank online. Accessed September 2008. http://www.newresourcebank.com/personal-banking/solar-home-equity.php New Jersey Clean Energy Program (NJCEP) (2009). Renewable Energy Incentive Program Handbook. Accessed February 2009. http://www.njcleanenergy.com/files/file/Renewable _Programs/CORE/REIPGuidebookfinal0202mq.pdf New Jersey Clean Energy Program (NJCEP) (2008a). Listing of Brokers and Aggregators. New Jersey Clean Energy Program online. Accessed April 2008.
51
http://www.njcleanenergy.com/renewable-energy/programs/solar-renewable-energy-certificates-srec/listing-brokers-and-aggregators-0
New Jersey Clean Energy Program (NJCEP) (2008b). Solar Renewable Energy Certificates Program Overview. New Jersey Clean Energy Program online. Accessed April 2008. http://www.njcleanenergy.com/renewable-energy/programs/solar-renewable-energy-certificates-srec/overview/overview New Jersey Clean Energy Program (NJCEP) (December 17, 2007). “FAQ: NJ Solar Financing Program New Jersey Clean Energy Program.” New Jersey Clean Energy Program online. http://www.njcleanenergy.com/files/file/SOLARTransitionFAQs121707%20fnl2(2).pdf
New York State Energy Research and Development Authority (NYSERDA) (2007). “New York Energy $martSM Loan Fund Program.” New York State Energy Research and Authority online. Accessed August 2008. http://www.nyserda.org/loanfund/default.asp
New York State Energy Research and Development Authority (NYSERDA) (2008a). “Power Naturally.” New York State Energy Research and Development Authority online. Accessed August 2008. http://www.powernaturally.org/ New York State Energy Research and Development Authority (NYSERDA) (2008b). “PON 1050: Incentive Overview and Payment Guidelines.” Accessed August 2008. http://www.powernaturally.org/Programs/pdfs_docs/1050Incentive.pdf New York State Energy Research and Development Authority (NYSERDA) (2008c). “Solar Electric (PV) System Costs and Savings.” New York State Energy Research and Development Authority online. Accessed August 2008. http://nyserdaweb.cleanpowerestimator.com/nyserdaweb.htm. New York State Energy Research and Development Authority (NYSERDA) (October 2008). “PV Incentive Program Funding.” New York State Energy Research and Development Authority online. Accessed November 2008. http://www.nyserda.org/pvincentive.asp Niver, M. (July 2008). Email communications. SolarCity. Nystedt, G. (June 2008). Telephone interview and email exchanges. City of Ellensburg. Public Service Enterprise Group (PSE&G) (2009a). “PSE&G Solar Loan Program: Frequently Asked Questions – Residential.” PSE&G online. http://www.pseg.com/customer/solar/faq_residential.jsp Public Service Enterprise Group (PSE&G) (2009b). "Residential Solar Loan Program Estimator." http://www.pseg.com/customer/solar/xls/loan_calculator-residential.xls.
Public Service Enterprise Group (PSE&G) (2008a). “PSE&G Solar Loan Program.” PSE&G online. Accessed September 26, 2008. http://www.pseg.com/customer/solar/
52
Public Service Enterprise Group (PSE&G) (July 16, 2008b). “PSE&G's innovative solar loan program now available to residential customers.” Press Release, PSE&G online. Accessed August 2008. http://www.pseg.com/media_center/pressreleases/articles/2008/2008-07-16.jsp
REC Solar (2008). “Downtown San Jose Solar Project.” REC Solar online. Accessed August 2008. http://recsolar.com/cm/Local%20Communities/Bay%20Area/san-jose-downtown-solar-project.html/ Roosevelt, M. (July 23, 2008). “New California law allows cities to give loans for energy-saving improvements.” Los Angeles Times online. Accessed August 2008. http://www.latimes.com/news/local/la-me-solar23-2008jul23,0,7437661.story Sacramento Municipal Utility District (SMUD) (2009). "Solar Power for Your Home." Sacramento Municipal Utility District online. http://www.smud.org/en/community-environment/solar/pages/index.aspx Sacramento Municipal Utility District (SMUD) (April 17, 2008). "SMUD closer to providing solar power for all." Press Release, SMUD online. Accessed August 2008. http://smud.org/news/releases/08archive/04-17-08_solar_shares_contract.pdf Solar City (2009). “Community Solar Programs.” Solar City online. Accessed November 2008. http://www.solarcity.com/tabid/137/Default.aspx Solar Energy Industry Association (SEIA) (2006). Solar Energy Industry Association Guide to Federal Tax Incentives for Solar Energy, Version 1.2. Washington, D.C.: SEIA; p. 27. http://www.seia.org/galleries/pdf/SEIA_manual_version_1.2.pdf Solar Energy Industry Association (SEIA) and Prometheus Institute (April 21, 2008). "U.S. Solar Industry Year in Review: 2007." Solar Energy Industry Association and Prometheus Institute for Sustainable Development. http://www.seia.org/Year_in_Review_2007_lr.pdf Starrs. T.; Wenger, H. (2003). Consumer's Guide: Get Your Power from the Sun (Brochure). 20 pp.; NREL Report No. BR-520-35297; DOE/GO-102003-1844. http://www.nrel.gov/docs/fy04osti/35297.pdf SunPower Corporation (2009). “Smart Financing.” SunPower Corporation online. Accessed August 2008. http://www.sunpowercorp.com/For-Homes/How-To-Buy/Smart-Financing.aspx SunRun, Inc. (2009a). "What we do." Accessed February 2009. http://www.sunrunhome.com/sunrun_home_solar/ SunRun, Inc. (2009b). "Service Plans." Accessed February 2009. http://www.sunrunhome.com/sunrun_home_solar/service_plans/
53
SunRun, Inc. (2008). "SunRun Closes Project Financing for up to $105M in Solar Facilities; Bolsters Team with Solar Industry Veteran." Accessed February 2009. http://www.sunrunhome.com/about_sunrun/press_releases/sunrun_closes_project_financing_for_up_to_105_million_in_solar_facilities/ SunSmart (2008). Welcome to SunSmart. Tomorrow's Power Today. http://www.sgsunsmart.com/index.htm. U.S. Census Bureau (2006). “Physical Housing Characteristics for Occupied Housing Units.” 2006 American Community Survey. The U.S. Census Bureau online. http://factfinder.census.gov/servlet/STTable?_bm=y&-geo%20_id=01000US&-qr_name=ACS_2006_EST_G00_S2504&-ds_name=ACS_2006_EST_G00_ U.S. Department of Energy (DOE) (2008). “State Energy Alternatives: System Benefit Charges.” U.S. Department of Energy online. Accessed April 6, 2008. http://www.eere.energy.gov/states/alternatives/system_benefits.cfm Xcel Energy (2008). Solar Rewards Program. Xcel Energy online. http://xcelenergy.com/Business/RenewableEnergy/Solar_Rewards/Pages/home.aspx
54
Appendix 1. Homeowners Insurance
A residential PV installation may trigger the need to modify a homeowner’s insurance policy in one or more ways, particularly when the homeowner owns the PV system. In the case of property insurance, a rooftop system owned by the homeowner can be incorporated into the policy as an improvement to the dwelling. The homeowner will want to determine if the amount of coverage should be increased to cover the cost of the PV system against fire and weather damage. In some instances, an existing insurance policy may already cover the additional investment. In other situations, it may involve an increase in the insurance premium. Each homeowner will need to independently determine the insurance impact of a new PV system. It is important to point out that the replacement cost of the system should be insured, which may be different than the original installation cost since it is possible the homeowner won’t be eligible for a second set of incentives and rebate for the new system. Overall, based on comments from a variety of solar installers, the additional homeowner’s property insurance costs (if any) do not represent a barrier or hindrance when promoting PV in the residential sector. Additional property insurance is probably not needed if the system is owned by a third-party, as in the case of the solar lease and the solar PPA models (until a time when the homeowner purchases the system). However, additional liability insurance may be required to interconnect to the utility grid, no matter who owns the system. For example, in Colorado, Xcel Energy requires a minimum $300,000 in personal liability insurance for a homeowner as part of its Small Generation System Interconnection Agreement (Xcel 2008). The reason is to protect utility workers from potential personal injury or property damage liability risks that might be created by the interconnection (IREC 2007a). However, a standard homeowner’s insurance policy is usually adequate enough to fulfill the requirements made by the corresponding utility (Starrs and Wenger 2003). Further, many states do not allow utilities to require additional insurance “beyond reasonable limits established by state regulatory commissions” (IREC 2007b).
To illustrate the insurance impacts of a PV system, one of the authors of this report had his insurance company evaluate the addition of a $30,000 PV system to his Colorado home. Currently, the author has dwelling coverage of $175,000 and an annual insurance premium of $757.00. Increasing dwelling coverage to $205,000 will increase the annual premium by $88.00 (12%), for a monthly increase of $7.33. Liability coverage under this policy is already $300,000 which would meet the Xcel Energy interconnection requirement at no additional cost.
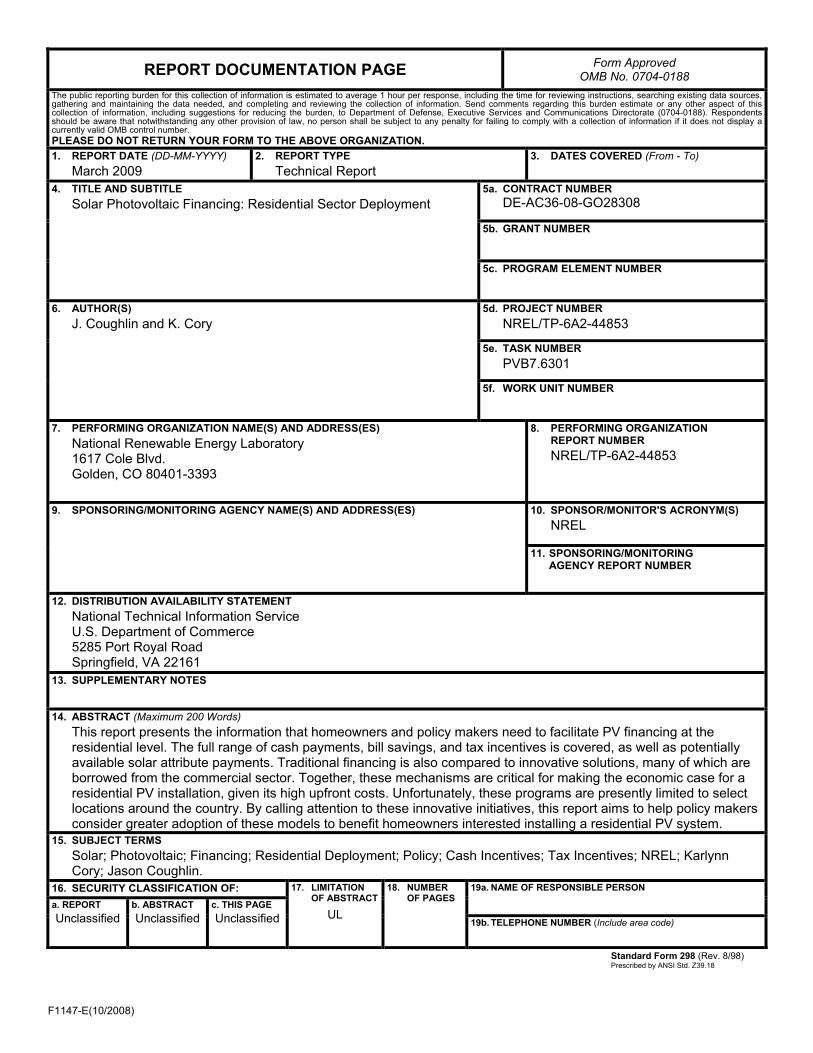
F1147-E(10/2008)
REPORT DOCUMENTATION PAGE Form Approved OMB No. 0704-0188
The public reporting burden for this collection of information is estimated to average 1 hour per response, including the time for reviewing instructions, searching existing data sources, gathering and maintaining the data needed, and completing and reviewing the collection of information. Send comments regarding this burden estimate or any other aspect of this collection of information, including suggestions for reducing the burden, to Department of Defense, Executive Services and Communications Directorate (0704-0188). Respondents should be aware that notwithstanding any other provision of law, no person shall be subject to any penalty for failing to comply with a collection of information if it does not display a currently valid OMB control number. PLEASE DO NOT RETURN YOUR FORM TO THE ABOVE ORGANIZATION. 1. REPORT DATE (DD-MM-YYYY)
March 2009 2. REPORT TYPE
Technical Report 3. DATES COVERED (From - To)
4. TITLE AND SUBTITLE
Solar Photovoltaic Financing: Residential Sector Deployment 5a. CONTRACT NUMBER
DE-AC36-08-GO28308
5b. GRANT NUMBER
5c. PROGRAM ELEMENT NUMBER
6. AUTHOR(S) J. Coughlin and K. Cory
5d. PROJECT NUMBER NREL/TP-6A2-44853
5e. TASK NUMBER PVB7.6301
5f. WORK UNIT NUMBER
7. PERFORMING ORGANIZATION NAME(S) AND ADDRESS(ES) National Renewable Energy Laboratory 1617 Cole Blvd. Golden, CO 80401-3393
8. PERFORMING ORGANIZATION REPORT NUMBER NREL/TP-6A2-44853
9. SPONSORING/MONITORING AGENCY NAME(S) AND ADDRESS(ES)
10. SPONSOR/MONITOR'S ACRONYM(S) NREL
11. SPONSORING/MONITORING AGENCY REPORT NUMBER
12. DISTRIBUTION AVAILABILITY STATEMENT National Technical Information Service U.S. Department of Commerce 5285 Port Royal Road Springfield, VA 22161
13. SUPPLEMENTARY NOTES
14. ABSTRACT (Maximum 200 Words) This report presents the information that homeowners and policy makers need to facilitate PV financing at the residential level. The full range of cash payments, bill savings, and tax incentives is covered, as well as potentially available solar attribute payments. Traditional financing is also compared to innovative solutions, many of which are borrowed from the commercial sector. Together, these mechanisms are critical for making the economic case for a residential PV installation, given its high upfront costs. Unfortunately, these programs are presently limited to select locations around the country. By calling attention to these innovative initiatives, this report aims to help policy makers consider greater adoption of these models to benefit homeowners interested installing a residential PV system.
15. SUBJECT TERMS Solar; Photovoltaic; Financing; Residential Deployment; Policy; Cash Incentives; Tax Incentives; NREL; Karlynn Cory; Jason Coughlin.
16. SECURITY CLASSIFICATION OF: 17. LIMITATION OF ABSTRACT
UL
18. NUMBER OF PAGES
19a. NAME OF RESPONSIBLE PERSON a. REPORT
Unclassified b. ABSTRACT Unclassified
c. THIS PAGE Unclassified 19b. TELEPHONE NUMBER (Include area code)
Standard Form 298 (Rev. 8/98) Prescribed by ANSI Std. Z39.18