Embed Size (px)
Citation preview
316
IMPACT OF THE QUALITY OF FIRST FOOD ON DIGESTIVE ENZYMES AND DEVELOPMENT OF THE ANTERIOR INTESTINE AND HEPATOPANCREAS
OF GENETICALLY MALE NILE TILAPIA (GMT) Oreochromis niloticus L.
Evangeline E. Jaravata1, Annabelle A. Herrera1 and Jose S. Abucay2
1Institute of Biology, University of the Philippines, Diliman, Quezon City 1102 Philippines
2Freshwater Aquaculture Center, College of Fisheries, Central Luzon State University,
Science City of Muñoz, Nueva Ecija 3120, Philippines
Introduction
Aquaculture is currently the fastest growing animal production sector in the world and is supported by increased production of formulated supplemental diets for aquatic animals. Worldwide, tilapias are emerging as one of the important cultured food fish. Several studies have been conducted demonstrating the effects of the different commercially available feeds on the growth performance of Nile tilapia. However, no attempt has been made particularly on the development of genetically male Nile tilapia (GMT) fed with different diets. Production of GMT is limited and under the management of FishGen and associates.
Tilapia performance primarily depends on its nutrition. In their normal growth and
reproduction, fish must consume and utilize proteins, carbohydrates, fats, vitamins, and minerals. First feeding is a very important consideration among fish nutritionists because of its impact on the fish. Studies have concluded that larvae improve their growth and survival significantly if food is available at the time the mouth opens and thus, the need for suitable food, are of great importance. Moreover, it is during the early stages of development of the fish that the nutrient requirement varies. In nature, fish use a variety of foods to maintain good condition. Likewise, some studies reported good growth performance from cultured tilapia fed on mixed diets.
This study was undertaken to investigate the effects of the different first food diets on
the development of the anterior intestine, liver and pancreas of GMT Nile tilapia through light, scanning and transmission electron microscopy. Furthermore, the study determined the effects of the different first food diets on the activity of some enzymes – lipase, esterase, amylase and phosphatase in the anterior intestine and pancreas of 150-day old GMT Nile tilapia.
The results of this study provide useful information for GMT culture.

317
Materials and methods Fish
Samples of Nile tilapia fry (GMT) of different families from the cross between female (XX) and “supermale” (YY) broodfish tilapia were produced and reared at the Phil-FishGen of the Freshwater Aquaculture Center, Central Luzon State University (FAC-CLSU) in Muñoz, Nueva Ecija. Experimental diets
Five different diets were prepared using plankton, rice bran, fish meal, and fry booster (Tateh) and used throughout the first 30 days when exogenous feeding started. Diet preparation was done by mixing the dry ingredients at equal ratio. Diet 1 contained Moina (plankton) only; Diet 2 fish meal and rice bran; Diet 3 fry booster; Diet 4 contained fish meal, rice bran and Moina; and Diet 5 contained fry booster and Moina. The nutrient composition of feeds used is given in Table 1. Table 1. Proximate composition of the different ingredients (Moina micrura, fish meal, fry
booster, and rice bran) used as experimental diets for Nile tilapia, Oreochromis niloticus L., as first food diets for 30 days.
Nutrients (%) Moina Fish meal Rice bran Fry booster
Crude protein 50 66.7 11.64 48.0 min Crude fiber 4-6 1.4 7.20 5.0 max Fat 8.7 10.5 11.93 12.0 min Crude ash - 20.8 8.89 16.0 max Moisture - - - 12.0 max
Experimental setups and feeding About a thousand fertilized Nile tilapia eggs were obtained and placed in down-
welling wells until hatching and complete absorption of the yolk. For the first period, after complete absorption of yolk and ready for exogenous
feeding, the fry were randomly stocked in five glass aquaria (18 X 10 X 12 inches). Each aquarium contained about two hundred (200) fry (D1, D2, D3, D4 and D5) and a prepared diet was assigned as first food for the fry. Feeding was done four times a day for thirty (30) days. The fish in aquaria received continuous supply of oxygen. The tank water was changed daily every morning, and excreta and leftover feed were siphoned out daily.
For the second period, after 30 days, the fingerlings were then transferred in earthen
ponds where natural food, predominantly plankton, was available. The fish from D1, D2, D3, D4 and D5 were placed and stocked separately in “hapas” in the pond. Experimental diets were no longer carried. Nevertheless, continuous feeding of fish meal was done three times a day until they reached 150 days.

318
Fish sampling Sampling was done at 10, 20, 30, 60, 90 and 120 and 150 days post-first feeding
(dpff). A total of fifteen (15) fish were collected in each aquarium/hapa at each sampling date. Ten fish samples were randomly selected, weighed and measured to obtain the weight and size of the fish. The gut was also measured. Histological analysis Light microscopy
Five fish sampled at each sampling date (day 10 to 150) were randomly selected from the ten (10) fish sampled at each sampling date and immediately fixed with 10% formaldehyde for light microscopic processing and examination. Fish bigger than 2 cm were dissected. The intestine, liver and pancreas were obtained and fixed in 10% formaldehyde. The fixed samples were dehydrated through a graded alcohol series (50%, 70%, 80%, 95% and absolute ethyl alcohol). After clearing with xylene and infiltration in series of hard and soft paraffin, the specimens were embedded in hard paraffin and cut 5 µm thick using a microtome apparatus and placed on glass slides. After deparaffinization and rehydration, the specimens were stained and counterstained with hematoxylin and eosin, respectively. Entellan was used as the mounting medium. Prepared slides were then examined for the development of the gut, liver, pancreas, testis, and skeletal muscles by light microscopy (Zeiss) and photodocumented. This was done at Developmental Biology Thesis Room, Institute of Biology, UP, Diliman.
For anterior intestine, thickness of muscularis, height of mucosa, and number of goblet cells were described and measured. The widest diameter of the hepatic portal vein diameter of the liver was measured; hepatocytes, sinusoids, blood vessels and lipid inclusions were observed and described. Likewise, exocrine and endocrine cells and zymogen granules of the pancreas were examined and described. Scanning and transmission electron microscopy
Fish sampled at day 150 from different diet groups were obtained for scanning and transmission electron microscopy preparation using the standard protocols. For scanning electron microscopy, sections (1 cm long) of inverted anterior intestine were placed in 1.9% tannic acid in 0.1 M cacodylate buffer (pH 7.4) for 2h following the post-formaldehyde wash step. It was transferred to 1.0% osmium tetroxide in the same buffer for 2h at room temperature. Tissues were then washed, dehydrated, and dried in a critical point dryer, mounted on aluminum stubs with silver paint, and sputter-coated with gold for examination. Viewing was done under Leica S440 scanning electron microscope. Processing of the specimen was done at the Molecular and Biotechnology Division of UP, Los Baños while viewing was done at the College of Engineering, UP, Diliman.
For transmission electron microscopy, short sections (1 cm long) of the anterior
intestine were fixed in 2.5% glutaraldehyde in 0.1 M sodium cacodylate containing 3.5% sucrose at 4°C. The specimens were cut (semi-thin), rinsed in a buffer followed by post fixation with 1% osmium tetroxide, then dehydrated in graded series of acetones, stained and embedded in resin. Ultrasection of the specimen were produced and mounted on uncoated
319
copper grids and stained with lead citrate and uranyl acetate and viewed under JEOL 1010 transmission electron microscope. Processing and viewing were done at Transmission Electron Laboratory, Research and Biotechnology Division of St. Luke’s Medical Center.
Characterization (compactness, thickness and height) of the microvilli and goblet cell
(mucous granules) of the epithelial lining of anterior intestine were done. In addition, organelles like the mitochondria and lipid droplets were observed. Enzyme histochemistry
Fish sampled at day 150 was brought to the National Kidney and Transplant Institute for cryostat procedure. Enzyme tests in triplicate for the activity of digestive enzymes – amylase, phosphatase, esterase and lipase in the anterior intestine and pancreas were performed at the Developmental Biology Thesis Room, Institute of Biology, UP, Diliman.
For alkaline phosphatase enzyme test, tissues were fixed in absolute acetone at -20°C.
Gomori’s Method was used to examine the presence of phospatase. For non-specific esterase enzyme test, tissues were fixed in 10% calcium formalin at 4-5°C and subsequently embedded in paraffin at 45°C. Naphthyl Acetate Method for Esterase was used for the detection of this enzyme. For lipase and amylase enzyme tests, tissues were embedded in Jung Embedding Medium and sectioned immediately at 10µm using a microtome cryostat at 20°C. Tween Method for lipase and Starch Substrate Method for amylase were employed for the detection of these enzymes in the digestive system.
Qualitative analysis (visual analysis) was done through the intensity of the color
reactions under the low power magnification (LPO). Subsequent color ranking scheme (quantitative analysis) was employed by assigning numerical values representing the intensity of color reactions. Cells with color reaction were likewise counted by concentrating on the lower right quadrant of every section under high power magnification (HPO). Statistical analysis
Total body weight and length, gut length, and timing and pattern of development of the different groups per age were subjected to statistical test. One-way ANOVA and Duncan Multiple Range Tests were employed to obtain significant difference using the Statistical Analysis Software (SAS) package.
Results Growth performance
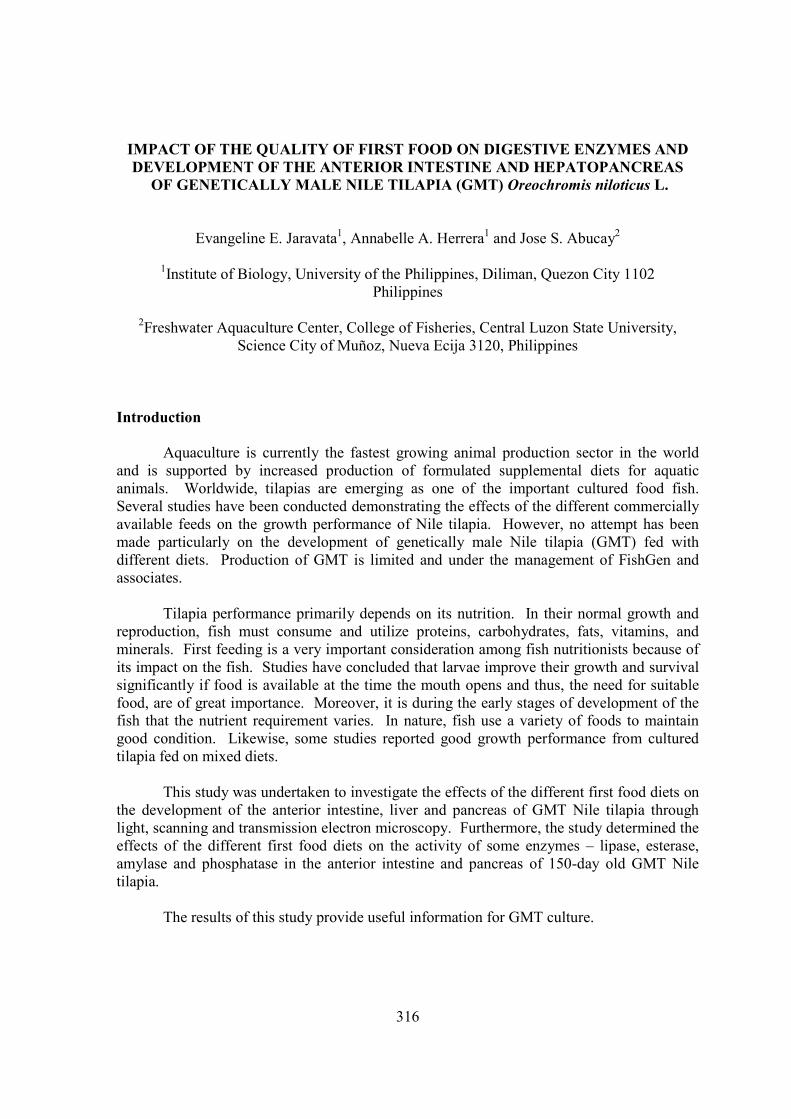
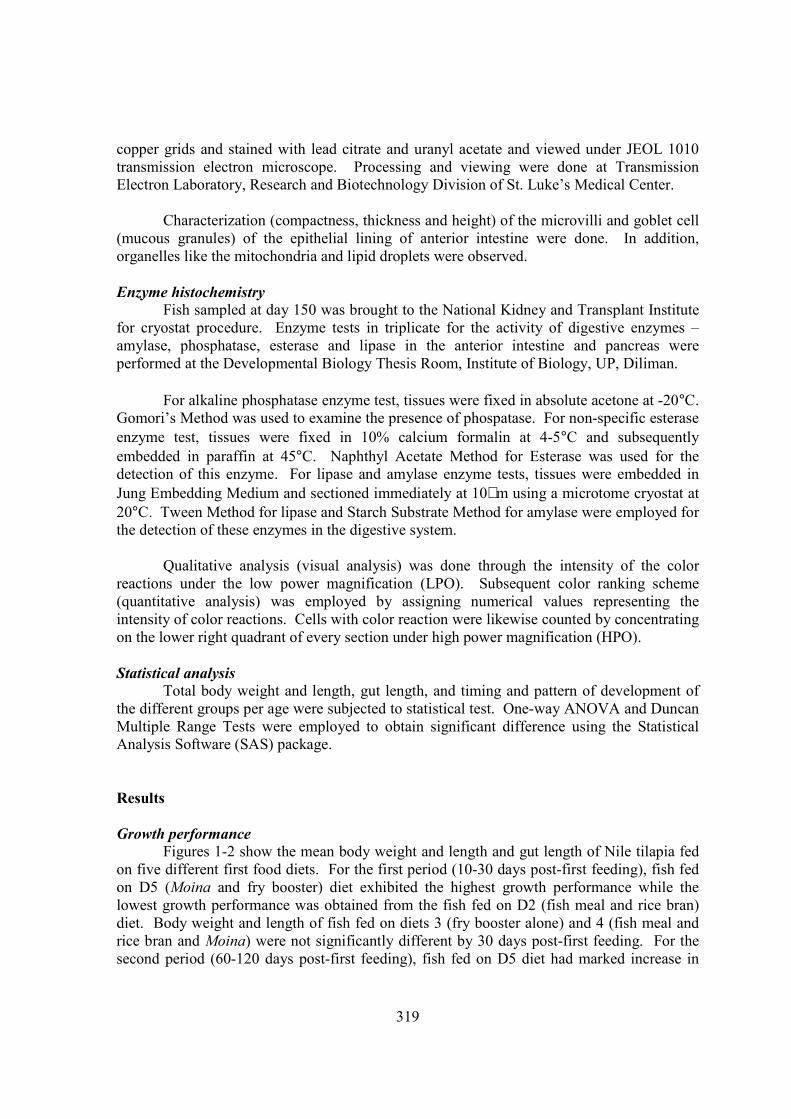
Figures 1-2 show the mean body weight and length and gut length of Nile tilapia fed on five different first food diets. For the first period (10-30 days post-first feeding), fish fed on D5 (Moina and fry booster) diet exhibited the highest growth performance while the lowest growth performance was obtained from the fish fed on D2 (fish meal and rice bran) diet. Body weight and length of fish fed on diets 3 (fry booster alone) and 4 (fish meal and rice bran and Moina) were not significantly different by 30 days post-first feeding. For the second period (60-120 days post-first feeding), fish fed on D5 diet had marked increase in
320
body weight and length but not significantly different from D1 and D3 fish groups. On the other hand, D2 and D4 diets did not show any improvement in the growth performance.
0
2
4
6
8
10
0 10 20 30 60 90 120 150
days post-first feeding (dpff)
leng
th(c
m) D1
D2D3D4D5
Figure 1. Total body length of Oreochromis niloticus L. (GMT), fed with different first food diets at different developmental stages.
Figure 2 .Total body weight of Oreochromis niloticus L. (GMT) fed with different firs t food diets at different
developmental s tages .
02468
10121416
0 10 20 30 60 90 120 150
days pos t-firs t feeding (dpff)
weig
ht(g
)
D1D2D3D4D5
Figure 2. Total body weight of Oreochromis niloticus L. (GMT), fed with different first food diets at different developmental stages.
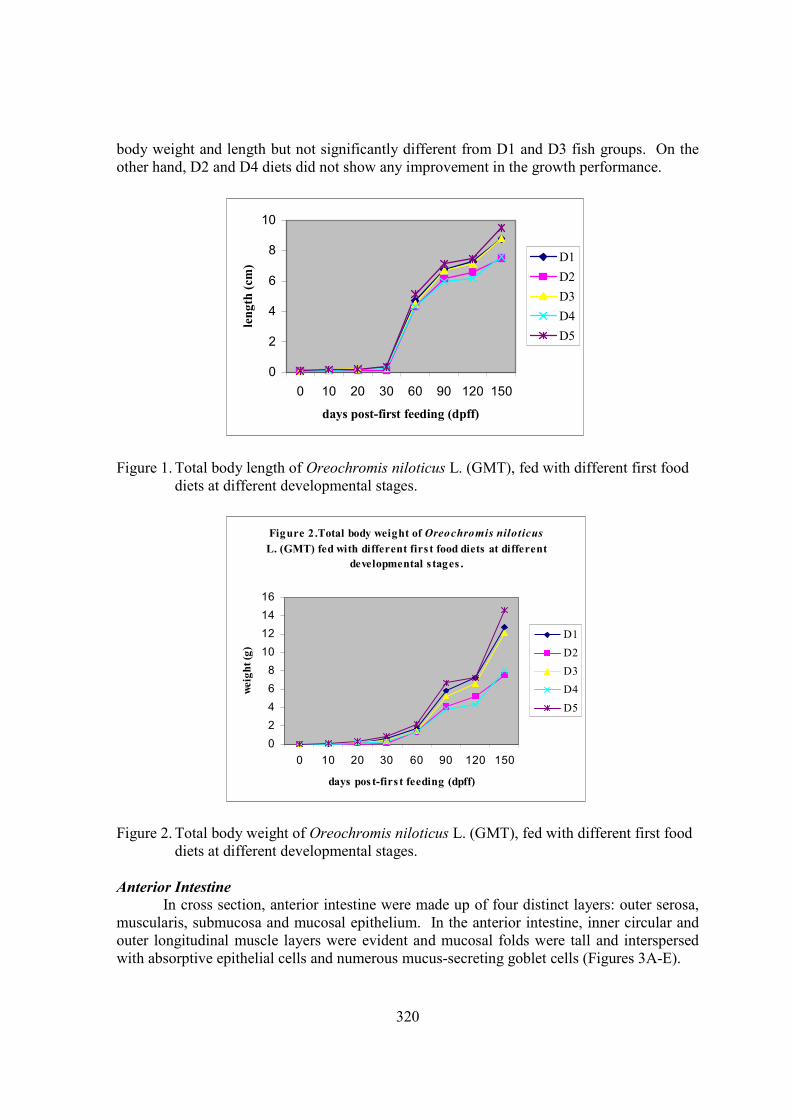
Anterior Intestine In cross section, anterior intestine were made up of four distinct layers: outer serosa, muscularis, submucosa and mucosal epithelium. In the anterior intestine, inner circular and outer longitudinal muscle layers were evident and mucosal folds were tall and interspersed with absorptive epithelial cells and numerous mucus-secreting goblet cells (Figures 3A-E).
321
Table 2 summarizes the histological changes observed, measured, and compared in the anterior intestine by light microscopic examinations: (1) thickness of the muscularis layer, which reflects the strength of gut wall contraction; (2) length of mucosal folds, which affects the relative surface area of the mucosal absorptive surface; and (3) number of mucus-secreting goblet cells, which affects the thickness of the intestinal mucosa.
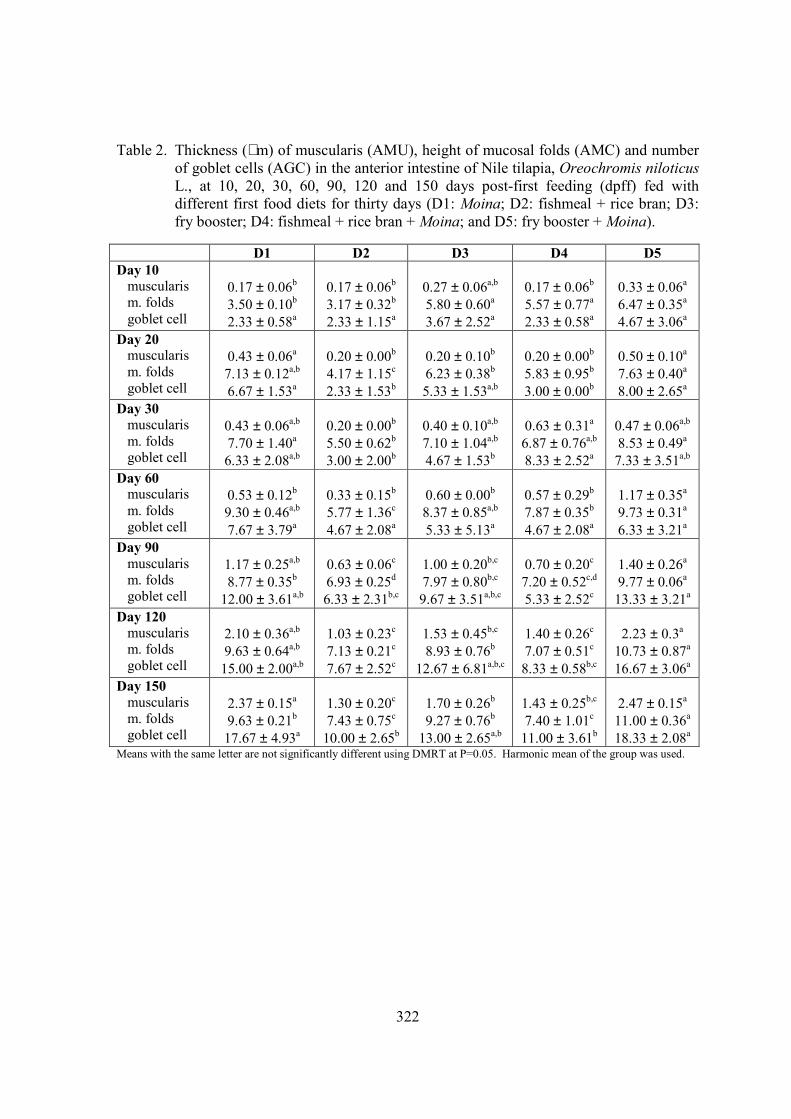
At 10 days post-first feeding (Table 2), there was no significant difference on the number of goblet cells present in the mucosal folds of fish from the five groups. Fish with D3 and D5 diet showed thicker muscularis layer. Biggest mucosal folds were evident in T5 fish, though not significantly different from T3 and T4 fish. By 30 days post-first feeding, there was no significant difference in the muscularis thickness, mucosal fold heights and number of goblet cells of fish with D1 and D5 diets (Table 2). By 90 days post-first feeding (Table 2), sharp increase in the number of goblet cells was discernible but there was no significant difference between D1, D3 and D5. Thicker muscularis layer and longer mucosal folds were evident in D5 diets. By 150 days post-first feeding (Table 2, Figure 4), thickness of muscularis layer and number of goblet cells in the epithelial layer were most pronounced but D1 and D5 diets were not significantly different. Deeper mucosal folds in D5 diet were more apparent and significantly different from the other four diets (D1, D2, D3, D4). Fish fed on D2 diet consistently resulted in a decrease in the thickness of muscularis layer, length of mucosal folds and number of goblet cells.
Figure 3. Photomicrograph of an anterior intestine portion of 150 days post-first feeding (dpff) Nile tilapia, Oreochromis niloticus, fed with (a) Moina alone (b) fish meal + rice bran (c) fry booster (d) fish meal + rice bran + Moina (e) fry booster + Moina. D5 (e) fish had the longest folds. Abbreviations: BB, brush borders; L, lumen; MF, mucosal folds; GC, goblet cells; SMU, submucosa; MU, muscularis; SE, serosa. 400x.
A B C
D E
322
Table 2. Thickness (µm) of muscularis (AMU), height of mucosal folds (AMC) and number of goblet cells (AGC) in the anterior intestine of Nile tilapia, Oreochromis niloticus L., at 10, 20, 30, 60, 90, 120 and 150 days post-first feeding (dpff) fed with different first food diets for thirty days (D1: Moina; D2: fishmeal + rice bran; D3: fry booster; D4: fishmeal + rice bran + Moina; and D5: fry booster + Moina).
D1 D2 D3 D4 D5
Day 10 muscularis m. folds goblet cell
0.17 ± 0.06b
3.50 ± 0.10b
2.33 ± 0.58a
0.17 ± 0.06b
3.17 ± 0.32b
2.33 ± 1.15a
0.27 ± 0.06a,b 5.80 ± 0.60a
3.67 ± 2.52a
0.17 ± 0.06b
5.57 ± 0.77a
2.33 ± 0.58a
0.33 ± 0.06a
6.47 ± 0.35a
4.67 ± 3.06a
Day 20 muscularis m. folds goblet cell
0.43 ± 0.06a
7.13 ± 0.12a,b
6.67 ± 1.53a
0.20 ± 0.00b
4.17 ± 1.15c
2.33 ± 1.53b
0.20 ± 0.10b
6.23 ± 0.38b
5.33 ± 1.53a,b
0.20 ± 0.00b
5.83 ± 0.95b
3.00 ± 0.00b
0.50 ± 0.10a
7.63 ± 0.40a
8.00 ± 2.65a
Day 30 muscularis m. folds goblet cell
0.43 ± 0.06a,b 7.70 ± 1.40a
6.33 ± 2.08a,b
0.20 ± 0.00b
5.50 ± 0.62b
3.00 ± 2.00b
0.40 ± 0.10a,b 7.10 ± 1.04a,b
4.67 ± 1.53b
0.63 ± 0.31a
6.87 ± 0.76a,b
8.33 ± 2.52a
0.47 ± 0.06a,b 8.53 ± 0.49a
7.33 ± 3.51a,b Day 60 muscularis m. folds goblet cell
0.53 ± 0.12b
9.30 ± 0.46a,b
7.67 ± 3.79a
0.33 ± 0.15b
5.77 ± 1.36c
4.67 ± 2.08a
0.60 ± 0.00b
8.37 ± 0.85a,b
5.33 ± 5.13a
0.57 ± 0.29b
7.87 ± 0.35b
4.67 ± 2.08a
1.17 ± 0.35a
9.73 ± 0.31a
6.33 ± 3.21a
Day 90 muscularis m. folds goblet cell
1.17 ± 0.25a,b 8.77 ± 0.35b
12.00 ± 3.61a,b
0.63 ± 0.06c
6.93 ± 0.25d
6.33 ± 2.31b,c
1.00 ± 0.20b,c 7.97 ± 0.80b,c
9.67 ± 3.51a,b,c
0.70 ± 0.20c
7.20 ± 0.52c,d
5.33 ± 2.52c
1.40 ± 0.26a
9.77 ± 0.06a
13.33 ± 3.21a
Day 120 muscularis m. folds goblet cell
2.10 ± 0.36a,b 9.63 ± 0.64a,b
15.00 ± 2.00a,b
1.03 ± 0.23c
7.13 ± 0.21c
7.67 ± 2.52c
1.53 ± 0.45b,c 8.93 ± 0.76b
12.67 ± 6.81a,b,c
1.40 ± 0.26c
7.07 ± 0.51c
8.33 ± 0.58b,c
2.23 ± 0.3a
10.73 ± 0.87a
16.67 ± 3.06a
Day 150 muscularis m. folds goblet cell
2.37 ± 0.15a
9.63 ± 0.21b
17.67 ± 4.93a
1.30 ± 0.20c
7.43 ± 0.75c
10.00 ± 2.65b
1.70 ± 0.26b
9.27 ± 0.76b
13.00 ± 2.65a,b
1.43 ± 0.25b,c 7.40 ± 1.01c
11.00 ± 3.61b
2.47 ± 0.15a
11.00 ± 0.36a
18.33 ± 2.08a
Means with the same letter are not significantly different using DMRT at P=0.05. Harmonic mean of the group was used.

323
Scanning electron microscope analysis showed that fish fed on D2 diet had less compact mucosal folds and microvilli (Figure 5A) while fish fed on D5 diet showed densely packed folds and microvilli (Figure 5B). Furthermore, transmission electron microscopic examination of the anterior intestine of 150 days post-first feeding Nile tilapia fed on D5 diet revealed that the surface of the tall intestinal absorptive cells had numerous large, stubby and compact microvilli projecting into the intestinal lumen (Figure 5B); abundant larger mitochondria with well-developed cristae were scattered in the cytoplasm (Figure 5C); and large mucus granules of goblet cells were present in the epithelial layer (Figure 5A). On the other hand, fish with D2 diet showed less abundant and shortened microvilli; large mucus-secreting goblet cells with smaller mucus granules; and numerous large spherical mitochondria were scattered in the cytoplasm.
Figure 5. Transmission electron micrograph of epithelial lining in the anterior intestine of 150 days post-first feeding (dpff) Nile tilapia, Oreochromis tilapia L., fed with fish meal + Moina (D5) for thirty days showing the surface of the tall intestinal absorptive cells has (A) large goblet cell with large mucus granules (B) numerous tall, stout and dense microvilli (MV) projecting into the intestinal lumen (L) and (C) many large mitochondria (M) with many cristae in the cytoplasm. The glycocalyx (short arrow), active sites of digestive enzymes, is also visible as fuzzy coat covering the microvilli. (a) 27, 000X (b) 54, 000X (c) 108, 000.
Figure 4. Scanning electron micrographs of anterior intestine of 150 days post-first feeding (dpff) Nile tilapia, Oreochromis niloticus L., fed with (a) fish meal + rice bran (D2) and (b) fry booster + Moina (D5) for thirty days. 200X.
M
MV
L
G
MC
MC MV
A B
A B C
MV

324
These findings suggest that longer and well-packed microvilli in the mucosal folds of D5- diet fed fish had increased the capacity for absorption in the intestinal mucosa. Also, presence of several large mitochondria with well-developed cristae reveals the amount of energy generated, stored and used by the cell depending on the workload. Liver
Histological changes observed, measured, and compared in the liver by light microscopic examinations: the diameter of the hepatic portal vein, appearance of sinusoids, size of hepatocytes, and lipid inclusions (vacuolation).
At hatching, the liver was differentiated, and the sinusoids were formed loosely between the hepatocytes. By day 10 post-first feeding, the liver became elongated and hepatocytes became more contiguously arranged around the central vein. Fish fed on D2 diet showed bigger liver, large hepatocytes with darkly stained basal nuclei, agranular cytoplasm, and small hepatic portal vein (Table 3); sinusoids were not evident compared to four other groups. Large hepatocytes and abundant vacuoles were noticeable in D3 fish while broader sinusoids were observed in fish fed on D1 diet. By 30 days post-first feeding (Figure 6), the liver was more elongated and bigger except for fry fed on D2 diet. Fish fed on D2, D3 and D4 diets had hepatocytes loaded with lipid globules, however, larger and more abundant lipid globules persisted in D2 fish. Occurrence of sinusoids was similar in the five groups. Larger hepatic portal veins in D1 and D5 fish were evident and significantly similar (Table 3). However, by 90 days post-first feeding, there was no significant difference in the diameter of hepatic portal vein in D1, D3, D4 and D5 fish (Table 3). By day 150 days post-first feeding (Figure 8), there was intensive vascularization of the tissue; vacuoles in hepatocytes were no longer evident in all five diets. D5 fish had larger hepatocytes. D2 fish showed less granular cytoplasm while D1, D3 and D5 fish had large hepatic portal veins which were not significantly different (Figure 7; Table 3). Table 3. Diameter of the hepatic portal vein (HPV) in the liver of Oreochromis niloticus L. at 10, 20, 30, 60, 90,
120 and 150 days post-first feeding (dpff) fed with different first food diets for thirty days (D1: Moina;D2: fishmeal + rice bran; D3: fry booster; D4: fishmeal + rice bran + Moina; and D5: fry booster + Moina).
D1 D2 D3 D4 D5
Day 10 HPV
3.43 ± 0.12a 2.40 ± 0.26b 3.13 ± 0.25a,b
3.63 ± 0.40a 3.67 ± 0.71a
Day 20 HPV
5.37 ± 0.72a,b
2.63 ± 0.73c 3.33 ± 0.59b,c
3.03 ± 0.21b,c
4.47 ± 1.66a
Day 30 HPV
5.40 ± 1.04a 2.77 ± 0.42c 3.90 ± 1.14b,c
3.17 ± 0.06b,c
4.33 ± 0.38a,b
Day 60 HPV
6.07 ± 0.35a 4.77 ± 1.70a,b
4.10 ± 1.13b 4.50 ± 0.30a,b
6.07 ± 0.12a
Day 90 HPV
6.03 ± 0.31a 5.33 ± 0.21b 6.13 ± 0.15a 6.000 ± 0.27a 6.17 ± 0.15a
Day 120 HPV
6.27 ± 0.25a 5.53 ± 0.15b 6.13 ± 0.15a 6.00 ± 0.26a 6.37 ± 0.12a
Day 150 HPV 6.20 ± 0.27a,b
5.43 ± 0.25c 6.13 ± 0.15a,b
5.93 ± 0.21b 6.37 ± 0.12a
Mean with the same letter are not significantly different using DMRT at P=0.05. Harmonic mean of the group sizes was used.

325
Figure 6. Photomicrograph of a liver portion of 30 days post-first feeding (dpff) Nile tilapia, Oreochromis niloticus, fed with (a) Moina alone (b) fish meal + rice bran (c) fry booster (d) fish meal + rice bran + Moina (e) fry booster + Moina. T1 (a) and D5 (e) fish had the largest hepatic portal vein. D2 (b) and D3 (c) had large abundant vacuoles. Abbreviations: HPV, hepatic portal vein; HC, hepatocyte; LV, lipid vacuole; SS, sinusoid. 400x.
Figure 7. Photomicrograph of a liver portion of 150 days post-first feeding (dpff) Nile tilapia, Oreochromis niloticus,fed with (a) Moina alone (b) fish meal + rice bran (c) fry booster (d) fish meal + rice bran + Moina (e) fry booster + Moina. D1 (a), D3 (c), and D5 (e) fish had large hepatic portal vein. D2 (b) fish had vacuoles. Abbreviations: V, vein; HC, hepatocyte; LV, lipid vacuole; P, pancreas; SS, sinusoid. 400x.
D E
A B C
A B C
D E

326
D2 fish showed small liver, less glycogen formation, and lipid infiltration. However, in mature fish, there was only significant difference in the size of hepatic portal vein; D1, d3 and D5 diets showed larger hepatic portal veins. Fish fed on T2 diet showed poor liver histology while fish fed on D5 diet exhibited better liver histology. Pancreas
Histological changes observed and compared were: size of acinar cells and the amount of zymogen granules in the cells.
At 10 days post-first feeding, the exocrine pancreas was differentiated with basophilic acinar cells, acinar cells were organized within the pancreatic acini and pancreatic ducts were already visible. Pancreatic acinar cells of the fish given the five diets (D1, D2, D3, D4, and D5) were rich in zymogen granules. By 30 days post-first feeding (Figure 8), pancreatic tissue was located and scattered along the length of the intestine. Fish fed on D2 diet showed small pancreatic tissue and pancreatic acinar cells were poor in zymogen granules. These findings were parallel with the observations in starved fish. By 90-150 days post-first feeding (Figure 9), pancreatic tissue was scattered in the entire length of the intestinal mesenteries and zymogen granules persisted in all diets administered. Many zymogen granules in the acinar cells were apparent in D1 and D5 fish (Figure 9A, E). D5 fish had bigger acinar cells (3-7 µm). Pancreatic vacuolations were also visible among the five groups; fish fed on D2 diet revealed larger vacuoles in the acinar cells. Blood vessels were also observed in the exocrine pancreas.
Figure 8. Photomicrograph of a pancreas portion of 30 days post-first feeding (dpff) Nile tilapia, Oreochromis niloticus, fed with (A) Moina alone (B) fish meal + rice bran (C) fry booster (D) fish meal + rice bran + Moina (E) fry booster + Moina. D5 fish had bigger pancreatic cells (3-7µm) and abundant zymogen granules. Abbreviations: AC, acinar cells; AR, artery; IL; islet of Langerhans; V, vein; ZG, zymogen granule. 400x.
A B
ED
C
327
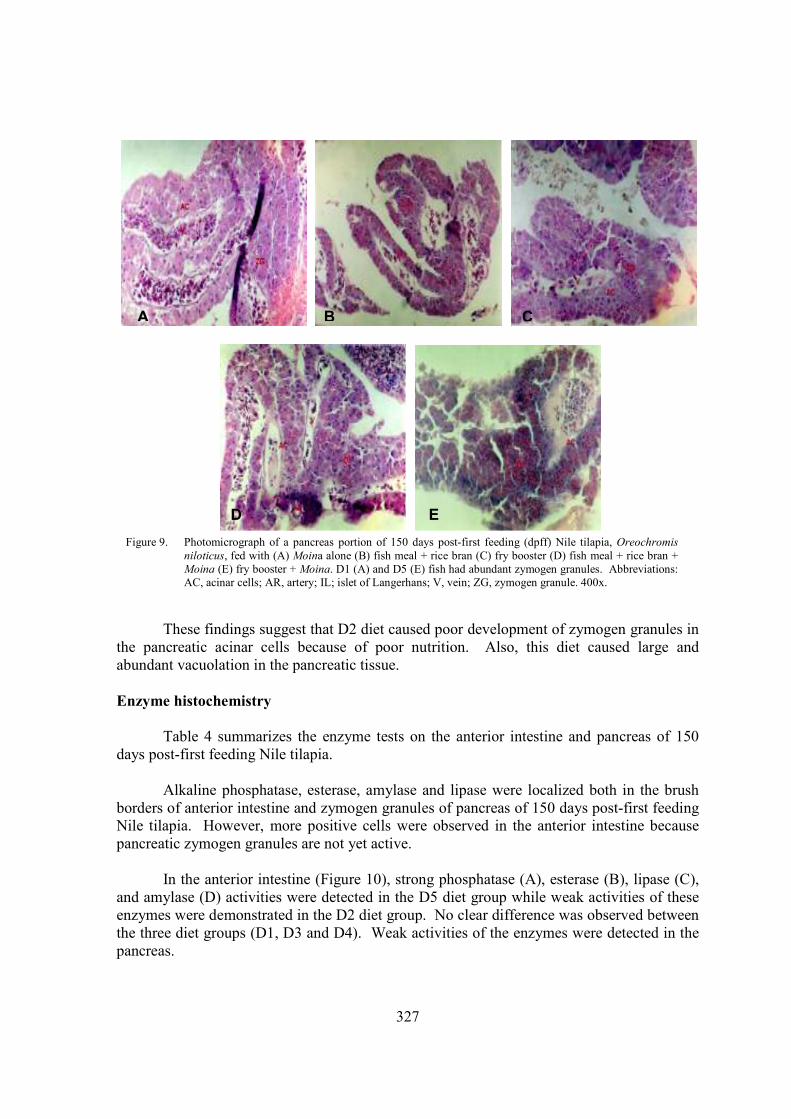
These findings suggest that D2 diet caused poor development of zymogen granules in the pancreatic acinar cells because of poor nutrition. Also, this diet caused large and abundant vacuolation in the pancreatic tissue. Enzyme histochemistry
Table 4 summarizes the enzyme tests on the anterior intestine and pancreas of 150 days post-first feeding Nile tilapia.
Alkaline phosphatase, esterase, amylase and lipase were localized both in the brush
borders of anterior intestine and zymogen granules of pancreas of 150 days post-first feeding Nile tilapia. However, more positive cells were observed in the anterior intestine because pancreatic zymogen granules are not yet active.
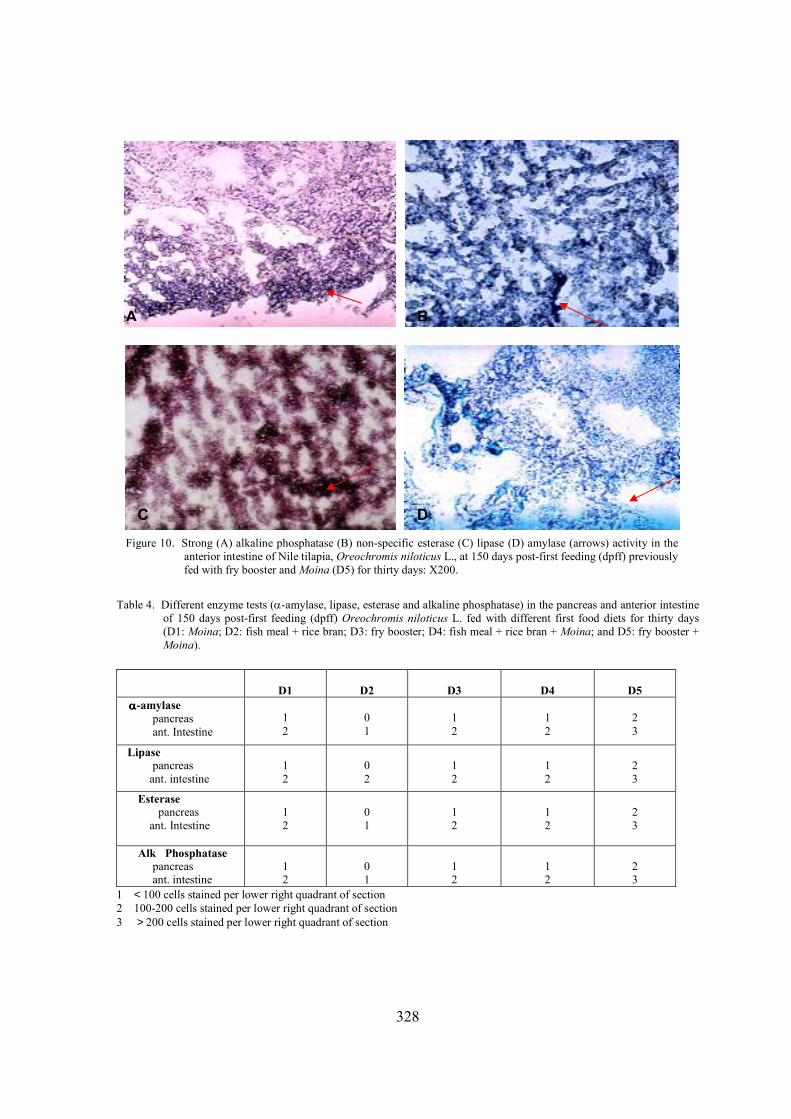
In the anterior intestine (Figure 10), strong phosphatase (A), esterase (B), lipase (C),
and amylase (D) activities were detected in the D5 diet group while weak activities of these enzymes were demonstrated in the D2 diet group. No clear difference was observed between the three diet groups (D1, D3 and D4). Weak activities of the enzymes were detected in the pancreas.
Figure 9. Photomicrograph of a pancreas portion of 150 days post-first feeding (dpff) Nile tilapia, Oreochromis niloticus, fed with (A) Moina alone (B) fish meal + rice bran (C) fry booster (D) fish meal + rice bran + Moina (E) fry booster + Moina. D1 (A) and D5 (E) fish had abundant zymogen granules. Abbreviations: AC, acinar cells; AR, artery; IL; islet of Langerhans; V, vein; ZG, zymogen granule. 400x.
A B C
D E
328
Table 4. Different enzyme tests (α-amylase, lipase, esterase and alkaline phosphatase) in the pancreas and anterior intestine of 150 days post-first feeding (dpff) Oreochromis niloticus L. fed with different first food diets for thirty days (D1: Moina; D2: fish meal + rice bran; D3: fry booster; D4: fish meal + rice bran + Moina; and D5: fry booster + Moina).
D1
D2
D3
D4
D5 αααα-amylase
pancreas ant. Intestine
12
01
12
12
23
Lipase pancreas ant. intestine
12
02
12
12
23
Esterase pancreas ant. Intestine
12
01
12
12
23
Alk Phosphatase pancreas ant. intestine
12
01
12
12
23
1 < 100 cells stained per lower right quadrant of section 2 100-200 cells stained per lower right quadrant of section 3 > 200 cells stained per lower right quadrant of section
Figure 10. Strong (A) alkaline phosphatase (B) non-specific esterase (C) lipase (D) amylase (arrows) activity in the anterior intestine of Nile tilapia, Oreochromis niloticus L., at 150 days post-first feeding (dpff) previously fed with fry booster and Moina (D5) for thirty days: X200.
A B
C D
329
Discussion
Effects of the different first food diets on growth performance Initially, growth rates were slow but they increased exponentially after week 4 of first
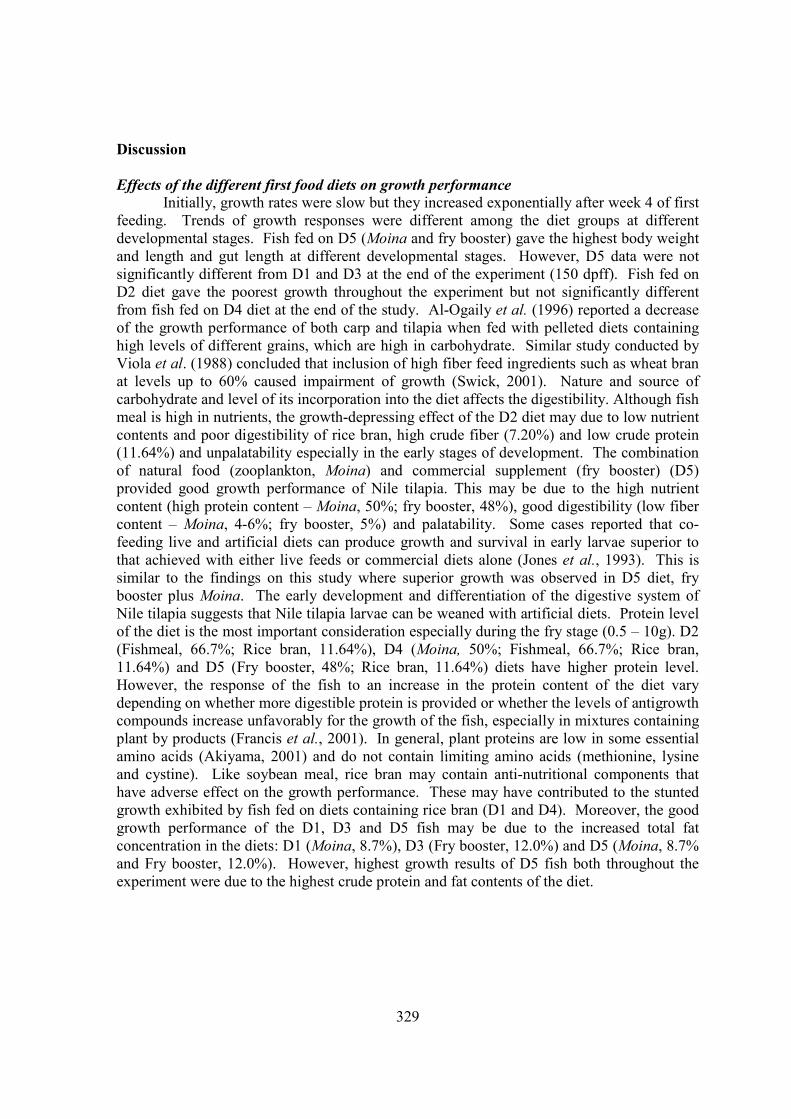
feeding. Trends of growth responses were different among the diet groups at different developmental stages. Fish fed on D5 (Moina and fry booster) gave the highest body weight and length and gut length at different developmental stages. However, D5 data were not significantly different from D1 and D3 at the end of the experiment (150 dpff). Fish fed on D2 diet gave the poorest growth throughout the experiment but not significantly different from fish fed on D4 diet at the end of the study. Al-Ogaily et al. (1996) reported a decrease of the growth performance of both carp and tilapia when fed with pelleted diets containing high levels of different grains, which are high in carbohydrate. Similar study conducted by Viola et al. (1988) concluded that inclusion of high fiber feed ingredients such as wheat bran at levels up to 60% caused impairment of growth (Swick, 2001). Nature and source of carbohydrate and level of its incorporation into the diet affects the digestibility. Although fish meal is high in nutrients, the growth-depressing effect of the D2 diet may due to low nutrient contents and poor digestibility of rice bran, high crude fiber (7.20%) and low crude protein (11.64%) and unpalatability especially in the early stages of development. The combination of natural food (zooplankton, Moina) and commercial supplement (fry booster) (D5) provided good growth performance of Nile tilapia. This may be due to the high nutrient content (high protein content – Moina, 50%; fry booster, 48%), good digestibility (low fiber content – Moina, 4-6%; fry booster, 5%) and palatability. Some cases reported that co-feeding live and artificial diets can produce growth and survival in early larvae superior to that achieved with either live feeds or commercial diets alone (Jones et al., 1993). This is similar to the findings on this study where superior growth was observed in D5 diet, fry booster plus Moina. The early development and differentiation of the digestive system of Nile tilapia suggests that Nile tilapia larvae can be weaned with artificial diets. Protein level of the diet is the most important consideration especially during the fry stage (0.5 – 10g). D2 (Fishmeal, 66.7%; Rice bran, 11.64%), D4 (Moina, 50%; Fishmeal, 66.7%; Rice bran, 11.64%) and D5 (Fry booster, 48%; Rice bran, 11.64%) diets have higher protein level. However, the response of the fish to an increase in the protein content of the diet vary depending on whether more digestible protein is provided or whether the levels of antigrowth compounds increase unfavorably for the growth of the fish, especially in mixtures containing plant by products (Francis et al., 2001). In general, plant proteins are low in some essential amino acids (Akiyama, 2001) and do not contain limiting amino acids (methionine, lysine and cystine). Like soybean meal, rice bran may contain anti-nutritional components that have adverse effect on the growth performance. These may have contributed to the stunted growth exhibited by fish fed on diets containing rice bran (D1 and D4). Moreover, the good growth performance of the D1, D3 and D5 fish may be due to the increased total fat concentration in the diets: D1 (Moina, 8.7%), D3 (Fry booster, 12.0%) and D5 (Moina, 8.7% and Fry booster, 12.0%). However, highest growth results of D5 fish both throughout the experiment were due to the highest crude protein and fat contents of the diet.
330
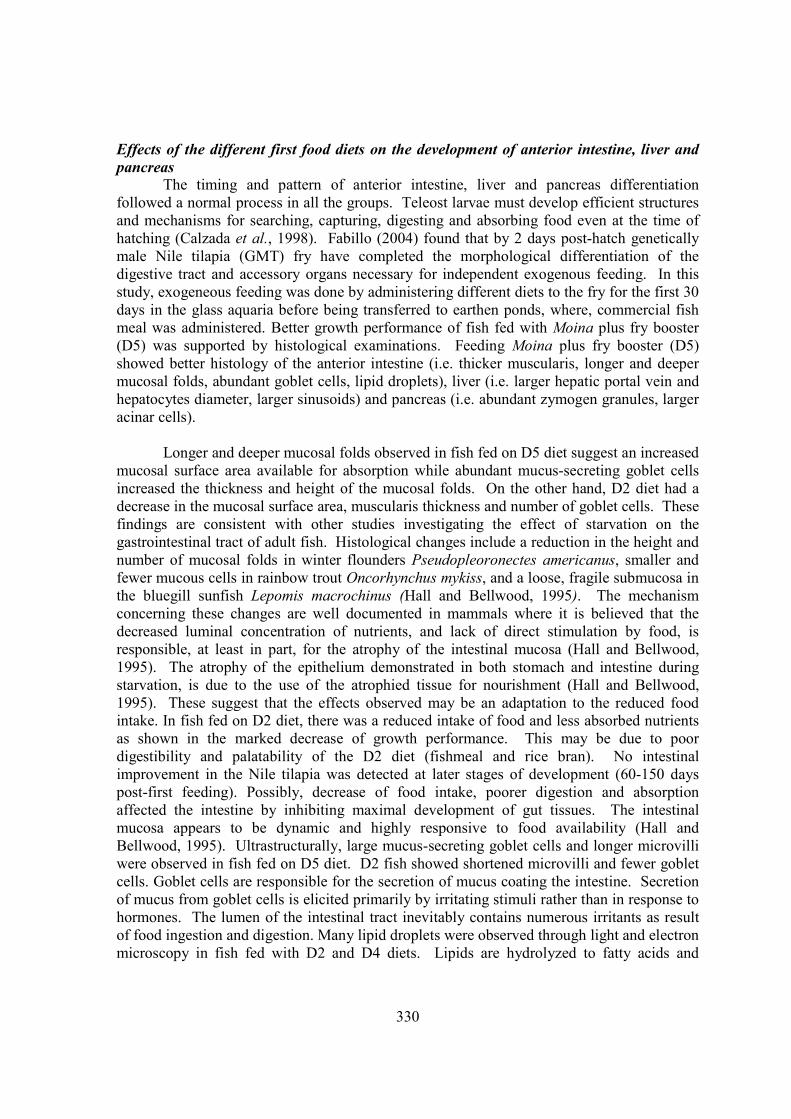
Effects of the different first food diets on the development of anterior intestine, liver and pancreas
The timing and pattern of anterior intestine, liver and pancreas differentiation followed a normal process in all the groups. Teleost larvae must develop efficient structures and mechanisms for searching, capturing, digesting and absorbing food even at the time of hatching (Calzada et al., 1998). Fabillo (2004) found that by 2 days post-hatch genetically male Nile tilapia (GMT) fry have completed the morphological differentiation of the digestive tract and accessory organs necessary for independent exogenous feeding. In this study, exogeneous feeding was done by administering different diets to the fry for the first 30 days in the glass aquaria before being transferred to earthen ponds, where, commercial fish meal was administered. Better growth performance of fish fed with Moina plus fry booster (D5) was supported by histological examinations. Feeding Moina plus fry booster (D5) showed better histology of the anterior intestine (i.e. thicker muscularis, longer and deeper mucosal folds, abundant goblet cells, lipid droplets), liver (i.e. larger hepatic portal vein and hepatocytes diameter, larger sinusoids) and pancreas (i.e. abundant zymogen granules, larger acinar cells).
Longer and deeper mucosal folds observed in fish fed on D5 diet suggest an increased
mucosal surface area available for absorption while abundant mucus-secreting goblet cells increased the thickness and height of the mucosal folds. On the other hand, D2 diet had a decrease in the mucosal surface area, muscularis thickness and number of goblet cells. These findings are consistent with other studies investigating the effect of starvation on the gastrointestinal tract of adult fish. Histological changes include a reduction in the height and number of mucosal folds in winter flounders Pseudopleoronectes americanus, smaller and fewer mucous cells in rainbow trout Oncorhynchus mykiss, and a loose, fragile submucosa in the bluegill sunfish Lepomis macrochinus (Hall and Bellwood, 1995). The mechanism concerning these changes are well documented in mammals where it is believed that the decreased luminal concentration of nutrients, and lack of direct stimulation by food, is responsible, at least in part, for the atrophy of the intestinal mucosa (Hall and Bellwood, 1995). The atrophy of the epithelium demonstrated in both stomach and intestine during starvation, is due to the use of the atrophied tissue for nourishment (Hall and Bellwood, 1995). These suggest that the effects observed may be an adaptation to the reduced food intake. In fish fed on D2 diet, there was a reduced intake of food and less absorbed nutrients as shown in the marked decrease of growth performance. This may be due to poor digestibility and palatability of the D2 diet (fishmeal and rice bran). No intestinal improvement in the Nile tilapia was detected at later stages of development (60-150 days post-first feeding). Possibly, decrease of food intake, poorer digestion and absorption affected the intestine by inhibiting maximal development of gut tissues. The intestinal mucosa appears to be dynamic and highly responsive to food availability (Hall and Bellwood, 1995). Ultrastructurally, large mucus-secreting goblet cells and longer microvilli were observed in fish fed on D5 diet. D2 fish showed shortened microvilli and fewer goblet cells. Goblet cells are responsible for the secretion of mucus coating the intestine. Secretion of mucus from goblet cells is elicited primarily by irritating stimuli rather than in response to hormones. The lumen of the intestinal tract inevitably contains numerous irritants as result of food ingestion and digestion. Many lipid droplets were observed through light and electron microscopy in fish fed with D2 and D4 diets. Lipids are hydrolyzed to fatty acids and
331
monoglycerides in the intestinal lumen, consequently are absorbed and following resynthesis in the agranular endoplasmic reticulum, they are deposited as lipid droplets in the mucosal epithelial cells (Hamlin et al., 2000). The presence of lipid vacuoles in the intestinal mucosa is considered in several teleost as an indicator of luminal absorption and a storage mechanism for lipids, caused by the absence of lipolysis and a reduced ability to mobilize lipid substances at early life stages of development (Gisbert et al., 1999). The anterior intestine appears to be the most active in the absorption of macronutrients in this study.
The hepatocytes contain glycogen and the amount of which in the liver cells depends
upon the nutritional state of the animal (Junqueira et al., 1995). Also, hepatocytes contain varying amounts of lipid in electron-dense droplets; they are few in number in the normal liver but are dramatically increased after consumption of hepatotoxic substances. Hence, fish hepatocytes are good indicator of dietary quality (Kugler and Pequignot, 1988). Mixed Moina and fry booster (D5) diet induced better liver histology (bigger hepatocytes and less lipid vacuoles) while mixed fishmeal and rice bran (D2) resulted in poor liver histology. Bigger hepatocytes of fish fed on D5 diet may be due to the increased glycogen inclusion. Lipid vacuolations were prominent and abundant in fish fed with T2 diet especially during the early developmental stages (10-30 dpff). Increased liver lipid deposits may indicate diet of insufficient vitamin content, too much carbohydrate and high-unsaturated fatty acids (Kugler and Pequignot, 1988). High lipid infiltration revealed in the liver of fish with D2 diet was probably due to the high carbohydrate and unsaturated fatty acids, low protein level and low vitamin content of the rice bran used. Also, presence of anti-nutritional components of rice bran may have aggravated the vacuolations. Dietary protein deficiency may have contributed to the lipid accumulation (lipid vacuoles) in D2 fish group. The impaired secretion of lipid from the liver causes lipid accumulation as a result of apolipoprotein deficiency. Very low-density lipoproteins (VLDL) are transport vehicle of triglycerides in the bloodstream and are synthesized from the triglycerides and apolipoprotein in the liver, and secreted as triglycerides-rich lipoprotein (Ogunji and Wirth, 2000). Although fry booster contains fishmeal and rice bran, the incorporation of zooplankton (Moina) in the mixed food diet (D5) may have counteracted the disturbed lipid metabolism caused by feeding a diet rich in carbohydrate. Bigger hepatic portal vein diameter was revealed in fish with D5 diet suggesting more blood supply in the liver.
The pancreas is a mixed exocrine and endocrine gland that produces digestive
enzymes and hormones. The cells of the endocrine tissue known as islet of Langerhans synthesize the hormones while the exocrine tissue is the major digestive gland producing different enzymes that digest all major classes of nutrients (Junqueira et al., 1995). Proenzymes, stored within zymogen granules, are inactive precursors of digestive enzymes that become active within the duodenum (Cross and Mercer, 1993), anterior intestine in Nile tilapia. Each zymogen granule appears to contain all the pancreatic enzymes; however, the concentration of individual enzymes varies between granules and is sensitive to changes in diet (Cross and Mercer, 1993). High-protein diets result in a high concentration of proteases, whereas high-carbohydrate and fat diets are reflected in high levels of amylase and lipase respectively (Fawcett, 1994). In this study, abundance of these granules in acinar cells suggest active production and secretion of pancreatic enzymes like protease, lipase, amylase esterase and phosphates indispensable for the digestion of macromolecules – protein,

332
carbohydrates, and lipids/fats. Pancreatic acinar cells of fish fed on D5 diet were rich in zymogen granules. More absorbed nutrients because of high nutrient content and better digestibility of this diet may have resulted in rich zymogen granules of pancreatic acinar cells in this treatment. D5 fish had bigger acinar cells (3-7 µm). This may be due to the increased level of zymogen granules in the pancreatic acinar cells.
Effects of the quality of first food diets on digestive enzymes
Generally, digestive enzymes were present at the earliest age of development – 3 days post-hatch (Baglole et al., 1998). However, these enzymes have varying intensities during the subsequent developmental stages and are not localized primarily in the intestine. In this study, enzymatic tests were employed in mature Nile tilapia (150 days post-first feeding) to demonstrate the effect of the different first food diets administered during the first thirty (30) days. In freshwater teleosts, digestive enzyme activity is affected by feeding behaviour and biochemical composition of the food (Kumar and Chakrabarti, 1998). No histochemical difference could be detected between the D1 (Moina alone), D3 (fry booaster alone) and D4 (Moina+fishmeal+rice bran) diet groups. More intense activity of alkaline phosphatase, non-specific esterase, lipase, and amylase were exhibited in fish with D5 diet while D2 diet showed weak enzymatic activity. Aside from high nutrient content of the diet, increased food intake of fish fed on D5 diet may have accounted for the strong enzymatic activities. Alkaline phosphatase has a wide distribution in developing tissues and consistent localization is found within intestinal segments in several fish species (Baglole et al., 1998). It is found primarily in cell membranes where active transport takes place. The sites of phosphatase activity appear purple to black. It has been speculated that this enzyme is important in the absorptive process in turbot and is considered to be a general marker of nutrient absorption (Baglole et al., 1998). In this study, presence of this enzyme in the intestinal brush borders of mucosa of Nile tilapia Oreohromis niloticus identifies this tissue as a site of active nutrient absorption. Fish fed with D5 diet showed stronger alkaline phosphatase activity in the intestinal mucosa suggesting more active nutrient absorption because of greater absorption area exhibited by the longer and deeper microvilli. This may be due to the greater food intake, better digestibility and higher nutrient contents of the diet (D5). Distribution of esterase among fish species is varied with activity present in the esophagus, intestine, liver, pancreas, pyloric caeca, stomach and gall bladder (Cousin et al., 1987). The sites of esterase activity appear as blue to black deposits. Correlation has been made in several fish species between the presence of this enzyme with fat digestion and lipid absorption (Baglole et al.,1998). High crude fat content (Moina, 8.7%; fry booster, 12.0%) of the D5 diet suggests more fat digestion and abundant lipid vacuoles in the anterior intestine suggest greater lipid absorption. These may have induced the strong esterase activity demonstrated in D5 diet. Further, this enzyme may be of particular importance because fish utilize lipid/fat as their main nutritional source rather than carbohydrate and protein especially during the later developmental stages (Baglole et al., 1998). The digestion of fats occurs completely in the intestine, under the action of pancreatic lipase. Triglycerides, the most abundant form of dietary fat, are broken down to fatty acids and glycerol, which diffuse across the microvilli (Cross and Mercer, 1993). Fish fed on D5 diet demonstrated strong lipase activity. The sites of lipase activity appear brownish-black deposits. Moreover, high amylolytic activity was observed in fish with D5 diet. Amylase is a widely distributed enzyme in the plant and animal kingdom. Significant amounts of amylase have been found in tilapia and the
333
amylolytic activity is dispersed along the entire intestine (Al-Ogaily et al., 1996). The sites of amylase activity appear unstained against a blue background. In the study of Moyano et al. (1995), high amylolytic activity was measured in seabream Sparus aurata along larval development. This high enzyme activity may be closely related to the ability of digesting carbohydrates occurring in microalgae, which are used as food for zooplankton (Kumar and Chakrabarti, 1998). High amylase activity in the gut of different fish species (C. punctuatus and carps) larvae feeding on carbohydrate-rich diet suggests extensive amylase synthesis (Sarkar et al., 1999). Like other teleosts, Nile tilapia prefer zooplankton as natural food in their early stages. The digestibility of starch (carbohydrate) is affected not only by the source and nature of carbohydrate but also by the level of its incorporation. Wheat and other grains contain albumins, which inhibit the α-amylase activity in fish (Al-Ogaily et al., 1996). This may suggest the weak amylolytic activity in Nile tilapia fed on D2 diet. Weak enzymatic activites may be due to poor nutrition. In conditions of extreme malnutrition, pancreatic acinar cells and other active protein-secreting cells undergo atrophy and lose much of their endoplasmic reticulum and the production of digestive enzymes is hindered (Junqueira et al.,1995).
In conclusion, feeding Moina and fry booster (D5) induced better growth results,
which are supported by organ histology, scanning and transmission electron microscopy and enzyme histochemistry results. All these findings suggest superior chemical digestion and intestinal absorption. Higher nutrient composition, better digestibility and palatability may have accounted the histological superiority of D5 fish. On the other hand, fish fed with a diet containing fish meal and rice bran (D2) showed the poorest growth performance and development.
References Akiyama, D.M. 2000. The use of soy products and other plant protein supplements in
aquaculture feeds. American Soybean Assoc Tech Bull., 49: 2-15. Al-Ogaily, S.M., Al-Asgah, N.A. and A. Ali. 1996. Effect of feeding different grain sources
on the growth performance and body composition of tilapia, Oreochromis niloticus (L.). Aquacult. Res., 27: 523-529.
Baglole, C.J., Goff G.P. and G.M. Wright. 1998. Distribution and ontogeny of digestive enzymes in larval yellowtail and winter flounder. J. Fish Biol., 53: 767-784.
Calzada, A., Medina, A. A. and D.E. Canales. 1998. Fine structure of the intestine development in cultured sea bream larvae. J. Fish Biol., 53: 340-365.
Cross, P.C. and K.L. Mercer. 1993. Cell and Tissue Ultrastructure. A Functional Perspective. W.H. Freeman & Comp.
Dersjant-Li, Y. 2002. The use of Soy Protein in Aquafeeds. In: Cruz-Suarez, L.E., Ricque-Marie, D., Tapia-Salazar, M., Gaxiola-Cortes, M.G., Simoes, N. (Eds.). The Sixth International Symposium of Aquatic Nutrition. Quintana Roo, Mexico.
Fabillo, M. 2004. Effects of Delayed First Feeding on Some Enzymes and Development of the Digestive Tract and Skeletal Muscles of Nile Tilapia Oreochromis niloticus L. Master’s Thesis, University of the Philippines, Diliman, Quezon City. (unpublished).
Fawcett, D.W. 1994. A Textbook of Histology. Chapman & Hall. 12th edition. 652-671 pp.

334
Francis, G, Makkar, H.P.S. and K. Becker. 2001. Antinutritional factors present in plant-derived alternate fish feed ingredients and their effects in fish. Aquaculture, 199: 197-227.
Gisbert, E, Sarasquete, M.C, Williot, P. and F. Castello-Orvay. 1999. Histochemistry of the development of the digestive system of Siberian sturgeon during early ontogeny. J. Fish Biol., 55: 596-616.
Hamlin, H.J, Von Herbing, I.H and L.J. King. 2000. Histological and morphological evaluations of the digestive tract and associated organs of haddock throughout post-hatching ontogeny. J. Fish Biol., 57:716-732.
Hall, K.C. and D.R. Bellwood. 1995. Histological effects of cyanide, stress and starvation on the intestinal mucosa of Pomacentrus coelestis, a marine aquarium fish species. J. Fish Biol., 47:438-454.
Jones, D.A., Kamarudin, M.S. and L.L. Vay. 1993. The Potential for Replacement of Live Feeds in Larval Culture. J. World Aquacult., Soc. 24: 199-210.
Junqueira, C.L., Carneiro, J. and R.O. Kelley. 1995. Basic Histology. Prentice-Hall International, Inc. 8th edition. 303-314 pp.
Kugler C.O.J. and J. Pequignot. 1988. Growth and Histological Studies on the Liver and Anterior Intestine of Nile Tilapia (Oreochromis niloticus) Fed on Mixed Foods: Daphnia magna, Chlorella vulgaris and Commercial Carp Pellets. In: R.S.V. Pullin, T. Bhukaswan, K. Tonguthai and J.L. Maclean (eds.). The Second International Symposium on Tilapia in Aquaculture. ICLARM Conference Proceedings 15. Bangkok, Thailand. 361-365pp.
Kumar, S. and R. Chakrabarti. 1998. Ontogenic development of amylase activity in three species of Indian carps, Catla catla, Labeo rohita and Cirrhinus mrigala, in relation to natural diet. Asian Fisheries Science, 10: 259-263.
Sarkar, S.K., Ganguly, S., Basu, T.K. and C. Medda. 1999. Comparative study on amylase activity in three freshwater fish larvae during early development. Asian Fisheries Science, 12: 57-64.
Swick, R.A. 2001. Feed based tilapia culture. American Soybean Association Technical Bulletin, 49: 1-10.