Embed Size (px)
Citation preview

December 2006Volume 46, No. 4
Engagement
Building “Engagement,” One Brick at a Time
Advertising Engagement: A Driver of Message Involvement on Message Effects
The Advertising Magnifier Effect: An MTV Study
A Biologically Based Measure of Emotional Engagement: Context Matters
A Disaster Is Contagious: How a Brand in Crisis Affects Other Brands
Measuring the Effectiveness of True Sponsorship
Brand Relationships: Strengthened by Emotion, Weakened by Attention
Engaging the Consumer through Event Marketing: Linking Attendees with the Sponsor, Community, and Brand
Effects of Popular Music in Advertising on Attention and Memory
Methodological and Strategy Development Implications of Decision Segmentation
Marketers Who Measure the Wrong Thing Get Faulty Answers
Review of What Sticks: Why Most Advertising Fails and How to Guarantee Yours Succeeds
JAR46(4)cover.qxp 12/5/06 9:32 AM Page C1

Measuring the Effectiveness
of True Sponsorship
Twenty-eight studies were conducted for leading advertisers to measure the
persuasion of sponsorship without advertising on the internet. Experimental design
maintained identical content except for the sponsorship message in the test group
missing from the control group. The two groups were random replicates. Persuasion
measures used were those accepted by the advertisers involved as being most
predictive of sales. Average lift in purchase intent/brand consideration was 29
percent, which compares to an average lift of 4 percent across all ARS Persuasion
tests. Across the 28 studies the results were consistent in 100 percent of cases,
with the test group higher than the control group. Statistical significance was achieved
in virtually all cases at 95 percent confidence. In a different study, the sponsored
content was specifically courseware offered free on the internet by major advertisers.
Here the measurement was ROI based on a questionnaire self-report of brand
purchase and price paid. Sample size was over 196,000 intab questionnaires with a
65 percent response rate. ROI for sponsored educational content averaged 55:1,
about 27 times the published average of all MMA ROI results. The latter study also
obtained supplementary measures of satisfaction, increased brand perception, brand
promoter, willingness to take future courses, etc., the results of which were highly
positive and hence strongly supportive of the ROI results. These studies point strongly
to a major role for classical “True” sponsorship in the future of advertising in all
media, including internet, linear TV, VOD, mobile, etc.
INTRODUCTIONSponsorship is again on the rise, and marketers havecalled for new efforts by researchers to measure thebusiness value of this form of marketing commu-nications. The methodologies appropriate to mak-ing sponsorship accountable are similar to those usedfor other forms of advertising, and the effects ofsponsorship fit within the continuum of effectsknown as the ARF Model. What causes Persuasionin the sponsorship context appears, however, to belogically different from what causes Persuasion inthe advertising context. Advertising appears to work
by causing improvements directly in brand per-ception, whereas sponsorship appears to work bycausing improvement directly in the perception ofthe sponsoring company and often indirectly byhalo effect in the brand perception. However, evenwhen brand perception is not affected, sponsor-ship can increase purchase intent, apparently asresult of gratitude toward the sponsor.
BACKGROUND TO THIS STUDY SERIESIn 1999, Next Century Media was approached byStudio One, a major creator and syndicator of
BILL HARVEYTRA, Inc.
STU GRAYIndependent Consultant
GERALD DESPAINNext Century Media,
Inc.
DOI: 10.2501/S0021849906060478 JOURNAL OF ADVERTISING RESEARCHDecember 2006 398

sponsored content on the internet and inbroadcast outlets, and was asked to de-velop a methodology for measuring theeffects of internet sponsorships. In sub-sequent meetings with industry associa-tions, including the Association of NationalAdvertisers (ANA), the American Associ-ation of Advertising Agencies (AAAA),and American Demographics Magazine, Stu-dio One Networks and Next Century Me-dia organized SEI LLC, whose purpose isto make those methodologies applicableacross all media, including television andevent sponsorships. The methodology hasbeen applied first to the internet and isexpanding, using constant yardsticks acrossall media. Between 2000 and 2006, SEI hasexecuted 30 sponsorship studies for 12top advertisers. Twenty-eight of these stud-ies for 10 top advertisers have been com-pleted, and their results are contained inthis report.
CURRENT QUESTIONSSponsorships were the original advertis-ing form on radio and television. Spon-sored events today generate more totaldollars than all media advertising com-bined (from a combination of sponsor ex-penditure plus ticket sales). On the internet,sponsorship revenues are expanding fasterthan banner revenues. In the future, therise in penetration of personal video re-corders [(PVRs) also known as digital videorecorders (DVRs)] such as TiVo, as well asthe duplication of PVR function by cableand satellite set top boxes is expected toincrease the consumer’s ability to avoidnormal advertising. Pundits are proclaim-ing that the future shall be a new GoldenAge for sponsorship, product placement,and cast presenter commercials, in an ef-fort by marketers to keep up the consum-er’s diet of marketing messages in face ofthe new hurdles—avoiding zapping bymerging into the programming.
Despite all of the indicators pointing tothe need for a clear understanding of thebusiness value of sponsorships, market-ers today remain unsure of how sponsor-ship works and how to properly measureits business value. Marketers see spon-sorship as something different fromadvertising—but there has been no gen-eral clarification of how sponsorship dif-fers from advertising, and what this impliesin terms of how to make sponsorshipaccountable. Thus there has been a recentgroundswell of interest expressed by ad-vertisers and agencies alike in devisingnew forms of research to measure thebusiness effects of sponsorships in allmedia—including events.
HYPOTHESES OF THE SPONSORSHIPEFFECTIVENESS INDEX STUDIES
1. Sponsorship has recall and persuasioneffects like traditional advertising.
2. Sponsorship operates through differ-ent cognitive processes than those uti-lized by traditional advertising.
3. Advertising changes the consumer’sperception of a specific product whilesponsorship changes the consumer’sperception of a specific sponsor—which can rub off positively on thebrands of that sponsor and may in-crease the willingness to purchase thosebrands.
4. Sponsorship’s positive business effectsare maximized when:a. The target audience is highly in-
volved in the subject of the programor event being sponsored.
b. That audience perceives there to bea scarcity of content in the subjectarea relative to their appetite for it.
c. The program/event is executed soas to produce a high level of sat-isfaction with the material by theaudience.
METHODOLOGYWhen internet users click on a link to asponsored program, they are interceptedby an invitation screen.
Before they are admitted to the pro-gram, they must answer yes or no to aquestion as to their willingness to answera few questions “to help us improve theprogram,” which they will be asked uponleaving the program. They may be of-fered an incentive ranging from a freemagazine to a $15 gift certificate at apopular book chain website, dependingon the degree of the advertiser’s willing-ness to incent respondents.
Users answering “no” are allowed togo to the program and are not contactedagain. Users answering “yes” are alsoallowed to go to the program, and arandom half of them are sent to a ver-sion of the program where the sponsor isnot mentioned (the control group). Every-thing else about the program is identicalacross the exposed group and the controlgroup. As respondents leave the pro-gram by any means (e.g., click on a ban-ner, hit the back button, etc.), they receivea short onscreen questionnaire, which isthe same for both the exposed group andcontrol group. A person’s status (agreedto participate or not, control or exposedgroup, already responded to question-naire or not) persists across multiple ses-sions to prevent duplication of participantsor showing sponsorship logos to the con-trol group.
The questionnaire begins with ques-tions about the editorial content, and howit might be improved. It then goes on toquestions relevant to measuring sponsor-ship effectiveness, which are adapted foreach sponsor’s studies to reflect commu-nications measures that the advertiser hasfound to be most predictive of sales, andwhich are therefore routinely used to as-sess advertising performance in trackingstudies and in commercial pretesting. The
MEASURING THE EFFECTIVENESS OF TRUE SPONSORSHIP
December 2006JOURNAL OF ADVERTISING RESEARCH399
difference in these measures is attributedto the effect of sponsorship, as all othervariables have been held constant.
SEI’s software can be calibrated so thatall users clicking to go to a sponsoredprogram may be intercepted, or a specificpercentage of them can be intercepted.
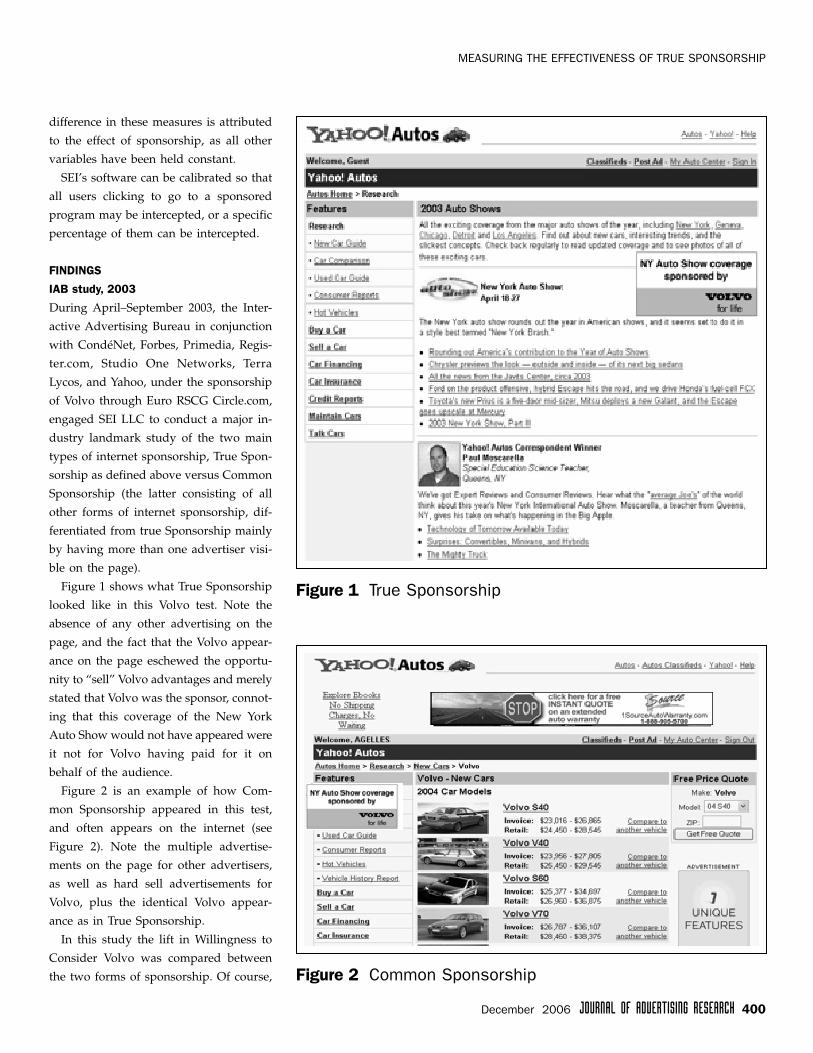
FINDINGSIAB study, 2003During April–September 2003, the Inter-active Advertising Bureau in conjunctionwith CondéNet, Forbes, Primedia, Regis-ter.com, Studio One Networks, TerraLycos, and Yahoo, under the sponsorshipof Volvo through Euro RSCG Circle.com,engaged SEI LLC to conduct a major in-dustry landmark study of the two maintypes of internet sponsorship, True Spon-sorship as defined above versus CommonSponsorship (the latter consisting of allother forms of internet sponsorship, dif-ferentiated from true Sponsorship mainlyby having more than one advertiser visi-ble on the page).
Figure 1 shows what True Sponsorshiplooked like in this Volvo test. Note theabsence of any other advertising on thepage, and the fact that the Volvo appear-ance on the page eschewed the opportu-nity to “sell” Volvo advantages and merelystated that Volvo was the sponsor, connot-ing that this coverage of the New YorkAuto Show would not have appeared wereit not for Volvo having paid for it onbehalf of the audience.
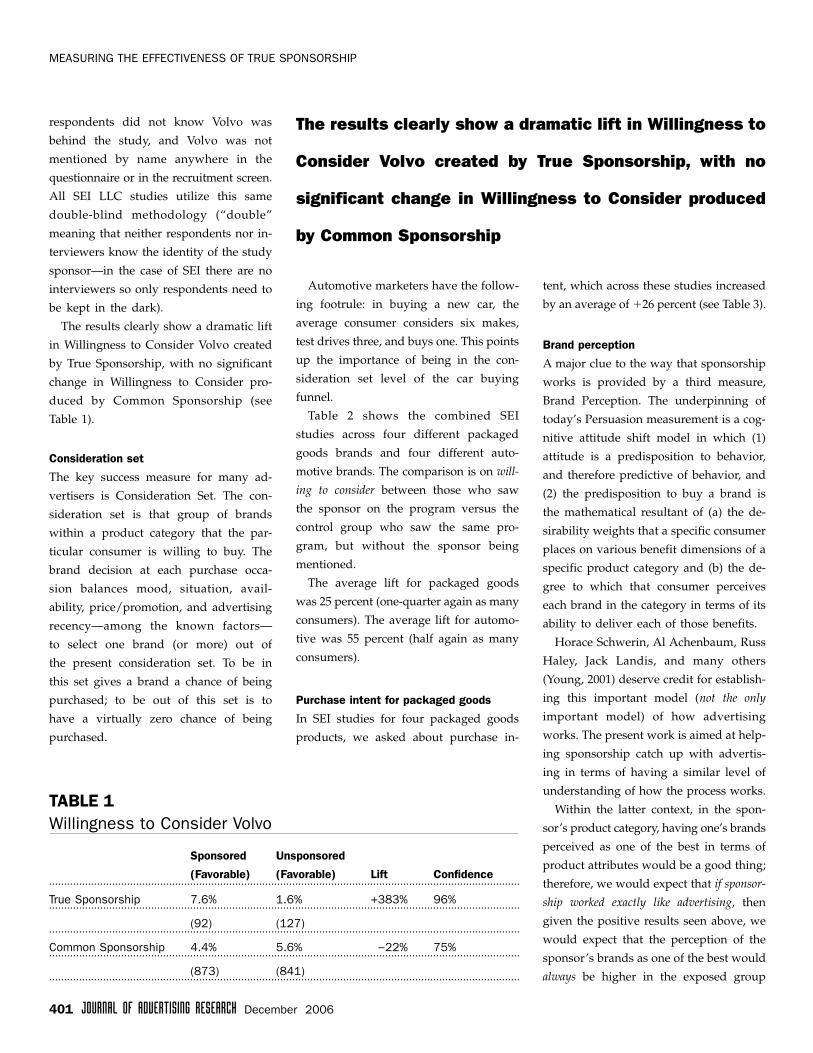
Figure 2 is an example of how Com-mon Sponsorship appeared in this test,and often appears on the internet (seeFigure 2). Note the multiple advertise-ments on the page for other advertisers,as well as hard sell advertisements forVolvo, plus the identical Volvo appear-ance as in True Sponsorship.
In this study the lift in Willingness toConsider Volvo was compared betweenthe two forms of sponsorship. Of course,
Figure 1 True Sponsorship
Figure 2 Common Sponsorship
MEASURING THE EFFECTIVENESS OF TRUE SPONSORSHIP
JOURNAL OF ADVERTISING RESEARCHDecember 2006 400
respondents did not know Volvo wasbehind the study, and Volvo was notmentioned by name anywhere in thequestionnaire or in the recruitment screen.All SEI LLC studies utilize this samedouble-blind methodology (“double”meaning that neither respondents nor in-terviewers know the identity of the studysponsor—in the case of SEI there are nointerviewers so only respondents need tobe kept in the dark).
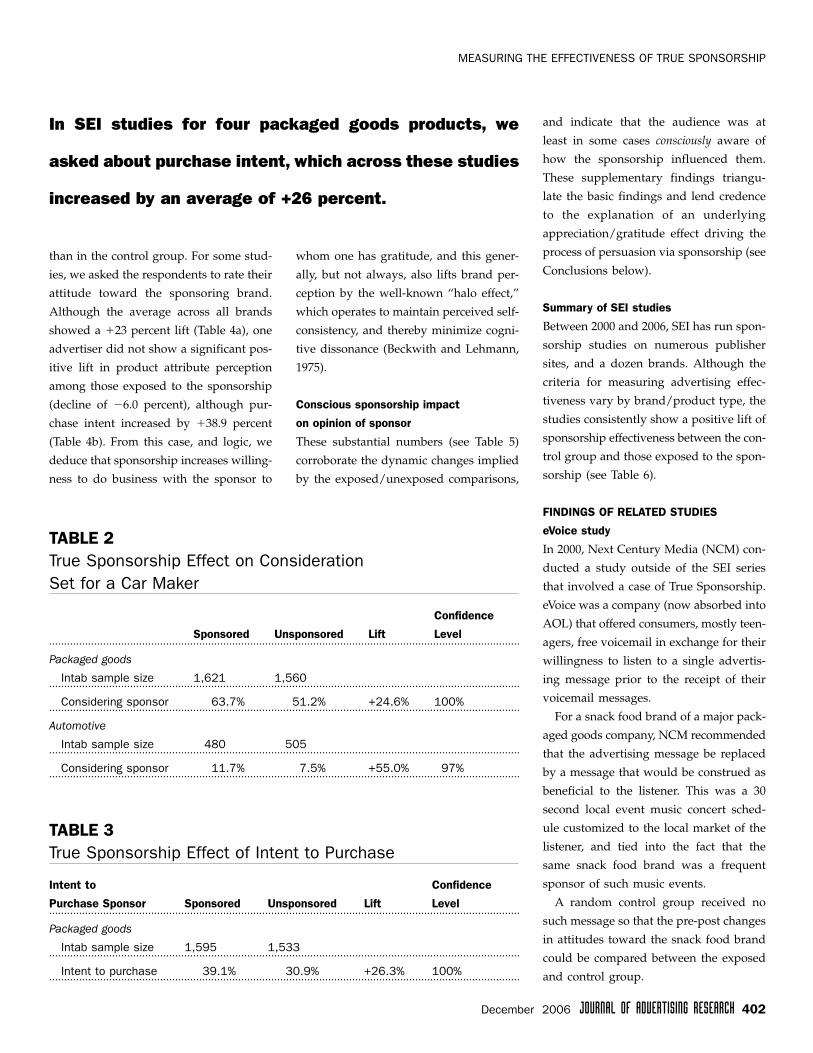
The results clearly show a dramatic liftin Willingness to Consider Volvo createdby True Sponsorship, with no significantchange in Willingness to Consider pro-duced by Common Sponsorship (seeTable 1).
Consideration setThe key success measure for many ad-vertisers is Consideration Set. The con-sideration set is that group of brandswithin a product category that the par-ticular consumer is willing to buy. Thebrand decision at each purchase occa-sion balances mood, situation, avail-ability, price/promotion, and advertisingrecency—among the known factors—to select one brand (or more) out ofthe present consideration set. To be inthis set gives a brand a chance of beingpurchased; to be out of this set is tohave a virtually zero chance of beingpurchased.
Automotive marketers have the follow-ing footrule: in buying a new car, theaverage consumer considers six makes,test drives three, and buys one. This pointsup the importance of being in the con-sideration set level of the car buyingfunnel.
Table 2 shows the combined SEIstudies across four different packagedgoods brands and four different auto-motive brands. The comparison is on will-ing to consider between those who sawthe sponsor on the program versus thecontrol group who saw the same pro-gram, but without the sponsor beingmentioned.
The average lift for packaged goodswas 25 percent (one-quarter again as manyconsumers). The average lift for automo-tive was 55 percent (half again as manyconsumers).
Purchase intent for packaged goodsIn SEI studies for four packaged goodsproducts, we asked about purchase in-
tent, which across these studies increasedby an average of !26 percent (see Table 3).
Brand perceptionA major clue to the way that sponsorshipworks is provided by a third measure,Brand Perception. The underpinning oftoday’s Persuasion measurement is a cog-nitive attitude shift model in which (1)attitude is a predisposition to behavior,and therefore predictive of behavior, and(2) the predisposition to buy a brand isthe mathematical resultant of (a) the de-sirability weights that a specific consumerplaces on various benefit dimensions of aspecific product category and (b) the de-gree to which that consumer perceiveseach brand in the category in terms of itsability to deliver each of those benefits.
Horace Schwerin, Al Achenbaum, RussHaley, Jack Landis, and many others(Young, 2001) deserve credit for establish-ing this important model (not the onlyimportant model) of how advertisingworks. The present work is aimed at help-ing sponsorship catch up with advertis-ing in terms of having a similar level ofunderstanding of how the process works.
Within the latter context, in the spon-sor’s product category, having one’s brandsperceived as one of the best in terms ofproduct attributes would be a good thing;therefore, we would expect that if sponsor-ship worked exactly like advertising, thengiven the positive results seen above, wewould expect that the perception of thesponsor’s brands as one of the best wouldalways be higher in the exposed group
TABLE 1Willingness to Consider Volvo
Sponsored(Favorable)
Unsponsored(Favorable) Lift Confidence.............................................................................................................................................................
True Sponsorship 7.6% 1.6% +383% 96%.............................................................................................................................................................(92) (127).............................................................................................................................................................
Common Sponsorship 4.4% 5.6% −22% 75%.............................................................................................................................................................(873) (841).............................................................................................................................................................
The results clearly show a dramatic lift in Willingness to
Consider Volvo created by True Sponsorship, with no
significant change in Willingness to Consider produced
by Common Sponsorship
MEASURING THE EFFECTIVENESS OF TRUE SPONSORSHIP
December 2006JOURNAL OF ADVERTISING RESEARCH401
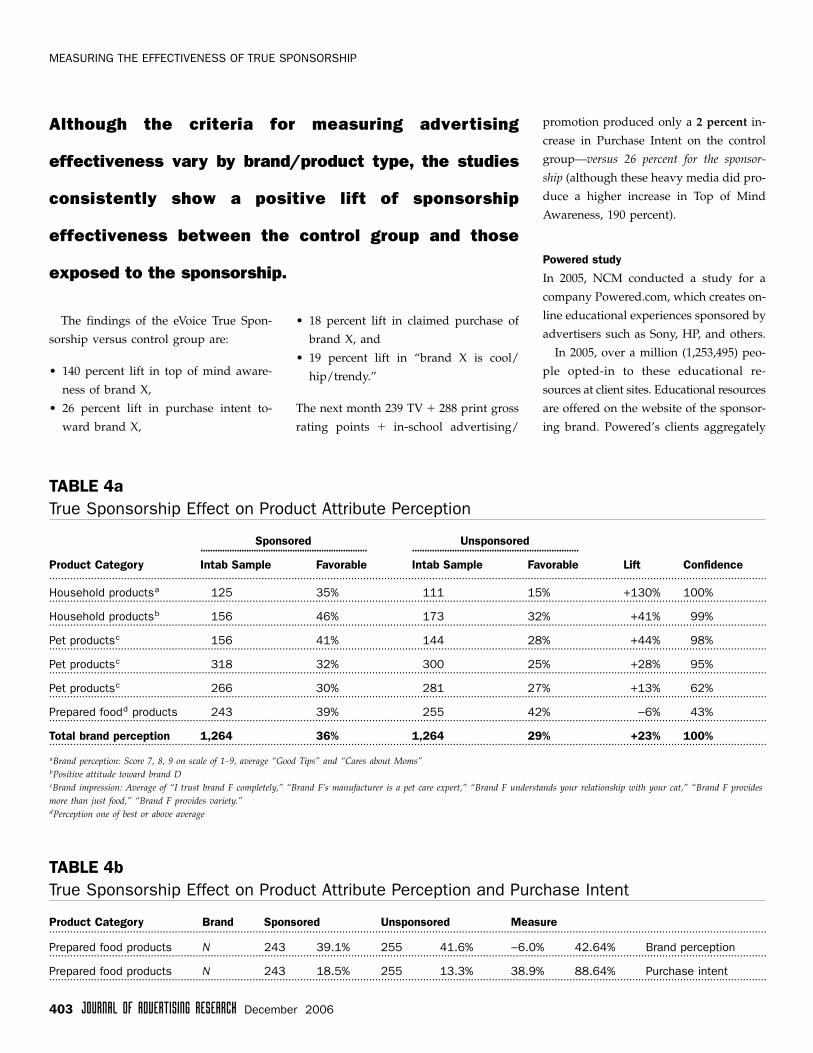
than in the control group. For some stud-ies, we asked the respondents to rate theirattitude toward the sponsoring brand.Although the average across all brandsshowed a !23 percent lift (Table 4a), oneadvertiser did not show a significant pos-itive lift in product attribute perceptionamong those exposed to the sponsorship(decline of "6.0 percent), although pur-chase intent increased by !38.9 percent(Table 4b). From this case, and logic, wededuce that sponsorship increases willing-ness to do business with the sponsor to
whom one has gratitude, and this gener-ally, but not always, also lifts brand per-ception by the well-known “halo effect,”which operates to maintain perceived self-consistency, and thereby minimize cogni-tive dissonance (Beckwith and Lehmann,1975).
Conscious sponsorship impacton opinion of sponsorThese substantial numbers (see Table 5)corroborate the dynamic changes impliedby the exposed/unexposed comparisons,
and indicate that the audience was atleast in some cases consciously aware ofhow the sponsorship influenced them.These supplementary findings triangu-late the basic findings and lend credenceto the explanation of an underlyingappreciation/gratitude effect driving theprocess of persuasion via sponsorship (seeConclusions below).
Summary of SEI studiesBetween 2000 and 2006, SEI has run spon-sorship studies on numerous publishersites, and a dozen brands. Although thecriteria for measuring advertising effec-tiveness vary by brand/product type, thestudies consistently show a positive lift ofsponsorship effectiveness between the con-trol group and those exposed to the spon-sorship (see Table 6).
FINDINGS OF RELATED STUDIESeVoice studyIn 2000, Next Century Media (NCM) con-ducted a study outside of the SEI seriesthat involved a case of True Sponsorship.eVoice was a company (now absorbed intoAOL) that offered consumers, mostly teen-agers, free voicemail in exchange for theirwillingness to listen to a single advertis-ing message prior to the receipt of theirvoicemail messages.
For a snack food brand of a major pack-aged goods company, NCM recommendedthat the advertising message be replacedby a message that would be construed asbeneficial to the listener. This was a 30second local event music concert sched-ule customized to the local market of thelistener, and tied into the fact that thesame snack food brand was a frequentsponsor of such music events.
A random control group received nosuch message so that the pre-post changesin attitudes toward the snack food brandcould be compared between the exposedand control group.
In SEI studies for four packaged goods products, we
asked about purchase intent, which across these studies
increased by an average of +26 percent.
TABLE 2True Sponsorship Effect on ConsiderationSet for a Car Maker
Sponsored Unsponsored LiftConfidenceLevel.............................................................................................................................................................
Packaged goods
Intab sample size 1,621 1,560.............................................................................................................................................................Considering sponsor 63.7% 51.2% +24.6% 100%.............................................................................................................................................................
Automotive
Intab sample size 480 505.............................................................................................................................................................Considering sponsor 11.7% 7.5% +55.0% 97%.............................................................................................................................................................
TABLE 3True Sponsorship Effect of Intent to Purchase
Intent toPurchase Sponsor Sponsored Unsponsored Lift
ConfidenceLevel.............................................................................................................................................................
Packaged goods
Intab sample size 1,595 1,533.............................................................................................................................................................Intent to purchase 39.1% 30.9% +26.3% 100%.............................................................................................................................................................
MEASURING THE EFFECTIVENESS OF TRUE SPONSORSHIP
402JOURNAL OF ADVERTISING RESEARCHDecember 2006
The findings of the eVoice True Spon-sorship versus control group are:
• 140 percent lift in top of mind aware-ness of brand X,
• 26 percent lift in purchase intent to-ward brand X,
• 18 percent lift in claimed purchase ofbrand X, and
• 19 percent lift in “brand X is cool/hip/trendy.”
The next month 239 TV ! 288 print grossrating points ! in-school advertising/
promotion produced only a 2 percent in-crease in Purchase Intent on the controlgroup—versus 26 percent for the sponsor-ship (although these heavy media did pro-duce a higher increase in Top of MindAwareness, 190 percent).
Powered studyIn 2005, NCM conducted a study for acompany Powered.com, which creates on-line educational experiences sponsored byadvertisers such as Sony, HP, and others.
In 2005, over a million (1,253,495) peo-ple opted-in to these educational re-sources at client sites. Educational resourcesare offered on the website of the sponsor-ing brand. Powered’s clients aggregately
Although the criteria for measuring advertising
effectiveness vary by brand/product type, the studies
consistently show a positive lift of sponsorship
effectiveness between the control group and those
exposed to the sponsorship.
TABLE 4aTrue Sponsorship Effect on Product Attribute Perception
Sponsored Unsponsored..................................................................... ...................................................................Product Category Intab Sample Favorable Intab Sample Favorable Lift Confidence................................................................................................................................................................................................................................................Household productsa 125 35% 111 15% +130% 100%................................................................................................................................................................................................................................................Household productsb 156 46% 173 32% +41% 99%................................................................................................................................................................................................................................................Pet productsc 156 41% 144 28% +44% 98%................................................................................................................................................................................................................................................Pet productsc 318 32% 300 25% +28% 95%................................................................................................................................................................................................................................................Pet productsc 266 30% 281 27% +13% 62%................................................................................................................................................................................................................................................Prepared foodd products 243 39% 255 42% −6% 43%................................................................................................................................................................................................................................................Total brand perception 1,264 36% 1,264 29% +23% 100%................................................................................................................................................................................................................................................aBrand perception: Score 7, 8, 9 on scale of 1–9, average “Good Tips” and “Cares about Moms”bPositive attitude toward brand DcBrand impression: Average of “I trust brand F completely,” “Brand F’s manufacturer is a pet care expert,” “Brand F understands your relationship with your cat,” “Brand F providesmore than just food,” “Brand F provides variety.”dPerception one of best or above average
TABLE 4bTrue Sponsorship Effect on Product Attribute Perception and Purchase Intent
Product Category Brand Sponsored Unsponsored Measure................................................................................................................................................................................................................................................Prepared food products N 243 39.1% 255 41.6% −6.0% 42.64% Brand perception................................................................................................................................................................................................................................................Prepared food products N 243 18.5% 255 13.3% 38.9% 88.64% Purchase intent................................................................................................................................................................................................................................................
MEASURING THE EFFECTIVENESS OF TRUE SPONSORSHIP
December 2006JOURNAL OF ADVERTISING RESEARCH403
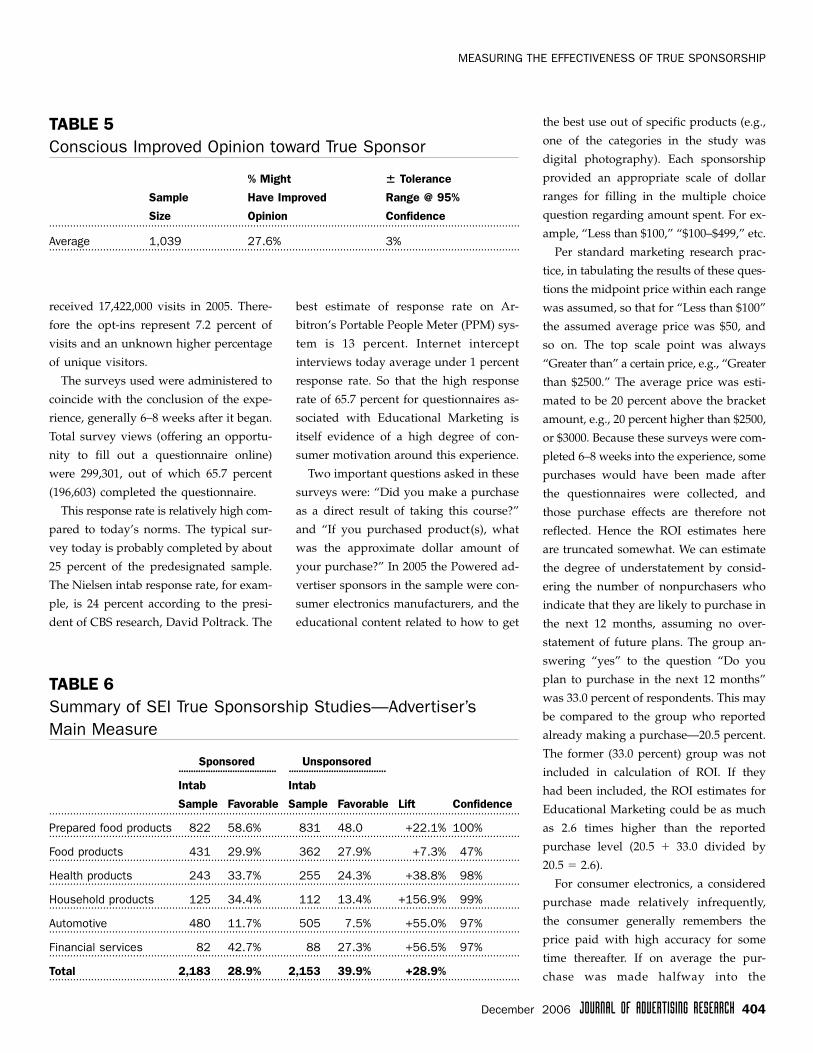
received 17,422,000 visits in 2005. There-fore the opt-ins represent 7.2 percent ofvisits and an unknown higher percentageof unique visitors.
The surveys used were administered tocoincide with the conclusion of the expe-rience, generally 6–8 weeks after it began.Total survey views (offering an opportu-nity to fill out a questionnaire online)were 299,301, out of which 65.7 percent(196,603) completed the questionnaire.
This response rate is relatively high com-pared to today’s norms. The typical sur-vey today is probably completed by about25 percent of the predesignated sample.The Nielsen intab response rate, for exam-ple, is 24 percent according to the presi-dent of CBS research, David Poltrack. The
best estimate of response rate on Ar-bitron’s Portable People Meter (PPM) sys-tem is 13 percent. Internet interceptinterviews today average under 1 percentresponse rate. So that the high responserate of 65.7 percent for questionnaires as-sociated with Educational Marketing isitself evidence of a high degree of con-sumer motivation around this experience.
Two important questions asked in thesesurveys were: “Did you make a purchaseas a direct result of taking this course?”and “If you purchased product(s), whatwas the approximate dollar amount ofyour purchase?” In 2005 the Powered ad-vertiser sponsors in the sample were con-sumer electronics manufacturers, and theeducational content related to how to get
the best use out of specific products (e.g.,one of the categories in the study wasdigital photography). Each sponsorshipprovided an appropriate scale of dollarranges for filling in the multiple choicequestion regarding amount spent. For ex-ample, “Less than $100,” “$100–$499,” etc.
Per standard marketing research prac-tice, in tabulating the results of these ques-tions the midpoint price within each rangewas assumed, so that for “Less than $100”the assumed average price was $50, andso on. The top scale point was always“Greater than” a certain price, e.g., “Greaterthan $2500.” The average price was esti-mated to be 20 percent above the bracketamount, e.g., 20 percent higher than $2500,or $3000. Because these surveys were com-pleted 6–8 weeks into the experience, somepurchases would have been made afterthe questionnaires were collected, andthose purchase effects are therefore notreflected. Hence the ROI estimates hereare truncated somewhat. We can estimatethe degree of understatement by consid-ering the number of nonpurchasers whoindicate that they are likely to purchase inthe next 12 months, assuming no over-statement of future plans. The group an-swering “yes” to the question “Do youplan to purchase in the next 12 months”was 33.0 percent of respondents. This maybe compared to the group who reportedalready making a purchase—20.5 percent.The former (33.0 percent) group was notincluded in calculation of ROI. If theyhad been included, the ROI estimates forEducational Marketing could be as muchas 2.6 times higher than the reportedpurchase level (20.5 ! 33.0 divided by20.5 # 2.6).
For consumer electronics, a consideredpurchase made relatively infrequently,the consumer generally remembers theprice paid with high accuracy for sometime thereafter. If on average the pur-chase was made halfway into the
TABLE 5Conscious Improved Opinion toward True Sponsor
SampleSize
% MightHave ImprovedOpinion
6 ToleranceRange @ 95%Confidence.............................................................................................................................................................
Average 1,039 27.6% 3%.............................................................................................................................................................
TABLE 6Summary of SEI True Sponsorship Studies—Advertiser’sMain Measure
Sponsored Unsponsored........................................ .......................................IntabSample Favorable
IntabSample Favorable Lift Confidence.............................................................................................................................................................
Prepared food products 822 58.6% 831 48.0 +22.1% 100%.............................................................................................................................................................Food products 431 29.9% 362 27.9% +7.3% 47%.............................................................................................................................................................Health products 243 33.7% 255 24.3% +38.8% 98%.............................................................................................................................................................Household products 125 34.4% 112 13.4% +156.9% 99%.............................................................................................................................................................Automotive 480 11.7% 505 7.5% +55.0% 97%.............................................................................................................................................................Financial services 82 42.7% 88 27.3% +56.5% 97%.............................................................................................................................................................Total 2,183 28.9% 2,153 39.9% +28.9%.............................................................................................................................................................
MEASURING THE EFFECTIVENESS OF TRUE SPONSORSHIP
JOURNAL OF ADVERTISING RESEARCHDecember 2006 404
6–8 week period, then the data were col-lected on average less than a month afterthe purchase was made. We would ex-pect therefore that the great majority ofconsumers checked the right box in termsof amount spent.
The findings for survey cooperators wereprojected to total enrollment using a pro-jection factor of 6.37, because the totalopt-in base was 6.37 times as large as theintab questionnaire sample base.
ROI is defined in this analysis as incre-mental short-term sales revenues dividedby investment.
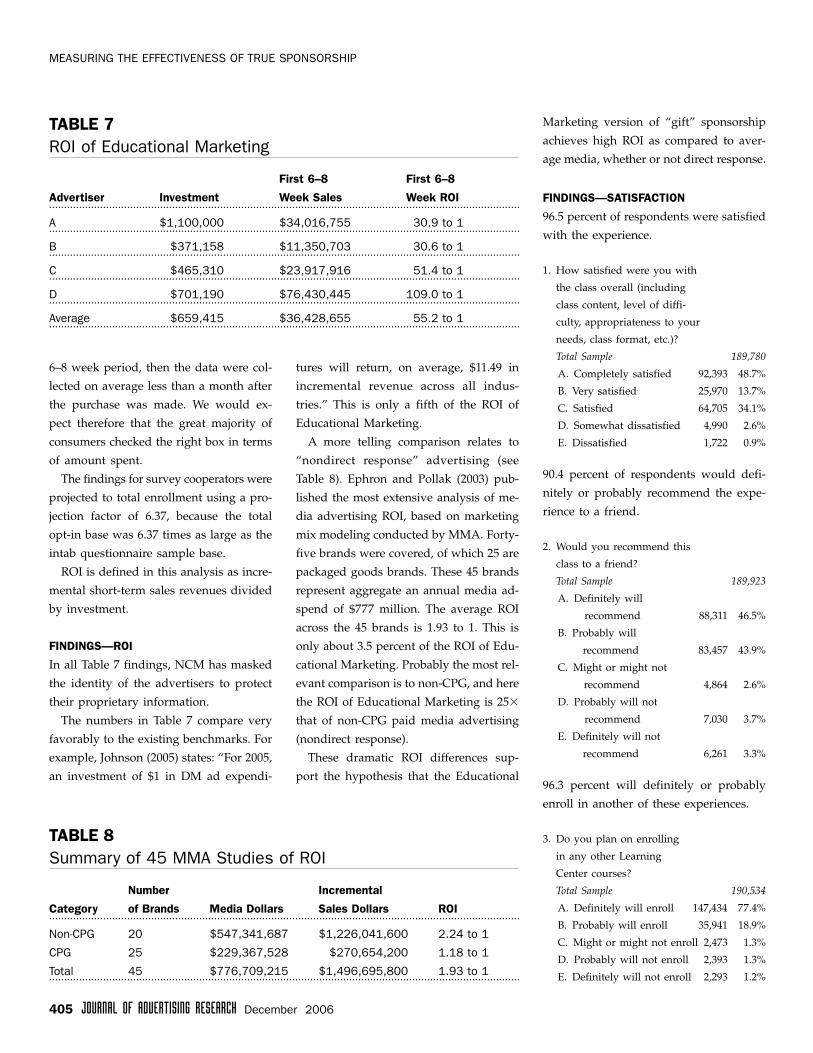
FINDINGS—ROIIn all Table 7 findings, NCM has maskedthe identity of the advertisers to protecttheir proprietary information.
The numbers in Table 7 compare veryfavorably to the existing benchmarks. Forexample, Johnson (2005) states: “For 2005,an investment of $1 in DM ad expendi-
tures will return, on average, $11.49 inincremental revenue across all indus-tries.” This is only a fifth of the ROI ofEducational Marketing.
A more telling comparison relates to“nondirect response” advertising (seeTable 8). Ephron and Pollak (2003) pub-lished the most extensive analysis of me-dia advertising ROI, based on marketingmix modeling conducted by MMA. Forty-five brands were covered, of which 25 arepackaged goods brands. These 45 brandsrepresent aggregate an annual media ad-spend of $777 million. The average ROIacross the 45 brands is 1.93 to 1. This isonly about 3.5 percent of the ROI of Edu-cational Marketing. Probably the most rel-evant comparison is to non-CPG, and herethe ROI of Educational Marketing is 25$
that of non-CPG paid media advertising(nondirect response).
These dramatic ROI differences sup-port the hypothesis that the Educational
Marketing version of “gift” sponsorshipachieves high ROI as compared to aver-age media, whether or not direct response.
FINDINGS—SATISFACTION96.5 percent of respondents were satisfiedwith the experience.
1. How satisfied were you with
the class overall (including
class content, level of diffi-
culty, appropriateness to your
needs, class format, etc.)?
Total Sample 189,780
A. Completely satisfied 92,393 48.7%
B. Very satisfied 25,970 13.7%
C. Satisfied 64,705 34.1%
D. Somewhat dissatisfied 4,990 2.6%
E. Dissatisfied 1,722 0.9%
90.4 percent of respondents would defi-nitely or probably recommend the expe-rience to a friend.
2. Would you recommend this
class to a friend?
Total Sample 189,923
A. Definitely will
recommend 88,311 46.5%
B. Probably will
recommend 83,457 43.9%
C. Might or might not
recommend 4,864 2.6%
D. Probably will not
recommend 7,030 3.7%
E. Definitely will not
recommend 6,261 3.3%
96.3 percent will definitely or probablyenroll in another of these experiences.
3. Do you plan on enrolling
in any other Learning
Center courses?
Total Sample 190,534
A. Definitely will enroll 147,434 77.4%
B. Probably will enroll 35,941 18.9%
C. Might or might not enroll 2,473 1.3%
D. Probably will not enroll 2,393 1.3%
E. Definitely will not enroll 2,293 1.2%
TABLE 8Summary of 45 MMA Studies of ROI
CategoryNumberof Brands Media Dollars
IncrementalSales Dollars ROI.............................................................................................................................................................
Non-CPG 20 $547,341,687 $1,226,041,600 2.24 to 1
CPG 25 $229,367,528 $270,654,200 1.18 to 1
Total 45 $776,709,215 $1,496,695,800 1.93 to 1.............................................................................................................................................................
TABLE 7ROI of Educational Marketing
Advertiser InvestmentFirst 6–8Week Sales
First 6–8Week ROI.............................................................................................................................................................
A $1,100,000 $34,016,755 30.9 to 1.............................................................................................................................................................B $371,158 $11,350,703 30.6 to 1.............................................................................................................................................................C $465,310 $23,917,916 51.4 to 1.............................................................................................................................................................D $701,190 $76,430,445 109.0 to 1.............................................................................................................................................................Average $659,415 $36,428,655 55.2 to 1.............................................................................................................................................................
MEASURING THE EFFECTIVENESS OF TRUE SPONSORSHIP
December 2006JOURNAL OF ADVERTISING RESEARCH405
FINDINGS—BRAND PERCEPTION93.6 percent agree with the statement “Ihave a more favorable impression of thebrand because of this service.”
I have a more favorable
impression of the brand
because of this service.
Total Sample 113,373
Strongly agree 35,020 30.9%
Agree 71,035 62.7%
Disagree 6,313 5.6%
Strongly Disagree 1,005 0.9%
31.1 percent are consciously aware thatthe experience increased their probabilityof buying the sponsor’s brand.
(This question was included in onlyone sponsor’s questionnaire, hence the farsmaller sample size.)
How did this course influence
your purchasing decision?
Total Sample 132
More likely to make
a purchase 41 31.1%
Unchanged 53 40.2%
Less likely to make
a purchase 2 1.5%
Not considering a
purchase at this time 19 14.4%
Don’t know (N/A) 17 12.9%
APPLICABILITY TO TELEVISIONMost of the results presented above werecollected from internet tests. This hascaused some reviewers to ask the ques-tion: how applicable will these results beto television? This is a natural questionbecause television is still the base me-dium for most major advertisers, garner-ing about six times the total investment ofthe internet. And it is particularly cogenttoday as TiVo-like devices make it easierto avoid TV commercials, and as Videoon Demand (VOD) reaches into morehomes—many of the same homes withPVRs. VOD is a logical new venue foradvertising in any of several forms: inter-ruptive commercials, which the viewer
would be expected to tolerate in order togain a discount or even a free viewing ofwhat otherwise would be a paid experi-ence; and/or True Sponsorship, where theviewer would be able to watch withoutcommercials, and potentially where theadvertising effectiveness might poten-tially exceed the use of interruptive com-mercials, based on the results seen above.
In this section, therefore, we will pre-sent the results for True Sponsorshipthat we have thus far accumulated withintelevision.
Hooper studiesIn 1968, we were privileged to work on aC.E. Hooper project for a pet food adver-tiser to measure the effects of a sponsoredSpecial on CBS in prime time. The castpresenter commercials were seamlessly in-tegrated into the program. Hooper wasmeasuring the scatter plan for that adver-tiser as well and applied the same on-airtesting methodology to measuring the Spe-cial. The attitude shift, and commercialrecall measures for the Special were ap-proximately three times the scatter planaverages. In the latter case, what wasbeing measured was a combination ofproduct-sell commercials plus sponsor-ship. One indeed wonders what the recalland attitude shift results would have beenif the sponsorship did not include prod-uct sell commercials. Today, sponsorshipgenerally does not include product sell—although perhaps it might in the future ifthe combination turned out to be as po-tent in general as in the case just cited.This potential potency suggests that theindustry develop its sponsorship measure-ment tools so as to be able to distinguishcauses and effects to this degree—i.e., sep-arating out the effects of sponsorship it-self from accompanying product selladvertising, if any.
In the same year, we were also fortu-nate in participating in another Hooper
study, which used approximately 250,000coincidental calls to measure the immedi-ate recall of TV commercials from 10 amto 10 pm in each local time zone. By 1968there were only a handful of sponsoredprograms left on television, as the scatterplan had become the dominant TV mediastrategy. The immediate commercial re-call on these sponsored programs wasabout 2.5 times the average scatter planlevel.
CBS Norman Hecht Research StudiesIn 1990, CBS commissioned Norman HechtResearch (www.normanhechtresearch.com)to conduct a series of studies measuringthe effects of five prime-time TV Specials.The advertisers were Anheuser-Busch,AT&T, Chrysler, GM, Hallmark, Mc-Donald’s, Pepsico, Reebok, and Valvoline.The Top of Mind Brand Awareness wasincreased up to !230 percent with a me-dian increase of !17 percent. Top of MindAdvertising Awareness was increased upto !500 percent with a median increaseof !24 percent. The most significant mea-sure, at the persuasion level, was a Pur-chase Intent increase of up to !40 percentwith a median increase of !20 percent.As a benchmark, at about the same time,one of the leading commercial pretestingcompanies, ARS (www.ars-group.com),found that persuasion increase caused bythe average TV commercial tested was onthe order of magnitude of !4 percent.
SURPRISING MAGNITUDE OFRESULTS—LIKELIHOOD OFREPLICATION IN PRACTICEThere is little question that the magnitudeof the results of these tests is surprising.Most tests of new advertising approaches,whether creative or media or both, whetherstrategic or executional, do not produceresults of such striking magnitude. There-fore it is reasonable to ask whether the
MEASURING THE EFFECTIVENESS OF TRUE SPONSORSHIP
JOURNAL OF ADVERTISING RESEARCHDecember 2006 406

average practitioner is actually capable ofachieving such results.
We do not profess to have an uncannydegree of creative talent, nor can the au-thors claim very much credit for the con-tent that, when sponsored according tothe precepts of True Sponsorship (see Rec-ommendations section below), producedthese results. A great many people wereresponsible for the programming in-volved in these tests. Logic suggests thatthe mix of creative talents involvedranged from high to low and did notdeviate extraordinarily from the typicalrange among practitioners.
We conclude from these considerationstherefore that the typical practitioner isquite capable of enjoying the large mag-nitude effects found in these studies, sim-ply by following the “rules” as laid outherein, especially in the Recommenda-tions section below.
CHARACTERISTICS OF THE CONTENTPRODUCING THESE RESULTSThe content producing these results var-ied across a spectrum. However, a com-mon element in many of the programsinvolved is that they stood out from mostprograms either by (in the case of the tele-vision programs studied) being “Spe-cials” or (in the case of the internetprograms studied) by providing usefulinformation.
Among the internet programs yieldingthe highest results, the utility of the infor-mation provided was conjoined by a de-gree of positive surprise at the sponsor’shonesty and integrity as evidenced by thesponsor’s willingness to allow positiveinformation to be included about the spon-sor’s competitors. This was, for example,the case with regard to the Volvo spon-sorship, in which all of Volvo’s competi-tors were showcased in the pages thatVolvo sponsored, because the program wascoverage of the New York Auto Show. It
was also the case for another sponsor-ship, but the details of that program can-not be revealed without trespassing onthe sponsor’s proprietary information.Other recent NCM studies in another field(Behavioral Targeting) also suggest thatpositive surprise is an element that can beof extreme value to advertising.
WHAT IS TRUE SPONSORSHIP?There is an unfortunate tendency for somemedia to misuse the term Sponsorship. Whatthen do we consider to be “True” Sponsor-ship? We provided an initial definition atthe outset of this report, and here we willexpand upon that definition with the in-tent of rounding out the reader’s under-standing of the critical success factors tothe use of this marketing method. A TrueSponsorship has:
• Exclusivity/Visibility. There is a singlesponsor. There is no advertising forany other brand. It is easy to see thesponsorship credit. It is not a TrueSponsorship if it is difficult to see thesponsorship logo because it is too small,poorly placed on the page, or is lostamong regular advertisements on thepage.
• Emotive Connection. It is perceived as giv-ing the user a no-strings-attached gift ofvalued content. It is not a True Sponsor-ship if it is promotion for a brand. It isnot a True Sponsorship if there are hid-den or obvious product plugs in theprogram/editorial content. It is not a TrueSponsorship if there is hard sell adver-tising for the sponsor or if what is meantas sponsorship to the consumer looks likejust more advertising.
SEI LLC has tested a variety of differ-ent modes of sponsorship, comparingthem on ascending and descending levelsof messaging, creative, integration, andexclusivity.
RECOMMENDATIONSFollowing are some implications for spon-sored programming/events that we havedrawn from our findings:
• Make sure that your sponsorship of thecontent is VISIBLE.
• If appropriate, someone involved inthe program/event might THANK thesponsor for sponsorship of the program/event.
• This “Thanking” might be carried overto advertising and PR for the program/event.
• Be wary of the potential dilutive effectswhere there are multiple sponsors forthe same program/event.
• Adhere to the rules of True Sponsor-ship—the gift of real value to theaudience.
• Make sure that the audience will notperceive your sponsorship as merelyanother form of advertising.
SUMMARY OF RESULTSAs sponsorship remains an importantmarketing element with the promiseof playing an even larger role in the fu-ture, the present work began with theobjective of developing tools with whichto quantify the business building effectsof sponsorship. At the present stage ofthis endeavor, some intriguing findingshave emerged, which are perhaps worthdiscussing in terms of their potentialimplications.
The first hypothesis was that Sponsor-ship has recall and persuasion effects likeadvertising does. The SEI studies appearto confirm the existence of a persuasioneffect.
The second hypothesis was that Spon-sorship operates through different cogni-tive processes than those utilized bytraditional advertising. Although it is toosoon to draw any firm conclusions, theredoes indeed appear to be support for this
MEASURING THE EFFECTIVENESS OF TRUE SPONSORSHIP
December 2006JOURNAL OF ADVERTISING RESEARCH407

hypothesis. If it were advertising, spon-sors ought not to have seen inconsistentresults on brand perception along withconsistent and dramatically positive re-sults on consideration set and purchaseintent. As marketers have long suspected,sponsorship appears to have its positivebusiness effects based on different cogni-tive processes than straight product selladvertising.
The third hypothesis was that Advertis-ing changes the consumer’s perception ofa specific product while sponsorshipchanges the consumer’s perception of aspecific sponsor—which can rub off pos-itively on the brands of that sponsor interms of willingness to purchase thosebrands. This would appear to be the casein the studies of brand attribute percep-tion change. We might speculate that wheresponsorship works, the perception of thesponsor changes in the direction of “thoseare pretty good folks, I ought to try togive them a fair chance.”
We might characterize this as Gratitudeor Appreciation. Scales such as Trust, Lik-ing, and Respect might also measure thisdimension. The perception of the sponsorhas changed in a positive way, and ashypothesized, that change in perceptionof the sponsor—although the perceptionof the brands did not change—did posi-tively change the consumer’s willingnessto buy the brands.
TRUE SPONSORSHIP AND ENGAGEMENTOne of the most encouraging signs inmarketing today is the immense shift inthinking from rote impressions-basedbrand planning, to the concept of Engage-ment. If one traces this back all the way, itwas 1953 when the best minds in theindustry, pulled together by ARF, beganwork on the ARF Model. The Model hasalways been aimed at getting past thestuck point—the fixation on vehicle im-pressions—to instead plan, optimize, buy,
and post-evaluate based on somethingcloser to ROI; specifically, some practicalsurrogate that can affordably and reliablybe measured the way media vehicle audi-ences have always been measured, and yetthat predicts ROI. Although implicit in theModel for half a century, ARF has now madethat core intent explicit. As we dig deeperinto Engagement, we invariably discoverthat it has many moving parts: the lengthof time we can get a prospect to stay witha brand’s messaging, the emotional bond-ing that all-too-rarely connects prospectsand brands, physical interaction by click-ing, and so on. Of these, perhaps the mostmeaningful is the emotional, nonrationaldimension of Engagement—surely this isone of the main implications of Gerry Zalt-man’s work in dissecting how purchase “de-cisions” are really made. What we find inthe course of studying True Sponsorship isthat, when sensitively executed, it is a re-liable way to engender emotional Engage-ment between a brand and its prospects.
CONCLUSIONIn looking at the present work in thecontext of the updated ARF Model, wewould ascribe the primary sponsorshipeffect analyzed herein as belonging withinthe Persuasion Level. It is a special case ofpersuasion where the people behind abrand become more attractive rather thanthe brand itself becoming directly moreattractive through the increased percep-tion of one or more of its valued benefits.
Don Schultz and Scott Bailey, in theirprovocative article “Customer/Brand Loy-alty in an Interactive Marketplace” (Schultzand Bailey, 2000), make profound refer-ences to Aristotle’s concept of distributivejustice, and its derivative, J. Stacy Adams’concept of inequity in social exchange. Aconsumer may change behavior basedupon a perceived inequity in a situation.One such perceived inequity situationmight be feeling grateful for a sponsor
having brought me a program, while Ihave not recently considered buying thatsponsor’s product.
These studies indicate that the spon-sorship of content can cause audiencesexposed to increase their willingness/intention to buy the sponsor’s product—not a surprising finding because that hasalways been the expectation that causesadvertisers to use sponsorship. However,the uncertainty as to this outcome hasheld sponsorship investments down to acouple of percentage points of total adver-tising expenditures. This accumulatingbody of work ought to give advertisersmore certainty as to the return on spon-sorship investments and therefore lead tomarketing allocation shifts in the direc-tion of sponsorship that reflect the higherlevels of persuasion found in this type ofmarketing communication as comparedto similar measures taken of, for example,television commercials.
The empirical proof of performance thathas always been missing in this form ofmarketing communications comes at theright time. Looking ahead, it is expectedthat television audiences will become in-creasingly able to avoid exposure to tele-vision commercials through the use ofthe digital version of VCRs started byTiVo, and today beginning to be built intocable and satellite set top boxes. In re-sponse, advertisers and their agencies havebegun to develop more entertainingcommercials, increasing use of productplacement, self-selected long-form pro-gramercials, and in this mix, sponsorshipshould also rise to compensate for thelost commercial impressions. The data wehave collected support the wisdom ofusing sponsorships more in the future asa way of merging with the programmingto avoid zapping, and at the same timeactually increase persuasion effects perdollar over current average marketingmethods.
MEASURING THE EFFECTIVENESS OF TRUE SPONSORSHIP
JOURNAL OF ADVERTISING RESEARCHDecember 2006 408
................................................................................................
BILL HARVEY has spent over 35 years leading the way
in the area of media research with special emphasis
on the New Media. In 1972, Harvey founded New
Electronic Media Science (NEMS), a marketing media
research consultancy that has served nearly 70 top
advertisers and agencies, all major MSOs, virtually all
major networks, and all major Hollywood studios in
the area of New Media. More recently, in conjunction
with IBM and Leonard Matthews, former CEO of Y&R
and of Leo Burnett, Mr. Harvey founded Next Century
Media. Next Century Media began as the leading
interactive media advisor to advertisers, advertising
agencies, entertainment and media companies world-
wide, and has now evolved into an enabler and ser-
vice provider for addressable TV commercials and TV
clickstream measurement. Through his two compa-
nies, he has been involved in every major New Elec-
tronic Media trial in the United States since 1975 and
many other trials around the world. He has brought
more advertisers and agencies into more Interactive
TV trials than everyone else in the world combined.
Mr. Harvey has authored Mind Magic, a book on self-
transformation, which has been used as a course text
at 34 universities including NYU and UCLA. A popular
speaker at media and futurist conferences around the
world, he has written, and been the subject of, numer-
ous articles in a wide range of consumer and media
trade publications.
................................................................................................
STU GRAY is an independent consultant in the field of
media research. His clients have included Arbitron,
the California Department of Justice, the Center on
Alcohol Marketing and Youth, Cplus3 TV, Knowledge
Networks Statistical Research, Lifetime Television,
NPD, OMD, Studio One Networks, TV Guide, and Ziff
Davis. Mr. Gray was previously senior vice president,
director of media resources of BBDO New York. He
joined BBDO in 1988 as vice president, director of
media research and was elected a senior vice presi-
dent in 1991. He has also served as vice president of
research for Showtime, RCA Selectavision, and NBC
Television, and as director of media research for Wells
Rich Greene. Mr. Gray is a graduate of the Baruch
School in New York. He has served on the faculty of
New York University, The New School, and Brooklyn
College Graduate School of Radio/TV. He has also
served on the Editorial Advisory Board of the ARF’s
Journal of Advertising Research.
................................................................................................
GERALD DESPAIN has a background in mathematical
optimization combined with advanced database tech-
nology while working for Honeywell and Groupe Bull
computer companies. Over the last decade he has
applied these concepts while working in advertising
domains to create audience measurement reports,
advertising effectiveness studies, and schedule opti-
mization tools.
ACKNOWLEDGMENTS
American Demographics Magazine, a Crain Ad-
vertising Age publication, is the exclusive pub-
lishing partner of SEI Inc. with special focus on
delivering insight into the study’s findings.
The SEI findings in this article are presented by
kind permission of American Demographics
Magazine.
A prior version of this report was originally
presented to the Advertising Research Founda-
tion (ARF) in October 2000 and published in
the ARF Journal of Advertising Research in No-
vember 2002. This updated version includes
additional findings developed through July 22,
2006.
REFERENCES
Beckwith, Neil E., and Donald R. Lehmann.
“The Importance of Halo Effects in Multi-
Attribute Attitude Models.” Journal of Market-
ing Research 12, 3 (1975): 265–75.
Ephron, Erwin, and Gerry Pollak.
“Finding the Other Half.” Presented at ARF/
ESOMAR Conference, June 2003: [URL: www.
ephrononmedia.com].
Johnson, Peter A. Direct Marketing Association
2005 Economic Impact Study. New York: Direct
Marketing Association, 2005.
Schultz, Don E., and Scott Bailey. “Cus-
tomer/Brand Loyalty in an Interactive Market-
place.” Journal of Advertising Research 40, 3 (2000):
41–52.
Young, Charles E. A Short History of Television
Copytesting. Albuquerque, NM: Ameritest, 2001.
MEASURING THE EFFECTIVENESS OF TRUE SPONSORSHIP
December 2006JOURNAL OF ADVERTISING RESEARCH409