Embed Size (px)
Citation preview
Japan’s Kumamoto Prefecture Flood of 12-14 July 2012-Draft
By
Charles Ross
And
Richard H. Grumm
National Weather Service Office, State College PA 16803
1. Overview
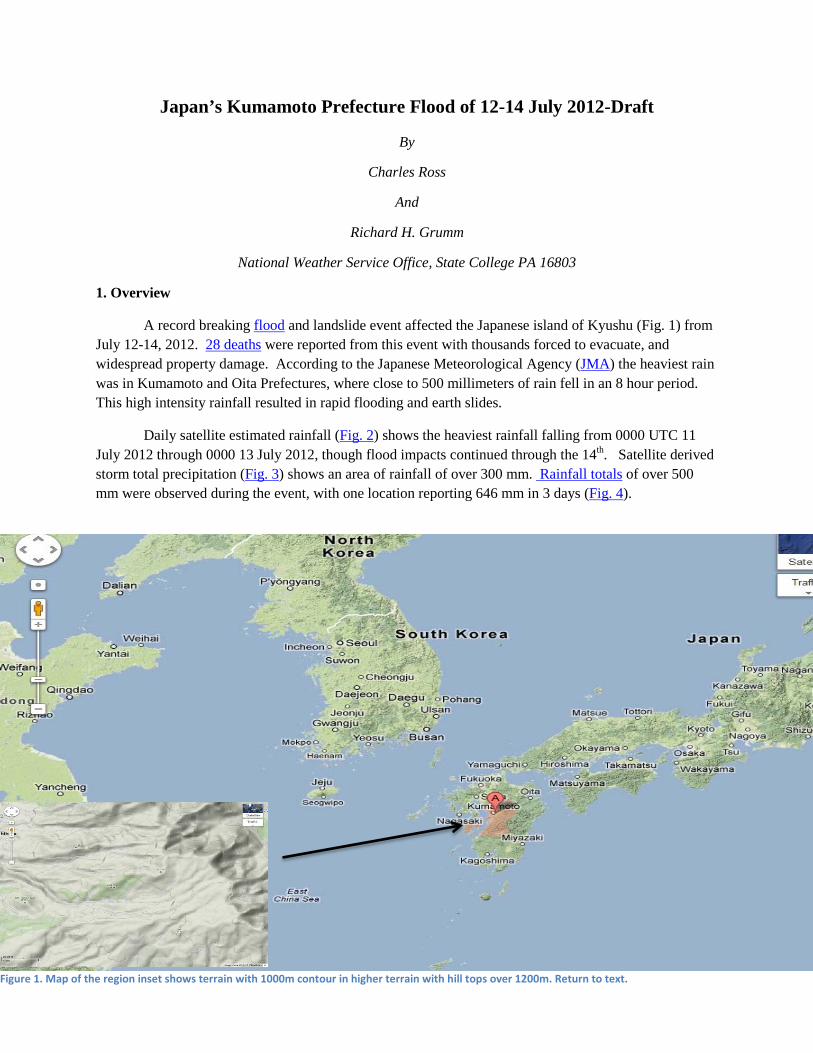
A record breaking flood and landslide event affected the Japanese island of Kyushu (Fig. 1) from July 12-14, 2012. 28 deaths were reported from this event with thousands forced to evacuate, and widespread property damage. According to the Japanese Meteorological Agency (JMA) the heaviest rain was in Kumamoto and Oita Prefectures, where close to 500 millimeters of rain fell in an 8 hour period. This high intensity rainfall resulted in rapid flooding and earth slides.
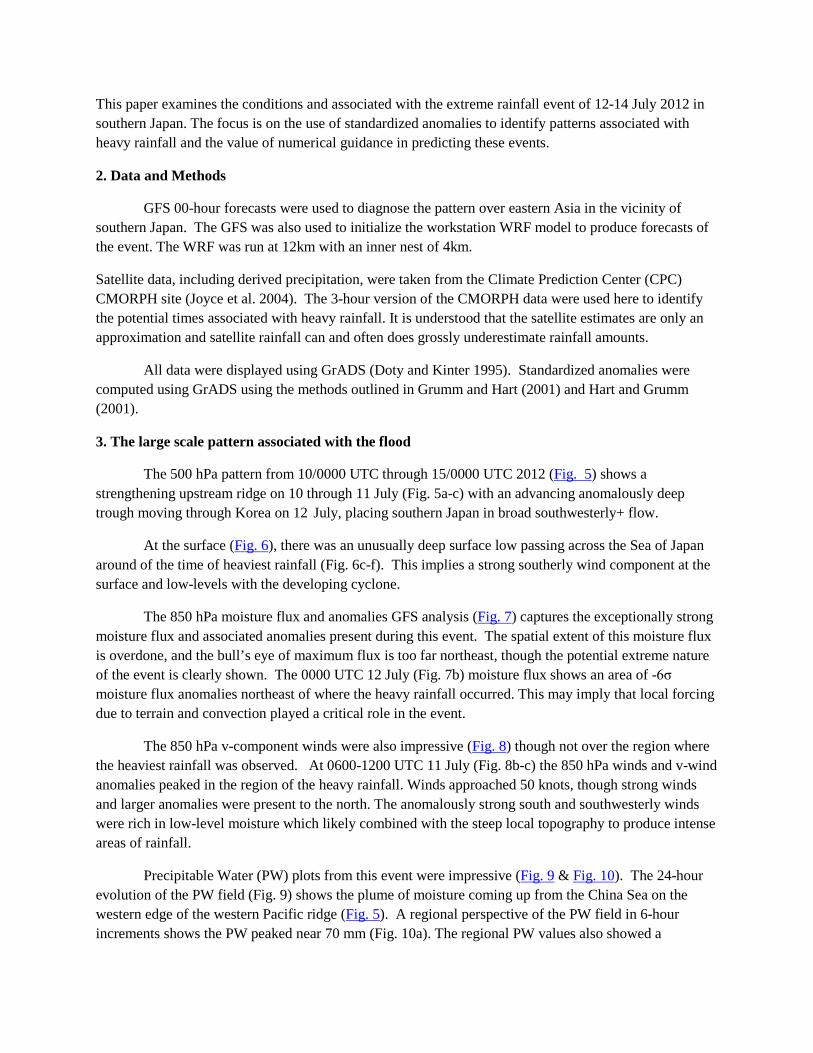
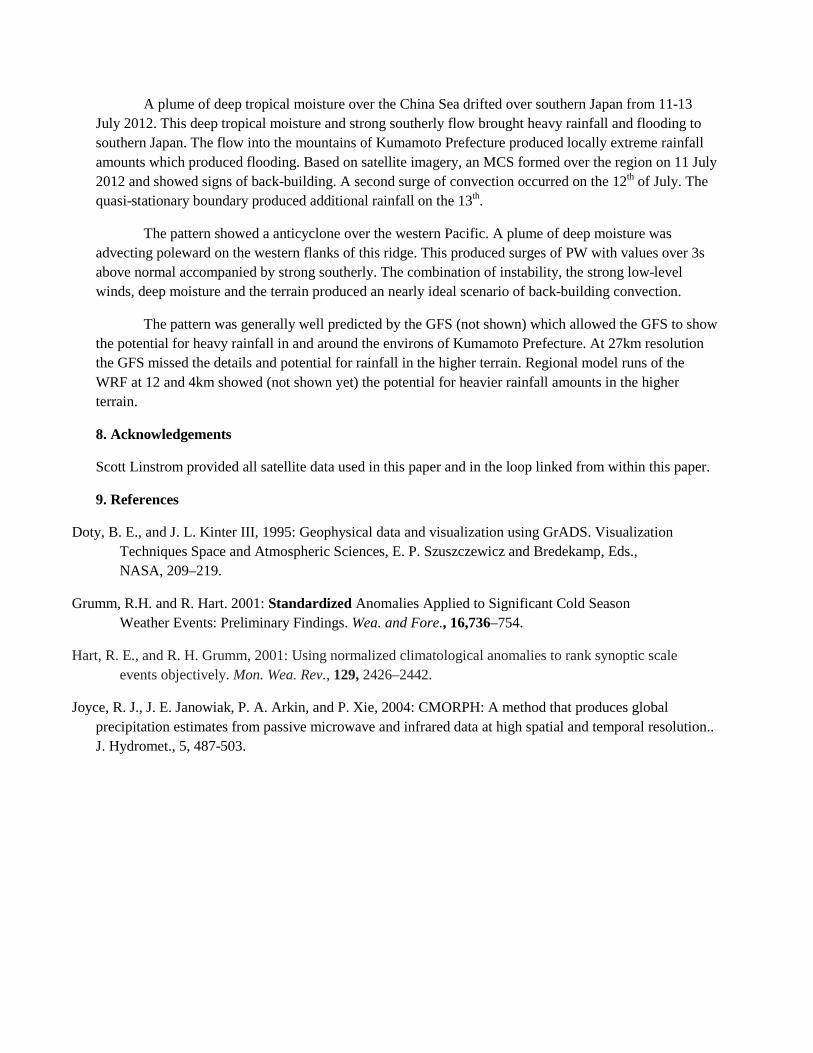
Daily satellite estimated rainfall (Fig. 2) shows the heaviest rainfall falling from 0000 UTC 11 July 2012 through 0000 13 July 2012, though flood impacts continued through the 14th. Satellite derived storm total precipitation (Fig. 3) shows an area of rainfall of over 300 mm. Rainfall totals of over 500 mm were observed during the event, with one location reporting 646 mm in 3 days (Fig. 4).
Figure 1. Map of the region inset shows terrain with 1000m contour in higher terrain with hill tops over 1200m. Return to text.
This paper examines the conditions and associated with the extreme rainfall event of 12-14 July 2012 in southern Japan. The focus is on the use of standardized anomalies to identify patterns associated with heavy rainfall and the value of numerical guidance in predicting these events.
2. Data and Methods
GFS 00-hour forecasts were used to diagnose the pattern over eastern Asia in the vicinity of southern Japan. The GFS was also used to initialize the workstation WRF model to produce forecasts of the event. The WRF was run at 12km with an inner nest of 4km.
Satellite data, including derived precipitation, were taken from the Climate Prediction Center (CPC) CMORPH site (Joyce et al. 2004). The 3-hour version of the CMORPH data were used here to identify the potential times associated with heavy rainfall. It is understood that the satellite estimates are only an approximation and satellite rainfall can and often does grossly underestimate rainfall amounts.
All data were displayed using GrADS (Doty and Kinter 1995). Standardized anomalies were computed using GrADS using the methods outlined in Grumm and Hart (2001) and Hart and Grumm (2001).
3. The large scale pattern associated with the flood
The 500 hPa pattern from 10/0000 UTC through 15/0000 UTC 2012 (Fig. 5) shows a strengthening upstream ridge on 10 through 11 July (Fig. 5a-c) with an advancing anomalously deep trough moving through Korea on 12 July, placing southern Japan in broad southwesterly+ flow.
At the surface (Fig. 6), there was an unusually deep surface low passing across the Sea of Japan around of the time of heaviest rainfall (Fig. 6c-f). This implies a strong southerly wind component at the surface and low-levels with the developing cyclone.
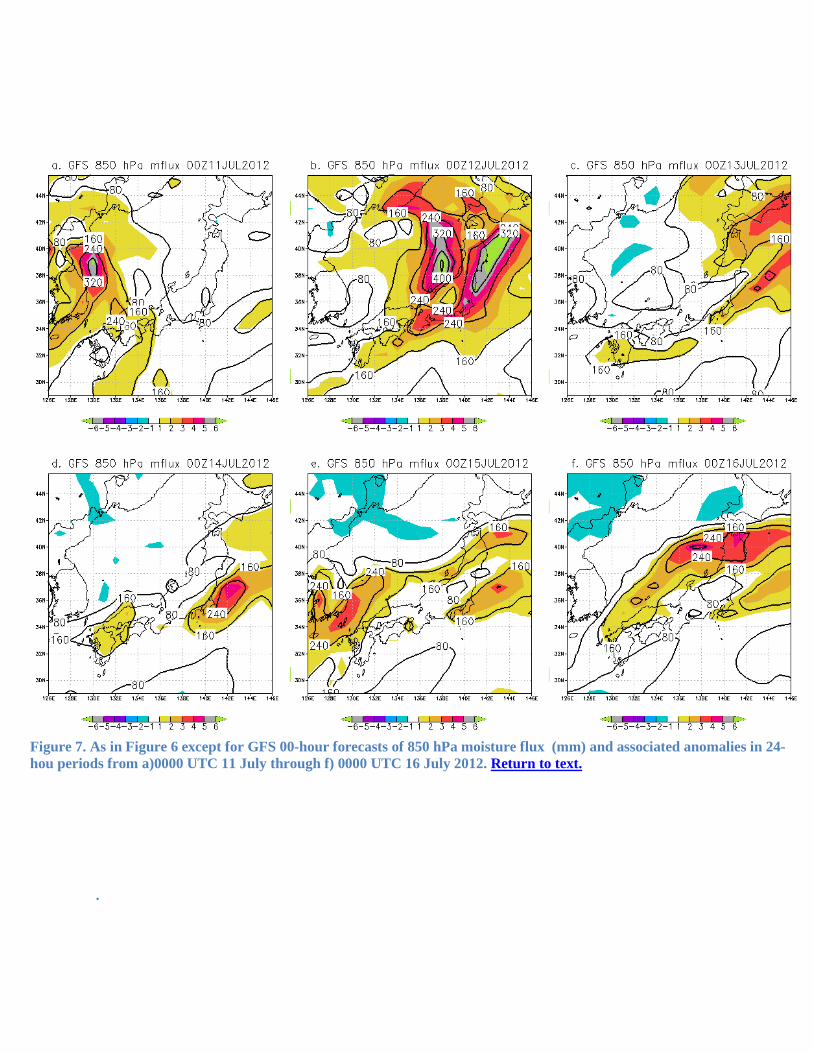
The 850 hPa moisture flux and anomalies GFS analysis (Fig. 7) captures the exceptionally strong moisture flux and associated anomalies present during this event. The spatial extent of this moisture flux is overdone, and the bull’s eye of maximum flux is too far northeast, though the potential extreme nature of the event is clearly shown. The 0000 UTC 12 July (Fig. 7b) moisture flux shows an area of -6σ moisture flux anomalies northeast of where the heavy rainfall occurred. This may imply that local forcing due to terrain and convection played a critical role in the event.
The 850 hPa v-component winds were also impressive (Fig. 8) though not over the region where the heaviest rainfall was observed. At 0600-1200 UTC 11 July (Fig. 8b-c) the 850 hPa winds and v-wind anomalies peaked in the region of the heavy rainfall. Winds approached 50 knots, though strong winds and larger anomalies were present to the north. The anomalously strong south and southwesterly winds were rich in low-level moisture which likely combined with the steep local topography to produce intense areas of rainfall.
Precipitable Water (PW) plots from this event were impressive (Fig. 9 & Fig. 10). The 24-hour evolution of the PW field (Fig. 9) shows the plume of moisture coming up from the China Sea on the western edge of the western Pacific ridge (Fig. 5). A regional perspective of the PW field in 6-hour increments shows the PW peaked near 70 mm (Fig. 10a). The regional PW values also showed a
downstream depletion effect (Figs. 10b-c) implying the terrain over Kumamoto Prefecture impacted the PW fields. Locally, the PW values were in the 60 to 70 mm range, peaking at 1200 UTC 11 July 2012 (Fig. 10a) over the region where the heavy rain was observed and the PW anomalies were on the order of 2-3σ above normal at the 0000 UTC time periods (Fig. 9).
The strong 850 hPa moisture flux (Fig. 7b) observed at 0000 UTC July 12 lines up with a strong nose of high precipitable water surging northeast out of the South China Sea (Fig. 9b). This is obviously resulting from an intense episode of the seasonal East Asia Monsoon. Focusing on the area of concern (Fig. 10) a large area of greater than 60mm PW stretched across the Kumamoto Prefecture from 1200 UTC July 11 through 1200 UTC July 12 (Fig 10a-e). An increasingly tight gradient is also evident in the analysis.
The surface pressure (Fig. 11) fields suggest a quasi-soutwest to northeast boundary form China across Korea and into Japan. A deep cyclone was present over Korea at 0000 UTC 11 July (Fig. 11b) and over the Sea of Japan by 0000 UTC 12 July 2012. This implied some enhanced low-level southweasterly flow over southern Japan during this 24 hour peroid on the warm side of the boundary. This surface
Figure 2. Daily Satellite Estimated Rainfall (mm). Return to text.
boundary is a key component in the East Asian Monsoon over Japan (reference http://en.wikipedia.org/wiki/East_Asian_Monsoon). This boundary, the anomalously strong southwesterly flow, and deep likely played a critical role in the rainfall. Additional factors likely included the terrain relative to the flow and the upper-level trough to the west which likely contributed to convective instability.
5. Satellite
MTSAT geostationary imagery was available and made into a loop to evaluate the evolution of this event. MTSAT imagery at 10/2314 UTC showed the boundary to the east of Japan (Fig. 12a) with enhanced clouds and moisture near the mouth of the Yellow Sea and enhanced cold cloud tops to the south. By 11/1301 UTC (Fig. 12b) the boundary had moved eastward and the first enhanced convective elements were present along the West Coast of Kumamoto Prefecture. This area of convection developed into an MCS and slowly moved over the Prefecture between 1300 and 1600 UTC (Fig. 13a).
The initial MCS had enhanced clouds over Kumamoto Prefecture from 11/1400 through about 11/2300 UTC when this system began moving to the east and the cloud tops began to rapidly weaken. Figure 13 shows the MCS near its peak to include back-building on its western flanks.
A new area of enhanced cold clouds and convection developed on the West Coast of Kumamoto Prefecture around 12/0101 UTC (Fig. 14). The northernmost regions of Kumamoto Prefecture were unaffected by this second surge of convection. This convection never developed as large a cold cloud top shield and it moved rapidly to the southeast. Thus, it added to the rainfall totals but was not as persistent and by 12/0700 UTC all the enhanced clouds and attendant convection was south and east of the Prefecture. Despite this, the quasi-stationary boundary remained over of the Prefecture on the 13th with scattered convective cells developing on the 13th as shown in Fig. 14 (13/2101). This evolution of the enhanced clouds on the satellite aligns well with CMORPH rainfall estimates from 11 to 15 July 2012 (Fig. 2). The heaviest rainfall was estimated on the 11th, with additional rain on the 12th and the 13th. Similar to the 13/2101 UTC the rainfall on the 13th was over the northern reaches of the Prefecture.
6. Quantitative Precipitation Forecasts
The large scale flow about the large ridge was relatively well predicted to include the deep southerly flow and the plume of high PW air (Fig. 9). This allowed the NCEP GFS to produced relatively heavy rainfall over the Prefecture in the 12, 24 and 48 hour periods ending at 12/0000, 12/1200 and 13/1200 UTC (Figs. 15-17). The 12-hour forecasts (Fig. 15) showed around 50 mm in most forecasts along the West Coast and offshore. The 10/0000 UTC GFS had higher QPF values (Fig. 15c) with over 100 mm along the West Coast.
With the exception of the 08/0000 UTC GFS, the 24 hour QPFs (Fig. 16) showed over 100mm focused on the West Coast of the prefecture. They also showed heavy rainfall potential farther north. The 48 hour QPFs (Fig. 17) all showed at least 150mm of QPF, mainly along the West Coast of the Prefecture though again the 10/0000 UTC GFS was a bit wetter and more robust with the QPF showing a 200 mm contour over much of the West Coast of the Prefecture.
7. Summary
A plume of deep tropical moisture over the China Sea drifted over southern Japan from 11-13 July 2012. This deep tropical moisture and strong southerly flow brought heavy rainfall and flooding to southern Japan. The flow into the mountains of Kumamoto Prefecture produced locally extreme rainfall amounts which produced flooding. Based on satellite imagery, an MCS formed over the region on 11 July 2012 and showed signs of back-building. A second surge of convection occurred on the 12th of July. The quasi-stationary boundary produced additional rainfall on the 13th.
The pattern showed a anticyclone over the western Pacific. A plume of deep moisture was advecting poleward on the western flanks of this ridge. This produced surges of PW with values over 3s above normal accompanied by strong southerly. The combination of instability, the strong low-level winds, deep moisture and the terrain produced an nearly ideal scenario of back-building convection.
The pattern was generally well predicted by the GFS (not shown) which allowed the GFS to show the potential for heavy rainfall in and around the environs of Kumamoto Prefecture. At 27km resolution the GFS missed the details and potential for rainfall in the higher terrain. Regional model runs of the WRF at 12 and 4km showed (not shown yet) the potential for heavier rainfall amounts in the higher terrain.
8. Acknowledgements
Scott Linstrom provided all satellite data used in this paper and in the loop linked from within this paper.
9. References
Doty, B. E., and J. L. Kinter III, 1995: Geophysical data and visualization using GrADS. Visualization Techniques Space and Atmospheric Sciences, E. P. Szuszczewicz and Bredekamp, Eds., NASA, 209–219.
Grumm, R.H. and R. Hart. 2001: Standardized Anomalies Applied to Significant Cold Season Weather Events: Preliminary Findings. Wea. and Fore., 16,736–754.
Hart, R. E., and R. H. Grumm, 2001: Using normalized climatological anomalies to rank synoptic scale events objectively. Mon. Wea. Rev., 129, 2426–2442.
Joyce, R. J., J. E. Janowiak, P. A. Arkin, and P. Xie, 2004: CMORPH: A method that produces global precipitation estimates from passive microwave and infrared data at high spatial and temporal resolution.. J. Hydromet., 5, 487-503.

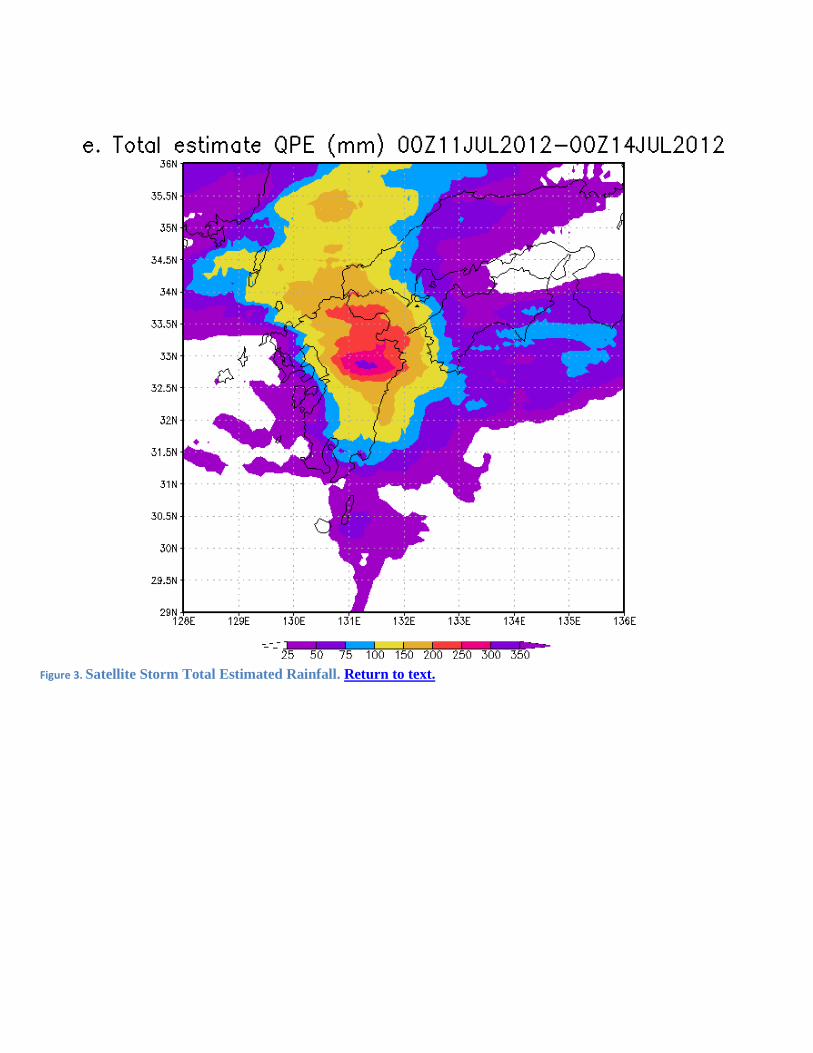
Figure 3. Satellite Storm Total Estimated Rainfall. Return to text.
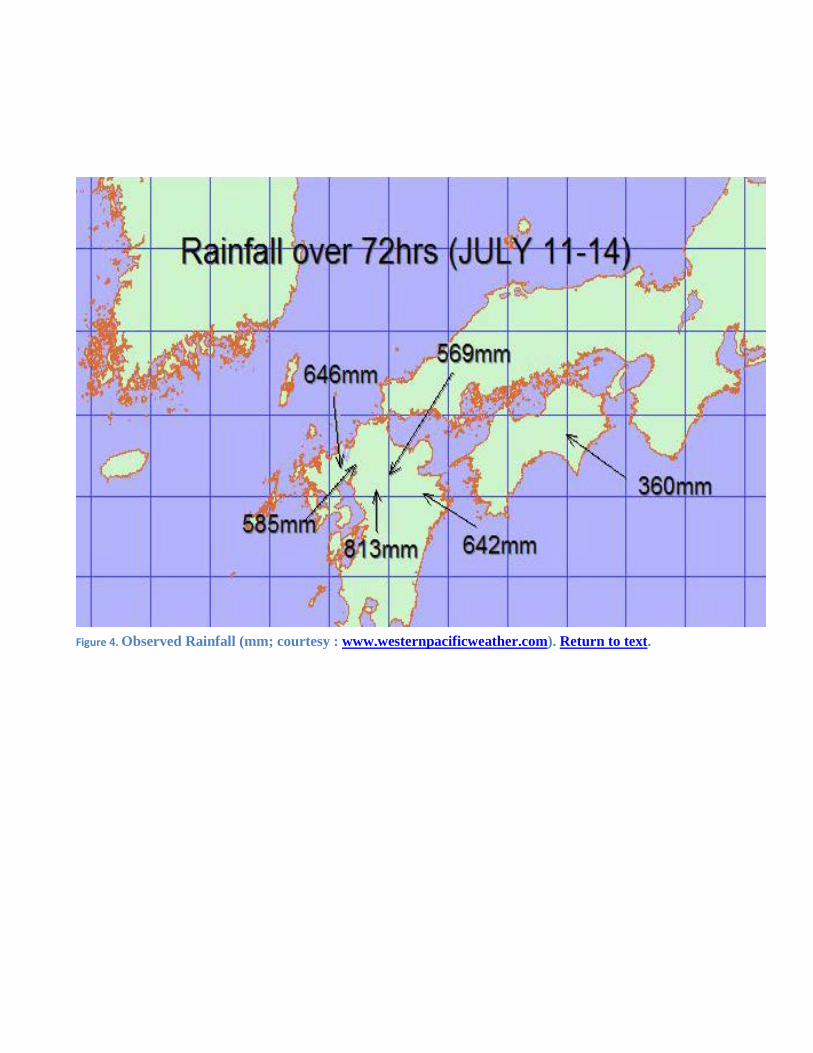
Figure 4. Observed Rainfall (mm; courtesy : www.westernpacificweather.com). Return to text.
Figure 5. NCEOP GFS 00-hour forecasts of 500 hPa heights (m) and 500 hPa height anomalies in 24-hour periods from a) 0000 UTC 10 July through f) 0000 UTC 15 July 2012. Return to text.
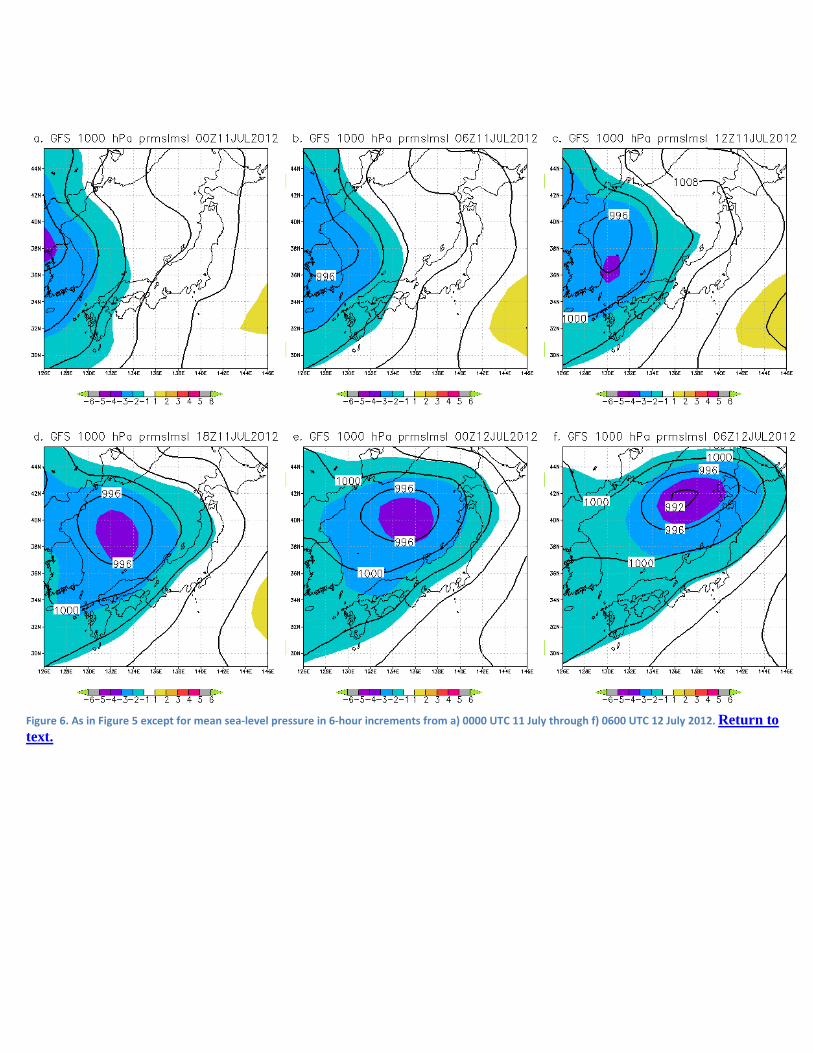
Figure 6. As in Figure 5 except for mean sea-level pressure in 6-hour increments from a) 0000 UTC 11 July through f) 0600 UTC 12 July 2012. Return to text.
.
Figure 7. NCEP GFS 00-hour forecasts of Mean Sea-Level Pressure (mb) and associated anomalies in 6-hour periods from a) 0000 UTC 11 July through f) 0600 UTC 12 July 2012.
Figure 7. As in Figure 6 except for GFS 00-hour forecasts of 850 hPa moisture flux (mm) and associated anomalies in 24-hou periods from a)0000 UTC 11 July through f) 0000 UTC 16 July 2012. Return to text.
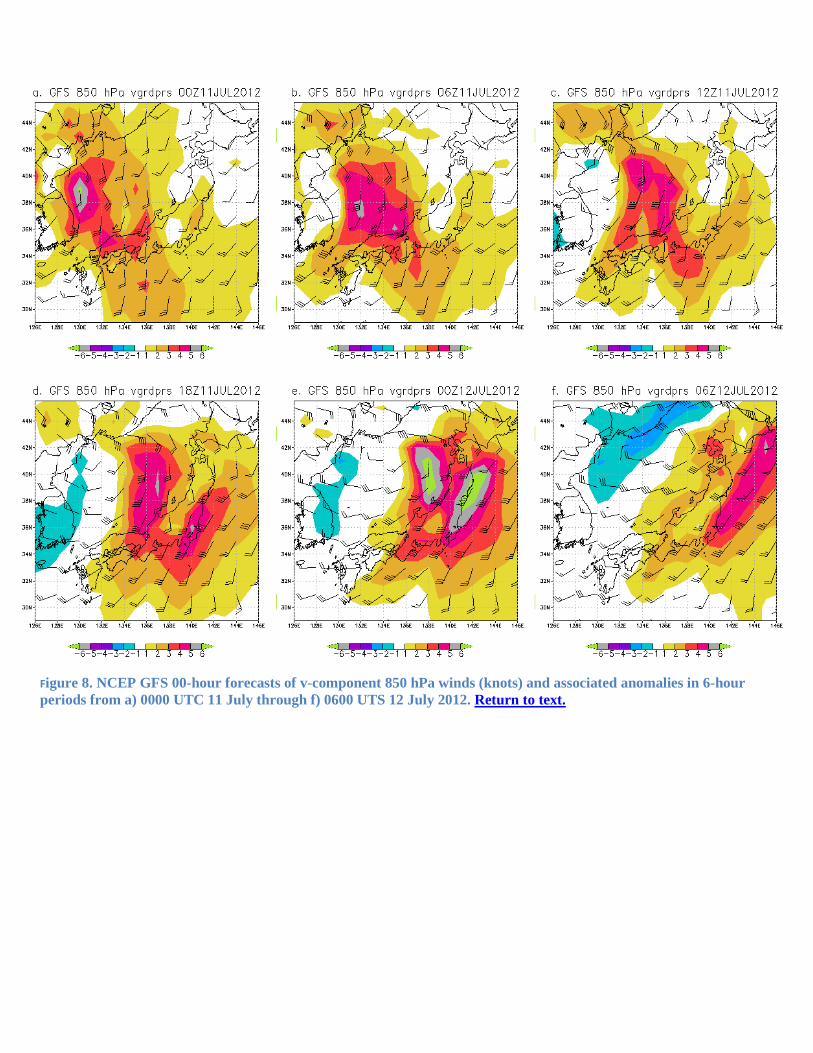
Figure 8. NCEP GFS 00-hour forecasts of v-component 850 hPa winds (knots) and associated anomalies in 6-hour periods from a) 0000 UTC 11 July through f) 0600 UTS 12 July 2012. Return to text.
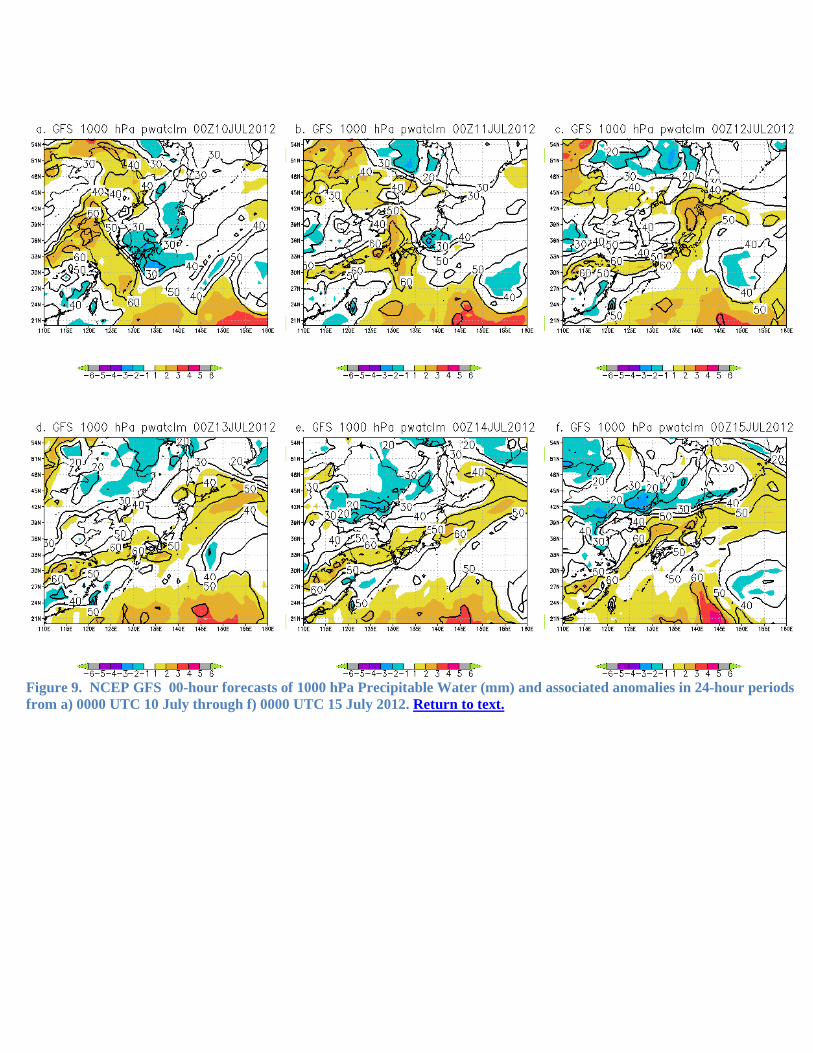
Figure 9. NCEP GFS 00-hour forecasts of 1000 hPa Precipitable Water (mm) and associated anomalies in 24-hour periods from a) 0000 UTC 10 July through f) 0000 UTC 15 July 2012. Return to text.
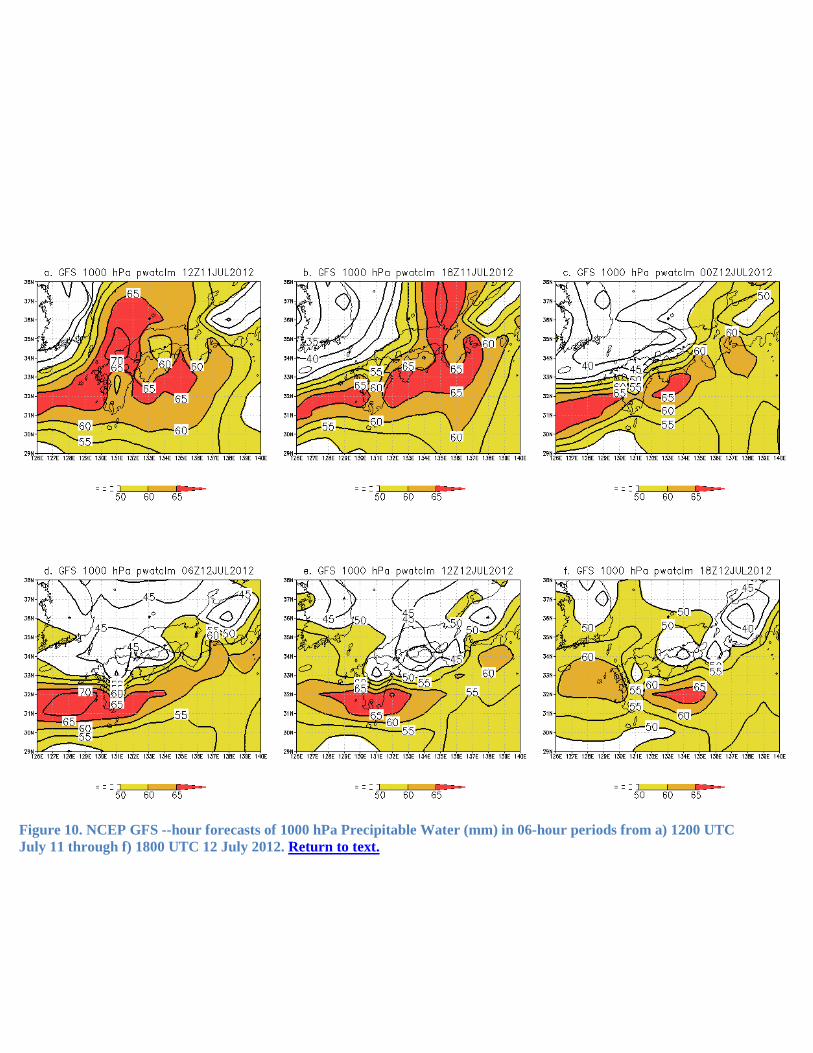
Figure 10. NCEP GFS --hour forecasts of 1000 hPa Precipitable Water (mm) in 06-hour periods from a) 1200 UTC July 11 through f) 1800 UTC 12 July 2012. Return to text.
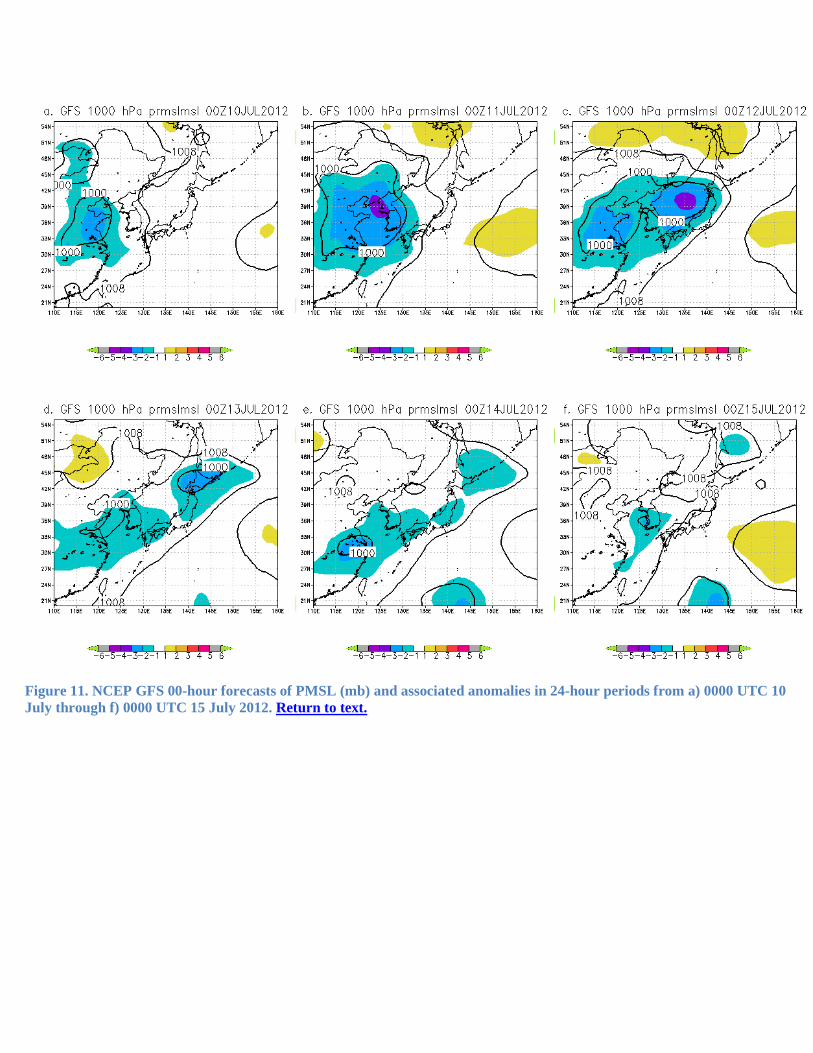
Figure 11. NCEP GFS 00-hour forecasts of PMSL (mb) and associated anomalies in 24-hour periods from a) 0000 UTC 10 July through f) 0000 UTC 15 July 2012. Return to text.
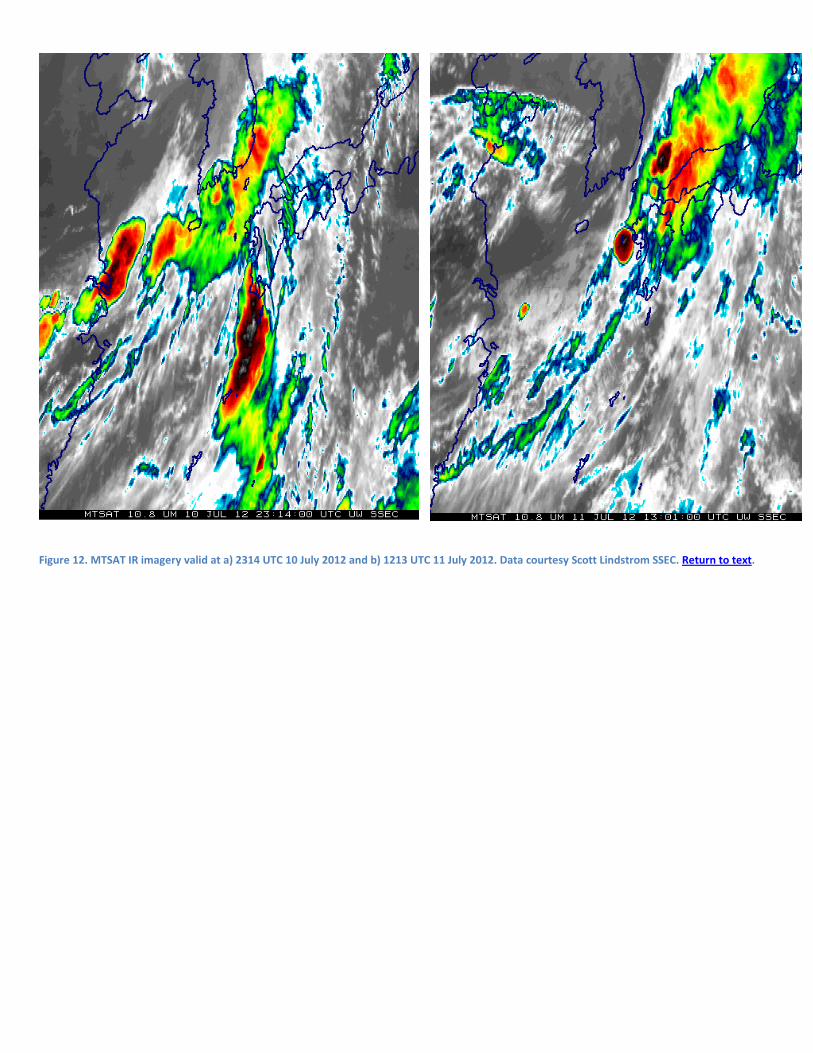
Figure 12. MTSAT IR imagery valid at a) 2314 UTC 10 July 2012 and b) 1213 UTC 11 July 2012. Data courtesy Scott Lindstrom SSEC. Return to text.
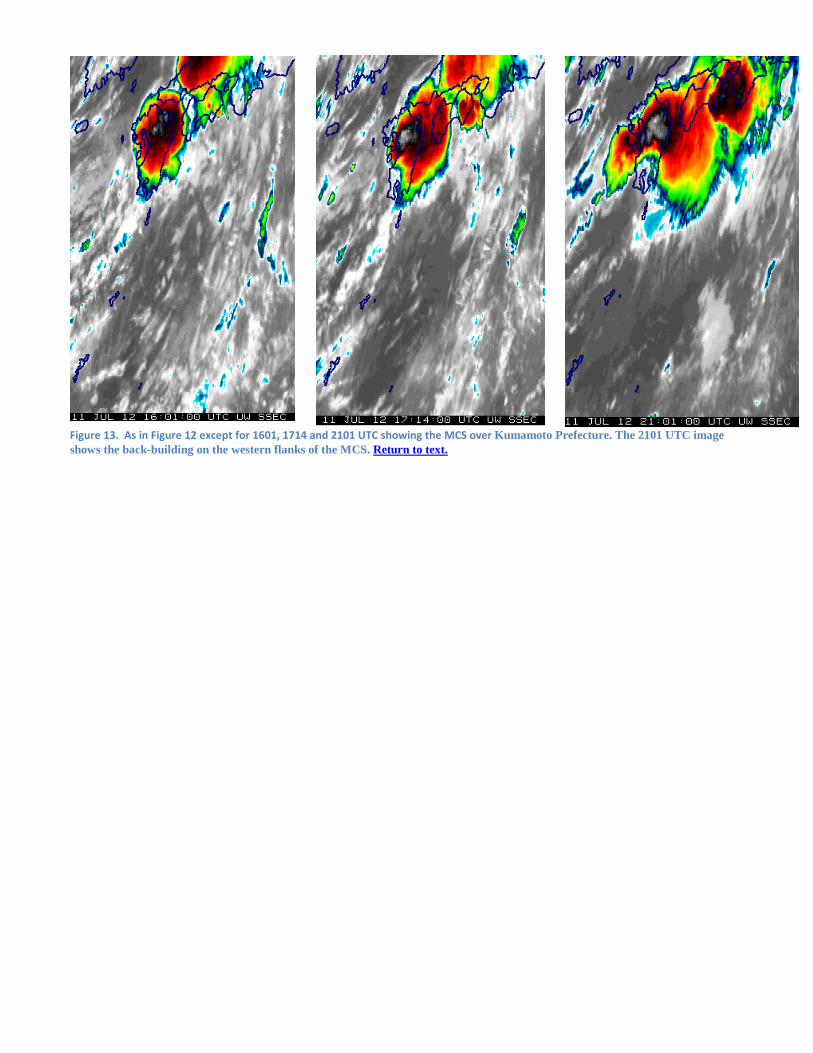
Figure 13. As in Figure 12 except for 1601, 1714 and 2101 UTC showing the MCS over Kumamoto Prefecture. The 2101 UTC image shows the back-building on the western flanks of the MCS. Return to text.
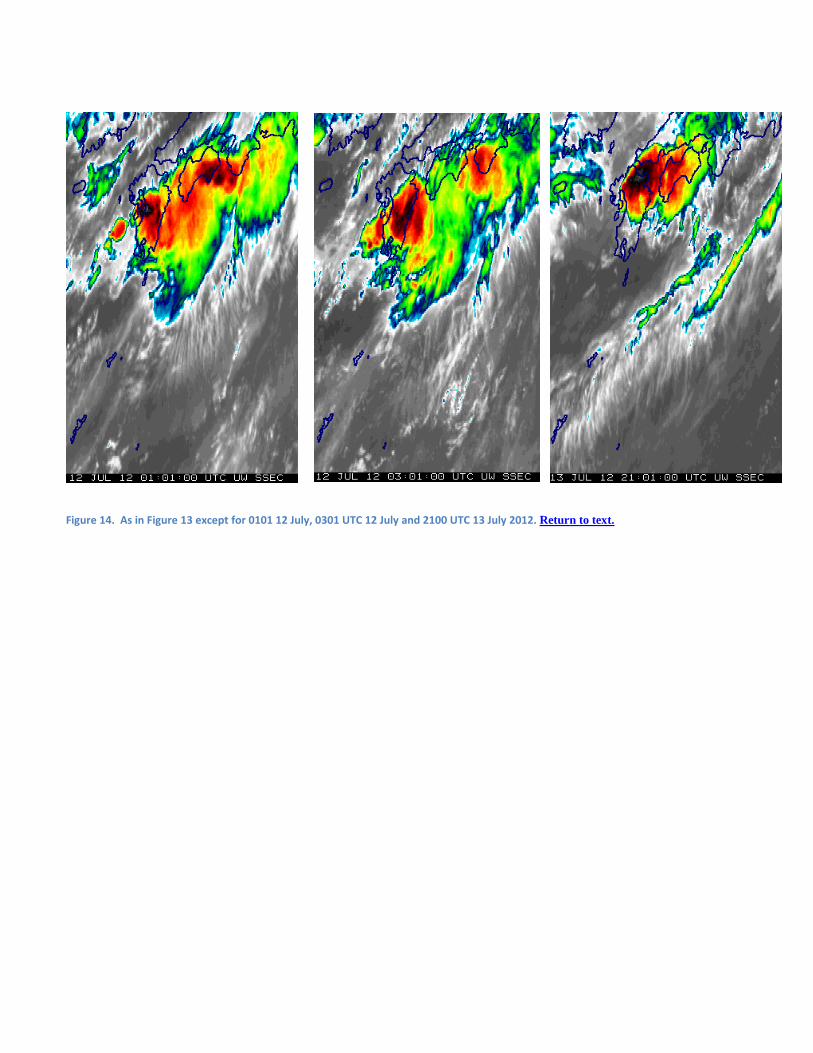
Figure 14. As in Figure 13 except for 0101 12 July, 0301 UTC 12 July and 2100 UTC 13 July 2012. Return to text.
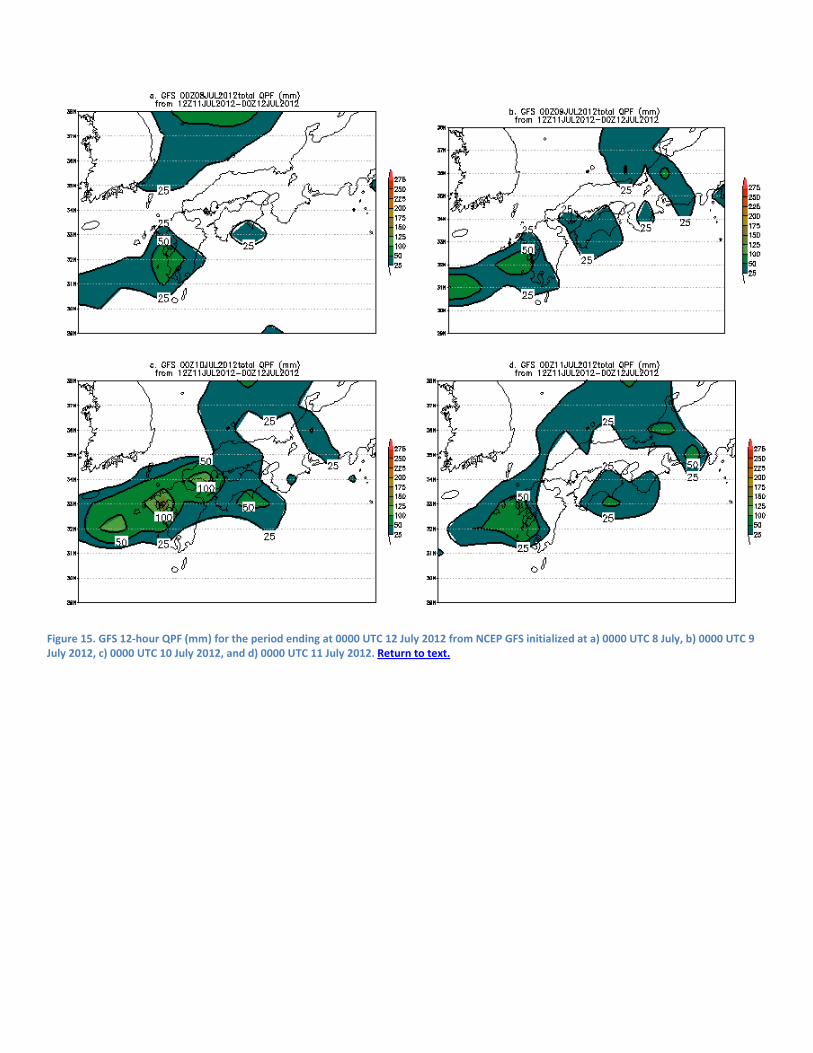
Figure 15. GFS 12-hour QPF (mm) for the period ending at 0000 UTC 12 July 2012 from NCEP GFS initialized at a) 0000 UTC 8 July, b) 0000 UTC 9 July 2012, c) 0000 UTC 10 July 2012, and d) 0000 UTC 11 July 2012. Return to text.
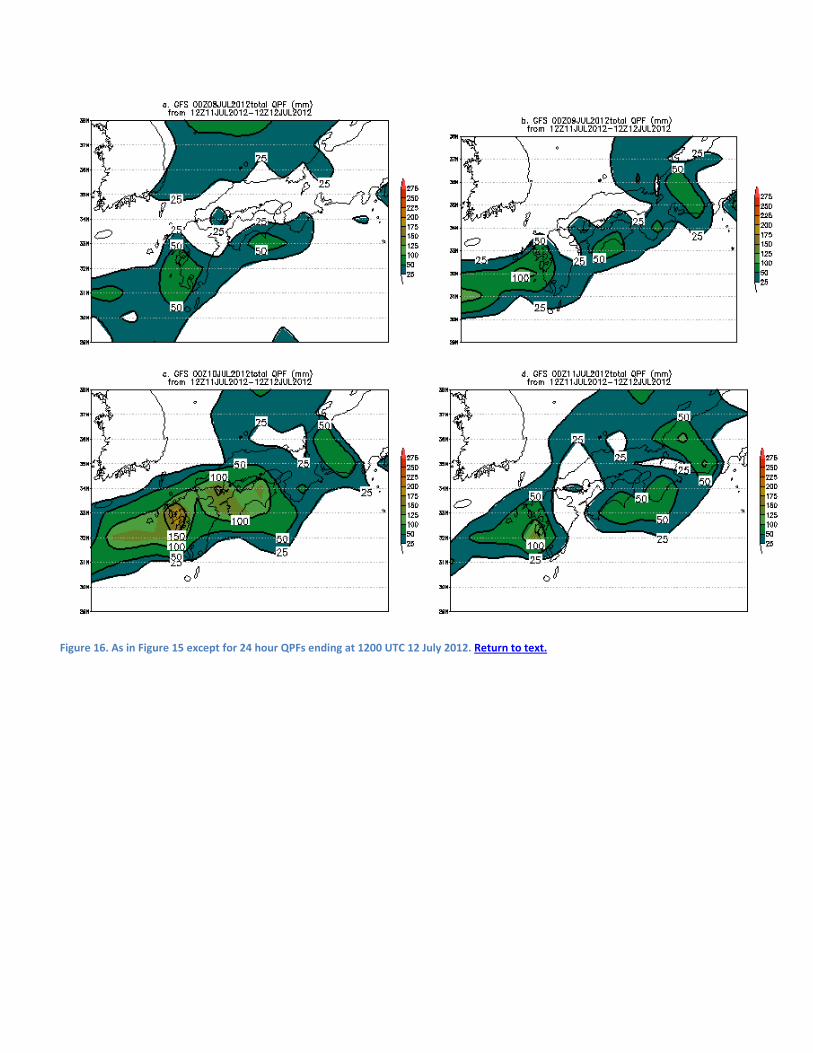
Figure 16. As in Figure 15 except for 24 hour QPFs ending at 1200 UTC 12 July 2012. Return to text.
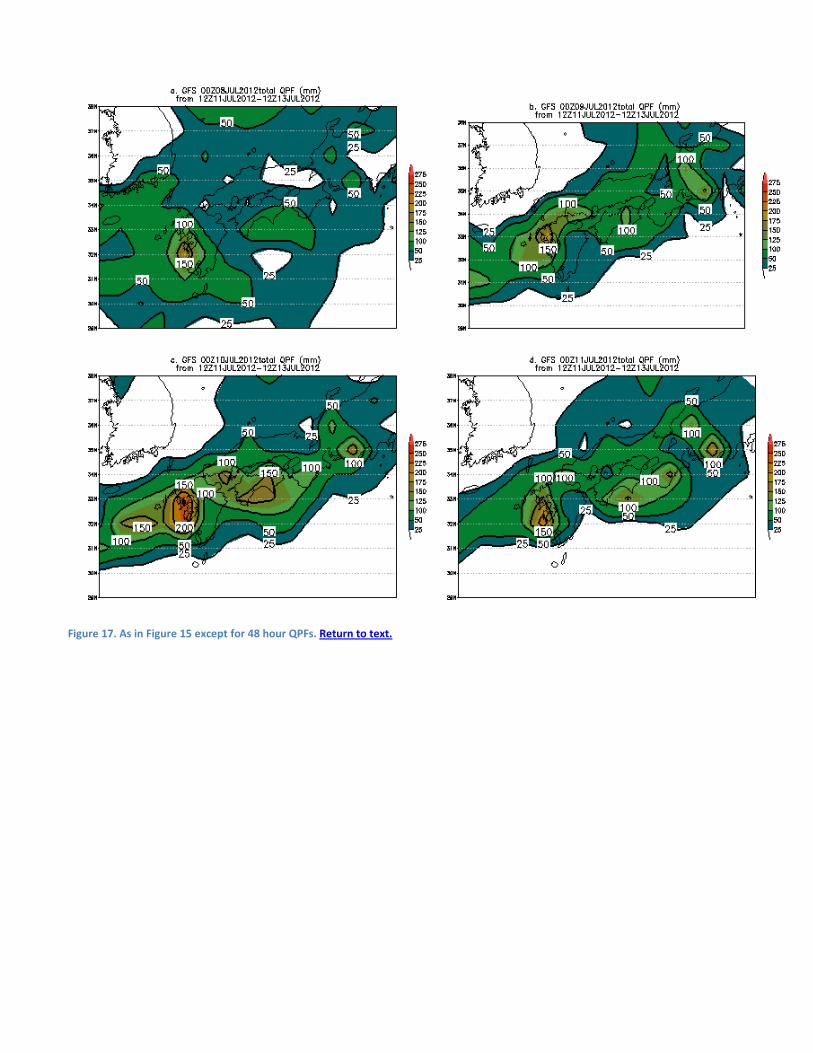
Figure 17. As in Figure 15 except for 48 hour QPFs. Return to text.


![arXiv:1905.07458v4 [cs.CL] 27 Aug 2019extract as entities the spans “Mrs. Tsuruyama”, “Yatsushiro”, “Kumamoto Prefecture”, and “Japan” where “Mrs. Tsuruyama” is](https://img.pdfslide.us/doc/110x75/5ff70cc1511ed849e0241d34/arxiv190507458v4-cscl-27-aug-2019-extract-as-entities-the-spans-aoemrs-tsuruyamaa.jpg)