Embed Size (px)
Citation preview
JAPAN RETAIL FUND
8953February 2015 (26th)
Period Results
US ADR(OTC): JNRFY
Security Code 8953http://www.jrf‐reit.com/english/

1
JAPAN RETAIL FUND
1. Portfolio Management
2. Implementation of Growth Strategy
3. Portfolio Evolution
4. Financial Results and Forecasts
5. Sustainability Management
Contents
P. 2
P. 5
P. 17
P. 20
P. 25
JAPAN RETAIL FUND
2
1. Portfolio Management
2. Implementation of Growth Strategy
3. Portfolio Evolution
4. Financial Results and Forecasts
5. Sustainability Managementmozo wonder city
Flexible Financing Capability
1. Portfolio Management
JRF Portfolio Management
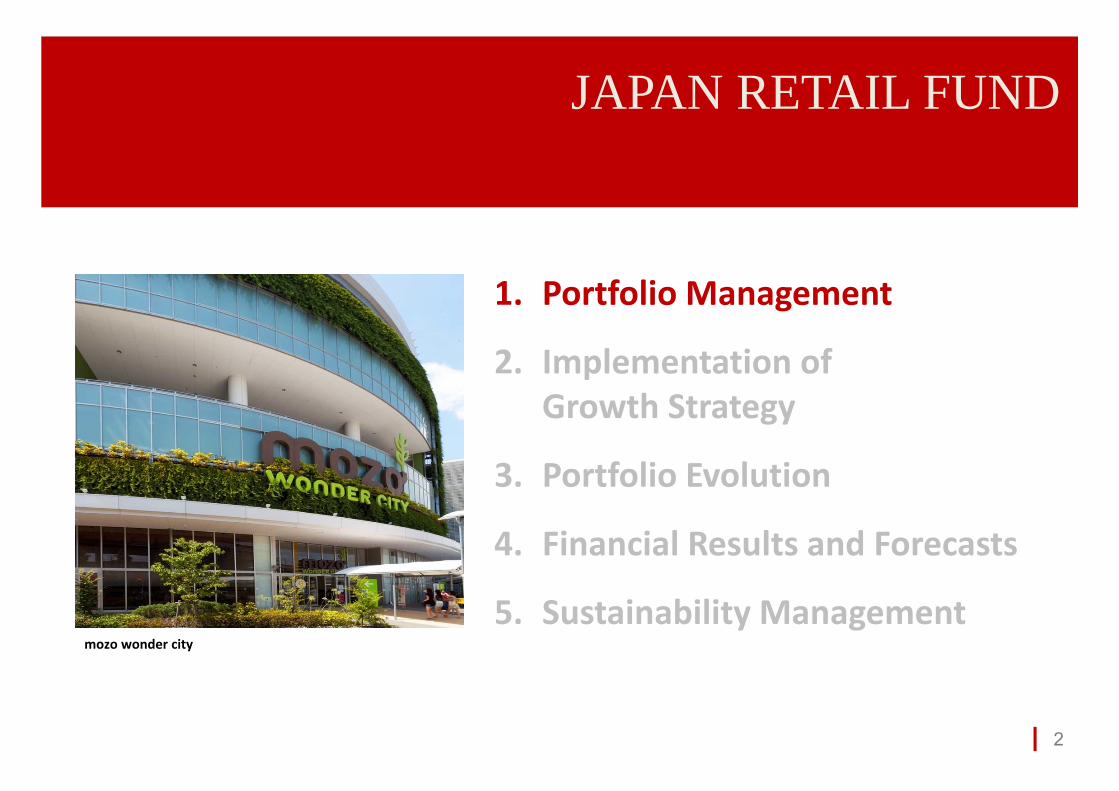
Drive active portfolio management by combining our strength
JRF featureCapability
of AM company
Financial Base
High credit rating AA‐
Asset Size
C. 850.0 billion JPY
SC Management Capability
Strong Property Sourcing
Capability
Unrealized Profits
C. 50.0 billion JPY
1. Asset size expansion2. Property replacement3. Existing property's value improvement
Measures for further growth
Control of risks Leasing downtime resulting from
renewal projects Lawsuit on rent reduction Change in retail environment ...etc
We aim to re‐allocate our portfolio that adapts to a changing environment surrounding retail properties in order to achieve improvement in profitability and stability while persistently growing distributions
JRF portfolio management
Combination of Strength
Strong Driving Forcefor portfolio management
Basic Policy
3
1. Portfolio Management
A Case of Portfolio Management
4
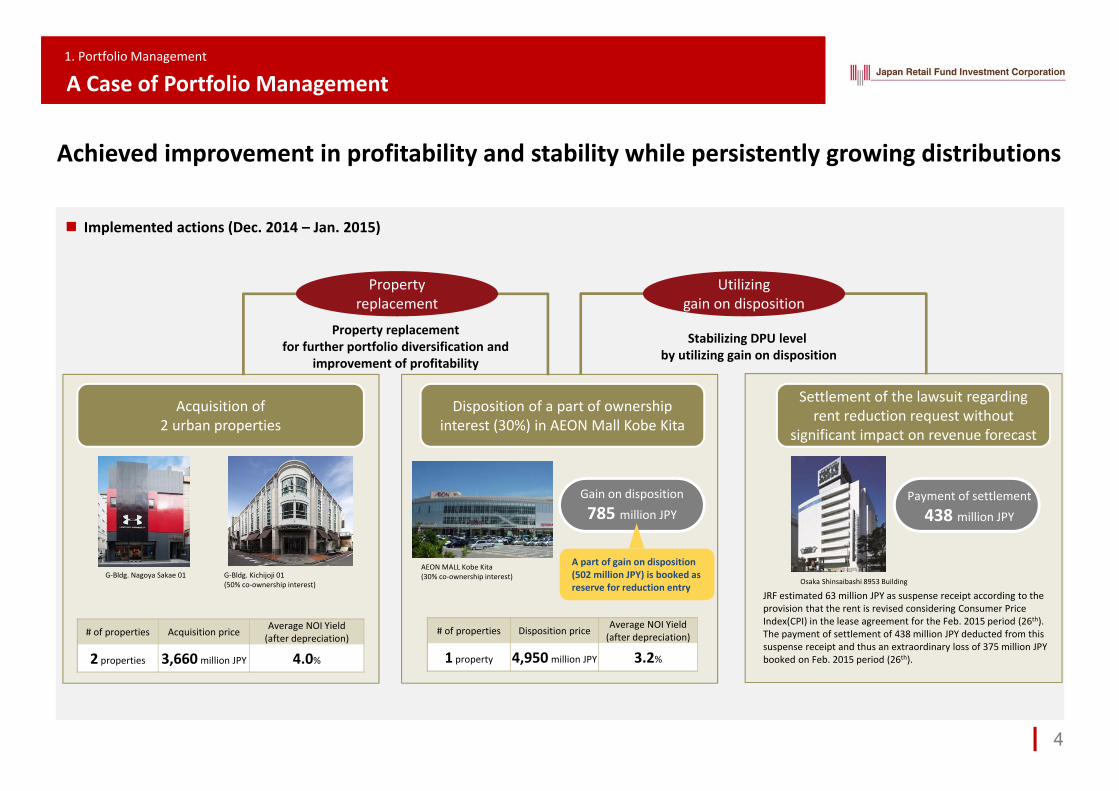
Disposition of a part of ownership interest (30%) in AEON Mall Kobe Kita
Acquisition of 2 urban properties
Settlement of the lawsuit regarding rent reduction request without
significant impact on revenue forecast
Gain on disposition
785 million JPY
AEON MALL Kobe Kita(30% co‐ownership interest)G‐Bldg. Kichijoji 01
(50% co‐ownership interest)G‐Bldg. Nagoya Sakae 01
Property replacement
# of properties Disposition price Average NOI Yield(after depreciation)
1 property 4,950 million JPY 3.2%
# of properties Acquisition price Average NOI Yield(after depreciation)
2 properties 3,660 million JPY 4.0%
Payment of settlement
438 million JPY
Utilizinggain on disposition
Osaka Shinsaibashi 8953 Building
Property replacement for further portfolio diversification and
improvement of profitability
Stabilizing DPU level by utilizing gain on disposition
JRF estimated 63 million JPY as suspense receipt according to the provision that the rent is revised considering Consumer Price Index(CPI) in the lease agreement for the Feb. 2015 period (26th).The payment of settlement of 438 million JPY deducted from this suspense receipt and thus an extraordinary loss of 375 million JPY booked on Feb. 2015 period (26th).
A part of gain on disposition (502 million JPY) is booked as reserve for reduction entry
Achieved improvement in profitability and stability while persistently growing distributions
Implemented actions (Dec. 2014 – Jan. 2015)

JAPAN RETAIL FUND
5
1. Portfolio Management
2. Implementation of Growth Strategy
3. Portfolio Evolution
4. Financial Results and Forecasts
5. Sustainability ManagementNewly acquired propertyG‐Bldg. Nagoya Sakae 01

Financing Strategy
1
2
Continued financing stability by diversifying maturity periods, lengthening borrowing periods, improving fixed interest rate ratio, and securing emergency funding sources
Diversification of funding sources through introduction of new lenders and issuance of corporate bonds
2. Implementation of Growth Strategy
JRF Growth Strategy
6
External Growth Strategy
Asset size expansion for the purpose of further enhancing regional and tenant diversification
Securing future internalgrowth opportunities through acquisition of properties with high potential in good location utilizing our SC Management capabilities
1
2
3
Additional acquisition of prime asset andproperty replacementfor the purpose of improving portfolio quality
Internal Growth Strategy
Improvement in profitability through strengthening of property competitiveness1
2 Improvement in stabilityof our portfolio by reducing potential risks through continuous dialogue with major tenants:‐ Suggestion of competitiveness improvement measures‐ Introduction of stable lease terms
Growth strategy for improvement of unitholders values
2. Implementation of Growth Strategy
Financing Strategy (1)
7
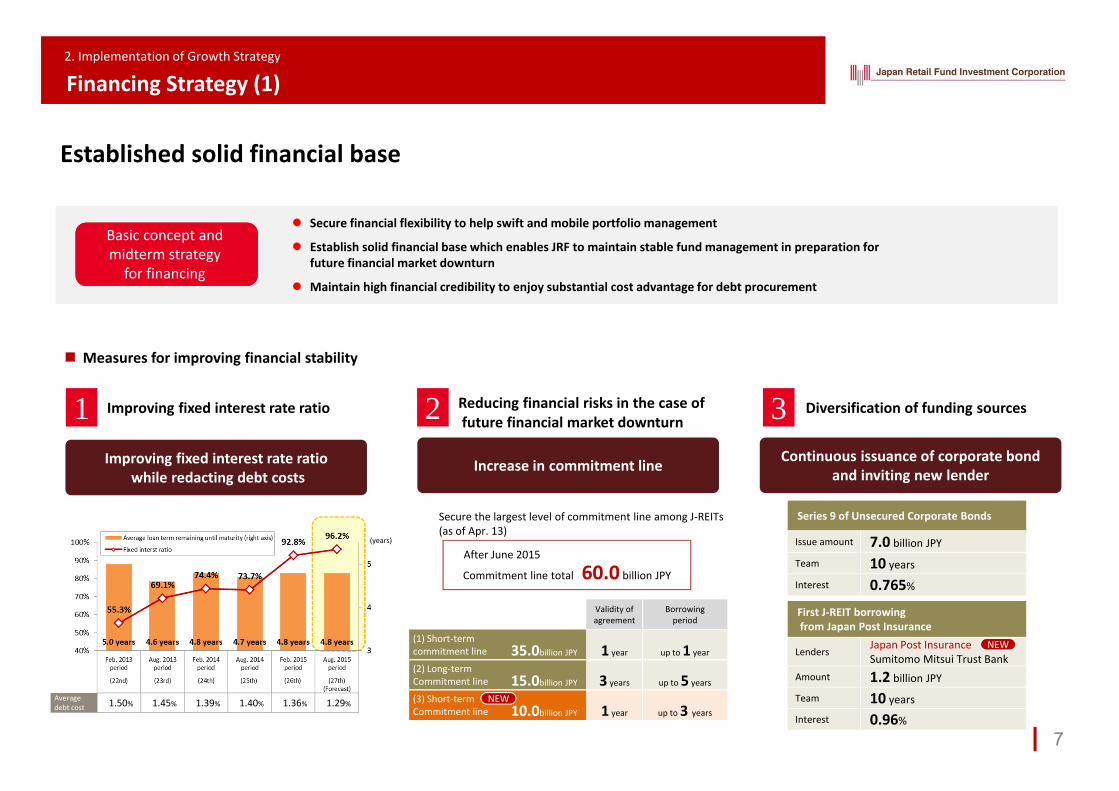
1 Improving fixed interest rate ratio 2 Reducing financial risks in the case offuture financial market downturn 3 Diversification of funding sources
Measures for improving financial stability
Improving fixed interest rate ratiowhile redacting debt costs
Increase in commitment line
Commitment line total 60.0 billion JPY
After June 2015
Continuous issuance of corporate bond and inviting new lender
Series 9 of Unsecured Corporate Bonds
Issue amount 7.0 billion JPY
Team 10 years
Interest 0.765%
First J‐REIT borrowingfrom Japan Post Insurance
LendersJapan Post InsuranceSumitomo Mitsui Trust Bank
Amount 1.2 billion JPY
Team 10 years
Interest 0.96%Averagedebt cost 1.50% 1.45% 1.39% 1.40% 1.36% 1.29%
(years)
Secure financial flexibility to help swift and mobile portfolio management
Establish solid financial base which enables JRF to maintain stable fund management in preparation forfuture financial market downturn
Maintain high financial credibility to enjoy substantial cost advantage for debt procurement
Basic concept and midterm strategy for financing
Validity ofagreement
Borrowingperiod
(1) Short‐term commitment line 35.0billion JPY 1 year up to 1 year
(2) Long‐termCommitment line 15.0billion JPY 3 years up to 5 years
(3) Short‐termCommitment line 10.0billion JPY 1 year up to 3 years
NEW
NEW
Established solid financial base
Secure the largest level of commitment line among J‐REITs(as of Apr. 13)
516 1,615 468 1,092 469 1,009 469 1,009 469 955 302 738 193 733 193 193 193 193 193 193
10,000 15,000
7,500 7,000 8,000 350
11,700
21,350 17,900
400
23,900 21,766 22,000
27,000 22,500 23,000 21,575
17,000 17,000 16,000 14,500 14,000
8,000
7,500
5,000
8,500
3,000
4,000
1,000 1,000 0
5,000
10,000
15,000
20,000
25,000
30,000
35,000
40,000
45,000
50,000
55,000
60,000
Aug. Feb. Aug. Feb. Aug. Feb. Aug. Feb. Aug. Feb. Aug. Feb. Aug. Feb. Aug. Feb. Aug. Feb. Aug. Feb. Aug. Feb. Aug. Feb. Aug. Feb. Aug. Feb. Aug.
2015 2016 2017 2018 2019 2020 2021 2022 2023 2024 2025 2026 2027 2028 2029
Long‐term borrowings Corporate bonds Tenant leasehold and security deposits(million JPY)
2. Implementation of Growth Strategy
Financing Strategy (2)
8
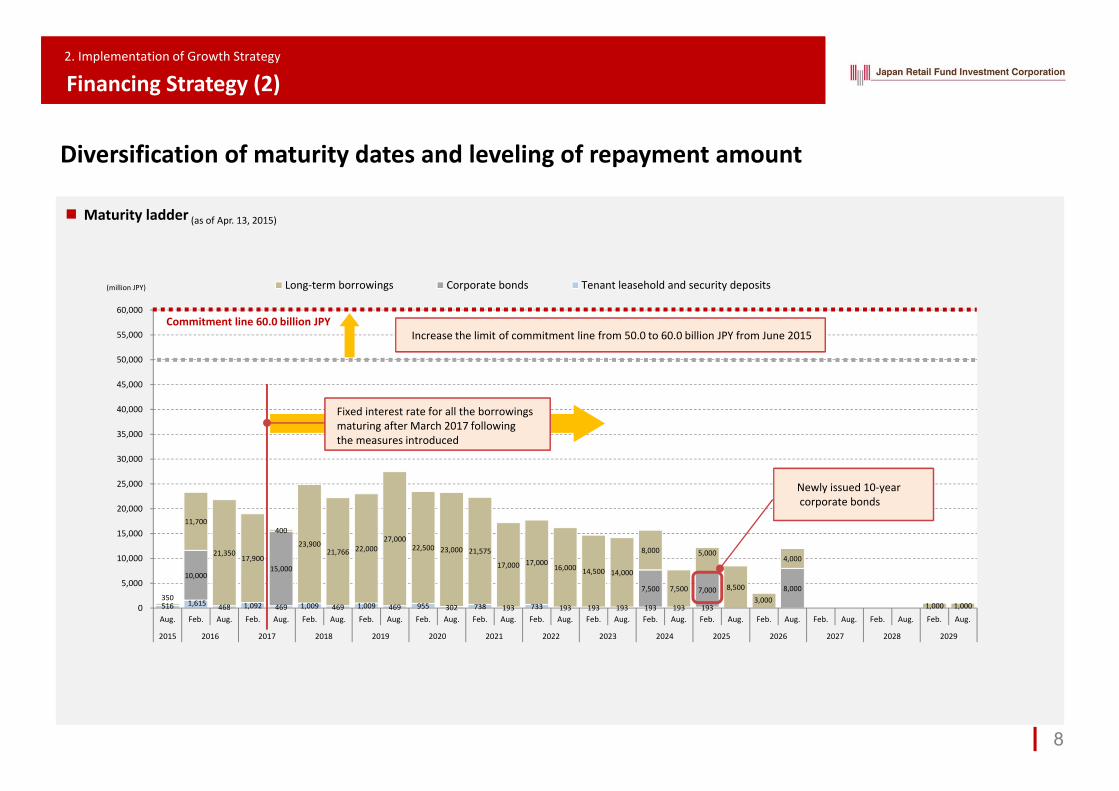
Diversification of maturity dates and leveling of repayment amount
Newly issued 10‐yearcorporate bonds
Maturity ladder (as of Apr. 13, 2015)
Commitment line 60.0 billion JPY
Fixed interest rate for all the borrowings maturing after March 2017 following the measures introduced
Increase the limit of commitment line from 50.0 to 60.0 billion JPY from June 2015
2. Implementation of Growth Strategy
External Growth Strategy (1)
9
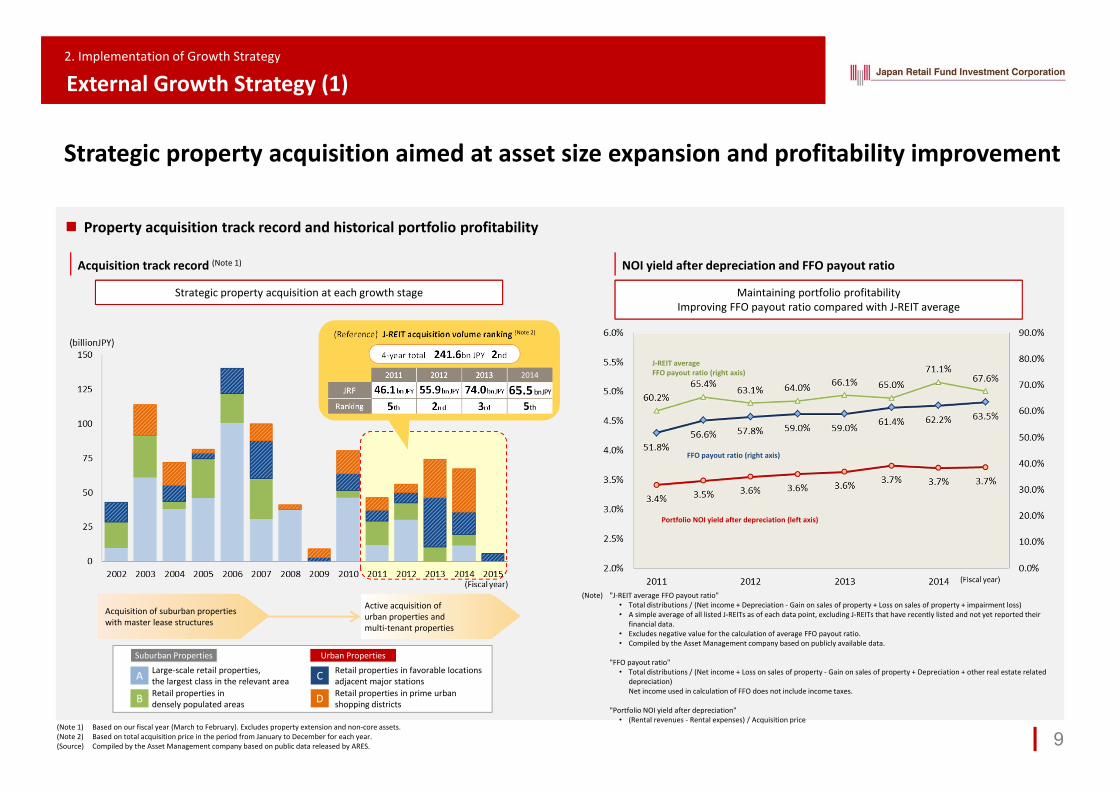
Strategic property acquisition aimed at asset size expansion and profitability improvement
Property acquisition track record and historical portfolio profitability
Acquisition of suburban properties with master lease structures
Active acquisition of urban properties and multi‐tenant properties
Acquisition track record (Note 1) NOI yield after depreciation and FFO payout ratio
A
B
C
D
Large‐scale retail properties, the largest class in the relevant areaRetail properties in densely populated areas
Retail properties in favorable locations adjacent major stationsRetail properties in prime urbanshopping districts
Suburban Properties Urban Properties
Strategic property acquisition at each growth stage Maintaining portfolio profitabilityImproving FFO payout ratio compared with J‐REIT average
Portfolio NOI yield after depreciation (left axis)
FFO payout ratio (right axis)
J‐REIT averageFFO payout ratio (right axis)
"J‐REIT average FFO payout ratio"• Total distributions / (Net income + Depreciation ‐ Gain on sales of property + Loss on sales of property + impairment loss)• A simple average of all listed J‐REITs as of each data point, excluding J‐REITs that have recently listed and not yet reported their
financial data.• Excludes negative value for the calculation of average FFO payout ratio.• Compiled by the Asset Management company based on publicly available data.
"FFO payout ratio"• Total distributions / (Net income + Loss on sales of property ‐ Gain on sales of property + Depreciation + other real estate related
depreciation)Net income used in calculation of FFO does not include income taxes.
"Portfolio NOI yield after depreciation"• (Rental revenues ‐ Rental expenses) / Acquisition price
(Note)
Based on our fiscal year (March to February). Excludes property extension and non‐core assets.Based on total acquisition price in the period from January to December for each year.Compiled by the Asset Management company based on public data released by ARES.
(Note 1)(Note 2)(Source)
(Reference) J‐REIT acquisition volume ranking (Note 2)
2011 2012 2013 2014
JRF 46.1bnJPY 55.9bnJPY 74.0bnJPY 65.5bnJPY
Ranking 5th 2nd 3rd 5th
4‐year total 241.6bn JPY 2nd
2. Implementation of Growth Strategy
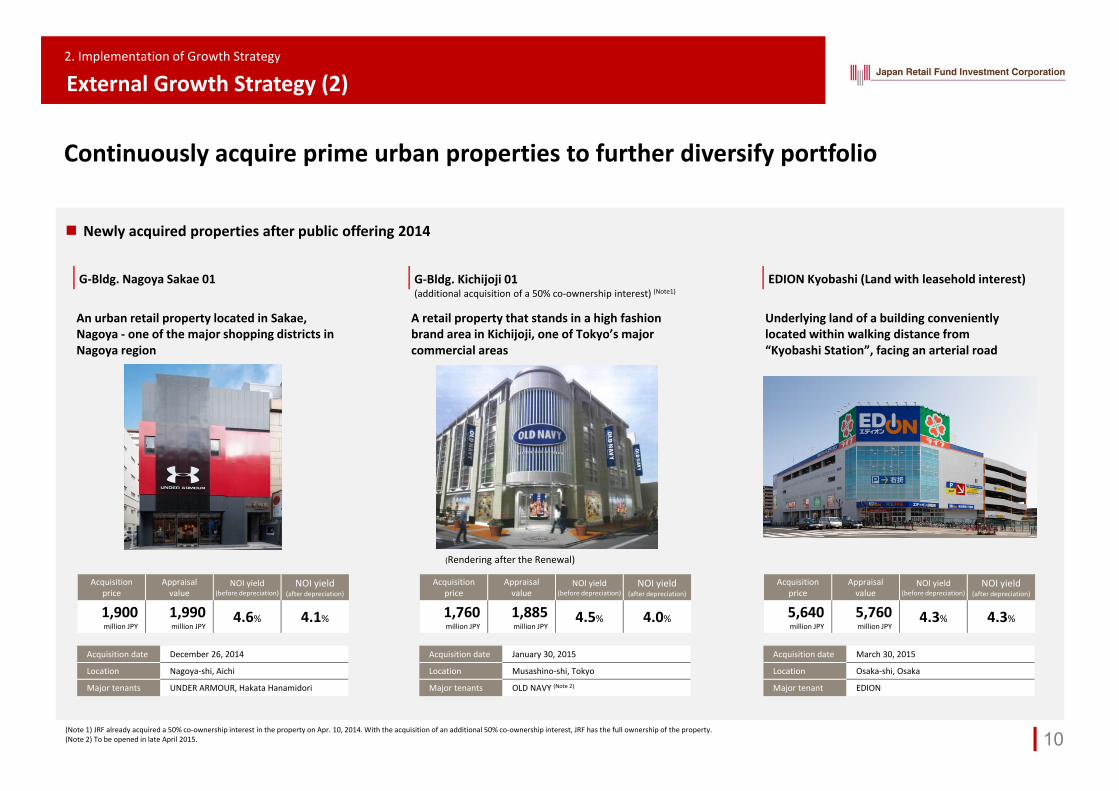
External Growth Strategy (2)
10
Newly acquired properties after public offering 2014
An urban retail property located in Sakae, Nagoya ‐ one of the major shopping districts in Nagoya region
G‐Bldg. Nagoya Sakae 01 G‐Bldg. Kichijoji 01(additional acquisition of a 50% co‐ownership interest) (Note1)
EDION Kyobashi (Land with leasehold interest)
Acquisitionprice
Appraisal value
NOI yield(before depreciation)
NOI yield(after depreciation)
1,900million JPY
1,990million JPY
4.6% 4.1%
Acquisition date December 26, 2014
Location Nagoya‐shi, Aichi
Major tenants UNDER ARMOUR, Hakata Hanamidori
A retail property that stands in a high fashion brand area in Kichijoji, one of Tokyo’s majorcommercial areas
Acquisitionprice
Appraisal value
NOI yield(before depreciation)
NOI yield(after depreciation)
1,760million JPY
1,885million JPY
4.5% 4.0%
Acquisition date January 30, 2015
Location Musashino‐shi, Tokyo
Major tenants OLD NAVY (Note 2)
Underlying land of a building conveniently located within walking distance from “Kyobashi Station”, facing an arterial road
Acquisitionprice
Appraisal value
NOI yield(before depreciation)
NOI yield(after depreciation)
5,640million JPY
5,760million JPY
4.3% 4.3%
Acquisition date March 30, 2015
Location Osaka‐shi, Osaka
Major tenant EDION
(Note 1) JRF already acquired a 50% co‐ownership interest in the property on Apr. 10, 2014. With the acquisition of an additional 50% co‐ownership interest, JRF has the full ownership of the property.(Note 2) To be opened in late April 2015.
(Rendering after the Renewal)
Continuously acquire prime urban properties to further diversify portfolio

Real estate market
2. Implementation of Growth Strategy
External Growth Strategy (3)
11
Property dispositions at optimum timingDisposition
Acquisition
Property replacement
Acquisitions of prime properties
Concept of property replacement
Example of property replacement AcquisitionDisposition
Jan. ~ Apr. 2014(24th, 25th period)
• AEON TOWN Ogaki• G DINING SAPPORO• G‐Bldg. Jingumae 04• G‐Bldg. Jingumae 05
Dec. 2014 ~ Feb. 2015(26th period)
• AEON MALL Kobe Kita(30% co‐ownership interest)
• G‐Bldg. Nagoya Sakae 01• G‐Bldg. Kichijoji 01 (50% co‐ownership interest)
9.9 billion JPY
Average NOI yield (after depreciation) 3.4% 3.9%
4.9 billion JPY 3.6 billion JPY
3.2% 4.0%
AEON MALL Kobe Kita G‐Bldg. Kichijoji 01G‐Bldg. Nagoya Sakae 01
• G‐Bldg. Omotesando 02 (35% co‐ownership interest)• G‐Bldg. Shibuya 01• G‐Bldg. Kichijoji 01 (50% co‐ownership interest)• Round1 Stadium Takatsuki
Objectives
Further diversification of portfolio
Re‐allocation of portfolio to adapt to a changingconsumption structure in Japan
present situation
19.4 billion JPY
Average NOI yield (after depreciation)
Average NOI yield (after depreciation)
Average NOI yield (after depreciation)
Strategic property replacement for improvement of portfolio profitability and stability
Increase in acquisition opportunities for prime urban properties on the back of strong real estate market
Cap rate compression for suburban single‐tenant properties
2. Implementation of Growth Strategy
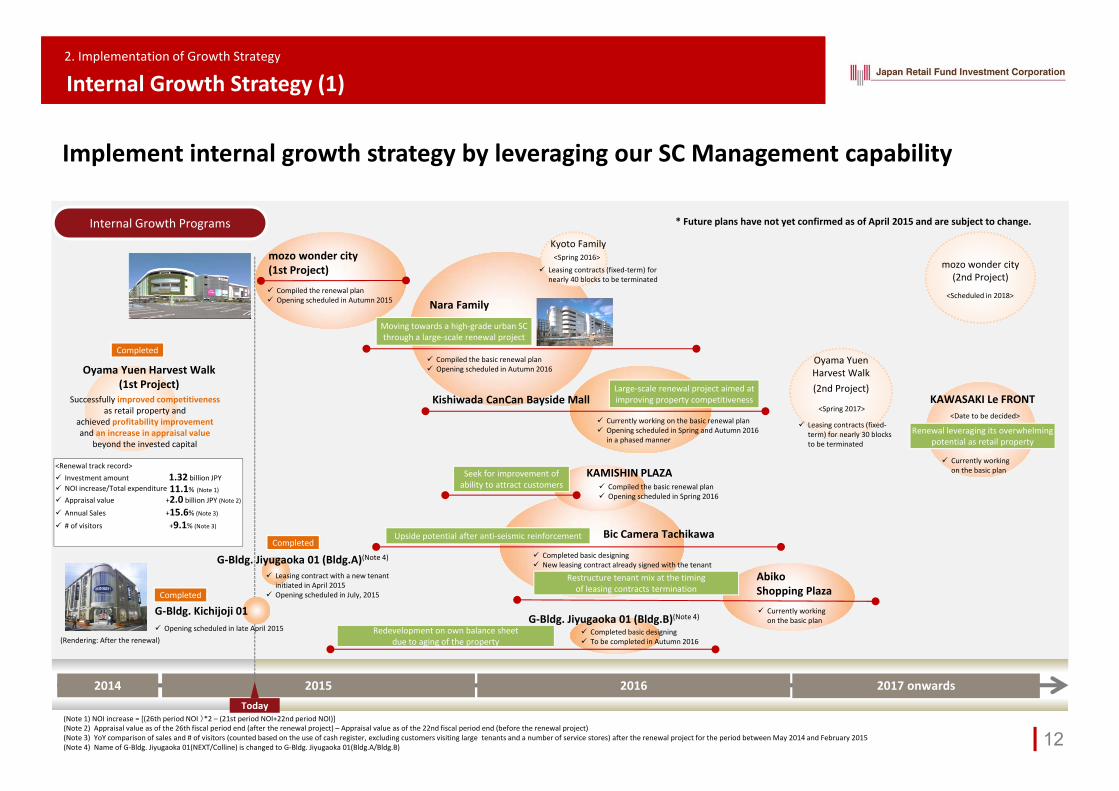
Internal Growth Strategy (1)
12
Implement internal growth strategy by leveraging our SC Management capability
Nara Family
G‐Bldg. Jiyugaoka 01 (Bldg.A)(Note 4)
KAWASAKI Le FRONT
Currently working on the basic plan
Internal Growth Programs
Kishiwada CanCan Bayside Mall
Bic Camera Tachikawa
Completed basic designing New leasing contract already signed with the tenant
Oyama Yuen Harvest Walk(1st Project)
2015 2016 2017 onwards2014Today
G‐Bldg. Jiyugaoka 01 (Bldg.B)(Note 4)
mozo wonder city (2nd Project)
Oyama Yuen Harvest Walk
<Scheduled in 2018>
* Future plans have not yet confirmed as of April 2015 and are subject to change.
mozo wonder city (1st Project)
Compiled the renewal plan Opening scheduled in Autumn 2015
G‐Bldg. Kichijoji 01
(Note 1) NOI increase = [(26th period NOI )*2 – (21st period NOI+22nd period NOI)](Note 2) Appraisal value as of the 26th fiscal period end (after the renewal project) – Appraisal value as of the 22nd fiscal period end (before the renewal project)(Note 3) YoY comparison of sales and # of visitors (counted based on the use of cash register, excluding customers visiting large tenants and a number of service stores) after the renewal project for the period between May 2014 and February 2015 (Note 4) Name of G‐Bldg. Jiyugaoka 01(NEXT/Colline) is changed to G‐Bldg. Jiyugaoka 01(Bldg.A/Bldg.B)
Completed
(Rendering: After the renewal)
Leasing contracts (fixed‐term) for nearly 30 blocks to be terminated
Leasing contracts (fixed‐term) for nearly 40 blocks to be terminated
Kyoto Family<Spring 2016>
<Renewal track record> Investment amount 1.32 billion JPY NOI increase/Total expenditure Appraisal value +2.0 billion JPY (Note 2)
Annual Sales +15.6% (Note 3)
# of visitors +9.1% (Note 3)
(2nd Project)
<Spring 2017>
AbikoShopping Plaza
Completed basic designing To be completed in Autumn 2016
Redevelopment on own balance sheet due to aging of the property
Leasing contract with a new tenant initiated in April 2015
Opening scheduled in July, 2015
<Date to be decided>
Successfully improved competitivenessas retail property and
achieved profitability improvementand an increase in appraisal value
beyond the invested capital
Compiled the basic renewal plan Opening scheduled in Autumn 2016
Currently working on the basic renewal plan Opening scheduled in Spring and Autumn 2016
in a phased manner
Upside potential after anti‐seismic reinforcement
KAMISHIN PLAZA
Restructure tenant mix at the timing of leasing contracts termination
Currently working on the basic plan
Compiled the basic renewal plan Opening scheduled in Spring 2016
Moving towards a high‐grade urban SCthrough a large‐scale renewal project
Large‐scale renewal project aimed at improving property competitiveness
Seek for improvement of ability to attract customers
Renewal leveraging its overwhelmingpotential as retail property
Completed
Completed
Opening scheduled in late April 2015
11.1% (Note 1)

1
2. Implementation of Growth Strategy
Internal Growth Strategy (2)
Implementing a large‐scale renewal project aiming at increasing market positioning (mozo wonder city)
Estimated total expenditure
2.17 billion JPY
Annual NOI increase/Total expenditure
10.9%
Objective and renewal plan
To lay foundation for future target annual sales of 60.0 billion JPY being consciously aware of differentiation from surrounding competing properties
Renewal project overview
Estimated increase in NOI
0.23 billion JPY/ year
Introduction of various new tenants (boutique shops, apparel brands, cosmetic stores and interior shops ), including first store opening in entire Nagoya area and first store opening in suburban shopping mall in Nagoya
13
Area # of stores
New 17% approx. 70
Relocated 8% approx. 40
Remained 22% approx. 90Not subject to lease renewal 53% approx. 20
Historical sales trend and target sales figure (based on fiscal year)
4F Complement tenant line‐up with goods tenantReinforce Men's and Unisex items
3F Change tenant mix to target at kids/familyRefurbishment of food court space
2F Set up as the main floor for ladies fashionIntroduce a large casual fashion tenant
1F Tenants with higher awareness of leading trendsIncrease in average sale per customer
Floor concept
1st Renewal Project
(This time)
2nd Renewal Project
(2018 onwards)
Tenant subject to lease renewal (planned)
Objective
Renewalplan
Review tenant mix and attract trend‐leading tenants
Create an attractive shopping environment to attract a customer group who shops in downtown (Nagoya station and Sakae) area
2 Work summary and schedule
3 Tenant replacement
4 Effects on the entire facilities
Aug. 2015 (27th period) Feb. 2016 (28th period)
2015March April May June July August September October
Termination of leasing contracts (approx. 200 tenants)Tenant replacement/relocation
Re‐opening of the facility
Environmental works
Energy‐saving works
CS improvement works
Pre‐opening(approx. 50 stores)
Opening (approx. 60 stores)
Subject to lease renewal
(Note) All figures are based on assumption of 100% ownership in the property
Target Sales
60.0 billion JPY
• Floor plan Alternation of floor plan in relation to tenant replacement
• Shopping environment Refurbishment of food court area and common area, etc.
• Energy‐conservation Installation of LED lightning, air conditioning inverter, etc.
• CS improvement Introduction of parking space control system, changeover system for loyalty card, etc.
4F Additional line‐up of goods tenantsStrengthening of Men's and Unisex line‐up
3F Change tenant mix to target at kids/familyRefurbishment of food court space
2F Set up of the main floor for ladies fashionIntroduce a large casual fashion brand
1F Tenants with higher awareness of leading trendsIncrease in average sale per customer

2. Implementation of Growth Strategy
Internal Growth Strategy (3)
14
After(Note)
Installation of “mozo tree,” which functions as seating space as well as a symbol, and green carpeting, which helps create “mozo park” atmosphere.
Partitioning of ample space to add accents to space and to create a comfortable atmosphere
Adoption of muti‐level ceiling and floor for visual effect and comfort
Efficient table layout to resolve lack of seating space.(Increase from 800 seats to 1,000 seats)
Before
After(Note)
Installation of Resting Space (mozo tree) and Green Carpeting Refurbishment of Food Court Area
Before
Rendering after the Renewal Project (mozo wonder city)
Environmental design concept
“mozo park” Repositioning of a large, spacious shopping mall in the community into a park‐like space where all generations enjoy comfortable time
(Note) These are indicative renderings and may differ from the actual development.

2. Implementation of Growth Strategy
Internal Growth Strategy (4)
15
Achieved rent increase by leveraging our SC Management capabilities
Examples of Rent IncreaseG‐Bldg. Jiyugaoka 01 (Bldg.A)(Note 2)
G‐Bldg. Kichijoji 01
Cheers Ginza
G‐Bldg. Sangenjaya 01
Achieved 100% occupancy rate with a single tenant
The first road‐side store of OLD NAVY a major U.S. apparel brand, in central Tokyo
Opening scheduled in late April 2015
Floor area Rent growth
Replacement2 tenants 411 tsubo +3.8%
Strategically, altered type of tenant on the first floor from restaurant to drug store
New tenant without any down‐time
Opening scheduled in from Autumn 2015 onwards
(Rendering: After renewal)
(Note 1) Figures are based on lease contracts signed as of April 13, 2015, excluding certain blocks whose rent level cannot be compared before and after lease renewal.(Note 2) Name of G‐Bldg. Jiyugaoka 01(NEXT/Colline) is changed to G‐Bldg. Jiyugaoka 01(Bldg.A/Bldg.B) (Note 3) Rent growth is a comparison of rental conditions before and after tenant replacement (a total of monthly rent and common area charges)(Note 4) Rent growth is not disclosed because we have not obtained the necessary permission from the tenant. NOI growth is calculated by comparing the initial estimated NOI (normalized‐based) and NOI after initiation of the new lease contract (normalized‐based)(Note 5) 1 tsubo is approximately 3.3 m2 .
Floor area NOI growth
Tenant replacement 457 tsubo +3.3%
Urban properties subject to lease renewal (fixed term) due to lease termination through Sep. 2014 and Feb. 2016
Rent increased in 11, stayed same in 17 and reduced in 4out of the signed 32blocks.
Concluded a long‐term lease contract (fixed‐term) with BAYCREW'S which operates boutique shops and cafes mainly in central TokyoOpening scheduled in late July 2015
Yoga studio to be opened in May 2015Basement
Replaced 3 tenants out of 7 that had expirity of lease contract(fixed‐term). New tenants including the first store opening in Tokyo and the first restaurant in Japan
New shops opening scheduled from May 2015 onwards
Floor area Rent growth
Expiration of lease contracts
7 tenants352 tsubo +1.6%
Floor area Rent growth
Replacement2 tenants 232 tsubo +85.0%
1‐3 Floors
Tenant replacement without any down‐time and introduction of a competitive tenant leveraging our strong tenant relationship
Conclude leasing contract with a competitive tenant by leveraging our leasing capabilities
Transform to a facility with increased consumer traffic by taking advantage of our accumulated experience in managing F&B‐oriented properties and wide tenant relationship
Large rent increase by changing tenant category to fully leverage its excellent location
(Note 4)
(Note 1)

1 The early settlement of the lawsuit for securing flexibility on property management
2. Implementation of Growth Strategy
Internal Growth Strategy (5)
16
Reduction of future potential risks for portfolio stabilization
2 The revision of the economic term of the lease and Renewing the lease with longer terms for stability
Osaka Shinsaibashi 8953 Building
Background of settlement
Elimination of future risks by stabilizing lease condition
Securing flexibility on property management of the urban property in Shinsaibashi area
Impact to P/L
Payment of settlement (438 million JPY) utilizing gain ondisposition of a part of AEON MALL Kobe Kita
No influence on P/L because decrease in rental revenuehad been already incorporated in the forecasts
Ito‐Yokado (Percentage of the rent in our portfolio:8.5%)
Lease term renewals with Ito‐Yokado(Note 1)(Note 2)
Ito‐Yokado Yotsukaido
Abiko Shopping Plaza
• Expected lease expiration(old style lease contract) in Feb. 2019
• Preparing revitalizing plan with the tenant that fully takes advantage of the prime location especially for in‐bound demands with tenant
Future management plan
Ito‐Yokado Tsunashima
Ito‐Yokado Kamifukuoka
Ito‐Yokado Yabashira
Ito‐Yokado Kawasaki
Early settlement of the lawsuit regarding rent reduction request without significant impact on revenue forecast
Hedging the risk of rent reduction
Excluding the 2 assets , Ito‐Yokado Nishiki Cho and Ario Otori, of fixed term building lease contract with Ito‐Yokado 。The lease contracts of 2 assets, IY Tsunashima and IY Yabashira have already been renewed with their expiration date of October 31, 2018.
(Note 1)(Note 2)
Renewed the lease contracts with same term as before
Discussing with the tenant on the lease term with potential renewal plans as a leverage
Strategically offered the reduced rent with longer lease periods to facilitate renewals driven by tenant

JAPAN RETAIL FUND
17
1. JRF’s Portfolio Management
2. Implementation ofGrowth Strategy
3. Portfolio Evolution
4. Financial Results and Forecasts
5. JRF’s Sustainability Management(Rendering after the Renewal)Additional acquisition of a 50% co‐ownership interest
G‐Bldg. Kichijoji 01

1 Improvement portfolio stability 2 Maintenance and improvement ofportfolio profitability
3. Portfolio Evolution
Portfolio Evolution
18
Aiming to achieve improvement in both profitability and stability
Portfolio evolution
Feb. 2013 period (22nd) As of Apr. 13, 2015
Increased number of urban properties
(based on appraisal value)
Increased number of growth type properties
Reduced risk of tenant concentration
(based on annual rent)
Increased new style lease contract ratio
(based of annual rent)
Urban
23.9%Suburban
76.1%
Urban
35.0%Suburban
65.0%
Growth type
28.7%Income type(AEON : ML type(Note 1))
40.7%(Others)
21.5%(Ito‐Yokado: ML type(Note 2))
9.1%
Growth type
33.4%
Income type(AEON : ML type(Note 1))
32.8%
(Others)
26.8%(Ito‐Yokado: ML type(Note 2))
7.0%
Direct lease28.1%
Master lease71.9%
New style(Fixed‐term)lease contract
Old style lease contract
51.0%
49.1%Old style
lease contract
New style(Fixed‐term)lease contract
56.4%
43.6%
Direct lease40.0%
Master lease60.0%
(Note 1) “AEON: ML type” refers to the total annual rent of AEON Retail, AEON MALL, AEON Kyushu, AEON Ryukyu and AEON TOWN which lease our properties as a master lease tenant in Income properties.(Note 2) "Ito‐Yokado: ML type" refers to the total annual rent of Ito‐Yokado which leases our properties as a master lease tenant in Income properties.
NOI yield trend
Aiming forimprovement
andstabilization

3. Portfolio Evolution
19
(Forecast) (Forecast)
(Note 1) Net income per unit is calculated by dividing net income by a number of units outstanding as of the end of each fiscal period and is not identical to net income per unit defined in The Summary of Financial Results and Asset Management Report (net income per unit / average number of units outstanding)
(Note 2) This graph does not reflect the reserves for dividends (103 mn JPY) we have recorded in Feb. 2014 (24th) period.
DPU stabilization through the use of reserve for reduction entry
Occurrence of temporary expense due to implementation of internal growth strategy
Implement active measures for future growth that involve temporary expenses
while stabilizing DPU level through overall portfolio management
Cover the temporary expenses by revenue of other existing properties
Monetize unrealized profits via property disposition
(JPY)Use the reserve over
several periods
Temporary expenses
Occurrence of demolition cost, loss on disposal of fixed assetsdue to renewal/redevelopmentof existing properties
Net income per unit (Note 1, 2)
Distributions per unit
Gain on sales of property= partially retain as internal reserve
Stabilizing the DPU through crystallizing unrealized profits over several period
Persistent DPU growth through the use of reserve for reduction entry
Flexibly use reserve for reduction entry, accumulated by monetizing
unrealized profits, for the purpose of stabilizing DPU
Future DPU after Aug. 2015 period (27th period)
JAPAN RETAIL FUND
20
1. Portfolio Management
2. Implementation of Growth Strategy
3. Portfolio Evolution
4. Financial Results and Forecasts
5. Sustainability Management
Newly acquired propertyEDION Kyobashi (land with leasehold interest)
4. Financial Results and Forecasts
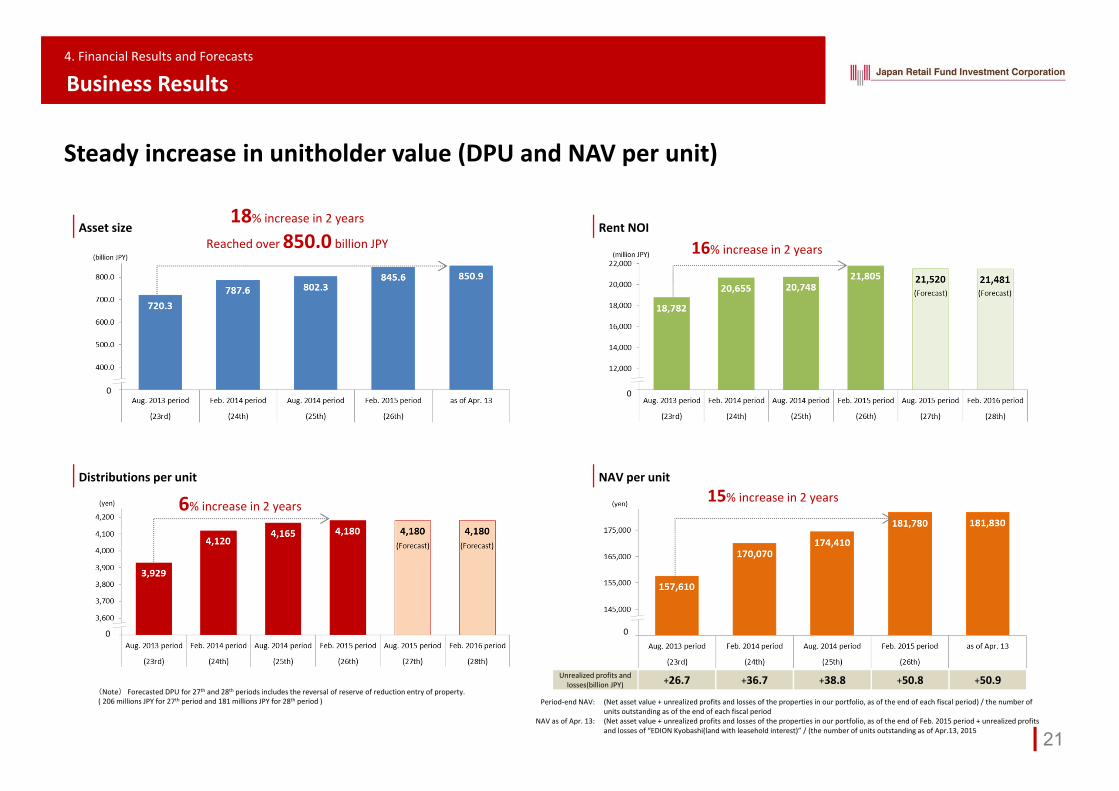
Business Results
21
Steady increase in unitholder value (DPU and NAV per unit)
Asset size Rent NOI
Distributions per unit
0
NAV per unit
18% increase in 2 years
Reached over 850.0 billion JPY
6% increase in 2 years
16% increase in 2 years
15% increase in 2 years
Unrealized profits and losses(billion JPY) +26.7 +36.7 +38.8 +50.8 +50.9
0
0
0
(Note) Forecasted DPU for 27th and 28th periods includes the reversal of reserve of reduction entry of property. ( 206 millions JPY for 27th period and 181 millions JPY for 28th period ) (Net asset value + unrealized profits and losses of the properties in our portfolio, as of the end of each fiscal period) / the number of
units outstanding as of the end of each fiscal period(Net asset value + unrealized profits and losses of the properties in our portfolio, as of the end of Feb. 2015 period + unrealized profits and losses of “EDION Kyobashi(land with leasehold interest)” / (the number of units outstanding as of Apr.13, 2015
Period‐end NAV:
NAV as of Apr. 13:
4. Financial Results and Forecasts
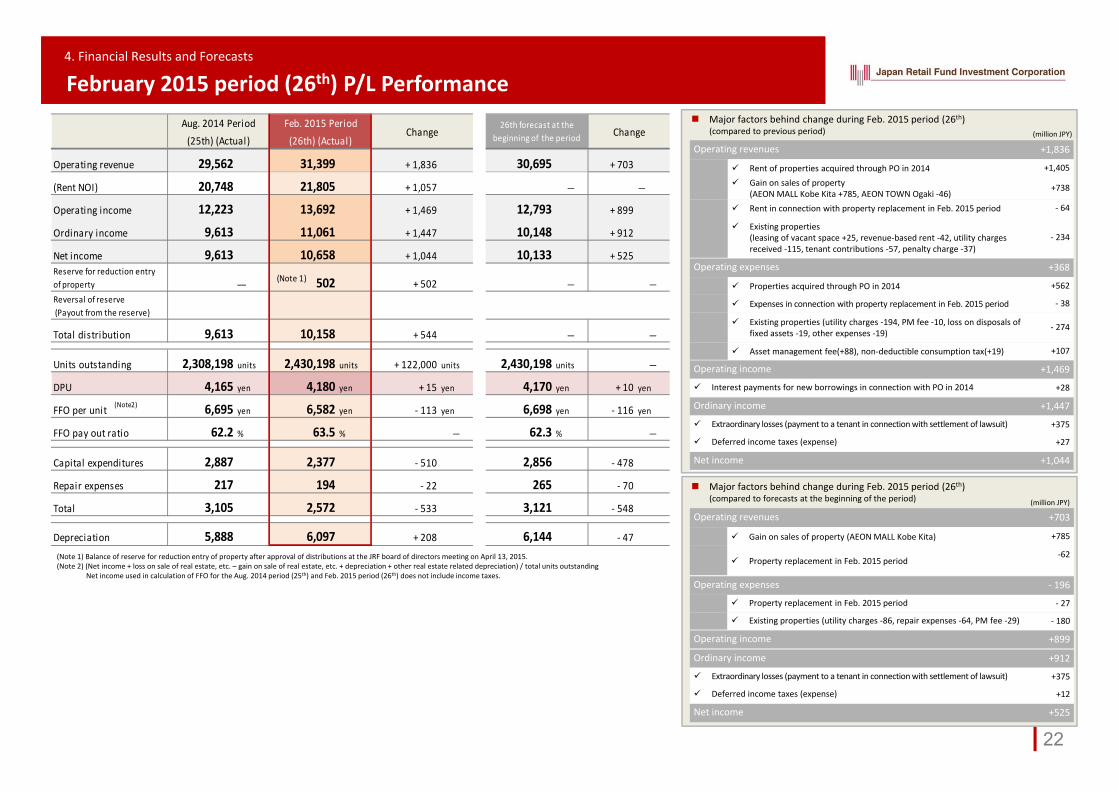
February 2015 period (26th) P/L Performance Major factors behind change during Feb. 2015 period (26th)
(compared to previous period) (million JPY)
Operating revenues +1,836
Rent of properties acquired through PO in 2014 +1,405
Gain on sales of property (AEON MALL Kobe Kita +785, AEON TOWN Ogaki ‐46)
+738
Rent in connection with property replacement in Feb. 2015 period ‐ 64
Existing properties (leasing of vacant space +25, revenue‐based rent ‐42, utility charges received ‐115, tenant contributions ‐57, penalty charge ‐37)
‐ 234
Operating expenses +368
Properties acquired through PO in 2014 +562
Expenses in connection with property replacement in Feb. 2015 period ‐ 38
Existing properties (utility charges ‐194, PM fee ‐10, loss on disposals of fixed assets ‐19, other expenses ‐19)
‐ 274
Asset management fee(+88), non‐deductible consumption tax(+19) +107
Operating income +1,469
Interest payments for new borrowings in connection with PO in 2014 +28
Ordinary income +1,447
Extraordinary losses (payment to a tenant in connection with settlement of lawsuit) +375
Deferred income taxes (expense) +27
Net income +1,044
Major factors behind change during Feb. 2015 period (26th) (compared to forecasts at the beginning of the period)
Operating revenues +703
Gain on sales of property (AEON MALL Kobe Kita) +785
Property replacement in Feb. 2015 period‐62
Operating expenses ‐ 196
Property replacement in Feb. 2015 period ‐ 27
Existing properties (utility charges ‐86, repair expenses ‐64, PM fee ‐29) ‐ 180
Operating income +899
Ordinary income +912
Extraordinary losses (payment to a tenant in connection with settlement of lawsuit) +375
Deferred income taxes (expense) +12
Net income +525
(Note 1) Balance of reserve for reduction entry of property after approval of distributions at the JRF board of directors meeting on April 13, 2015.(Note 2) (Net income + loss on sale of real estate, etc. – gain on sale of real estate, etc. + depreciation + other real estate related depreciation) / total units outstanding
Net income used in calculation of FFO for the Aug. 2014 period (25th) and Feb. 2015 period (26th) does not include income taxes.
(million JPY)
22
Operating revenue 29,562 31,399 + 1,836 30,695 + 703
(Rent NOI) 20,748 21,805 + 1,057 ― ―
Operating income 12,223 13,692 + 1,469 12,793 + 899
Ordinary income 9,613 11,061 + 1,447 10,148 + 912
Net income 9,613 10,658 + 1,044 10,133 + 525
― 502 + 502 ― ―
Total distribution 9,613 10,158 + 544 ― ―
2,308,198 units 2,430,198 units + 122,000 units 2,430,198 units ―
DPU 4,165 yen 4,180 yen + 15 yen 4,170 yen + 10 yen
FFO per unit 6,695 yen 6,582 yen ‐ 113 yen 6,698 yen ‐ 116 yen
FFO pay out ratio 62.2 % 63.5 % ― 62.3 % ―
Capital expenditures 2,887 2,377 ‐ 510 2,856 ‐ 478
Repair expenses 217 194 ‐ 22 265 ‐ 70
Total 3,105 2,572 ‐ 533 3,121 ‐ 548
Depreciation 5,888 6,097 + 208 6,144 ‐ 47
Reserve for reduction entryof propertyReversal of reserve (Payout from the reserve)
ChangeFeb. 2015 Period(26th) (Actual)
Aug. 2014 Period(25th) (Actual)
Units outstanding
26th forecast at thebeginning of the period Change
(Note2)
(Note 1)
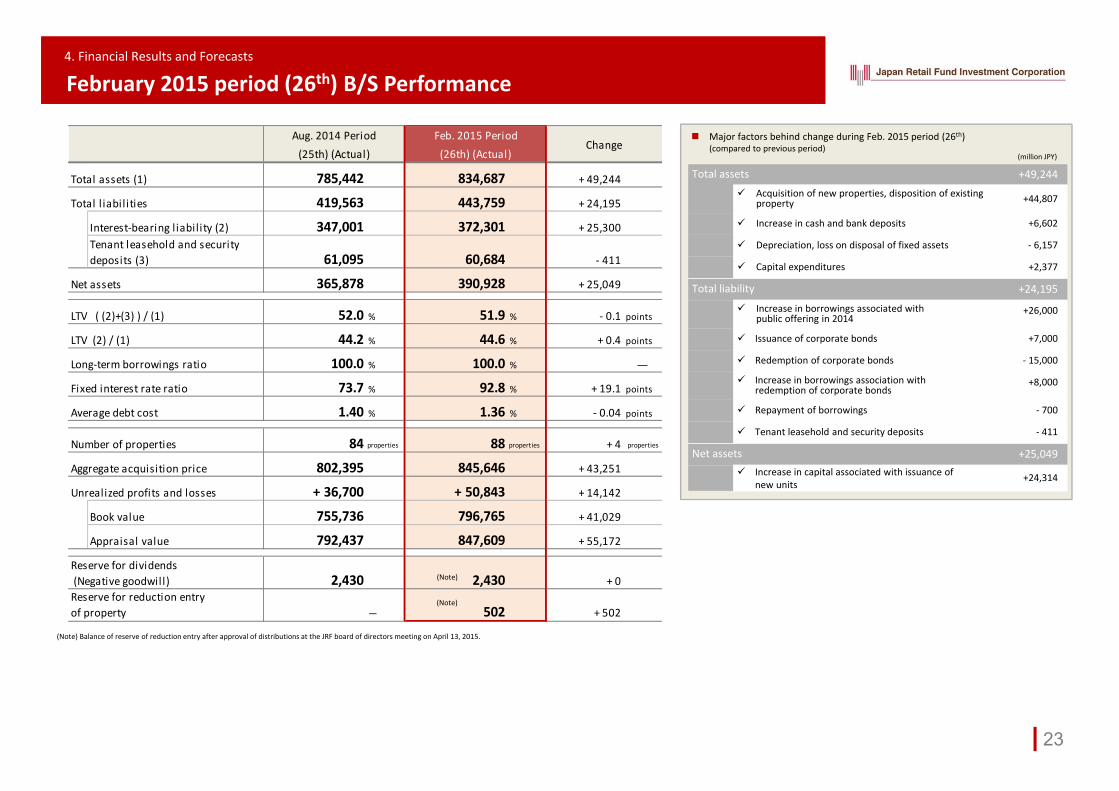
Total assets (1) 785,442 834,687 + 49,244
Total l iabilities 419,563 443,759 + 24,195
Interest‐bearing l iability (2) 347,001 372,301 + 25,300
61,095 60,684 ‐ 411
Net assets 365,878 390,928 + 25,049
LTV ( (2)+(3) ) / (1) 52.0 % 51.9 % ‐ 0.1 points
LTV (2) / (1) 44.2 % 44.6 % + 0.4 points
100.0 % 100.0 % ―
73.7 % 92.8 % + 19.1 points
1.40 % 1.36 % ‐ 0.04 points
Number of properties 84 properties 88 properties + 4 properties
Aggregate acquisition price 802,395 845,646 + 43,251
Unrealized profits and losses + 36,700 + 50,843 + 14,142
Book value 755,736 796,765 + 41,029
Appraisal value 792,437 847,609 + 55,172
2,430 2,430 + 0
― 502 + 502Reserve for reduction entryof property
ChangeFeb. 2015 Period(26th) (Actual)
Aug. 2014 Period(25th) (Actual)
Reserve for dividends (Negative goodwill)
Long‐term borrowings ratio
Tenant leasehold and securitydeposits (3)
Fixed interest rate ratio
Average debt cost
4. Financial Results and Forecasts
February 2015 period (26th) B/S Performance
23
Total assets +49,244 Acquisition of new properties, disposition of existing
property +44,807
Increase in cash and bank deposits +6,602
Depreciation, loss on disposal of fixed assets ‐ 6,157
Capital expenditures +2,377
Total liability +24,195
Increase in borrowings associated with public offering in 2014
+26,000
Issuance of corporate bonds +7,000
Redemption of corporate bonds ‐ 15,000
Increase in borrowings association withredemption of corporate bonds
+8,000
Repayment of borrowings ‐ 700
Tenant leasehold and security deposits ‐ 411
Net assets +25,049 Increase in capital associated with issuance of
new units+24,314
(Note)
(Note)
(Note) Balance of reserve of reduction entry after approval of distributions at the JRF board of directors meeting on April 13, 2015.
Major factors behind change during Feb. 2015 period (26th) (compared to previous period)
(million JPY)

Operating revenue 31,399 30,613 ‐ 786 30,763 + 150
(Rent NOI) 21,805 21,520 ‐ 284 21,481 ‐ 39
Operating income 13,692 12,539 ‐ 1,153 12,518 ‐ 21
Ordinary income 11,061 9,952 ‐ 1,108 9,977 + 25
Net income 10,658 9,951 ‐ 706 9,977 + 25
502 ― ‐ 502 ― ―
― 206 + 206 181 ‐ 25
Total distribution 10,158 10,158 ― 10,158 ―
2,430,198 units 2,430,198 units ― 2,430,198 units ―
DPU 4,180 yen 4,180 yen ― 4,180 yen ―
FFO per unit 6,582 yen 6,614 yen + 32 yen 6,622 yen + 8 yen
FFO pay out ratio 63.5 % 63.2 % ― 63.1 % ―
Capital expenditures 2,377 2,890 + 513 3,986 + 1,095
Repair expenses 194 277 + 82 495 + 217
Total 2,572 3,168 + 595 4,482 + 1,313
Depreciation 6,097 6,123 + 26 6,117 ‐ 5
Units outstanding
ChangeFeb. 2016 Period
Change(27th) (Forecast) (28th) (Forecast)Aug. 2015 PeriodFeb. 2015 Period
(26th) (Actual)
Reserve for reduction entryof propertyReversal of reserve (Payout from the reserve)
(Note3)
4. Financial Results and Forecasts
Forecasts for the Coming Two Periods
(百万円)
Operating revenues +150
Renewal opening of mozo +305 Other existing properties
(leasing downtime at Kishiwada, Tachikawa, etc. due to renewal projects ‐83, utility charges received ‐67, penalty charge ‐4)
‐ 155
Operating expenses ‐ 171 Special promotion campaign at mozo in connection with renewal opening +252 Utility charges for existing properties ‐138, decrease in rental expense due
to acquisition of underlying land for DFS ‐5‐ 165
Repair expenses (renewal projects for Kishiwada, mozo) +217
Loss on disposals of fixed assets (Jiyugaoka, mozo) ‐ 121
Asset management fee, etc. ‐ 12
Operating income ‐ 21 Decrease in interest cost, expiration of amortization in relation to unit issuance costs ‐ 46
Ordinary income +25Net income +25
Operating revenues ‐ 786
Full contribution of properties acquired through PO in 2014 +200
Full contribution of properties replacement in Feb. 2015 period ‐ 19 Existing properties (adjustment due to leasing renewals ‐74, leasing
downtime resulting from renewals ‐215, utility charges received +58, leasing of vacant space +58)
‐ 181
Absence of gain on sales of property ‐ 785
Operating expenses +366
Full contribution of properties acquired through PO in 2014 +190
Full contribution of properties replacement in Feb. 2015 period ‐ 53
Existing properties (utility charges +59, PM fee ‐124, other +21) ‐ 44
Repair expense (renewal project at mozo, etc.) +82
Loss on disposals of fixed assets (renewal projects at Jiyugaoka, mozo, etc.) +132
Asset management fee, etc. +57
Operating income ‐ 1,153 Decrease in interest for corporate bonds, etc. ‐ 45
Ordinary income ‐ 1,108 Absence of extraordinary losses
(payment to a tenant in connection with settlement of lawsuit) ‐ 375
Absence of deferred income taxes (expense) ‐ 27
Net income ‐ 706
24
Net income ‐186
Acquisition of EDION Kyobashi (Land with leasehold interest) +148
Increase in repair expense (mozo, KAWASAKI Le FRONT) ‐89
Increase in loss on disposals of fixed assets (mozo, Jiyugaoka) ‐192
Increase in leasing downtime due to renewal projects (mozo) ‐ 39
Previousforecast Revised forecast Change
Net income 10,138 9,951 ‐ 186Reversal of reserve (payment from the reserve) 0 206 +206
Total distributions 10,138 10,158 +19
DPU 4,172 4,180 +8
(Note 1) Million JPY unless otherwise noted.(Note 2) The maximum amount of the reversal of reserve for reduction entry will be following temporary expense in connection with renewal projects
Aug. 2015 period (27th) Property Feb. 2016 period (28th) PropertyTemporary expensesin connection with renewal projects 232 million JPY
Jiyugaoka (Bldg.B),mozo
340 million JPYmozo, Kishiwada,Kyoto Family, KamishinDemolition costs, compensation costs, etc. 40 million JPY 280 million JPY
Loss on disposals of fixed assets 192 million JPY 60 million JPY
(million JPY)(million JPY)
(million JPY)
(million JPY) Major factors behind change for Aug. 2015 (27th) period
(compared to 26th period)
Major factors behind change during Feb. 2016 (28th) period(compared to forecast for Aug. 2015 (27th) period)
(Note 3) (Net income + loss on sales of property, etc. ‐ gain on sales of property, etc. + depreciation + other real estate related depreciation) / total units outstanding Net income used in calculation of FFO for the Aug. 2015 period (27th) does not include income taxes.
Comparison of forecasts for Aug. 2015 (27th) period
(Note 2)

JAPAN RETAIL FUND
25
1. Portfolio Management
2. Implementation ofGrowth Strategy
3. Portfolio Evolution
4. Financial Results and Forecasts
5. Sustainability ManagementAEON MALL Itami

5. Sustainability Management
JRF Sustainability Management
26
Activities for minimizing environmental load and conserving the environment Creation of common spaces
AEON Mall Itami
Installation of solar panels
mozo wonder city
Adding greenery to the exterior
Adding greenery Restoration of rain water to aquifers through such measures as a permeable
pavement Expansion of recreation space
Oyama Yuen Harvest Walk
Social contribution activities
Our approaches
Kishiwada Can Can Bayside Mall, etc.
Offering the vacant event space to UNHCR free of charge for refugees supporting campaign.
GYRE
Exhibition of the artworks of Mitsubishi Corporation Art Gate Program in EYE OF GYRE
(Note) “Mitsubishi Corporation Art Gate Program” is a career development program offered by Mitsubishi Corporation as social contribution activities for the young and promising artists(http://www.mcagp.com/program)
Proactively engage in various measures for building a sustainable society and environment as a whole
Basic policy Communication with stakeholders
JRF shares the same concept of sustainability with the Asset Manager and implement various measures together. We established new policies and measures for sustainability in June 2013 and signed declarations adopting the following two principles.
United Nation's Principles for Responsible Investment (PRI)
The Principles for Financial Action towards a Sustainable Society endorsed by Japanese Ministry of Environment (Principles for Financial Action for the 21st Century)
Recognition from third parties
JRF participates in GRESB (Global Real EstateSustainability Benchmark) and is designated as a “Green Talk” company.Unit‐
holderTenant
Community Government
Asset Management companyMitsubishi Corp.‐UBS Realty Inc.

“CASBEE for Building” Certifications
5. Sustainability Management
Environmental Certifications
27
JRF acquired various environmental certificate through sustainability management
CASBEE (Comprehensive Assessment System for Building Environmental Efficiency) is an evaluation system that ranks buildings and structures in terms of their environmental performance. In addition to each building's ability to reduce its environmental impact across a variety of areas including energy and resource conservation as well as recycling, this system undertakes to comprehensively evaluate the environmental performance of each building and structure including its aesthetic appeal.
Certification rank Property name
Rank S★★★★★
• AEON MALL Musashi Murayama
• AEON MALL Tsurumi Ryokuchi
• Higashi‐Totsuka Aurora City
Rank A★★★★
• AEON MALL Itami
DBJ Green Building Certification
The DBJ Green Building Certification system is a system established in April 2011 by DBJ, to support real estate properties that demonstrate environment and social considerations.As for the retail properties, DBJ Green Building Certification for retail facilities was established in October 2014, and four properties in our portfolio (Nara Family, mozo wonder city, Oyama Yuen HarvestWalk and GYRE) were awarded the certification for the first time in J‐REIT.
Certification rank Property name
Properties with exceptionally high environmental & social awareness
• Nara Family
• mozo wonder city
• Abiiko Shopping Plaza
Properties with excellentenvironmental
& social awareness
• Oyama Yuen Harvest Walk
• KAWASAKI Le FRONT
Properties with high environmental &social
awareness • GYRE

The contents of this document, including summary notes, quotes, data and other information, are provided solely for informational purposes and not intended for the purpose of soliciting investment in, or as a recommendation to purchase or sell, any specific products. Please be aware that matters described herein may change or cease to exist without prior notice of any kind. This document contains forward-looking statements and anticipations of future results, based on current assumptions and beliefs in light of currently available information and resources. Risks and uncertainties, both known and unknown, including those relating to the future performance of the retail market in Japan, interest rate fluctuations, competitive scenarios, and changing regulations or taxations, may cause performance to be materially different from those explicitly or implicitly expressed in this document. With respect to any and all terms herein, including without limitation, this document, the information provided is intended to be thorough. However, no absolute assurance or warranties are given with respect to the accuracy or completeness thereof.
Unless otherwise specified, this document was created based on Japanese accounting system. Neither JRF nor Mitsubishi Corp.-UBS Realty Inc. (MCUBSR) shall be liable for any errors, inaccuracies, loss or damage, or for any actions taken in reliance thereon, or undertake any obligation to publicly update the
information contained in this document after the date of this document.
Disclaimer
Asset Management Company: Mitsubishi Corp.‐UBS Realty Inc. (Financial Instrument Firm under License No. 403 of the Director of Kanto Local Finance Bureau)