Embed Size (px)
Citation preview

Performance Review for Fiscal Period Ended September 30, 2016
Japan Real Estate Investment Corporation
November 16, 2016

I would like to express our sincere appreciation that JRE Investment
Corporation successfully marked its 15th anniversary on September 2016
with your support. We look forward to your continued patronage.
1© Japan Real Estate Asset Management Co., Ltd. All Rights Reserved.
Japan Real Estate Asset Management Co., Ltd.Naoki Umeda, President & CEO
Message from President & CEO
001
002
003
004
005
006
007
Summary
Financial Results for Sep. ’16 Period
Performance Forecasts for Mar. and Sep. ’17 Period
Internal Growth
External Growth
Appraisal Values
Financial Condition
2© Japan Real Estate Asset Management Co., Ltd. All Rights Reserved.
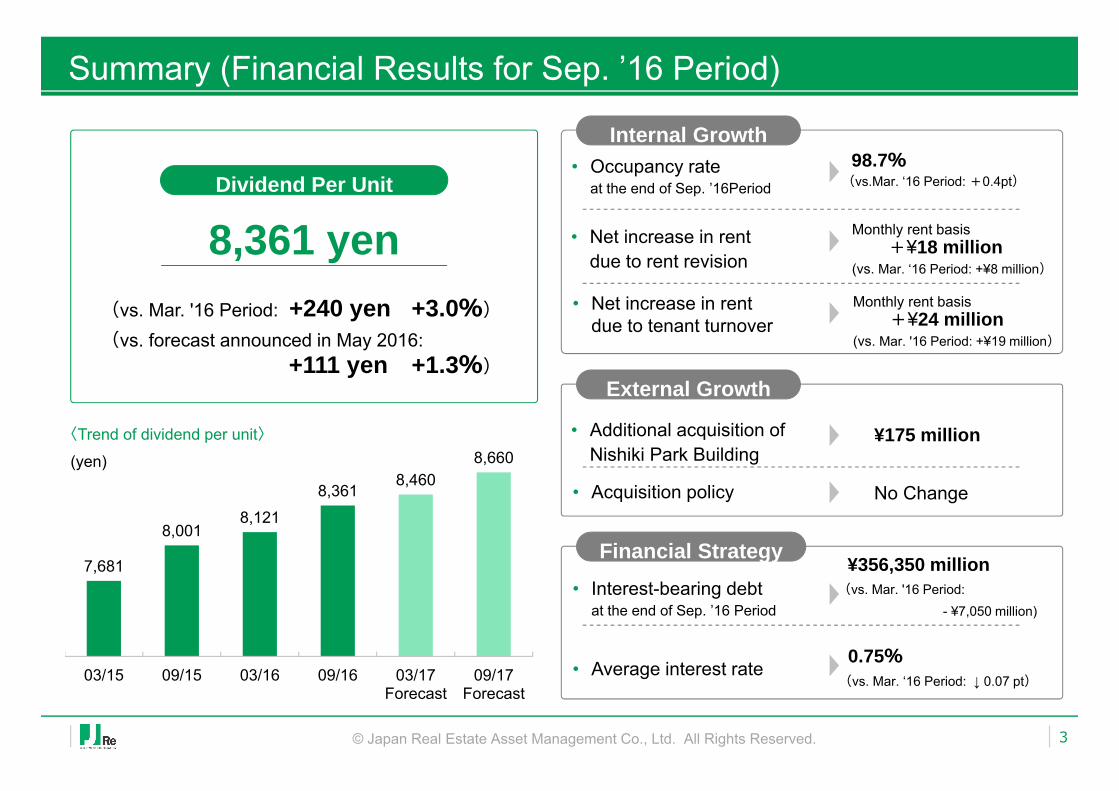
0.75%(vs. Mar. ‘16 Period: ↓ 0.07 pt)
Summary (Financial Results for Sep. ’16 Period)
3© Japan Real Estate Asset Management Co., Ltd. All Rights Reserved.
Internal Growth
External Growth
Financial Strategy
98.7%(vs.Mar. ‘16 Period: +0.4pt)
Monthly rent basis +¥18 million
(vs. Mar. ‘16 Period: +¥8 million)
• Occupancy rateat the end of Sep. ’16Period
• Net increase in rentdue to rent revision
• Net increase in rentdue to tenant turnover
• Additional acquisition of Nishiki Park Building
¥175 million
• Acquisition policy No Change
• Interest-bearing debtat the end of Sep. ’16 Period
Monthly rent basis +¥24 million
(vs. Mar. '16 Period: +¥19 million)
• Average interest rate
¥356,350 million(vs. Mar. '16 Period:
- ¥7,050 million)
Dividend Per Unit
8,361 yen(vs. Mar. '16 Period: +240 yen +3.0%)(vs. forecast announced in May 2016:
+111 yen +1.3%)
7,681
8,001 8,121
8,361 8,460
8,660
03/15 09/15 03/16 09/16 03/17Forecast
09/17Forecast
〈Trend of dividend per unit〉(yen)
Summary (Performance Forecast for Mar. and Sep. ’17 Period)
4© Japan Real Estate Asset Management Co., Ltd. All Rights Reserved.
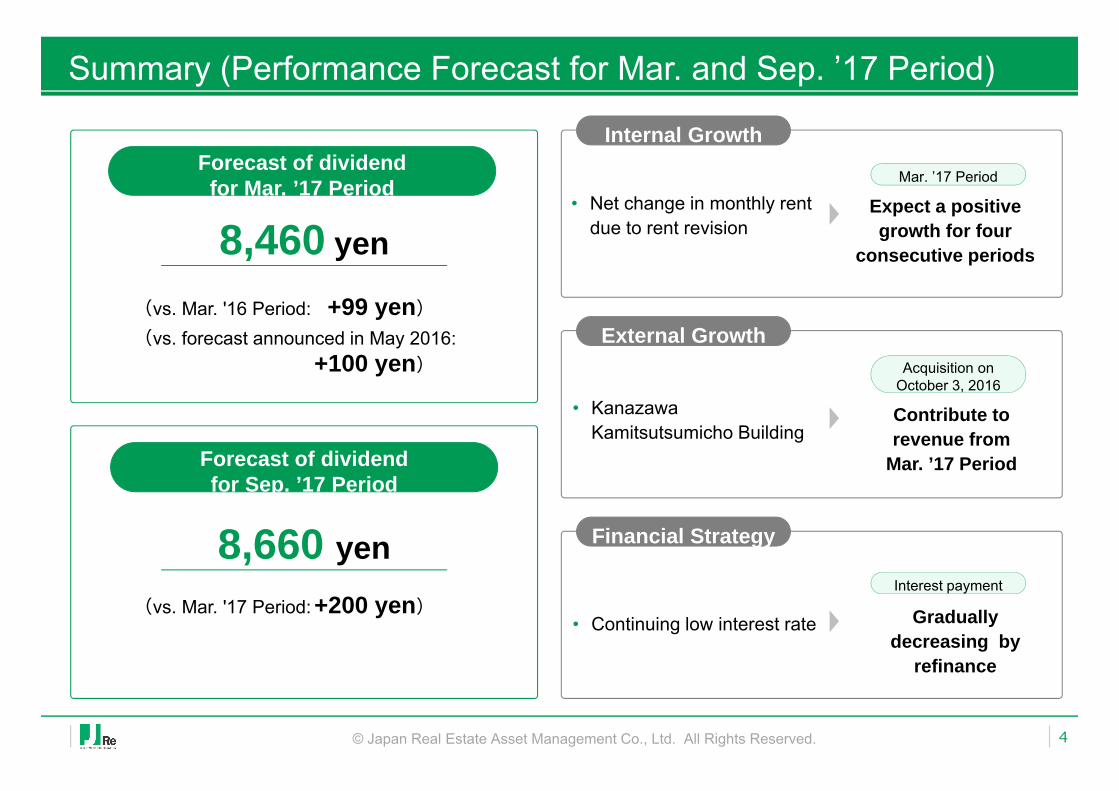
Forecast of dividend for Mar. ’17 Period
8,460 yen
Forecast of dividendfor Sep. ’17 Period
8,660 yen
• Net change in monthly rent due to rent revision
Expect a positive growth for four
consecutive periods
Mar. ’17 Period
• Kanazawa Kamitsutsumicho Building
Contribute to revenue from
Mar. ’17 Period
Acquisition on October 3, 2016
• Continuing low interest rate Gradually decreasing by
refinance
Interest payment
Financial Strategy
External Growth
Internal Growth
(vs. Mar. '16 Period: +99 yen)(vs. forecast announced in May 2016:
+100 yen)
(vs. Mar. '17 Period: +200 yen)
001
002
003
004
005
006
007
Summary
Financial Results for Sep. ’16 Period
Performance Forecasts for Mar. and Sep. ’17 Period
Internal Growth
External Growth
Appraisal Values
Financial Condition
5© Japan Real Estate Asset Management Co., Ltd. All Rights Reserved.
Financial Results for Sep. ’16 Period
© Japan Real Estate Asset Management Co., Ltd. All Rights Reserved. 6
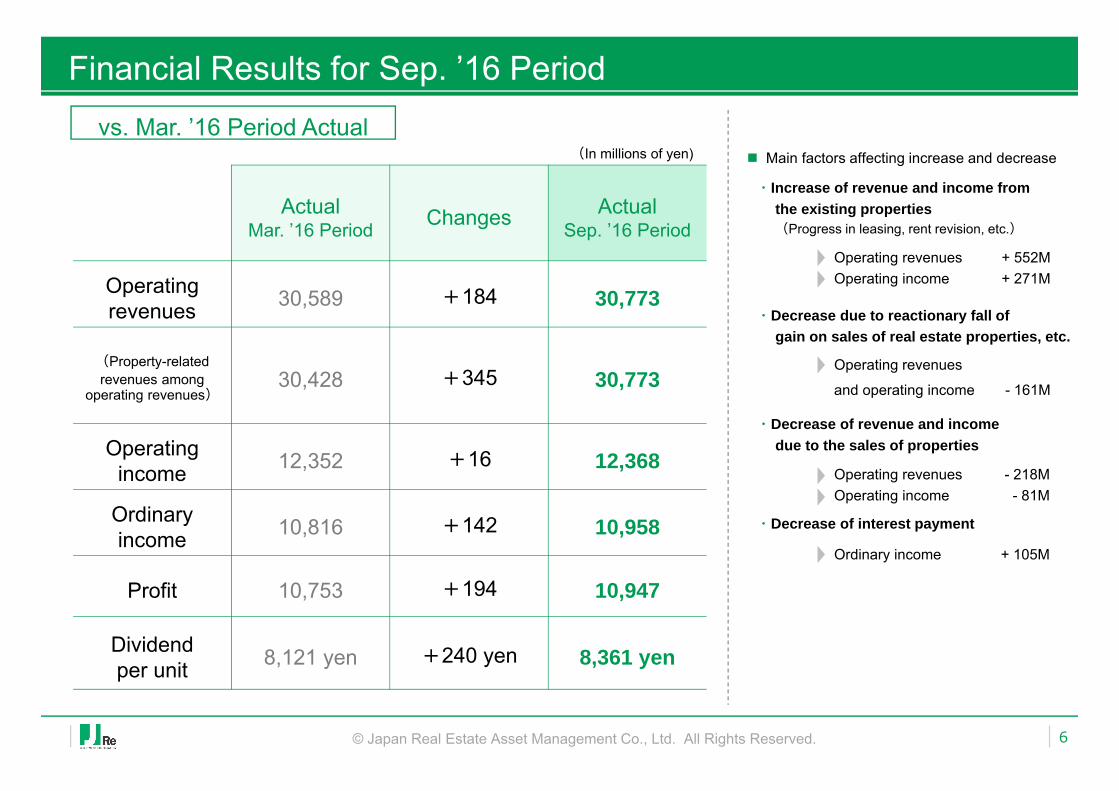
ActualMar. ’16 Period Changes Actual
Sep. ’16 Period
Operatingrevenues 30,589 +184 30,773
(Property-related revenues among
operating revenues)30,428 +345 30,773
Operating income 12,352 +16 12,368
Ordinary income 10,816 +142 10,958
Profit 10,753 +194 10,947
Dividend per unit 8,121 yen +240 yen 8,361 yen
(In millions of yen)vs. Mar. ’16 Period Actual
Main factors affecting increase and decrease
・Increase of revenue and income fromthe existing properties(Progress in leasing, rent revision, etc.)
Operating revenues + 552MOperating income + 271M
・Decrease due to reactionary fall ofgain on sales of real estate properties, etc.
Operating revenues
and operating income - 161M
・Decrease of revenue and incomedue to the sales of properties
Operating revenues - 218MOperating income - 81M
・Decrease of interest payment
Ordinary income + 105M
Financial Results for Sep. ’16 Period
© Japan Real Estate Asset Management Co., Ltd. All Rights Reserved. 7
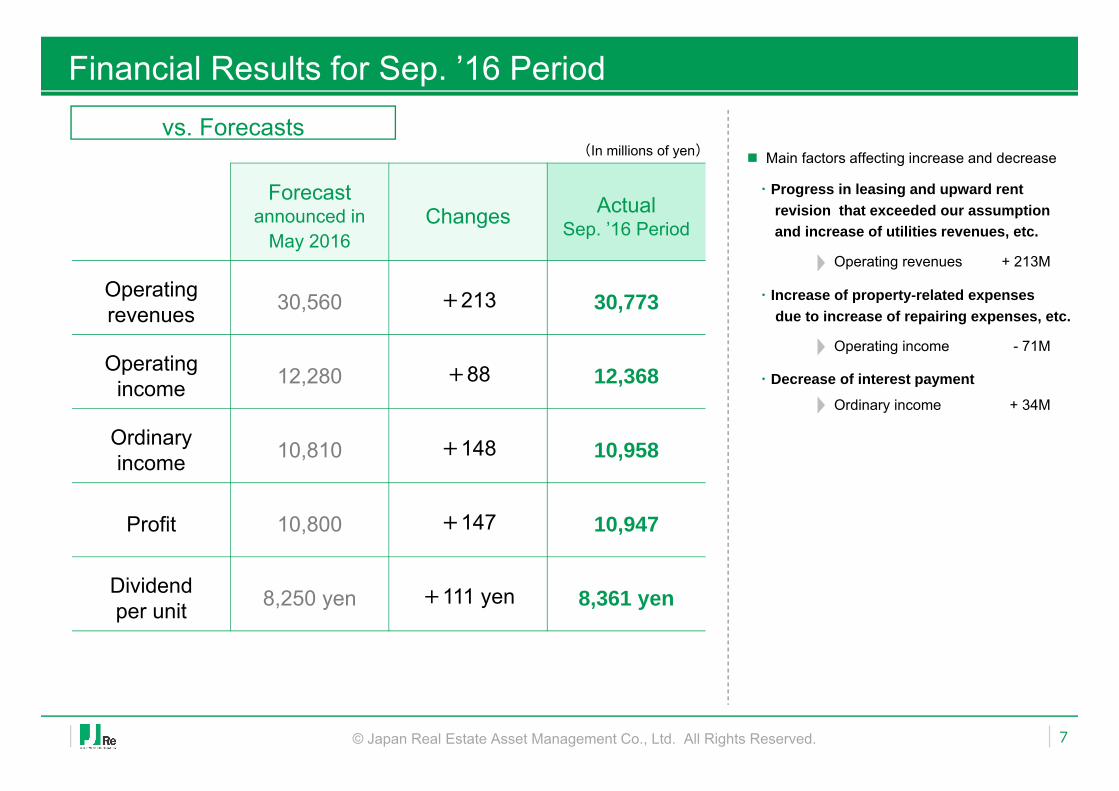
Forecastannounced in
May 2016Changes Actual
Sep. ’16 Period
Operating revenues 30,560 +213 30,773
Operating income 12,280 +88 12,368
Ordinary income 10,810 +148 10,958
Profit 10,800 +147 10,947
Dividend per unit 8,250 yen +111 yen 8,361 yen
(In millions of yen)vs. Forecasts
・Progress in leasing and upward rent revision that exceeded our assumption and increase of utilities revenues, etc.
・Increase of property-related expensesdue to increase of repairing expenses, etc.
・Decrease of interest payment
Main factors affecting increase and decrease
Operating revenues + 213M
Operating income - 71M
Ordinary income + 34M
001
002
003
004
005
006
007
Summary
Financial Results for Sep. ’16 Period
Performance Forecasts for Mar. and Sep. ’17 Period
Internal Growth
External Growth
Appraisal Values
Financial Condition
8© Japan Real Estate Asset Management Co., Ltd. All Rights Reserved.
Performance Forecast for Mar. ’17 Period
© Japan Real Estate Asset Management Co., Ltd. All Rights Reserved. 9
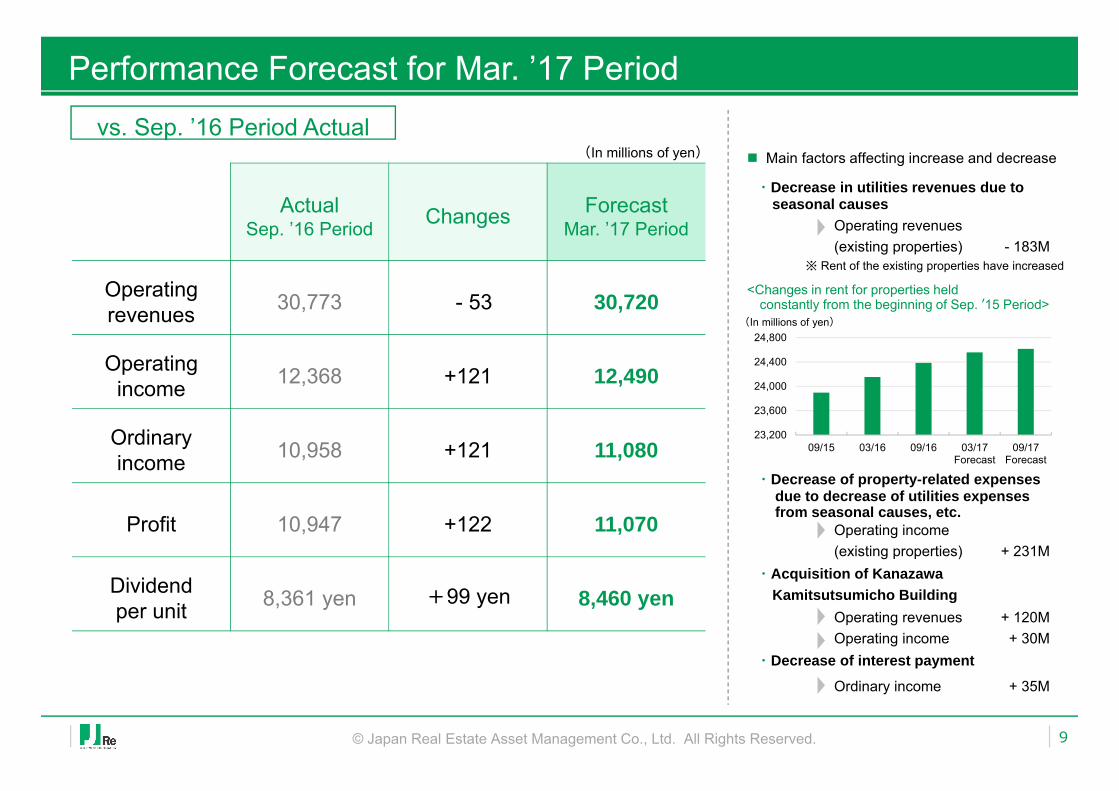
ActualSep. ’16 Period Changes Forecast
Mar. ’17 Period
Operating revenues 30,773 - 53 30,720
Operating income 12,368 +121 12,490
Ordinaryincome 10,958 +121 11,080
Profit 10,947 +122 11,070
Dividendper unit 8,361 yen +99 yen 8,460 yen
(In millions of yen)vs. Sep. ’16 Period Actual
<Changes in rent for properties heldconstantly from the beginning of Sep. ʼ15 Period>
23,200
23,600
24,000
24,400
24,800
09/15 03/16 09/16 03/17Forecast
09/17Forecast
(In millions of yen)
※ Rent of the existing properties have increased
・Decrease in utilities revenues due toseasonal causes
Operating revenues(existing properties) - 183M
・Decrease of property-related expensesdue to decrease of utilities expensesfrom seasonal causes, etc.
Operating income(existing properties) + 231M
・Acquisition of KanazawaKamitsutsumicho Building
Operating revenues + 120MOperating income + 30M
・Decrease of interest payment
Ordinary income + 35M
Main factors affecting increase and decrease
Performance Forecast for Sep. ’17 Period
© Japan Real Estate Asset Management Co., Ltd. All Rights Reserved. 10
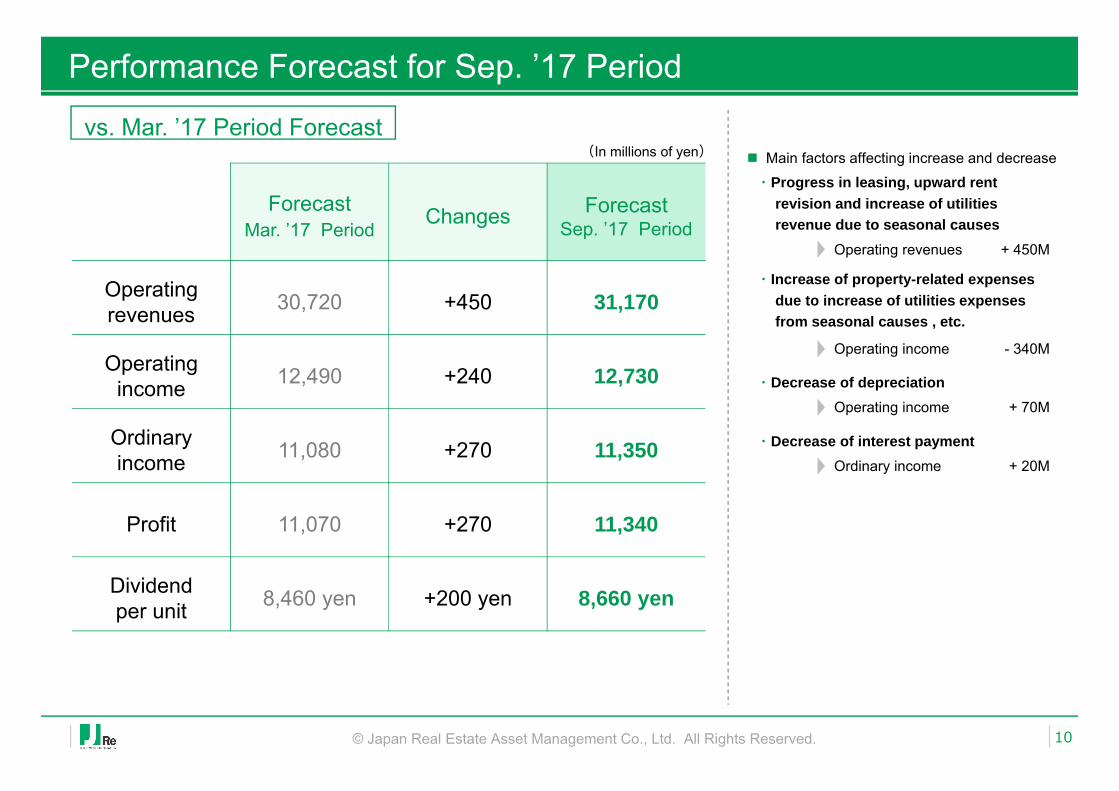
ForecastMar. ’17 Period
Changes ForecastSep. ’17 Period
Operating revenues 30,720 +450 31,170
Operating income 12,490 +240 12,730
Ordinary income 11,080 +270 11,350
Profit 11,070 +270 11,340
Dividendper unit 8,460 yen +200 yen 8,660 yen
(In millions of yen)vs. Mar. ’17 Period Forecast
・Progress in leasing, upward rent revision and increase of utilitiesrevenue due to seasonal causes
Operating revenues + 450M
・Increase of property-related expensesdue to increase of utilities expenses from seasonal causes , etc.
Operating income - 340M
・Decrease of depreciationOperating income + 70M
・Decrease of interest paymentOrdinary income + 20M
Main factors affecting increase and decrease
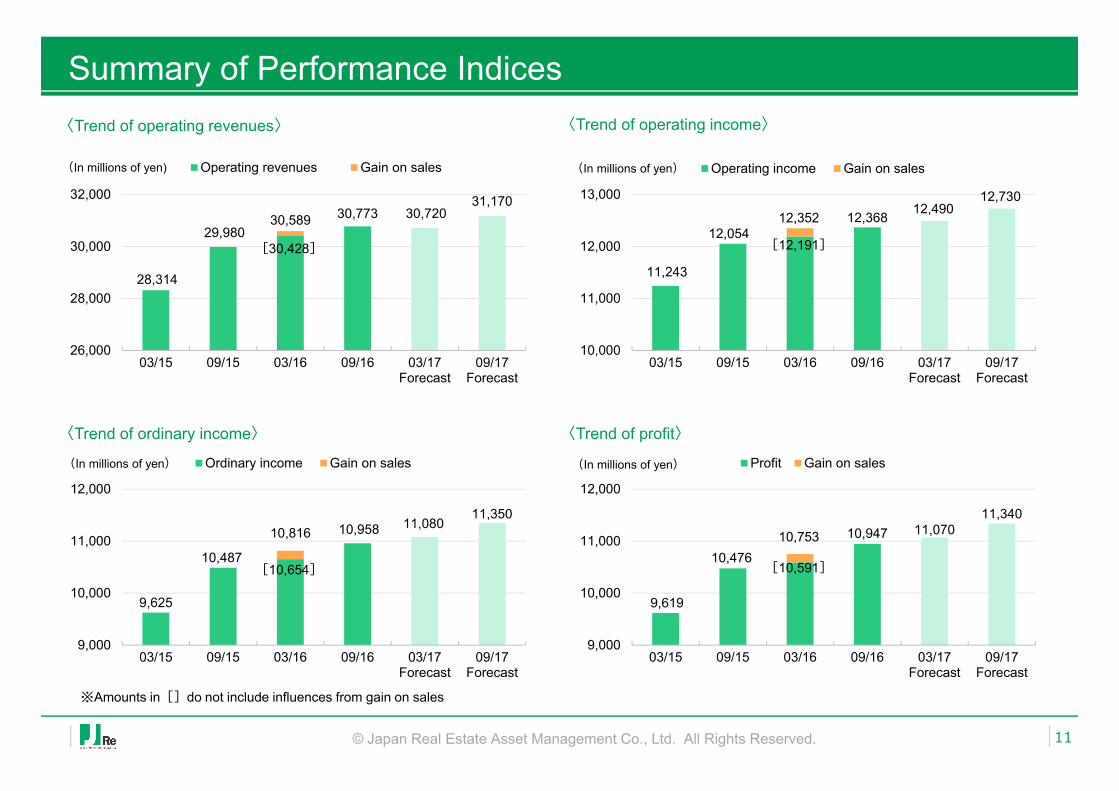
9,625
10,487
10,958 11,08011,350
9,000
10,000
11,000
12,000
03/15 09/15 03/16 09/16 03/17Forecast
09/17Forecast
Ordinary income Gain on sales
28,314
29,98030,773 30,720
31,170
26,000
28,000
30,000
32,000
03/15 09/15 03/16 09/16 03/17Forecast
09/17Forecast
Operating revenues Gain on sales
11,243
12,05412,368 12,490
12,730
10,000
11,000
12,000
13,000
03/15 09/15 03/16 09/16 03/17Forecast
09/17Forecast
Operating income Gain on sales
9,619
10,476
10,947 11,07011,340
9,000
10,000
11,000
12,000
03/15 09/15 03/16 09/16 03/17Forecast
09/17Forecast
Profit Gain on sales
Summary of Performance Indices
© Japan Real Estate Asset Management Co., Ltd. All Rights Reserved. 11
(In millions of yen)
※Amounts in[]do not include influences from gain on sales
〈Trend of operating revenues〉 〈Trend of operating income〉
(In millions of yen)
〈Trend of ordinary income〉 〈Trend of profit〉
[30,428]
30,589
[12,191]
12,352
[10,654]
10,816
[10,591]
10,753
(In millions of yen) (In millions of yen)
001
002
003
004
005
006
007
Summary
Financial Results for Sep. ’16 Period
Performance Forecasts for Mar. and Sep. ’17 Period
Internal Growth
External Growth
Appraisal Values
Financial Condition
12© Japan Real Estate Asset Management Co., Ltd. All Rights Reserved.
Internal Growth
© Japan Real Estate Asset Management Co., Ltd. All Rights Reserved. 13
0.0
1.0
2.0
3.0
4.0
5.0
6.0
7.0
8.0
0
10,000
20,000
30,000
40,000
50,000
60,000
2005 2006 2007 2008 2009 2010 2011 2012 2013 2014 2015 2016
Grade A rent Grade A-Minus rentGrade B rent Vacancy rate in Tokyo central 5 wards
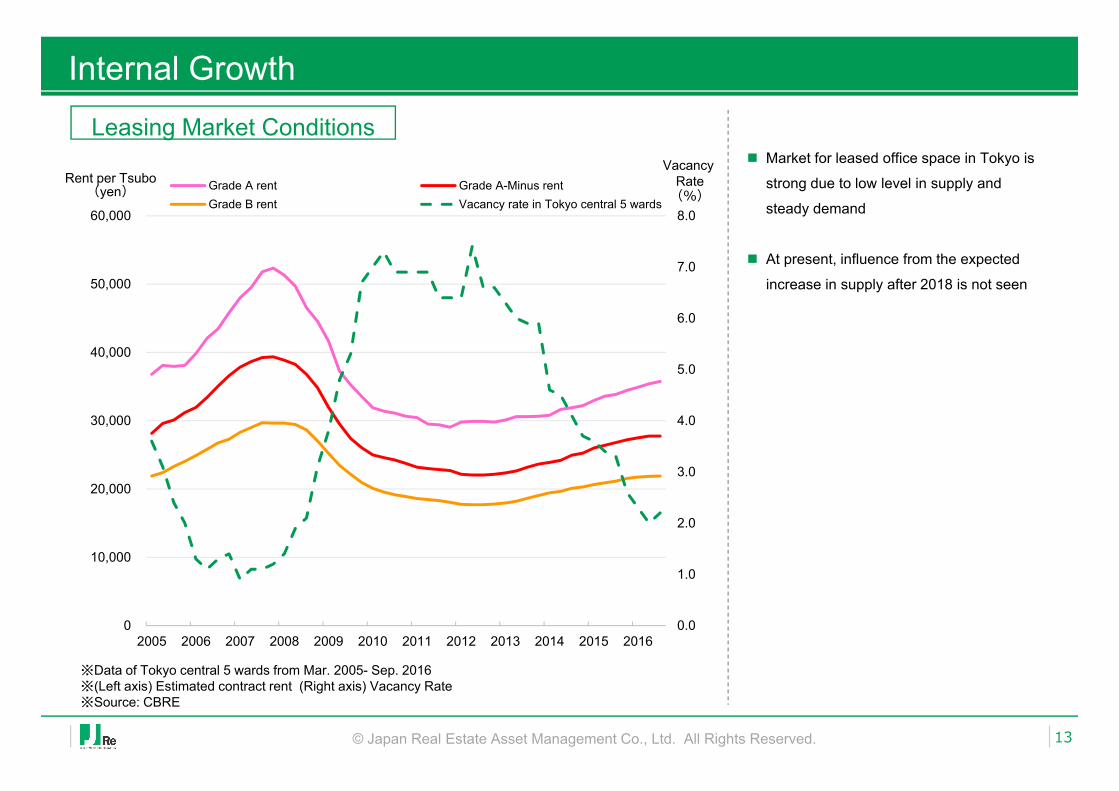
Leasing Market Conditions
Rent per Tsubo(yen)
Vacancy Rate
(%)
※Data of Tokyo central 5 wards from Mar. 2005- Sep. 2016※(Left axis) Estimated contract rent (Right axis) Vacancy Rate※Source: CBRE
Market for leased office space in Tokyo is
strong due to low level in supply and
steady demand
At present, influence from the expected
increase in supply after 2018 is not seen
Internal Growth
© Japan Real Estate Asset Management Co., Ltd. All Rights Reserved. 14
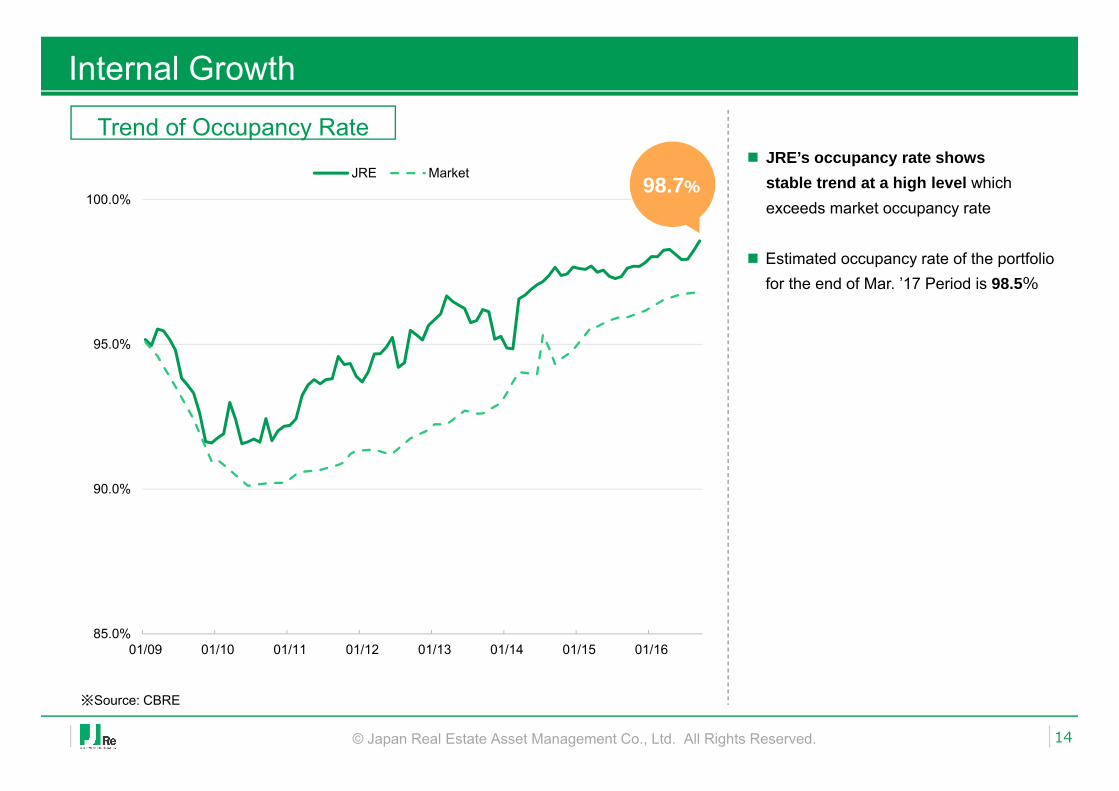
Trend of Occupancy Rate JRE’s occupancy rate shows
stable trend at a high level whichexceeds market occupancy rate
Estimated occupancy rate of the portfoliofor the end of Mar. ’17 Period is 98.5%
※Source: CBRE
85.0%
90.0%
95.0%
100.0%
01/09 01/10 01/11 01/12 01/13 01/14 01/15 01/16
JRE Market98.7%
Internal Growth
© Japan Real Estate Asset Management Co., Ltd. All Rights Reserved. 15
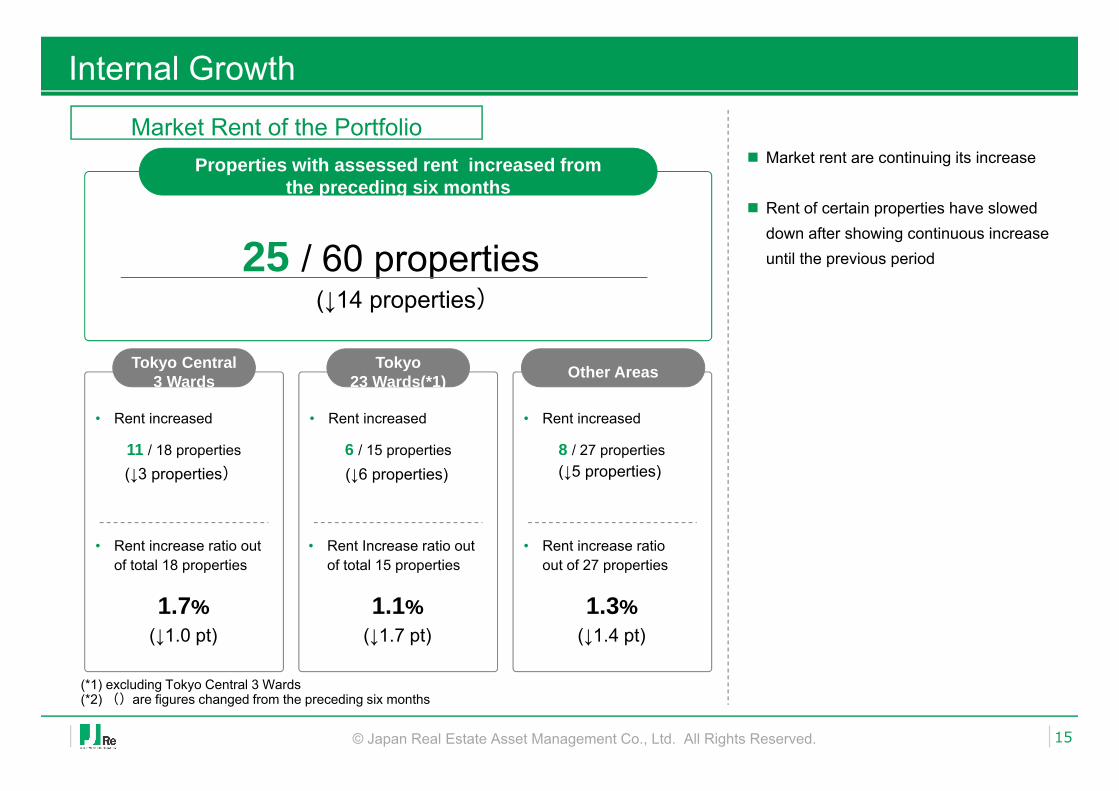
Market Rent of the Portfolio
(*1) excluding Tokyo Central 3 Wards(*2) ()are figures changed from the preceding six months
Market rent are continuing its increase
Rent of certain properties have slowed down after showing continuous increase until the previous period
Properties with assessed rent increased from the preceding six months
25 / 60 properties
Tokyo Central3 Wards
11 / 18 properties
1.7%
• Rent increased
• Rent increase ratio out of total 18 properties
(↓3 properties)
(↓1.0 pt)
Other Areas
8 / 27 properties
1.3%
• Rent increased
• Rent increase ratio out of 27 properties
(↓5 properties)
(↓1.4 pt)
Tokyo23 Wards(*1)
6 / 15 properties
1.1%
• Rent increased
• Rent Increase ratio out of total 15 properties
(↓6 properties)
(↓1.7 pt)
(↓14 properties)
Internal Growth
© Japan Real Estate Asset Management Co., Ltd. All Rights Reserved. 16
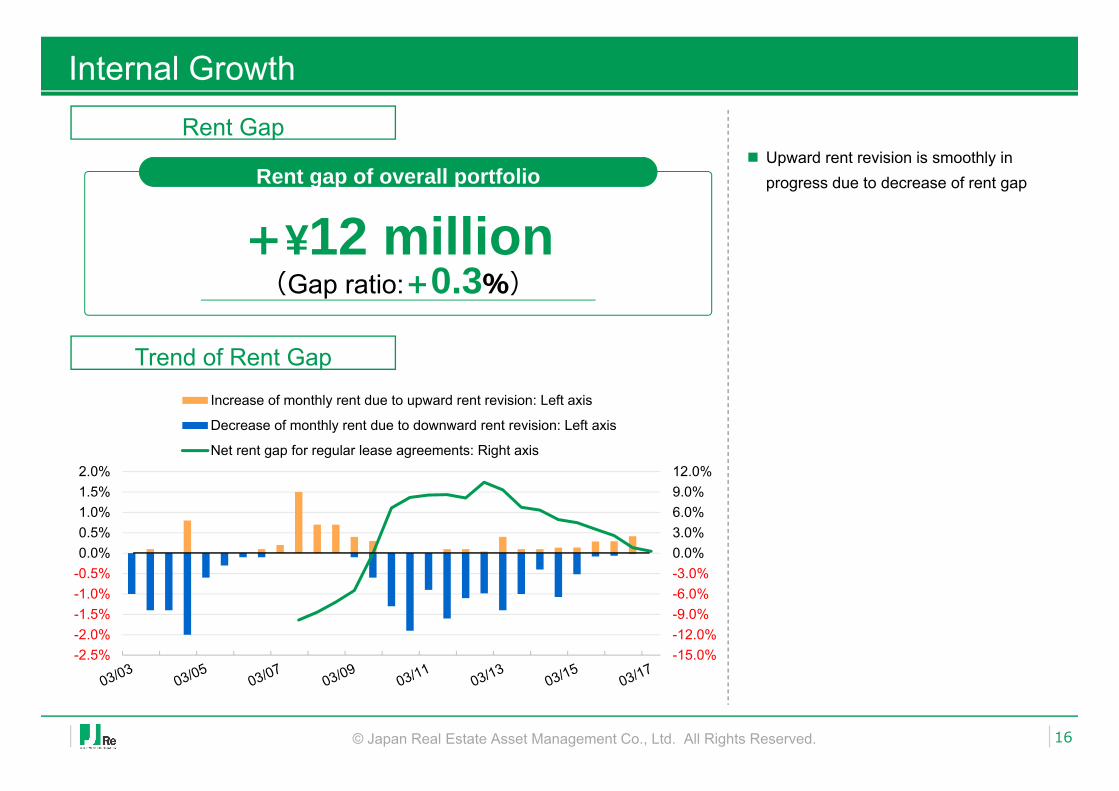
Rent Gap
Trend of Rent Gap
Upward rent revision is smoothly in progress due to decrease of rent gapRent gap of overall portfolio
+¥12 million(Gap ratio:+0.3%)
-15.0%-12.0%-9.0%-6.0%-3.0%0.0%3.0%6.0%9.0%12.0%
-2.5%-2.0%-1.5%-1.0%-0.5%0.0%0.5%1.0%1.5%2.0%
Increase of monthly rent due to upward rent revision: Left axis
Decrease of monthly rent due to downward rent revision: Left axis
Net rent gap for regular lease agreements: Right axis
(Increase from Mar. ’16 Period: +¥44 million +1.0%)
Internal Growth
© Japan Real Estate Asset Management Co., Ltd. All Rights Reserved. 17
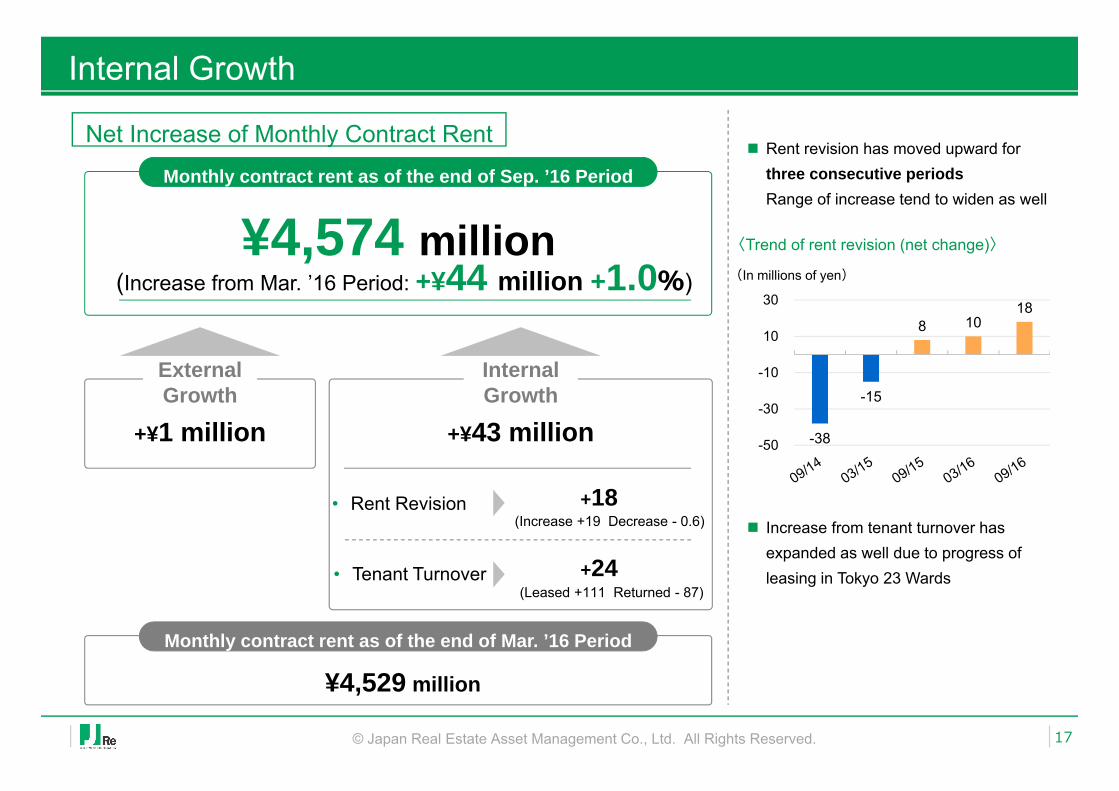
Net Increase of Monthly Contract Rent
Monthly contract rent as of the end of Sep. ’16 Period
¥4,574 million
Rent revision has moved upward for three consecutive periodsRange of increase tend to widen as well
Increase from tenant turnover has expanded as well due to progress of leasing in Tokyo 23 Wards
Monthly contract rent as of the end of Mar. ’16 Period
¥4,529 million
+¥1 million
External Growth
Internal Growth
+¥43 million
+18(Increase +19 Decrease - 0.6)
+24• Tenant Turnover(Leased +111 Returned - 87)
-38
-15
8 10 18
-50
-30
-10
10
30
〈Trend of rent revision (net change)〉(In millions of yen)
• Rent Revision
001
002
003
004
005
006
007
Summary
Financial Results for Sep. ’16 Period
Performance Forecasts for Mar. and Sep. ’17 Period
Internal Growth
External Growth
Appraisal Values
Financial Condition
18© Japan Real Estate Asset Management Co., Ltd. All Rights Reserved.
External Growth
© Japan Real Estate Asset Management Co., Ltd. All Rights Reserved. 19
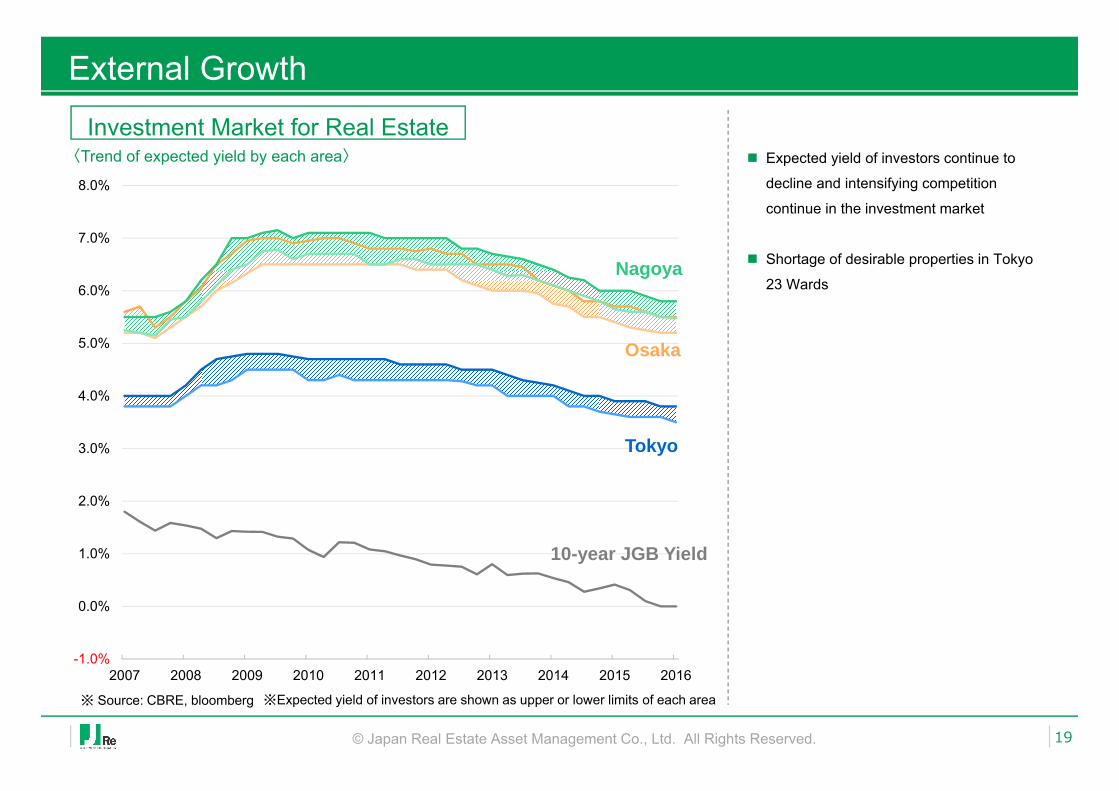
Investment Market for Real Estate
-1.0%
0.0%
1.0%
2.0%
3.0%
4.0%
5.0%
6.0%
7.0%
8.0%
2007 2008 2009 2010 2011 2012 2013 2014 2015 2016
Nagoya
Osaka
Tokyo
10-year JGB Yield
Expected yield of investors continue to
decline and intensifying competition
continue in the investment market
Shortage of desirable properties in Tokyo
23 Wards
〈Trend of expected yield by each area〉
※ Source: CBRE, bloomberg ※Expected yield of investors are shown as upper or lower limits of each area
External Growth
© Japan Real Estate Asset Management Co., Ltd. All Rights Reserved. 20
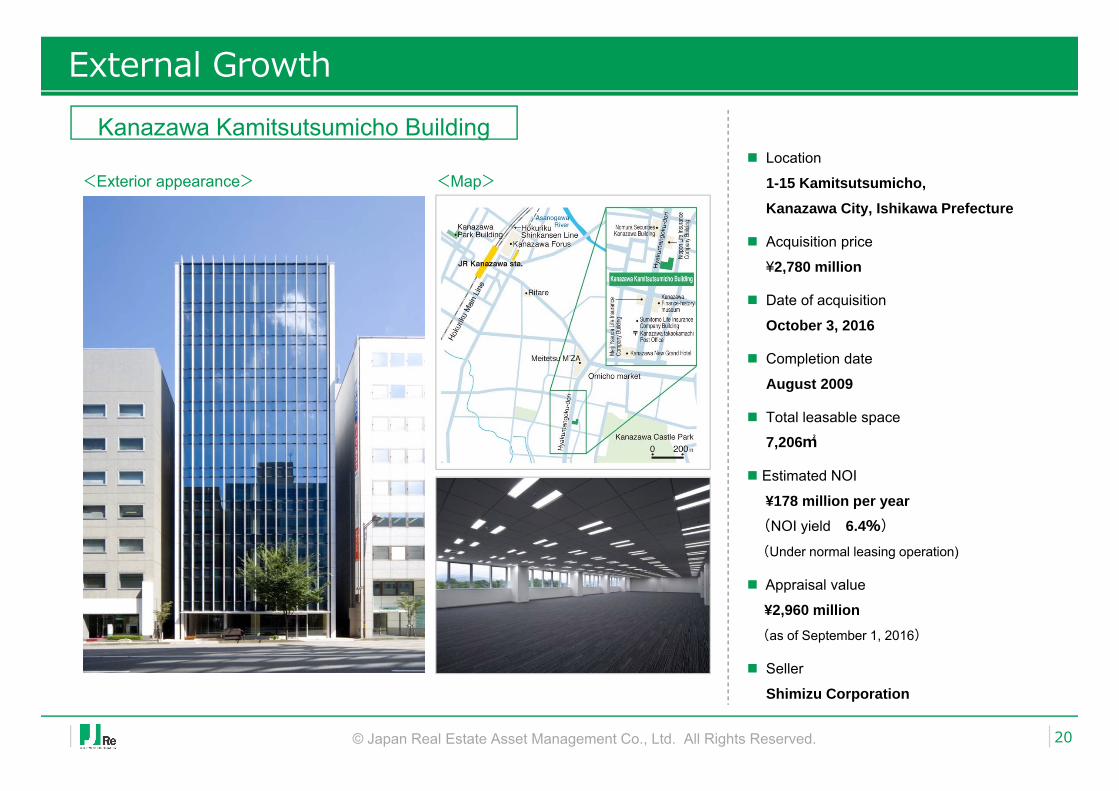
Kanazawa Kamitsutsumicho Building
<Exterior appearance> <Map> Location
1-15 Kamitsutsumicho, Kanazawa City, Ishikawa Prefecture
Acquisition price
¥2,780 million
Date of acquisition
October 3, 2016
Completion date
August 2009
Total leasable space
7,206㎡
Estimated NOI
¥178 million per year(NOI yield 6.4%)(Under normal leasing operation)
Appraisal value
¥2,960 million(as of September 1, 2016)
Seller
Shimizu Corporation
External Growth
© Japan Real Estate Asset Management Co., Ltd. All Rights Reserved. 21
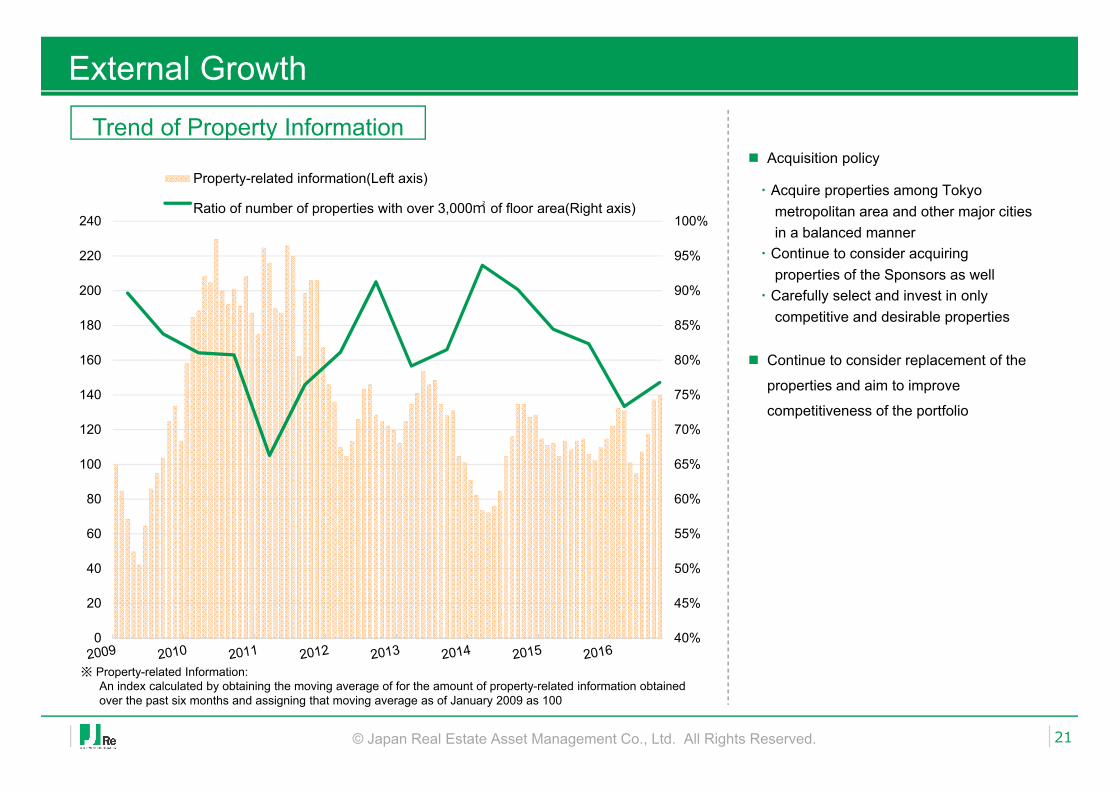
Trend of Property Information
40%
45%
50%
55%
60%
65%
70%
75%
80%
85%
90%
95%
100%
0
20
40
60
80
100
120
140
160
180
200
220
240
Property-related information(Left axis)
Ratio of number of properties with over 3,000㎡ of floor area(Right axis)
Acquisition policy
Continue to consider replacement of the
properties and aim to improve
competitiveness of the portfolio
※ Property-related Information:An index calculated by obtaining the moving average of for the amount of property-related information obtained over the past six months and assigning that moving average as of January 2009 as 100
・Acquire properties among Tokyometropolitan area and other major citiesin a balanced manner
・Continue to consider acquiringproperties of the Sponsors as well
・Carefully select and invest in onlycompetitive and desirable properties
001
002
003
004
005
006
007
Summary
Financial Results for Sep. ’16 Period
Performance Forecasts for Mar. and Sep. ’17 Period
Internal Growth
External Growth
Appraisal Values
Financial Condition
22© Japan Real Estate Asset Management Co., Ltd. All Rights Reserved.
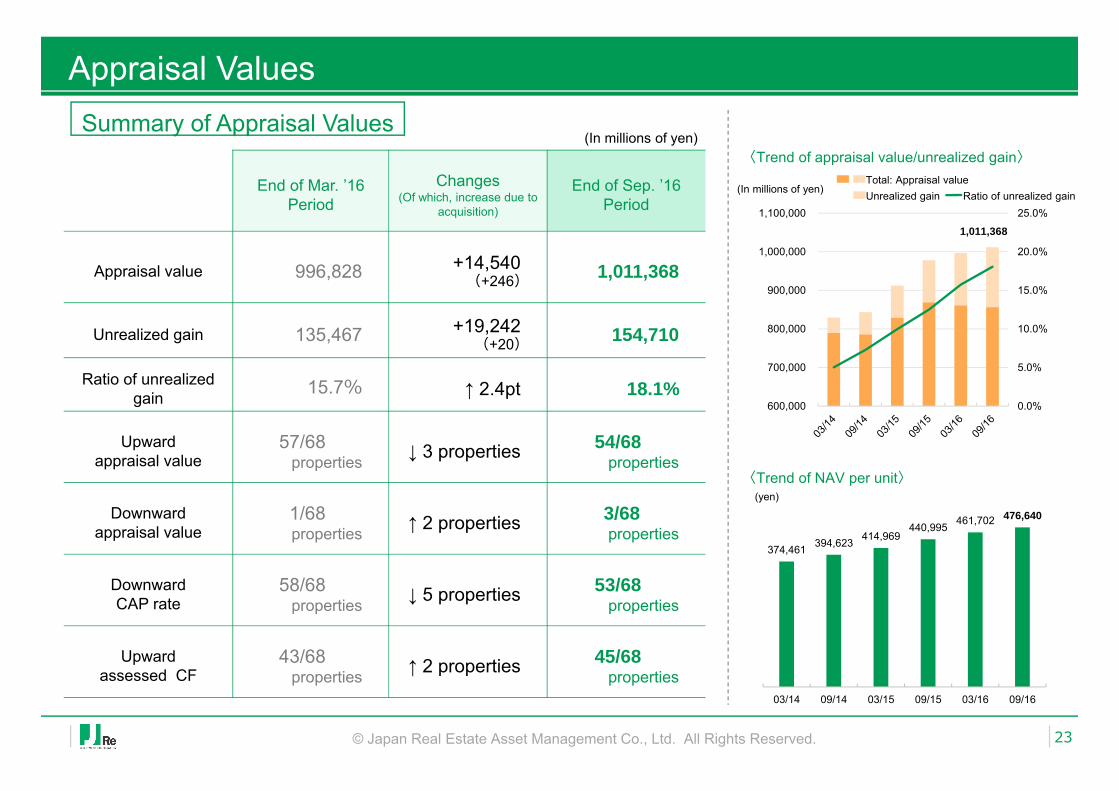
374,461 394,623 414,969 440,995 461,702 476,640
03/14 09/14 03/15 09/15 03/16 09/16
Appraisal Values
© Japan Real Estate Asset Management Co., Ltd. All Rights Reserved. 23
End of Mar. ’16 Period
Changes(Of which, increase due to
acquisition)
End of Sep. ’16 Period
Appraisal value 996,828 +14,540(+246) 1,011,368
Unrealized gain 135,467 +19,242(+20) 154,710
Ratio of unrealized gain 15.7% ↑ 2.4pt 18.1%
Upwardappraisal value
57/68properties ↓ 3 properties 54/68
properties
Downwardappraisal value
1/68properties ↑ 2 properties 3/68
properties
DownwardCAP rate
58/68properties ↓ 5 properties 53/68
properties
Upwardassessed CF
43/68properties ↑ 2 properties 45/68
properties
(In millions of yen)Summary of Appraisal Values
0.0%
5.0%
10.0%
15.0%
20.0%
25.0%
600,000
700,000
800,000
900,000
1,000,000
1,100,000
(In millions of yen)Total: Appraisal valueUnrealized gain Ratio of unrealized gain
〈Trend of NAV per unit〉
1,011,368
(yen)
〈Trend of appraisal value/unrealized gain〉
001
002
003
004
005
006
007
Summary
Financial Results for Sep. ’16 Period
Performance Forecasts for Mar. and Sep. ’17 Period
Internal Growth
External Growth
Appraisal Values
Financial Condition
24© Japan Real Estate Asset Management Co., Ltd. All Rights Reserved.
Financial Condition
© Japan Real Estate Asset Management Co., Ltd. All Rights Reserved. 25
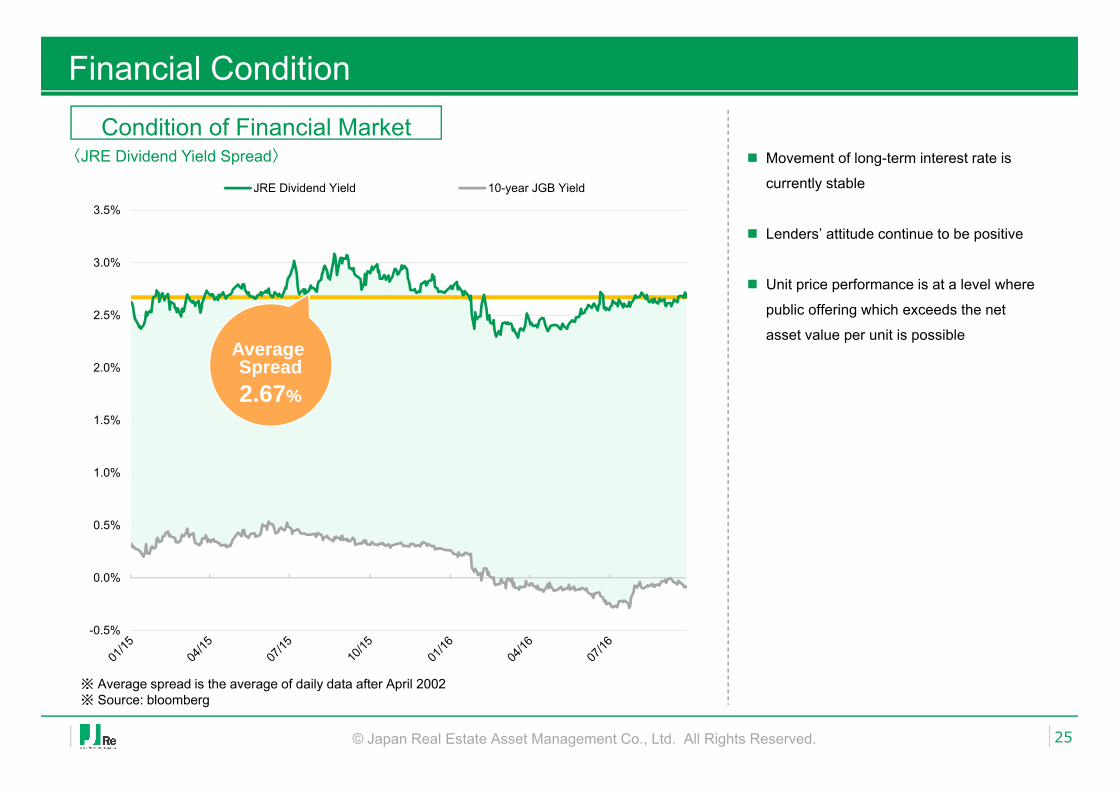
Condition of Financial Market
-0.5%
0.0%
0.5%
1.0%
1.5%
2.0%
2.5%
3.0%
3.5%
JRE Dividend Yield 10-year JGB Yield
Movement of long-term interest rate is
currently stable
Lenders’ attitude continue to be positive
Unit price performance is at a level where
public offering which exceeds the net
asset value per unit is possible
〈JRE Dividend Yield Spread〉
※ Average spread is the average of daily data after April 2002※ Source: bloomberg
Average Spread2.67%
Financial Condition
© Japan Real Estate Asset Management Co., Ltd. All Rights Reserved. 26
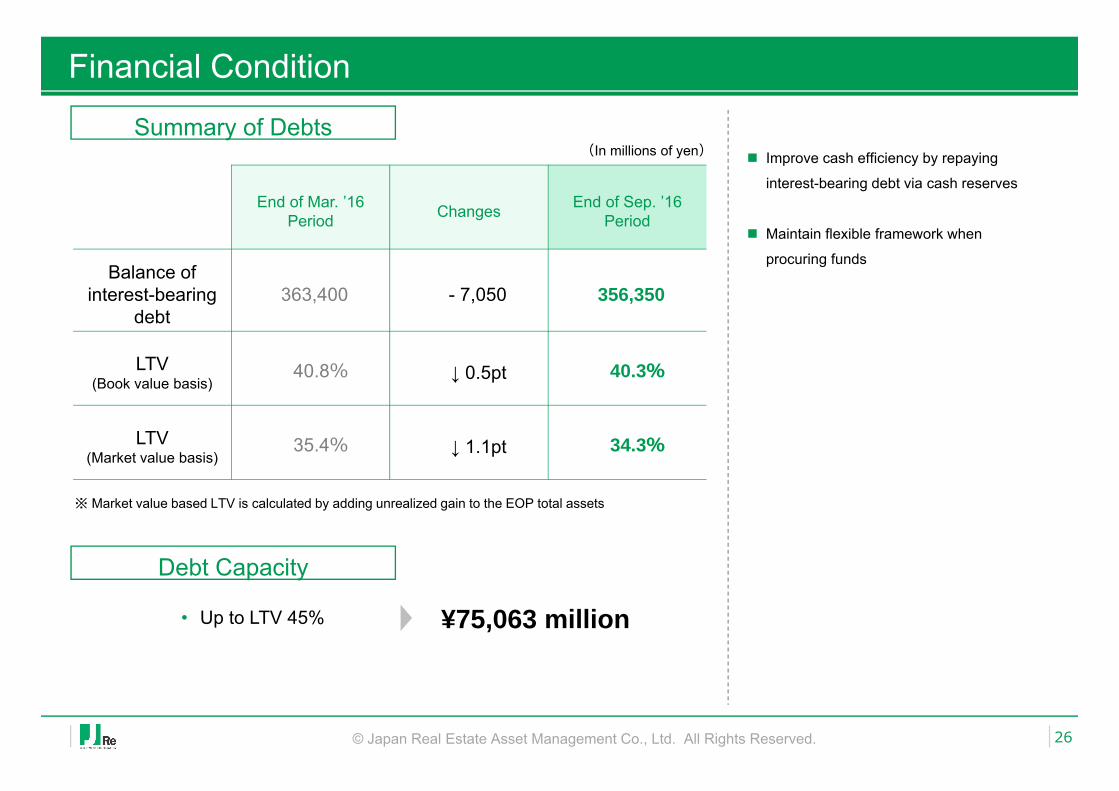
Summary of Debts
End of Mar. ’16 Period Changes End of Sep. ’16
Period
Balance of interest-bearing
debt363,400 - 7,050 356,350
LTV(Book value basis)
40.8% ↓ 0.5pt 40.3%
LTV(Market value basis)
35.4% ↓ 1.1pt 34.3%
(In millions of yen) Improve cash efficiency by repaying
interest-bearing debt via cash reserves
Maintain flexible framework when
procuring funds
Debt Capacity
¥75,063 million• Up to LTV 45%
※ Market value based LTV is calculated by adding unrealized gain to the EOP total assets
Financial Condition
© Japan Real Estate Asset Management Co., Ltd. All Rights Reserved. 27
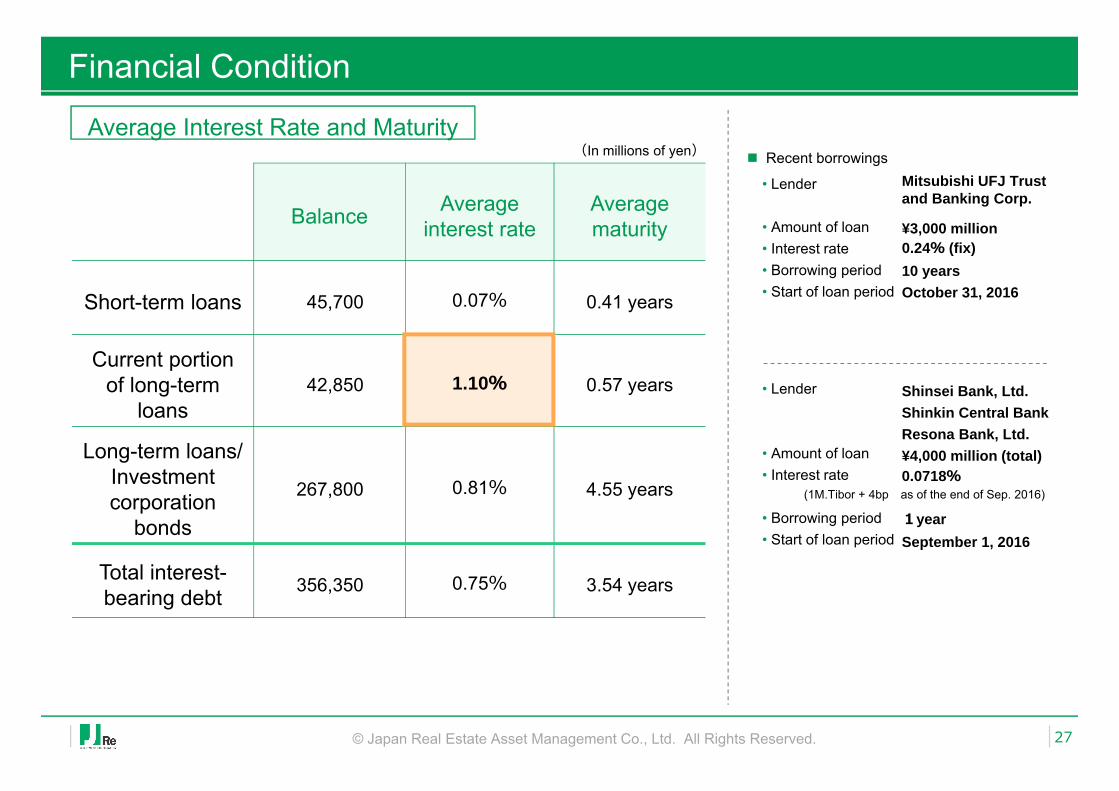
Average Interest Rate and Maturity
Balance Average interest rate
Average maturity
Short-term loans 45,700 0.07% 0.41 years
Current portion of long-term
loans42,850 1.10% 0.57 years
Long-term loans/Investmentcorporation
bonds
267,800 0.81% 4.55 years
Total interest-bearing debt 356,350 0.75% 3.54 years
(In millions of yen) Recent borrowings
Shinsei Bank, Ltd.Shinkin Central BankResona Bank, Ltd.¥4,000 million (total)0.0718%
1yearSeptember 1, 2016
• Lender
• Amount of loan• Interest rate• Borrowing period• Start of loan period
Mitsubishi UFJ Trust and Banking Corp.
¥3,000 million0.24% (fix)10 yearsOctober 31, 2016
(1M.Tibor + 4bp as of the end of Sep. 2016)
• Lender
• Amount of loan• Interest rate
• Borrowing period• Start of loan period
Financial Condition
© Japan Real Estate Asset Management Co., Ltd. All Rights Reserved. 28
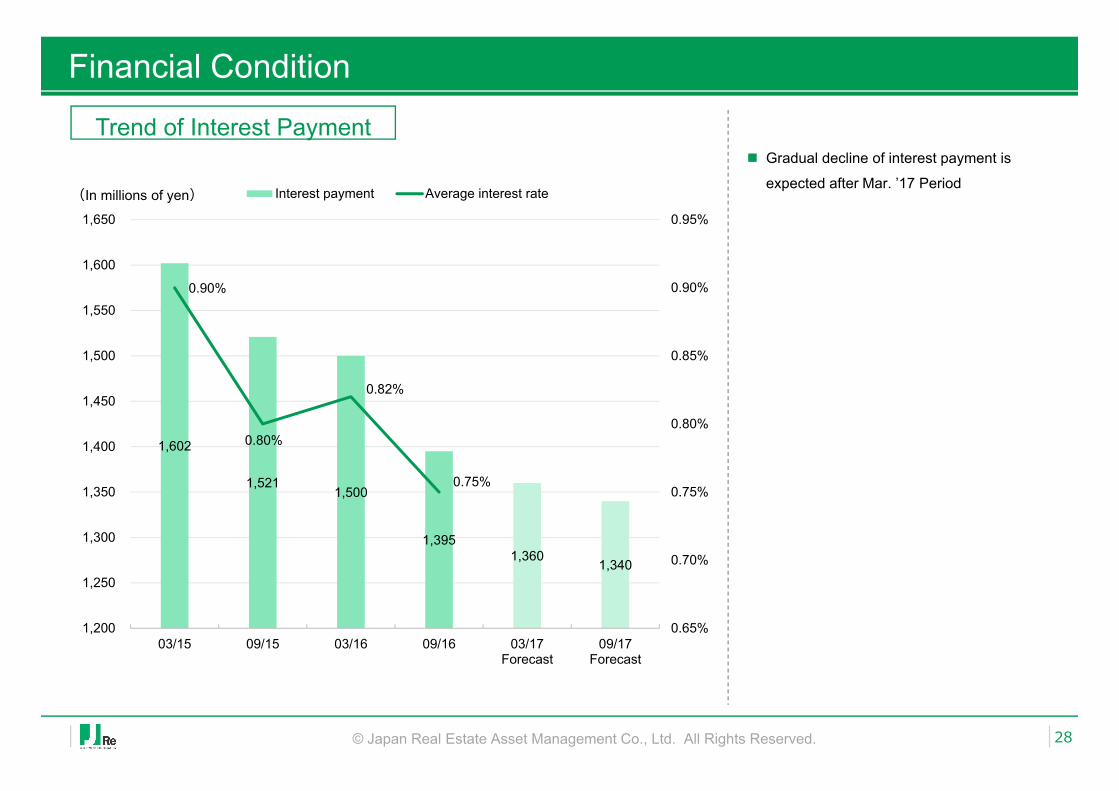
Trend of Interest Payment
1,602
1,521 1,500
1,395 1,360
1,340
0.90%
0.80%
0.82%
0.75%
0.65%
0.70%
0.75%
0.80%
0.85%
0.90%
0.95%
1,200
1,250
1,300
1,350
1,400
1,450
1,500
1,550
1,600
1,650
03/15 09/15 03/16 09/16 03/17Forecast
09/17Forecast
Interest payment Average interest rate(In millions of yen)
Gradual decline of interest payment is
expected after Mar. ’17 Period
Financial Condition
© Japan Real Estate Asset Management Co., Ltd. All Rights Reserved. 29
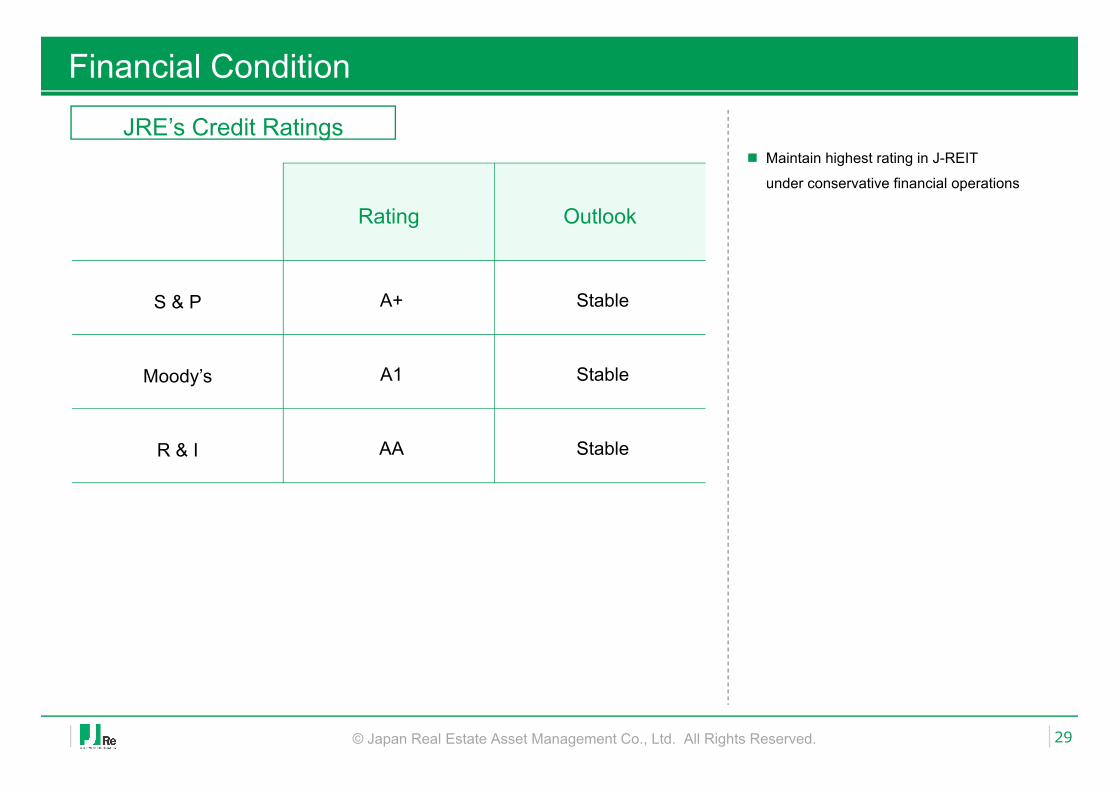
JRE’s Credit Ratings Maintain highest rating in J-REIT
under conservative financial operations
Rating Outlook
S & P A+ Stable
Moody’s A1 Stable
R & I AA Stable
© Japan Real Estate Asset Management Co., Ltd. All Rights Reserved. 30
Great shot! It’s right in the middle of the fairway.Trend of leasing market is slowly following.
Let’s make the second shot as a chance for birdie.
There is a cloud of large supply faraway.I don’t know if that will come closer,
but let’s earn our score while we can!
© Japan Real Estate Asset Management Co., Ltd. All Rights Reserved. 31
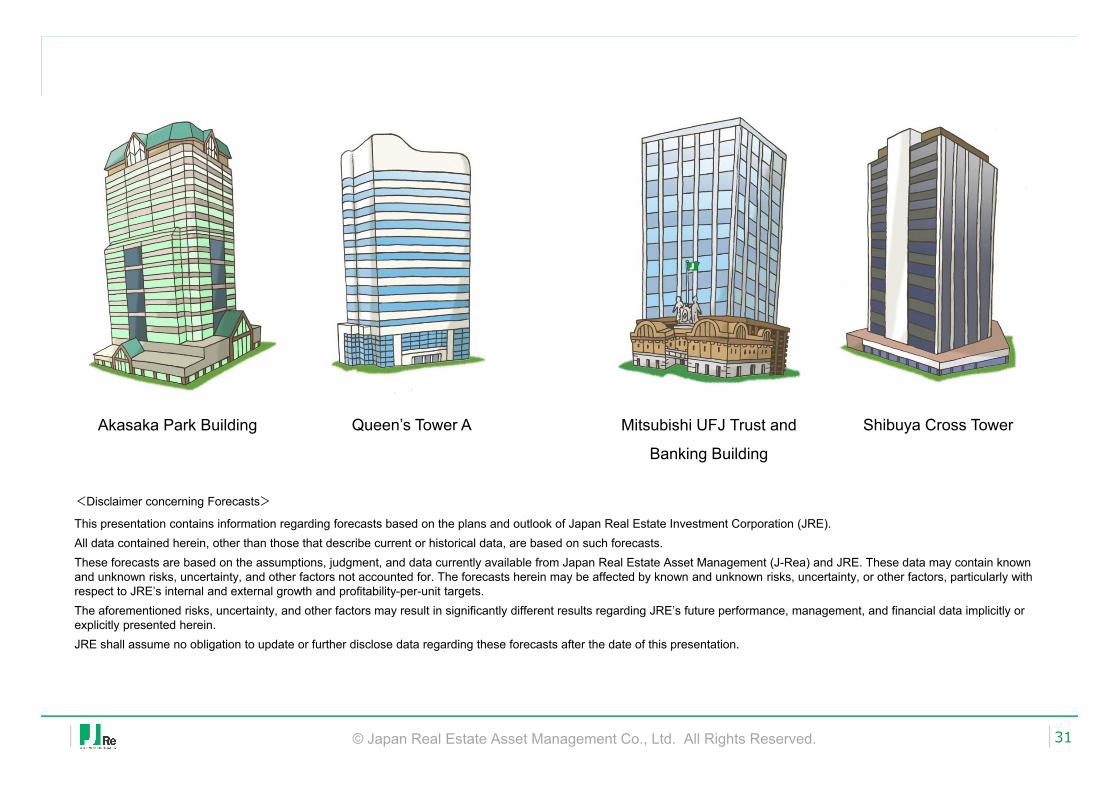
Akasaka Park Building Queen’s Tower A Mitsubishi UFJ Trust and
Banking Building
Shibuya Cross Tower
<Disclaimer concerning Forecasts>This presentation contains information regarding forecasts based on the plans and outlook of Japan Real Estate Investment Corporation (JRE). All data contained herein, other than those that describe current or historical data, are based on such forecasts. These forecasts are based on the assumptions, judgment, and data currently available from Japan Real Estate Asset Management (J-Rea) and JRE. These data may contain known and unknown risks, uncertainty, and other factors not accounted for. The forecasts herein may be affected by known and unknown risks, uncertainty, or other factors, particularly with respect to JRE’s internal and external growth and profitability-per-unit targets. The aforementioned risks, uncertainty, and other factors may result in significantly different results regarding JRE’s future performance, management, and financial data implicitly or explicitly presented herein. JRE shall assume no obligation to update or further disclose data regarding these forecasts after the date of this presentation.