Embed Size (px)
Citation preview

7/29/2019 Japan Crisis_Final Draft
http://slidepdf.com/reader/full/japan-crisisfinal-draft 1/43
Acknowledgements We extend our gratitude to BCIDS to give us the opportunity to research into the
Japan’s current crisis and its impact on the world
We thank our guide, Mrs Karishma Chawla for supporting us with the project and
providing us with critical insight into the topic and its direction.
We are grateful to the various people working in various financial institutions for
helping us acquire reports and research material which helped us add value to this
report.

7/29/2019 Japan Crisis_Final Draft
http://slidepdf.com/reader/full/japan-crisisfinal-draft 2/43
Japan Earthquake – 2011
1
Dedications
We dedicate this report to the people of Japan who have suffered from the terrible
calamity that shook their nation and also to those who are struggling to put their
lives back to normal.
We further make this dedication to our family and friends who have always
supported us through our education and other endeavors and always wished for our
success.
7/29/2019 Japan Crisis_Final Draft
http://slidepdf.com/reader/full/japan-crisisfinal-draft 3/43
What hit the Country – What the Country hit
2
Table of ContentsOverview .................................................................................................................................. 4
Introduction .............................................................................................................................
Risk and Risk Management ............................................................................................... 6
The 2011 Tōhoku Earthquake and its causes ......................................................... 7
The Japanese Economy .......................................................................................... 8
The 1995 Kobe Earthquake and its impact on the economy of Japan ................. 9
The impact on the economy of Japan of the 2011 Tohoku Earthquake ........... 9
The Japanese Stock Market ..............................................................................................10
Impact of the 1995 Kobe earthquake on Tokyo Stock Exchange .................................... 10
Impact of the 2011 Tohoku earthquake on Tokyo Stock Exchange ................................. 11
Forecast for the Nikkei 225 after the 2011 Tohoku Earthquake ..................................... 12
Impact on the Indian Markets ......................................................................................... 12
Comparison between BSE Sensex and Nikkei 225 .......................................................... 12
Impact of the earthquake on Insurance........................................................................14
Estimates of loss to insurance companies ....................................................................... 15
Losses incurred to the residential sector ..................................................................... 15
Losses incurred from loss of life .................................................................................. 16
Losses incurred from loss at sea and sea vessels ......................................................... 16
Losses incurred from loss to vehicles .......................................................................... 16
Losses incurred to international insurers .................................................................... 16
Impact on Japan’s currency –the Yen ...........................................................................18
Shift to Gold Exchange Standard ................................................................................. 18
Fixed value of the Yen to the US dollar and introduction to floating exchange rates . 18
Highly volatile decade for the Yen (1970 – 1980) ....................................................... 18
Weakening Yen (1980 – 1985) ..................................................................................... 19
Impact of Plaza Accord ................................................................................................ 19
Twin Disaster – Japanese Asset bubble and Kobe Earthquake .................................. 19
Deflation trap (2000 – 2007), US Crisis and Tohoku Earthquake 2011 ..................... 19
The Tohoku Sendai Earthquake and Tsunami ..................................................... 20
Japanese Yen fuelled by Earthquake ................................................................ 20
Dollar hits all time low against earthquake ...................................................... 21
7/29/2019 Japan Crisis_Final Draft
http://slidepdf.com/reader/full/japan-crisisfinal-draft 4/43
Japan Earthquake – 2011
3
What drove the Yen’s strength?........................................................................ 21
Difference with Yen strengthening following Kobe earthquake in 1995 ............ 22
Yen stabilizes after hitting record high ..................................................................... 23
What next for the Yen ............................................................................................ 24
Impact of Earthquake on commodity ........................................................................... 26
Impact of 2011 earthquake on steel and base metals .......................................... 26
Production impact on steel ............................................................................... 26
Consumption impact on steel ........................................................................... 27
Impact on iron ore and coking coal .................................................................. 27
Would Indian steel benefit from the crisis?...................................................... 28
Impact on base metals ...................................................................................... 28
Impact on crude oil ........................................................................................... 29
Impact on Liquid Natural Gas .......................................................................... 30
Impact on construction materials ..................................................................... 31
Impact on information technology ................................................................... 32
Impact of Japan’s Import and Export........................................................................... 34
Annexure I – Japan’s stock market post Kobe 1995..................................................35
Annexure II – Trends of Nikkei 225 .............................................................................. 36
Annexure III – Trends of BSE Sensex........................................................................... 38
Annexure IV – Japanese Yen charts and graphs........................................................39
Bibliography .........................................................................................................................41
7/29/2019 Japan Crisis_Final Draft
http://slidepdf.com/reader/full/japan-crisisfinal-draft 5/43
What hit the Country – What the Country hit
4
Overview Japan is one of the more influential countries in the world. With its participation in
the G - 20 and the ASEAN, it influences a lot of the world trade. It is one of the few
countries in the world that has a positive balance of payments.
Given that, it is also a country prone to natural calamities due to its geographical
positioning. Japan has faced many earthquakes in the past but the 2011 Tohoku
earthquake has been the most impactful and most damaging of them all – not only in
terms of loss to property and lives but also the economic loss in terms of trade,
equity markets, loss to insurance and impact on the commodity that the country
produces and trades.
This report seeks to study the impact of the earthquake from the perspective of
Markets, insurance, currency, commodity and trade.
The equity markets of Japan are known to be the most affected with a declining
returns on investment since the property and stock market bubble in the late 1980’s.
Although this can be attributed more to fundamental factors like deflation, many
stocks are still struggling to find equilibrium even 16 years after the 1995 Kobe
earthquake. From the FII front, Japan was one of the few countries in the world and
the only Asian country that was able to attract large FIIs in the first two months of
the last quarter of FY2010 ($2.2bn), but the earthquake’s devastating impact led the
FIIs to withdraw from these markets and find newer markets, therefore, other Asian
markets saw an increase in the FIIs in the month of March. It can be said fromprevious observations made during the 1995 Kobe earthquake (however, there was
the bank crisis also prevailing at that time in Japan) that the markets see a short
term impact due to sentiments and temporary disabled production in the economy,
in the medium term markets will show a bounce back and within one and a half years
from the 2011 Tohoku earthquake, after the production and consumption come to
normal, the markets will show significant returns. In conclusion, investors find an
opportunity in such markets and although the country of Japan is going through the
worst crisis in its history, there is still hope for growth in the years to come.
Insurance is another sector that took a major impact. Although WB estimates are
that $235bn will be the damages to Japan, insurers are estimating that the insured
losses will be around $20bn to $45bn. The government of Japan in its Earthquake
insurance sharing scheme has neatly organized the insurance to be paid by the two
parties apart from itself –the Japanese Earthquake reinsurer company and the non-
life insurers. The impact on the insurance companies is not going to be significant as
insurers are observed to maintain within themselves very strict standards of capital
adequacy and take into account events of this nature. It was observed that the limit of
capital with the insurance agencies was 5 times the prescribed amount and that some
companies had reserves of $90bn while the total for the industry exceeded $134bn.
7/29/2019 Japan Crisis_Final Draft
http://slidepdf.com/reader/full/japan-crisisfinal-draft 6/43
Japan Earthquake – 2011
5
International agencies did not have a large exposure and damage to them was limited
to around $1.5bn.
The Yen showed strong appreciation after the earthquake of 1.3% to the US dollar.
Although one might expect that a currency might show signs of weakening after an
event of such magnitude, the Japanese Yen became stronger. The main reason forthis is that many Japanese nationals living abroad started to repatriate money into
the Japanese economy increasing the demand for Yen. Another reason was that the
Japanese are famous for selling asset abroad in case their own country requires it.
These assets are usually held in the form of land and property or bonds in different
countries which were liquidated and brought back into the country.
The commodity market for Japan looked stable, although the production has been
impacted and consumption is expected to rise as replacement and reconstruction
demands will rise. Coincidently the oil prices have risen, although there will be an
increased demand in oil and petroleum from Japan to generate power to make up for
the loss in capacity due to the loss of the nuclear power plants, a lot of the increase in
price can be attributed to the OPEC and the Chinese refineries shutting down. The
impact on LNG however is a different story as it is anticipated that 40% of the loss of
capacity will be fuelled by production of energy using LNG and prices have seen a
spike and expected to remain there for atleast another 3 months or till the time
Japan does not regain energy production capacity. Steel and base metals have seen a
sharp spike due to demand from reconstruction looming and iron ore and coking
coal also have seen the same. Cement will not be affected as Japan has the capacity to
increase the production as seen from the 2008 earthquake and also can reduce theexports to further meet internal demand, however an impact can be felt on countries
that have small domestic markets for cement and are dependent n Japan for exports.
Finished goods like the personal computer and TV panels are expected to see some
impact in the short run as the production capacity of many Japanese companies is
hindered due to lack of power, in the medium term the market still looks favorable
for the other Asian countries such as Korea and Taiwan, but in the long run again
replacement demand will help the economy and industry pick up.
On trade the Japanese economy is mainly dependent on China for imports and US
for exports. Other trading partners also play an important role s Japan has very poorraw material resource, but have technology and quality of finished goods. The impact
on trade is going to be short lived and only till the time infrastructure is going to be
restored as many countries are dependent on information technology that Japan
offers and Japan is dependent on other countries or resources.
In conclusion the impact will affect the global economy only in the short run and as
the Japanese economy restores its infrastructure and as demand will pick up, trade,
and the markets will reach the equilibrium much faster.
7/29/2019 Japan Crisis_Final Draft
http://slidepdf.com/reader/full/japan-crisisfinal-draft 7/43
What hit the Country – What the Country hit
6
IntroductionRisk and risk management
Risk as the dictionary defines it is – ―the exposure to the chance of injury or loss; a
hazard or danger...‖ (Dictionary.com). Many different industries follow different
more specific definitions of risk more suited to their field of operation; however, the
essence of the term is the same. There are many different types of risks and each one
of them is treated differently.
Below is a list of types of risks that a business faces on a day to day basis. This list
only comprises of 9 types of risks, however, in reality there are many other risks that
exist. (withRisk, 2008):-
i. Strategic Risks (for example a competitor coming on to the market);
ii. Compliance Risks (for example the introduction of new health and safety
legislation);
iii. Financial Risks (for example non-payment by a customer or increased interest
charges on a business loan);
iv. Operational Risks (for example the breakdown of key equipment);
v. Environmental Risks (like disasters);
vi. Employee Risks (supplying necessary number of employees, safety and health
issues);
vii. Political and Economic (instable political status in foreign markets you export
goods to.);
ix. Planning Risks (sometimes the work requirement and specification
may change and all the work would be planned again.)
These are only a few types of risks that exist in an environment. However, they are
the most significant ones as far as a business organization is concerned; the risks that
affect a country are slightly different.
Countries operate in an environment that is governed mainly by international trade,exchange rates, the political stability of the countries of the world and diplomatic
relations with the outside world.
Given that; countries are more exposed to risks such as:-
i. Trade risk
ii. Foreign exchange rate risk
iii. Political and economic risk
iv. Environmental risk
7/29/2019 Japan Crisis_Final Draft
http://slidepdf.com/reader/full/japan-crisisfinal-draft 8/43
Japan Earthquake – 2011
7
Although the risks faced by the countries are similar, their magnitude and effect on
the economy and other economies can be different. For e.g. the Foreign exchange
rate would impact a business as an appreciation of the foreign currency would make
the exported commodity more expensive and affect demand, however, from the
countries point of view it would mean that their country’s demand for goods falls
affecting their balance of payments.
Exposure to risk therefore can be hazardous to the overall health of the economy.
Understanding risk and controlling it is therefore detrimental. Many techniques of
counteracting the risk and controlling losses from it have been designed under the
banner Risk Management .
Risk management is the process of identification, analysis and either acceptance or
mitigation of uncertainty or chance of loss. Essentially, risk management occurs
anytime when an entity analyzes and attempts to quantify the potential for losses for
a given occurrence and then takes the appropriate action (or inaction). Inadequate
risk management can result in severe consequences for companies, Nations as well as
individuals. For example, the recession that began in 2008 was largely caused by the
loose credit risk management of financial firms. (Investopedia, 2010)
There are numerous risk management techniques that are practiced and new ones
are designed on a regular basis to tackle risks that are newly being identified – such
as the Information systems risk management techniques – with the growing
dependence on technology and information systems.
The 2011 Tōhoku Earthquake and its causes
The 2011 Tōhoku earthquake and tsunami, literally "Eastern Japan Great was caused
by a 9.0-magnitude undersea megathrust earthquake off the coast of Japan that
occurred at 14:46 JST (05:46 UTC) on Friday, 11 March 2011. The epicenter was
approximately 72 km (45 mi) east of the Oshika Peninsula of Tōhoku, with the
hypocenter at an underwater depth of approximately 32 km (19.9 mi). On 1 April
2011, the Japanese government named the disaster resulting from the earthquake
and tsunami the "Great Eastern Japan Earthquake".
The earthquake triggered extremely destructive tsunami waves of up to 37.9 meters
(124 ft) that struck Japan minutes after the quake, in some cases traveling up to
10 km (6 mi) inland, with smaller waves reaching many other countries after several
hours. Tsunami warnings were issued and evacuations ordered along Japan's Pacific
coast and at least 20 other countries, including the entire Pacific coast of the
Americas.
The Japanese National Police Agency has confirmed 13,219 deaths, 4,742 injured and
14,274 people missing across eighteen prefectures, as well as over 125,000 buildings
7/29/2019 Japan Crisis_Final Draft
http://slidepdf.com/reader/full/japan-crisisfinal-draft 9/43
What hit the Country – What the Country hit
8
damaged or destroyed. The earthquake and tsunami caused extensive and severe
structural damage in Japan, including heavy damage to roads and railways as well as
fires in many areas, and a dam collapse. Around 4.4 million households in
northeastern Japan were left without electricity and 1.5 million without water. Many
electrical generators were taken down, and at least three nuclear reactors suffered
explosions due to hydrogen gas that had built up within their outer containment
buildings after cooling system failure. On 18 March, Yukiya Amano—the head of the
International Atomic Energy Agency —described the crisis as "extremely serious."
Residents within a 20 km (12 mi) radius of the Fukushima I Nuclear Power Plant and
a 10 km (6 mi) radius of the Fukushima II Nuclear Power Plant were evacuated. In
addition, the U.S. recommended that its citizens evacuate up to 80 km (50 mi) of the
plant.
Estimates of the Tōhoku earthquake's magnitude make it the most powerful known
earthquake to have hit Japan, and one of the five most powerful earthquakes in the world overall since modern record-keeping began in 1900. Japanese Prime Minister
Naoto Kan said, "In the 65 years after the end of World War II, this is the toughest
and the most difficult crisis for Japan.‖ The earthquake moved Honshu 2.4 m (7.9 ft)
east and shifted the Earth on its axis by almost 10 cm (3.9 in). Early estimates placed
insured losses from the earthquake alone at US$14.5 to $34.6 billion. The Bank of
Japan offered ¥15 trillion (US$183 billion) to the banking system on 14 March in an
effort to normalize market conditions. On 21 March, the World Bank estimated
damage between US$122 billion and $235 billion. Japan's government said the cost
of the earthquake and tsunami that devastated the northeast could reach $309
billion, making it the world's most expensive natural disaster on record. (Wikipedia,
2011)
The Japanese Economy
Japan’s economy can be characterized as highly industrialized and a free market
economy. The nation plays a competitive role in international trade, although
productivity is quite low in protected areas, including agriculture, services and
distribution. (Economy Watch, 2010) However, it is the third largest economy in the world – only after the United States of America and China. Most of its export goods
consist of cars, electronic devices and computers. Its trading partners for export are
USA, China, South Korea, Taiwan and Honk Kong. Japan is dependent on imports
for goods such as raw materials such as oil, foodstuffs and wood imported from
China, followed by the USA, Australia, Saudi Arabia, South Korea, Indonesia and the
United Arab Emirates.
The major industries prevalent in Japan are manufacturing; construction;
distribution; real estate; services; and communication are Japan's major industries
today. Agriculture makes up only about two percent of the GNP. Most important
7/29/2019 Japan Crisis_Final Draft
http://slidepdf.com/reader/full/japan-crisisfinal-draft 10/43
Japan Earthquake – 2011
9
agricultural product is rice. Resources of raw materials are very limited and the
mining industry rather small. (JapanGuide.com, 2011). Japan is one of the few
countries in the world that has a positive balance of payments - i.e. the component of
exports in much higher in Japan than it imports.
The 1995 Kobe Earthquake and its impact on the economy of
Japan
Japan is in a geographically perilous area and faces the risk of earthquakes
frequently exposing it to the environmental risk factor more than most other
countries. The 1995 Kobe earthquake killed 6,500 people and caused a damage of
¥10bn which was 2.5% of the GDP of the country during the time. Apart from the loss
of life and financial impact, the country saw a loss in value of 25% from the stock
market over the next six months. From a currency perspective, the Yen appreciated by 20% relative to the US Dollar in the following three months as local Japanese
investors sold foreign assets to fund domestic reconstruction (McCafferty, et al.,
2011). However, data also suggests that in the year before the Kobe earthquake the
GDP of the country had expanded by 0.9% however, the following year saw a growth
of 2.5% as reconstruction efforts contributed greatly to the economy. However, one
cannot ignore the destruction of the pre-existing assets (Morris, 2011).
The impact on the Japanese economy of the 2011 Tōhoku
Earthquake
The damage from the three most important prefecture affected by the earthquake
and tsunami – the nuclear reactors Miyagi, Fukushima and Iwate – account for
nearly 4% of Japan’s 2007 GDP. The damage in Tokyo alone accounts for nearly 18%
of the GDP. The impact is not only extended to the financial loss but an impact will
also be seen on automakers, consumer goods and IT manufacturers who will suffer
losses also due the time period it will take to for operations to come back to its
original state (Morris, 2011).
7/29/2019 Japan Crisis_Final Draft
http://slidepdf.com/reader/full/japan-crisisfinal-draft 11/43
What hit the Country – What the Country hit
10
The Japanese stock markets
The Nikkei 225 more commonly called the Nikkei , the Nikkei index , or the Nikkei
Stock Average, is a stock market index for the Tokyo Stock Exchange (TSE). It has
been calculated daily by the Nihon Keizai Shimbun (Nikkei) newspaper since 1950. It
is a price-weighted average (the unit is yen), and the components are reviewed once a
year. Currently, the Nikkei is the most widely quoted average of Japanese equities,
similar to the Dow Jones Industrial Average. In fact, it was known as the "Nikkei
Dow Jones Stock Average" from 1975 to 1985. The Nikkei 225 began to be calculated
on September 7, 1950, retroactively calculated back to May 16, 1949. Since January
2010 the index is updated every 15 seconds during trading sessions. (Wikipedia,
2011)
The Japanese stock market has seen a decline in the returns from stocks and bondssince the 1989 equity bubble burst. Today the returns on the Japanese stocks are just
above 1.75% and the Japanese bond markets are giving a return of just over 0%
which is almost negligible, this in comparison to the 8% returns that both the
markets gave is a significant drop.
Apart from the impact from the earthquakes, the main reason for the decrease in the
return is attributed to deflation in the economy (Morris, 2011).
The currency was seen becoming weaker compared to the dollar, this could be a
positive sign for the stock markets of Japan. The markets have already startedshowing signs of positive movement as the Nikkei 225 is rising at a steady rate. The
depreciated Yen and the fallen stock prices can be viewed highly beneficial for the
foreign investor. This lays down foundation for large foreign investment in the
country which will help the Nikkei 225 come back to the pre-earthquake levels.
Impact of the 1995 Kobe Earthquake on Tokyo Stock Exchange
The 1995 Kobe Earthquake was the last major earthquake that caused significant
damage to the country of Japan. Nikkei 225 saw a fall of 1000 points on the day of
the earthquake. The trend that was observed was that the Nikkei 225 fell by 6.6% in
the initial week from the Kobe Earthquake which occurred on 17th January 1995,
before the fall the Nikkei was around the 19600 points mark. Over the next month
the index saw a further drop of 5.6%, and over the next three months saw a 15% drop
in the index. However, the lowest point was seen at the end of six months when the
Nikkei 225 fell by 25% from the day the earthquake had occurred; despite this the
market recovered well after July of 1995 and closed higher than the Index closing
before the earthquake took place by July 1996. (Bespoke Investment Group, 2011)
(Refer Annexure I).
7/29/2019 Japan Crisis_Final Draft
http://slidepdf.com/reader/full/japan-crisisfinal-draft 12/43
Japan Earthquake – 2011
11
The initial decline in the market index in January 1995 was attributed to the Kobe
Earthquake, however, the further decline seen through the year was also because
Japan’s Banks were facing a crisis in the form of a wave of non-performing loans.
Even though the government had tried to recapitalize the banks, it was seen as
heavily inadequate (Brooks, 2011).
The impact of the 2011 Tōhoku Earthquake on Tokyo Stock
Exchange
Past data suggests that the Nikkei 225 was looking good since November 2010. It had
risen from 9200 to 10600 – a return of 15.7% over 5 months. However, the news of
an earthquake had great impact on the Nikkei 225, two days prior to the earthquake
the Nikkei 225 fell from 10600 to 8600 within 2 days after the event; a negative
return of 18.9% over one week.
This can be attributed to the large sell volumes seen in the days following the
earthquake. From trend analysis of the Nikkei 225, it is observable that the total
trade volumes had increased to over 250% from the average trade volumes over the
past 5 years. This is indicative of the fact that many foreign and domestic investors
were exiting the market – foreign ones in anticipation of the markets drastically
falling and domestic entities removing their money to fund the damage that was
incurred and to aid in the rebuilding efforts (Refer Annexure II).
Comparison between the situation of Japan after theearthquakes
Given that the 1995 Kobe earthquake and the 2011 Tōhoku earthquake let a large
impact on the Japanese economy, there is no contention that the Tōhoku earthquake
was far more devastating to the economy and is the cause for the largest damage
caused to any nation due to a natural calamity. However, the situation of Japan when
the Kobe earthquake hit in 1995 and the Tōhoku earthquake of 2011 is very different.
One of the most significant differences is that the banking sector of Japan today in
not going through a crisis like it was in 1995.
Another difference is that the extent of impact on the Nikkei was far more adverse in
the 2011 Tōhoku earthquake than the 1995 Kobe earthquake, this can be inferred by
looking at the fall in the index. In 1995, Nikkei 225 fell by 25% over a 6 month period
whereas in 2011, the Nikkei fell by almost 19% in just 4 days after the 2011 Tōhoku
earthquake.
7/29/2019 Japan Crisis_Final Draft
http://slidepdf.com/reader/full/japan-crisisfinal-draft 13/43
What hit the Country – What the Country hit
12
Forecast for the Nikkei 225 after the 2011 Tōhoku Earthquake
Japan was the only Asian country that was able to attract FIIs1 estimated at $2.2bn.
In the initial days of the 2011 earthquake, FII flows out of Japan were seen to rise.
This is backed up by the fact that other Asian markets saw a turnaround in the
amount of FII flows in their respective countries. For example, India witnessed an
FII outflow of $2bn in the months of January 2011 and February 2011, however, in
March, India saw an FII flow of $304.6mn. However, this increase in FII cannot be
totally contributed to the calamity, the extent of increase in FII flows to India are
indicatives of the foreign institutes looking for other than Japan markets.
This could change very rapidly as the currency and market conditions of Japan seem
favorable for foreign investors to invest in the markets.
Going by the trends that previous data for 1995 Kobe earthquake suggests, the
Japanese economy showed a turnaround the stock prices rose almost a year and a
half after the Kobe earthquake, then again the economy was going through a problem
in the banking sector. Given that the economy is not suffering from any fundamental
issues with the financial system and that the deflation in the market is decreasing,
the outlook of the market is positive and investors will be keen to look at the
Japanese markets in the near future.
Impact on the Indian Markets
To better understand the impact of the Japanese earthquake on the Indian stock
markets, it is important to understand what the index is. The index is a weighted
average of selected stocks from different sectors industry. What needs to be observed
is which stocks that comprise of the index have exposure to Japan. In the Indian
context, the major sectors that have any sort of exposure are the Automobile and
Information Technology (Equitymaster, 2011).
Given that the operations in Japan are not permanently disabled, however, it is
estimated that Japanese Auto makers are going to take some time to recover theirproduction back to normal. This could have some impact on the share prices of the
auto makers. However, since most of the Japanese companies have production
facilities outside Japan, this fall in prices could only be sentimental as effect in sales
would not be significant and the Indian markets will not see a long term impact on
the index.
Although the there are certain assessments of the future of the global and Indian
stock markets, a fair assessment cannot be made as the extent of damage has not
1 Foreign Institutional Investors: An investor or investment fund that is from or registered in a country outside of the one in which it is currently investing.

7/29/2019 Japan Crisis_Final Draft
http://slidepdf.com/reader/full/japan-crisisfinal-draft 14/43
Japan Earthquake – 2011
13
completely come into view. But, one thing is sure that the extent of the damage is
substantially large and the impact on the markets in the short term is inevitable.
Comparison between the BSE Sensex and the TSE Nikkei 225
From the past trends of the market, it can be observed in 2007 and 2008 the Sensex
and the Nikkei 225 have seen growth in the years, however, the trend shows that in
2009 the Nikkei and the Sensex had fallen dramatically as a result of the credit crisis
that prevailed in the period. However, the Sensex had recovered within 18 months
and so did the Nikkei but the extent to which the Nikkei increased was less due to the
prevailing deflation at the time. Although trends are similar, it does not indicate any
dependence as the trend was observed in markets all over the world (Refer Annexure
III).
7/29/2019 Japan Crisis_Final Draft
http://slidepdf.com/reader/full/japan-crisisfinal-draft 15/43
What hit the Country – What the Country hit
14
Impact of the earthquake onInsurance
Japan being in an earthquake prone region has developed an earthquake insurancesharing scheme. The main participants in the scheme are the Japanese government,
the Japanese earthquake reinsurance company (JER) and the non-life insurers. The
scheme is divided into slabs on the basis of the value of the damaged caused. The
JER is to cover any losses up to the extent of $1.4bn or ¥0.115tn, the next slab is
$23.5bn or ¥1.1925tn of which 50% is to be borne by the government and the
remaining 50% is to be shared by the non-life insurers and the JER in a defined
proportion. The third slab is $45.3bn or ¥3.712tn of which 95% losses are borne by
the government and 5% losses by the non-life insurers. The last slab is the $67.1bn or
¥5.500tn in losses of which again the government bares 95% of the losses and the
JER bares 5% of the losses (Tower Watson, 2011).
The cover on the losses is provided by non-life and co-operative insurers, the
Standard property policies offered by non-life insurers exclude earthquake risk.
Residential earthquake insurance (residential EQ) coverage and extended cover to
the commercial market are offered as optional coverage. For a residential EQ policy
offered by non-life insurers, the amount of coverage is typically selected by the
insured to be between 30% and 50% of the fire limit of coverage, with a maximum
limit of ¥50 million for the building and ¥10 million for its contents. By contrast, the
standard property policy offered by Zenkyoren – the leading non-life insuranceprovider – does not exclude earthquake risk.
Residential EQ coverage was first established in 1964 following a large earthquake in
Niigata, in northern Japan. Until 1995’s Kobe earthquake, the penetration ratio of
residential EQ on policies issued by non-life insurers had been less than 10% of
households. After the Kobe event, the penetration rate increased to the current rate
of 22% of households. Combined with the EQ coverage issued by the co-op insurers,
roughly half of all households in Japan carry EQ coverage. However, even when
covered, the insured typically participates significantly in the exposure. The
commercial property market is mainly covered by local non-life insurers. Earthquakeinsurance is written as an extended coverage endorsement to an ordinary fire policy
and is offered to selected large corporations. (Tower Watson, 2011)
Given the high natural catastrophe risk present in this part of the world, solvency
regulation of Japanese non-life insurance companies includes a solvency margin
requirement specific to catastrophes. Currently, the required solvency margin for
catastrophe risk is defined as the larger of the loss arising from a repeat of the Kanto/
Tokyo earthquake of 1923, which is deemed equivalent to a one-in-200-year event,
and the Isewan Typhoon of 1959, which is deemed equivalent to a one-in-70-year
event. Japanese insurers have a long track record of providing a high level of security
7/29/2019 Japan Crisis_Final Draft
http://slidepdf.com/reader/full/japan-crisisfinal-draft 16/43
Japan Earthquake – 2011
15
to their policyholders. For example; the combined available solvency margins for the
three largest non-life insurance groups in Japan, Tokio Marine Group, NKSJ Group
and MS&AD Group, exceeded US$120 billion as of March 2010. The total is
equivalent to four times the required risk solvency margin of these carriers, inclusive
of catastrophe risks. Zenkyoren has a solvency margin of US$90 billion, representing
almost five times its required solvency margin. Based on the large market share of
these three non-life groups (90% of the market share of non-life premiums,
excluding the co-ops) and some of the largest co-ops (Zenkyoren in particular), This
indicates that Japanese industry’s capitalization will be sufficient to withstand the
estimates of insured losses from this recent disaster.
Estimates of loss to insurance companies
Although the extent of the damage to the country of Japan was estimated at $235bn by the World bank just 10 days after the earthquake, the estimates of the insured
losses are around $20bn to $45bn (Tower Watson, 2011), this implies that the
insured property and life that was damaged is between 8% to 18% of the total losses
due to the earthquake in excess of the damage cause to the 4 nuclear power station of
the 17 that Japan has. The impact was seen throughout all the arms of insurances i.e.
Fire insurance (that covers residential and commercial property), Life, Auto, Marine.
There was an impact on the international insurance companies as well.
Losses incurred to the residential sector
The estimate of insured losses to residential properties from the combination of the
earthquake and the ensuing tsunami is US$9.5 billion to US$21.9 billion, based on
the assumption that approximately half of the population affected by these events
currently purchases earthquake insurance.
It is important to note that the co-ops, including Zenkyoren, follow a different set of
regulations from those that apply to insurance companies in Japan. In particular,
they do not share their EQ exposures with the JER. Zenkyoren has purchased an
excess of loss program2 from the international reinsurance markets that is said to beone of the largest programs in the world. It is believed that Zenkyoren’s catastrophe
reinsurance coverage is approximately US$8 billion excess of US$3.3 billion,
bringing our ground-up loss estimate for Zenkyoren to between US$3.5 billion and
US$8.5 billion. The loss estimates assume Zenkyoren holds a 60% market share of
the total co-op market (Tower Watson, 2011).
2 This is a type of treaty reinsurance where the reinsurer covers all the insurance contracts with theinsurer that are defined under a specific contract.
7/29/2019 Japan Crisis_Final Draft
http://slidepdf.com/reader/full/japan-crisisfinal-draft 17/43
What hit the Country – What the Country hit
16
Losses incurred to the commercial sector
The estimate of the insured losses to commercial properties from the combination of
the earthquake and the ensuing tsunami is US$4.7 billion to US$11 billion. This
estimate is based on the assumption that the industry losses will be split two-thirds
to residential and one-third to commercial properties (Tower Watson, 2011).
Losses incurred from loss of Li fe
Because of the tremendous loss of life, life insurers face increased death, accident
and health claims. Life insurance coverage in Japan is relatively straightforward,
with one exception. An accidental death benefit rider, typically double the death
benefit, is excluded by contract in the event of an earthquake. However, in
accordance with local customs and concern for insureds’ families, the Japanese life
insurance industry has announced that the earthquake exclusion will not be enforced
for this event and that payments arising from the accidental death benefit coverage
will be made. The current estimate of the losses to life insurers is US$3.0 billion to
US$4.9 billion.
This estimate does not contemplate any scenario where there is a significant release
of radioactive material from the stricken Fukushima power plant, which could cause
significant health and mortality issues (Tower Watson, 2011).
Losses incurred from loss at sea and sea vessels
The ensuing tsunamis tossed many large ships aground along with many smaller
commercial and personal vessels. Losses to port facilities were also extensive. The
estimate of the marine losses related to the event is US$1.1 billion to US$1.5 billion
(Tower Watson, 2011).
Losses incurred from loss to vehicles
Many thousands of cars were flooded due to the tsunamis. The estimate of the losses
to auto insurers is US$0.2 billion to US$0.7 billion (Tower Watson, 2011).
Losses incurred to international insurers
The estimated loss to international insurers is US$1.5 billion to US$5.0 billion. One
of the most uncertain elements of this catastrophe is the insured loss associated with
large international (non-Japanese) corporations. These companies will be primarily
insured by major international insurers. Insurance protections often include time
7/29/2019 Japan Crisis_Final Draft
http://slidepdf.com/reader/full/japan-crisisfinal-draft 18/43
Japan Earthquake – 2011
17
element coverages such as business interruption, extra expense and contingent
business interruption (CBI) cover when suppliers can’t supply needed production
materials to customers. The CBI element is particularly difficult to estimate because
the financial effects of supply-chain interruption will not be known for some time.
The policy terms and conditions for time element coverages also vary considerably
from company to company.
While this estimate does include some level of losses from these types of coverages,
The range of potential outcomes for this portion of the insured loss is very wide. But
the time element coverages will likely account for a significant portion of the impact
on the international reinsurance market. This business is more heavily reinsured in
both the treaty 3 and facultative4 markets, which operate, respectively, by contract
and the prerogative of the reinsurer’s appetite for risk. The level of uncertainty
surrounding the earthquake’s impact on the international reinsurance market is
disproportionately influenced by time element coverage obligations.
To sum up, the loss to the insurance industry can attributed to 47.5% loss from
residential, 23.5% from commercial 15% from life, 5.5% from Marine, 1% from Auto
and 7.5% of losses to the international insurer.
3 Treaty Reinsurance is a method of reinsurance requiring the insurer and the reinsurer to formulate and execute a reinsurancecontract. The reinsurer then covers all the insurance policies coming within the scope of that contract. There are two basicmethods of treaty reinsurance: Quota Share Treaty Reinsurance, and Excess of Loss Treaty Reinsurance.
4 Facultative reinsurance, the ceding company cedes and the reinsurer assumes all or part of the risk assumed by a particular
specified insurance policy. Facultative reinsurance is negotiated separately for each insurance contract that is reinsured.Facultative reinsurance normally is purchased by ceding companies for individual risks not covered by their reinsurancetreaties, for amounts in excess of the monetary limits of their reinsurance treaties and for unusual risks
7/29/2019 Japan Crisis_Final Draft
http://slidepdf.com/reader/full/japan-crisisfinal-draft 19/43
What hit the Country – What the Country hit
18
Impact on Japan’s currency – The YenThe Japanese yen (sign: ¥; code: JPY) is the official currency of Japan. It is the third
most-traded currency in the foreign exchange market after the United States dollar
and the euro. It is also widely used as a reserve currency after the U.S. dollar, theeuro and the pound sterling.
Shift to Gold Exchange Standard
Following the silver devaluation of 1873, Japan adhered to a gold standard, and by
the year 1897 the yen was worth only about US$0.50. In that year, Japan adopted a
gold exchange standard and hence froze the value of the yen at $0.50.
Fixed value of the Yen to the US dollar & Introduction to Floating Exchange Rates
The yen lost most of its value during and after World War II. After a period of
instability, in 1949, the value of the yen was fixed at ¥360 per US$1 through a United
States plan, which was part of the Bretton Woods System, to stabilize prices in the
Japanese economy. That exchange rate was maintained until 1971, when the United
States abandoned the gold standard, which had been a key element of the Bretton
Woods System5, setting in motion, changes that eventually led to floating exchange
rates in 1973.
Highly Volatile Decade for Yen (1970-1980)
Floating exchange rates brought the yen to 271 per US$ from 308 yen per US$ in
1971, hurting the export growth as Japanese products became less competitive, even
though the Japanese Government tried to intervene in Forex market. After the 1973
Oil Crisis, the Yen depreciated & was in the range 290-300 per US$ from 1974-1976.
But due to trade surpluses in late 1970’s, the yen appreciated very strongly to 211 per
US$. But this appreciation was affected again due to 2nd Oil Crisis in 1979, which
weakened the yen to 227 per US$ in 1980 (Refer Annexure IV, Fig 1.0).
5 The Bretton Woods system of monetary management established the rules for commercial and financial relations among the world's major industrial states in the mid 20th century. The Bretton Woods system was the first example of a fully negotiated
monetary order intended to govern monetary relations among independent nation-states.
7/29/2019 Japan Crisis_Final Draft
http://slidepdf.com/reader/full/japan-crisisfinal-draft 20/43
Japan Earthquake – 2011
19
Weakening Yen (1980-85)
Though there was re-emergence of Trade surpluses in early 80’s, the yen remained
low at 221 per US$ in 1981. This lowered further due to large capital outflow from
Japan, from 1981-1985, to USA, as the interest rates in USA rose to new heights, than
the Japanese rates. This caused high supply of yen in Forex market, weakening it to
239 per US$ in 1985. But this also helped in promoting the rapid rise in Japanese
trade surpluses (Refer Annexure IV, Fig 1.0).
Impact of Plaza Accord
In 1985 a dramatic change began. Finance officials from major nations signed an
agreement (the Plaza Accord6) stating that the dollar was overvalued (and, therefore,
the yen undervalued). This agreement, and shifting supply and demand pressures in
the markets, led to a rapid rise in the value of the yen. From its average of ¥239 per
US$1 in 1985, the yen rose to a peak of ¥128 in 1988, virtually doubling its value
relative to the dollar. At the end of the decade, Yen stood at around ¥145 per US$.
Japan had entered the stage of depression (Refer Annexure IV, Fig 1.0).
Twin Disaster – Japanese Asset Bubble & Kobe Earthquake
The Japanese asset price bubble was an economic bubble in Japan from 1986 to1991, in which real estate and stock prices greatly inflated. This caused deflation in
Japan (which is still present). Yen depreciated a bit, in early months of 1990 but after
1991 it started strengthening & hit the strongest in 1995, due to the Kobe earthquake,
falling to 79.75 yen per dollar. The fall was due to the repatriating of funds by
Japanese people & also Mexican Peso Crisis. In the late 1990s, the yen retreated from
its extraordinary 1995 high, with the fairly wide fluctuations, getting extremely weak,
144 yen per US$ in August 1998 & standing at 102 yen per US$ in December 1999
(Refer Annexure IV, fig 2.0)
Deflation Trap (2000-2007) , US Crisis 2008 & Tohuku Earthquake 2011
The combination of an overvalued yen and the aftermath of collapsed asset bubbles
previous 5 years, forced Japan's economy into a deflationary slump from which it has
yet to fully recover. The yen started weakening till February 2002 to 133 yen per
US$, when the Bubble economy burst effect had come to an end. As Japan was about
6 The Plaza Accord or Plaza Agreement was an agreement between the governments of France, West Germany, Japan, theUnited States, and the United Kingdom, to depreciate the U.S. dollar in relation to the Japanese yen and German Deutsche
Mark by intervening in currency markets. The five governments signed the accord on September 22, 1985 at the Plaza Hotelin New York City.
7/29/2019 Japan Crisis_Final Draft
http://slidepdf.com/reader/full/japan-crisisfinal-draft 21/43
What hit the Country – What the Country hit
20
to get back to its feet, from 2003-2006, when the yen touched 103 yen per US$, it
was struck badly by the US sub-prime crisis in December 2007, when the yen
strengthened to 90 yen per US$ in early 2009. In that year, the yen had shown
fluctuations in the around 95 yen per US$; till late 2009 when the Japanese yen
again appreciated against the dollar falling lower than 90 yen per US$ mid 2010 &
later stabilizing around 83 yen per US$ in February 2011.
The Tohoku-Sendai Earthquake & Tsunami
The 2011 Tohuku earthquake and tsunami, officially named the Great East Japan
Earthquake, was caused by a 9.0-magnitude undersea megathrust earthquake off the
coast of Japan that occurred at 14:46 JST on Friday, 11 March 2011.
Japan's biggest earthquake in 140 years pushed global stocks and commodities
markets lower. But guess what went up? The Yen.
Japanese Yen fueled by earthquake
The Japanese Yen advanced on Friday 11th after a massive tsunami-including
earthquake hit Japan, killing hundreds. It was the biggest ever earthquake to hit
Japan.
The Japanese currency took a brief dip but then quickly turned higher against all 16
of its major counterparts. The reason? It still had safe-haven status, and there was
speculation that overseas Japanese were repatriating large amounts of the currency.The U.S. dollar slid 1.3% against the Japanese currency at 81.876 yen.
"You would expect any catastrophic event would have a negative impact on the
victim's currency," Chuck Butler, president of Everbank World Markets, "But this
natural disaster has caused these Japanese investors to bring their currency back
home, as they fear they will need it to help rebuild."
Over the years, Japanese investors have been investing their savings in foreign
markets, including the higher-yielding currencies of New Zealand and Australia,
given the near-zero interest rates in their home country. But the magnitude of theearthquake's devastation was helping to reverse this trend.
Risk modeller AIR Worldwide said that insured losses could be $14.5bn to $35bn,
which excludes some pretty devastating tsunami effects. So there were to be inflows
from (largely European) reinsurers. Meanwhile Japan’s domestic insurers w ere
probably expected to liquidate some of their assets to make payments too. These two
combined meant more yen inflows.
Still, there was watchfulness that the yen's appreciation will likely be short-term, and
longer-term investors should avoid the Japanese currency.
7/29/2019 Japan Crisis_Final Draft
http://slidepdf.com/reader/full/japan-crisisfinal-draft 22/43
Japan Earthquake – 2011
21
The economy had actually benefited from this disaster in the short run as there was
fiscal stimulus from reconstruction. But Japan's budget deficits were already close to
10% of GDP, and this additional spending only added to the problem, facing the
Japan's aging population (The Street, 2011) (Refer Annexure IV, fig 3.0).
Dollar hits al l-time low against Yen
The dollar hit an all-time low against a strengthening Japanese yen on 16th, as global
uncertainty and the prospect of more cash flowing into Japan pushed its currency
higher.
The dollar fell as low as 76.54 against the yen in late trading on that day, dipping
under the previous all-time low of 79.75 set in April 1995.
Despite the nation's turmoil, the yen has long been a haven for risk-averse investors.Japanese corporations were also expected to repatriate vast amounts of capital. The
repatriation effect is that Japanese companies and households sell foreign assets to
cover needs at home. These holdings are mostly bonds of countries such as Brazil,
South Africa, Australia, or New Zealand with temptingly high interest rates. They
hold $50bn of bonds issued in Brazilian real and $27bn of "Uridashi"7 bonds in
Australia. The reversal of funds was expected to be swift. Japanese authorities soon
expected to intervene in currency markets to arrest the yen's appreciation. The BoJ
had immediately yet secretly injected $183 billion into the financial system in a move
to provide liquidity, on 14th March (CNN Money, 2011) (Refer Annexure IV, fig, 4.0).
What drove the yen's strength?
If you believe the Japanese government, it is all down to speculators, but there were
constant rumors that the yen's record high against the dollar on 17th April’s-day
trading was due to the repatriation of funds, mostly by insurance firms. What is not
in doubt is the remarkable rise of the yen after the dollar plunged to an all-time low
of 76.25 yen by the close of the US market. The question was why?
The markets were moved by a consensus view that Japanese institutions, particularly insurance companies, would repatriate assets into yen to meet their obligations
denominated in the currency. Ana Armstrong of Distinction Asset Management
wrote: "Japanese investors are selling overseas assets to bring home funds, and
insurance companies buy yen to meet obligations and foreign aid packages have all
increased short term demand for yen."
7 An Uridashi bond is a bond denominated in a foreign currency and sold directly to Japanese household investors. An Uridashi
bond is normally issued in high-yielding currencies such as New Zealand Dollars or Australian Dollars in order to give the
investor a higher return than the historically low domestic interest rate in Japan.
7/29/2019 Japan Crisis_Final Draft
http://slidepdf.com/reader/full/japan-crisisfinal-draft 23/43
What hit the Country – What the Country hit
22
The Japanese government moved fast to shoot this, with officials saying that
speculators were to blame and that there was "no evidence" of funds repatriating
assets.
That remains to be seen, but analysts expected an announcement on intervention in
the currency to mitigate the strength after a G7 (Group of 7 Industrial Nations:
Canada, France, Germany, Italy, Japan, UK & USA) meeting on the Japan situation.
It was noted that the situation was finely balanced, as while a stronger currency hurts
exports, it might help bring the costs of reconstruction and energy down.
Either way, while traders feast on the volatility in the markets, the disaster in Japan
has affected risk appetite dramatically.
But what we saw here is a function of ultra-leveraged hedge funds loosening their
carry trades8. If you borrowed yen and invested in higher-yielding currencies like the
Australian dollar or the South African rand, you made lots of money so long as the
rate of appreciation of the yen was lower than the interest rate you were getting in
the target currency. But when the yen starts to appreciate dramatically, you get
margin calls, which force you to buy a lot of yen in an illiquid market, which in turn
drives the yen up even further, which in turn not only increases the size of your
margin call but also triggers a large number of stop-loss orders and other FX options.
The result has been massive.
Difference with Yen strengthening following Kobe earthquake
in 1995
That earthquake, known in the US as the "Kobe Earthquake" and officially in Japan
as "The Great Hanshin-Awaji Earthquake Disaster," measured 6.8 in magnitude. The
energy released by Sendai quake was some 200 times that released by the Kobe
quake. Unlike the Kobe quake, the Tohoku quake was centered offshore, generating
the tsunami (Morris, 2011) (Refer Annexure IV, Fig 5.0).
The Kobe quake struck at Japan's industrial heartland. The affected regions
accounted for 12.4% of Japan's GDP in 1995. The five prefectures most affected by
the Tohoku quake are not as industrialized as the Kobe quake region. They accountfor about 7.8% of GDP.
The question now arises is how the latest disaster would be compared with the Kobe
earthquake in 1995.
8 The "carry trade" is basically an interest arbitrage speculation. Investors (speculators) borrow money in a country with low
interest rates, and then invest that borrowed money overseas in countries that pay higher interest rates. The risk, obviously, is
that the currency exchange rates may change. If the value of the Japanese Yen were to suddenly appreciate, then the amount
you owe (account payable) would grow, meaning that you would suddenly owe more money than you anticipated. On the
other hand, the currency that you invested in might suddenly depreciate, making your gain smaller.
7/29/2019 Japan Crisis_Final Draft
http://slidepdf.com/reader/full/japan-crisisfinal-draft 24/43
Japan Earthquake – 2011
23
The yen was on a tear at the time of the Kobe earthquake. It had already rallied from
just over 160 yen per dollar in 1990 to 99 yen at the end of 1994. The day before the
disaster, the yen had closed around 98.40 per dollar. It fell on the day of the quake to
99.11 and the following day to 99.69. The yen strengthened 20% against the U.S
dollar to turn down in April 1995, 3 months after the earthquake. USD/JPY
ultimately broke below 80 to a record low to 79.75 yen/$.
The reason for the appreciation, at first was, individuals and companies began to
repatriate some of their foreign holdings. It was more an indirect result of the
Mexican peso crisis & trade tensions with the United States were also a factor behind
the yen's rise. The yen reached a monthly high of 83.7 per USD by April, 1995 & then
to 79.75 per USD in and then began to depreciate sharply reaching 144.87 to the
dollar by August, 1998. The stock market immediately fell sharply, and continued to
fall until mid year, after which it had a good rise to June, 1997.
However, the main driver of the strong yen in 1995 wasn’t flow triggered by the
earthquake. A sharp increase in US interest rates in 1994 led to crisis in Mexico and
uncertainty in the dollar. In Japan, risk tolerance declined, and because US-Japan
trade negotiations were in their final stages, there were strong underlying concerns
about yen appreciation. In addition, life insurers and other Japanese entities
accelerated the hedging and selling of assets denominated in foreign currencies (also
owing to accounting issues; insurance companies had to record their mark-to-market
losses once the losses exceeded 15% and they rushed to sell foreign bonds before the
losses exceeded 15%), contributing to the yen’s sharp appreciation between the
earthquake and the end-March book-closing period. The BOJ lowered interest ratesin April 1995 in response to the strong yen.
When we compare the Kobe quake with the recent Tohuku quake, the economies of
Iwate, Miyagi and Fukushima regions that have been affected most seriously this
time account for 4-5% of Japan’s GDP, as compared to 2.5% of the Hyogo region
economy that was devastated by the Kobe earthquake in 1995. Now the damages to
infrastructure in the latest earthquake are more widespread owing to the effect of the
tsunamis, which also aggravated the human toll. Economists thus expected the short-
term economic effect this time to exceed that in 1995, which strengthened the yen by
making investors less likely to take risk.
Yen stabilizes after hitting record high
The dollar strengthened against the Japanese yen Thursday 16th ahead of a
conference call of G-7 finance ministers that was the first step towards intervention
by Japanese authorities in currency markets.
The call came after twin natural disasters pushed the yen to a record high against the
dollar, and fears over the country’s unf olding nuclear crisis continue to spook investors.
7/29/2019 Japan Crisis_Final Draft
http://slidepdf.com/reader/full/japan-crisisfinal-draft 25/43
What hit the Country – What the Country hit
24
On Wednesday 16th, the dollar fell as low as 76.54 against the yen in late trading,
dipping under the previous all-time low of 79.75 set in April 1995. By Thursday
afternoon, the dollar had stabilized around 79 versus the yen.
Reports published in advance of the conference call speculated that finance ministers
would voice a measure of support for Japanese efforts to weaken the yen.
For an economy facing a tough road ahead, a weaker currency would be a good thing.
Japan is an exporting nation and needs an undervalued currency to stimulate exports
and to fight persistent deflationary pressures. A stronger home currency will make
Japanese goods more expensive in overseas markets, to the disadvantage of Japan’s
manufacturing industry (CNN Money, 2011) (Refer Annexure IV, Fig 6.0).
What next for Yen?
The Yen had strengthened by more than 1 per cent against the dollar in the
immediate aftermath of the earthquake, but it’s been ticking back down. After the G7
intervened in Forex markets in the 3rd week of March, the Yen fell dramatically. But
at the end of the 1st week of April, however, the Yen has stabilized and is now starting
to claw back some of its losses. Also Yen weakness throughout that week was most
likely speculative JPY-selling from overseas investors. When Japanese corporate and
investors start buying back JPY to cut back their foreign risk positions, these JPY
short positions are likely to be unwound. That week’s USD/JPY’s rally was driven by
―JPY weakness‖, not USD strength — in fact, USD actually softened in trade-
weighted terms 9 over the period. Thus USD/JPY appreciation led only by JPY
weakness does not last long.
One has to wonder: is the Yen heading back towards record highs or will it wear out
soon and resume its decline?
There has been a tremendous influence to the G7, since the Yen fell by a whopping
5% following its intervention. Thus, investors are confident that the G7 won’t let the
yen go below 80 versus the dollar again.
However, it would be virtually impossible for the G7 to single-handedly lower the Yen. That’s because the Yen holdings of G7 Central Banks are absolutely small. For
example, the Fed holds only $14 Billion in Yen-denominated assets (compared to the
Bank of Japan’s $800+ Billion in Dollar assets), of which it deployed only $600
million towards the Yen intervention effort. Even if the Bank of Japan was secretly
involved (by printing money and advancing it to other Central Banks), its efforts
would still pale in comparison to overall Yen exchanges. Trading in the USD/JPY
pair alone accounts for an estimated $570 Billion per day. Thus, given the minute
9 an economic instrument used by economies to compare their exchange rate against those of their major trading partners
7/29/2019 Japan Crisis_Final Draft
http://slidepdf.com/reader/full/japan-crisisfinal-draft 26/43
Japan Earthquake – 2011
25
amounts in question, it would be unworkable for the Central Banks alone to move the
Yen.
Foreign institutional interest in Yen assets – which initially surged as investors dived
in, following the 20% drop in the Nikkei 225 average – has probably worn out. The
Bank of Japan will probably continue to flood the markets with Yen, and theGovernment of Japan will need to issue a large amount of debt in order to pay for the
rebuilding effort. Given Japan’s already weak fiscal situation, it seems unlikely that it
can count on foreign sources of funding. Japan's debt burden currently stands at 200
percent of its gross domestic product, compared with about 85 percent when Kobe
struck. Japan will also be "tempted" to print money to pay for the reconstruction bill.
But concerns about inflation and higher interest rates will likely limit that option too,
noting that higher interest rates would have negative consequences given the
country's massive debt burden.
In nominal terms the currency today is just past its 1995 high of JPY83 per dollar,
but this overstates the currency’s strength. On a real, trade-weighted basis the yen is
still 36% below the 1995 peak. This suggests that there is more room for the currency
to continue appreciating, even though the headline exchange rate is already at new
highs and governments have been intervening to manage it. In the meantime, the
yen’s (real) relative weakness should continue to benefit Japanese exporters
(Fxstreet, 2011).
7/29/2019 Japan Crisis_Final Draft
http://slidepdf.com/reader/full/japan-crisisfinal-draft 27/43
What hit the Country – What the Country hit
26
Impact of the Earthquake oncommodity
The balance of payments is an account of the exports and imports of a country. A positive balance of payment implies that the exports are more than the imports of
that country, and is a favorable scenario for a country. Japan is one of the few
countries in the world with a positive balance of payments. The export value of Japan
exceeded its import value by nearly 10% in FY 2011 (Ministry of Finance, Japan,
2011).
The main export and import commodities of Japan and its trading partners are
discussed previously. The question that arises is what commodities are most affected
by this crisis. Although many commodities were affected, this report will see the
impact on steel and base metals; oil, petroleum and Liquid Natural Gas (LNG); andnon-coking coal.
Impact of the 2011 earthquake on steel and base metals
Japan accounts for 7.8% of production and 4.6% of consumption in Steel & less than
10% of global exports.
Production Impact on steel
In CY10, Japan produced 110mt of crude steel and is forecast to produce 121mt in
CY11. Japan accounts for more than 10% of global ordinary steel exports accounting
for 29 mt of ordinary steel and 43mt including specialty steel. The natural disaster
will hinder the forecast 10% growth in production for CY11.
Production will be mainly affected due to shortage in power. According to Platts, as
of 14th March, only two steel mills (Sumitomo’s Kashima and Nippon’s Kamaishi)
had suspended work. While the direct impact from production cuts in these two
plants might not be significant, however, many steelmakers in Japan would have tocut or reduce production due to power rationing by the government. That said, the
reduced production would only trigger increased capacity utilization elsewhere, since
foremost the World has more than 20% capacity lying idle and that it ideally takes
only 3 months to restart a blast furnace.
In totality, hot rolled coil could see near term spikes, due to sudden decrease in
Japanese steel production, caused due to the crisis. But it will moderate in a two to
three months, once the capacity in other parts of the world starts coming online.
7/29/2019 Japan Crisis_Final Draft
http://slidepdf.com/reader/full/japan-crisisfinal-draft 28/43
Japan Earthquake – 2011
27
Consumption Impact on steel
Currently the pre-calamity Japanese consumption of steel is forecast to be 65mt in
CY11 i.e. around a 5% increase from 62mt in previous year. The major setback in
steel consumption would emerge from the automobile industry. Many car makers
including Suzuki motor, Mitsubishi motors, Toyota etc. announced plans to halt
production temporarily.
These cuts will not lead to a surplus in global steel market, since Japan accounts for
less than 1% of global imports. However, consumption could surprise positively once
rebuilding commences and the auto manufacturers start operating at normal rates.
Also majority of the reconstruction may be happening towards the latter half of CY11.
Thus steel raw materials could see correction in spot prices, however recovering and
possibly increasing in the next three months.
Impact on iron ore and coking coal
Iron ore and coking coal are the most essential components of steel. Japan accounts
for 13% of global iron ore imports and 22% of coking coal imports.
While traditionally Japan has been the price negotiator for iron ore and coking coal
with the big miners, the trend has been slowly undergoing a shift to Chinese steel
makers directly negotiating with the miners and two, frequency of prices movingfrom annual to quarterly and now possibly monthly contracts (with BHP talking
about a large spot market by year 2012 – BHP increased offer price by 21% to
US$188 to some Chinese steel makers). For these reasons the Japanese steel makers’
importance as price setters as reduced.
The impact on steel, due to crisis has helped to avoid major impacts of both its raw
materials. Production halts or reduced production due to power shortage will lead to
more availability of steel raw materials on spot market for a short period, which
could see a slight correction for both the raw materials (iron ore & coking coal) over
the next couple of months. According to Platts, some Japanese steel makers coulddeclare force measures on coal purchases.
In the medium term, both the raw materials could be positively impacted due to
increased capacity utilization in anticipation of an increase in Japanese steel demand
once it starts rebuilding the affected areas.
Therefore one can anticipate chances of increased imports of Iron Ore by the Korean
and Chinese firms due to increased steel capacity utilization; and secondly, the big
four suppliers of coking coal might be forced to sell small volumes in the spot market.
7/29/2019 Japan Crisis_Final Draft
http://slidepdf.com/reader/full/japan-crisisfinal-draft 29/43
What hit the Country – What the Country hit
28
One of them, Anglo settled for US$330 for German creek coal for Q2 CY11. BHP also
spoke of creating a liquid spot market over the next 12 months.
Would Indian steel benefit from the crisis?
Most of the steel that Japan exports are high end value added steel – the segment in
which India is fairly deficient. Therefore chances of any Indian companies getting
affected or directly taking advantage of this short term crisis are very less. The
Korean steel makers could be the major beneficiaries. However, any movement
towards the monthly pricing system by the steelmakers, could lead to a short term
gains from rising HRC prices.
Impact on Base metals
Apart from steel Japan is also a large consumer of Copper, Aluminum, and Zinc.
Japan consumes 4% to 5% of the total global production of the three metals;
however, the production capacity of Japan is 7% for copper and 4% to 5% of Zinc
which is not sufficient for the country. And due to the lack of natural raw materials in
the country, these base metals have to be imported.
Chances of base metals getting impacted to a large extent is less, even after shut
downs by Japanese factories would lead to a temporary drop in base metal demand,
since the percentage of Japanese consumption is only in the range of 4-5% of global
demand in the Copper-aluminum-zinc space.
However Japan is one of the largest importers of copper concentrate with an import
of 5.4mt in CY10. In the event of a prolonged halt in copper smelters, the imports
could be diverted elsewhere, thus leading to a temporary relief in the extremely tight
copper concentrate market. While copper concentrate market could slightly ease,
refined copper will tighten further, due to production halts in some Japanese copper
smelters. On 14th March, a total of 378kt of smelting capacity was offline.
Lead could be a major gainer on the back of increased battery demand for power
backups. Its price has shown a 3.9% increase.
On a medium term, the Japanese consumption of metals, there will increase and
surpass the estimated demand for CY11 and CY12 due to rebuilding of lost property
and infrastructure and replacement of lost goods. There will be a positive revision of
consumption over the next year to year and a half.
A further insight into the base metal exchanges like the London Metal Exchange
(LME) and India’s commodity exchange MCX give a glimpse into the current trade
prices and the impact of the Japan crisis.
7/29/2019 Japan Crisis_Final Draft
http://slidepdf.com/reader/full/japan-crisisfinal-draft 30/43
Japan Earthquake – 2011
29
The foremost observation is that the concern about the nuclear crisis in Japan and
lower equity markets, base metal prices are expected to remain under pressure.
Aluminium prices ended lower by 0.8 percent on LME and half a percent on MCX
thereby underperforming the base metal pack. Aluminium stocks on London Metal
Exchange witnessed draw-down of 4,250 tonnes thereby marking fourth consecutivedecline. On the fundamental front, reports indicated that China has halted plans to
build new aluminium plants in the country to tackle serious over-capacity in the
industry.
Copper stocks on London Metal Exchange witnessed build-up of 1,525 tonnes
thereby marking third consecutive increase. On the fundamental front, copper
imports climbed by 29 percent in March to 304,299 tonnes. However on a year-on-
year basis, it declined by 33 percent.
Lead stocks on London Metal Exchange witnessed draw-down of 975 tonnes thereby
marking sixth consecutive decline. Open interest also declined along with increase in
prices by half a percent indicating unwinding of positions.
Nickel prices on LME ended higher by 0.4 percent while the gains on MCX were
more than a percent. Nickel stocks on London Metal Exchange witnessed draw-
downs of 234 tonnes thereby marking sixth consecutive decline.
Zinc stocks witnessed draw-down of a modest 300 tonnes from London Metal
Exchange as against increase of 1,150 tonnes on the previous day. After declining to
$10/tonne, the basis has moved back to average levels of $20/tonne thereby givingno clear indication about future price movement. Open interest however declined by
nearly 10 percent indicating unwinding of positions at higher levels (Commodity
Online, 2011).
To summarize, the commodity market also reacted to the crisis and base metal prices
of Copper, Aluminum and Zinc – the three most demanded metal in Japan – saw a
hit in prices, whereas Nickel and Lead saw trade according to the market dynamics.
Impact on Crude Oil
Japan imports 1.6% of world demand of crude oil. Based on the U.S. EIA data, Japan
imported 4.7 million barrels a day (bpd) in 2009, with total oil refining capacity of
4.6 million bpd at 29 facilities as of January 2010. According to Reuters, the six
refineries that are shut down have a total capacity of 1.40 million barrels per day
(bpd). That's about 1.6% of the 89.3 million bbl/d global 2011 product demand
forecast by the International Energy Agency (IEA).
7/29/2019 Japan Crisis_Final Draft
http://slidepdf.com/reader/full/japan-crisisfinal-draft 31/43
What hit the Country – What the Country hit
30
While Japan is the second-largest net importer of oil in the world after the United
States in 2009, the estimated import disruptions due to the earthquake does not
appear significant enough to sway world’s crude oil market.
On the other hand, since about 25% of Japan’s electricity is coming from nuclear, the
resulted power shortage due to closures of a dozen nuclear reactors after the quakesuggests Japan will likely need to increase its imports of petroleum products and
other energy sources.
The country’s power generation relies mostly on coal and natural gas, which means
there will be an increase in imports of diesel to power generators, and other
petroleum products since part of its domestic production is offline, along with
natural gas/LNG, and coal, just to keep the entire nation going in the aftermath.
However fuel prices could spike. Even though the oil import disruption at Japan is
unlikely to wrangle an upward momentum out of crude oil. However, the Japaneserefinery shutdown happens to coincide with planned shutdowns of crude units led by
China and Japan that will cut 2.12 million barrels of output a day, or 6.8% of the
region's total, in the April-June quarter, according to Reuters.
Moreover, the second quarter is the typical refinery turnaround season with a
substantial amount of crude processing capacity offline. As such, there could be a
tightening of the global petroleum products market, and spikes in the prices of
petroleum products including gasoil (diesel), gasoline, along with LNG and coal
prices. This will likely benefit other Asian refiners in South Korea, Taiwan and China
and oil majors such as Shell (RDS) with refineries in the region (L.Chu, 2011).
To summarise, Danny Huang of Royal Bank of Scotland notes that the impact of the
Japan crisis will be direct on international oil price. In the short term, Japan's
demand for oil may decline as part of the economic activities may halt. But as it starts
to reconstruct and economic activities revive, this will drive higher energy demand.
This will be supportive to the manufacturers and may put more pressure on refiners.
That said, the situation in Middle East and North Africa remain in our view bigger
drivers for oil prices. If unrests settle or investors become less concerned,
international oil prices could ease also (Liu, 2011).
Impact on Liquid Natural Gas
As Japan is dependent on 30% of its power on nuclear energy, and the earthquake
has left 3 of its nuclear power plant incapacitated, which accounted for 25% of its
power capacity, the country is forced to look at alternative fuels. LNG falls under the
category of alternative fuels along with petroleum and coal.
The impact on the prices of oil and petroleum have been discussed previously and it
can be concluded that oil and petroleum prices will not be adversely affected by the
7/29/2019 Japan Crisis_Final Draft
http://slidepdf.com/reader/full/japan-crisisfinal-draft 32/43
Japan Earthquake – 2011
31
crisis, rather will be dependent on the OPEC and the shortage in supply due to
petroleum manufacturers in China shutting down operations. LNG as an alternative
fuel to Japan has shown some reaction to the crisis
As CRISIL reports, LNG will take care of 40% of the shutdown nuclear capacities.
Spot LNG is expected to be used to meet 26% requirement of power, 74% beinggenerated through coal.
International LNG prices have risen following the Japan calamity. Prices jumped
from US$ 9 to US$ 12 per mmBtu due to increased spot demand from the country.
Japan’s biggest suppliers like Indonesia, Malaysia & Australia have lent support to
some extent. For the remaining demand, Japan will be importing from Middle East
nations. Suppliers like Shell have already diverted some exports from Europe to
Asian markets.
Damage to Nuclear plants & its radiation effects in Japan have forced many nationslike Germany to close their nuclear plants. This has caused to divert its demands for
LNG & other products, forcing the prices to go even higher.
CRISIL expects Asian LNG spot prices to go up to US$ 19-20 mmBtu in next 3
months.
Price rise will also affect demand in India, as acquisition costs have got higher. Spot
LNG accounts to 8% of the total gas demands in India (Crisil Research, 2011).
Impact on the Construction material
Steel and cement are the major materials required for construction. Steel, as seen
earlier, might see a slight spike in prices due to the fall in capacity and demand for it
during the reconstruction effort, and revival of operations of the automobile
industry. Cement on the other hand has a different story.
Japan has a lot of under-utilized capacity as far as cement is concerned. During the
Sichuan earthquake in 2008, the cement production was seen increasing from 62m
tones to 90m tones in 2009 and 132m tones in 2010 – an increase of an average of
33m tones a year. This is indicative of the fact that Japan is capable of producing
cement for its reconstruction effort. This coupled with reduced exports and import of
cement can comfortably suffice Japan’s increased demand for cement which is
estimated at an additional 30 – 50 m tones over the next 1 to 2 years (Chang, et al.,
2011).
The main impact will be felt by the Asian countries. China and Taiwan are especially
important as they are one of the main trading partners for cement of Japan. Data
suggests that China might not be impacted as much as Taiwan. This is due to the fact
that China has a huge domestic market and can channel the reduced exports toJapan (as Japan will now be producing most of its demand in cement) to the
7/29/2019 Japan Crisis_Final Draft
http://slidepdf.com/reader/full/japan-crisisfinal-draft 33/43
What hit the Country – What the Country hit
32
emerging market in the country itself. On the other hand, Taiwan which has a
relatively smaller demand for cement of around 10 m tones can be affected as it is
highly dependent on its imports. The capacity could be idle which could impact the
cement industry in Taiwan in the short run.
As far as the rest of the world is concerned, it is safe to say that the quantity of cement that was imported out of Japan is not significant enough to affect global
dynamics in the prices of steel. Although production levels were high, a lot of the
produce was consumed domestically, and now even moreso. Only countries that have
a small demand and larger capacity, and are dependent on Japan for the trade of
cement might be affected but only in the short run.
Impact on the Information Technology
Japan specializes in information technology and specially hardware. Companies like
Sony and Samsung are market leaders in panel and memory technology, which are
key components for television and computer manufacturing.
The earthquake has forced many facilities to stop operation or reduce production due
to the damage to the infrastructure. This implies that the global demand for
televisions and computers have to be met from other suppliers like Korea and
Taiwan, who are also suppliers of memory and panel technology.
Therefore, the market may initially focus on the positive impact for Korean and
Taiwan memory and panel makers from lower Japanese production. However, thereare medium-term risks from disruptions to the supply of key components and lower
Japanese consumption.
Japan itself is a large consumer of LCD TV and PCs. The country accounts for 9% of
global LCD TV unit sales and 10% of revenues from the same. It also accounts for
4.5% global PC shipments.
Apart from consumption, Japanese production of key electronics components is the
highest in the world with Toshiba accounting for 36% of global production. Elpida
has capacity of 120k 300m wpm in Japan which accounts for 9.6% of global capacity.Sharp accounts for 10% of global LCD panel production by area. Japan's Shin-Etsu
Chemical, the major supplier of 300mm silicon wafers to the semiconductor industry
– a key component in panel technology also has a large market share in the industry.
Although it was not clear to what extent the earthquake affected the production of
these firms, it was noted that most of these companies were affected by the loss of
power rather than by the damage to the actual facility itself, except for Shin – Etsu
Chemicals whose facility is reportedly damaged.
In the near term, the obvious reaction is that panel and memory production from
Japan could be negatively impacted, which is positive for Samsung, AUO, LG
7/29/2019 Japan Crisis_Final Draft
http://slidepdf.com/reader/full/japan-crisisfinal-draft 34/43
Japan Earthquake – 2011
33
Display, Chimei-Innolux and Hynix. However, since Japan is a major market for LCD
TV consumption, the net impact on the panel industry could be negative in the
medium term if panel makers ramp up too quickly to fill any near-term gap (Toder,
et al., 2011).
Therefore, one can conclude that although the supply for memory and paneltechnology could be affected in the short-run as global demand will be filled in by the
Korean and other Asian countries that have this technology; however, the impact on
consumption could be medium term as Japan is a large consumer itself, which could
lead to a fall in prices due to an excess supply in the medium term. In the long-run,
the replacement demand from Japan will stabilise prices and bring them to
equilibrium
The semiconductor production might not be impacted in the near term. TSMC has
already commented that the company has enough inventories to maintain operations
in the near term. OSAT’s Powertech is likely the most vulnerable given its high
exposure to Elpida and Toshiba. Kinsus and Nan Ya PCB might also be negatively
impacted since they source key materials from Japan. The biggest issue in the
medium term is the supply of components. Japan is dominant in a number of
components such as high capacitance MLCC. Although each component accounts for
only a tiny fraction of the costs of final products, they are necessary for production.
Therefore, shortages could be felt across the manufacturing supply chain resulting in
a slowdown in shipments of PCs, TVs, tablets and other consumer products. Such a
situation could have a negative impact demand and pricing for all electronic
components in the medium term.
Longer term, the earthquake is likely to stimulate replacement demand in Japan for
electronic goods such has PCs and TVs which were destroyed. At this stage, however,
it is difficult to forecast when significant replacement demand will emerge (Toder, et
al., 2011).
7/29/2019 Japan Crisis_Final Draft
http://slidepdf.com/reader/full/japan-crisisfinal-draft 35/43
What hit the Country – What the Country hit
34
Impact on Japan’s Import and Export Japan plays an important role in international trade. Its main trading
partners are China and USA. The exports comprise of information technology,
automobiles etc. and most of Japan’s imports comprise of fuels, agri-basedproducts, food and food related products etc. due to lack of raw materials and
resources.
The Exports
Japan’s major export comes from the cars, electronic devices and computers. The
countries main export partners are the USA, China, South Korea, Taiwan and Honk
Kong. (JapanGuide.com, 2011) USA was the most important export partner of Japan
in 2008 with 17% to 18% of the total exports made to the USA and China was on the
second position with 15% to 16% share. South Korea had a share of 7.6% of Japan’sexport whereas Taiwan and Honk Kong have 5.9% and 5.1% respectively (Economy
Watch, 2009) Today’s scenario is slightly different; China is the main export partner
of Japan, importing a total of 19.5% from Japan whereas USA is in second place with
15.5% of exports from Japan. South Korea has increased its stake in Japan’s export to
8%; Taiwan has also increased its stake to 6.75% and Honk Kong has a stake of 5.4%
of Japan’s export (Ministry of Finance, Japan, 2011).
In 2008, India had 1% of the export share of Japan, which rose to 1.09% and 1.17% in
2009 and 2010 respectively. In FY 2011, the share still remains at 1.17%, implying
that India has not played an important role in the growth of Japan’s export.
The Imports
The main commodities imported by Japan are oil, foodstuffs and wood, which are
essential raw materials in many industries. The import partners of Japan are China,
followed by the USA, Australia, Saudi Arabia, South Korea, Indonesia and the United
Arab Emirates. In 2008, China was the number exporter to Japan with a share of
16% followed by USA at 10.2%; Saudi Arabia at 6.7%; Germany at 2.7%; Egypt at
0.25%; and Ukraine at 0.03% (Economy Watch, 2009). The current situation in 2011
is that China is the country that Japan imports the most from with an average of 22.15% of imports followed by USA which has a 9.5% of the share of Japan’s Import
followed by Saudi Arabia at 5.2%; Germany at 2.7%; Egypt at 0.08%; Ukraine at
0.03%. (Ministry of Finance, Japan, 2011)
In 2008 India had 0.7% of the share of Japan’s imports in 2011, India has 1.2% of the
share of Japan’s Imports. (Ministry of Finance, Japan, 2011)
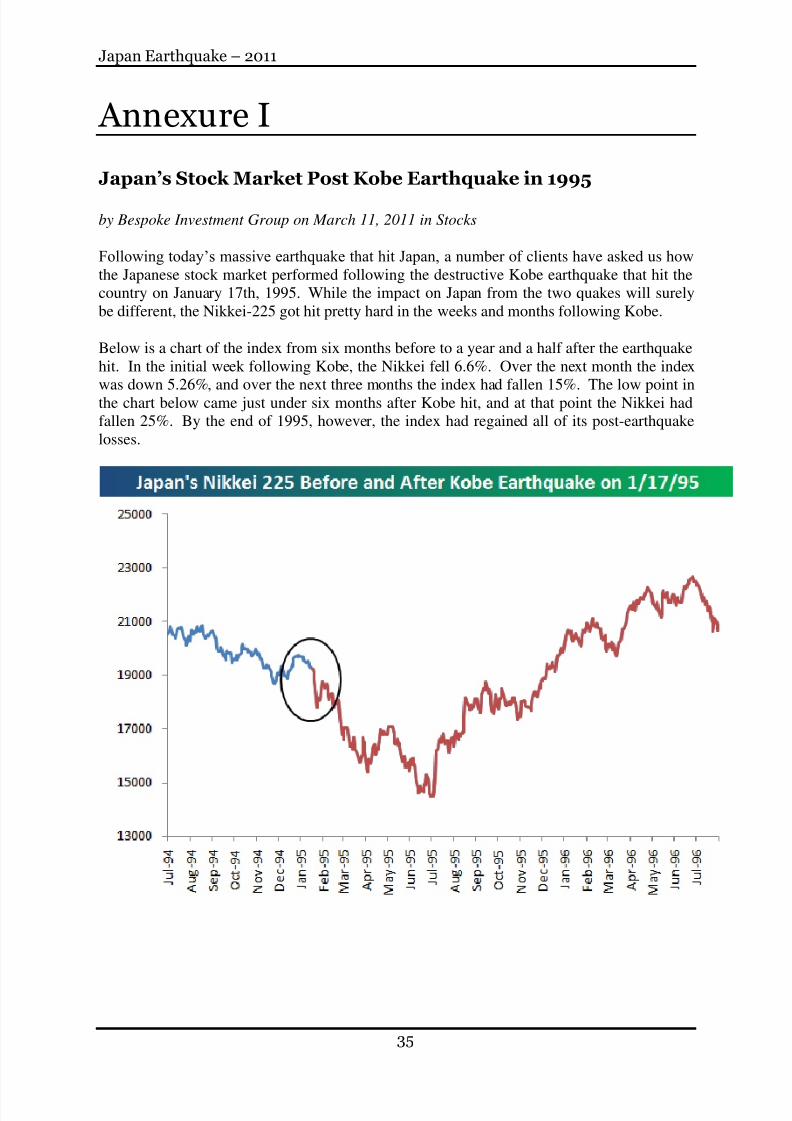
7/29/2019 Japan Crisis_Final Draft
http://slidepdf.com/reader/full/japan-crisisfinal-draft 36/43
Japan Earthquake – 2011
35
Annexure I
Japan’s Stock Market Post Kobe Earthquake in 1995
by Bespoke Investment Group on March 11, 2011 in Stocks
Following today’s massive earthquake that hit Japan, a number of clients have asked us how
the Japanese stock market performed following the destructive Kobe earthquake that hit the
country on January 17th, 1995. While the impact on Japan from the two quakes will surely
be different, the Nikkei-225 got hit pretty hard in the weeks and months following Kobe.
Below is a chart of the index from six months before to a year and a half after the earthquake
hit. In the initial week following Kobe, the Nikkei fell 6.6%. Over the next month the index
was down 5.26%, and over the next three months the index had fallen 15%. The low point inthe chart below came just under six months after Kobe hit, and at that point the Nikkei had
fallen 25%. By the end of 1995, however, the index had regained all of its post-earthquake
losses.
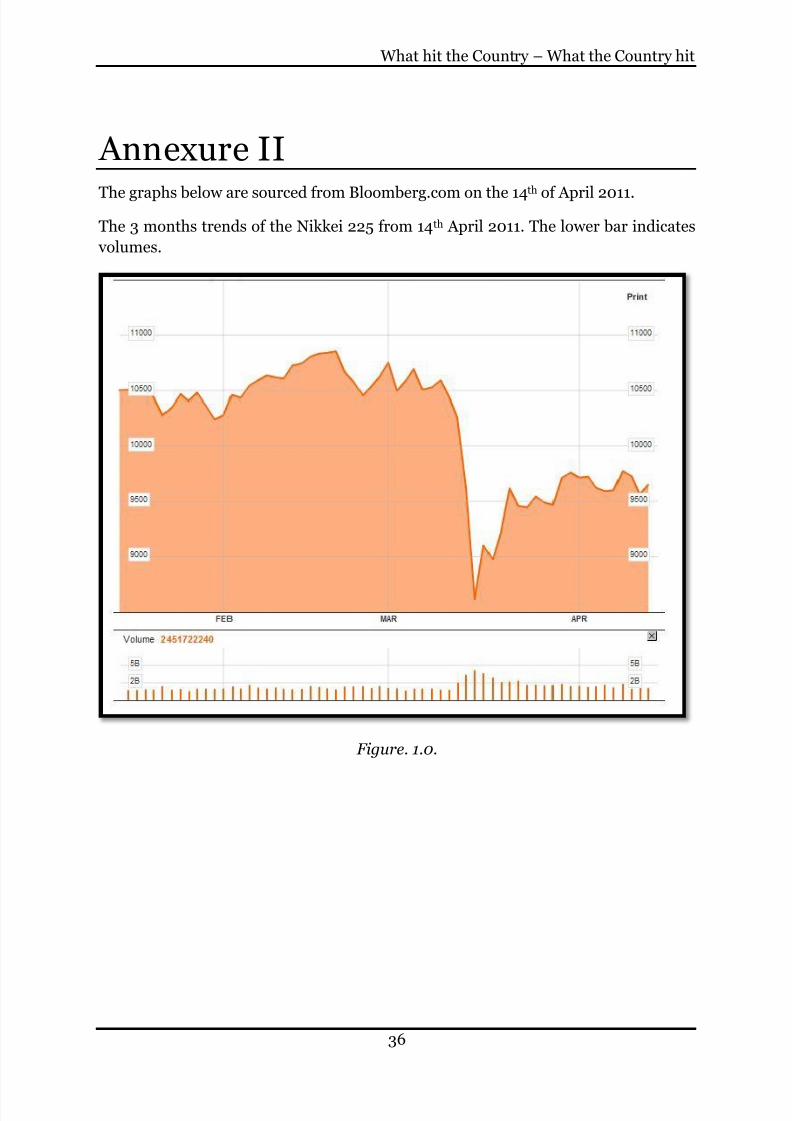
7/29/2019 Japan Crisis_Final Draft
http://slidepdf.com/reader/full/japan-crisisfinal-draft 37/43
What hit the Country – What the Country hit
36
Annexure II
The graphs below are sourced from Bloomberg.com on the 14th
of April 2011.
The 3 months trends of the Nikkei 225 from 14th April 2011. The lower bar indicates
volumes.
Figure. 1.0.
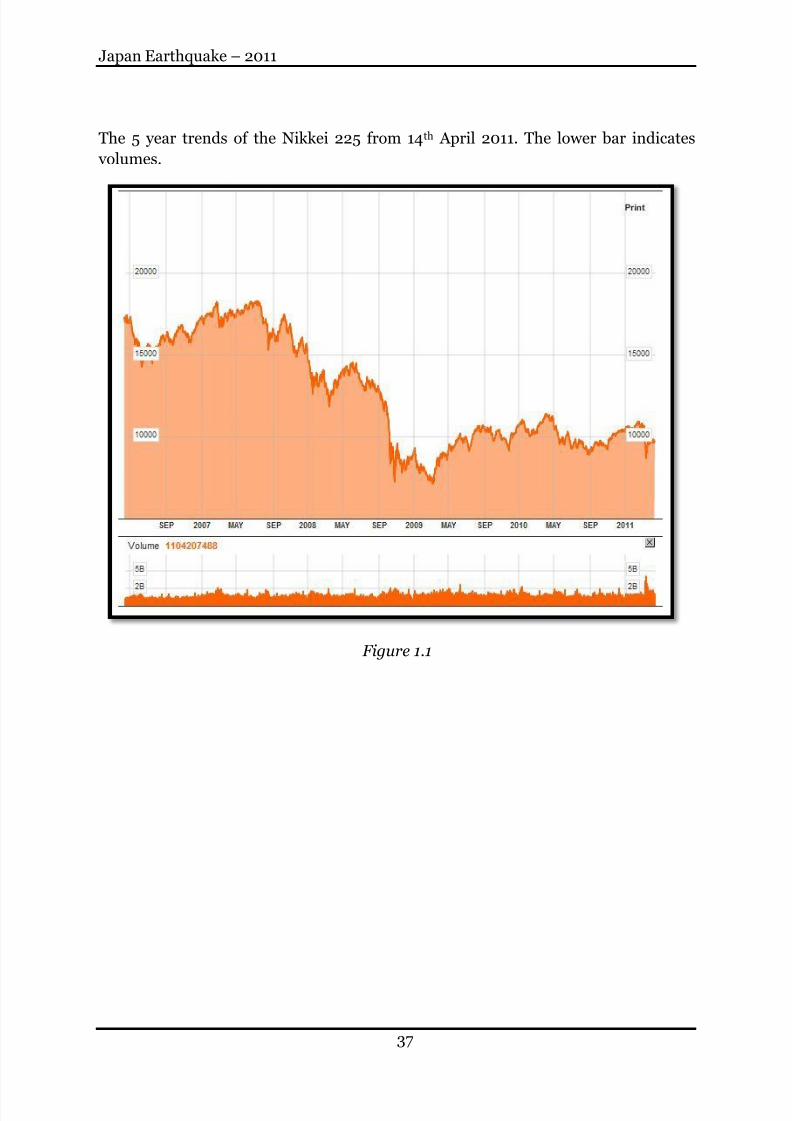
7/29/2019 Japan Crisis_Final Draft
http://slidepdf.com/reader/full/japan-crisisfinal-draft 38/43
Japan Earthquake – 2011
37
The 5 year trends of the Nikkei 225 from 14th April 2011. The lower bar indicates
volumes.
Figure 1.1
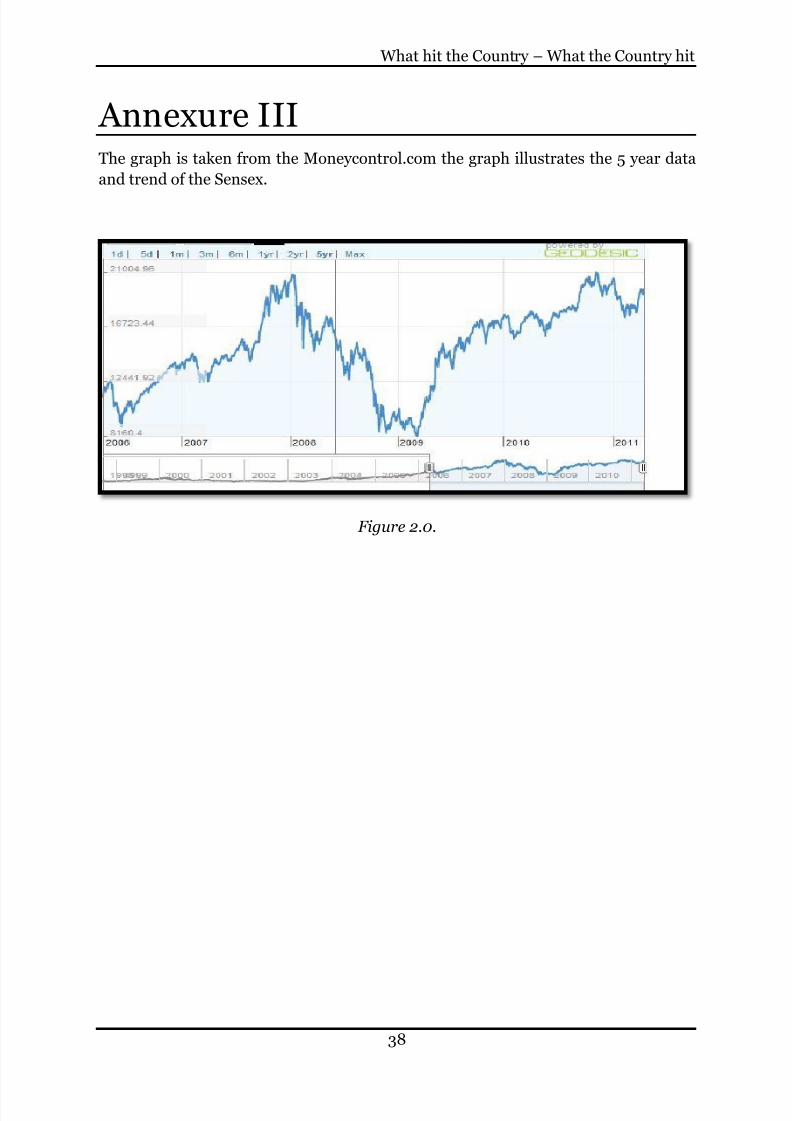
7/29/2019 Japan Crisis_Final Draft
http://slidepdf.com/reader/full/japan-crisisfinal-draft 39/43
What hit the Country – What the Country hit
38
Annexure IIIThe graph is taken from the Moneycontrol.com the graph illustrates the 5 year data
and trend of the Sensex.
Figure 2.0.
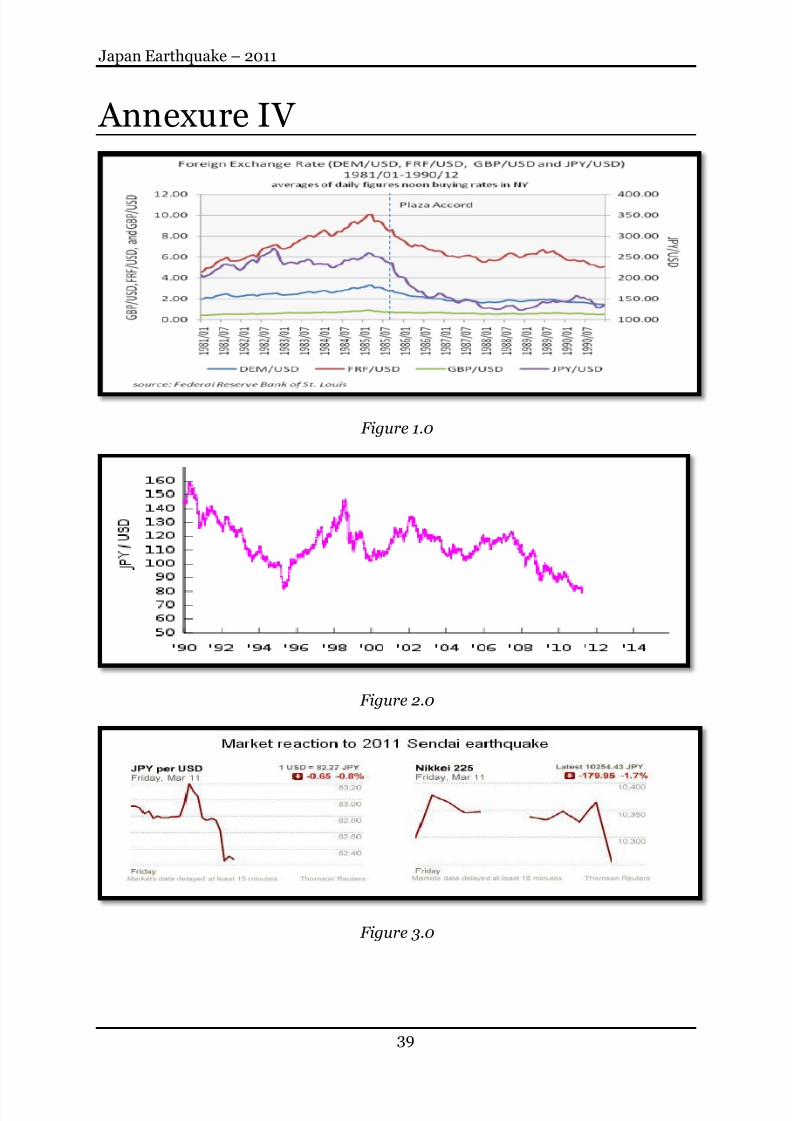
7/29/2019 Japan Crisis_Final Draft
http://slidepdf.com/reader/full/japan-crisisfinal-draft 40/43
Japan Earthquake – 2011
39
Annexure IV
Figure 1.0
Figure 2.0
Figure 3.0
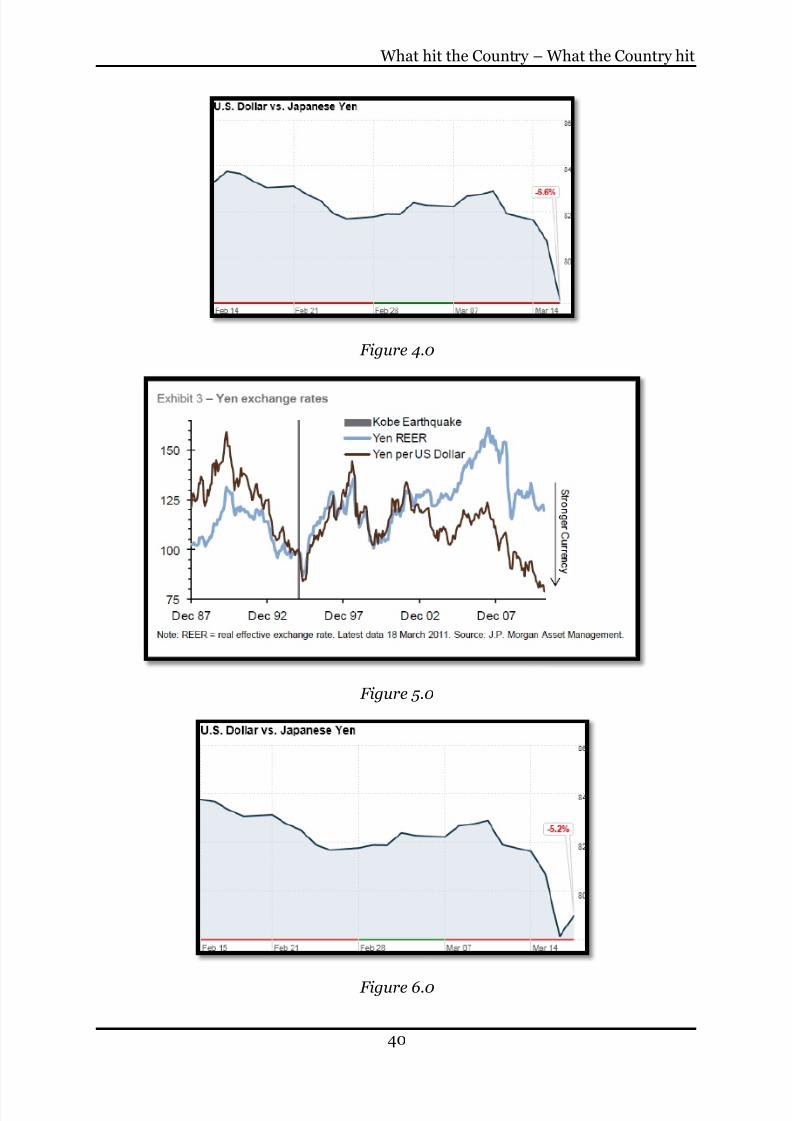
7/29/2019 Japan Crisis_Final Draft
http://slidepdf.com/reader/full/japan-crisisfinal-draft 41/43
What hit the Country – What the Country hit
40
Figure 4.0
Figure 5.0
Figure 6.0
7/29/2019 Japan Crisis_Final Draft
http://slidepdf.com/reader/full/japan-crisisfinal-draft 42/43
Japan Earthquake – 2011
41
Bibliography Bespoke Investment Group. 2011. Japan's Stock Market Post Kobe Earthquake
1995. SwingTradingDaily.com. [Online] March 11, 2011. [Cited: April 10, 2011.]
http://swingtradingdaily.com/2011/03/11/japans-stock-market-post-kobe-earthquake-in-1995/.
Brooks, Kathleen. 2011. The Nikkei Today and Post the Kobe Earthquake in 1995.
www.ibtimesfx.com. [Online] FOREX.com, March 14, 2011. [Cited: April 09, 2011.]
http://www.ibtimes.com/articles/122426/20110314/the-nikkei-today-and-post-the-
kobe-earthquake-in-1995.htm.
CNN Money. 2011. money.cnn.com. [Online] CNN, March 16, 2011. [Cited: April
09, 2011.] http://money.cnn.com/2011/03/16/markets/dollar_yen/index.htm.
—. 2011. Yen Stabilizes after hitting record High. money.cnn.com. [Online] CNN,
March 17, 2011. [Cited: April 09, 2011.]
http://rss.cnn.com/~r/rss/money_markets/~3/VTR8wqn-c94/index.htm.
Dictionary.com. www.dictionary.com. [Online] [Cited: April 09, 2011.]
http://dictionary.reference.com/browse/risk.
Economy Watch. 2010. www.EconomyWatch.com. [Online] 2010. [Cited: April
10, 2011.] http://www.economywatch.com/world_economy/japan/export-
import.html.
—. 2009. www.economywatch.com. [Online] Stanley St Labs, 2009. [Cited: April
08, 2011.] http://www.economywatch.com/world_economy/japan/export-
import.html.
Equitymaster. 2011. www.equitymaster.com. [Online] Bloomberg, March 2011.
[Cited: April 09, 2011.]
http://www.equitymaster.com/detail.asp?date=3/15/2011&story=1&title=Effects-of-
Japan-tsunami-on-Indian-stock-markets.
Investopedia. 2010. www.investopedia.com. [Online] April 12, 2010. [Cited: April09, 2011.] http://www.investopedia.com/terms/r/riskmanagement.asp.
JapanGuide.com. 2011. Japan Guide. [Online] April 07, 2011. http://www.japan-
guide.com/e/e644.html.
McCafferty, James and Hilton, Peter. 2011. Japan tragedy: potential market
impact. Hong Kong : Royal bank of Scotland, 2011.
Ministry of Finance, Japan. 2011. www.e-stats.com. [Online] Ministry of
Finance, April 04, 2011. [Cited: April 08, 2011.] http://www.e-
stat.go.jp/SG1/estat/ListE.do?lid=000001071897.
7/29/2019 Japan Crisis_Final Draft
http://slidepdf.com/reader/full/japan-crisisfinal-draft 43/43
What hit the Country – What the Country hit
Morris, Dan. 2011. Aftershocks: Japan and world markets after the disaster. s.l. :
J.P. Morgan Asset Management, 2011.
The Street. 2011. Japanese Yen Fuelled by the Earthquake. www.thestreet.com.
[Online] March 12, 2011. [Cited: April 09, 2011.]
http://www.thestreet.com/story/11040695/1/japanese-yen-fuelled-by-earthquake.html.
Tower Watson. 2011. Japan Earthquake - Insurance Industry impact and Risk
management lessons. s.l. : Tower Watson, 2011.
Wikipedia. 2011. www.wikipedia.com. [Online] April 2011. [Cited: April 10, 2011.]
http://en.wikipedia.org/wiki/2011_T%C5%8Dhoku_earthquake_and_tsunami.
—. 2011. www.wikipedia.com. [Online] 2011. [Cited: April 10, 2011.]
http://en.wikipedia.org/wiki/Nikkei_225.
withRisk. 2008. www.withrisk.com. [Online] July 07, 2008. [Cited: April 09,
2011.]
http://www.withrisk.com/index.php?kat=4&entry=7&yer=Risk+Management.


![Journal of the Physical Society of Japan DRAFT - arXiv · arXiv:1208.1102v2 [cond-mat.supr-con] 13 Dec 2012 Journal of the Physical Society of Japan DRAFT Crossoverbetween BCSSuperconductor](https://img.pdfslide.us/doc/110x75/5e0c09b9f338ba2eaf5b278e/journal-of-the-physical-society-of-japan-draft-arxiv-arxiv12081102v2-cond-matsupr-con.jpg)