Embed Size (px)
Citation preview

INTERIM REPORT
JANUARY – SEPTEMBER
2017
Craft
J.Harvest & Frost

THIS IS NEW WAVE GROUP
New Wave Group is a growth company. We design, acquire and develop brands and products in the corporate promotion, sports, gifts and home furnishings sectors.
Our three operating segments are: Corporate Promo; promowear, promotional gifts and workwear, Sports & Leisure and Gifts & Home Furnishings.
We are active in two sales channels; the promo market and the retail market. By being active in both markets the Group achieves good risk diversification. We also achieve great synergy advantages since major parts of our product range can be used in both sales channels.
New Wave Group’s strengths are design, purchasing, logistics and marketing of our brands.
The products are mainly produced in Asia and to a certain, lesser extent in Europe.
New Wave Group has since the start had strong growth and good margins.
New Wave Group distributes 49 different brands, 3 of which are licensed brands. The rest are fully owned. Each brand is categorised according to which of our three operating segments it belongs to; Corporate Promo, Sports & Leisure or Gifts & Home Furnishings. The brands are distributed in both the promo market and the retail market to achieve good risk diversification.
CORPORATE PROMO
GIFTS & HOME FURNISHINGS
SPORTS & LEISURE
OPERATING SEGMENTS AND MARKETS

Clique
CORPORATE PROMO vision
The vision for the Corporate Promo operating segment is to become the leading supplier in Europe and one of the leading suppliers in the USA of promotional products by offering retailers a broad product range, strong brands, advanced expertise and service, and a superior all-inclusive concept.

Cutter & Buck
The vision for the Sports & Leisure operating segment involves establishing Craft as a world-leading sportswear brand, and making Cutter & Buck a world-leading golf apparel brand. The vision also entails to strengthening Speedo in the Swedish, Norwegian and Danish markets. The brand Auclair should take a leading position on gloves in Europe and we will also use Paris Glove’s strong distribution platform to launch the Group’s other brands in Canada. We want to become the leading sports supplier in both Sweden and the other European countries, as well as in the USA. All in all, our brands shall give us a position among the largest sport suppliers in the world.
SPORTS & LEISURE vision

Orrefors
Sagaform
The vision for the Gifts & Home Furnishings operating segment area is to make Orrefors and Kosta Boda world-leading glass and crystal suppliers. Part of the vision also involves utilising innovative and playful design to make Sagaform a prominent player in Northern Europe in both the promo and retail markets.
GIFTS & HOME FURNISHINGS vision

Craft
J.Harvest & Frost
Clique Retail Craft Cutter & Buck
FINANCIAL INFORMATION

Cutter & Buck
Clique Cottover JULY – SEPTEMBER 2017
Sales SEK 1 331 million (1 300)
Sales increased 2% (4% in local currencies).
Corporate Promo 11%, Sports & Leisure -6%,Gifts & Home Furnishings 11%.
Growth in most of the geographical areas
Promo sales channel 9%, retail -4%.
Sales per Operating segment
Corporate Promo 11% to SEK 551 million (499).
Promo sales channel.
Growth in most of our geographical areas.
Sports & Leisure -6% to SEK 617 million (656).
Growth in promo, decrease in retail.
Growth in Europe, decrease in other geographical areas.
Gifts & Home Furnishings 11% to SEK 163 million (146).
Retail sales channel.
Sweden and USA

JULY – SEPTEMBER 2017 Net sales per geographical area
Jul-Sep Part of Jul-Sep Part of ChangeSEK million 2017 income 2016 income SEK million %Sweden 293,0 22% 279.5 21% 13.5 5%USA 352.3 26% 379.4 29% -27.1 -7%Nordic countries excluding Sweden 204.6 15% 197.8 15% 6.8 3%Central Europe 243.0 18% 229.2 18% 13.8 6%Southern Europe 121.0 9% 114.0 9% 7.0 6%Other countries 117.2 9% 100.5 8% 16.7 17%Total 1 331.1 100% 1 300.4 100% 30.7 2%
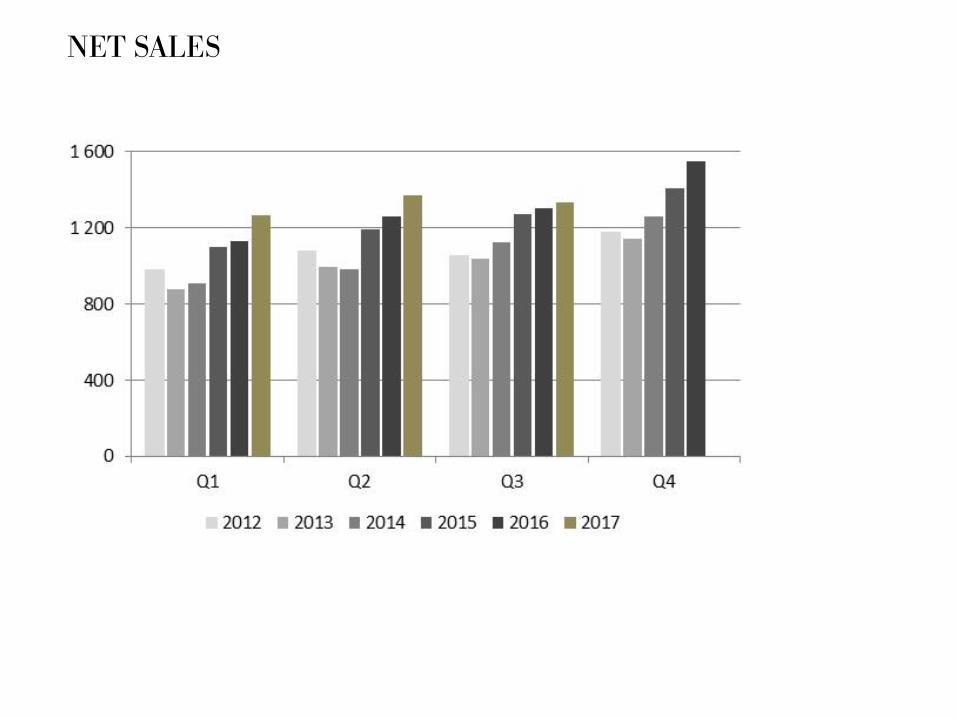
NET SALES

J. Harvest & Frost Ahead Clique
Gross profit margin amounted to 47.9 (46.7) %.
External costs and personnel costs amounted to a total
of SEK -482.5 million (-476.8) Employments within sales, warehouse and customer service
Operating result amounted to SEK 143.0 million (124.9)
Higher net sales and improved gross profit margin
Result for the period amounted to SEK 105.3 million (86.5)
JULY – SEPTEMBER 2017
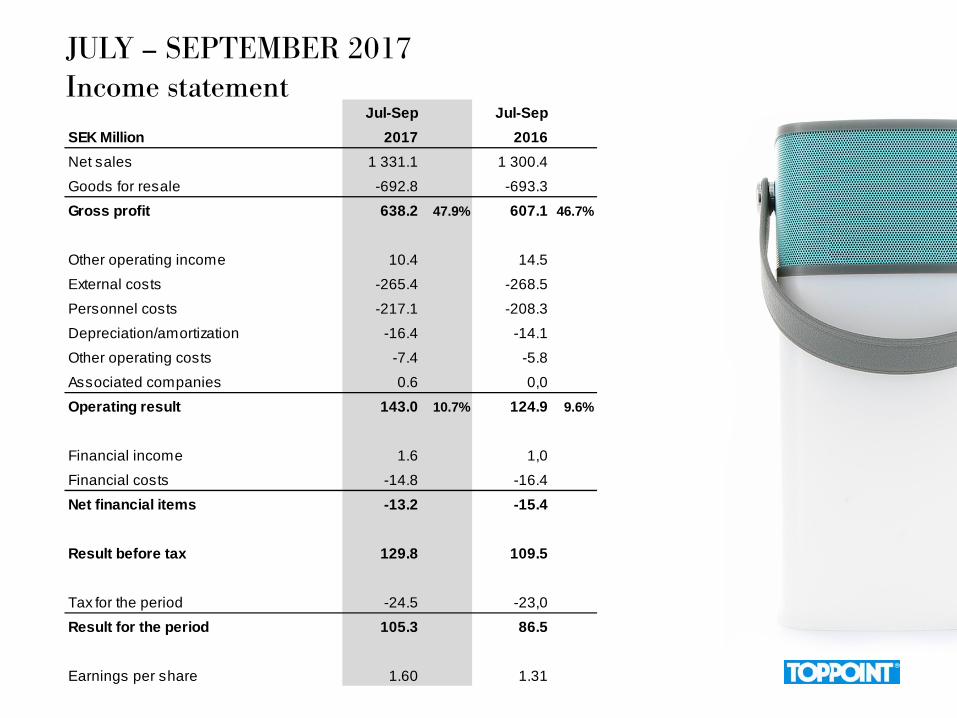
JULY – SEPTEMBER 2017 Income statement
Jul-Sep Jul-SepSEK Million 2017 2016Net sales 1 331.1 1 300.4
Goods for resale -692.8 -693.3
Gross profit 638.2 47.9% 607.1 46.7%
Other operating income 10.4 14.5
External costs -265.4 -268.5
Personnel costs -217.1 -208.3
Depreciation/amortization -16.4 -14.1
Other operating costs -7.4 -5.8
Associated companies 0.6 0,0
Operating result 143.0 10.7% 124.9 9.6%
Financial income 1.6 1,0
Financial costs -14.8 -16.4
Net financial items -13.2 -15.4
Result before tax 129.8 109.5
Tax for the period -24.5 -23,0
Result for the period 105.3 86.5
Earnings per share 1.60 1.31

JULY – SEPTEMBER 2017 EBITDA per operating segment
Corporate Promo amounted to SEK 49.9 million (36.9). Higher turnover
Sports & Leisure amounted to SEK 98.9 million (93.5). Improved gross profit margin
Lower costs
Gifts & Home Furnishings amounted to SEK 10.5 million (8.6). Higher turnover
Higher marketing costs

RESULT BEFORE TAX

JULY - SEPTEMBER 2017 Cash flow
Jul-Sep Jul-SepSEK million 2017 2016
Cash flow from operating activities before changes in working capital 153.3 116.2
Change in working capital -163.7 -100.7
Cash flow from operating activities -10.4 15.5
Investing activities -36.9 -25.8
Cash flow after investing activities -47.3 -10.3
Financial activities 30.2 22.9
Cash flow for the period -17.1 12.6

Cutter & Buck
Clique Cottover JANUARY – SEPTEMBER 2017
Sales SEK 3 967 million (3 689) Sales increased 8% (6% in local currencies)
Corporate Promo 13%, Sports & Leisure 1%, Gifts & Home Furnishings 11%
Improvements in all geographical areas
Promo sales channel 12%, retail 2%
Sales per Operating segment
Corporate Promo 13% to SEK 1 820 million (1 609)
Promo sales channel
Growth in all geographical areas
Sports & Leisure 1% to SEK 1 715 million (1 690)
Increase in promo sales channels, decrease in retail
Europe
Gifts & Home Furnishings 11% to SEK 432 million (390)
Primarily the retail sales channel
Sweden and USA

JANUARY – SEPTEMBER 2017 Net sales per geographical area
Jan-Sep Part of Jan-Sep Part of ChangeSEK million 2017 income 2016 income SEK million %Sweden 867.7 22% 817.4 22% 50.3 6%USA 1 029.9 26% 1 008.0 27% 21.9 2%Nordic countries excluding Sweden 576.2 15% 552.6 15% 23.6 4%Central Europe 739.3 19% 690.5 19% 48.8 7%Southern Europe 400.3 10% 357.1 10% 43.2 12%Other countries 353.5 9% 262.9 7% 90.6 34%Total 3 967.0 100% 3 688.5 100% 278.5 8%

Gross profit margin amounted to 46.3% (45.9) Improvement in Sports & Leisure, Gifts & Home
Furnishings on the same level and Corporate Promo slightly lower due to change in product mix
Total costs amounted to SEK -1 502.3 million
(-1 436.6) currency effect when converting into SEK higher sales costs more personnel in sales, warehouse and
customer service
Operating result amounted to SEK 296.6 million (233.3) higher net sales
Result for the period amounted to SEK 207.2 million (148.9)
JANUARY – SEPTEMBER 2017

JANUARY – SEPTEMBER 2017 Income statement
Jan-Sep Jan-SepSEK Million 2017 2016Net sales 3 967.0 3 688.5
Goods for resale -2 131.3 -1 994.6
Gross profit 1 835.7 46.3% 1693.9 45.9%
Other operating income 28.3 36.1
External costs -824.1 -797.9
Personnel costs -678.2 -638.7
Depreciation/amortization -47.1 -40.7
Other operating costs -19.1 -19.5
Associated companies 1.1 0,0
Operating result 296.6 7.5% 233.2 6.3%
Financial income 3.9 3.1
Financial costs -42.7 -47.1
Net financial items -38.8 -44,0
Result before tax 257.8 189.2
Tax for the period -50.6 -40.3
Result for the period 207.2 148.9
Earnings per share 3.14 2.26

JANUARY – SEPTEMBER 2017 EBITDA per operating segment
Corporate Promo amounted to SEK 179.1 million (140.9) Higher net sales
Sports & Leisure amounted to SEK 160.6 million (139.5) Improved gross profit margin
Lower costs
Gifts & Home Furnishings amounted to SEK 4.0 million (-6.5) Higher net sales
Higher marketing costs

JANUARY - SEPTEMBER 2017 Cash flow
Jan-Sep Jan-SepSEK million 2017 2016
Cash flow from operating activities before changes in working capital 296.1 201.4
Change in working capital -222.8 -33.4
Cash flow from operating activites 73.3 168.0
Investing activities -72.8 -65.1
Cash flow after investing activities 0.5 102.9
Financial activities -51.7 -100.1
Cash flow for the period -51.2 2.8

FINANCIAL HIGHLIGHTS
Jan-Sep Jan-Sep Jan - Dec Jan - Dec2017 2016 2016 2015
Net sales growth, % 7.6 3.6 5.5 16.2Number of employees 2 469 2 397 2 396 2 358
Gross profit margin, % 46.3 45.9 46.0 45.1Operating margin before depreciation, % 6.3 7.4 8.7 6.3Operating margin, % 7.5 6.3 7.6 5.1
Return on shareholders’ equity, % 9.9 7.7 10.4 6,0Return on capital employed, % 8.4 6.7 8.6 5.8
Equity ratio, % 48.0 45.4 48.4 45.9Net debt - Equity ratio, % 60.7 73.5 62.1 76.8Net debt - working capital ratio, % 61.7 70.0 64.7 71.7Net debt, SEK million 1 721.9 1 949.9 1 748.9 1 929.1Stock turnover, times 1.1 1.1 1.1 1.2
Shareholders’ equity per share, SEK 42.8 40.0 42.5 37.9
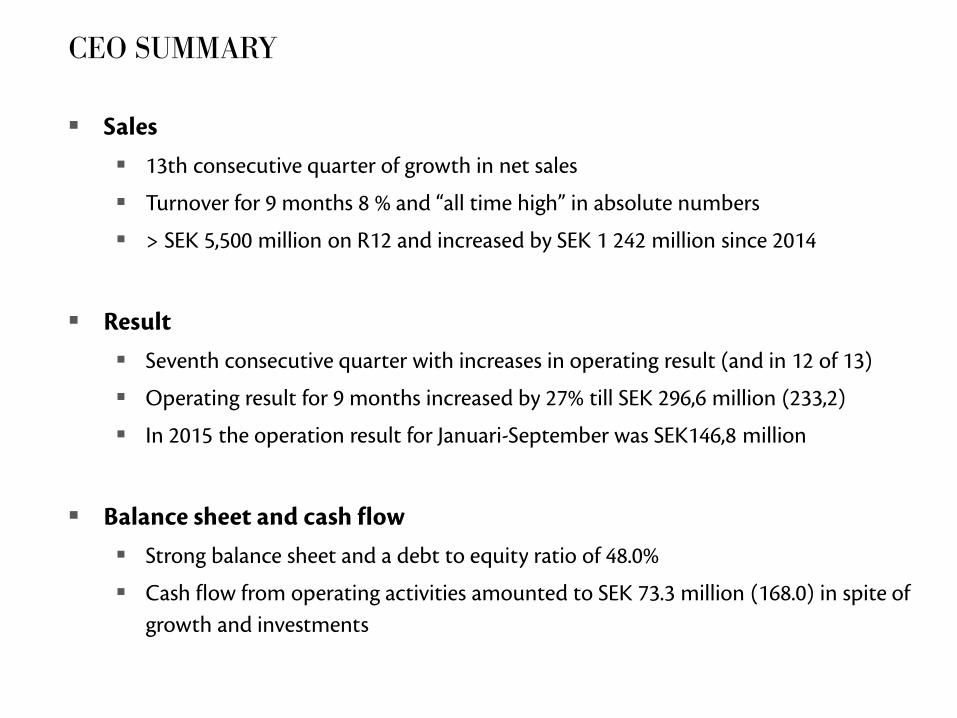
CEO SUMMARY
Sales 13th consecutive quarter of growth in net sales
Turnover for 9 months 8 % and “all time high” in absolute numbers
> SEK 5,500 million on R12 and increased by SEK 1 242 million since 2014
Result Seventh consecutive quarter with increases in operating result (and in 12 of 13)
Operating result for 9 months increased by 27% till SEK 296,6 million (233,2)
In 2015 the operation result for Januari-September was SEK146,8 million
Balance sheet and cash flow Strong balance sheet and a debt to equity ratio of 48.0%
Cash flow from operating activities amounted to SEK 73.3 million (168.0) in spite of growth and investments
CRAFT Teamwear
Increased marketing in USA which starts in the fourth quarter
New collections for ProJob and Jobman
CRAFT shoes in retail first quarter 2018
New warehouses in Germany and Belgium
CEO SUMMARY Future
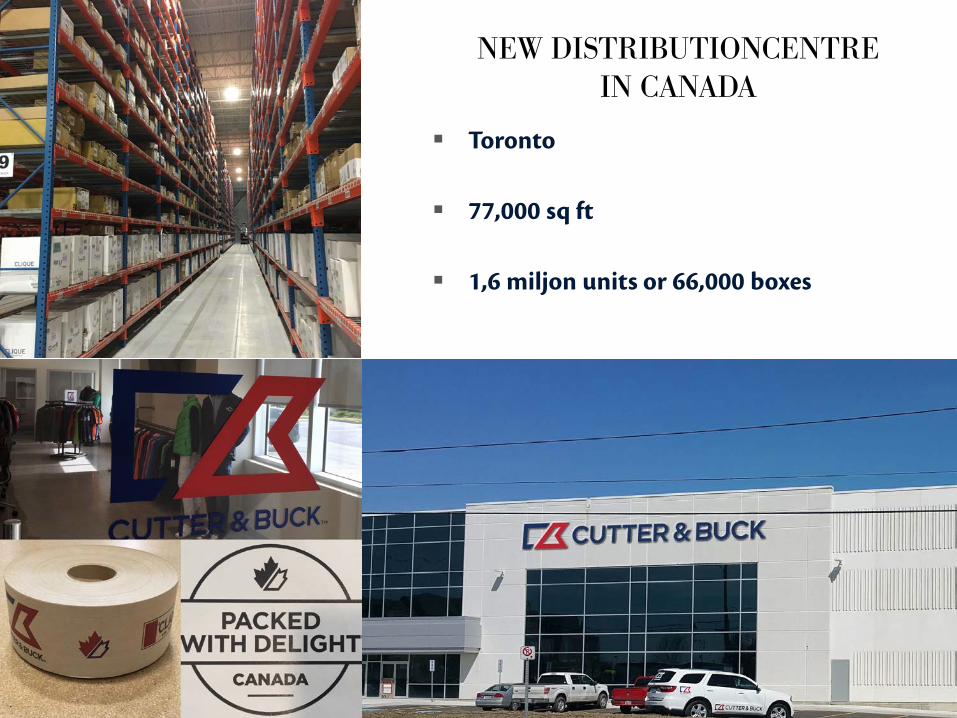
NEW DISTRIBUTIONCENTRE IN CANADA
Toronto
77,000 sq ft
1,6 miljon units or 66,000 boxes

Mattias Stenberg
We strive to make everyone who buys our
products a happy customer. If you choose to
invest in New Wave Group we want you to
know that we promise to take care of your
investment in the best possible way we can —
through long-term thinking, growth, stability
and hard work!