Embed Size (px)
Citation preview
January 3, 2003
Kevin RakinKevin RakinPresident and Chief Executive OfficerPresident and Chief Executive Officer
Kevin RakinKevin RakinPresident and Chief Executive OfficerPresident and Chief Executive Officer
Economic SummitEconomic Summit
andand
Outlook 2003Outlook 2003
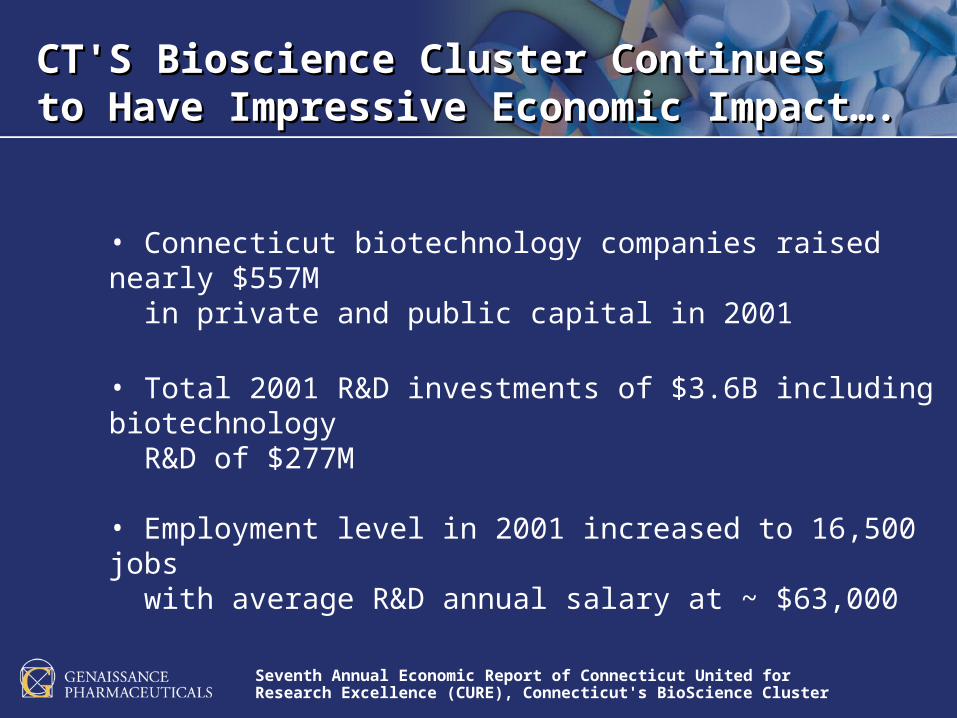
CT'S Bioscience Cluster Continues CT'S Bioscience Cluster Continues to Have Impressive Economic Impact….to Have Impressive Economic Impact….
• Connecticut biotechnology companies raised nearly $557M in private and public capital in 2001
• Total 2001 R&D investments of $3.6B including biotechnology R&D of $277M • Employment level in 2001 increased to 16,500 jobs with average R&D annual salary at ~ $63,000
Seventh Annual Economic Report of Connecticut United for Research Excellence (CURE), Connecticut's BioScience Cluster
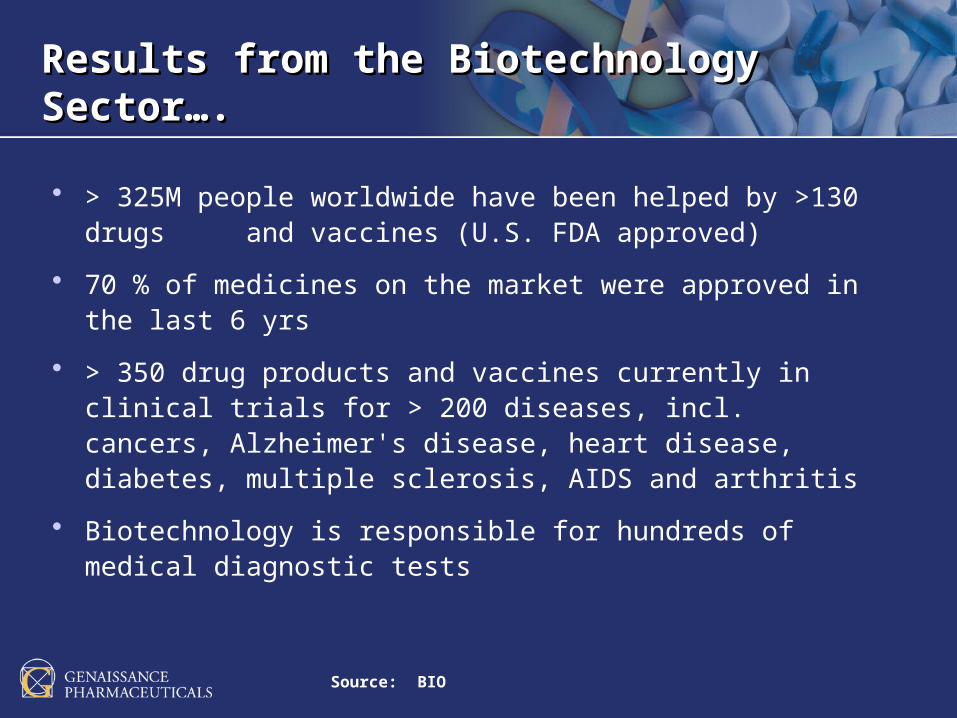
Results from the Biotechnology Sector….Results from the Biotechnology Sector….
> 325M people worldwide have been helped by >130 drugs and vaccines (U.S. FDA approved)
70 % of medicines on the market were approved in the last 6 yrs
> 350 drug products and vaccines currently in clinical trials for > 200 diseases, incl. cancers, Alzheimer's disease, heart disease, diabetes, multiple sclerosis, AIDS and arthritis
Biotechnology is responsible for hundreds of medical diagnostic tests
Source: BIO
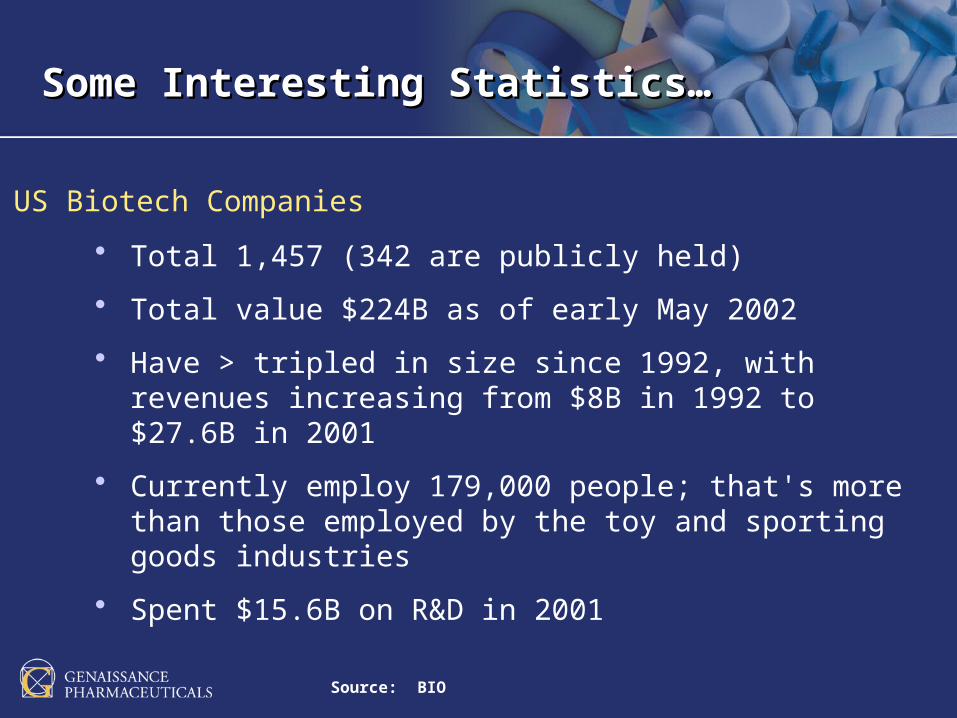
Total 1,457 (342 are publicly held)
Total value $224B as of early May 2002
Have > tripled in size since 1992, with revenues increasing from $8B in 1992 to $27.6B in 2001
Currently employ 179,000 people; that's more than those employed by the toy and sporting goods industries
Spent $15.6B on R&D in 2001
Source: BIO
Some Interesting Statistics…Some Interesting Statistics…
US Biotech Companies
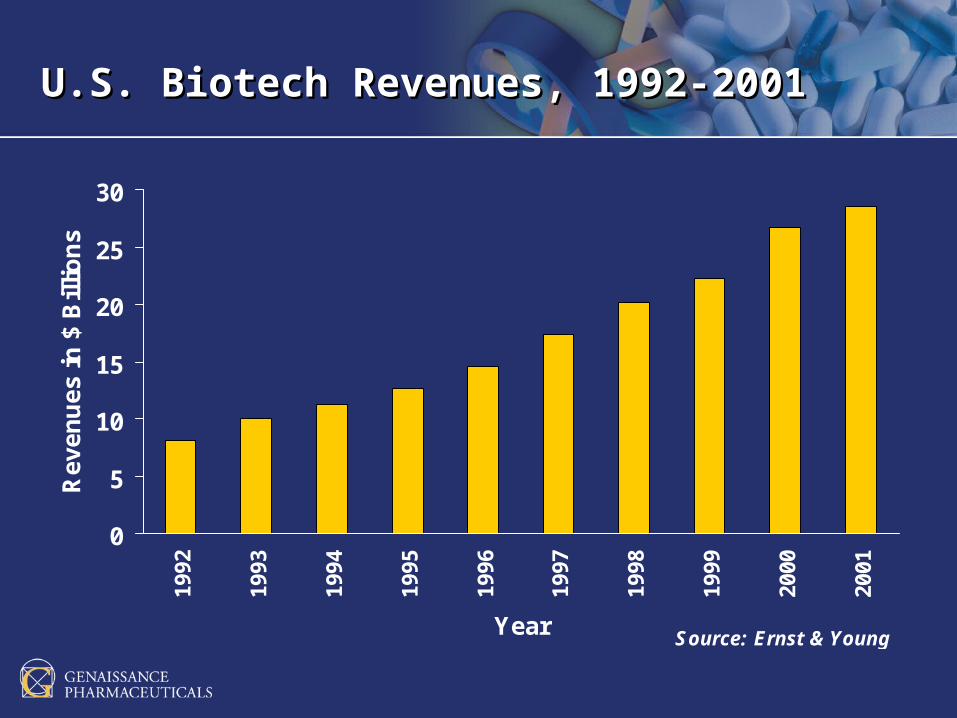
U.S. Biotech Revenues, 1992-2001U.S. Biotech Revenues, 1992-2001
0
5
10
15
20
25
3019
92
1993
1994
1995
1996
1997
1998
1999
2000
2001
Year
Re
ve
nu
es
in
$ B
illi
on
s
Source: Ernst & Young
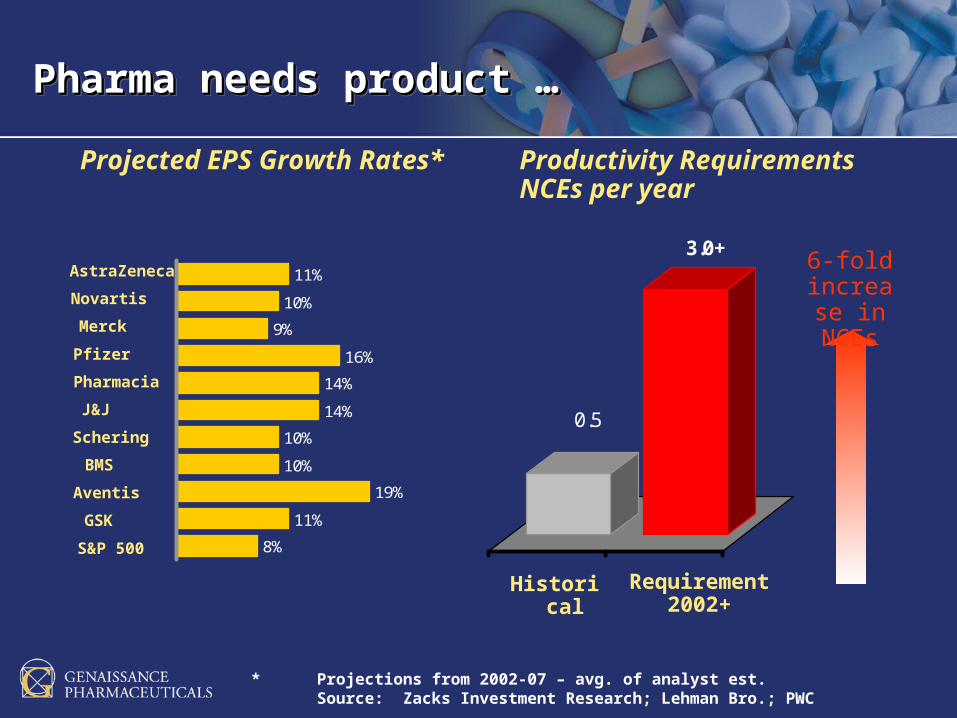
* Projections from 2002-07 – avg. of analyst est.Source:Zacks Investment Research; Lehman Bro.; PWC
Projected EPS Growth Rates*
10%
9%
16%
14%
10%
10%
19%
11%
8%
14%
11%
Productivity RequirementsNCEs per year
0.5
3.0+
Historical Requirement 2002+
6-fold increase in NCEs
Pharma needs product …Pharma needs product …Pharma needs product …Pharma needs product …
Pfizer
Pharmacia
Schering
Aventis
J&J
BMS
Merck
Novartis
AstraZeneca
GSK
S&P 500
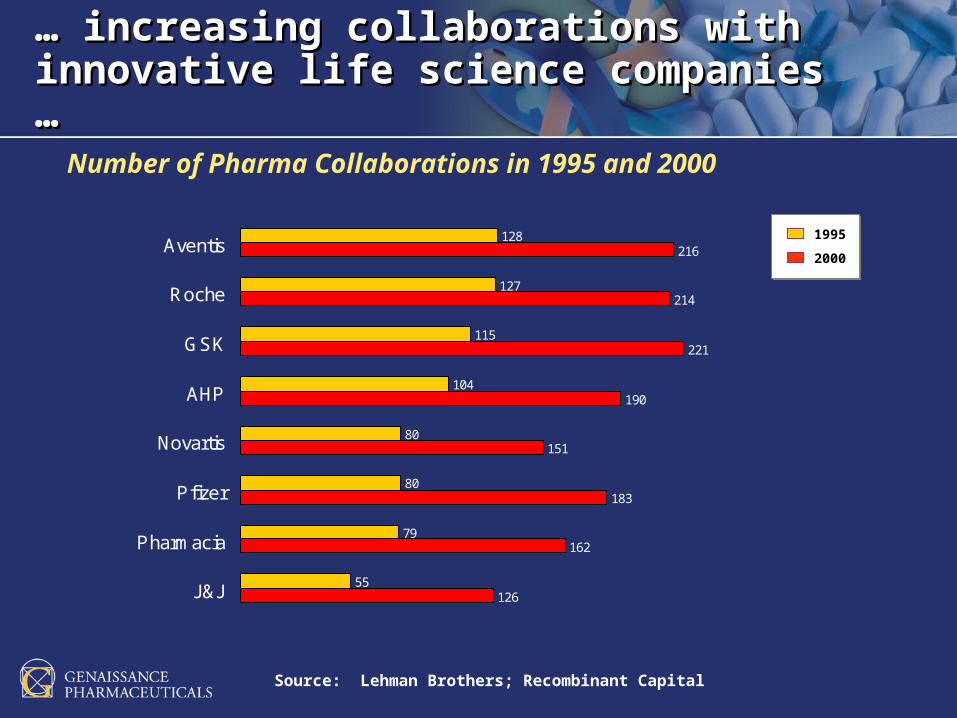
… … increasing collaborations with increasing collaborations with innovative life science companies …innovative life science companies …
Source: Lehman Brothers; Recombinant Capital
Number of Pharma Collaborations in 1995 and 2000
128
127
115
104
80
80
79
55
216
214
221
190
151
183
162
126
Aventis
Roche
GSK
AHP
Novartis
Pfizer
Pharmacia
J&J
1995
2000
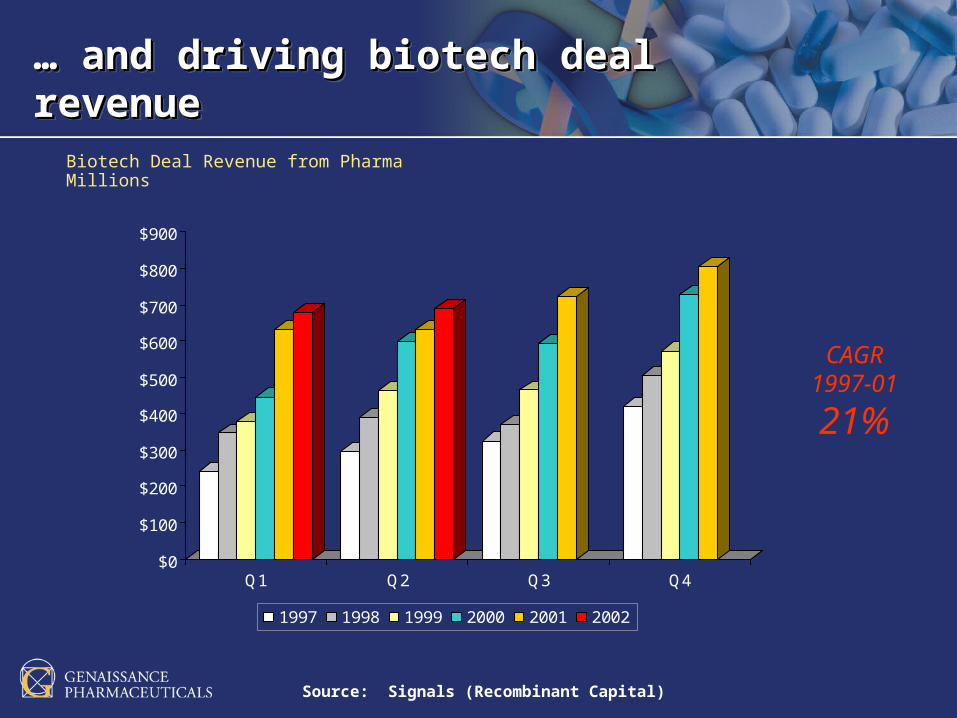
Source:Signals (Recombinant Capital)
… … and driving biotech deal revenueand driving biotech deal revenue… … and driving biotech deal revenueand driving biotech deal revenue
$0
$100
$200
$300
$400
$500
$600
$700
$800
$900
Q1 Q2 Q3 Q4
1997 1998 1999 2000 2001 2002
Biotech Deal Revenue from PharmaMillions
CAGR1997-01
21%
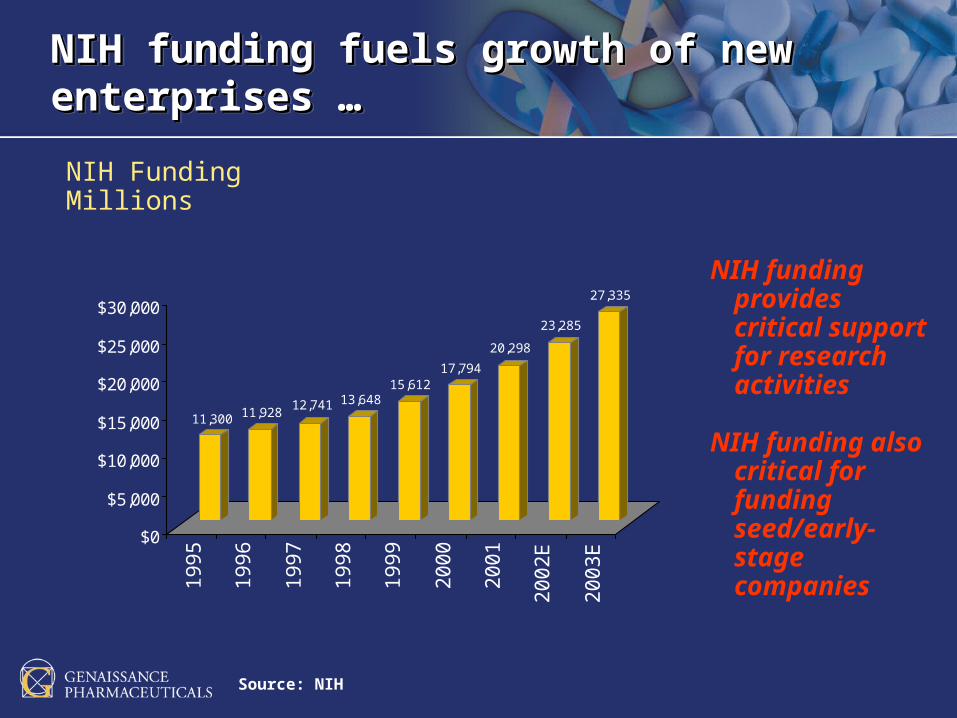
Source: NIH
NIH FundingMillions
NIH funding provides critical support for research activities
NIH funding also critical for funding seed/early-stage companies
NIH funding fuels growth of new enterprises …NIH funding fuels growth of new enterprises …NIH funding fuels growth of new enterprises …NIH funding fuels growth of new enterprises …
11,300 11,92812,741 13,648
15,61217,794
20,298
23,285
27,335
$0
$5,000
$10,000
$15,000
$20,000
$25,000
$30,000
19
95
19
96
19
97
19
98
19
99
20
00
20
01
20
02
E
20
03
E
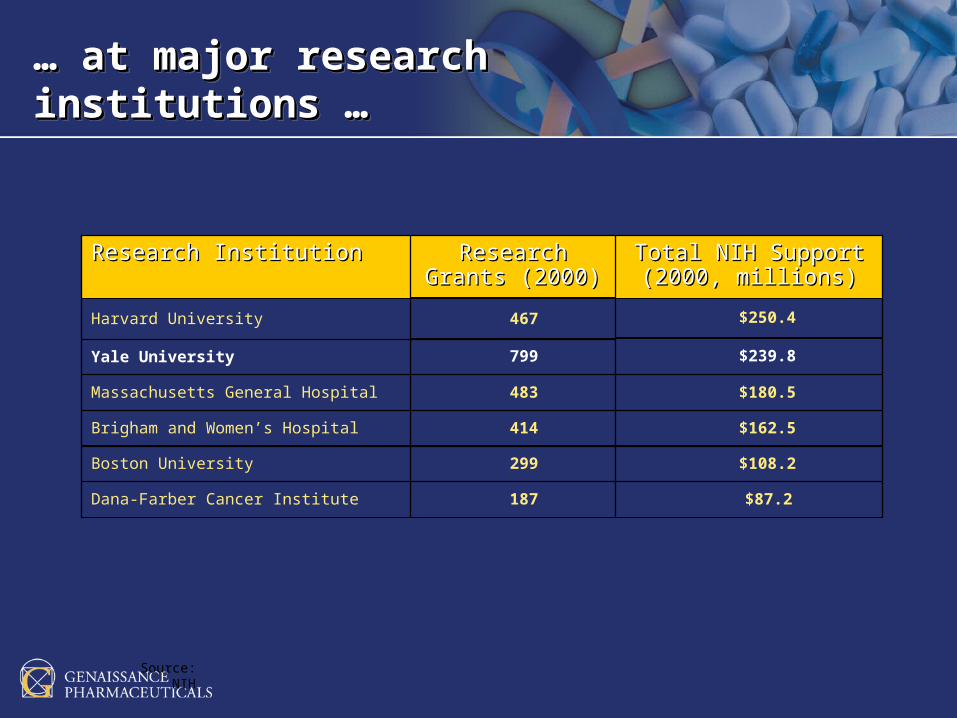
$87.2187Dana-Farber Cancer Institute
$108.2299Boston University
$162.5414Brigham and Women’s Hospital
$180.5483Massachusetts General Hospital
$250.4467Harvard University
Total NIH Support Total NIH Support (2000, millions)(2000, millions)
Research Grants Research Grants (2000)(2000)
Research InstitutionResearch Institution
… … at major research institutions …at major research institutions …… … at major research institutions …at major research institutions …
Source:NIH
Yale University $239.8799
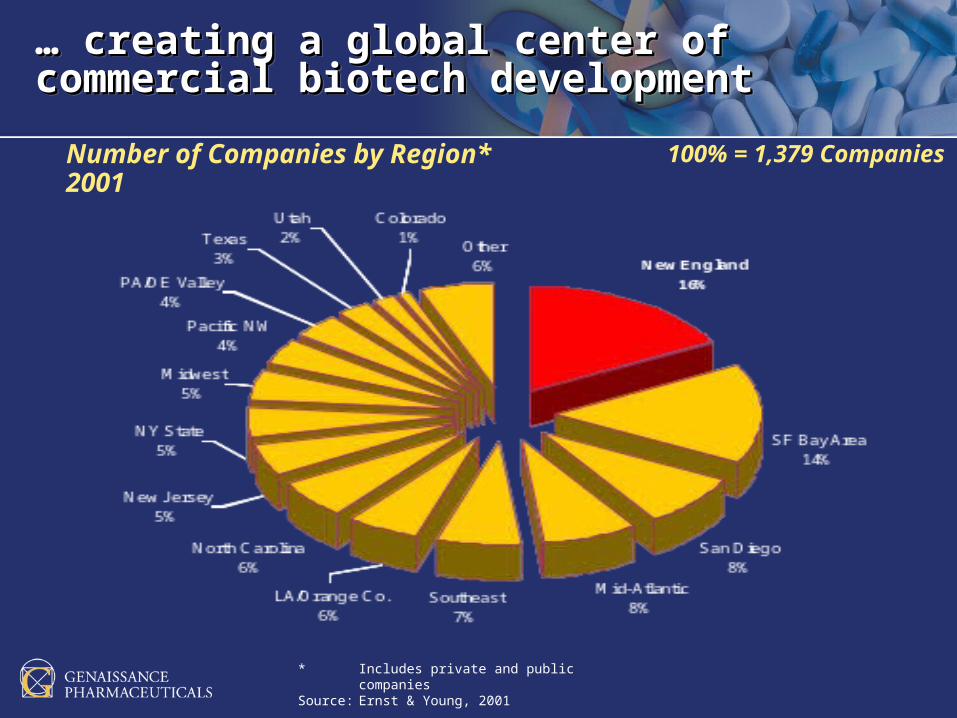
* Includes private and public companiesSource: Ernst & Young, 2001
… … creating a global center of creating a global center of commercial biotech developmentcommercial biotech development… … creating a global center of creating a global center of commercial biotech developmentcommercial biotech development
Number of Companies by Region*2001
100% = 1,379 Companies
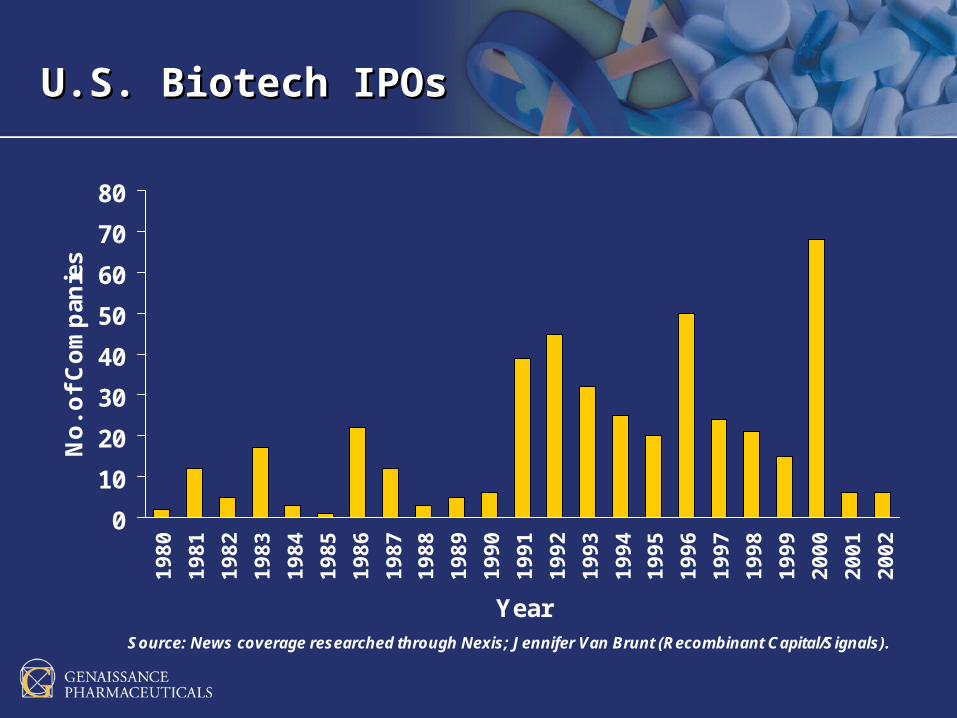
U.S. Biotech IPOsU.S. Biotech IPOs
0
10
20
30
40
50
60
70
801
98
0
19
81
19
82
19
83
19
84
19
85
19
86
19
87
19
88
19
89
19
90
19
91
19
92
19
93
19
94
19
95
19
96
19
97
19
98
19
99
20
00
20
01
20
02
Year
No
. o
f C
om
pan
ies
Source: News coverage researched through Nexis; Jennifer Van Brunt (Recombinant Capital/Signals).
$18.5
$3.5
$1.4
$9.5
$7.2
$10.4
$3.5 $4.0 $3.8
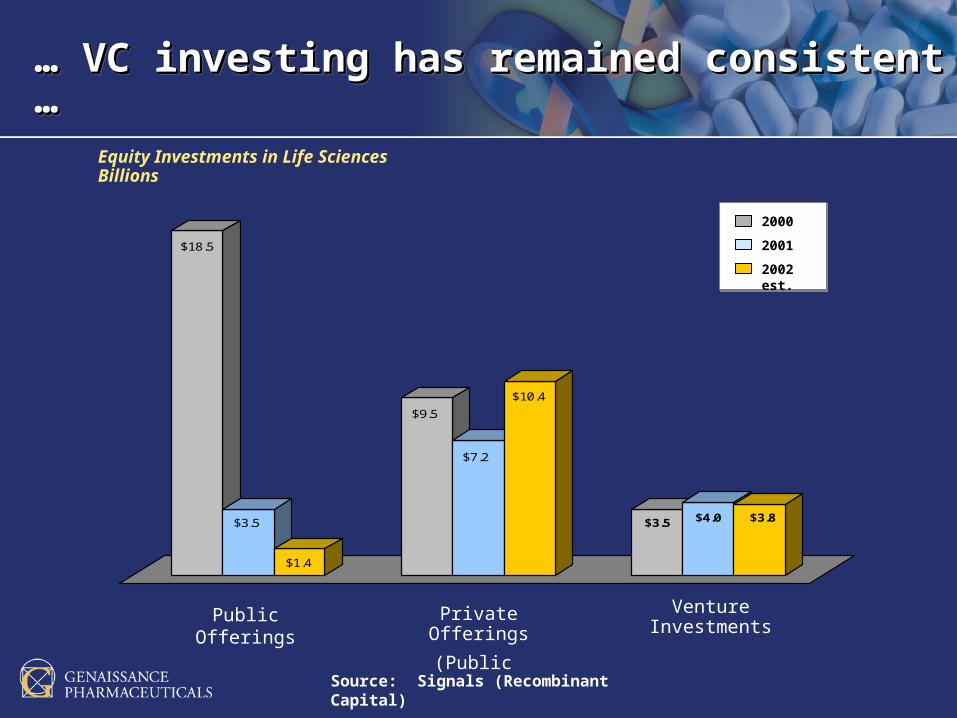
Public Offerings
(Public Companies)
Private Offerings
(Public
Companies)
Venture Investments
(Private Companies)
2000
2001
2002 est.
Source: Signals (Recombinant Capital)
… … VC investing has remained consistent …VC investing has remained consistent …… … VC investing has remained consistent …VC investing has remained consistent …
Equity Investments in Life Sciences Billions
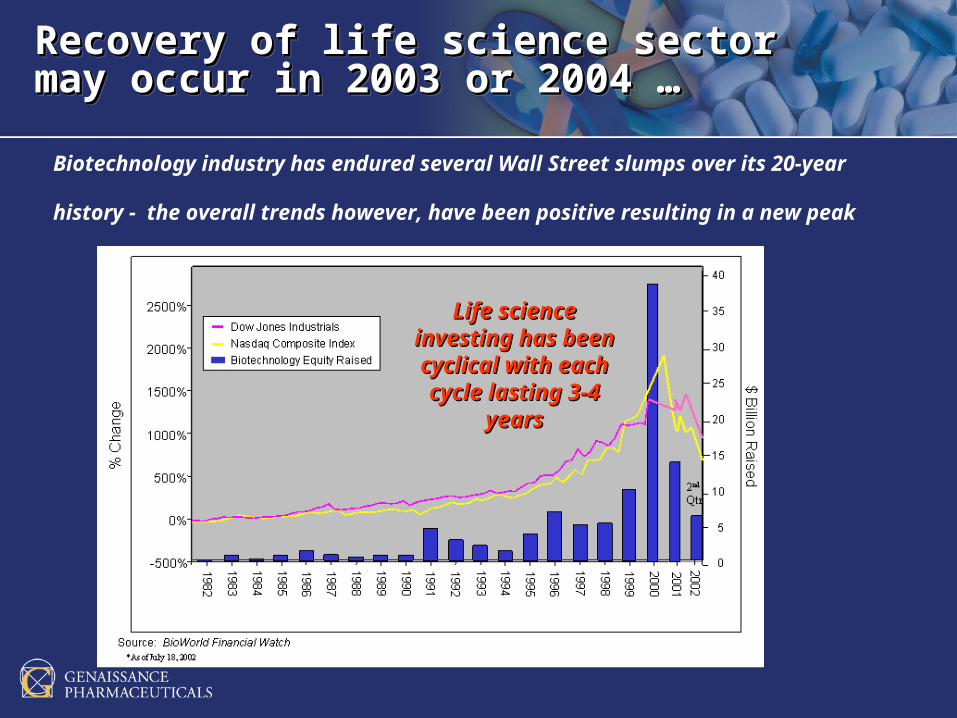
Recovery of life science sectorRecovery of life science sectormay occur in 2003 or 2004 …may occur in 2003 or 2004 …Recovery of life science sectorRecovery of life science sectormay occur in 2003 or 2004 …may occur in 2003 or 2004 …
Life science Life science investing has been investing has been cyclical with each cyclical with each cycle lasting 3-4 cycle lasting 3-4
yearsyears
Biotechnology industry has endured several Wall Street slumps over its 20-year
history - the overall trends however, have been positive resulting in a new peak
In SummaryIn Summary
The biotech sector is a major U.S. industry
Cluster has critical mass in Connnecticut
Drivers exist for continued growth:– Pharma needs biotech for new products and revenue growth– NIH Funding fuels early stage research– Private Investment in the biotech sector continues
Capital markets should improve 2003/04:– Emerging from bottom of the cycle– Companies are becoming more commercially oriented
From Genomics From Genomics to Drugsto Drugs
Personalized Medicine Personalized Medicine From Genomics™From Genomics™