Embed Size (px)
Citation preview

January 27th, 2010
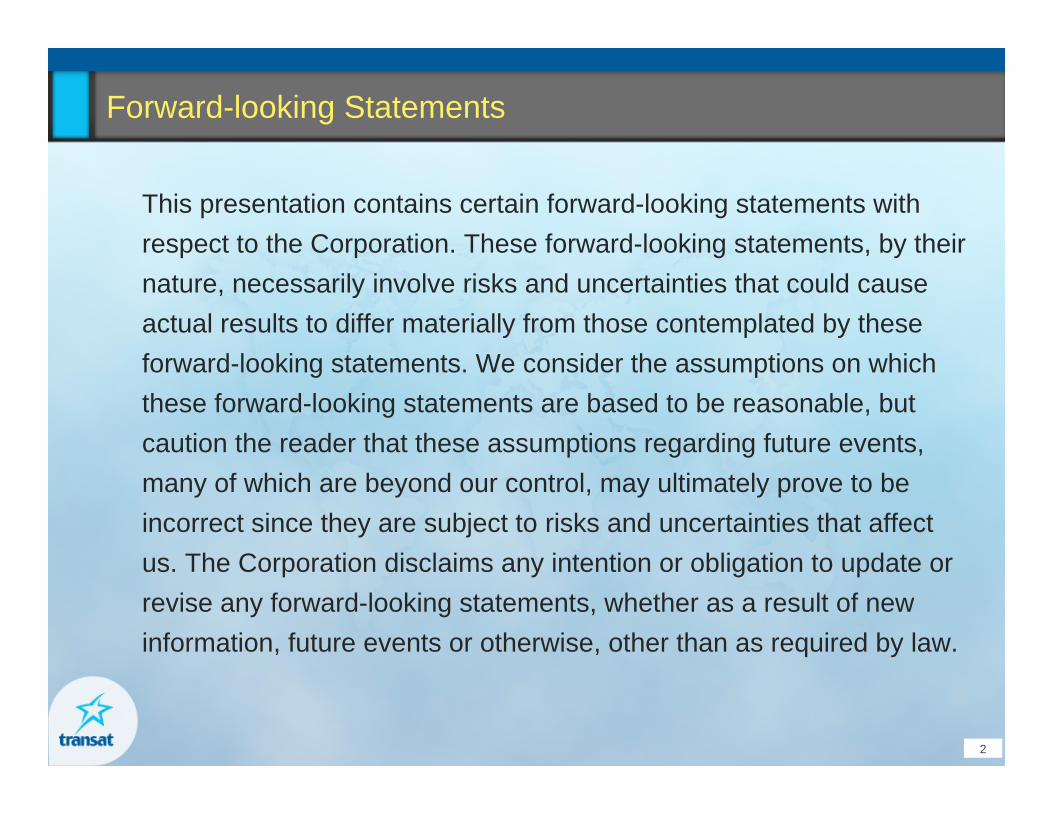
Forward-looking Statements
This presentation contains certain forward-looking statements with respect to the Corporation. These forward-looking statements, by their nature, necessarily involve risks and uncertainties that could cause actual results to differ materially from those contemplated by these forward-looking statements. We consider the assumptions on which these forward-looking statements are based to be reasonable, but caution the reader that these assumptions regarding future events, many of which are beyond our control, may ultimately prove to beincorrect since they are subject to risks and uncertainties that affect us. The Corporation disclaims any intention or obligation to update or revise any forward-looking statements, whether as a result of new information, future events or otherwise, other than as required by law.
2
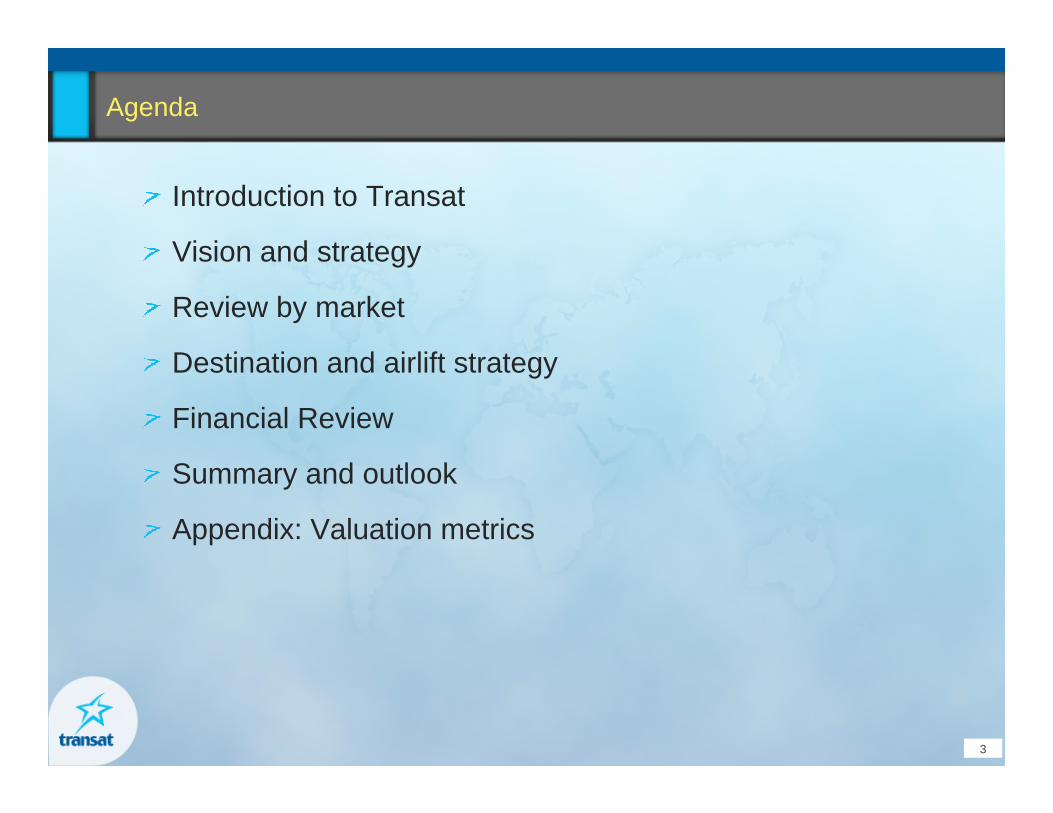
Agenda
Introduction to Transat
Vision and strategy
Review by market
Destination and airlift strategy
Financial Review
Summary and outlook
Appendix: Valuation metrics
3
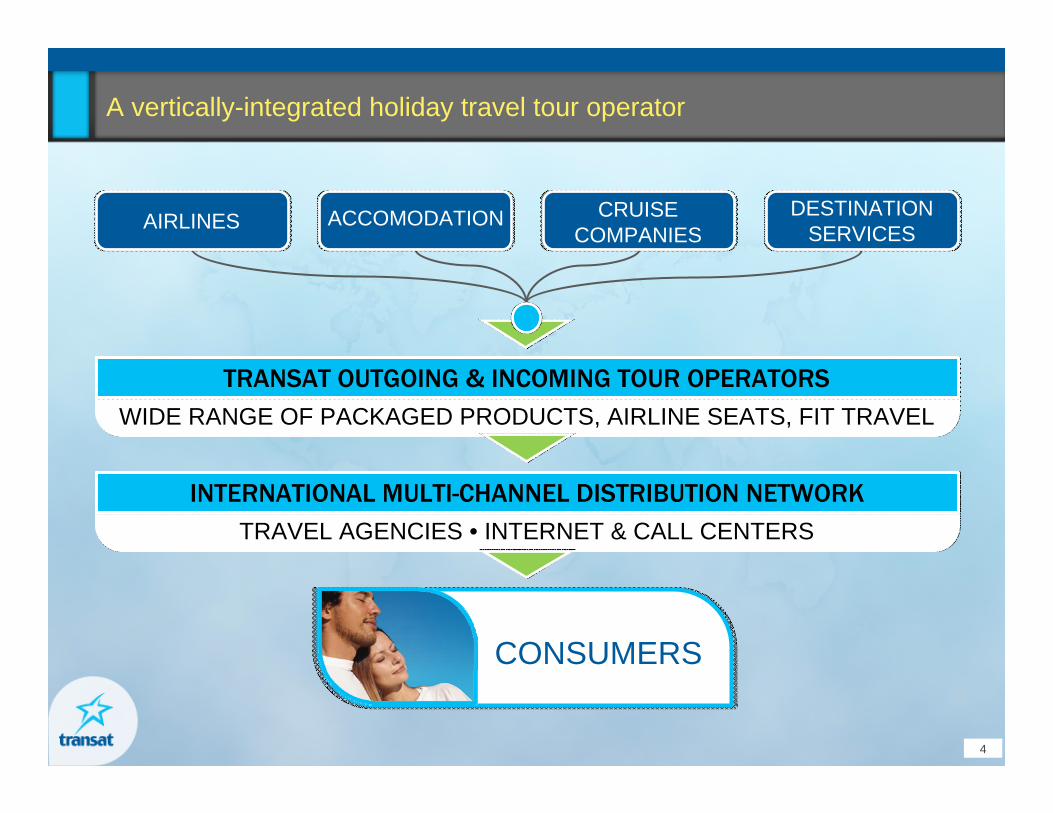
A vertically-integrated holiday travel tour operator
4
CONSUMERS
WIDE RANGE OF PACKAGED PRODUCTS, AIRLINE SEATS, FIT TRAVELTRANSAT OUTGOING & INCOMING TOUR OPERATORS
TRAVEL AGENCIES • INTERNET & CALL CENTERSINTERNATIONAL MULTI-CHANNEL DISTRIBUTION NETWORK
AIRLINES ACCOMODATION CRUISE COMPANIES
DESTINATION SERVICES
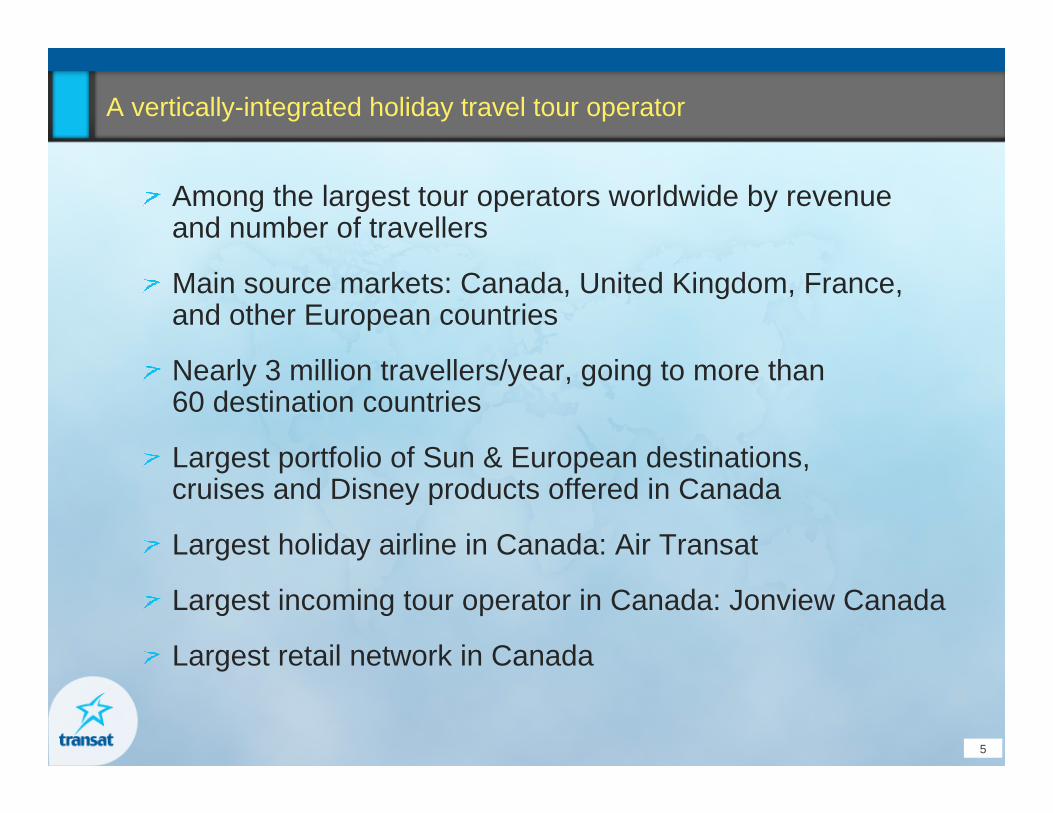
A vertically-integrated holiday travel tour operator
Among the largest tour operators worldwide by revenueand number of travellers
Main source markets: Canada, United Kingdom, France,and other European countries
Nearly 3 million travellers/year, going to more than60 destination countries
Largest portfolio of Sun & European destinations,cruises and Disney products offered in Canada
Largest holiday airline in Canada: Air Transat
Largest incoming tour operator in Canada: Jonview Canada
Largest retail network in Canada
5
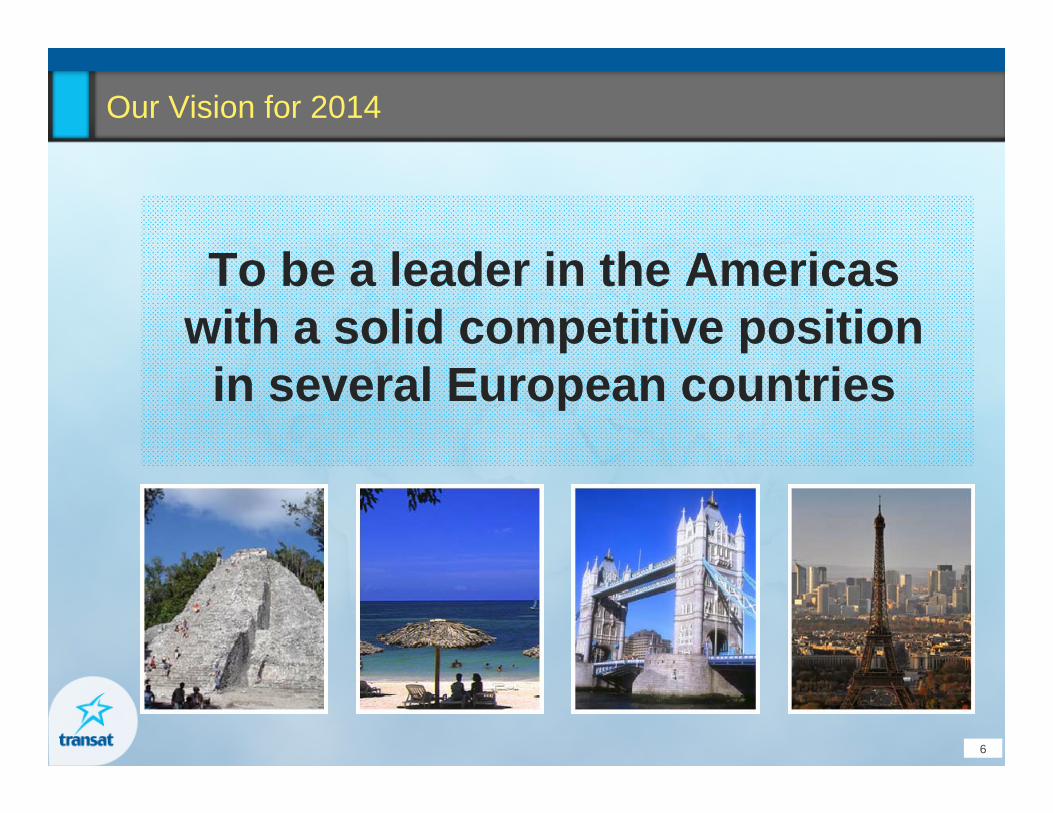
Our Vision for 2014
6
To be a leader in the Americaswith a solid competitive position
in several European countries
1
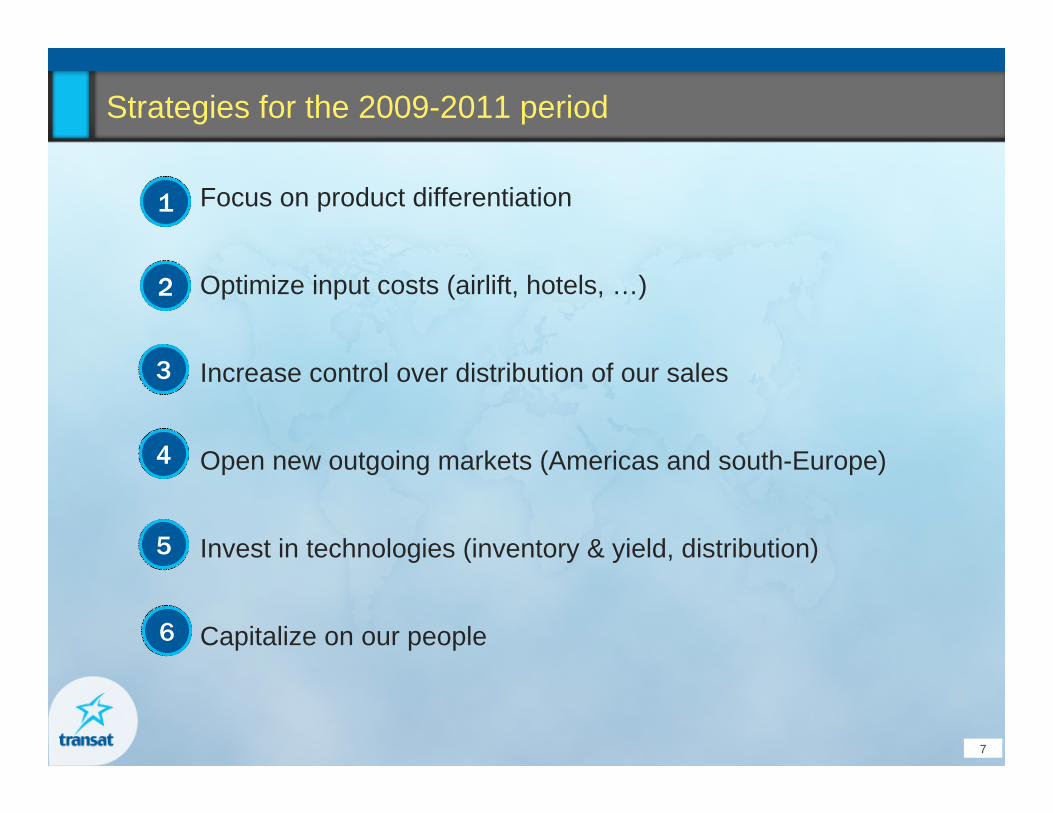
Strategies for the 2009-2011 period
Focus on product differentiation
Optimize input costs (airlift, hotels, …)
Increase control over distribution of our sales
Open new outgoing markets (Americas and south-Europe)
Invest in technologies (inventory & yield, distribution)
Capitalize on our people
7
2
3
4
5
6
Canada to Sun destinations: Overview
Growth market:
Commoditized market with positive growth pattern (last year: 2.7 million packages sold; + 13% for Mexico/Caribbean; + 17% for Transat)
Highly competitive market, showing signs of consolidation in the tour operator segment, marked by intensified presence of scheduled carriers
Outlook for Winter 2010:
Surveys indicate consumers’ confidence level and travel intentions on positive trends compared with 2009
Continued trend towards last-minute bookings
Consumers scaling back their holidays?
Majority of customers use the Internet to retrieve information,but up to 60% of them use a travel agent
8Source: Conference Board of Canada, October 2009
-
Canada to Sun Destinations: Market
9
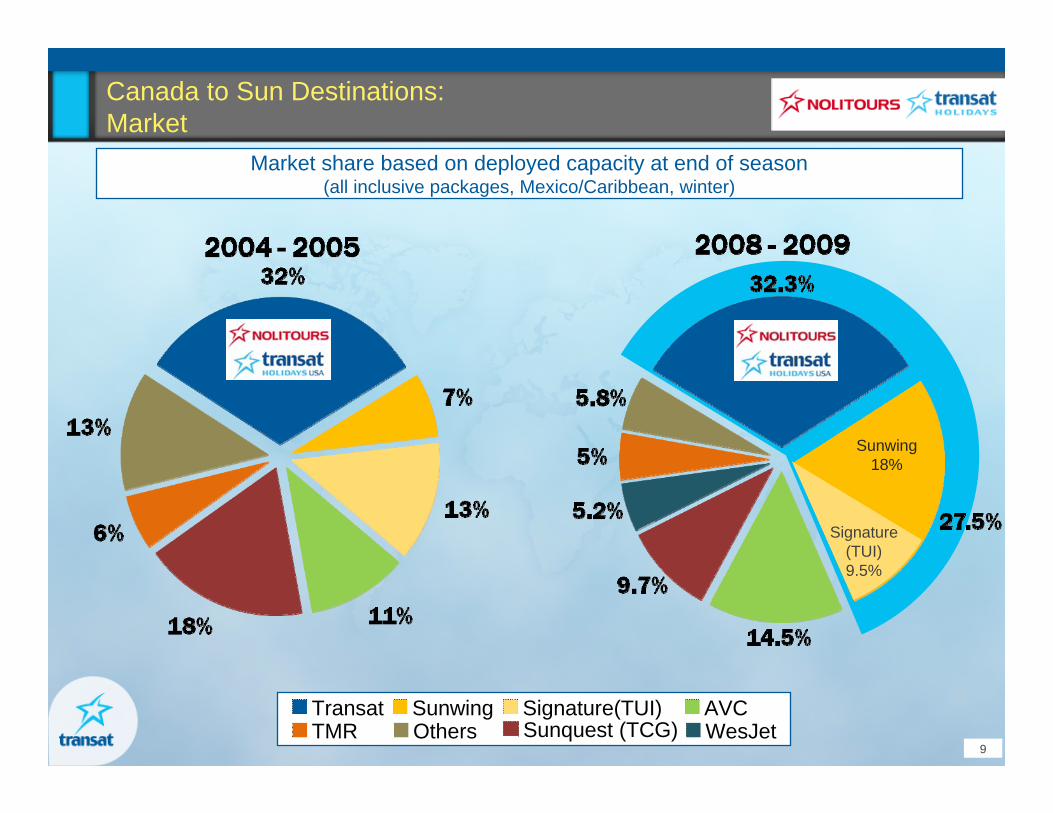
Market share based on deployed capacity at end of season(all inclusive packages, Mexico/Caribbean, winter)
Transat Sunwing AVCSunquest (TCG)Signature(TUI)
TMR Others WesJet
Sunwing18%
Signature(TUI)9.5%
Canada to sun destinations:Strategy
Canjet 5-year agreement Enhanced ability to expand and contract capacity in a very
cost-competitive way
Hotel costs and commitments Adjusted product mix vs. demand for winter 2009-2010
Increased purchasing power due to lower demand from other countries
Distribution Capitalize on our position and pursue expansion (453 agencies in Canada)
Increase controlled sales (made through our travel agencies or websites)
Loyalty / incentive programs for travel agents
Strategic realignment of marketing expenses
Lowering of costs
10
Transatlantic Market: Overview
Europe, especially France and UK, remains the number one regional market for international tourism (incoming and outgoing)
New liberalization agreements could bring challenges and growth opportunities
Easy for travellers to compare rates; fair proportion of air-only and internet bookings
Competitive market, easy to penetrate, but demanding (frequent failures: Zoom Airlines, Flyglobespan).
11
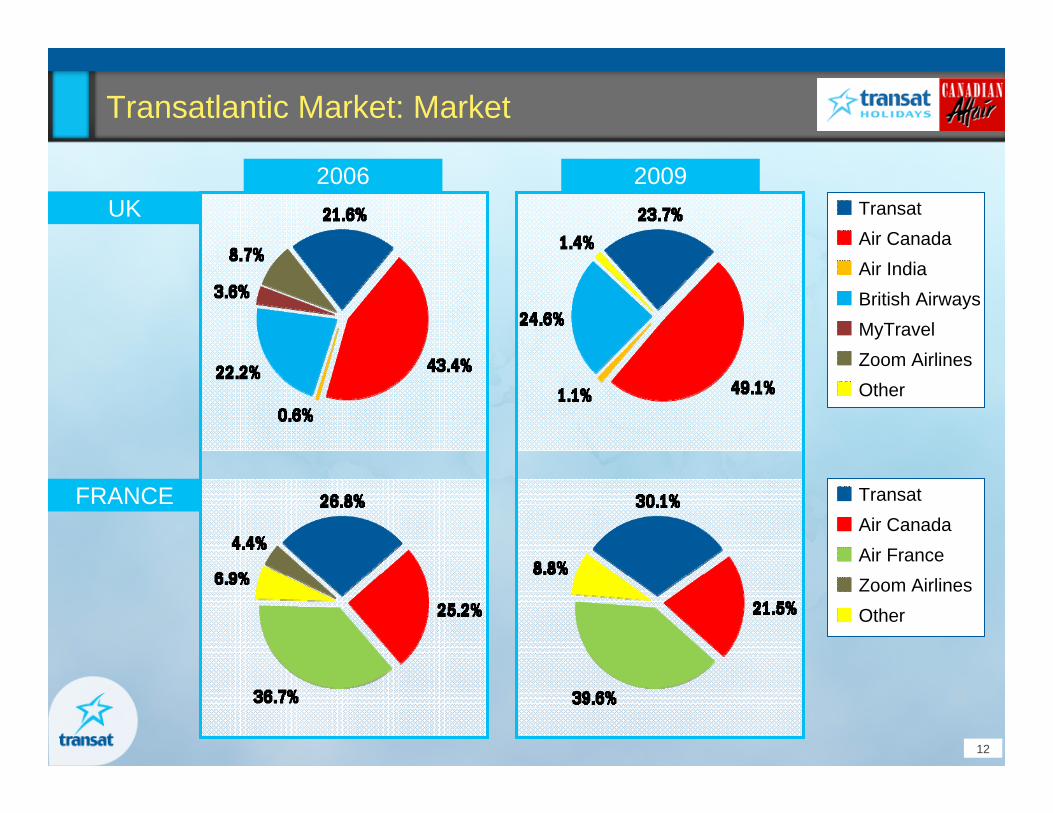
Transatlantic Market: Market
12
2006UK
FRANCE
2009TransatAir CanadaAir IndiaBritish AirwaysMyTravelZoom AirlinesOther
TransatAir CanadaAir FranceZoom AirlinesOther
Transatlantic Market: Strategy
Unique value proposition to the traveller:
Only player with a point-to-point strategy between 9 Canadianand 34 European destinations
Offering uniquely suited to the leisure traveller(no connection, possibility of open jaws, etc.)
Only major tour operator with a full array of land portionin Canada and in Europe
Solid distribution networks on both sides of the Atlantic
Leader in France and UK on Canada
Network of GSAs in 10 other countries
Implementing an enhanced Web-based FIT platformto meet future demand
13FIT: Foreign independent travel
Outgoing market from France: Overview
Fragmented market, with market consolidating
5 tour operators represent 61% of the market,vs. ten 5 years ago
Nearly 250 tour operators share the remaining 30%
Large players growing their market share
International travel has recorded slow growth (1.4% CAGR) over the last 10 years
Distribution is highly concentrated
4 groups control 71% of the market
14
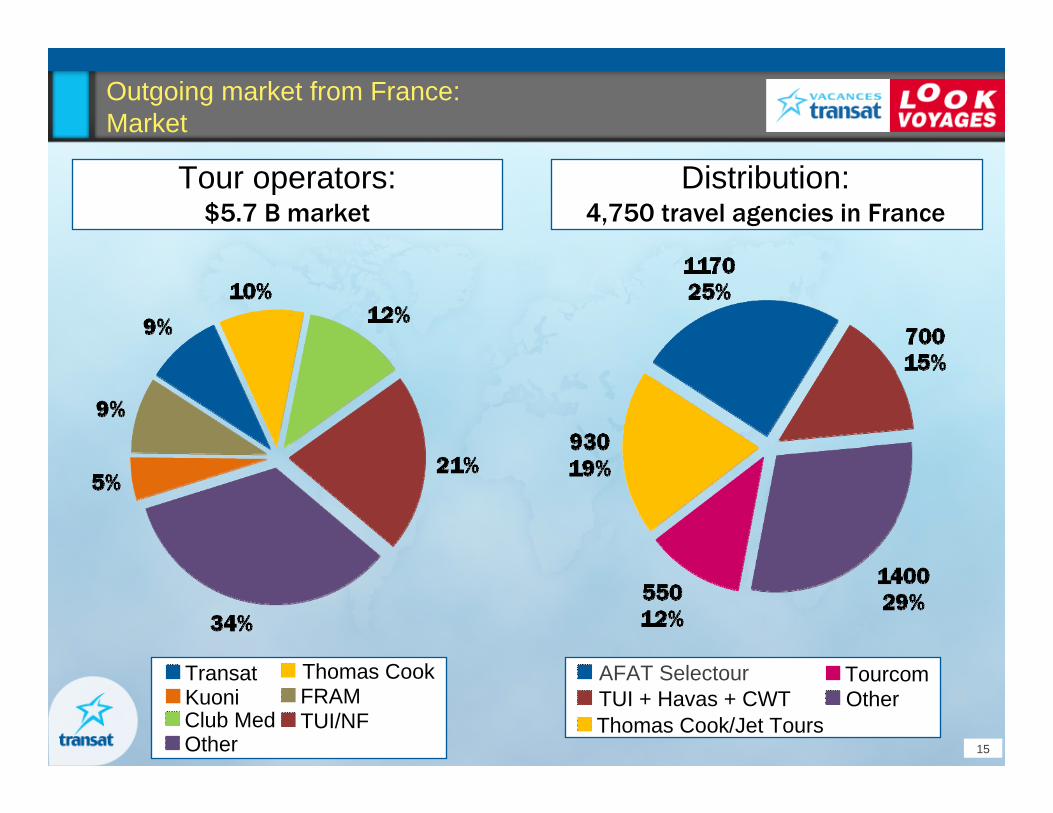
Outgoing market from France: Market
15
Transat Thomas Cook
Club Med TUI/NFOther
Kuoni FRAM
Tour operators:$5.7 B market
Distribution:4,750 travel agencies in France
AFAT Selectour TourcomOtherTUI + Havas + CWT
Thomas Cook/Jet Tours
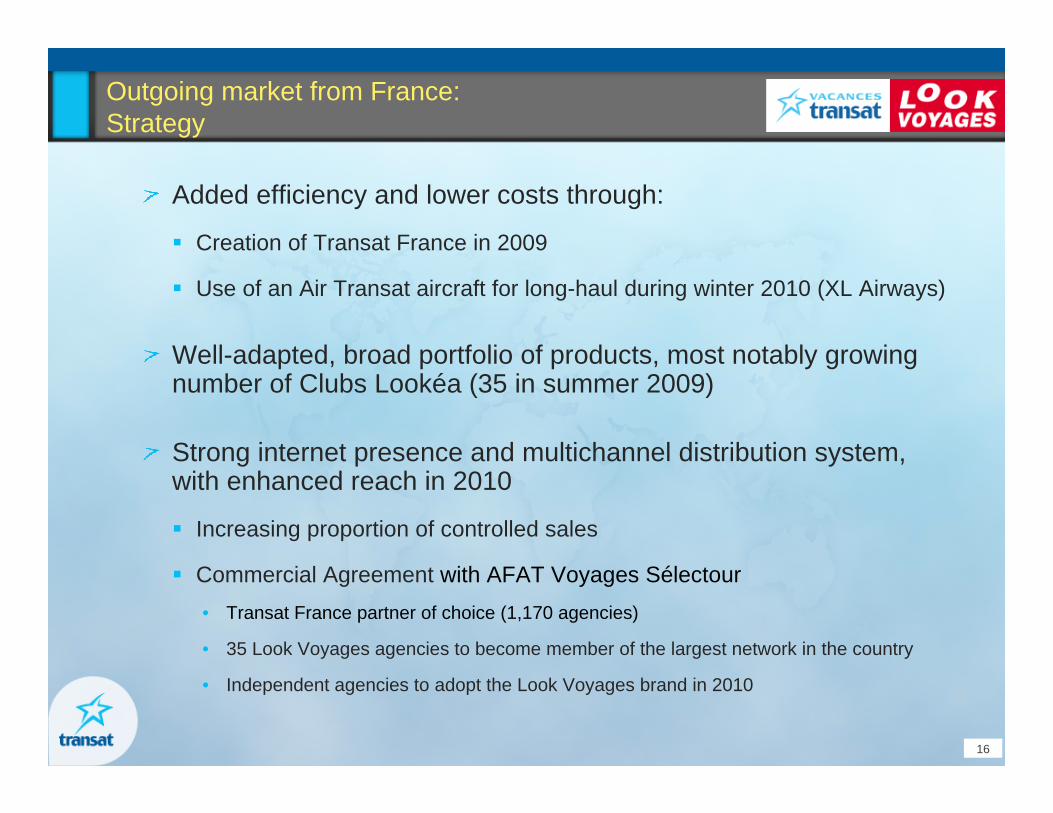
Outgoing market from France:Strategy
Added efficiency and lower costs through:
Creation of Transat France in 2009
Use of an Air Transat aircraft for long-haul during winter 2010 (XL Airways)
Well-adapted, broad portfolio of products, most notably growing number of Clubs Lookéa (35 in summer 2009)
Strong internet presence and multichannel distribution system, with enhanced reach in 2010
Increasing proportion of controlled sales
Commercial Agreement with AFAT Voyages Sélectour• Transat France partner of choice (1,170 agencies)
• 35 Look Voyages agencies to become member of the largest network in the country
• Independent agencies to adopt the Look Voyages brand in 2010
16
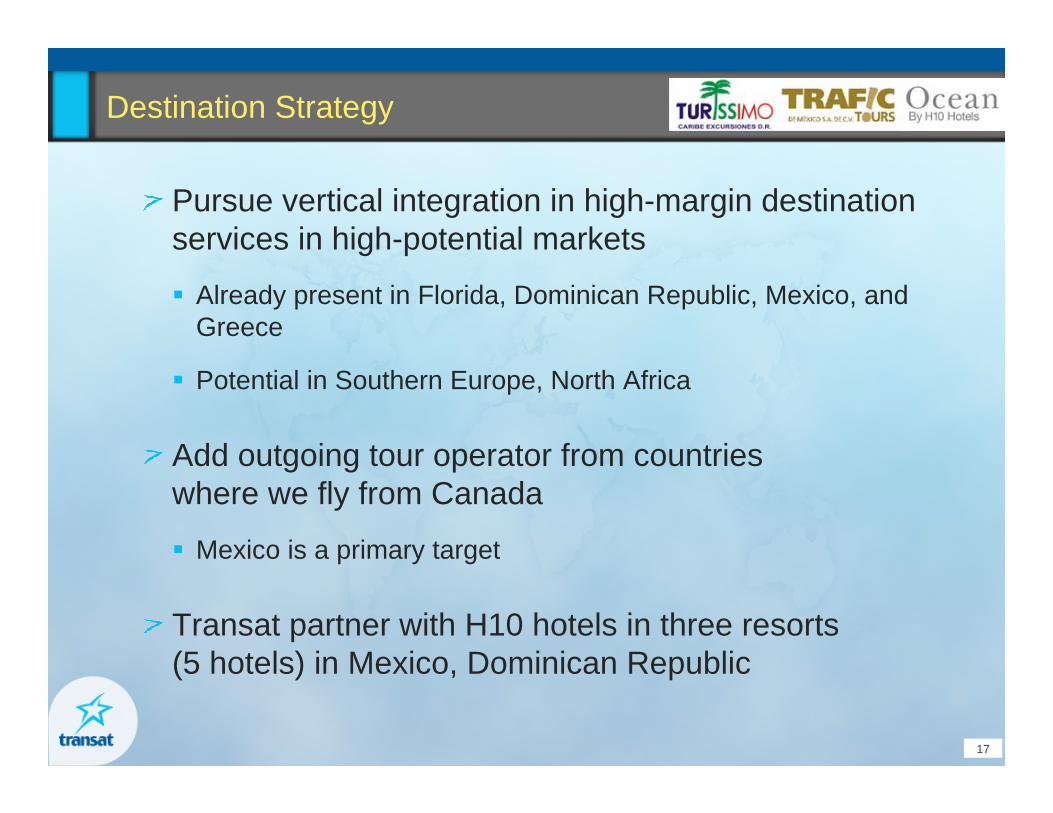
Destination Strategy
Pursue vertical integration in high-margin destination services in high-potential markets
Already present in Florida, Dominican Republic, Mexico, and Greece
Potential in Southern Europe, North Africa
Add outgoing tour operator from countrieswhere we fly from Canada
Mexico is a primary target
Transat partner with H10 hotels in three resorts(5 hotels) in Mexico, Dominican Republic
17
Airlift capacity management
More holistic, supply-driven approach, with embedded flexibility (third party suppliers, access to a mixed fleet)
Objectives:
Ability to expand and contract depending on demand fluctuations or external events, per market
Priority: have the most efficient aircraft for a given route
Air Transat fleet strategy: replace A310s by A330s by 2013 (implementation has started end of 2009)
Sourcing of airlift:
Air Transat: 50% of our overall needs (Transat uses more than 60 airlines overall)
Canjet: very good solution for the South from Canada
Excellent agreement with Thomas Cook Airlines and other wide-body suppliers
Innovative solutions (exchange of aircraft)
18
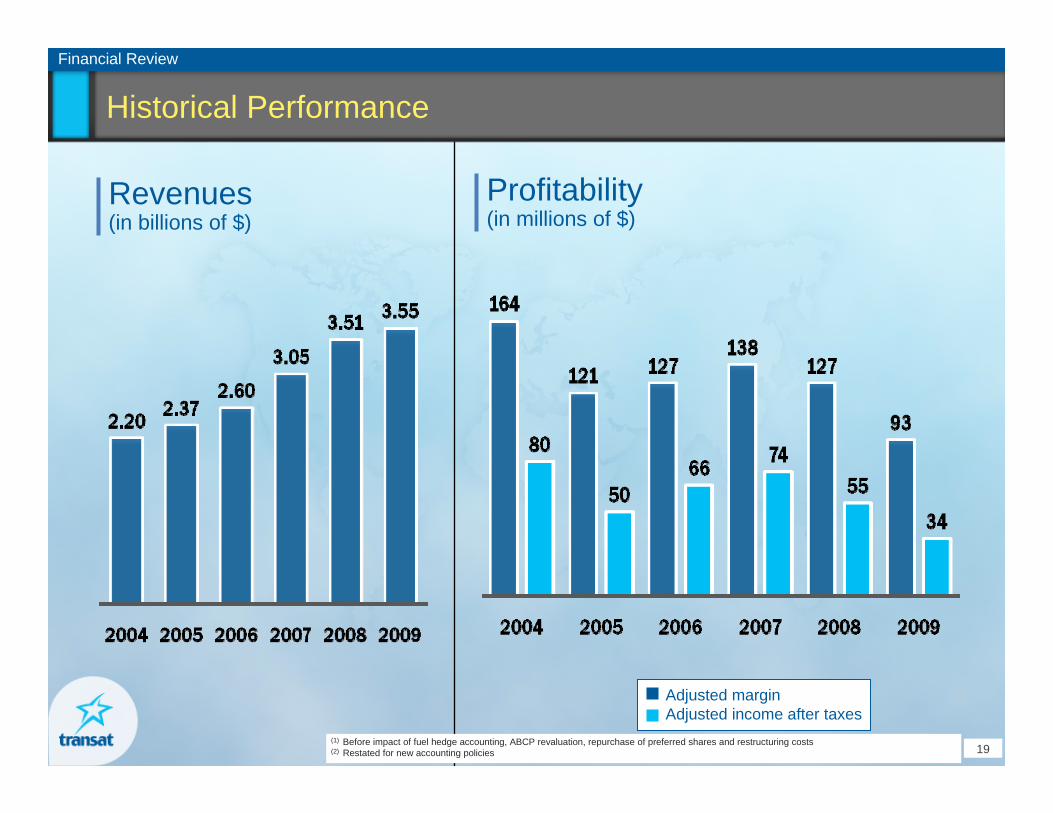
Historical Performance
19
Revenues(in billions of $)
Financial Review
Profitability(in millions of $)
Adjusted marginAdjusted income after taxes
(1) Before impact of fuel hedge accounting, ABCP revaluation, repurchase of preferred shares and restructuring costs(2) Restated for new accounting policies
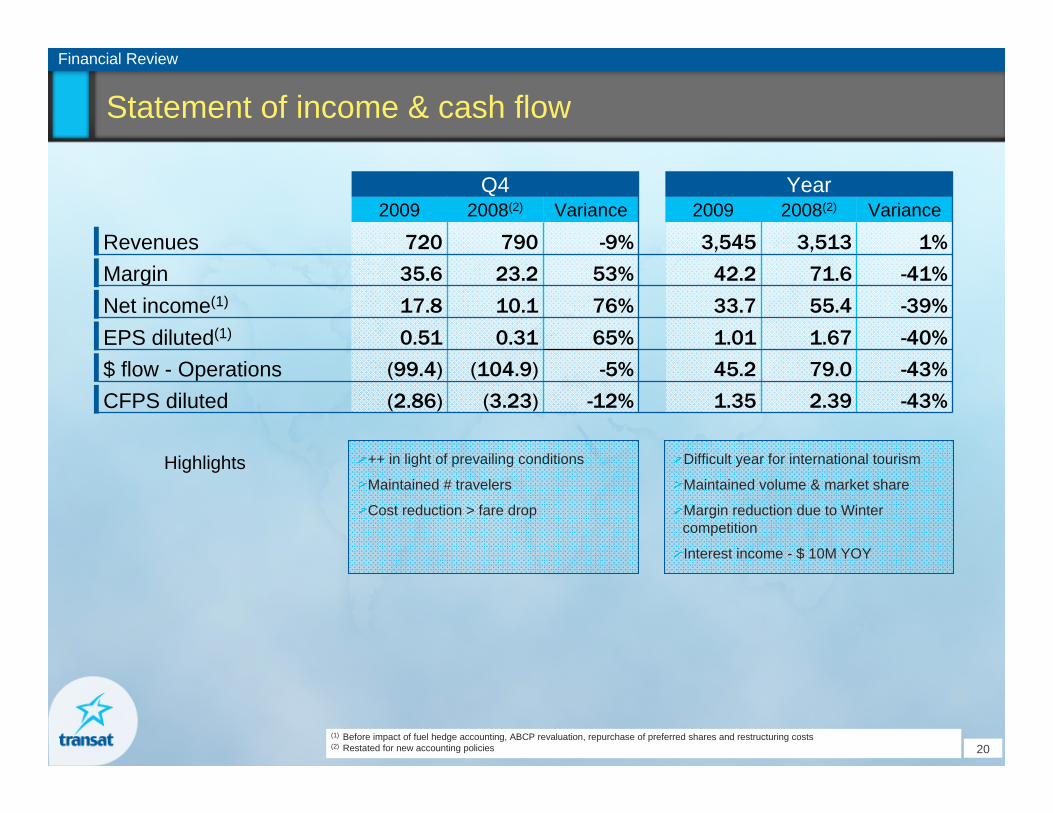
Statement of income & cash flow
++ in light of prevailing conditions
Maintained # travelers
Cost reduction > fare drop
Difficult year for international tourism
Maintained volume & market share
Margin reduction due to Winter competition
Interest income - $ 10M YOY
20
Financial Review
Q4 Year2009 2008(2) Variance 2009 2008(2) Variance
Revenues 720 790 -9% 3,545 3,513 1%
Margin 35.6 23.2 53% 42.2 71.6 -41%
Net income(1) 17.8 10.1 76% 33.7 55.4 -39%
EPS diluted(1) 0.51 0.31 65% 1.01 1.67 -40%
$ flow - Operations (99.4) (104.9) -5% 45.2 79.0 -43%
CFPS diluted (2.86) (3.23) -12% 1.35 2.39 -43%
Highlights
(1) Before impact of fuel hedge accounting, ABCP revaluation, repurchase of preferred shares and restructuring costs(2) Restated for new accounting policies
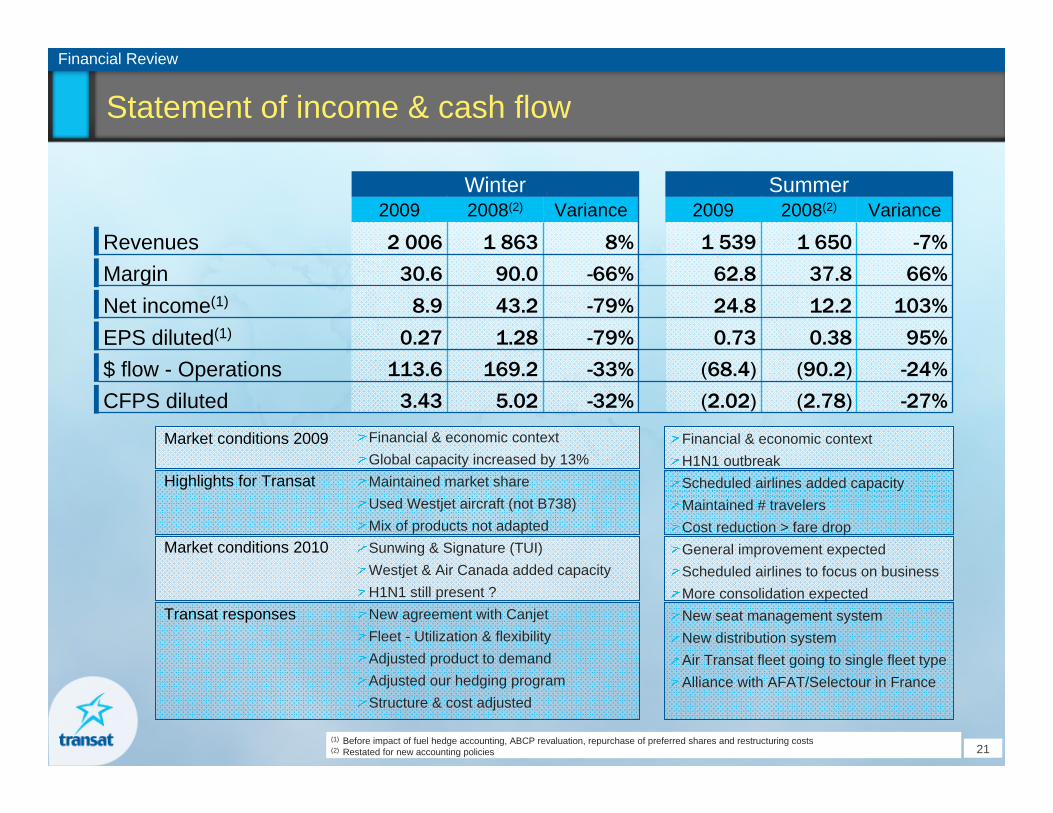
Statement of income & cash flow
Financial & economic contextGlobal capacity increased by 13%Maintained market shareUsed Westjet aircraft (not B738)Mix of products not adaptedSunwing & Signature (TUI)Westjet & Air Canada added capacityH1N1 still present ?New agreement with CanjetFleet - Utilization & flexibilityAdjusted product to demandAdjusted our hedging programStructure & cost adjusted
Financial & economic contextH1N1 outbreakScheduled airlines added capacityMaintained # travelersCost reduction > fare dropGeneral improvement expectedScheduled airlines to focus on businessMore consolidation expectedNew seat management systemNew distribution systemAir Transat fleet going to single fleet typeAlliance with AFAT/Selectour in France
21
Financial Review
Winter Summer2009 2008(2) Variance 2009 2008(2) Variance
Revenues 2 006 1 863 8% 1 539 1 650 -7%
Margin 30.6 90.0 -66% 62.8 37.8 66%
Net income(1) 8.9 43.2 -79% 24.8 12.2 103%
EPS diluted(1) 0.27 1.28 -79% 0.73 0.38 95%
$ flow - Operations 113.6 169.2 -33% (68.4) (90.2) -24%
CFPS diluted 3.43 5.02 -32% (2.02) (2.78) -27%
Market conditions 2009
Highlights for Transat
Market conditions 2010
Transat responses
(1) Before impact of fuel hedge accounting, ABCP revaluation, repurchase of preferred shares and restructuring costs(2) Restated for new accounting policies
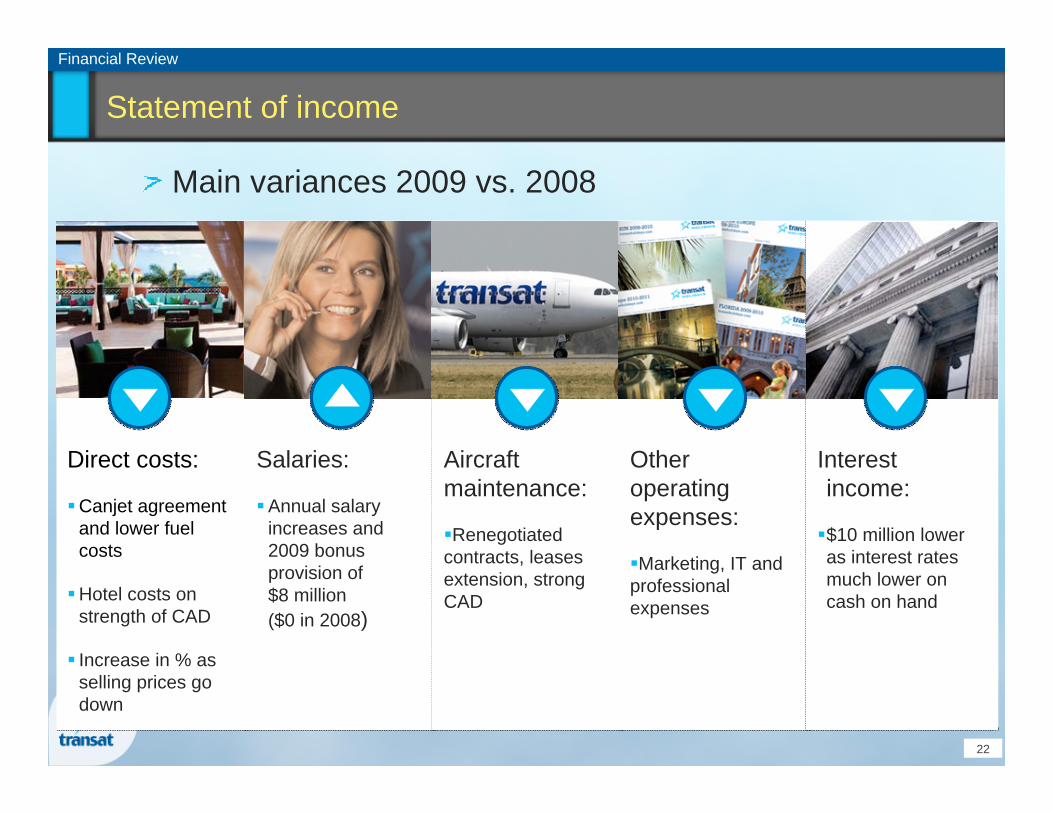
Statement of income
Main variances 2009 vs. 2008
22
Financial Review
Direct costs:
Canjet agreement and lower fuel costs
Hotel costs on strength of CAD
Increase in % as selling prices go down
Salaries:
Annual salary increases and 2009 bonus provision of $8 million ($0 in 2008)
Aircraft maintenance:
Renegotiated contracts, leases extension, strong CAD
Other operating expenses:
Marketing, IT and professional expenses
Interest income:
$10 million lower as interest rates much lower on cash on hand
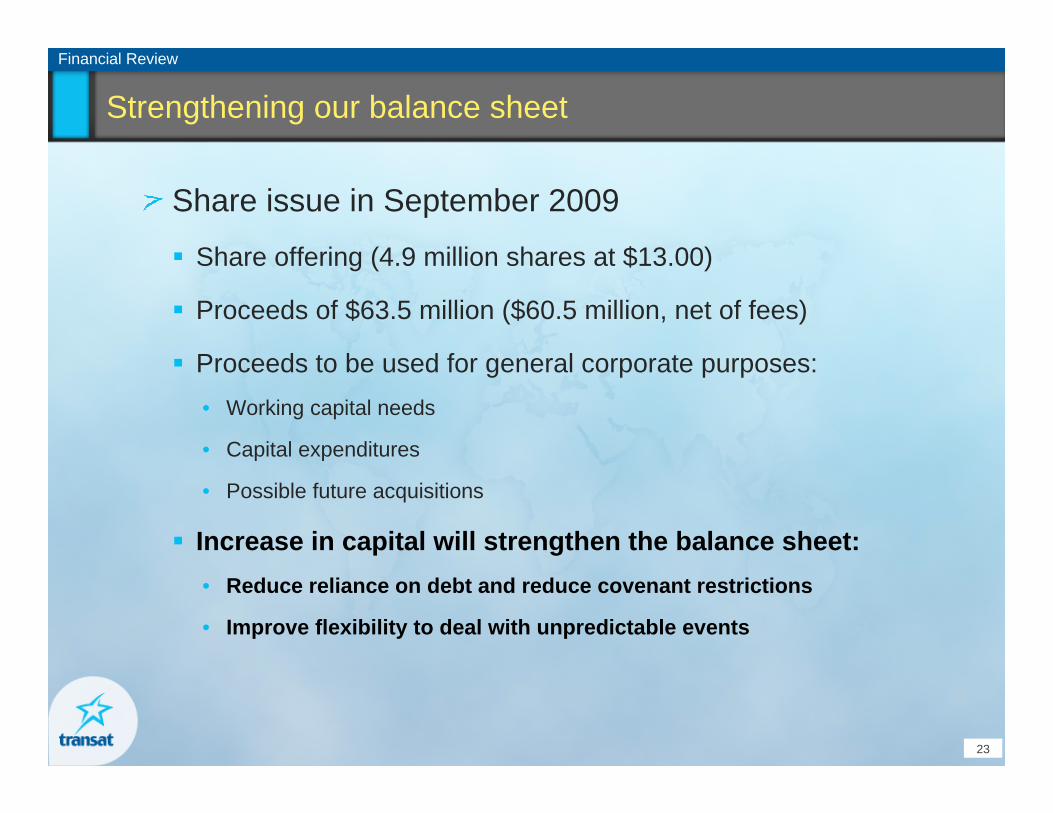
Strengthening our balance sheet
Share issue in September 2009
Share offering (4.9 million shares at $13.00)
Proceeds of $63.5 million ($60.5 million, net of fees)
Proceeds to be used for general corporate purposes:• Working capital needs
• Capital expenditures
• Possible future acquisitions
Increase in capital will strengthen the balance sheet: • Reduce reliance on debt and reduce covenant restrictions
• Improve flexibility to deal with unpredictable events
23
Financial Review
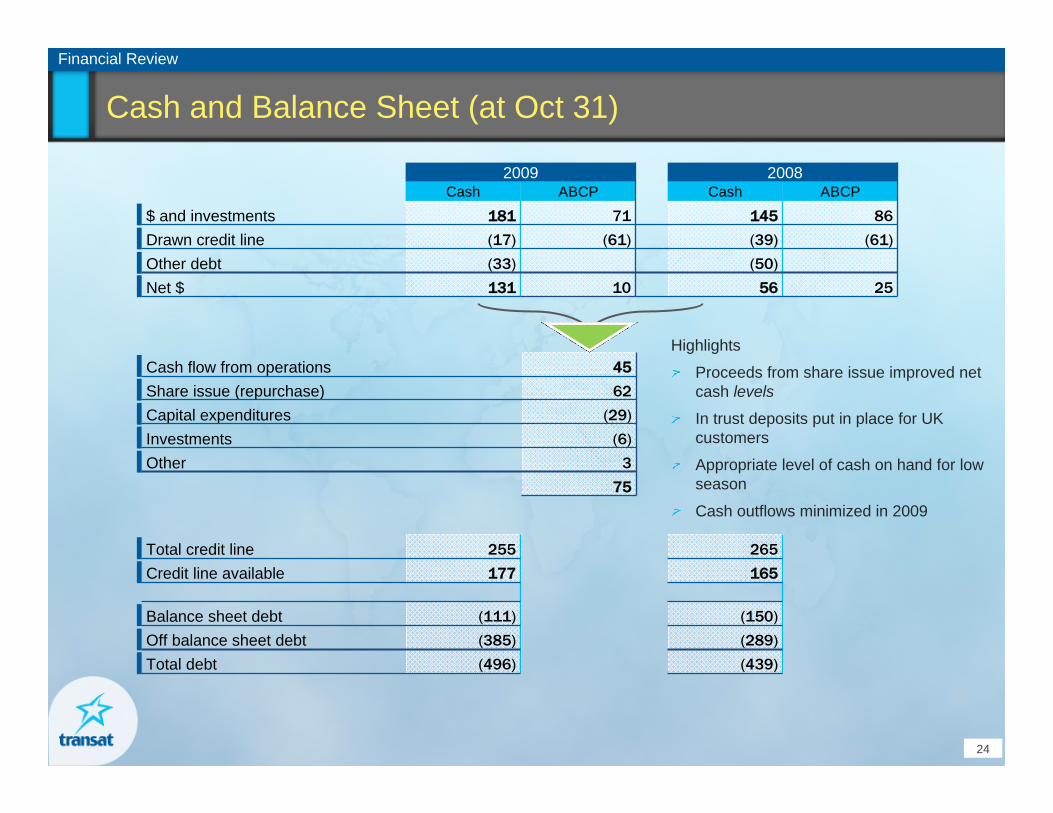
Cash and Balance Sheet (at Oct 31)
24
Financial Review
2009 2008Cash ABCP Cash ABCP
$ and investments 181 71 145 86
Drawn credit line (17) (61) (39) (61)
Other debt (33) (50)
Net $ 131 10 56 25
Cash flow from operations 45
Share issue (repurchase) 62
Capital expenditures (29)
Investments (6)
Other 3
75
Highlights
Proceeds from share issue improved net cash levels
In trust deposits put in place for UK customers
Appropriate level of cash on hand for low season
Cash outflows minimized in 2009
Total credit line 255 265
Credit line available 177 165
Balance sheet debt (111) (150)
Off balance sheet debt (385) (289)
Total debt (496) (439)
Summary of 2009
Despite challenging environment, flu, etc.
Maintain market share
Increase control over distribution of our sales
Pursue IT strategic projects
Reduce costs through contracts and processes
Globally, a solid performance
25
Outlook for 2010
Reservations from Canada to sun for winter 2010
Currently lower than record volumes recorded last year
Transat adjusted capacity in the first quarter to protect its load factors
Capacity currently aligned with last year’s volumes for second quarter• Taking into account trend towards last-minute bookings
France for winter
Reservations lower than last year
Selling prices are generally inferior to last year
Transat will benefit from lower input costs• Fuel prices, hotel costs and other land portion expenses are tracking lower
• Air seats costs also lower 26
Financial Review

1
Strategies for the 2009-2011 period
Focus on product differentiation
Optimize input costs (airlift, hotels, …)
Increase control over distribution of our sales
Open new outgoing markets (Americas and south-Europe)
Invest in technologies (inventory & yield, distribution)
Capitalize on our people
27
2
3
4
5
6
Appendix
28
Financial Review
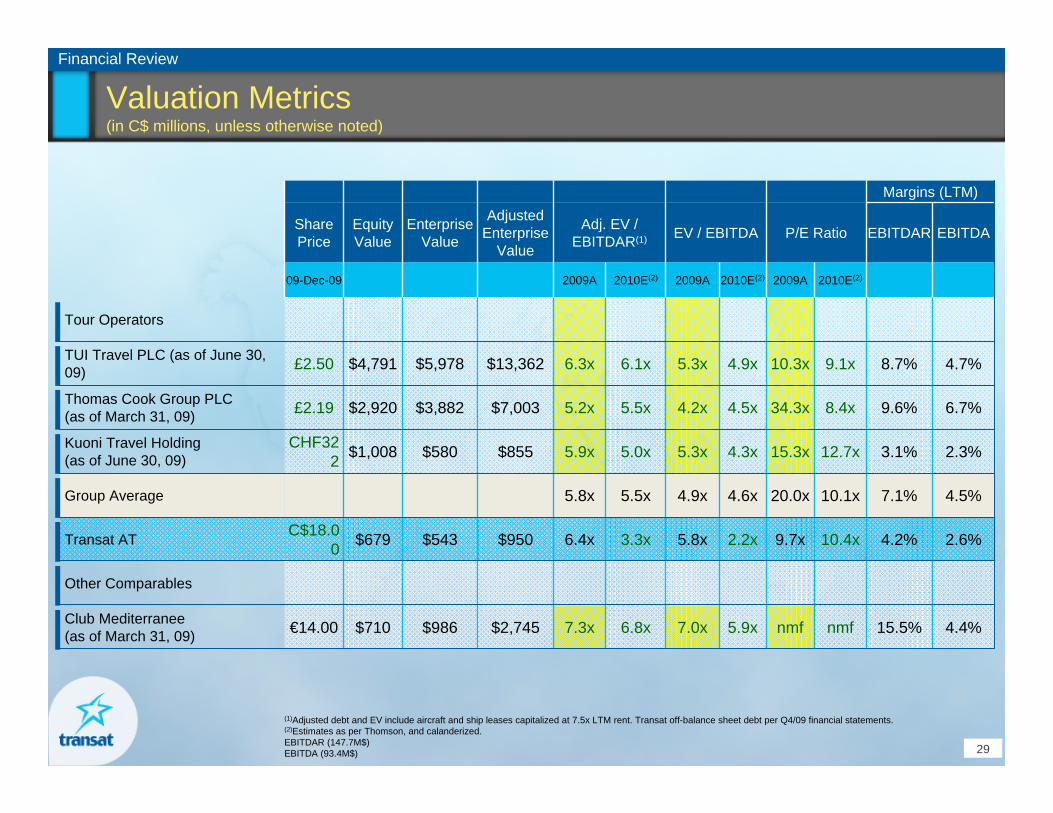
Valuation Metrics(in C$ millions, unless otherwise noted)
29
Financial Review
Margins (LTM)
SharePrice
EquityValue
Enterprise Value
AdjustedEnterprise
Value
Adj. EV / EBITDAR(1) EV / EBITDA P/E Ratio EBITDAR EBITDA
09-Dec-09 2009A 2010E(2) 2009A 2010E(2) 2009A 2010E(2)
Tour Operators
TUI Travel PLC (as of June 30, 09) £2.50 $4,791 $5,978 $13,362 6.3x 6.1x 5.3x 4.9x 10.3x 9.1x 8.7% 4.7%
Thomas Cook Group PLC (as of March 31, 09) £2.19 $2,920 $3,882 $7,003 5.2x 5.5x 4.2x 4.5x 34.3x 8.4x 9.6% 6.7%
Kuoni Travel Holding (as of June 30, 09)
CHF322 $1,008 $580 $855 5.9x 5.0x 5.3x 4.3x 15.3x 12.7x 3.1% 2.3%
Group Average 5.8x 5.5x 4.9x 4.6x 20.0x 10.1x 7.1% 4.5%
Transat AT C$18.00 $679 $543 $950 6.4x 3.3x 5.8x 2.2x 9.7x 10.4x 4.2% 2.6%
Other Comparables
Club Mediterranee(as of March 31, 09) €14.00 $710 $986 $2,745 7.3x 6.8x 7.0x 5.9x nmf nmf 15.5% 4.4%
(1)Adjusted debt and EV include aircraft and ship leases capitalized at 7.5x LTM rent. Transat off-balance sheet debt per Q4/09 financial statements. (2)Estimates as per Thomson, and calanderized.EBITDAR (147.7M$)EBITDA (93.4M$)

Capital structure(in C$ millions, unless otherwise noted)
30
Financial Review
Capital Structure ($) Capital Structure ($)
CashAdjusted
Net Debt(1)
MarketCap
ShortTermDebt
LongTermDebt
Leases Other Adj.EV
MarketCap
Total Debt Leases Cash Other EV
Closest Comparables
TUI Travel PLC (as of June 30, 09) $693 $8,869 $4,791 $204 $1,974 $7,384 ($298) $13,362 36% 16% 55% (5%) (2%) 100%
Thomas Cook Group PLC (as of March 31, 09) 4,170 2,920 1,331 572 3,121 (87) 7,003 42% 27% 45% (12%) (1%) 100%
Kuoni Travel Holding (as of June 30, 09) 460 (148) 1,008 7 29 275 (5) 855 118% 4% 32% (54%) (1%) 100%
Group Average 65% 16% 44% (24%) (1%) 100%
Transat AT $181 $337 $679 $28 $83 $407 $(66) $950 71% 12% 43% (19%) (7%) 100%
Other Comparables
Club Mediterranee(as of March 31, 09) $298 $2,094 $710 $48 $585 $1,759 ($59) $2,745 26% 23% 64% (11%) (2%) 100%
(1) Adjusted debt and EV include aircraft and ship leases capitalized at 7.5x LTM rent. Transat off-balance sheet debt per Q4/09 financial statements.
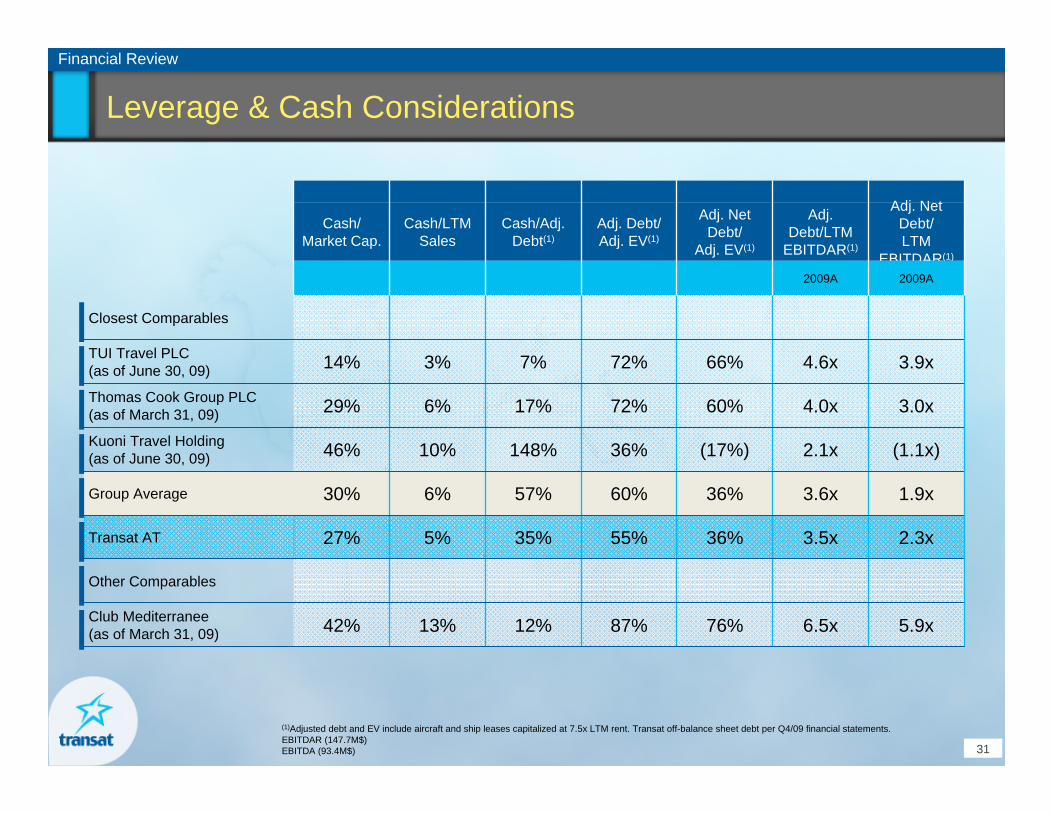
Leverage & Cash Considerations
31
Financial Review
Cash/Market Cap.
Cash/LTMSales
Cash/Adj.Debt(1)
Adj. Debt/Adj. EV(1)
Adj. Net Debt/
Adj. EV(1)
Adj. Debt/LTM
EBITDAR(1)
Adj. Net Debt/LTM
EBITDAR(1)
2009A 2009A
Closest Comparables
TUI Travel PLC (as of June 30, 09) 14% 3% 7% 72% 66% 4.6x 3.9x
Thomas Cook Group PLC (as of March 31, 09) 29% 6% 17% 72% 60% 4.0x 3.0x
Kuoni Travel Holding (as of June 30, 09) 46% 10% 148% 36% (17%) 2.1x (1.1x)
Group Average 30% 6% 57% 60% 36% 3.6x 1.9x
Transat AT 27% 5% 35% 55% 36% 3.5x 2.3x
Other Comparables
Club Mediterranee(as of March 31, 09) 42% 13% 12% 87% 76% 6.5x 5.9x
(1)Adjusted debt and EV include aircraft and ship leases capitalized at 7.5x LTM rent. Transat off-balance sheet debt per Q4/09 financial statements.EBITDAR (147.7M$)EBITDA (93.4M$)