Embed Size (px)
Citation preview

Policy AnalysisJanuary 27, 2021 | Number 907
Scott Lincicome is a senior fellow in economic studies at the Cato Institute.
Manufactured Crisis“Deindustrialization,” Free Markets, and National SecurityBy Scott Lincicome
EXECUTIVE SUMMARY
Both the American left and right often use “national security” to justify sweeping proposals for new U.S. protectionism and industrial policy. “Free markets” and a lack of government support for the manufacturing
sector are alleged to have crippled the U.S. defense indus-trial base’s ability to supply “essential” goods during war or other emergencies, thus imperiling national security and demanding a fundamental rethink of U.S. trade and manu-facturing policy. The COVID-19 crisis and U.S.-China tensions have amplified these claims.
This resurgent “security nationalism,” however, extends far beyond the limited theoretical scenarios in which national security might justify government action, and it suffers from several flaws.
First, reports of the demise of the U.S. manufacturing sector are exaggerated. Although U.S. manufacturing sec-tor employment and share of national economic output (gross domestic product) have declined, these data are mostly irrelevant to national security and reflect mac-roeconomic trends affecting many other countries. By contrast, the most relevant data—on the U.S. manufactur-ing sector’s output, exports, financial performance, and investment—show that the nation’s total productive capac-ity and most of the industries typically associated with “national security” are still expanding.
Second, “security nationalism” assumes a need for broad and novel U.S. government interventions while ignoring the targeted federal policies intended to support the de-fense industrial base. In fact, many U.S. laws already autho-rize the federal government to support or protect discrete U.S. industries on national security grounds.
Third, several of these laws and policies provide a cau-tionary tale regarding the inefficacy of certain core “secu-rity nationalist” priorities. Case studies of past government support for steel, shipbuilding, semiconductors, and machine tools show that security-related protectionism and industrial policy in the United States often undermines national security.
Fourth, although the United States is not nearly as open (and thus allegedly “vulnerable”) to external shocks as claimed, global integration and trade openness often bolster U.S. national security by encouraging peace among trading nations or mitigating the impact of domestic shocks.
Together, these points rebut the most common claims in support of “security nationalism” and show why skepti-cism of such initiatives is necessary when national secu-rity is involved. They also reveal market-oriented trade, immigration, tax, and regulatory policies that would generally benefit the U.S. economy while also supporting the defense industrial base and national security.

2
“Free marketers largely reject the interventionist critique but do acknowledge the potential need for security-related protectionism and industrial policy.”
THEORETICAL JUSTIFICATIONS FOR NATIONAL SECURITY PROTECTIONISM AND INDUSTRIAL POLICY
“National security” has long been invoked to justify government policies intended to support manufacturing in case of war or an-other emergency. The justification has been offered not only by trade skeptics and sup-porters of industrial policy (i.e., targeted and directed government efforts to plan for spe-cific future industrial outputs and outcomes1) from Alexander Hamilton to Donald Trump but also by advocates of free markets.2
The general argument of each side is simi-lar: open markets may be good in most cases, but ensuring the productive capacity of essen-tial manufacturing sectors can warrant the im-position of tariffs, subsidies, or other types of industrial planning. Trade skeptics and indus-trial policy advocates go further, however, by arguing that American “deindustrialization” (and, by extension, “dependency” on foreign production) justifies interventionist U.S. trade and economic policy. Indeed, the absence of such policies is often alleged to have caused the manufacturing sector’s demise. Related to the first point, the skeptics and industrial poli-cy advocates are also trusting of the efficacy of protectionism and industrial policy to achieve national security objectives. These same in-dividuals further assume that open trade is incompatible with national security and eco-nomic “resiliency.”
An April 2020 op-ed from Sen. Marco Rubio (R-FL) is indicative of the intervention-ist case:
Any prudent policymaker should recog-nize that both efficiency and resiliency are values we should prioritize and seek to balance. But that’s not what we have done in recent decades. [U.S. econom-ic policy] choices, from offshoring to building an economy based on finance and service, have produced one of the most efficient economic engines of all time. But a pendulum can swing too far
in one direction. And when an economy lacks resiliency, it can be devastating in a crisis. . . .
Today, the result of these failed pol-icy choices is that our manufacturing base is severely diminished, and mil-lions of productive jobs that relied on it are gone. The American domestic supply chain devoted to producing vital medical supplies like generic pharma-ceuticals and respirators has withered.3
Rubio goes on to claim that these prob-lems require “a new vision to create a more resilient economy” and proposes a “sweep-ing pro-American industrial policy” that in-volves “re-shoring of supply chains integral to our national interest—everything from basic medicines and equipment to vital rare-earth minerals and technologies of the future.” And he is certainly not alone: prominent politicians and pundits on the right and left routinely lament the harms that “deindustri-alization” has imposed on U.S. national and economic security and propose “sweeping” programs (protectionism, domestic procure-ment mandates, subsidies, etc.) to fix this al-leged problem.
Free marketers largely reject the interven-tionist critique but do acknowledge the po-tential need for security-related protectionism and industrial policy. Adam Smith explained in The Wealth of Nations that one of the “two cases in which it will generally be advantageous to lay some burden upon foreign for the encour-agement of domestic industry” is “when some particular sort of industry is necessary for the defence of the country.”4 Smith noted that Great Britain’s military, for example, needed to maintain “the number of its sailors and shipping” and therefore supported measures to promote the domestic shipping industry at the expense of domestic consumers or other countries. Two centuries later, Milton and Rose Friedman noted that while “the argument that a thriving domestic steel industry, for example, is needed for defense . . . is more often a rationalization for particular tariffs than a valid reason for
3
“The decline in U.S. manufacturing jobs coincided with rising sector output and was mirrored around the world—including in countries more centered on manufacturing, with trade surpluses, or with industrial policies.”
them, it cannot be denied that on occasion it might justify the maintenance of otherwise uneconomical productive facilities.”5 To this day, stalwart defenders of open trade and free markets permit a “national security” excep-tion to those policies.6
However, these same scholars are quick to limit the national security exception. After granting the “defence” basis for Britain’s Navigation Acts, for example, Smith explained that it arose during a time of “violent animos-ity” between Britain and Holland—not merely in expectation of such hostilities—and was specifically needed to reduce “the naval power of Holland, the only naval power which could endanger the security of England.” He added that it would “very seldom” be “reasonable” to pursue such protectionism (“to tax the industry of the great body of the people” so as not “to depend upon our neighbors for the supply”).7
The Friedmans were more direct (and skep-tical): “To go beyond this statement of possibil-ity and establish in a specific case that a tariff or other trade restriction is justified in order to promote national security, it would be neces-sary to compare the cost of achieving the spe-cific security objective in alternative ways and establish at least a prima facie case that a tariff is the least costly way. Such cost comparisons are seldom made in practice.”8 Contemporary economists and free marketers have reiterated such concerns: “Given the negative impact of tariffs on wealth, when they are proposed, even under the national defense justification, they should be carefully examined to see if there is a true national defense issue or if do-mestic firms are merely justifying tariffs for protection from competition.”9
This skepticism—mostly absent from Washington—is indeed warranted: analyses of the U.S. manufacturing sector and the re-lationship between trade and national se-curity, as well as the United States’ long and checkered history of security-related pro-tectionism, undermine the theoretical jus-tifications for imposing protectionism and industrial policy in the name of national de-fense. Instead, open trade, freer markets, and
global interdependence will in almost all cases produce better outcomes in terms of national security and, most importantly, preventing wars and other forms of armed conflict.
THE REALITY OF AMERICAN MANUFACTURING AND NATIONAL SECURITY
Today’s security nationalists often empha-size two trends—declining U.S. manufacturing employment and the sector’s declining share of U.S. economic output (as measured by gross domestic product [GDP])—when lamenting American industrial decline and proposing new policies to support domestic manufactur-ing and national security. Figure 1 shows that both trends have occurred.
However, these trends provide little in-sight into the state of the U.S. defense indus-trial base or government policies affecting it, because they primarily reflect secular, global macroeconomic forces mostly unaffected by domestic policy and say little about the pro-ductive capacity of the United States overall or of the industries that are most essential to U.S. national security.
Secular Trends Driving Changes to U.S. (and Global) Manufacturing
Both declining manufacturing jobs and the sector’s declining share of GDP primarily re-flect long-term global trends disconnected from specific economic policies, whether “free market” or “interventionist.”
JOBS. The long-term decline in U.S. manufacturing jobs coincided with rising sector output and was mirrored in developed countries around the world—including those with economies more centered on manufacturing, with long-standing trade surpluses in goods, or with more aggressive industrial policies.10 (See Table 1 and Figure 2.) In fact, Robert Lawrence’s 2020 examination of 60 countries between 1995 and 2011 found that nations with manufacturing trade surpluses experienced slightly larger declines in manufacturing employment than those

4
with manufacturing trade deficits and that manufacturing job losses were as large in countries with “improving” manufacturing trade balances over this period as those with “worsening” ones.11
As shown in Figure 3, countries generally follow the same inverted-U pattern of eco-nomic development, first adding and then los-ing manufacturing jobs as they develop.
Figures 1–3 establish that, though manu-facturing in some countries represents a larger total share of a country’s domestic workforce than in the United States, the loss of manufac-turing jobs—and thus the basis for any “deindus-trialization” claim—is happening around the world. (Despite recent U.S. industrial job gains, the U.S. Bureau of Labor Statistics expects the longer-term downward trend to continue in the
0
2
4
6
8
10
12
14
16
18
20
22
24
0
1,667
3,333
5,000
6,667
8,333
10,000
11,667
13,333
15,000
16,667
18,333
20,000
1
9
7
0
1
9
7
2
1
9
7
4
1
9
7
6
1
9
7
8
1
9
8
0
1
9
8
2
1
9
8
4
1
9
8
6
1
9
8
8
1
9
9
0
1
9
9
2
1
9
9
4
1
9
9
6
1
9
9
8
2
0
0
0
2
0
0
2
2
0
0
4
2
0
0
6
2
0
0
8
2
0
1
0
2
0
1
2
2
0
1
4
2
0
1
6
2
0
1
8
Percentage
Thousands of persons
U.S. manufacturing employment and share of gross domestic product, 1970–2018
Figure 1
Sources: United Nations data, https://unstats.un.org/unsd/snaama/Downloads; and Conference Board.
Share of gross domestic product Employment
Source: Robert Z. Lawrence, “Recent US Manufacturing Employment: The Exception That Proves the Rule,” Peterson Institute for International Economics
Working Paper no. 17-12, November 2017.
Table 1
1973 24.75 23.35 22 28.88 36.74 27.86 27.78 25.29 32.06
1990 16.77 14.42 15.79 21.27 31.62 22.56 24.33 19.08 22.13
2000 14.35 12.05 15.26 17.87 23.86 22.91 20.66 14.85 14.82
2010 10.13 8.9 10.27 13.32 20.1 18.87 16.95 10.64 9.85
2016 10.17 7.51 9.37 12.15 19.15 18.23 16.1 9.52 9.46
Year United States Australia Canada France Germany Italy Japan Netherlands
United
Kingdom
Share of employment in manufacturing, selected advanced economies (percentage)

5
5
10
15
20
25
30
35
40
1973 1990 2000 2010 2016
Percentage
Figure 2
Share of employment in manufacturing in selected advanced economies
Source: Robert Z. Lawrence, “Recent US Manufacturing Employment: The Exception That Proves the Rule,” Peterson Institute for International Economics
Working Paper no. 17-12, November 2017.
Germany France Italy Japan Netherlands United States Australia Canada
0 10,0005,000 20,00015,000 25,000 35,00030,000 45,00040,000 50,000 55,0000
5
10
15
20
25
30
35
40
45
50
55
GDP, U.S. dollars
Perc
enta
ge s
hare
of e
mpl
oym
ent
Figure 3Manufacturing share of total employment vs. gross domestic product (GDP) per capita
Source: “GDP per Head vs Share of Industry in Employment, 1801 to 2015,” Our World in Data, https://ourworldindata.org/grapher/gdp-vs-manufacturing-employment?time=1801..2015.
FinlandBelgium Denmark France Germany India Italy Japan Mexico
Netherlands South Korea Spain Sweden Taiwan United Kingdom United States

6
“In reality, neither job gains nor job losses demonstrate a vibrant (or lagging) American industrial sector.”
next decade, projecting a loss of almost 445,000 U.S. manufacturing jobs from 2019 to 2029.12) Thus, for example, U.S. policy might have been able to increase overall manufacturing employ-ment at some point, but the trends—including the significant decline in jobs from the late 1990s to the late 2000s—would have remained essentially unchanged.13 Therefore, the chang-es in manufacturing jobs alone provide little in-sight into the state of American manufacturing or related U.S. policies.
Aggregate employment trends also say little about the ability of U.S. workers to produce es-sential goods during a national emergency. For example, U.S. manufacturing employment in-creased by almost 1 million jobs between 2010 and 2018, “outperforming” Germany, Japan, and China in the process. However, over the same period, real manufacturing value-added per worker and per hour worked in the United States increased by only 0.3 percent per year and 0.1 percent per year, respectively, as com-pared to 5.6 percent and 5.7 percent per year between 2000 and 2008—a time of significant manufacturing job loss in the United States.14 In other words, American workers were im-proving their ability to produce manufactured goods (and thus to supply the economy in times of war or other emergency) at a much more rapid pace during the height of “deindus-trialization” than during the subsequent pe-riod of “reindustrialization.” In reality, neither job gains nor job losses demonstrate a vibrant (or lagging) American industrial sector. There also is little to indicate that U.S. manufactur-ing jobs deserve special government support.15
GDP SHARE. Manufacturing’s declining share of total U.S. GDP also reflects secular trends largely disconnected from U.S. government policy. First, the change in the industrial sector’s GDP share reflects the relative strength of the U.S. services sector instead of the weakness of American manufacturing. Indeed, between 1997 and 2019, real gross output and real value-added of private services–producing industries increased by 87 percent and 77.4 percent, respectively, while the same metrics for U.S. manufacturing increased
by a slower-but-still-respectable 18.7 percent and 52.8 percent—continuing long-term trends in these U.S. sectors dating back to the 1940s.16
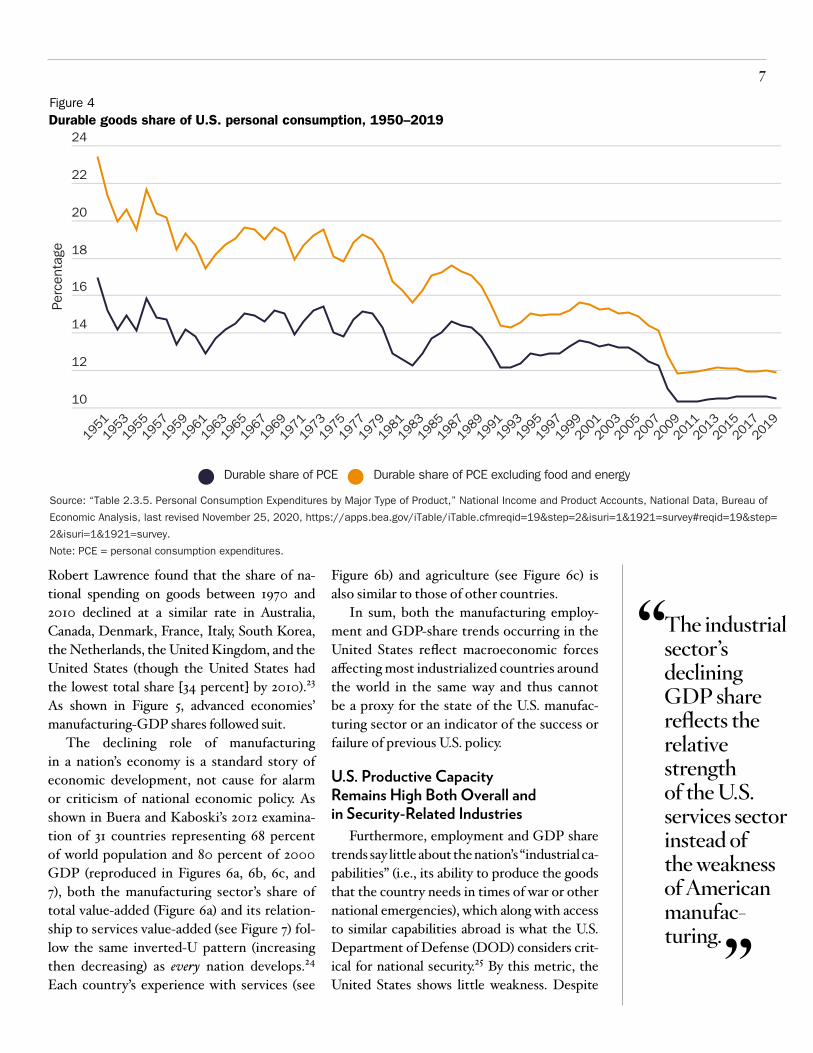
Second, the relative growth of services ver-sus manufacturing reflects fundamental shifts in consumption patterns in the United States and other countries away from goods and toward services.17 In the United States, “consumers, government, and investors have been devoting declining shares of nominal spending to goods relative to services” since the 1960s, and “the overall impact, inclusive of investment expen-diture on equipment and software, was a de-cline in nominal US spending on goods relative to services by 1.47 log points (percent) per year over the entire period.”18 Thus, U.S. consum-ers were allocating half of all their spending on consumption to goods—50.3 percent—in 1960 but only 33 percent by 2010. Over the same period, U.S. government consumption and investment expenditure on goods dropped from 61 percent to 42 percent.19 As shown in Figure 4, Americans’ consumption of durable goods as a share of total consumption has simi-larly declined since the 1950s.
These relative consumption trends coincide with the U.S. manufacturing sector’s declining share of U.S. GDP (see Figure 1), and these fac-tors have coincided over time: documenting trends in U.S. consumption and manufacturing value-added between 1900 and 2000, for ex-ample, economists Francisco Buera and Joseph Kaboski found a “strong connection” between the two.20 The onset of COVID-19 in the United States again showed the link between consumer spending and manufacturing sector performance: U.S. manufacturers during the summer of 2020 outperformed domestic service providers because several factors—including “catch-up” purchases that were delayed in the spring; continued restrictions on many services; consumer unease about public exposure; and stimulus payments—had pushed homebound Americans to increase their relative consump-tion of goods over this period.21
Nor are the consumption and output trends limited to the United States or even other de-veloped countries.22 Lawrence Edwards and
7
“The industrial sector’s declining GDP share reflects the relative strength of the U.S. services sector instead of the weakness of American manufacturing.”
Robert Lawrence found that the share of na-tional spending on goods between 1970 and 2010 declined at a similar rate in Australia, Canada, Denmark, France, Italy, South Korea, the Netherlands, the United Kingdom, and the United States (though the United States had the lowest total share [34 percent] by 2010).23 As shown in Figure 5, advanced economies’ manufacturing-GDP shares followed suit.
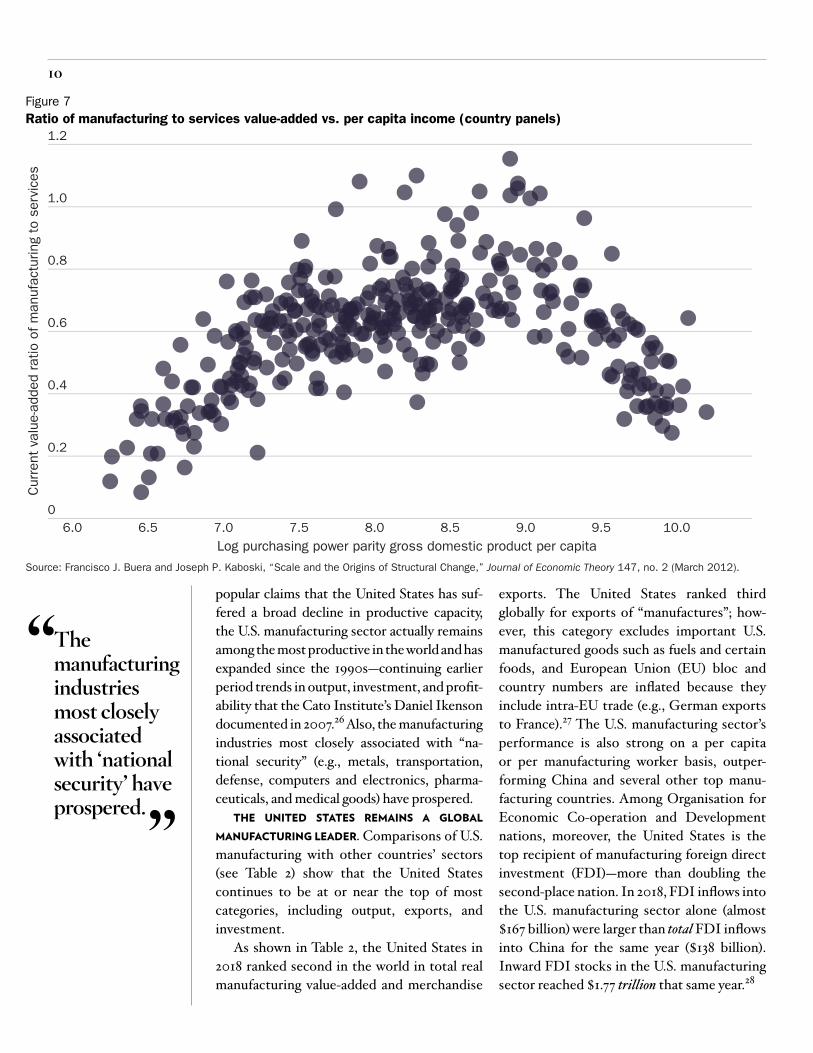
The declining role of manufacturing in a nation’s economy is a standard story of economic development, not cause for alarm or criticism of national economic policy. As shown in Buera and Kaboski’s 2012 examina-tion of 31 countries representing 68 percent of world population and 80 percent of 2000 GDP (reproduced in Figures 6a, 6b, 6c, and 7), both the manufacturing sector’s share of total value-added (Figure 6a) and its relation-ship to services value-added (see Figure 7) fol-low the same inverted-U pattern (increasing then decreasing) as every nation develops.24 Each country’s experience with services (see
Figure 6b) and agriculture (see Figure 6c) is also similar to those of other countries.
In sum, both the manufacturing employ-ment and GDP-share trends occurring in the United States reflect macroeconomic forces affecting most industrialized countries around the world in the same way and thus cannot be a proxy for the state of the U.S. manufac-turing sector or an indicator of the success or failure of previous U.S. policy.
U.S. Productive Capacity Remains High Both Overall and in Security-Related Industries
Furthermore, employment and GDP share trends say little about the nation’s “industrial ca-pabilities” (i.e., its ability to produce the goods that the country needs in times of war or other national emergencies), which along with access to similar capabilities abroad is what the U.S. Department of Defense (DOD) considers crit-ical for national security.25 By this metric, the United States shows little weakness. Despite
10
12
14
16
18
20
22
24
1
9
5
1
1
9
5
3
1
9
5
5
1
9
5
7
1
9
5
9
1
9
6
1
1
9
6
3
1
9
6
5
1
9
6
7
1
9
6
9
1
9
7
1
1
9
7
3
1
9
7
5
1
9
7
7
1
9
7
9
1
9
8
1
1
9
8
3
1
9
8
5
1
9
8
7
1
9
8
9
1
9
9
1
1
9
9
3
1
9
9
5
1
9
9
7
1
9
9
9
2
0
0
1
2
0
0
3
2
0
0
5
2
0
0
7
2
0
0
9
2
0
1
1
2
0
1
3
2
0
1
5
2
0
1
7
2
0
1
9
Percentage
Durable share of PCE Durable share of PCE excluding food and energy
Figure 4
Durable goods share of U.S. personal consumption, 1950–2019
Source: “Table 2.3.5. Personal Consumption Expenditures by Major Type of Product,” National Income and Product Accounts, National Data, Bureau of
Economic Analysis, last revised November 25, 2020, https://apps.bea.gov/iTable/iTable.cfmreqid=19&step=2&isuri=1&1921=survey#reqid=19&step=
2&isuri=1&1921=survey.
Note: PCE = personal consumption expenditures.

8
5
10
15
20
25
30
35
Pe
rce
nta
ge
Figure 5
Manufacturing share of gross domestic product in selected advanced economies
Source: United Nations data, https://unstats.un.org/unsd/snaama/Downloads.
Japan Germany Italy World United States United Kingdom Canada France Australia
1
9
7
1
1
9
7
3
1
9
7
5
1
9
7
7
1
9
7
9
1
9
8
1
1
9
8
3
1
9
8
5
1
9
8
7
1
9
8
9
1
9
9
1
1
9
9
3
2
0
0
1
2
0
0
3
2
0
0
5
2
0
0
7
2
0
0
9
2
0
1
3
2
0
1
7
2
0
1
9
2
0
1
5
2
0
1
1
1
9
9
5
1
9
9
7
1
9
9
9
0
0.2
0.4
0.6
0.8
1.0
6 7 8 9 10 11
Cu
rre
nt va
lu
e-a
dd
ed
s
ha
re
o
f m
an
ufa
ctu
rin
g
Log purchasing power parity gross domestic product per capita
Figure 6a
Manufacturing share vs. per capita income (country panels)
Source: Francisco J. Buera and Joseph P. Kaboski, “Scale and the Origins of Structural Change,” Journal of Economic Theory 147, no. 2 (March 2012).

9
0
0.2
0.4
0.6
0.8
1.0
6 7 8 9 10 11
Cu
rre
nt va
lu
e-a
dd
ed
s
ha
re
o
f s
ervice
s
Log purchasing power parity gross domestic product per capita
Figure 6b
Services share vs. per capita income (country panels)
Source: Francisco J. Buera and Joseph P. Kaboski, “Scale and the Origins of Structural Change,” Journal of Economic Theory 147, no. 2 (March 2012).
0
0.2
0.4
0.6
0.8
1.0
6 7 8 9 10 11
Cu
rre
nt va
lu
e-a
dd
ed
s
ha
re
o
f a
gricu
ltu
re
Log purchasing power parity gross domestic product per capita
Figure 6c
Agriculture share vs. per capita income (country panels)
Source: Francisco J. Buera and Joseph P. Kaboski, “Scale and the Origins of Structural Change,” Journal of Economic Theory 147, no. 2 (March 2012).
10
“The manufacturing industries most closely associated with ‘national security’ have prospered.”
popular claims that the United States has suf-fered a broad decline in productive capacity, the U.S. manufacturing sector actually remains among the most productive in the world and has expanded since the 1990s—continuing earlier period trends in output, investment, and profit-ability that the Cato Institute’s Daniel Ikenson documented in 2007.26 Also, the manufacturing industries most closely associated with “na-tional security” (e.g., metals, transportation, defense, computers and electronics, pharma-ceuticals, and medical goods) have prospered.
THE UNITED STATES REMAINS A GLOBAL MANUFACTURING LEADER. Comparisons of U.S. manufacturing with other countries’ sectors (see Table 2) show that the United States continues to be at or near the top of most categories, including output, exports, and investment.
As shown in Table 2, the United States in 2018 ranked second in the world in total real manufacturing value-added and merchandise
exports. The United States ranked third globally for exports of “manufactures”; how-ever, this category excludes important U.S. manufactured goods such as fuels and certain foods, and European Union (EU) bloc and country numbers are inflated because they include intra-EU trade (e.g., German exports to France).27 The U.S. manufacturing sector’s performance is also strong on a per capita or per manufacturing worker basis, outper-forming China and several other top manu-facturing countries. Among Organisation for Economic Co-operation and Development nations, moreover, the United States is the top recipient of manufacturing foreign direct investment (FDI)—more than doubling the second-place nation. In 2018, FDI inflows into the U.S. manufacturing sector alone (almost $167 billion) were larger than total FDI inflows into China for the same year ($138 billion). Inward FDI stocks in the U.S. manufacturing sector reached $1.77 trillion that same year.28
0
0.2
0.4
0.6
0.8
1.0
1.2
6.0 6.5 7.0 7.5 8.0 8.5 9.0 9.5 10.0
Current value-added ratio of manufacturing to services
Log purchasing power parity gross domestic product per capita
Figure 7
Ratio of manufacturing to services value-added vs. per capita income (country panels�
Source: Francisco J. Buera and Joseph P. Kaboski, “Scale and the Origins of Structural Change,” Journal of Economic Theory 147, no. 2 (March 2012).

11
“The United States remains a major global manufacturer and a top destination for manu-facturing investment.”
In short, the United States remains a major global manufacturer and a top destination for manufacturing investment.
THE UNITED STATES’ INDUSTRIAL CAPABILITIES KEEP EXPANDING. Second, historical data on the U.S. manufacturing sector show it to be growing. As shown in Figure 8, real (inflation-adjusted) U.S. manufacturing value-added and gross output were up significantly between 1997 and 2018.
Furthermore, investment in the manufac-turing sector—capital expenditures, research and development (R&D), and FDI—has been consistent and strong. (See Figures 9 and 10.) Finally, as shown in Figure 11, the sector has also experienced improved financial per-formance since 2001 (the first year of data available), with inflation-adjusted gains in rev-enues, post-tax income, and assets.
Based on these and other data, the last two DOD reports on the U.S. defense indus-trial base concluded that it is “profitable and expanding” overall. In fact, the latest report for fiscal year 2019 (issued June 23, 2020)
states that the largest six prime defense sup-pliers (Lockheed Martin, Boeing, Northrop Grumman, Raytheon, General Dynamics, and BAE Systems) “are financially healthy and continue to expand in market share” and that their “investments hit a six year high in 2018 at $33.9 billion with firms investing largely in acquisition of subsidiaries, R&D, and capital expenditures.”29
A longer-term view of these data is essen-tial to evaluating the sector’s performance. Some of the more negative analyses of U.S. manufacturing provide an incomplete view because they fail to account for either the Great Recession, which collapsed global out-put and employment, or the manufacturing “mini-recession” in 2015–16, caused by an un-expected collapse in global oil prices—issues clarified by updating the data through 2018 (when U.S. trade conflicts halted the sector’s improvement).30 Indeed, the problems with taking a narrow snapshot are revealed by exam-ining employment trends in the United States and other top manufacturing countries
Top manufacturing countries, 2018 (millions of dollars, unless otherwise noted)
Table 2
China $3,884,451 $2,486,695 $2,318,153 $138,305 n/a $29,188
United
States
$2,300,398 $1,663,982 $1,176,498 $253,561 $166,889 $177,127
Japan $959,243 $738,143 $641,106 $9,858 $13,242 $92,448
Germany $746,485 $1,560,539 $1,364,575 $73,570 $12,826* $96,632
South
Korea
$427,724 $604,860 $528,991 $12,183 $5,245 $94,841
India $409,087 $324,778 $223,265 $42,156 n/a $7,169
Italy $289,160 $549,527 $452,134 $32,886 $8,481 $73,292
United
Kingdom
$279,298 $486,439 $468,817 $65,299 $4,058* $108,223
France $260,321 $581,774 $462,086 $38,185 $20,128 $100,938
Mexico $214,789 $450,685 $362,608 $34,745 $16,318 $29,931
Country
Manufacturing
value-added
Merchandise
exports
Manufactures
exports
FDI
in�ows
(total)
FDI in�ows
(manufacturing)
Manufacturing value-added
per worker (dollars)
Sources: United Nations Conference on Trade and Development; World Trade Organization; Conference Board; Organisation for Economic Co-operation
and Development; and author’s calculations.
Notes: FDI = foreign direct investment. Gross domestic product value-added figures were provided in 2015 dollars and have not been adjusted. All other
figures are in 2018 dollars. Organisation for Economic Co-operation and Development data were not provided for “n/a” countries. Germany FDI inflows
(manufacturing) is 2017, and UK FDI (manufacturing) is 2015 (the latest data available).

12
$1,000
$1,500
$2,000
$2,500
$3,000
$3,500
$4,000
$4,500
$5,000
$5,500
$6,000
$6,500
1
9
9
7
1
9
9
8
1
9
9
9
2
0
0
0
2
0
0
1
2
0
0
2
2
0
0
3
2
0
0
4
2
0
0
5
2
0
0
6
2
0
0
7
2
0
0
8
2
0
0
9
2
0
1
0
2
0
1
1
2
0
1
2
2
0
1
3
2
0
1
4
2
0
1
5
2
0
1
6
2
0
1
7
2
0
1
8
Output (in billions of 2012 U.S. dollars)
Real value-added Real gross output
Source: “GDP-by-Industry,” Bureau of Economic Analysis, updated December 10, 2020, https://apps.bea.gov/iTable/index_industry_gdpIndy.cfm.
U.S. manufacturing output and value-added, 1997–2018
Figure 8
$100,000
$120,000
$140,000
$160,000
$180,000
$200,000
$220,000
$240,000
$260,000
$280,000
Millions of U.S. dollars
U.S. manufacturing investment, 1999–2018
Figure 9
Sources: “Research and Development: U.S. Trends and International Comparisons,” Science and Engineering Indicators, National Science Board,
https://ncses.nsf.gov/pubs/nsb20203/u-s-business-r-d; and “2019 Annual Capital Expenditures Survey Tables,” U.S. Census Bureau, December 16,
2020, https://www.census.gov/data/tables/2019/econ/aces/2019-aces-summary.html.
Deflator: “Table 1.1.9. Implicit Price Deflators for Gross Domestic Product,” National Income and Product Accounts, National Data, Bureau of Economic
Analysis, https://apps.bea.gov/iTable/iTable.cfm?reqid=19&step=3&isuri=1&1921=survey&1903=13#reqid=19&step=3&isuri=1&1921=survey&1903=13.
Real domestic research and development Real capital expenditures
1
9
9
9
2
0
0
0
2
0
0
1
2
0
0
2
2
0
0
3
2
0
0
4
2
0
0
5
2
0
0
6
2
0
0
7
2
0
0
8
2
0
0
9
2
0
1
0
2
0
1
1
2
0
1
2
2
0
1
3
2
0
1
4
2
0
1
5
2
0
1
6
2
0
1
7
2
0
1
8

13
$1,800,000
$1,600,000
$1,400,000
$1,200,000
$1,000,000
$800,000
$600,000
$400,000
$200,000
0
1
9
9
7
1
9
9
8
1
9
9
9
2
0
0
0
2
0
0
1
2
0
0
2
2
0
0
3
2
0
0
4
2
0
0
5
2
0
0
6
2
0
0
7
2
0
0
8
2
0
0
9
2
0
1
0
2
0
1
1
2
0
1
2
2
0
1
3
2
0
1
4
2
0
1
5
2
0
1
6
2
0
1
7
2
0
1
8
Millions of U.S. dollars
Real foreign direct investment position in the United States: manufacturing, 1997–2018
Figure 10
Source: “Foreign Direct Investment in the U.S.: Balance of Payments and Direct Investment Position Data,” Bureau of Economic Analysis,
https://www.bea.gov/international/di1fdibal.
Deflator: “Table 1.1.9. Implicit Price Deflators for Gross Domestic Product,” National Income and Product Accounts, National Data, Bureau of Economic
Analysis, https://apps.bea.gov/iTable/iTable.cfm?reqid=19&step=3&isuri=1&1921=survey&1903=13#reqid=19&step=3&isuri=1&1921=survey&1903=13.
0
$5,000,000
$10,000,000
$15,000,000
$20,000,000
$25,000,000
$30,000,000
$35,000,000
$40,000,000
$45,000,000
Millions of U.S. dollars
U.S. manufacturing sector financial performance, 2001–2018
Figure 11
Source: “Quarterly Financial Report (QFR): Manufacturing, Mining, Trade, and Selected Service Industries,” U.S. Census Bureau,
https://www.census.gov/econ/qfr/.
Deflator: “Table 1.1.9. Implicit Price Deflators for Gross Domestic Product,” National Income and Products Accounts, National Data, Bureau of Economic
Analysis, https://apps.bea.gov/iTable/iTable.cfm?reqid=19&step=3&isuri=1&1921=survey&1903=13#reqid=19&step=3&isuri=1&1921=survey&1903=13.
Real net sales, receipts, and operating revenues Real income after income taxes Real total assets
1
9
9
9
2
0
0
0
2
0
0
1
2
0
0
2
2
0
0
3
2
0
0
4
2
0
0
5
2
0
0
6
2
0
0
7
2
0
0
8
2
0
0
9
2
0
1
0
2
0
1
1
2
0
1
2
2
0
1
3
2
0
1
4
2
0
1
5
2
0
1
6
2
0
1
7
2
0
1
8
14
“Topline data hide significant changes in the manufacturing sector over the past two decades in response to various economic forces.”
between 2010 and 2018. These data show that the United States (1.1 percent annual growth; 956,000 jobs gained) has had stronger em-ployment growth than Germany (1.0 percent; 440,000 jobs), Japan (–0.4 percent; –229,000 jobs), and China (–0.5 percent; –9.5 million jobs).31 Just as it would be inappropriate to claim that this single datapoint captures the true state of these diverse, multitrillion dol-lar manufacturing sectors (or the national policies affecting them), so does using other short-term snapshots to argue the same.32
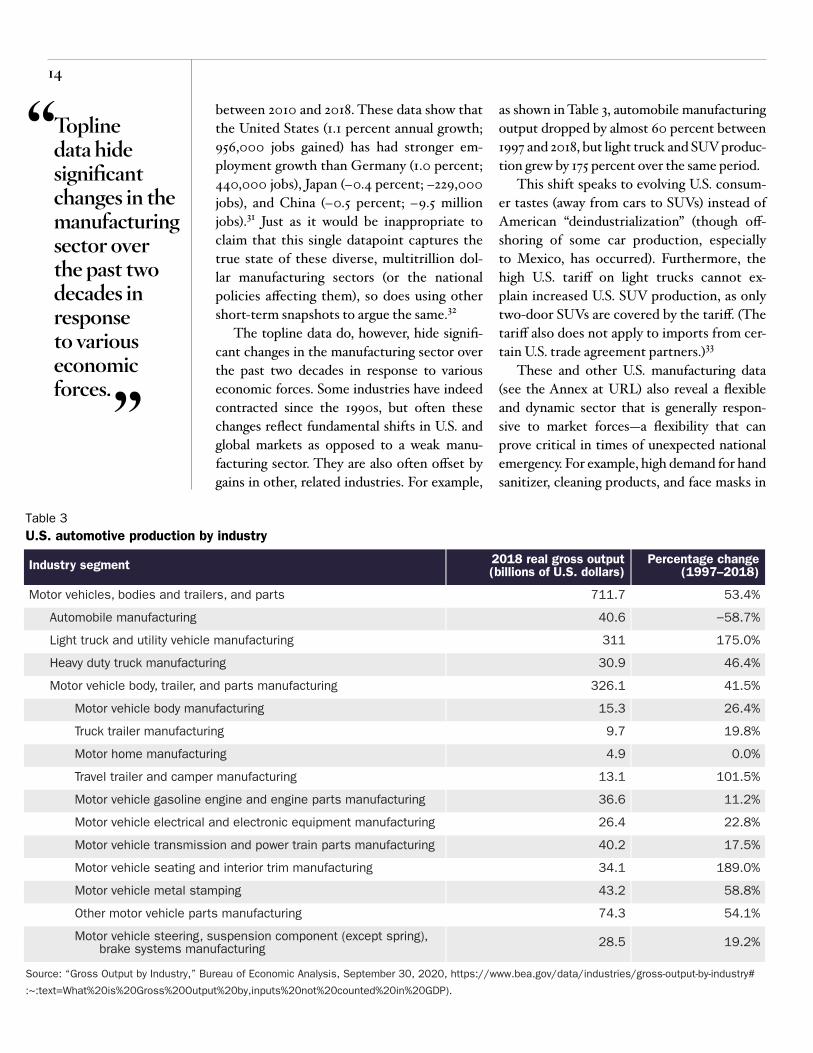
The topline data do, however, hide signifi-cant changes in the manufacturing sector over the past two decades in response to various economic forces. Some industries have indeed contracted since the 1990s, but often these changes reflect fundamental shifts in U.S. and global markets as opposed to a weak manu-facturing sector. They are also often offset by gains in other, related industries. For example,
as shown in Table 3, automobile manufacturing output dropped by almost 60 percent between 1997 and 2018, but light truck and SUV produc-tion grew by 175 percent over the same period.
This shift speaks to evolving U.S. consum-er tastes (away from cars to SUVs) instead of American “deindustrialization” (though off-shoring of some car production, especially to Mexico, has occurred). Furthermore, the high U.S. tariff on light trucks cannot ex-plain increased U.S. SUV production, as only two-door SUVs are covered by the tariff. (The tariff also does not apply to imports from cer-tain U.S. trade agreement partners.)33
These and other U.S. manufacturing data (see the Annex at URL) also reveal a flexible and dynamic sector that is generally respon-sive to market forces—a flexibility that can prove critical in times of unexpected national emergency. For example, high demand for hand sanitizer, cleaning products, and face masks in
Source: “Gross Output by Industry,” Bureau of Economic Analysis, September 30, 2020, https://www.bea.gov/data/industries/gross-output-by-industry#
:~:text=What%20is%20Gross%20Output%20by,inputs%20not%20counted%20in%20GDP).
U.S. automotive production by industry
Table 3
Motor vehicles, bodies and trailers, and parts 711.7 53.4%
xxx Automobile manufacturing 40.6 −58.7%
xxx Light truck and utility vehicle manufacturing 311 175.0%
xxx Heavy duty truck manufacturing 30.9 46.4%
xxx Motor vehicle body, trailer, and parts manufacturing 326.1 41.5%
xxxx. . . Motor vehicle body manufacturing 15.3 26.4%
xxxx. . . Truck trailer manufacturing 9.7 19.8%
xxxx. . . Motor home manufacturing 4.9 0.0%
xxxx. . . Travel trailer and camper manufacturing 13.1 101.5%
xxxx. . . Motor vehicle gasoline engine and engine parts manufacturing 36.6 11.2%
xxxx. . . Motor vehicle electrical and electronic equipment manufacturing 26.4 22.8%
xxxx. . . Motor vehicle transmission and power train parts manufacturing 40.2 17.5%
xxxx. . . Motor vehicle seating and interior trim manufacturing 34.1 189.0%
xxxx. . . Motor vehicle metal stamping 43.2 58.8%
xxxx. . . Other motor vehicle parts manufacturing 74.3 54.1%
xxxx. . . Motor vehicle steering, suspension component (except spring),
and xxxx. . . brake systems manufacturing
28.5 19.2%
Industry segment
2018 real gross output
(billions of U.S. dollars)
Percentage change
(1997–2018)

15
“U.S. durable goods production has increased significantly since 1997, while nondurable goods output has sagged.”
the wake of COVID-19 caused small and large manufacturers across the country to retool their operations and thereby meet Americans’ essential material needs.34 This rapid transition is a testament to not only the hard work and in-genuity of U.S. retailers and manufacturers but also the United States’ economic dynamism and industrial capabilities more broadly.
INDUSTRY-SPECIFIC DATA REVEAL STRENGTH WHERE IT COUNTS. Detailed breakdowns of U.S. manufacturing data also show a stark divide between durable goods (i.e., the goods such as metals, planes, and machinery that we most commonly associate with “national security”) and nondurable goods (e.g., food and textiles). In particular, U.S. durable goods production (real gross output and real value-added) has increased significantly—by 35.9 percent and 109 percent, respectively—since 1997 (see
Figure 12), while nondurable goods output has sagged (see Table 4). The durable-goods gains are not, as some have claimed, merely the result of adjustments for increases in computing power.35 Excluding the entire computers and electronics industry (including semiconductors), U.S. durable goods’ real gross output and real value-added still increased by more than 26 percent and 60 percent, respectively, since 1997 and, excluding only semiconductors, 109.1 percent and 35 percent.
Eliminating these thriving sectors, of course, overcompensates for any technical ad-justment issues, as U.S. computer, electron-ics, and semiconductor firms undoubtedly produce important and globally competitive products and employ hundreds of thousands of American workers. Doing so also raises questions about what other sectors may need to
50
73
97
120
143
167
190
1
9
9
7
1
9
9
8
1
9
9
9
2
0
0
0
2
0
0
1
2
0
0
2
2
0
0
3
2
0
0
4
2
0
0
5
2
0
0
6
2
0
0
7
2
0
0
8
2
0
0
9
2
0
1
0
2
0
1
1
2
0
1
2
2
0
1
3
2
0
1
4
2
0
1
5
2
0
1
6
2
0
1
7
2
0
1
8
Indexed, 2009=100
Real U.S. durable goods manufacturing output and investment
Figure 12
Sources: “Gross Output by Industry,” Bureau of Economic Analysis, September 30, 2020, https://www.bea.gov/data/industries/gross-output-by-
industry#:~:text=What%20is%20Gross%20Output%20by,inputs%20not%20counted%20in%20GDP); and “Annual Capital Expenditures: 2017,” U.S.
Census Bureau, March 13, 2019, https://www.census.gov/library/publications/2019/econ/2017-aces-summary.html.
Deflator: “Table 1.1.9. Implicit Price Deflators for Gross Domestic Product,” National Income and Product Accounts, National Data, Bureau of Economic
Analysis, https://apps.bea.gov/iTable/iTable.cfm?reqid=19&step=3&isuri=1&1921=survey&1903=13#reqid=19&step=3&isuri=1&1921=survey&1903=13.
Total durable goods Total durable goods minus semiconductors Total durable goods minus computers and electronic
Durable goods capital spending

16
“The industries that are most closely tied to national security—including those now prioritized due to COVID-19—have not experienced significant historical declines and in most cases have expanded.”
be discounted or excluded when evaluating the “true” state of the nation’s overall productive capacity. For example, should we also exclude the data for the paper and printing, tobacco, and magnetic and optical media (e.g., cassette tapes and CDs) industries—which have de-clined due to fundamental market changes and are thus unrelated to any “deindustrialization” concerns? Eliminating these industries would reveal even more impressive manufacturing sector gains since the late 1990s.
As shown in Table 4, moreover, declines in nondurable goods production have been driven by basic, low-margin consumables such as textiles and apparel; by tobacco; or by “dematerialized” goods such as paper—not other nondurables such as chemicals (includ-ing pharmaceuticals) and energy that might have a national security nexus.36 Remove the aforementioned decliners, and nondurable goods’ real value-added and gross output in-crease by 22.9 percent and 10.3 percent, re-spectively, between 1997 and 2018.
By contrast, the industries that are most closely tied to national security—including those now prioritized due to COVID-19—have not experienced significant historical declines
and in most cases have expanded. (See Table 5.) This category includes the goods di-rectly involved in national defense (e.g., tanks, missiles, and munitions), as well as those indi-rectly related, including metals, computer and electronic products (including or excluding semiconductors), motor vehicles, aerospace products, ships medical equipment, energy, chemicals, and pharmaceuticals. Although certain sub-industries’ output has risen and fallen over different periods (to be expected given business cycles, changing U.S. military operations, and other factors), the overall pic-ture is one of stability and health, not decline.
These data also refute a common myth that industries unrelated to national secu-rity have driven gains in U.S. manufactur-ing output—the well-worn “we make potato chips, not microchips” argument. They also underscore why tying U.S. national security to trends in manufacturing employment or GDP share is so misguided.
Industry-level analyses corroborate these data in the two industries—semiconductors and medical goods—that Washington policy-makers are now targeting for security-related support.
Change in U.S. nondurable goods manufacturing output, total and select industries
Table 4
Source: “GDP-by-Industry,” Bureau of Economic Analysis, updated December 10, 2020, https://apps.bea.gov/iTable/index_industry_gdpIndy.cfm.
Total nondurable goods 0.2% 3.53%
xxx Food and beverage and tobacco products 8.3% 12.5%
xxxx. . . Food manufacturing 45.6% 27.9%
xxxx. . . Beverage manufacturing 86.2% 22.2%
xxxx. . . Tobacco product manufacturing −72.7% −70.1%
xxx Textile mills and textile product mills −38.9% −51.5%
xxx Apparel and leather and allied products −65.4% −81.6%
xxx Paper products −36.3% −22.4%
xxx Printing and related support activities 5.6% −30.1%
xxx Petroleum and coal products 13.0% 21.5%
xxx Chemical products 14.2% 4.9%
Nondurable goods (excluding textiles, apparel,
paper, printing, tobacco)
22.9% 10.3%
Industry
Percentage change in real value-
added (1997–2018)
Percentage change in real gross
output (1997–2018)

17
Source: “GDP-by-Industry,” Bureau of Economic Analysis, updated December 10, 2020, https://apps.bea.gov/iTable/index_industry_gdpIndy.cfm.
Note: BEA value-added figures not provided at the sub-industry level.
Performance of select U.S. manufacturing industries related to national security (billions of U.S. dollars)
Table 5
2018
total
Percentage
change
(1997–2018)
Percentage
change in
(2009–2018)
2018
total
Percentage
change
(1997–
2018)
Percentage
change in
(2009–
2018)
Iron and steel mills and manufacturing from
purchased steel
$106.40 6.0% 29.0%
Ammunition, arms, ordnance, and accessories
manufacturing
$22.10 172.8% 104.6%
Semiconductor machinery manufacturing $8.80 −9.3% 44.3%
Turbine and turbine generator set units
manufacturing
$13.60 44.7% 14.3%
Speed changer, industrial high-speed drive, and
gear manufacturing
$3.60 −5.3% 16.1%
Mechanical power transmission equipment
manufacturing
$4.60 −6.1% 35.3%
Other engine equipment manufacturing $27.90 19.2% 65.1%
xxxxComputer and peripheral equipment
manufacturing
$42.60 258.0% −17.8% $34.50 4828.6% 32.2%
Electronic computer manufacturing $22.80 570.6% −28.5%
xxxx. . . Computer storage device
manufacturing
$5.90 18.0% −9.2%
xxxx. . . Computer terminals and other
xxxxxxxxcomputer peripheral equipment
manufacturing
$14.30 27.7% 24.3%
xxx Communications equipment
manufacturing
$80.40 226.8% 87.4% $66.20 1906.1% 148.9%
Telephone apparatus manufacturing $16.90 70.7% 85.7%
xxxx. . . Broadcast and wireless
communications equipment
$59.50 404.2% 111.0%
xxxx. . . Other communications equipment
manufacturing
$5.70 7.5% 1.8%
xxx Semiconductor and other electronic
component manufacturing
$113.40 184.2% 24.9% $87.90 1658.0% 47.7%
xxxx. . . Semiconductor and related device
manufacturing
$64.90 654.7% 36.6%
xxxx. . . Printed circuit assembly (electronic
assembly) manufacturing
$19.30 −1.5% 9.0%
Electromedical and electrotherapeutic
apparatus manufacturing
$43.00 418.1% 100.0%
Search, detection, and navigation instruments
manufacturing
$49.90 9.4% −8.8%
Analytical laboratory instrument manufacturing $19.30 121.8% 43.0%
Irradiation apparatus manufacturing $14.20 468.0% 264.1%
Light truck and utility vehicle manufacturing $311.00 175.0% 196.5% $34.60 27.7% 507.0%
Heavy duty truck manufacturing $30.90 46.4% 45.1% $6.90 −16.9% 137.9%
Motor vehicle body, trailer, and parts
manufacturing
$326.10 41.5% 76.8% $82.20 94.8% 184.4%
Aerospace product and parts manufacturing $248.20 47.6% 31.5% $121.40 54.3% 20.7%
Aircraft manufacturing $129.60 52.8% 27.8%
Aircraft engine and engine parts manufacturing $51.10 43.5% 46.8%
Other aircraft parts and auxiliary equipment
manufacturing
$33.80 35.7% 4.3%
Guided missile and space vehicle
manufacturing
$27.50 62.7% 100.7%
Propulsion units and parts for space vehicles
and guided missiles
$6.40 6.7% −1.5%
All other transportation equipment
manufacturing
$73.70 59.5% 2.6% $25.60 53.3% 24.3%
Railroad rolling stock manufacturing $13.10 22.4% 9.2%
Ship building and repairing $26.60 71.6% 4.3%
Motorcycle, bicycle, and parts manufacturing $8.90 117.1% 50.8%
Military armored vehicle, tank, and tank
component manufacturing
$5.90 181.0% −61.9%
All other transportation equipment
manufacturing
$11.20 107.4% 55.6%
Medical equipment and supplies manufacturing $101.90 84.9% 6.9% $62.00 103.3% 7.6%
Petroleum reBneries $848.50 23.4% 8.6%
Petrochemical manufacturing $62.60 20.4% −21.9%
Other basic organic chemical manufacturing $128.30 0.3% 36.8%
Medicinal and botanical manufacturing $16.50 −3.5% 20.4%
Pharmaceutical preparation manufacturing $178.50 23.7% 1.5%
In-vitro diagnostic substance manufacturing $16.70 32.5% 36.9%
Biological product (except diagnostic)
manufacturing
$32.00 223.2% 11.1%
Industry Real gross output Real �alue�added

18
Semiconductors. Shortly before the end of the 116th Congress, both chambers approved by wide margins the National Defense Authorization Act for Fiscal Year 2021 (NDAA), which includes billions of dollars in federal support for the construction of domestic semiconductor manufacturing facilities and an R&D consortium. According to the Bureau of Economic Analysis (BEA), however, U.S.
“semiconductor and other electronic compo- nent manufacturing” production reached $113.4 billion in real gross output and $88 billion in real value-added in 2018.37 Real gross output for “semiconductor and related device manufacturing” alone reached $64.9 billion (more detailed value-added data are not available). The Semiconductor Industry of America (SIA) further notes that there are
Source: “GDP-by-Industry,” Bureau of Economic Analysis, updated December 10, 2020, https://apps.bea.gov/iTable/index_industry_gdpIndy.cfm.
Note: BEA value-added figures not provided at the sub-industry level.
Performance of select U.S. manufacturing industries related to national security (billions of U.S. dollars)
Table 5
2018
total
Percentage
change
(1997–2018)
Percentage
change in
(2009–2018)
2018
total
Percentage
change
(1997–
2018)
Percentage
change in
(2009–
2018)
Iron and steel mills and manufacturing from
purchased steel
$106.40 6.0% 29.0%
Ammunition, arms, ordnance, and accessories
manufacturing
$22.10 172.8% 104.6%
Semiconductor machinery manufacturing $8.80 −9.3% 44.3%
Turbine and turbine generator set units
manufacturing
$13.60 44.7% 14.3%
Speed changer, industrial high-speed drive, and
gear manufacturing
$3.60 −5.3% 16.1%
Mechanical power transmission equipment
manufacturing
$4.60 −6.1% 35.3%
Other engine equipment manufacturing $27.90 19.2% 65.1%
xxxxComputer and peripheral equipment
manufacturing
$42.60 258.0% −17.8% $34.50 4828.6% 32.2%
Electronic computer manufacturing $22.80 570.6% −28.5%
xxxx. . . Computer storage device
manufacturing
$5.90 18.0% −9.2%
xxxx. . . Computer terminals and other
xxxxxxxxcomputer peripheral equipment
manufacturing
$14.30 27.7% 24.3%
xxx Communications equipment
manufacturing
$80.40 226.8% 87.4% $66.20 1906.1% 148.9%
Telephone apparatus manufacturing $16.90 70.7% 85.7%
xxxx. . . Broadcast and wireless
communications equipment
$59.50 404.2% 111.0%
xxxx. . . Other communications equipment
manufacturing
$5.70 7.5% 1.8%
xxx Semiconductor and other electronic
component manufacturing
$113.40 184.2% 24.9% $87.90 1658.0% 47.7%
xxxx. . . Semiconductor and related device
manufacturing
$64.90 654.7% 36.6%
xxxx. . . Printed circuit assembly (electronic
assembly) manufacturing
$19.30 −1.5% 9.0%
Electromedical and electrotherapeutic
apparatus manufacturing
$43.00 418.1% 100.0%
Search, detection, and navigation instruments
manufacturing
$49.90 9.4% −8.8%
Analytical laboratory instrument manufacturing $19.30 121.8% 43.0%
Irradiation apparatus manufacturing $14.20 468.0% 264.1%
Light truck and utility vehicle manufacturing $311.00 175.0% 196.5% $34.60 27.7% 507.0%
Heavy duty truck manufacturing $30.90 46.4% 45.1% $6.90 −16.9% 137.9%
Motor vehicle body, trailer, and parts
manufacturing
$326.10 41.5% 76.8% $82.20 94.8% 184.4%
Aerospace product and parts manufacturing $248.20 47.6% 31.5% $121.40 54.3% 20.7%
Aircraft manufacturing $129.60 52.8% 27.8%
Aircraft engine and engine parts manufacturing $51.10 43.5% 46.8%
Other aircraft parts and auxiliary equipment
manufacturing
$33.80 35.7% 4.3%
Guided missile and space vehicle
manufacturing
$27.50 62.7% 100.7%
Propulsion units and parts for space vehicles
and guided missiles
$6.40 6.7% −1.5%
All other transportation equipment
manufacturing
$73.70 59.5% 2.6% $25.60 53.3% 24.3%
Railroad rolling stock manufacturing $13.10 22.4% 9.2%
Ship building and repairing $26.60 71.6% 4.3%
Motorcycle, bicycle, and parts manufacturing $8.90 117.1% 50.8%
Military armored vehicle, tank, and tank
component manufacturing
$5.90 181.0% −61.9%
All other transportation equipment
manufacturing
$11.20 107.4% 55.6%
Medical equipment and supplies manufacturing $101.90 84.9% 6.9% $62.00 103.3% 7.6%
Petroleum reBneries $848.50 23.4% 8.6%
Petrochemical manufacturing $62.60 20.4% −21.9%
Other basic organic chemical manufacturing $128.30 0.3% 36.8%
Medicinal and botanical manufacturing $16.50 −3.5% 20.4%
Pharmaceutical preparation manufacturing $178.50 23.7% 1.5%
In-vitro diagnostic substance manufacturing $16.70 32.5% 36.9%
Biological product (except diagnostic)
manufacturing
$32.00 223.2% 11.1%
Industry Real gross output Real �alue�added
Table 5 (continued)
Source: “GDP-by-Industry,” Bureau of Economic Analysis, updated December 10, 2020, https://apps.bea.gov/iTable/index_industry_gdpIndy.cfm.
Note: BEA value-added figures not provided at the sub-industry level.
Performance of select U.S. manufacturing industries related to national security (billions of U.S. dollars)
Table 5
2018
total
Percentage
change
(1997–2018)
Percentage
change in
(2009–2018)
2018
total
Percentage
change
(1997–
2018)
Percentage
change in
(2009–
2018)
Iron and steel mills and manufacturing from
purchased steel
$106.40 6.0% 29.0%
Ammunition, arms, ordnance, and accessories
manufacturing
$22.10 172.8% 104.6%
Semiconductor machinery manufacturing $8.80 −9.3% 44.3%
Turbine and turbine generator set units
manufacturing
$13.60 44.7% 14.3%
Speed changer, industrial high-speed drive, and
gear manufacturing
$3.60 −5.3% 16.1%
Mechanical power transmission equipment
manufacturing
$4.60 −6.1% 35.3%
Other engine equipment manufacturing $27.90 19.2% 65.1%
xxxxComputer and peripheral equipment
manufacturing
$42.60 258.0% −17.8% $34.50 4828.6% 32.2%
Electronic computer manufacturing $22.80 570.6% −28.5%
xxxx. . . Computer storage device
manufacturing
$5.90 18.0% −9.2%
xxxx. . . Computer terminals and other
xxxxxxxxcomputer peripheral equipment
manufacturing
$14.30 27.7% 24.3%
xxx Communications equipment
manufacturing
$80.40 226.8% 87.4% $66.20 1906.1% 148.9%
Telephone apparatus manufacturing $16.90 70.7% 85.7%
xxxx. . . Broadcast and wireless
communications equipment
$59.50 404.2% 111.0%
xxxx. . . Other communications equipment
manufacturing
$5.70 7.5% 1.8%
xxx Semiconductor and other electronic
component manufacturing
$113.40 184.2% 24.9% $87.90 1658.0% 47.7%
xxxx. . . Semiconductor and related device
manufacturing
$64.90 654.7% 36.6%
xxxx. . . Printed circuit assembly (electronic
assembly) manufacturing
$19.30 −1.5% 9.0%
Electromedical and electrotherapeutic
apparatus manufacturing
$43.00 418.1% 100.0%
Search, detection, and navigation instruments
manufacturing
$49.90 9.4% −8.8%
Analytical laboratory instrument manufacturing $19.30 121.8% 43.0%
Irradiation apparatus manufacturing $14.20 468.0% 264.1%
Light truck and utility vehicle manufacturing $311.00 175.0% 196.5% $34.60 27.7% 507.0%
Heavy duty truck manufacturing $30.90 46.4% 45.1% $6.90 −16.9% 137.9%
Motor vehicle body, trailer, and parts
manufacturing
$326.10 41.5% 76.8% $82.20 94.8% 184.4%
Aerospace product and parts manufacturing $248.20 47.6% 31.5% $121.40 54.3% 20.7%
Aircraft manufacturing $129.60 52.8% 27.8%
Aircraft engine and engine parts manufacturing $51.10 43.5% 46.8%
Other aircraft parts and auxiliary equipment
manufacturing
$33.80 35.7% 4.3%
Guided missile and space vehicle
manufacturing
$27.50 62.7% 100.7%
Propulsion units and parts for space vehicles
and guided missiles
$6.40 6.7% −1.5%
All other transportation equipment
manufacturing
$73.70 59.5% 2.6% $25.60 53.3% 24.3%
Railroad rolling stock manufacturing $13.10 22.4% 9.2%
Ship building and repairing $26.60 71.6% 4.3%
Motorcycle, bicycle, and parts manufacturing $8.90 117.1% 50.8%
Military armored vehicle, tank, and tank
component manufacturing
$5.90 181.0% −61.9%
All other transportation equipment
manufacturing
$11.20 107.4% 55.6%
Medical equipment and supplies manufacturing $101.90 84.9% 6.9% $62.00 103.3% 7.6%
Petroleum reBneries $848.50 23.4% 8.6%
Petrochemical manufacturing $62.60 20.4% −21.9%
Other basic organic chemical manufacturing $128.30 0.3% 36.8%
Medicinal and botanical manufacturing $16.50 −3.5% 20.4%
Pharmaceutical preparation manufacturing $178.50 23.7% 1.5%
In-vitro diagnostic substance manufacturing $16.70 32.5% 36.9%
Biological product (except diagnostic)
manufacturing
$32.00 223.2% 11.1%
Industry Real gross output Real �alue�added

19
“The U.S. semiconductor industry is profitable and expanding—in many ways still globally dominant—and is investing billions of its own dollars to stay that way.”
commercial semiconductor manufacturing facilities in 18 states, employing more than 240,000 Americans, and that the United States has 12.5 percent of global semiconductor manufacturing capacity.38 Furthermore, the largest share (44.3 percent) of U.S. companies’ production occurs in the United States (while only 5.6 percent is in China, whose alleged dominance was the stated justification for the subsidies).
The United States is also a top-five global exporter of semiconductors and related equip-ment, shipping almost $47 billion of those goods in 2019.39 These and other data led the SIA to conclude in its 2020 State of the U.S. Semiconductor Industry report that “the semi-conductor manufacturing base in the United States remains on solid footing.”40
The SIA also reports that the U.S. indus-try has “nearly half ” of all global semiconduc-tor sales—a market share that has been steady (ranging from the mid-40s to low 50s) since the late 1990s—and is the top seller in ev-ery major regional market, including China. Sales by U.S. semiconductor firms also grew from $76.7 billion in 1999 to $192.8 billion in 2019—a compound annual growth rate of al-most 5 percent.
Beyond output and sales, the U.S. semi-conductor industry has been a global leader in capital spending (capex) and R&D. The SIA notes that total R&D and capex by U.S. semi-conductor firms, including “fabless” compa-nies that specialize in R&D but outsource actual chip manufacturing, was $71.7 billion in 2019, growing steadily between 1999 and 2019 at a 6.2 percent annual rate. R&D expen-ditures hit $39.8 billion last year, constitut-ing 16.4 percent of the industry’s total sales last year—an “R&D intensity” second only to pharmaceuticals in the United States and the highest of any semiconductor industry in the world. Capex has been similarly world-class: SIA reports that 2018 capital expenditures reached “an all-time high of $32.7 billion” and constituted 12.5 percent of sales in 2019, with only South Korea having a larger global share of semiconductor capex that year.
Other data corroborate these findings. (See Table 6.) According to the U.S. National Science Board’s 2020 report on R&D trends, U.S. computer and electronic (including semiconductor) companies spent more on R&D in 2016 (the last year available) than any other country surveyed—often many times more—with only South Korea’s sector hav-ing a greater share of total or manufacturing R&D than the United States.41
The BEA further calculates that foreign multinational corporations in 2017 spent $7.3 billion and $2.2 billion on R&D and ca-pex, respectively, for their U.S. affiliates in the “semiconductors and other electronic components” sector, up from $4.4 billion and $1.9 billion in 2007.42 U.S. semiconduc-tor companies’ stock prices also have climbed steadily over the past decade.43
As a result of this investment, the SIA notes that in 2019 the United States remained at or near the “leading edge” of current semicon-ductor technology. Although U.S.-based Intel announced delays to its 7 nm chip production (reportedly competitive with the 5 nm chips from Taiwan’s TSMC), Intel also remained fi-nancially healthy as of July 2020: “Even with $15 billion projected for capital expenditures this year, on a non-GAAP basis, Intel is look-ing at free cash flow of $17.5 billion.”44
In short, the U.S. semiconductor industry is profitable and expanding—in many ways still globally dominant—and is investing billions of its own dollars to stay that way. None of this indicates a significant long-term “national se-curity” threat—particularly not one that could be solved via subsidies for commercial fab con-struction (which takes years to complete).
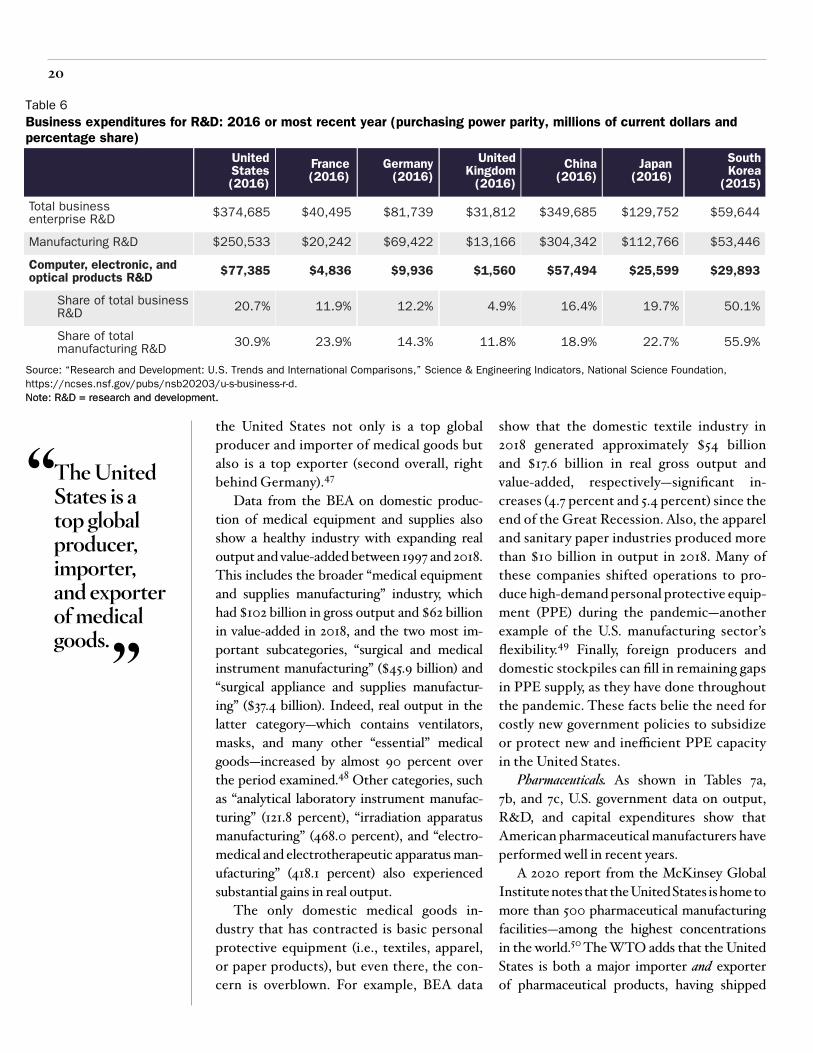
Medical Goods (Non-Pharmaceutical ). The U.S. medical goods industry is also large and productive.45 For example, a 2020 study from the St. Louis Federal Reserve of “essential medical equipment” (hand sanitizer, masks, personal protective equipment, ventilators, etc.) found that American producers supplied the vast majority (more than 70 percent) of these products in 2018.46 The World Trade Organization (WTO) further notes that
20
“The United States is a top global producer, importer, and exporter of medical goods.”
the United States not only is a top global producer and importer of medical goods but also is a top exporter (second overall, right behind Germany).47
Data from the BEA on domestic produc-tion of medical equipment and supplies also show a healthy industry with expanding real output and value-added between 1997 and 2018. This includes the broader “medical equipment and supplies manufacturing” industry, which had $102 billion in gross output and $62 billion in value-added in 2018, and the two most im-portant subcategories, “surgical and medical instrument manufacturing” ($45.9 billion) and “surgical appliance and supplies manufactur-ing” ($37.4 billion). Indeed, real output in the latter category—which contains ventilators, masks, and many other “essential” medical goods—increased by almost 90 percent over the period examined.48 Other categories, such as “analytical laboratory instrument manufac-turing” (121.8 percent), “irradiation apparatus manufacturing” (468.0 percent), and “electro-medical and electrotherapeutic apparatus man-ufacturing” (418.1 percent) also experienced substantial gains in real output.
The only domestic medical goods in-dustry that has contracted is basic personal protective equipment (i.e., textiles, apparel, or paper products), but even there, the con-cern is overblown. For example, BEA data
show that the domestic textile industry in 2018 generated approximately $54 billion and $17.6 billion in real gross output and value-added, respectively—significant in-creases (4.7 percent and 5.4 percent) since the end of the Great Recession. Also, the apparel and sanitary paper industries produced more than $10 billion in output in 2018. Many of these companies shifted operations to pro-duce high-demand personal protective equip-ment (PPE) during the pandemic—another example of the U.S. manufacturing sector’s flexibility.49 Finally, foreign producers and domestic stockpiles can fill in remaining gaps in PPE supply, as they have done throughout the pandemic. These facts belie the need for costly new government policies to subsidize or protect new and inefficient PPE capacity in the United States.
Pharmaceuticals. As shown in Tables 7a, 7b, and 7c, U.S. government data on output, R&D, and capital expenditures show that American pharmaceutical manufacturers have performed well in recent years.
A 2020 report from the McKinsey Global Institute notes that the United States is home to more than 500 pharmaceutical manufacturing facilities—among the highest concentrations in the world.50 The WTO adds that the United States is both a major importer and exporter of pharmaceutical products, having shipped

21
almost $41 billion in medicines (35 percent of total U.S. medical goods exports) in 2019.51
With respect to pharmaceutical inputs (i.e., active pharmaceutical ingredients, or APIs), available public data on domes-tic and global API production do not indi-cate a need for urgent government funding (such as that proposed for Eastman Kodak Company). According to the Food and Drug Administration (FDA), of the roughly 2,000 global API manufacturing facilities,
13 percent are in China; 28 percent are in the United States; 26 percent are in the EU; and 18 percent are in India. For the APIs of World Health Organization “essential medicines” on the U.S. market, 21 percent of manufactur-ing facilities are located in the United States; 15 percent are in China; and the rest are in the EU, India, and Canada.52 The FDA further notes that the United States was home to 510 API facilities in 2019, 221 of which supply the aforementioned “essential medicines.”53
Real gross output by industry (billions of U.S. dollars)
Table 7a
Source: “GDP-by-Industry,” Bureau of Economic Analysis, updated December 10, 2020, https://apps.bea.gov/iTable/index_industry_gdpIndy.cfm.
Pharmaceutical and
medicine
manufacturing� (total)
$242.8 $58.7 31.9% $39.1 16.1% $12.6 5.5%
xxxMedicinal and
xxxbotanical
xxxmanufacturing
$16.5 $(0.6) −3.5% $(0.5) −2.9% $2.8 20.4%
xxxPharmaceutical
xxxpreparation
xxxmanufacturing
$178.5 $34.2 23.7% $17.7 11.0% $2.7 1.5%
xxxIn-vitro
xxxdiagnostic
xxxsubstance
xxxmanufacturing
$16.7 $4.1 32.5% $2.1 14.4% $4.5 36.9%
xxxBiological product
xxx(except diagnostic)
xxxmanufacturing
$32.0 $22.1 223.2% $20.7 183.2% $3.2 11.1%
Industry
2018
output
Change
1997–
2018
Percentage
change 1997–
2018
Change
2000–
2018
Percentage
change 2000–
2018
Change
2009–
2018
Percentage
change 2009–
2018
Domestic research and development (millions of current U.S. dollars)
Table 7b
Source: “Business and Industry R&D,” National Science Foundation, https://www.nsf.gov/statistics/industry/.
Pharmaceuticals
and medicines
$10,137 $66,202 553.1%
Industry 2001 2017 Percentage change
Capital expenditure in pharmaceutical and medicine manufacturing (billions of current U.S. dollars!
Table 7c
Source: “Annual Capital Expenditures: 2018,” U.S. Census Bureau, January 16, 2020.
2017
Pharmaceutical
and medicine manufacturing
$16,196 $15,917 $5,846 $10,350
2018
Pharmaceutical
and medicine manufacturing
$15,096 $14,450 $6,099 $8,998
Year Industry
Total
expenditures
Total
new expenditures
Expenditures
for structures
Expenditures
for equipment

22
“‘Security nationalism’ also assumes a need for broad and novel U.S. government interventions while ignoring the current, targeted federal policies intended to support the defense industrial base.”
THE “DEFENSE INDUSTRIAL BASE” ALREADY ENJOYS TARGETED POLICY SUPPORT
“Security nationalism” also assumes a need for broad and novel U.S. government inter-ventions while ignoring the current, targeted federal policies intended to support the de-fense industrial base. As documented in the Appendix, this includes policies intended to diversify potential sources of essential sup-plies beyond U.S. borders; to subsidize, pro-cure, and stockpile domestically produced items deemed essential for national defense; or to protect domestic companies from im-port competition.
These laws, central to past DOD recom-mendations and actions to support the U.S. defense industrial base, are summarized as follows:
y International policies intended to support the defense industrial base: the “National Technology and Industrial Base” (NTIB), which in-cludes Canada, the UK, and Australia and is intended to enhance national security by eliminating restrictions on trade and R&D collaboration among NTIB partner countries, thereby ex-panding the United States’ industrial capacity beyond U.S. borders; recipro-cal defense procurement agreements between the DOD and its counterparts in 27 foreign governments, under which each country agrees to remove barriers to national security–related purchases of supplies and services of the other country;54 and “security of supply” ar-rangements with eight countries that “allow the DOD to request priority delivery for DOD contracts, subcon-tracts, or orders from companies in these countries.”55
y Domestic laws intended to support the defense industrial base on ex-press national security grounds, in-cluding: NTIB provisions that require the DOD to assess annually the defense
industrial base (published in an annual industrial capabilities report) and to work to mitigate any potential concerns; the Defense Production Act of 1950, which allows the DOD to identify prior-ity sectors for government contracting and enter into those contracts (Title I), and to support, through purchases or loans/loan guarantees, “essential” do-mestic industrial base capabilities that are found to be nonexistent, at risk of loss, or insufficient to meet govern-ment needs (Title III); numerous other programs (see the Appendix) providing the DOD with the authority and fund-ing to support other parts of the indus-trial base; and the National Defense Stockpile Transaction Fund and Strategic and Critical Materials Stock Piling Act of 1939, which authorize the National Defense Stockpile Manager to fund R&D projects to develop new materials for the stockpile and require the president to encourage the devel-opment and conservation of domestic sources of “strategic and critical materi-als” through procurement.
y Laws intended to protect U.S. manu-facturers via the imposition of restric-tions on foreign imports, including: Section 232 of the Trade Expansion Act of 1962, which authorizes the executive branch to take action (e.g., through tar-iffs or quotas) against imports found to have been “imported into the United States in such quantities or under such circumstances as to threaten to impair the national security”;56 U.S. “trade remedy” laws, which allow for the im-position of antidumping or anti-subsidy duties on imports from specific coun-tries that are found to have injured or threatened to injure the U.S. industry making a directly competitive product; and various “Buy American” laws, which require the federal government to pur-chase or contract for domestically pro-duced industrial goods.
23
“Protectionism often undermines national security by weakening a country’s economy and manufacturing sector, thus making it less resilient in the face of war or other shocks.”
As explained in the Appendix and the following sections, many of these policies have proven to be ineffective, unused, or even counterproductive, and several reforms are proposed. Regardless, these measures’ mere existence rebuts the current caricature of a U.S. defense industrial base ravaged by free markets and government inattention. These policies also show that the federal gov-ernment, particularly the DOD, has legal tools to address discrete and legitimate weaknesses in essential supply chains (e.g., for weapons). Also, the government’s implementation of some of these laws shows the weaknesses of security nationalism in practice.
“SECURITY NATIONALISM” MAKES THE UNITED STATES LESS SECURE
Because economic nationalist policies weaken the U.S. economy and manufacturing sector, the government should not pursue “se-curity nationalism” to bolster national security.
Closed Markets Make Economies Less Secure
Protectionism often undermines national security by weakening a country’s economy and manufacturing sector, thus making it less resilient in the face of war or other shocks. Restrictions on international trade and invest-ment not only reduce economic growth (and thus tax revenue) and output but also can dis-tort the economy and divert resources from sectors (e.g., high-tech, high-productivity in-dustries such as information technology) that are also essential to national security.
Decades of research bear this out. For ex-ample, International Monetary Fund (IMF) economists in 2018 examined data for 151 countries over 51 years (1963–2014) and found that “tariff increases lead, in the medium term, to economically and statistically significant declines in domestic output and productiv-ity” as well as more unemployment and higher inequality.57 Numerous analyses of U.S. pro-tectionism reveal that these policies impose economic harms that far outweigh possible
short-term benefits, fail to protect American firms and workers over the longer term, and breed political dysfunction.58
Furthermore, protectionism’s harms are typically amplified for the U.S. manufacturing sector—the target of current security nationalist demands. The IMF paper, for example, found that increased tariffs on manufacturing inputs (e.g., steel) resulted in a statistically significant decline in manufacturing sector-wide output (6.4 percent) and productivity (3.9 percent) five years after the tariff hikes in question. These findings are particularly relevant for the United States, given the diversity and complexity of the domestic manufacturing sector; the consis-tently high percentage of manufacturing inputs as a share of total imports; the concentration of “trade remedy” (antidumping, countervail-ing duty, safeguard) duties on manufacturing inputs; and relatively new “national security” tariffs on almost all primary steel and aluminum imports into the United States.
Other papers have confirmed these harms. For example, a 2020 paper from Alessandro Barattieri and Matteo Cacciatore found that U.S. “trade remedy” duties were concentrat-ed in a few upstream industries (base met-als and metal products, chemicals, plastics, and rubber products) and therefore resulted in substantial employment losses for down-stream manufacturing industries, along with modest and short-lived employment gains in the industries that won protection. The au-thors further determined that these down-stream industries suffered because they lost competitiveness (and therefore jobs) after raising prices to cover higher input costs.59 Examinations of President Trump’s “national security” tariffs on steel and aluminum found that the measures’ costs were mostly borne by domestic manufacturers that consume these metals—including in industries most closely associated with national security (e.g., trans-portation and weapons)—and resulted in for-eign retaliation against U.S. goods exports. As a result, the import protection harmed these firms in terms of increased costs and re-duced output, jobs, exports, and investment.60
24
“The United States’ imple-mentation of ‘security nationalist’ policies reveals a long track record of costs, risks, failed objectives, and unin-tended con-sequences.”
Finally, extensive literature ties trade open-ness to improved economic performance more broadly. A 2018 paper from Robert Feenstra summarized the studies on the long-run, over-all gains from trade for the United States, cal-culating total average GDP gains of 1.1 percent per year due to increased product variety aris-ing from imports, the productivity-enhancing effects of trade-induced creative destruc-tion, and pro-competitive effects on domes-tic prices.61 A 2017 Peterson Institute for International Economics paper calculated the payoff to the United States from expanded trade between 1950 and 2016 to be $2.1 trillion, increasing U.S. GDP per capita and per house-hold by $7,000 and $18,000, respectively.62 The U.S. International Trade Commission (ITC) found in 2016 that U.S. trade agree-ments produced small but significant gains in U.S. exports, real GDP, employment, and wag-es and saved American consumers $13.4 billion in 2014.63 Several other papers have found similar gains.64
Overall, the evidence and analysis refute current arguments that economic national-ism would bolster the U.S. defense industrial base (and thus national security). Instead, American protectionism has been repeatedly found to weaken the U.S. manufacturing sec-tor and the economy more broadly.
“Security Nationalism” Fails in PracticeRegardless of the theory supporting “se-
curity nationalism,” the United States’ im-plementation of these policies—for steel, ships, machine tools, semiconductors, and other “essential” goods—reveals a long track record of costs, risks, failed objectives, and unintended consequences. This checkered history must be considered when evaluating new proposals to support certain industries on national security grounds.
SECTION 232 TARIFFS ON STEEL. President Trump’s tariffs on steel imports under Section 232 is a powerful example of the perils of American security nationalism. Prior to the tariffs’ imposition, the U.S. steel industry had already won billions of dollars in government
subsidies and import protection through dozens of U.S. trade remedy measures covering almost 61 percent of all steel product imports in 2017, the year before the Section 232 tariffs took effect.65 Public data for that same year also showed that the industry was at no risk of collapse: according to the Commerce Department’s Section 232 report, for example, annual U.S. steel output (around 80 million metric tons) and production capacity (around 115 million metric tons) were steady between 1998 and 2016, and the domestic industry’s U.S. market share remained dominant at around 70 percent between 2011 and 2016.66 Furthermore, in the months leading up to the Section 232 investigation, domestic crude steel output and shipments of steel mill products also remained stable;67 five of the six largest domestic steelmakers were profitable, posting a combined net income of $491 million in the first quarter of 2017; and Standard and Poor’s credit ratings showed eight major U.S. producers to be financially viable.68 This was not an industry in crisis.
Nor did imports pose an immediate threat to the United States’ ability to procure steel (and aluminum) for national defense needs, as judged by the same standards that the Commerce Department applied in a 2001 Section 232 investigation that concluded that imports of iron and steel did not pose a na-tional security threat.69 As previously noted, imports constituted less than one-third of all domestic steel consumption, and the major-ity of those steel imports came from “reliable” (in Commerce Department parlance) U.S. al-lies, such as Canada (the largest source coun-try), Brazil (2), South Korea (3), Mexico (4), Japan (7), and various EU countries, including Germany (8), the Netherlands (13), Italy (14), Spain (16), and the UK (17). As the Commerce Department noted in 2001, none of these countries—most of which were U.S. treaty, free trade agreement, and/or defense procurement agreement partners and home to companies with major U.S. investments—would realisti-cally deny the United States steel in a time of war or other emergency:

25
“President Trump’s tariffs on steel imports under Section 232 are a powerful example of the perils of American security na-tionalism.”
The Department found that iron ore and semi-finished steel are imported from re-liable foreign sources. Accordingly, even if the United States were dependent on imports of iron ore and semi-finished steel, imports would not threaten to im-pair national security. . . .
Imports of iron ore and semi-finished steel come from diverse and reliable trading partners. More than a dozen countries exported iron ore to the United States in 2000; many of these countries are in the Western Hemisphere. Over the past ten years, Canada—with which the United States shares a 3,987-mile border—has been the source of more than 50 percent of U.S. iron ore imports. Canada is a North Atlantic Treaty Organization (“NATO”) ally, the United States’ largest trading partner, and also a party to NAFTA.70
Meanwhile, China—the repeated excuse for the Section 232 tariffs—was only the 11th largest U.S. supplier of steel in 2017, suffer-ing a 31 percent drop since 2011 (due in part to the dozens of U.S. trade remedy measures).71
The absence of a national security threat in 2017 was established in a statutorily required assessment from then-Secretary of Defense James Mattis that agreed with the Commerce Department that the “systematic use of un-fair trade practices . . . poses a risk to our na-tional security” but explained that because “the U.S. military requirements for steel and aluminum each only represent about three percent of U.S. production . . . DoD does not believe that the findings in the [Commerce Section 232] reports impact the ability of DoD programs to acquire the steel . . . neces-sary to meet national defense requirements.” For this reason, Mattis recommended only “targeted tariffs” focused on “correcting Chinese overproduction and countering their attempts to circumvent existing anti-dumping tariffs” instead of “a global quota or global tariff,” as well as a dialogue with “key allies” to emphasize the United States’
commitment to these countries’ “bilateral U.S. relationship.”72
Mattis’ recommendations—as well as the Commerce Department’s findings and standards in the 2001 Section 232 investi- gation—were ignored. Instead, President Trump, surrounded by U.S. steel company chief executive officers and union leaders at a March 2018 White House press event, announced blanket 25 percent tariffs—inexplicably 1 per-centage point higher than what the Commerce Department recommended—on all types of steel.73 This included commodity products (e.g., rebar) with little national security nexus and semifinished products (e.g., slab) that American steel companies needed to maintain their domes-tic operations. It also included steel from close U.S. allies such as Canada, Japan, and the EU (including the UK).74
Numerous studies have documented the tariffs’ high economic costs for U.S. consumers (particularly manufacturing firms). In particu-lar, the tariffs caused higher steel prices that in turn hurt other U.S. manufacturers in terms of higher input costs, lower exports, and lost competitiveness at home and abroad; created an opaque, costly, and uncertain “exclusion” bureaucracy, under which more than 100,000 requests have been filed by U.S. manufacturers seeking relief; resulted in approximately 75,000 fewer manufacturing jobs than would have otherwise existed in the absence of the tariffs; depressed global demand for steel (thereby dampening prices); bred global market uncer-tainty, which hurt investment in manufactur-ing; and caused numerous U.S. trading partners to retaliate against American exporters.75
At the same time, the steel tariffs were found to have a minimal impact on U.S. steel-worker jobs and to do nothing to address glob-al steel overcapacity—the primary long-term driver of the U.S. steel industry’s weakened financial position in 2018.76 Given these and other market dynamics (e.g., steelmakers bringing back inefficient capacity to capture rents and subsequently flooding the U.S. mar-ket), industry stocks tanked in late 2018 and early 2019, and steel companies were actually
26
“A century of evidence reveals that the Jones Act has failed to achieve its main national security objectives while imposing substantial economic costs.”
laying off workers and curtailing investments by the end of 2019.77 In extending the tariffs to downstream “derivative” products in early 2020, the Trump administration tacitly admit-ted that the steel tariffs had not achieved their primary goal of increasing and stabilizing the industry’s capacity utilization.78 As one Los Angeles Times story put it, “Trump’s steel tar-iffs were supposed to save the industry. They made things worse.”79
Finally, the president’s baseless invocation of “national security” in this (and other) Section 232 cases has likely harmed U.S. national secu-rity in other important ways, including by an-tagonizing allies and thereby undermining U.S. credibility and complicating efforts to build in-ternational coalitions on other, more legitimate security threats (e.g., China); eroding the rule of law in the United States via the clear abuse of constitutional trade powers delegated to the executive branch by Congress; and undermin-ing U.S. leadership at the WTO by exploiting the body’s rarely invoked exceptions for the protection of “essential security interests.”
THE JONES ACT. The Merchant Marine Act of 1920 was presented as a plan to ensure adequate domestic shipbuilding capacity and a ready supply of merchant mariners in times of war or other national emergencies. Section 27 of the law—the “Jones Act”—purportedly supports those objectives by restricting domestic shipping services to vessels that are U.S.-built, U.S.-owned, U.S.-flagged, and U.S.-staffed. As a result, the United States has one of the most (if not the most80) restrictive shipping systems in the world, as shown in Figure 13.
A century of evidence—summarized in a 2018 Cato Institute policy analysis81—reveals that the Jones Act has failed in its main national security objectives while imposing substantial economic costs. First, Jones Act restrictions inflated U.S. shipping costs because the trans-port of cargo between U.S. ports and on inland waterways is off-limits to foreign competition. Higher shipping rates for waterborne transpor-tation reduced demand for shipping services, thereby leading U.S. companies to purchase fewer vessels. Producers, in turn, build fewer
ships, thus retarding both output (ships) and production facilities (shipyards).
The trends shown in Figure 14 are especial-ly bleak for oceangoing vessels (i.e., the ships that the U.S. military would need in wartime):
Nearly 9 of every 10 commercial vessels produced in U.S. shipyards since 2010 have been barges or tugboats. Among oceangoing ships of at least 1,000 gross tons that transport cargo and meet Jones Act requirements, their numbers have declined from 193 to 99 since 2000, and only 78 of those 99 can be deemed militarily useful. Even in their expres-sions of support for the Jones Act, gov-ernment officials concede that the U.S. shipping industry and its associated ecosystem have been depleted.82
The Jones Act fleet is not only shrink-ing but also increasingly decrepit because of artificially high replacement costs. Of the mere 98 ships in service, more than a third (34.7 percent) are past the age of 20, and a quar-ter of them (24.5 percent) are past 30. Studies also show that these old vessels are not only inefficient but dangerous.
With fewer (and older) ships, fewer ship-yards, and fewer workers in the industry, the Jones Act has undoubtedly failed to achieve its national security objectives—a conclusion evident by the fact that the U.S. military during the Gulf War and thereafter rarely turned to the Jones Act fleet (and overwhelmingly relied on foreign-built ships) to meet its sealift needs.83
Second, higher shipping costs caused by the Jones Act increase demand for alternative forms of transportation, including trucking, rail, and pipeline services, raising those modes’ rates and inflating business costs throughout the supply chain—thus affecting the opera-tions and finances of nearly every business in nearly every U.S. industry, especially manu-facturing. The Jones Act therefore disadvan-tages U.S. companies relative to their foreign competitors and consumes funds that U.S. households could spend or invest elsewhere

27
0
0.1
0.2
0.3
0.4
N
e
t
h
e
r
l
a
n
d
s
I
r
e
l
a
n
d
L
a
t
v
i
a
P
o
r
t
u
g
a
l
C
a
n
a
d
a
D
e
n
m
a
r
k
G
e
r
m
a
n
y
P
o
l
a
n
d
U
n
i
t
e
d
K
i
n
g
d
o
m
A
u
s
t
r
a
l
i
a
C
h
i
l
e
F
r
a
n
c
e
I
s
r
a
e
l
J
a
p
a
n
N
e
w
Z
e
a
l
a
n
d
N
o
r
w
a
y
L
i
t
h
u
a
n
i
a
E
s
t
o
n
i
a
S
p
a
i
n
T
u
r
k
e
y
C
o
s
t
a
R
i
c
a
S
o
u
t
h
A
f
r
i
c
a
B
e
l
g
i
u
m
S
l
o
v
e
n
i
a
C
o
l
o
m
b
i
a
F
i
n
l
a
n
d
I
t
a
l
y
B
r
a
z
i
l
I
c
e
l
a
n
d
S
o
u
t
h
K
o
r
e
a
G
r
e
e
c
e
M
e
x
i
c
o
S
w
e
d
e
n
I
n
d
i
a
R
u
s
s
i
a
U
n
i
t
e
d
S
t
a
t
e
s
C
h
i
n
a
I
n
d
o
n
e
s
i
a
Restrictiveness
STRI Score Average
Restrictiveness on foreign entry for maritime transport services (2017)
Figure 13
Source: “Services Trade Restrictiveness Index Regulatory Database,” Organisation for Economic Co‐ operation and Development,
https://qdd.oecd.org/subject.aspx?Subject=063bee63-475f-427c-8b50-c19bffa7392d.
Notes: The restrictiveness index assigns values between 0 (least restrictive) and 1 (most restrictive). STRI = Services Trade Restrictiveness Index.
0
100
200
300
400
500
600
0
2,000
4,000
6,000
8,000
10,000
12,000
1950 1955 1960 1965 1970 1975 1980 1985 1990 1995 2000 2005 2010 2015 2018
Number of ships
Jones Act oceangoing ships
Figure 14
Deadweight tonnage (thousands)
Number of ships Deadweight tonnage (thousands)
Source: Congressional Research Service, “Shipping Under the Jones Act: Legislative and Regulatory Background,” updated November 21, 2019, p. 14, fig. 1.
Note: Deadweight tonnage is a measure of ship cargo capacity.
28
“After years of subsidies and trade protection, the U.S. machine tools industry was in worse shape than when the policies began and today remains a Defense Department concern.”
in the economy (on more productive ven-tures). Indeed, some of those competitors, such as Russian gas producers that service Northeastern U.S. communities due to the ar-tificially high cost of shipping liquified natural gas from Texas and Louisiana, are in hostile territories—another unintended consequence that undermines national security.
At the same time, heightened use of trucks and freight trains increases infra-structure and maintenance costs, as well as environmental costs (surface transportation emits more carbon than ships). It also raises safety issues (e.g., transporting toxic mate-rials on U.S. highways) and increases traffic congestion—especially on highways running parallel to U.S. sea lanes—thereby generating opportunity costs from lost wages and lost out-put for American commuters. Finally, the Jones Act has been a persistent irritant to important U.S. trade partners, thus discouraging U.S. ex-ports in those markets. These economic harms further undermine, rather than support, U.S. national security.
MACHINE TOOL “VOLUNTARY” RESTRAINT AGREEMENTS, SUBSIDIES, AND BUY AMERICAN RESTRICTIONS. Following a 1983 petition from the domestic machine tool industry under Section 232 and an affirmative “national security” determination by the Commerce Department in 1984, the Reagan administration concluded in 1986 five-year “voluntary restraint agreements” (VRAs) with Japan and Taiwan to limit their exports of certain machine tools and requested that nine other countries limit their U.S. machine tool market shares to certain levels. The federal government—led by the Commerce Department and the DOD—simultaneously implemented a “Domestic Action Plan” to “assist, encourage, and fund a variety of research and development activities to help modernize machine tool and manufacturing technology.”84 This included the creation of the National Center for Manufacturing Sciences (NCMS), a public-private consortium intended to “revitalize” the machine tool industry. Finally, Congress in 1986 and 1988 imposed Buy American restrictions on the
DOD’s procurement of foreign-made machine tools.85 The VRAs were modified in 1991 and extended through December 1993, when they expired. The NCMS still exists, though it has been expanded to cover all manufacturing operations in North America (as opposed to just U.S. machine tools producers).
These trade restrictions and subsidies proved unsuccessful. First, the VRAs cost U.S. machine tool consumers (i.e., other U.S. manu-facturers) hundreds of millions of dollars per year but provided much smaller benefits to U.S. producers, resulting in an estimated an-nual net loss of $647,892 (in 2017 dollars) per job protected.86 Among the measures’ victims was one of the United States’ largest machine tool producers, Hurco, which sourced certain hardware from Taiwan and survived because it won an exemption from the government through 1990.87 The trade measures also failed to reverse import growth (which expanded by 2.51 percent per year between 1986 and 1990) or domestic job losses (which declined by 2.09 percent per year), while delivering substantial “quota rents” to foreign produc-ers.88 Import growth was attributable to the exemptions, lax government enforcement, and the growth of unconstrained foreign suppliers—most notably Austria and China.89
Second, neither the trade restrictions nor the subsidies revitalized the domestic in-dustry. A 1990 Government Accountability Office report found, for example, that American companies had thus far failed to meet the Reagan administration’s domestic market share targets in four of the six ma-chine tool categories at issue.90 The ITC in 1993 found that domestic machine tools shipments actually declined by 11.7 percent between 1989 and 1991, while employment dropped by 9.8 percent.91 According to a 1995 article for the Philadelphia Inquirer, after years of subsidies and import protection, the U.S. machine tool industry still remained a “dis-tant third” in global production—essentially tied with Italy but well behind both Germany and Japan; had only half the volume of sales (measured in constant dollars) in 1995 that

29
“Government support for the semiconductor industry generated meager benefits for U.S. firms while imposing substantial costs, leaving national security objectives unmet or even under-mined.”
it had 30 years earlier; and saw its workforce shrink from 108,000 in 1980 to 58,300 in 1995 (as well as experience stagnant wages).92
Finally, the programs were plagued with dysfunction. The Government Accountability Office report found that the Commerce Department’s methods for monitoring quota compliance and related import volumes suf-fered from a lack of documented procedures and data, inaccurate calculation methodolo-gies, and reporting delays of five months or more. It also found problems with compliance and enforcement. Moreover, U.S. restrictions on supplies from major foreign producers likely fueled the growth of new market en-trants, including China, which has since be-come a global leader.
In 1993, the George H. W. Bush admin-istration quietly allowed the machine tools VRAs to fade away.93 Furthermore, nei-ther the Buy American restrictions nor the NCMS’s continued operation ever revital-ized the domestic machine tools industry, which remains a DOD concern.
SEMICONDUCTOR TARIFFS AND SUBSIDIES. National security also undergirded U.S. support for the semiconductor industry in the 1980s and ’90s, but it also proved costly and unsuccessful.94 Government support was primarily implemented through two measures: the 1986 Semiconductor Trade Agreement (STA) between the United States and Japan and contemporaneous subsidies to support domestic semiconductor research and production. Each measure, however, generated meager benefits for specific U.S. firms while imposing substantial and unforeseen economic costs, leaving long-term national security objectives unmet or even undermined.
THE STA. Under the STA, the Japanese government agreed to stop its producers from “dumping” dynamic random-access memory (DRAM) and erasable programmable read-only memory chips—enforced through production limits and export restraints that kept prices above U.S.-determined levels—and to guarantee foreign producers 20 percent of the Japanese market. In exchange, the United States
suspended ongoing antidumping and Section 301 (a U.S. law intended to police foreign trading practices that allegedly harm U.S. commerce) investigations of Japanese memory chips.95
The STA’s economic harms were signifi-cant. A 1994 Peterson Institute analysis found that in 1989, the STA generated a net national welfare loss of $974 million ($2.04 billion in 2020 dollars) and cost U.S. consumers over $525,000 ($1.10 million in 2020 dollars) per manufacturing job potentially saved. After the STA took effect, domestic semiconductor pric-es “skyrocketed,” and a “full-fledged shortage of DRAMs was widely felt in the United States and Europe by early 1998.”96 As a result, U.S. semi-conductor users, particularly up-and-coming computer manufacturers such as Apple that were dependent on DRAMs, were hobbled and less able to compete with Asian and European producers that could obtain cheaper DRAMs.97 As a result, the computer manu-facturing industry shed one job for every U.S. semiconductor job supposedly gained from the STA.98 Increased DRAM prices also added al-most $100 to the price of a personal computer selling for $600 or $700 in 1988.99
The STA also ended up helping Japanese semi-conductor producers more than their U.S. com-petitors because the STA allowed the Japanese to charge higher prices in the United States and elsewhere. According to one Brookings Institution study, Japan’s manufacturers earned $1.2 billion in extra DRAM profits in 1988 alone and another $3–4 billion on all products in 1989—most of which was paid by U.S. con-sumers and computer manufacturers.100 Other studies found similar gains for Japanese produc-ers, in part due to collusive behavior.101
U.S. producers, on the other hand, did not increase production capacity, despite ar-tificially high domestic prices and U.S. gov-ernment subsidies.102 All but one U.S. chip maker left the DRAM market within a de-cade, and the STA prevented neither indus-try recessions nor declining U.S. market share (which shrunk from 83 percent to 70 percent between 1986 and 1992).103 One reason is that U.S. firms found ways to circumvent the STA

30
“The U.S.-Japan Semiconductor Trade Agreement hurt American computer companies, targeted the wrong products, and helped turn fledgling Korean competitors into market leaders.”
by importing not individual chips but rather assembled circuit boards that weren’t sub-ject to the agreement.104 The benefits of the Japanese market share targets also proved il-lusory: although foreign semiconductor ex-ports to Japan in 1992 hit the STA’s 20 percent market share targets, economist Craig Parsons found that this “achievement” was caused by broader macroeconomic trends, not the agreement itself.105 Other reports at the time noted that Japanese firms dumped the semiconductors that they were forced to buy into Tokyo Bay.106 Overall, “there is little consensus on whether the STA was effective in increasing the foreign market share.”107
As a result, “for most U.S. chip makers, the main impact of the price hikes was vastly greater profits strengthening their Japanese competitors.”108 Longer term, the STA actu-ally helped “accelerate the entrance of Korean companies onto the world DRAM scene—as with Japanese companies, the supernormal profits that were obtainable in the years im-mediately after the [STA] allowed Korean firms such as Hyundai, Samsung, and LG to reap unexpected returns and gain a foothold at the lower end of the semiconductor technol-ogy ladder.”109 They are now market leaders.
Finally, the STA had significant politi-cal ramifications in the United States and abroad. It encouraged collusion among Japanese producers and restored the Japanese government’s control over the sector, with U.S. help. It led to the creation of a new and powerful lobbying group in the United States—composed of injured downstream user industries—that would go on to mold U.S. trade policy for decades.110 And it dem-onstrated the folly of U.S. security national-ism: just as the DOD was recommending action, American companies were exiting the DRAM market, having already discerned that their future was not in the “high-volume, low-profit commodity” but in advanced mi-croprocessors, specialty chips, and design.111 As a result, U.S. Memories, a private consor-tium to expand domestic DRAM production, was “stillborn and collapsed in January 1990
owing to insufficient financial support and an unwillingness of other major buyers . . . to commit to future purchases.”112 Government planners foresaw none of this.
SEMATECH. Sematech (short for “semi-conductor manufacturing technology”) was not a DRAMs project but instead a semi- conductor R&D consortium funded jointly by private industry and the federal govern- ment—very similar to the consortium now proposed in the NDAA. As chronicled by Brink Lindsey in a 1992 piece for Reason, the primary impetus for Sematech was national security: only a month before the entity’s formation, a Pentagon-sponsored study on “defense semiconductor dependency”—prepared by the Defense Science Board, whose advisory panel conveniently included Sematech member companies—concluded that “it is simply no longer possible for individual U.S. semiconductor firms to compete independently against world-class combinations of foreign industrial, governmental and academic institutions.” The DOD therefore recom- mended $1 billion in government funding for a “Semiconductor Manufacturing Tech- nology Institute.” Congress authorized $100 million a year for five years via the Defense Advanced Research Projects Agency.113
Lindsey showed how Sematech “con- firm[ed] all the darkest suspicions of industrial-policy critics.” In its first phase, “Sematech was able to borrow technology from private companies and reproduce manufactur-ing results that other private companies had achieved years before—and do it with taxpay-ers’ money”; and in its second phase, Sematech did some “useful work, both in evaluating new equipment and improving working relations between chipmakers and suppliers”—but it was work that, while it may have helped a few favored U.S. equipment suppliers, added “very little to what private industry is already capa-ble of doing for itself.”114
Meanwhile, U.S. semiconductor firms were staging a major turnaround but did so by “ignor[ing] just about everything Sematech’s supporters have ever said about
31
“Sematech did not induce more R&D than would have otherwise occurred and is today a cautionary tale of American ‘technona-tionalism.’”
semiconductor competitiveness.” Instead, “American companies have been thriving in those supposedly marginal ‘specialty’ markets derided by the Defense Science Board.” Even worse, Lindsey explained how Sematech ac-tually hindered the industry’s revitalization by “favoring older, more-established companies [i.e., Sematech’s member companies] over in-novative newcomers.” He finally debunked Sematech’s national security basis, noting that the U.S. military had ample domestic and foreign supplies of both commodity DRAMs and the chips most essential to U.S. weapons systems.115
Subsequent studies have confirmed Lindsey’s contemporaneous reporting. In a 1996 paper, for example, Douglas A. Irwin and Peter J. Klenow concluded that the “U.S. government’s contributions to Sematech do not induce more semiconductor research than would otherwise occur.”116 Even Sematech proponents Kenneth Flamm and Qifei Wang concluded that the consortium’s impact on member companies’ R&D expenditures was inconclusive and could in fact have been negative on net.117 That is hardly a ringing en-dorsement, given Lindsey’s account of other, noneconomic harms. In 2020, the Carnegie Endowment’s James L. Schoff included Sematech among the cautionary tales of American “technonationalism” in the 1980s:
The U.S. and Japanese bureaucrats promoting industrial policy and tech-nonationalism at that time could not foresee the growth of the internet and how it would evolve in tandem with the smartphone and other new digital tech-nologies. They could not conceive of AI-enabled cyber hacks of cloud-based data centers or stimulate the rise of in-ternet titans like Google, Amazon, or the modern version of Apple. These companies flourished in the techno-globalist era and avoided single-firm product models by incorporating the best components of various leading technologies into their own product
lines. Now these firms possess some of the world’s most coveted technology, investing more than most governments do to push new boundaries and acceler-ate change through design and systems integration.
Another lesson is that governments generally overreact to perceived tech-nonationalist threats. Many U.S. poli-cymakers and scholars during the 1980s viewed competition with Japan over technology as a form of economic war-fare and regularly assumed the worst about the Japanese government’s inten-tions. American fears that Japan would come to dominate technological fields like semiconductors, supercomputers, satellites, and aerospace in the same way they pushed U.S. manufacturers out of the production of radios and televisions simply never happened, and U.S. initia-tives such as SEMATECH or Super 301 trade dispute cases had only a mar-ginal effect. After all, Japanese firms be-came members of SEMATECH within ten years, and many market-opening Super 301 cases against Japan involved products (like dynamic random access memory chips) that were soon over-taken by new technology or—in the case of satellites—were eventually sub-ject to U.S. export controls. U.S. firms prospered because of their ability to innovate and compete effectively, not because of such technonationalist or protectionist measures.118
Given the NDAA’s plans to subsidize the U.S. semiconductor industry and to establish another R&D consortium, it appears that U.S. policymakers have not learned these lessons.
Other “Security Nationalist” FailuresThese four case studies are a representative
sample of the U.S. government’s long-standing inability to achieve national security objectives through protectionism and industrial policy, as
32
“Freer markets—including openness to international trade and investment—can bolster national security and enhance the country’s resilience to economic ‘shocks.’”
well as the frequent abuse of “national security” for political purposes. Other examples of secu-rity nationalist failures include: Trump admin-istration Section 232 tariffs on aluminum and Section 301 tariffs on Chinese imports;119 pre-vious episodes of steel protectionism, including President Bush’s broad “safeguard” measures in 2001;120 the Sugar Program;121 crude oil im-port quotas from the 1950s to early 1970s;122 textiles and apparel protection;123 wool/mohair subsidies;124 Japanese automobile quotas; and antidumping duties on supercomputers and flat panel displays (which also received gener-ous U.S. government R&D subsidies).125 In each case, along with many others, the outcome was essentially the same: high economic costs, the continued demise of the favored industry, political dysfunction, and U.S. government advocates who, as the American Enterprise Institute’s Claude Barfield explained in his book High Tech Protectionism, “either never un-derstood or willfully ignored the structure of the industry and the nature of worldwide com-petition in the sector.”126
In short, any past successes of U.S. security nationalism are the exception, not the rule.
FREE MARKETS ENHANCE U.S. NATIONAL SECURITY AND “RESILIENCE”
Freer markets—including openness to in-ternational trade and investment—can bolster national security and enhance the country’s resilience to economic “shocks,” such as a pan-demic. The relationship between trade and na-tional security has played a central role in U.S. economic and foreign policy since Secretary of State Cordell Hull helped create the World Trade Organization’s predecessor, the General Agreement on Tariffs and Trade, in the late 1940s and usher in the modern era of global-ization.127 Since that time, numerous academ-ic studies have supported Hull’s instincts, in terms of both geopolitics and economics, that trade and economic interdependence can pre-vent armed conflict and make countries more resilient to shocks.
Open Markets Help Achieve Geopolitical Objectives
A wide body of research across a range of countries and time periods reveals a strong, positive relationship between trade and na-tional security.128
y One of the most influential analyses of trade and peace is that of John R. Oneal, Bruce Russett, and Michael L. Berbaum, who examined almost 10,000 country pairs between 1885 and 1992 and found that increasing two nations’ economic interdependence (as mea-sured by bilateral trade-to-GDP ratio) from the 10th to the 90th percentile lowers the probability of a fatal dispute between them by 32 percent. They es-timated that the growth in U.S.-China trade between the 1960s and 2002 re-duced the probability of a fatal milita-rized dispute between the two nations by 27 percent, as compared with what it would have been without the increase in commercial relations (and assum-ing China’s authoritarianism remained unchanged). They further found that militarized disputes between nations significantly decreased their bilateral trade in the following year, thus indicat-ing that “the relationship between trade and conflict is reciprocal. . . . Peace and commerce promote each other.”129
y Solomon W. Polachek and Carlos Seiglie similarly found in a 2006 study that as two countries’ gains from trade increase, their level of armed conflict decreases and their level of cooperation increas-es. In particular, a doubling of bilateral trade volumes leads to a 20 percent de-crease in conflict.130
y In a 2016 Review of Development Economics paper, Jong-Wha Lee and Ju Hyun Pyun examined 243,225 country pairs from 1950 to 2000 and found that “an increase in bilateral trade interde-pendence significantly promotes peace,” with this effect strongest for contiguous
33
“A wide body of research across a range of countries and time periods reveals a strong, positive relationship between trade and national security.”
countries (e.g., the United States and Canada). They also showed that peace is separately promoted by a nation’s open-ness to global trade and that “an increase in global trade openness reduces the probability of interstate conflict more for countries far apart from each other than it does for countries sharing bor-ders.” Finally, they found that “states more dependent on the world economy tend to have fewer conflicts than those less dependent,” thus providing a strong “security motive” for nations’ efforts to increase other countries’ global economic integration.131
y Patrick J. McDonald in a 2004 article for the Journal of Conflict Resolution found that “free trade, and not just trade, promotes peace by removing an important foundation of domestic privilege—protective barriers to in-ternational commerce—that enhances the domestic power of societal groups likely to support war, reduces the ca-pacity of free-trading interests to limit aggression in foreign policy, and simul-taneously generates political support for the state often used to build its war machine.” Testing the link between in-dividual countries’ trade barriers (mea-sured in terms of both tariff levels and deviation from an ideal “free trade” state) and their propensity to engage in military conflicts, McDonald found that “the tendency of protective trade policies to increase military conflict is both statistically and substantively significant” and that “the level of free trade exerts a larger effect than ag-gregate trade flows on the outbreak of peace” between countries. He conclud-ed that “these results strongly support the claim that free trade enhances the prospects for peace.”132
y Matthew O. Jackson and Stephen Nei in a 2015 paper examining alliances and interstate wars found that interna-tional trade induces peaceful and stable
alliances: “Trade increases the density of alliances so that countries are less vulnerable to attack and also reduces countries’ incentives to attack an ally.” Examining detailed historical data on wars and trade, they showed that “the dramatic drop in interstate wars since 1950 is paralleled by a densification and stabilization of trading relationships and alliances”; that “countries with high levels of trade with their allies are less likely to be involved in wars with any other countries (including allies and nonallies)”; and that “an increase in trade between two countries corre-lates with a lower chance that they will go to war with each other.” They found that a country having more allies and more trade with those allies leads the country to be less prone to attack and less prone to being attacked. Importantly, they also noted that “in the absence of international trade, no network of alli-ances is peaceful and stable”—thus indi-cating the centrality of trade to peace, especially after 1950.133
y A 2020 analysis of 140 countries from 1970–2012, by Benny Kleinman, Ernest Liu, and Stephen J. Redding, found that as countries become greater eco-nomic “friends” (as measured by wel-fare exposure/gains due to the other countries’ productivity growth), they become greater political “friends” in terms of having more similar United Nations voting records, being less likely to be strategic rivals (i.e., “whether two countries regard each other as com-petitors, a source of actual or latent threats that pose some possibility of becoming militarized, or enemies”) and being closer to the “U.S.-led liberal or-der.” They concluded that these results, taken together, “are consistent with the view that increased conflict of econom-ic interests between countries leads to heightened political tension between them.”134

34
“Economic openness can decrease a country’s vulnerability to demand or supply shocks, or it can help the economy recover thereafter.”
y Finally, in a 2012 issue of the British Journal of Political Science, Timothy Peterson and Cameron Thies found that the post-World War II decline in armed conflict is driven by an “unprece-dented” increase in intra-industry trade (i.e., trade in similar—in many cases, branded—commodities, caused by econ-omies of scale and consumer demands for variety) during this period.135
In sum, armed conflicts decrease as na-tions’ economic interdependence and trade openness increase, and a country should seek to encourage other countries’ global economic integration to discourage future attacks on that country. These national security benefits are driven by several factors: First, by making countries more commercially interdependent, trade encourages these nations to avoid war or other large-scale armed conflicts (which could impose substantial economic losses). Second, trade and commercial bargaining are more cost-effective than war as a means of resolving disputes with, or obtaining resources from, an-other country. Third, trade increases material prosperity (e.g., goods, services, investment, ideas) and promotes mutual tolerance and un-derstanding.136 And fourth, free trade can limit the political power of domestic constituencies that may benefit from increased conflict.
Regardless of the reason, the outcome is clear: while global economic integration can-not eliminate armed conflicts, trade liberaliz-ing policies make peace among nations more likely (and thus enhance national security) than the nationalist alternative.
“Open” Nations Can Still Be “Resilient”Finally, there is little to indicate that trade
and investment openness has made the United States less economically resilient and thereby increased national security risk. Indeed, open-ness in many cases can decrease a country’s vul-nerability to demand or supply shocks, or it can help the economy recover thereafter.
JUST HOW “OPEN” ARE WE? That being said, the United States is not nearly as open or
“dependent” on imports and global supply chains as claimed. Regarding openness, the United States has low “most favored nation” tariffs on goods generally, for example, but maintains high tariffs on dozens of politically sensitive goods and is one of the world’s most frequent users of nontariff barriers (e.g., trade remedies) on goods, services, and investment.137
Nor is the U.S. economy especially reliant on imported goods: according to a 2019 analysis from the Federal Reserve Bank of San Francisco, imports account for only about 11 percent of U.S. consumer spending—a share that has re-mained “nearly unchanged” in the past 15 years. Thus, “despite how individual shopping experi-ences may appear, the majority of U.S. personal consumption expenditures are on domestically produced goods and services.”138
In fact, the United States is one of the least trade-dependent countries in the world. According to the World Bank, for example, the United States in 2019 ranked second-to-last among surveyed countries in terms of trade (imports and exports of goods and servic-es) as a share of national GDP—26 percent, right below Cuba (27 percent) and also well below major manufacturers such as China (36 percent), Japan (37 percent), South Korea (77 percent), and Germany (88 percent), as well as the world average (60 percent).139 The United States also ranked near the bottom of a similar ranking of only import shares: fifth lowest at 14.6 percent and again below China (17.3 percent), Japan (18.3 percent), South Korea (37 percent), Germany (41.1 percent), and the world average (29.8 percent).140 More complex analyses of trade dependency reveal similar results.141 In terms of manufacturing supply chains, for example, Richard Baldwin and Rebecca Freeman found that imported in-puts from only five countries—Canada, China, Mexico, Germany, and South Korea—make up more than 0.5 percent of U.S. manufacturing output, tied for the lowest number among the 21 Organisation for Economic Co-operation and Development nations.142
This is not to say, of course, that the United States’ relative lack of global integration

35
“An early assessment of the pandemic’s impact on global supply chains and national economic performance found that ‘renational-ization’ of supply chains would generally not improve a country’s economic perfor-mance.”
is a “good” thing or that further closing the U.S. economy would be relatively costless—in fact, the preceding sections reveal much the opposite. Nevertheless, the nation’s alleged import “dependency” and lack of protective measures are a common justification for new security nationalism—one that the data reveal to be generally groundless.
OPENNESS AND RESILIENCY ARE NOT MUTUALLY EXCLUSIVE. More importantly, there is little to suggest that a country’s openness to foreign trade and investment undermines its economic resiliency or response to national emergencies. This conclusion makes intuitive sense—greater trade and investment openness might make an economy more vulnerable to external supply or demand shocks, but it also helps reduce a nation’s vulnerability to (and improve its recovery from) domestic shocks—and is borne out in academic research. For example, economists Francesco Caselli and others found in 2015 that, when a countrywide shock occurs, “openness to international trade can lower GDP volatility by reducing exposure to domestic shocks and allowing countries to diversify the sources of demand and supply across countries.”143 Similarly, a 2016 examination of openness and economic fragility from Aida Caldera-Sánchez and colleagues found a positive relationship between trade openness and economic vulnerability.144 Examining how certain policies (i.e., financial market liberalization, capital account openness, trade openness, exchange rate policies, and product market regulation) affect a country’s economic growth and risk of financial crisis, the authors found that “lower import tariffs . . . lowers crisis risk while having a favourable impact on average growth.”145
Similar conclusions apply to the COVID-19 crisis. For example, a 2020 assessment from Barthélémy Bonadio and others of the pan-demic’s impact on global supply chains and national economic performance found that “renationalization” of supply chains would generally not improve a country’s economic performance after a global pandemic:
We show that the average real GDP downturn due to the Covid-19 shock is expected to be ~29.6%, with one quarter of the total due to transmission through global supply chains. However, “rena-tionalization” of global supply chains does not in general make countries more resilient to pandemic-induced contrac-tions in labor supply. The average GDP drop would have been ~30.2% in a world without trade in inputs and final goods. This is because eliminating reliance on foreign inputs increases reliance on the domestic inputs, which are also dis-rupted due to nationwide lockdowns. In fact, trade can insulate a country im-posing a stringent lockdown from the pandemic-shock, as its foreign inputs are less disrupted than its domestic ones.146
The authors also examined the effect of pandemic lockdowns on individual sectors (including manufacturing industries such as textiles, chemicals and pharmaceuticals, and electrical equipment) and concluded that “there is no sector in which supply chain re-nationalization notably improves resilience, measured either by GDP, or by value added of the sector itself.” These results are prelimi-nary but consistent with the research on open-ness and resiliency more generally. Combined, the analyses should foment caution among American policymakers seeking to improve U.S. economic resiliency and performance by renationalizing supply chains.
The research is also backed by anecdotal evidence: in his book on the economics of COVID-19, for example, Cato’s Ryan Bourne documents several instances of foreign suppli-ers and trade openness (e.g., East Asian cloth-ing producers and foreign carmakers) helping the U.S. economy recover and of closed sec-tors (e.g., domestic meatpacking facilities or tariff-protected light truck production) doing the opposite.147
Indeed, domestic policy likely outweighs trade openness in terms of mitigating the risk of economic shocks. For example, two

36
“Domestic policy likely outweighs trade openness in terms of mitigating the risk of economic shocks, including pandemics.”
of the most “trade-dependent” countries noted in the previous section (Germany and South Korea) experienced COVID-19-induced quarterly GDP contractions in the first half of 2020 that were similar to or better than the rel-atively “closed” Japan or United States, while other “open” economies performed less favor-ably over the same period.148 Germany’s initial “V-shaped” recovery is particularly notewor-thy in this regard, given the country’s level of economic development and high dependence on trade.149 Sweden, meanwhile, also has “high exposure to international value chains” but “face[d] a milder recession this year than many economies in the euro area.”150 Bourne further notes that certain foreign suppliers rebounded quickly from COVID-19, but “it was the lack of demand from importing countries that took longer to contain the virus, such as the United States and the UK, which prolonged a depres-sion of activity in those industries.”151 These situations indicate that domestic policies, in particular countries’ ability to control the vi-rus or keep their economies open, drove their economic performance more than trade or in-vestment liberalization. Subsequent research supports these conclusions.152
Research also supports the general primacy of domestic policy and domestic demand over trade openness in terms of mitigating eco-nomic shocks. For example, the study from Caldera and others found that the policies with the greatest benefit in terms of both economic growth and crisis risk were those that improve the quality of domestic institutions (e.g., more effective government, greater voice and ac-countability, and better control of corrup-tion). A 2016 examination from Lino Briguglio and Melchior Vella of 172 countries found that trade openness can lead to economic growth volatility but that this risk can be mitigated entirely by good governance (as measured in this case by the Rule of Law portion of the Worldwide Governance Indicators).153 A World Bank analysis of how various policies affect the ability of European economies to absorb an external shock and recover thereafter found the most significant and negative effects for
both shock absorption and recovery to come from domestic policies, namely state control of production and prices; regulatory barriers to entrepreneurship; and an uncompetitive bank-ing sector. (Trade openness effects, meanwhile, were mixed or ambiguous.)154
MARKET-ORIENTED POLICIES CAN SUPPORT MANUFACTURING AND NATIONAL SECURITY
Although the data belie the supposed “death” of the U.S. manufacturing sec-tor and the defense industrial base, sev-eral market-oriented policy reforms would support national security by strengthening the U.S. economy in general and boosting the manufacturing sector’s performance in partic-ular. Where possible, the reforms discussed in this section incorporate current U.S. laws and policies related to national security (see the Appendix) and reflect the preceding sections’ conclusions that using only domestic output to satisfy U.S. demand in times of emergency would be impractical (as even many industrial policy advocates recognize155) and counterpro-ductive; that U.S. industrial policies targeting specific companies or industries have a woeful track record; that simply removing govern-ment restrictions on trade, investment, and consumption would better achieve core na-tional security objectives; and that domestic policies are a critical contributor to a nation’s economic strength and resiliency.
Trade and Investment Reforms to Bolster National Security
Six policies liberalizing trade and invest-ment would support U.S. national security by improving access to and production of essen-tial goods:
y Unilateral liberalization of tariffs on industrial inputs. President Trump’s tariffs on global steel and aluminum imports, as well as on Chinese capital goods, have been repeatedly found to harm the U.S. manufacturing sector

37
“Eliminate restrictions on imports of manufacturing inputs and liberalize trade and investment with allies through mechanisms such as the National Technology and Industrial Base.”
and antagonize allies (e.g., the EU and Canada) while providing little long-term benefit to the protected domestic in-dustries at issue. Eliminating these measures—whether through unilateral executive action or legislation—would thus provide an immediate boost to the U.S. manufacturing sector. Longer term, Congress should reform or elim-inate the U.S. laws, such as Section 232, that provide the president with vast discretion to impose tariffs on “national security” or other grounds without any congressional input or oversight—thus generating tariffs and injecting uncertainty into manufactur-ing supply chains. Should full repeal or line-by-line amendment of these laws prove politically untenable, Congress should consider legislation that would subject presidential trade restrictions to congressional approval, such as the Global Trade Accountability Act, which Sen. Mike Lee (R-UT) introduced.156
U.S. “trade remedy” duties on indus-trial inputs impose similar economic harms.157 Congress should follow other jurisdictions by requiring the executive branch to consider the costs that these duties inflict on other U.S. manufactur-ers and to refrain from implementing them where doing so would be inconsis-tent with the “public interest,” including U.S. national security. Other method-ological improvements might also be in order.158 Finally, Congress should expand the current provision of U.S. law prohib-iting the president from restricting “the importation into the United States of any material determined to be strategic and critical” under the Stock Piling Act (with limited exceptions) to apply to any other goods that the U.S. government deems so “essential” as to be stockpiled in case of national emergency.159
y New trade and investment agreements with U.S. allies. The U.S. government should liberalize trade and investment
with allies through existing legal mecha-nisms, including expanding the National Technology and Industrial Base (NTIB) to include allies (and innovative manufac-turing nations) such as Finland, Germany, Japan, the Netherlands, South Korea, Singapore, Switzerland, and Sweden; fully implementing the NTIB and fur-ther liberalizing trade, investment, and R&D collaboration among all NTIB members, for example by eliminating U.S. procurement restrictions (e.g., Buy American; the Berry Amendment; and the Byrnes-Tollefson Amendment), ex-empting NTIB members from U.S. in-vestment screening, and eliminating U.S. controls on high-technology and defense-related exports to these trusted nations; and entering into new recipro-cal defense procurement agreements or security of supply arrangements, or expanding the coverage of the current agreements (e.g., to medical goods), to ensure that the United States and partner countries have access to essential items in times of emergency or abnormally high demand. Over the longer term, the United States should consider new com-prehensive free trade agreements with these and other countries, including by reentering the Trans-Pacific Partnership (now the Comprehensive and Progressive Trans-Pacific Partnership).
There already appears to be support in Congress for several of these rec-ommendations. For example, the 2021 NDAA instructs the DOD to improve NTIB implementation and consider ex-panding the list of NTIB member coun-tries.160 This process has only just begun, and further NTIB reforms—for ex-ample with respect to procurement, in-vestment, and export controls—remain necessary. The legislation also imposes new printed circuit board acquisition requirements on the DOD but permits the DOD to acquire these items from “covered nations,” which includes the

38
“Eliminate the Jones Act and ‘Buy American’ restrictions, and reform U.S. export controls and trade agreement exceptions for ‘national security.’”
United States, NTIB members, NATO members with reciprocal procurement agreements, and any other country (ex-cluding Russia, China, Iran, and North Korea) that meets specified national se-curity conditions.161
y Repealing the Jones Act. As the 2018 Cato Institute paper concluded, the evi-dence against the Jones Act is compelling:
Under its watch the U.S. shipbuild-ing industry has atrophied, its shipping fleet has withered, and any contribution to the military’s sealift capability has been trivial at best. The failure of the Jones Act to meet its intended objec-tives, meanwhile, has inflicted consider-able economic harm through a variety of direct and indirect channels. Rather than serving to bolster national secu-rity, the Jones Act has stultified domes-tic shipbuilding, diminished the size of America’s merchant marine reserve, and hamstrung our ability to respond expe-ditiously and effectively to natural and manmade disasters.162
Nothing less than immediate repeal is warranted. In the meantime, the pres-ident should grant any waiver requests submitted by American companies now suffering under the law.
y Reforming U.S. export controls. As documented by numerous experts, U.S. “national security” restrictions on certain exports, especially technology products such as satellites and semiconductors, can harm the U.S. defense industrial base.163 For example, export controls can reduce the incentive for investment by reducing the market size for a company’s goods.164 Beyond the aforementioned NTIB-related reform, U.S. policymakers should reform the U.S. export controls regime more broadly by limiting controls to only essential national security objec-tives; omitting items that are available in other countries; streamlining the export licensing process to minimize exporter (and taxpayer) burdens; or ensuring
system flexibility through automatic sun-set provisions or mandatory annual re-views of controlled products.
y Reforming existing trade agreement rules on national security and short supply. The terms under which U.S. trade agreement parties can restrict trade in the name of “national security” or “short supply” should be revised to establish objective definitions of both terms and ensure that participants’ in-vocation of these exceptions is subject to binding dispute settlement.165 These reforms would maintain national sov-ereignty while increasing predictabil-ity for U.S. companies and disciplining abuse by governments. The national se-curity exception changes would also be consistent with the United States’ his-torical view of the General Agreement on Tariffs and Trade.166
y Eliminating Buy American restric-tions. As Cato scholars have argued for decades, Buy American procurement re-quirements are bad law, bad economics, bad trade policy, and bad politics—and can especially harm U.S. manufactur-ers.167 The U.S. government should elim-inate these restrictions, particularly for the procurement of essential goods and services. For example, the government should terminate the Stock Piling Act’s Buy American rules for “strategic and critical materials” and should block at-tempts to implement similar rules for the Strategic National Stockpile (which covers medical goods). As President Truman warned when signing the Stock Piling Act into law:
[Buy American] provisions will not only materially increase the cost of the proposed stockpiles but will tend to defeat the conser-vation and strategic objectives of the bill by further depleting our already inadequate underground reserves of strategic materials.

39
“‘Horizontal’ reforms of U.S. immigration, education, tax, and regulatory policies would boost U.S. manufacturers and national security.”
Furthermore, there can be a seri-ous conflict between those provi-sions and the foreign economic policy which this Government is actively pursuing. It also seems to me that the application of the Buy American Act may frequent-ly hamper the effective achieve-ment of the essential purpose of the legislation which is to enlarge the stock of vital raw materials available within our borders in time of possible emergency.168
These principles apply equally today.
Other Market-Oriented Reforms to Enhance U.S. National Security
Beyond trade policy, the United States should implement “horizontal” economic re-forms that would boost U.S. manufacturers and national security:
y Human capital. To address the DOD’s immediate concerns regarding the dearth of qualified U.S. manufactur-ing workers in science, technology, en-gineering, and mathematics fields, the federal government should significant-ly expand high-skilled immigration. Research shows that U.S. restrictions on high-skilled immigration have under-mined national security objectives by encouraging multinational corporations to offshore jobs and R&D activities to their affiliates in more welcoming coun-tries and by benefiting potential U.S. ad-versaries, especially China, in terms of new jobs, new businesses, and new inno-vations, thus causing a relative decline in the United States’ own innovative capaci-ty.169 In fact, restrictive U.S. immigration policies have likely boosted China’s semi-conductor industry, which the ITC in 2019 found had been hamstrung by a lack of skilled human capital.170
Over the longer term, private-sector training and apprenticeship programs
can equip native workers for the future needs of advanced manufacturing indus-tries. For example, the employer-funded Federation for Advanced Manufacturing Education program has helped hun-dreds of new high-school graduates and older factory workers gain modern (“grey collar”) manufacturing skills and find high-paying work in U.S. factories that now utilize computers and robot-ics.171 These efforts can be assisted by reforms to federal, state, and local gov-ernment educational policies that elimi-nate biases against vocational schools that can provide skills at lower cost and allow older workers, whether currently employed or recently jobless, to train for new careers.172
y Tax policy. Governments should further reform corporate tax policy to encourage American companies—manufacturers or otherwise—to locate and invest in the United States and to ensure that current businesses are globally competitive. In particular, the federal government and the states should further reduce corpo-rate tax rates, which combined remain above the Organisation for Economic Co-operation and Development aver-age and are shouldered in large part by workers and consumers.173 The gov-ernment should also expand and make permanent the 2017 Tax Cuts and Jobs Act’s temporary “full expensing” provi-sion (“100 percent bonus depreciation”), which allows U.S. businesses to write off certain business investments imme-diately and fully. Localities might also consider lowering property taxes, which are borne by owners of industrial (and other) real estate and are high by global standards.174 These reforms would ben-efit all companies and should be pursued regardless of any national security con-cerns. Nevertheless, they would benefit the U.S. manufacturing sector: substan-tial research shows, for example, that full expensing increases investment, jobs,

40
“The case of machine tools—highlighted as ‘at risk’ by the Department of Defense—shows the potential benefits of the free market reforms proposed herein.”
and economic growth and that a per-manent and expanded version (covering structures such as factories) would espe-cially benefit U.S. manufacturers.175
y Eliminate “never needed” regula-tions. During the COVID-19 pan-demic, state and federal governments temporarily suspended hundreds of regulations to boost domestic pro-duction, investment, and adjustment during the national emergency, reveal-ing in the process that these “never needed” regulations discouraged eco-nomic growth and dynamism while providing little, if any, public benefit.176 Although many of these regulations affect nonmanufacturing issues and industries (e.g., physician licensing), many others—such as FDA testing and approval of medical goods—directly in-hibit the domestic production of cer-tain essential goods. Others, such as biofuels mandates, increase production costs for U.S. manufacturers. Repeal of these regulations would therefore boost not only economic growth gener-ally but also American manufacturers directly—all to the benefit of national security.
Additional government action should not be considered unless and until these and other market-oriented policies prove insufficient to satisfy legitimate U.S. national security con-cerns. New and expansive industrial policy programs, however, would be unnecessary. U.S. law already provides the federal government with several tools (e.g., Title III of the Defense Production Act of 1950 or U.S. government stockpiles) to fill discrete gaps in the defense industrial base. (See the Appendix.) And expe-rience with these laws, the current state of the U.S. manufacturing sector, and the failures of past “security nationalism” policies argue for both skepticism and caution when pursuing protectionism, subsidies, or other government interventions intended to boost specific parts of the U.S. defense industrial base.177
Case Study: Machine ToolsThe case of machine tools—an industry
highlighted as “at risk” by the DOD in its Fiscal Year 2019 Industrial Capabilities Report to Congress (and often by advocates of U.S. industrial poli-cy)—shows the potential benefits of several of the reforms in the previous section. The DOD’s report made the following findings:
y The United States in 2017 was the second largest consumer and fifth largest produc-er of machine tools (behind China, Japan, Germany, and Italy, and just in front of South Korea, Taiwan, and Switzerland).
y “Major risks” to the industry include U.S. universities’ lack of “large-scale industrial machine tool research pro-grams” and of cooperative efforts with industry; a lack of skilled labor to meet current and projected needs (likely the largest problem); “economic tradecraft” and intellectual property theft by China and unnamed other countries; other na-tions’ “coherent investment plans and tax policies to support their own indus-trial sectors”; and U.S. export controls. The DOD subsequently lamented the fact that foreign machine tool produc-ers, notably in Japan and Taiwan, were increasing exports to China while de-creasing exports to the United States.
y To address the “major risks” identified, the DOD has begun working on plans to improve the U.S. machine tools work-force and establish a national network of “machine tool hubs” focused on both skills development and “increasing the prestige of manufacturing as a profes-sion in order to inspire more prospec-tive workers to choose it as a career.”178
Despite these risks, the DOD did not view it necessary to directly subsidize the U.S. ma-chine tool industry or specific domestic goods using one of the numerous legal authorities permitting it to do so (see Appendix).
Many of the problems that the DOD identified (to the extent that they are valid

41
“Given the health of U.S. manufacturing, the checkered history of government intervention, and the availability and efficacy of market-oriented alternatives, security nationalism proposals warrant extreme skepticism.”
at all179) would be improved by implement-ing the reforms discussed in the preceding subsections. Although the United States re-mained a top-five global producer of machine tools, the government could solidify access to these goods through new arrangements that liberalize trade (tariff and nontariff barri-ers180) in machine tools with allies and major producing nations such as Japan, Germany, Italy, South Korea, and Taiwan. (In a good first step, the Trump administration reduced tariffs on certain Japanese machine tools as part of the 2019 U.S.-Japan “Phase One” Deal.181) U.S. machine tools producers and their customers, moreover, would benefit from the elimination of tariffs on industrial inputs (especially steel and aluminum) and current restrictions on high-skill foreign workers as well as from cor-porate tax and regulatory reforms. And U.S. workers would benefit from private-sector workforce development programs such as the Federation for Advanced Manufacturing Education program.
Given the failures of U.S. machine tools protectionism and planning in the 1980s and 1990s, as well as the documented economic and political problems with American pro-tectionism and industrial policy more broad-ly, these market-oriented policies should be prioritized.
CONCLUSIONAlthough theory might support using pro-
tectionism and other market interventions to boost national security, current “security na-tionalism” proposals ignore several facts. First,
reports of the demise of U.S. industrial base are exaggerated—overall, the U.S. manufac-turing sector is productive on both global and historical terms, as are the industries that are most relevant to national security. Second, his-tory and academic research show that freer markets can bolster national security and economic resilience and that U.S. “security nationalism,” by contrast, has been not only unsuccessful but often based on an expansive and political definition of “national security.” Third, U.S. law already permits the federal government, primarily through the DOD, to address discrete weaknesses in the defense industrial base.
For these reasons, expansive new security nationalism proposals warrant extreme skep-ticism, and market-oriented policies should be prioritized. As President Truman stated decades ago:
The United States is opposed to govern-mental policies fostering autarchy, for it-self as well as for others. Encouragement of uneconomic domestic production and unjustified preferential treat-ment of domestic producers destroys trade and so undermines our national economic strength. A large volume of soundly based international trade is es-sential if we are to achieve prosperity in the United States, build a durable struc-ture of world economy and attain our goal of world peace and security.182
American policymakers would be wise to remember—and heed—Truman’s advice.

42
APPENDIX: SUMMARY OF U.S. LAWS INTENDED TO SUPPORT THE DEFENSE INDUSTRIAL BASE
U.S. Policies Expanding International Cooperation to Bolster National Security
THE NATIONAL TECHNOLOGY AND INDUSTRIAL BASE. The United States has established a four-country National Technology and Industrial Base (NTIB) specifically designed to bolster U.S. national security by expanding the country’s industrial capacity beyond U.S. borders. A 2020 Congressional Research Service (CRS) report describes the NTIB as follows:
The [NTIB] consists of the people and organizations engaged in national security and dual-use research and development (R&D), production, maintenance, and related activities within the United States, Canada, the United Kingdom, and Australia. The NTIB, as established by 10 U.S.C. §2500, is intended to sup-port national security objectives of the United States, including supplying military operations; conducting advanced R&D and systems development to ensure technological superiority of the U.S. Armed Forces; se-curing reliable sources of critical materials; and devel-oping industrial preparedness to support operations in wartime or during a national emergency.183
The CRS report adds that the NTIB was part of an ef-fort by Congress in the mid-1990s to support production and R&D of critical defense materials and products. It orig-inally included Canada—a long-standing U.S. defense indus-trial partner184—but was expanded in 2016 (as part of the National Defense Authorization Act for Fiscal Year 2017) to include the United Kingdom and Australia to leverage those countries’ defense R&D efforts and to avoid U.S. restric-tions on exports of technology to these allies. According to the report, “Congress also directed [the Department of Defense] to create a plan that would promote closer inte-gration of the technology and industrial bases of all NTIB member countries.”185 Such integration was, in Congress’ view, an important way to boost U.S. national security.
Participation in the NTIB allows member countries and their manufacturers several benefits: procurement prefer-ences for conventional ammunition, uniforms, and other items; exemptions from some domestic sourcing (Buy American) restrictions on the U.S. government’s acquisi-tion of buses, chemical weapons antidotes, valves and ma-chine tools, ball bearings and roller bearings, and certain components for naval ships (including diesel engines);186
exemptions from foreign ownership requirements of the National Industrial Security Program; and preferences for contracts awarded under a national security program. U.S. law also directs the secretary of defense to develop a “na-tional security strategy for the NTIB based on a prioritized assessment of risks and challenges to the defense supply chain” and to submit both an annual report to Congress on “NTIB capabilities, performance, and vulnerabilities” and a report on “unfunded priorities to address gaps or vul-nerabilities in the NTIB.”187
Although the NTIB was established years ago and re-flects Congress’s priority to bolster national security through international cooperation, little work has been undertaken to achieve congressional objectives. For example, the Fiscal Year 2019 Industrial Capabilities Report to Congress issued in 2020 contains limited references to the NTIB and describes no major U.S. government efforts thereunder (even though it notes a 2018 Department of Defense [DOD] recommenda-tion to address industrial base risks by “working with allies and partners on joint industrial base challenges through the NTIB and similar structures”).188
The CRS also noted other limitations on the NTIB’s use and thus the effective integration of the NTIB countries’ de-fense industrial bases, including domestic sourcing require-ments, such as the Buy American Act (41 U.S.C. §§ 8301–8303) and the Byrnes-Tollefson Amendment (10 U.S.C. § 8679); small business set-asides that apply only to American small businesses as defined under U.S. law; U.S. export controls on certain categories of defense articles and services, espe-cially the International Traffic in Arms Regulations, admin-istered by the State Department, that restrict the export of defense-related goods and services;189 and the NTIB’s omis-sion of Finland, Germany, the Netherlands, South Korea, Singapore, Switzerland, Sweden, or other U.S. allies that are innovative and productive.190
INTERNATIONAL DEFENSE PROCUREMENT AGREEMENTS. The United States also has several agreements with allies to ensure sufficient supplies of defense-related materials:
y Pursuant to reciprocal defense procurement agree-ments between the DOD and its counterparts in 27 foreign governments, each country agrees to re-move barriers to national security–related purchases of supplies and services of the other country.191 The countries with which the DOD has these agreements

43
also are considered “qualifying countries” under the United States’ Defense Federal Acquisition Regulation Supplement 225.872, meaning that the DOD has de-termined it “inconsistent with the public interest” to apply restrictions on the federal government’s acquisi-tion of qualifying products from these countries.192
y Second, the DOD also has security of supply arrange-ments with several countries (see Table 8) that “al-low the DOD to request priority delivery for DOD contracts, subcontracts, or orders from companies
in these countries.” These arrangements implement the “Meeting National Defense Requirements” sec-tion of the “Declarations of Principles for Enhanced Cooperation in Matters of Defense Equipment and Industry” that the United States has signed with cer-tain nations that “recognizes the potential for a cer-tain degree of mutual interdependence of supplies needed for national security, and calls for the par-ties to explore solutions for achieving assurance of supply.”193
U.S. defense procurement agreements
Table 8
Sources: “Security of Supply,” Industrial Policy, Department of Defense, http://www.businessdefense.gov/security-of-supply/; and “Reciprocal Defense
Procurement and Acquisition Policy Memoranda of Understanding,” International Contracting, Contract Policy, Defense Pricing and Contracting,
https://www.acq.osd.mil/dpap/cpic/ic/reciprocal_procurement_memoranda_of_understanding.html.
Australia
Austria
Belgium
Canada
Czech Republic
Denmark
Egypt
Estonia
Finland
Germany
Greece
Israel
Italy
Japan
Latvia
Luxembourg
Netherlands
Norway
Poland
Portugal
Slovenia
Spain
Sweden
Switzerland
Turkey
United Kingdom
Country Security of supply arrangement Reciprocal defense procurement and acquisition

44
Domestic Laws Aimed at Supporting the “Defense Industrial Base”
U.S. law also provides the DOD with authority to identify and mitigate defense-related industrial procurement and ca-pacity issues.
First, U.S. law requires the DOD to assess annually the de-fense industrial base and work to mitigate any potential con-cerns. In particular, the DOD is required to “develop a national security strategy” for the NTIB that “shall be based on a pri-oritized assessment of risks and challenges to the defense sup-ply chain and shall ensure that the national technology and industrial base is capable of achieving” multiple enumerated objectives, including the president’s National Security Strategy and “sustaining production, maintenance, repair, logistics, and other activities in support of military operations of various durations and intensity.” The law further requires the DOD, in consultation with secretary of commerce and the secretary of energy to “prepare selected assessments of the capability of the national technology and industrial base to attain the national security objectives set forth” in the statute. This in-cludes the submission of an annual Industrial Capabilities Report to Congress that reviews the U.S. defense industrial base and describes “any mitigation strategies necessary to address any gaps or vulnerabilities in the national technology and industri-al base” and “any other steps necessary to foster and safeguard the national technology and industrial base.”194
Second, U.S. law provides the DOD with several tools to implement the “mitigation strategies,” including those listed and described in Table 9. For example, the Defense Production Act of 1950 (DPA) allows the DOD to identify priority sectors for government contracting and enter into those contracts (Title I) and to support, through purchases or loans/loan guar-antees, “essential” domestic industrial base capabilities that are found to be nonexistent, at risk of loss, or insufficient to meet government needs (Title III). Several other programs provide the DOD with the authority and funding to sup-port the industrial base. The DOD also can use the National Defense Stockpile Transaction Fund and Strategic and Critical Materials Stock Piling Act (50 U.S.C. § 98 et seq.), which autho-rizes the National Defense Stockpile Manager to fund mate-rial R&D projects to develop new materials for the stockpile and requires the president to encourage the development and conservation of domestic sources of “strategic and critical ma-terials” through procurement.195 The Stock Piling Act is also subject to the Buy American Act of 1933, despite President Truman’s opposition at the time the policy was enacted.196
Past DOD recommendations and actions have used these laws to support the U.S. defense industrial base. For example,
in a September 2018 DOD report issued pursuant to President Trump’s July 21, 2017, Executive Order 13806 on “Assessing and Strengthening the Manufacturing and Defense Industrial Base and Supply Chain Resiliency of the United States,” the DOD expressly noted that it can address industrial base risks by, among other things: expanding direct investment in the lower tier of the industrial base through DPA Title III, ManTech, and Industrial Base Analysis and Sustainment programs; diver-sifying sources of domestic and international supply of critical materials and technologies, including through expanded use of the National Defense Stockpile program; and working with allies and partners on joint industrial base challenges through the NTIB and similar structures.197
The fiscal years 2018 and 2019 industrial capabilities re-ports submitted to Congress also use the legal authorities from Table 9. The reports, however, do not show a broad-based de-cline in the U.S. manufacturing sector as a whole and instead conclude that the U.S. defense industrial base is, in general, “profitable and expanding.”198 The fiscal year 2019 report, in particular, summarizes the strong and improving state of the defense industry and then provides sector-specific risk as-sessments for aircraft; chemical, biological, radiological, nu-clear; ground systems; missiles and munitions; nuclear matter warheads; radar and electronic warfare; shipbuilding; soldier systems; space; materials; cybersecurity for manufacturing; electronics; machine tools; organic defense industrial base; software engineering; and workforce. These analyses reveal very few sector-wide concerns, instead focusing on narrow product/process risks (e.g., ammonium perchlorate supply or gallium nitride technologies199) that may require DOD sup-port. As a result, the fiscal year 2019 report lists relatively few actions by the DOD to mitigate—for example through direct funding under DPA Title III—risks to the domestic indus-trial base. Indeed, the most common risks found in the DOD industrial bases analyses are lack of a skilled and “clearable” workforce and insufficient demand from the U.S. govern-ment. Neither can be blamed on “deindustrialization.”
The primary exceptions to DOD’s conclusions are in the soldier systems (textiles; batteries; night vision), electron-ics (in particular, printed circuit boards), and machine tools sectors, where the DOD voiced broader concerns about the health of the domestic industry. However, despite these complaints, the DOD did not intervene (e.g., through subsi-dies or contracts) to support the sector’s industrial capabili-ties or specific products. Among the DOD’s reasons for not doing so was a lack of “unacceptable levels of industrial base risks.”200 Instead, the DOD’s efforts were again focused on improving workforce-related impediments, such as science,

45
S�urce: Office �f I�dustrial P�licy, Industrial Capabilities: Annual Report to Congress, Fiscal Year 2018 (Washi�gt��: Departme�t �f Defe�se, May 13, 2019).
U.S. domestic laws intended to support defense industrial base
Table 9
Defe�se
Pri�rities
a�d
All�cati��s
System
(DPAS)
Title I �f the
Defe�se
Pr�ducti��
Act �f 1950
(DPA)
The purp�se �f the DPA is t� assure the timely availability
�f i�dustrial res�urces t� meet curre�t �ati��al defe�se
a�d emerge�cy prepared�ess pr�gram requireme�ts a�d
t� pr�vide a� �perati�g system t� supp�rt rapid i�dustrial
resp��se i� day-t�-day �perati��s a�d �ati��al
emerge�cies. The DPA auth�rized the preside�t t� require
prefere�tial treatme�t �f �ati��al defe�se pr�grams. DPAS
establishes pr�cedures f�r placeme�t �f pri�rity rati�gs ��
c��tracts, den�es the i�dustry’s resp��sibilities u�der
rated �rders, a�d sets f�rth c�mplia�ce pr�cedures.
As �f nscal year (FY) 2019, there were
13 “DX” pr�grams, which have the
“highest �ati��al defe�se urge�cy.”
DPA Title III
Title III �f
the DPA
The DPA Title III pr�gram pr�vides the preside�t, thr�ugh
the Departme�t �f Defe�se (DOD), br�ad auth�rity t�
e�sure timely availability �f d�mestic i�dustrial res�urces
esse�tial f�r the executi�� �f the Nati��al Security
Strategy �f the U�ited States thr�ugh the use �f tail�red
ec���mic i�ce�tives.
At e�d �f FY 19, the DPA Title III
p�rtf�li� c��sisted �f 37 pr�jects
t�tali�g m�re tha� $1 billi�� i�
g�ver�me�t a�d i�dustry fu�di�g t�
stre�gthe� the d�mestic i�dustrial base.
The
C�mmittee
�� F�reig�
I�vestme�t
i� the
U�ited
States
(CFIUS)
Secti�� 721
�f the DPA
CFIUS is a� i�terage�cy c�mmittee that reviews certai�
f�reig� acquisiti��s, mergers, �r take�vers �f U.S.
busi�esses t� determi�e the effect �f a tra�sacti�� �� the
�ati��al security �f the U�ited States. The c�mmittee is
chaired by the secretary �f the Treasury Departme�t a�d
i�cludes �i�e v�ti�g members, i�cludi�g the DOD (thr�ugh
its Ofnce �f I�dustrial P�licy).
CFIUS reviewed 231 “c�vered
tra�sacti��s” i� 2019.
Ofnce �f
Small
Busi�ess
Pr�grams
(OSBP)
Secti�� 831
�f the
Nati��al
Defe�se
Auth�rizati��
Act �f FY 91
The OSBP maximizes prime a�d subc��tracti�g
�pp�rtu�ities f�r small busi�esses t� resp��d t� DOD
“warnghter requireme�ts.” The pr�gram’s g�al is t�
c��tribute t� a� “i���vative, c�st effective, a�d agile
i�dustrial base, t� directly supp�rt the Nati��al Defe�se
Strategy a�d a r�bust ec���my.”
I� FY 19, the OSBP c��ducted �umer�us
trai�i�g sessi��s f�r small busi�esses
acr�ss the c�u�try.
I�dustrial
Base Fu�d
10 U.S.C. §
2508
The I�dustrial Base A�alysis a�d Sustai�me�t (IBAS)
pr�gram seeks t� “create a m�der� I�dustrial Base that
f�rtines traditi��al a�d f�rges emergi�g sect�rs t�
resp��d at will t� Nati��al Security Requireme�ts.” U�der
the IBAS, DOD makes direct i�vestme�ts “t� impr�ve
i�dustrial base resilie�ce t� impr�ve f�rce readi�ess.” The
IBAS �fnce directs i�vestme�t by ide�tifyi�g strategy/f�cus
areas, �btai�i�g res�urces, a�d �verseei�g the executi��
�f pr�jects, “aimi�g t� ameli�rate i�dustrial base a�d
ma�ufacturi�g issues a�d stre�gthe� the defe�se
i�dustrial base.” This i�cludes eff�rts thr�ugh C�r�erst��e
Other Tra�sacti�� Auth�rity, which is a g�ver�me�t-ru�,
i�tegrated c��tract vehicle that carries �ut pr�t�type
pr�jects, capabilities, a�d capacities i� supp�rt �f defe�se
i�dustrial base requireme�ts acr�ss 18 sect�rs.
I� FY 19, IBAS made i�vestme�ts i� the
f�ll�wi�g areas: huma� capital (s�lid
r�cket m�t�r i�itiative a�d w�rkf�rce
skills); i�frastructure (�aval pr�pulsi��
f�u�dry, alumi�um f�u�dry, tu�gste�,
a�d electr��ic beam weldi�g); s�urce
mitigati�� (micr�electr��ics a�d
materials i�cludi�g b�r�� carbide,
expl�sive i�itiat�rs, carb�� nber, a�d
critical e�ergetics [buta�etri�l]); a�d
c��strai�ed, fragile, a�d emergi�g
markets (directed e�ergy supply chai�
assura�ce i�itiative, radar aff�rdability
a�d resilie�cy i�itiative, small u�ma��ed
aircraft system, �ptical ceramics, a�d
carb�� �a��tube).
Small
Busi�ess
I���vati��
Research
(SBIR) a�d
Small
Busi�ess
Tech��l�gy
Tra�sfer
(STTR)
pr�grams
15 U.S.C. §
638
The SBIR pr�gram is i�te�ded t� stre�gthe� the r�le �f
i���vative small busi�ess c��cer�s i� federally fu�ded
research �r research a�d devel�pme�t (R/R&D). A�y
federal age�cy with a� extramural budget f�r R/R&D i�
excess �f $100 milli�� must participate i� the SBIR
pr�gram a�d reserve a mi�imum perce�tage �f its R/R&D
budgets f�r small busi�ess R/R&D c��tracts. The STTR
pr�gram expa�ds public- a�d private-sect�r part�erships t�
i�clude j�i�t ve�ture �pp�rtu�ities f�r small busi�esses
a�d ���pr�nt research i�stituti��s. I� particular, the STTR
pr�gram pr�vides n�a�ci�g t� bridge the gap betwee�
basic R&D a�d c�mmercializati�� �f resulti�g i���vati��s.
Acc�rdi�g t� a 2019 DOD-fu�ded rep�rt,
the SBIR/STTR c��tracts i�itiated
betwee� 1995 a�d 2015 ge�erated:
$121 billi�� i� t�tal sales �f �ew
pr�ducts a�d services; $28 billi�� i�
sales �f �ew pr�ducts t� the U.S.
military; $347 billi�� i� t�tal ec���mic
impact �ati��wide; a�d 1,508,295 U.S.
j�bs with a� average c�mpe�sati�� �f
$73,461.
Rapid
I���vati��
Fu�d (RIF)
Pub. L. N�.
116-92 §
878
The RIF pr�gram was established by the Nati��al Defe�se
Auth�rizati�� Act �f FY 11 as a c�mpetitive, merit-based
pr�gram desig�ed t� accelerate the neldi�g �f i���vative
tech��l�gies fr�m SBIR/STTR, defe�se lab�rat�ries, a�d
�ther s�urces i�t� military systems.
C��gress appr�priated $250 milli�� t�
RIF i� FY 19 fu�di�g. FY 19 pr�gram
highlights i�clude: $120 milli�� pr�jects
selected by m�der�izati�� assista�t
direct�rs; $120 milli�� missi�� pri�rity
pr�jects selected by military services
a�d DOD age�cies; a�d a t�tal �f 94
a�ticipated awards w�rth $2.5 milli��
each.
Ma�Tech
10 U.S.C. §
2521
The DOD Ma�ufacturi�g Tech��l�gy (Ma�Tech) pr�gram is
desig�ed t� a�ticipate a�d cl�se gaps i� d�mestic
ma�ufacturi�g capabilities thr�ugh the “devel�pme�t a�d
applicati�� �f adva�ced ma�ufacturi�g tech��l�gies a�d
pr�cesses that will reduce the acquisiti�� a�d
supp�rtability c�sts �f defe�se weap�� systems a�d
reduce ma�ufacturi�g a�d repair cycle times acr�ss the
life cycles �f such systems.”
I� FY 19, Ma�Tech pr�jects c�vered
i�frared se�s�rs, hypers��ic aer�shell
c�ati�gs, high-yield f�cal pla�e arrays,
OL�D micr�displays, micr�circuit
emulati��, a�d l��g-ra�ge discrimi�ati��
radar.
Nati��al
Defe�se
St�ckpile
Tra�sacti��
Fu�d
Strategic
a�d Critical
Materials
St�ck Pili�g
Act
The Strategic a�d Critical Materials St�ck Pili�g Act �f
1939 pr�vides f�r the pr�cureme�t, recycli�g, a�d upgrade
�f strategic a�d critical materials by the Nati��al Defe�se
St�ckpile (NDS) pr�gram. The DOD admi�isters this
pr�gram via a rev�lvi�g fu�d called the NDS Tra�sacti��
Fu�d, which is pr�jected t� be exhausted by FY 25.
Betwee� FY 03 a�d FY 18, the NDS
Tra�sacti�� Fu�d made the f�ll�wi�g
distributi��s: NDS acquisiti��s, s�urce
qualincati��s, R&D ($471.3 milli��);
���defe�se acc�u�ts ($998.6 milli��);
�ther defe�se acc�u�ts ($2.702 billi��);
a�d �et cash o�w ($3.283 billi��).
Program
Legal
authority
Objective Actions
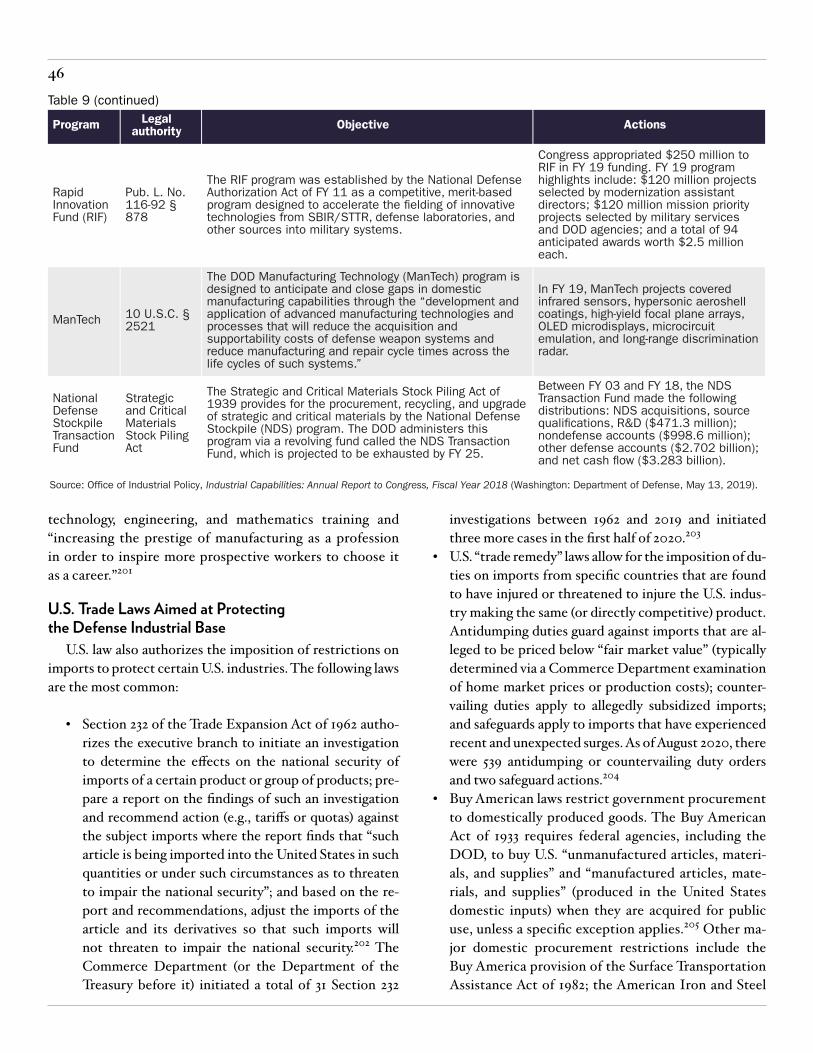
46
technology, engineering, and mathematics training and “increasing the prestige of manufacturing as a profession in order to inspire more prospective workers to choose it as a career.”201
U.S. Trade Laws Aimed at Protecting the Defense Industrial Base
U.S. law also authorizes the imposition of restrictions on imports to protect certain U.S. industries. The following laws are the most common:
y Section 232 of the Trade Expansion Act of 1962 autho-rizes the executive branch to initiate an investigation to determine the effects on the national security of imports of a certain product or group of products; pre-pare a report on the findings of such an investigation and recommend action (e.g., tariffs or quotas) against the subject imports where the report finds that “such article is being imported into the United States in such quantities or under such circumstances as to threaten to impair the national security”; and based on the re-port and recommendations, adjust the imports of the article and its derivatives so that such imports will not threaten to impair the national security.202 The Commerce Department (or the Department of the Treasury before it) initiated a total of 31 Section 232
investigations between 1962 and 2019 and initiated three more cases in the first half of 2020.203
y U.S. “trade remedy” laws allow for the imposition of du-ties on imports from specific countries that are found to have injured or threatened to injure the U.S. indus-try making the same (or directly competitive) product. Antidumping duties guard against imports that are al-leged to be priced below “fair market value” (typically determined via a Commerce Department examination of home market prices or production costs); counter-vailing duties apply to allegedly subsidized imports; and safeguards apply to imports that have experienced recent and unexpected surges. As of August 2020, there were 539 antidumping or countervailing duty orders and two safeguard actions.204
y Buy American laws restrict government procurement to domestically produced goods. The Buy American Act of 1933 requires federal agencies, including the DOD, to buy U.S. “unmanufactured articles, materi-als, and supplies” and “manufactured articles, mate-rials, and supplies” (produced in the United States domestic inputs) when they are acquired for public use, unless a specific exception applies.205 Other ma-jor domestic procurement restrictions include the Buy America provision of the Surface Transportation Assistance Act of 1982; the American Iron and Steel
S�urce: Office �f I�dustrial P�licy, Industrial Capabilities: Annual Report to Congress, Fiscal Year 2018 (Washi�gt��: Departme�t �f Defe�se, May 13, 2019).
U.S. domestic laws intended to support defense industrial base
Table 9
Defe�se
Pri�rities
a�d
All�cati��s
System
(DPAS)
Title I �f the
Defe�se
Pr�ducti��
Act �f 1950
(DPA)
The purp�se �f the DPA is t� assure the timely availability
�f i�dustrial res�urces t� meet curre�t �ati��al defe�se
a�d emerge�cy prepared�ess pr�gram requireme�ts a�d
t� pr�vide a� �perati�g system t� supp�rt rapid i�dustrial
resp��se i� day-t�-day �perati��s a�d �ati��al
emerge�cies. The DPA auth�rized the preside�t t� require
prefere�tial treatme�t �f �ati��al defe�se pr�grams. DPAS
establishes pr�cedures f�r placeme�t �f pri�rity rati�gs ��
c��tracts, den�es the i�dustry’s resp��sibilities u�der
rated �rders, a�d sets f�rth c�mplia�ce pr�cedures.
As �f nscal year (FY) 2019, there were
13 “DX” pr�grams, which have the
“highest �ati��al defe�se urge�cy.”
DPA Title III
Title III �f
the DPA
The DPA Title III pr�gram pr�vides the preside�t, thr�ugh
the Departme�t �f Defe�se (DOD), br�ad auth�rity t�
e�sure timely availability �f d�mestic i�dustrial res�urces
esse�tial f�r the executi�� �f the Nati��al Security
Strategy �f the U�ited States thr�ugh the use �f tail�red
ec���mic i�ce�tives.
At e�d �f FY 19, the DPA Title III
p�rtf�li� c��sisted �f 37 pr�jects
t�tali�g m�re tha� $1 billi�� i�
g�ver�me�t a�d i�dustry fu�di�g t�
stre�gthe� the d�mestic i�dustrial base.
The
C�mmittee
�� F�reig�
I�vestme�t
i� the
U�ited
States
(CFIUS)
Secti�� 721
�f the DPA
CFIUS is a� i�terage�cy c�mmittee that reviews certai�
f�reig� acquisiti��s, mergers, �r take�vers �f U.S.
busi�esses t� determi�e the effect �f a tra�sacti�� �� the
�ati��al security �f the U�ited States. The c�mmittee is
chaired by the secretary �f the Treasury Departme�t a�d
i�cludes �i�e v�ti�g members, i�cludi�g the DOD (thr�ugh
its Ofnce �f I�dustrial P�licy).
CFIUS reviewed 231 “c�vered
tra�sacti��s” i� 2019.
Ofnce �f
Small
Busi�ess
Pr�grams
(OSBP)
Secti�� 831
�f the
Nati��al
Defe�se
Auth�rizati��
Act �f FY 91
The OSBP maximizes prime a�d subc��tracti�g
�pp�rtu�ities f�r small busi�esses t� resp��d t� DOD
“warnghter requireme�ts.” The pr�gram’s g�al is t�
c��tribute t� a� “i���vative, c�st effective, a�d agile
i�dustrial base, t� directly supp�rt the Nati��al Defe�se
Strategy a�d a r�bust ec���my.”
I� FY 19, the OSBP c��ducted �umer�us
trai�i�g sessi��s f�r small busi�esses
acr�ss the c�u�try.
I�dustrial
Base Fu�d
10 U.S.C. §
2508
The I�dustrial Base A�alysis a�d Sustai�me�t (IBAS)
pr�gram seeks t� “create a m�der� I�dustrial Base that
f�rtines traditi��al a�d f�rges emergi�g sect�rs t�
resp��d at will t� Nati��al Security Requireme�ts.” U�der
the IBAS, DOD makes direct i�vestme�ts “t� impr�ve
i�dustrial base resilie�ce t� impr�ve f�rce readi�ess.” The
IBAS �fnce directs i�vestme�t by ide�tifyi�g strategy/f�cus
areas, �btai�i�g res�urces, a�d �verseei�g the executi��
�f pr�jects, “aimi�g t� ameli�rate i�dustrial base a�d
ma�ufacturi�g issues a�d stre�gthe� the defe�se
i�dustrial base.” This i�cludes eff�rts thr�ugh C�r�erst��e
Other Tra�sacti�� Auth�rity, which is a g�ver�me�t-ru�,
i�tegrated c��tract vehicle that carries �ut pr�t�type
pr�jects, capabilities, a�d capacities i� supp�rt �f defe�se
i�dustrial base requireme�ts acr�ss 18 sect�rs.
I� FY 19, IBAS made i�vestme�ts i� the
f�ll�wi�g areas: huma� capital (s�lid
r�cket m�t�r i�itiative a�d w�rkf�rce
skills); i�frastructure (�aval pr�pulsi��
f�u�dry, alumi�um f�u�dry, tu�gste�,
a�d electr��ic beam weldi�g); s�urce
mitigati�� (micr�electr��ics a�d
materials i�cludi�g b�r�� carbide,
expl�sive i�itiat�rs, carb�� nber, a�d
critical e�ergetics [buta�etri�l]); a�d
c��strai�ed, fragile, a�d emergi�g
markets (directed e�ergy supply chai�
assura�ce i�itiative, radar aff�rdability
a�d resilie�cy i�itiative, small u�ma��ed
aircraft system, �ptical ceramics, a�d
carb�� �a��tube).
Small
Busi�ess
I���vati��
Research
(SBIR) a�d
Small
Busi�ess
Tech��l�gy
Tra�sfer
(STTR)
pr�grams
15 U.S.C. §
638
The SBIR pr�gram is i�te�ded t� stre�gthe� the r�le �f
i���vative small busi�ess c��cer�s i� federally fu�ded
research �r research a�d devel�pme�t (R/R&D). A�y
federal age�cy with a� extramural budget f�r R/R&D i�
excess �f $100 milli�� must participate i� the SBIR
pr�gram a�d reserve a mi�imum perce�tage �f its R/R&D
budgets f�r small busi�ess R/R&D c��tracts. The STTR
pr�gram expa�ds public- a�d private-sect�r part�erships t�
i�clude j�i�t ve�ture �pp�rtu�ities f�r small busi�esses
a�d ���pr�nt research i�stituti��s. I� particular, the STTR
pr�gram pr�vides n�a�ci�g t� bridge the gap betwee�
basic R&D a�d c�mmercializati�� �f resulti�g i���vati��s.
Acc�rdi�g t� a 2019 DOD-fu�ded rep�rt,
the SBIR/STTR c��tracts i�itiated
betwee� 1995 a�d 2015 ge�erated:
$121 billi�� i� t�tal sales �f �ew
pr�ducts a�d services; $28 billi�� i�
sales �f �ew pr�ducts t� the U.S.
military; $347 billi�� i� t�tal ec���mic
impact �ati��wide; a�d 1,508,295 U.S.
j�bs with a� average c�mpe�sati�� �f
$73,461.
Rapid
I���vati��
Fu�d (RIF)
Pub. L. N�.
116-92 §
878
The RIF pr�gram was established by the Nati��al Defe�se
Auth�rizati�� Act �f FY 11 as a c�mpetitive, merit-based
pr�gram desig�ed t� accelerate the neldi�g �f i���vative
tech��l�gies fr�m SBIR/STTR, defe�se lab�rat�ries, a�d
�ther s�urces i�t� military systems.
C��gress appr�priated $250 milli�� t�
RIF i� FY 19 fu�di�g. FY 19 pr�gram
highlights i�clude: $120 milli�� pr�jects
selected by m�der�izati�� assista�t
direct�rs; $120 milli�� missi�� pri�rity
pr�jects selected by military services
a�d DOD age�cies; a�d a t�tal �f 94
a�ticipated awards w�rth $2.5 milli��
each.
Ma�Tech
10 U.S.C. §
2521
The DOD Ma�ufacturi�g Tech��l�gy (Ma�Tech) pr�gram is
desig�ed t� a�ticipate a�d cl�se gaps i� d�mestic
ma�ufacturi�g capabilities thr�ugh the “devel�pme�t a�d
applicati�� �f adva�ced ma�ufacturi�g tech��l�gies a�d
pr�cesses that will reduce the acquisiti�� a�d
supp�rtability c�sts �f defe�se weap�� systems a�d
reduce ma�ufacturi�g a�d repair cycle times acr�ss the
life cycles �f such systems.”
I� FY 19, Ma�Tech pr�jects c�vered
i�frared se�s�rs, hypers��ic aer�shell
c�ati�gs, high-yield f�cal pla�e arrays,
OL�D micr�displays, micr�circuit
emulati��, a�d l��g-ra�ge discrimi�ati��
radar.
Nati��al
Defe�se
St�ckpile
Tra�sacti��
Fu�d
Strategic
a�d Critical
Materials
St�ck Pili�g
Act
The Strategic a�d Critical Materials St�ck Pili�g Act �f
1939 pr�vides f�r the pr�cureme�t, recycli�g, a�d upgrade
�f strategic a�d critical materials by the Nati��al Defe�se
St�ckpile (NDS) pr�gram. The DOD admi�isters this
pr�gram via a rev�lvi�g fu�d called the NDS Tra�sacti��
Fu�d, which is pr�jected t� be exhausted by FY 25.
Betwee� FY 03 a�d FY 18, the NDS
Tra�sacti�� Fu�d made the f�ll�wi�g
distributi��s: NDS acquisiti��s, s�urce
qualincati��s, R&D ($471.3 milli��);
���defe�se acc�u�ts ($998.6 milli��);
�ther defe�se acc�u�ts ($2.702 billi��);
a�d �et cash o�w ($3.283 billi��).
Program
Legal
authority
Objective Actions
Table 9 (continued)
S�urce: Office �f I�dustrial P�licy, Industrial Capabilities: Annual Report to Congress, Fiscal Year 2018 (Washi�gt��: Departme�t �f Defe�se, May 13, 2019).
U.S. domestic laws intended to support defense industrial base
Table 9
Defe�se
Pri�rities
a�d
All�cati��s
System
(DPAS)
Title I �f the
Defe�se
Pr�ducti��
Act �f 1950
(DPA)
The purp�se �f the DPA is t� assure the timely availability
�f i�dustrial res�urces t� meet curre�t �ati��al defe�se
a�d emerge�cy prepared�ess pr�gram requireme�ts a�d
t� pr�vide a� �perati�g system t� supp�rt rapid i�dustrial
resp��se i� day-t�-day �perati��s a�d �ati��al
emerge�cies. The DPA auth�rized the preside�t t� require
prefere�tial treatme�t �f �ati��al defe�se pr�grams. DPAS
establishes pr�cedures f�r placeme�t �f pri�rity rati�gs ��
c��tracts, den�es the i�dustry’s resp��sibilities u�der
rated �rders, a�d sets f�rth c�mplia�ce pr�cedures.
As �f nscal year (FY) 2019, there were
13 “DX” pr�grams, which have the
“highest �ati��al defe�se urge�cy.”
DPA Title III
Title III �f
the DPA
The DPA Title III pr�gram pr�vides the preside�t, thr�ugh
the Departme�t �f Defe�se (DOD), br�ad auth�rity t�
e�sure timely availability �f d�mestic i�dustrial res�urces
esse�tial f�r the executi�� �f the Nati��al Security
Strategy �f the U�ited States thr�ugh the use �f tail�red
ec���mic i�ce�tives.
At e�d �f FY 19, the DPA Title III
p�rtf�li� c��sisted �f 37 pr�jects
t�tali�g m�re tha� $1 billi�� i�
g�ver�me�t a�d i�dustry fu�di�g t�
stre�gthe� the d�mestic i�dustrial base.
The
C�mmittee
�� F�reig�
I�vestme�t
i� the
U�ited
States
(CFIUS)
Secti�� 721
�f the DPA
CFIUS is a� i�terage�cy c�mmittee that reviews certai�
f�reig� acquisiti��s, mergers, �r take�vers �f U.S.
busi�esses t� determi�e the effect �f a tra�sacti�� �� the
�ati��al security �f the U�ited States. The c�mmittee is
chaired by the secretary �f the Treasury Departme�t a�d
i�cludes �i�e v�ti�g members, i�cludi�g the DOD (thr�ugh
its Ofnce �f I�dustrial P�licy).
CFIUS reviewed 231 “c�vered
tra�sacti��s” i� 2019.
Ofnce �f
Small
Busi�ess
Pr�grams
(OSBP)
Secti�� 831
�f the
Nati��al
Defe�se
Auth�rizati��
Act �f FY 91
The OSBP maximizes prime a�d subc��tracti�g
�pp�rtu�ities f�r small busi�esses t� resp��d t� DOD
“warnghter requireme�ts.” The pr�gram’s g�al is t�
c��tribute t� a� “i���vative, c�st effective, a�d agile
i�dustrial base, t� directly supp�rt the Nati��al Defe�se
Strategy a�d a r�bust ec���my.”
I� FY 19, the OSBP c��ducted �umer�us
trai�i�g sessi��s f�r small busi�esses
acr�ss the c�u�try.
I�dustrial
Base Fu�d
10 U.S.C. §
2508
The I�dustrial Base A�alysis a�d Sustai�me�t (IBAS)
pr�gram seeks t� “create a m�der� I�dustrial Base that
f�rtines traditi��al a�d f�rges emergi�g sect�rs t�
resp��d at will t� Nati��al Security Requireme�ts.” U�der
the IBAS, DOD makes direct i�vestme�ts “t� impr�ve
i�dustrial base resilie�ce t� impr�ve f�rce readi�ess.” The
IBAS �fnce directs i�vestme�t by ide�tifyi�g strategy/f�cus
areas, �btai�i�g res�urces, a�d �verseei�g the executi��
�f pr�jects, “aimi�g t� ameli�rate i�dustrial base a�d
ma�ufacturi�g issues a�d stre�gthe� the defe�se
i�dustrial base.” This i�cludes eff�rts thr�ugh C�r�erst��e
Other Tra�sacti�� Auth�rity, which is a g�ver�me�t-ru�,
i�tegrated c��tract vehicle that carries �ut pr�t�type
pr�jects, capabilities, a�d capacities i� supp�rt �f defe�se
i�dustrial base requireme�ts acr�ss 18 sect�rs.
I� FY 19, IBAS made i�vestme�ts i� the
f�ll�wi�g areas: huma� capital (s�lid
r�cket m�t�r i�itiative a�d w�rkf�rce
skills); i�frastructure (�aval pr�pulsi��
f�u�dry, alumi�um f�u�dry, tu�gste�,
a�d electr��ic beam weldi�g); s�urce
mitigati�� (micr�electr��ics a�d
materials i�cludi�g b�r�� carbide,
expl�sive i�itiat�rs, carb�� nber, a�d
critical e�ergetics [buta�etri�l]); a�d
c��strai�ed, fragile, a�d emergi�g
markets (directed e�ergy supply chai�
assura�ce i�itiative, radar aff�rdability
a�d resilie�cy i�itiative, small u�ma��ed
aircraft system, �ptical ceramics, a�d
carb�� �a��tube).
Small
Busi�ess
I���vati��
Research
(SBIR) a�d
Small
Busi�ess
Tech��l�gy
Tra�sfer
(STTR)
pr�grams
15 U.S.C. §
638
The SBIR pr�gram is i�te�ded t� stre�gthe� the r�le �f
i���vative small busi�ess c��cer�s i� federally fu�ded
research �r research a�d devel�pme�t (R/R&D). A�y
federal age�cy with a� extramural budget f�r R/R&D i�
excess �f $100 milli�� must participate i� the SBIR
pr�gram a�d reserve a mi�imum perce�tage �f its R/R&D
budgets f�r small busi�ess R/R&D c��tracts. The STTR
pr�gram expa�ds public- a�d private-sect�r part�erships t�
i�clude j�i�t ve�ture �pp�rtu�ities f�r small busi�esses
a�d ���pr�nt research i�stituti��s. I� particular, the STTR
pr�gram pr�vides n�a�ci�g t� bridge the gap betwee�
basic R&D a�d c�mmercializati�� �f resulti�g i���vati��s.
Acc�rdi�g t� a 2019 DOD-fu�ded rep�rt,
the SBIR/STTR c��tracts i�itiated
betwee� 1995 a�d 2015 ge�erated:
$121 billi�� i� t�tal sales �f �ew
pr�ducts a�d services; $28 billi�� i�
sales �f �ew pr�ducts t� the U.S.
military; $347 billi�� i� t�tal ec���mic
impact �ati��wide; a�d 1,508,295 U.S.
j�bs with a� average c�mpe�sati�� �f
$73,461.
Rapid
I���vati��
Fu�d (RIF)
Pub. L. N�.
116-92 §
878
The RIF pr�gram was established by the Nati��al Defe�se
Auth�rizati�� Act �f FY 11 as a c�mpetitive, merit-based
pr�gram desig�ed t� accelerate the neldi�g �f i���vative
tech��l�gies fr�m SBIR/STTR, defe�se lab�rat�ries, a�d
�ther s�urces i�t� military systems.
C��gress appr�priated $250 milli�� t�
RIF i� FY 19 fu�di�g. FY 19 pr�gram
highlights i�clude: $120 milli�� pr�jects
selected by m�der�izati�� assista�t
direct�rs; $120 milli�� missi�� pri�rity
pr�jects selected by military services
a�d DOD age�cies; a�d a t�tal �f 94
a�ticipated awards w�rth $2.5 milli��
each.
Ma�Tech
10 U.S.C. §
2521
The DOD Ma�ufacturi�g Tech��l�gy (Ma�Tech) pr�gram is
desig�ed t� a�ticipate a�d cl�se gaps i� d�mestic
ma�ufacturi�g capabilities thr�ugh the “devel�pme�t a�d
applicati�� �f adva�ced ma�ufacturi�g tech��l�gies a�d
pr�cesses that will reduce the acquisiti�� a�d
supp�rtability c�sts �f defe�se weap�� systems a�d
reduce ma�ufacturi�g a�d repair cycle times acr�ss the
life cycles �f such systems.”
I� FY 19, Ma�Tech pr�jects c�vered
i�frared se�s�rs, hypers��ic aer�shell
c�ati�gs, high-yield f�cal pla�e arrays,
OL�D micr�displays, micr�circuit
emulati��, a�d l��g-ra�ge discrimi�ati��
radar.
Nati��al
Defe�se
St�ckpile
Tra�sacti��
Fu�d
Strategic
a�d Critical
Materials
St�ck Pili�g
Act
The Strategic a�d Critical Materials St�ck Pili�g Act �f
1939 pr�vides f�r the pr�cureme�t, recycli�g, a�d upgrade
�f strategic a�d critical materials by the Nati��al Defe�se
St�ckpile (NDS) pr�gram. The DOD admi�isters this
pr�gram via a rev�lvi�g fu�d called the NDS Tra�sacti��
Fu�d, which is pr�jected t� be exhausted by FY 25.
Betwee� FY 03 a�d FY 18, the NDS
Tra�sacti�� Fu�d made the f�ll�wi�g
distributi��s: NDS acquisiti��s, s�urce
qualincati��s, R&D ($471.3 milli��);
���defe�se acc�u�ts ($998.6 milli��);
�ther defe�se acc�u�ts ($2.702 billi��);
a�d �et cash o�w ($3.283 billi��).
Program
Legal
authority
Objective Actions

47
Requirements of the Consolidated Appropriations Act, 2014, and the Water Resources Reform and Development Act of 2014; and the American Recovery and Reinvestment Act of 2009. These laws restrict specific types of federal government procure-ment, especially for the construction of public build-ings, aviation projects, highways, railroads and rail cars, and buses;206 specific sectors, including supplies, construction materials, information technology, and defense;207 and the procurement of specific materials, especially iron and steel.208 Finally, defense procure-ment is further restricted by the Berry Amendment (10 U.S.C. § 2533a), which applies to food, clothing, fabrics, fibers, yarns, other made-up textiles, and hand or measuring tools; and the Byrnes-Tollefson Amendment (10 U.S.C. § 8679), which restricts U.S.
government contracting for vessel construction or re-pair at foreign shipyards.209
Other U.S. laws intended to protect American manufac-turers from allegedly unfair or injurious competition include Section 337 (19 U.S.C. § 1337), which addresses antitrust and intellectual property rights claims, including allegations of patent infringement and trademark infringement by imported goods; Section 301 of the Trade Act of 1974, which permits the Office of the U.S. Trade Representative to respond to unfair trade practices and in certain cases impose unilateral remedies (e.g., tariffs) against imports from the offending country; and both the Trading with the Enemy Act of 1917 and International Emergency Economic Powers Act of 1977, which allow the president to regulate all forms of international commerce and to freeze assets in times of war or national emergency.
48
NOTES1. Adam Thierer, “On Defining ‘Industrial Policy,’” Technology Lib-eration Front (blog), September 3, 2020.
2. Matt Winesett, “Would Alexander Hamilton Support Tariffs Today?,” AEIdeas (blog), American Enterprise Institute, April 4, 2018.
3. Marco Rubio, “We Need a More Resilient American Economy,” opinion, New York Times, April 20, 2020.
4. Adam Smith, An Inquiry into the Nature and Causes of the Wealth of Nations, vol. 1, ed. Edwin Cannan (London: Methuen, 1904).
5. Milton Friedman and Rose D. Friedman, “The Case for Free Trade,” Hoover Digest 1997, no. 4 (October 30, 1997).
6. For example, see Jon Murphy, “Does National Security Justify Tariffs?,” Library of Economics and Liberty, May 7, 2018.
7. Smith, Wealth of Nations, vol. 2.
8. Friedman and Friedman, “Case for Free Trade.”
9. Murphy, “Does National Security Justify Tariffs?”
10. Robert Z. Lawrence, “Recent US Manufacturing Employ-ment: The Exception That Proves the Rule,” Peterson Institute for International Economics Working Paper no. 17-12, November 2017, table 1.
11. Robert Z. Lawrence, “Trade Surplus or Deficit? Neither Mat-ters for Changes in Manufacturing Employment Shares,” Peter-son Institute for International Economics Working Paper no. 20-15, September 2020.
12. Bureau of Labor Statistics, “Employment Projections: 2019–2029 Summary,” Department of Labor news release no. USDL-20-1646, September 1, 2020.
13. Robert Z. Lawrence and Lawrence Edwards, “US Employment Deindustrialization: Insights from History and the International Experience,” Peterson Institute for International Economics Pol-icy Brief no. PB13-27, October 2013.
14. “The Conference Board International Labor Compari-sons,” Conference Board, https://www.conference-board.org/ilcprogram/.
15. Ryan Bourne, “Do Oren Cass’s Justifications for Industrial Policy Stack Up?,” Cato Institute, August 15, 2019.
16. “GDP by Industry,” Bureau of Economic Analysis, https://www.bea.gov/data/gdp/gdp-industry; and Mack Ott, “The Grow-ing Share of Services in the U.S. Economy—Degeneration or Evo-lution?,” Federal Reserve Bank of St. Louis Review 69, no. 6 (June/July 1987): 5–22.
17. As the St. Louis Federal Reserve noted in 1987 (citing econom-ic historians from the 1950s), for example, “there is substantive evidence that the postwar rise in the share of U.S. output in ser-vices reflects a relative shift in final demand for services and away from commodities.” Ott, “Services in the U.S. Economy,” p. 12.
18. Lawrence and Edwards, “US Employment Deindustrializa-tion,” p. 6.
19. Lawrence and Edwards, “US Employment Deindustrializa-tion”; and Lawrence, “Recent US Manufacturing Employment,” p. 3, fig. 2, and p. 12, fig. 6.
20. Francisco J. Buera and Joseph P. Kaboski, “Scale and the Ori-gins of Structural Change,” Journal of Economic Theory 147, no. 2 (March 2012): 692, fig. 6; and Lawrence, “Trade Surplus or Defi-cit,” p. 14.
21. Justin Lahart, “Why Factories Are So Strong in a Pandemic,” Wall Street Journal, September 1, 2020.
22. Mark J. Perry, “Manufacturing’s Decline Share of GDP Is In-evitable, Global, and Something to Celebrate,” AEIdeas (blog), American Enterprise Institute, March 22, 2012; and Timothy Taylor, “Global Manufacturing: A McKinsey View,” Conversable Economist (blog), November 30, 2012.
23. Lawrence and Edwards, “US Employment Deindustrializa-tion,” p. 11, table 3.
24. Buera and Kaboski, “Scale and the Origins of Structural Change.”
25. “The national security of the United States requires the tech-nological and intellectual capabilities of domestic and foreign companies, academia, and dual-use technology providers collabo-rating at the forefront of future generation technologies, along with the sub-tiers and components suppliers that support them.” Office of Industrial Policy, Industrial Capabilities: Annual Report to

49
Congress, Fiscal Year 2018 (Washington: Department of Defense, May 13, 2019), p. 1.
26. Daniel J. Ikenson, “Thriving in a Global Economy: The Truth about U.S. Manufacturing and Trade,” Cato Institute Trade Poli-cy Analysis no. 35 (August 28, 2007).
27. World Trade Organization, Trade Profiles 2019 (Geneva, Switzerland: World Trade Organization, 2019), p. 3.
28. “Inward FDI Stocks by Industry,” OECD Data, Organisation for Economic Co-operation and Development, https://data.oecd.org/fdi/inward-fdi-stocks-by-industry.htm.
29. Office of Industrial Policy, Industrial Capabilities: Fiscal Year 2018, p. 17; and Office of Industrial Policy, Fiscal Year 2019 Indus-trial Capabilities Report to Congress (Washington: Department of Defense, June 23, 2020), pp. 34–35, 37.
30. Scott Lincicome, “Testing the ‘China Shock’: Was Normalizing Trade with China a Mistake?,” Cato Institute Pol-icy Analysis no. 895, July 8, 2020; Susan Houseman, “Is Manu-facturing in Decline?,” W. E. Upjohn Institute for Employment Research, October 2016; and Neil Irwin, “The Most Important Least-Noticed Economic Event of the Decade,” New York Times, September 29, 2018.
31. “International Comparisons of Manufacturing Productiv-ity and Unit Labor Cost—Data, The Conference Board, updated January 6, 2020, https://www.conference-board.org/ilcprogram/index.cfm?id=30139.
32. Lawrence, “Recent US Manufacturing Employment.” Indeed, increasing U.S. manufacturing employment since 2010 is likely the result of slow productivity growth in the sector since the Great Recession.
33. Kane Farabaugh, “Sedans Take Backseat to SUVs, Trucks for American Buyers,” Voice of America, February 14, 2020; Tim Mullaney, “It’s Small Cars, Not Auto Jobs, Making the Big U.S. Move to Mexico,” CNBC, October 19, 2016; Bill Vlasic, “Ford Plants Go to Mexico, but U.S. Jobs Stay Around,” New York Times, October 18, 2016; and Dan Ikenson, “Ending the ‘Chicken War’: The Case for Abolishing the 25 Percent Truck Tariff,” Cato Insti-tute Trade Briefing Paper no. 17, June 18, 2003.
34. Scott Lincicome, “‘Seemingly out of Nowhere,’” Cato at Lib-erty (blog), Cato Institute, August 7, 2020.
35. For example, see Susan N. Houseman, “Is Automation Re-ally to Blame for Lost Manufacturing Jobs?,” Foreign Affairs, September 7, 2018.
36. In his 2019 book, Andrew McAfee provides data from the U.S. Geological Survey to show declining U.S. consumption of met-als (aluminum, nickel, copper, steel, and gold), fertilizer, wood products, and fuels since 2000—following decades of increases and even amid substantial gains in real GDP. Organisation for Economic Co-operation and Development data on “material consumption” (i.e., the actual amount of materials [in terms of weight] used in an economy) confirm these observations for both the United States and other developed countries. Andrew McAfee, More from Less: The Surprising Story of How We Learned to Prosper Using Fewer Resources—and What Happens Next (New York: Scribner, October 8, 2019); and “Material Consumption,” OECD Data, Organisation for Economic Co-operation and Development, 2020, https://data.oecd.org/materials/material-consumption.htm.
37. “GDP by Industry,” Bureau of Economic Analysis, https://apps.bea.gov/iTable/index_industry_gdpIndy.cfm.
38. Semiconductor Industry Association, 2020 SIA Factbook (Washington: Semiconductor Industry Association, 2020); and Semiconductor Industry Association, “CHIPS for America Act Would Strengthen U.S. Semiconductor Manufacturing, Innovation,” Semiconductor Industry Association, June 10, 2020.
39. “UN Comtrade Database,” Trade Statistics, Statistics Divi-sion, Department of Economic and Social Affairs, United Na-tions, https://comtrade.un.org/data/. The goods at issue are cat-egorized under tariff codes 8542 ($40.0 billion) and 8541 ($6.7 billion) of the Harmonized System.
40. Semiconductor Industry Association, 2020 State of the U.S. Semiconductor Industry (Washington: Semiconductor Industry As-sociation, June 2020).
41. “Research and Development: U.S. Trends and International Comparisons,” Science & Engineering Indicators, National Science Foundation, https://ncses.nsf.gov/pubs/nsb20203/u-s-business-r-d.
42. “Direct Investment & Multinational Enterprises (MNEs),” Bureau of Economic Analysis, https://apps.bea.gov/iTable/index_MNC.cfm.

50
43. For example, see “VanEck Vectors Semiconductor ETF (SMH),” Yahoo Finance, https://finance.yahoo.com/chart/SMH.
44. Peter, “Production of Snapdragon 875 Has Started on TSMC’s 5nm Node,” GSMArena, June 22, 2020; and Bill Maurer, “Intel Beats Big, but Delays 7nm,” Seeking Alpha, July 23, 2020, https://seekingalpha.com/article/4360481-intel-beats-big-delays-7nm.
45. Scott Lincicome, “Determining America’s ‘Dependence’ on China for Essential Medical Goods,” Cato at Liberty (blog), Cato Institute, July 13, 2020.
46. Fernando Leibovici, Ana Maria Santacreu, and Makenzie Peake, “How Much Does the U.S. Rely on Other Countries for Essential Medical Equipment?,” On the Economy Blog, Federal Re-serve Bank of St. Louis, April 8, 2020.
47. Scott Lincicome, “New @wto Report on trade in medical goods shows the USA to be a top global producer/exporter (yes *exporter*) of medical goods: wto.org/english/news_e...,” Twitter, April 3, 2020, 2:03 pm, https://twitter.com/scottlincicome/status/1246136368595681281.
48. “NAICS 339113—Surgical Appliance and Supplies Manu-facturing,” Industrius CFO, https://secure.industriuscfo.com/industry-metrics/naics/339113-surgical-appliance-and-supplies-manufacturing.
49. For example, see Rachael S. Davis, “COVID-19: The Textile Industry Responds to PPE Shortage,” Textile World, May 27, 2020.
50. Scott Lincicome, “What If Politicians Are the Biggest Medical Supply Chain Risk?,” Cato at Liberty (blog), Cato Insti-tute, September 9, 2020.
51. World Trade Organization, “Trade in Medical Goods in the Context of Tackling COVID-19,” April 3, 2020.
52. Scott Lincicome, “On ‘Supply-Chain Repatriation,’ It’s Buyer (And Nation) Beware,” National Review, April 28, 2020.
53. Janet Woodcock, “Safeguarding Pharmaceutical Supply Chains in a Global Economy,” testimony before the House Committee on Energy and Commerce, Subcommittee on Health, Food and Drug Administration, October 30, 2019; and Lincicome, “What If Politicians Are the Biggest Medical Supply Chain Risk?”
54. Qualifying countries include Australia; Austria; Belgium;
Canada; Czech Republic; Denmark; Egypt; Estonia; Finland; France; Germany; Greece; Israel; Italy; Japan; Latvia; Luxembourg; Netherlands; Norway; Poland; Portugal; Slovenia; Spain; Sweden; Switzerland; Turkey; and the United Kingdom. “Reciprocal Defense Procurement and Acquisition Policy Memoranda of Understanding,” International Contract-ing, Contract Policy, Defense Pricing and Contracting, https://www.acq.osd.mil/dpap/cpic/ic/reciprocal_procurement_memoranda_of_understanding.html.
55. Partner countries include Australia, Canada, Finland, Italy, the Netherlands, Spain, Sweden, and the United Kingdom. “Secu-rity of Supply,” Industrial Policy, Department of Defense, http://www.businessdefense.gov/security-of-supply/.
56. The Commerce Department (or the Department of the Treasury before it) initiated a total of 31 Section 232 investiga-tions between 1962 and 2019 and initiated three more cases in the first half of 2020. Congressional Research Service, “Sec-tion 232 Investigations: Overview and Issues for Congress,” August 24, 2020.
57. Davide Furceri et al., “Macroeconomic Consequences of Tariffs,” International Monetary Fund Working Paper no. 19/9, January 15, 2019.
58. Scott Lincicome, “Doomed to Repeat It: The Long History of America’s Protectionist Failures,” Cato Institute Policy Analysis no. 819, August 22, 2017.
59. Alessandro Barattieri and Matteo Cacciatore, “Self-Harming Trade Policy? Protectionism and Production Networks,” Nation-al Bureau of Economic Research Working Paper no. 27630, July 2020.
60. Lydia Cox and Kadee Russ, “Steel Tariffs and U.S. Jobs Revis-ited,” Econofact, February 6, 2020.
61. Robert C. Feenstra, “Alternative Sources of the Gains from In-ternational Trade: Variety, Creative Destruction, and Markups,” Journal of Economic Perspectives 32, no. 2 (Spring 2018): 25–46.
62. Gary Clyde Hufbauer and Zhiyao (Lucy) Lu, “The Payoff to America from Globalization: A Fresh Look with a Focus on Costs to Workers,” Peterson Institute for International Economics Pol-icy Brief no. 17–16, May 2017.
63. U.S. International Trade Commission, “USITC Releases

51
Report Estimating the Historical Impact of Trade Agreements,” news release no. 16-081, June 29, 2016.
64. For example, a 2018 paper estimated that the annual gains from trade for the U.S. economy range from 2 to 8 percent of gross domestic product (GDP), depending on U.S. demand for foreign factor services—an impressive sum given that the United States is relatively closed (in terms of import consump-tion as a share of GDP) and resource-rich. Arnaud Costinot and Andrés Rodríguez-Clare, “The US Gains from Trade: Valu-ation Using the Demand for Foreign Factor Services,” Nation-al Bureau of Economic Research Working Paper no. 24407, March 2018.
65. Lincicome, “Doomed to Repeat It,” p. 23; and Gary Clyde Hufbauer and Eujin Jung, “Steel Profits Gain, but Steel Users Pay, under Trump’s Protectionism,” Trade and Investment Policy Watch (blog), Peterson Institute for International Economics, December 20, 2018.
66. Office of Technology Evaluation, “The Effect of Imports of Steel on the National Security: An Investigation Conducted Un-der Section 232 of the Trade Expansion Act of 1962, as Amended,” Bureau of Industry and Security, Department of Commerce, January 11, 2018, pp. 45–46.
67. “Monthly Production 2017–2016,” World Steel Associa-tion, https://www.worldsteel.org/steel-by-topic/statistics/steel-statistical-yearbook.html; World Steel Association, Steel Statistical Yearbook 2016 (Brussels: World Steel Association, October 2016); and U.S. Geological Survey, “Mineral Commodity Summary 2017,” Department of the Interior, January 19, 2017, pp. 84–85.
68. The healthy financial position of U.S. steel was summarized in a European Steel Association’s written submission: Karl Tachelet (director of International Affairs, EUROFER), “Re: Section 232 National Security Investigation of Imports of Steel,” email to Brad Botwin (director of industrial studies, Office of Technology Evaluation, Bureau of Industry and Security, U.S. Department of Commerce), May 31, 2017, pp. 21–23, https://www.bis.doc.gov/index.php/232-steel-public-comments/1787-eurofer-written-submission-public-version/file.
69. Office of Technology Evaluation, “The Effect of Imports of Iron Ore and Semi-Finished Steel on the National Security: An Investigation Conducted under Section 232 of the Trade Expan-sion Act of 1962, as Amended,” Bureau of Industry and Security, Department of Commerce, October 2001.
70. Office of Technology Evaluation, “Effect of Imports of Iron Ore and Semi-Finished Steel,” p. 27.
71. Tachelet, “Re: Section 232 National Security Investigation,” p. 28, fig. 2.
72. James N. Mattis, “Response to Steel and Aluminum Policy Recommendations,” Memorandum for the Secretary of Com-merce from the Secretary of Defense, https://www.commerce.gov/sites/default/files/department_of_defense_memo_response_to_steel_and_aluminum_policy_recommendations.pdf.
73. Ana Swanson, “Trump to Impose Sweeping Steel and Alumi-num Tariffs,” New York Times, March 1, 2018.
74. The Trump administration subsequently negotiated quotas with certain countries (Argentina, Brazil, etc.) while excluding Australia entirely.
75. Cox and Russ, “Steel Tariffs and U.S. Jobs Revisited.”
76. Cox and Russ.
77. Chris Isidore, “Why American Steel Stocks Plummeted in the Past Year, Despite Tariffs,” CNN Business, May 21, 2019; and Don Lee, “Trump’s Steel Tariffs Were Supposed to Save the Industry. They Made Things Worse,” Los Angeles Times, October 29, 2019.
78. Proclamation No. 9980, 85 Fed. Reg. 5281 (January 29, 2020).
79. Lee, “Trump’s Steel Tariffs Were Supposed to Save the Indus-try.”
80. “6. Case Examples: Shipping Co.: Maritime Cabotage Com-plicates Logistics and Adds Costs,” Reports, World Economic Forum, https://reports.weforum.org/global-enabling-trade-2013/shipping-co/.
81. Colin Grabow, Inu Manak, and Daniel J. Ikenson, “The Jones Act: A Burden America Can No Longer Bear,” Cato Institute Policy Analysis no. 845, June 28, 2018.
82. Grabow, Manak, and Ikenson, “The Jones Act.”
83. Grabow, Manak, and Ikenson.
84. The other countries are Brazil, Italy, South Korea, Singapore, Spain, Sweden, Switzerland, the United Kingdom, and West

52
Germany. General Accounting Office, “International Trade: Re-vitalizing the U.S. Machine Tool Industry,” GAO NSIAD-90-182, July 1990, https://www.gao.gov/assets/150/149299.pdf.
85. General Accounting Office, “Defense Procurement: DOD Purchases of Foreign-Made Machine Tools,” GAO NSIAD-91-70, February 1991, https://www.gao.gov/assets/160/150236.pdf. Sec-tion 812 of the Senate’s Fiscal Year 2021 National Defense Au-thorization Act would eliminate these procurement restrictions. National Defense Authorization Act for Fiscal Year 2021, S. 4049, 116th Cong. § 812.
86. Lincicome, “Doomed to Repeat It,” p. 15, table 7.
87. Ronald E. Yates, “Keeping Up with Asia,” Chicago Tribune, December 18, 1994.
88. Gary Clyde Hufbauer and Kimberly Ann Elliott, Measuring the Costs of Protection in the United States (New York: Columbia Uni-versity Press, January 1994), pp. 10–12, tables 1.2 and 1.3. A 1991 General Accounting Office report on the Buy American restric-tions found them essentially useless. General Accounting Office, “DOD Purchases of Foreign-Made Machine Tools.”
89. Douglas A. Irwin, “Trade Shocks and Response, 1979–1992,” in Clashing over Commerce: A History of U.S. Trade Policy (Chicago: University of Chicago Press, November 2017), p. 593; and General Accounting Office, “Revitalizing the U.S. Machine Tool Indus-try,” p. 30.
90. General Accounting Office, “Revitalizing the U.S. Machine Tool Industry.”
91. Office of Economics, “The Economic Effects of Significant U.S. Import Restraints,” Investigation No. 332-325, U.S. Inter-national Trade Commission Publication no. 2699, November 1993, p. 23, table 11, https://www.usitc.gov/publications/332/pub_2699.pdf.
92. Donald L. Barlett and James B. Steele, “The ‘New’ American Worker: Manufacturing Industries are Suffering. Laid-Off Em-ployees May Be Finding Work out There, but It’s Often in Lower-Paying Service Jobs,” Philadelphia Inquirer, September 11, 1996.
93. Irwin, “Trade Shocks and Response, 1979–1992,” p. 622.
94. A 1987 U.S. Department of Defense report, for example, ar-gued that dynamic random-access memory (DRAM) were central
to the future of U.S. global technology leadership and that the loss of DRAM capacity would destroy U.S. firms’ ability to compete in other high-tech sectors. Lincicome, “Doomed to Repeat It.”
95. Douglas A. Irwin, “The U.S.-Japan Semiconductor Trade Conflict,” in The Political Economy of Trade Protection, ed. Anne O. Krueger (Chicago: University of Chicago Press, January 1996), pp. 5–14.
96. T. R. Reid, “Semiconductor Agreement Disastrous Excursion into Protectionism,” Washington Post, March 4, 1991; and Kenneth Flamm, “Semiconductor Dependency and Strategic Trade Policy,” Brookings Papers on Economic Activity: Microeconomics 1993, no. 1 (1993).
97. Dorinda G. Dallmeyer, “The United States-Japan Semicon-ductor Accord of 1986: The Shortcomings of High-Tech Protec-tionism,” Maryland Journal of International Law 13, no. 2 (1989): 197.
98. Douglas Irwin, “Trade Politics and the Semiconductor Indus-try,” National Bureau of Economic Research Working Paper no. 4745, May 1994, p. 60; and Claude E. Barfield, High-Tech Protection-ism: The Irrationality of Antidumping Laws (Washington: AEI Press, 2003).
99. Kenneth Flamm, “U.S. Memory Chip Makers in a Fix,” Wash-ington Post, March 1, 1988.
100. Barfield, High-Tech Protectionism, p. 27.
101. Craig R. Parsons, “The Effect of the Semiconductor Trade Agreement on Japanese Firms,” Singapore Economic Review 50, no. 01 (April 2005): 117–29; and Richard Baldwin, “The Impact of the 1986 US-Japan Semiconductor Agreement,” Japan and the World Economy 6, no. 2 (February 1994): 129–52.
102. Dallmeyer, “United States-Japan Semiconductor Accord of 1986,” p. 205; and Federal Interagency Staff Working Group, The Semiconductor Industry (Washington: Government Printing Of-fice, November 16, 1987).
103. Irwin, “Trade Politics and the Semiconductor Industry,” pp. 70–71.
104. Dallmeyer, “United States-Japan Semiconductor Accord of 1986,” p. 197.
105. Craig Parsons, “Did the US-Japan Semiconductor Trade

53
Agreement Have Any Impact?,” Asian Economic Journal 16, no. 1 (March 2002): 37–51.
106. “Back to the 1980s: Donald Trump’s Review of Trade Deficits Is a Blast from the Past,” The Economist, April 6, 2017.
107. Byron Gangnes and Craig R. Parsons, “Have U.S.-Japan Trade Agreements Made a Difference?,” Journal of the Asia Pacific Econo-my 12, no. 4 (April 2004).
108. Flamm, “U.S. Memory Chip Makers in a Fix.”
109. Barfield, High-Tech Protectionism, p. 27.
110. Dallmeyer, “United States-Japan Semiconductor Accord of 1986,” pp. 63–64.
111. Barfield, High-Tech Protectionism, p. 28.
112. Irwin, “Trade Politics and the Semiconductor Industry,” p. 61.
113. Brink Lindsey, “DRAM Scam,” Reason, February 1992.
114. Lindsey, “DRAM Scam.”
115. Lindsey.
116. Douglas A. Irwin and Peter J. Klenow, “Sematech: Purpose and Performance,” Proceedings of the National Academy of Sciences 93, no. 23 (November 12, 1996): 12739–42.
117. Kenneth Flamm and Qifei Wang, “SEMATECH Revis-ited: Assessing Consortium Impacts on Semiconductor Indus-try R&D,” in Securing the Future: Regional and National Programs to Support the Semiconductor Industry, ed. Charles W. Wessner (Washington: National Academies Press, 2003), p. 254, https://www.nap.edu/read/10677/chapter/13.
118. James L. Schoff, “U.S.-Japan Technology Policy Coordina-tion: Balancing Technonationalism with a Globalized World,” Carnegie Endowment for International Peace working paper, June 29, 2020.
119. Scott Lincicome, “We Can Finally Stop Pretending Trump Isn’t a Protectionist,” Cato Institute, August 12, 2020; and Alan Beattie, “Time to Kill the US Trade Deficit Delusion,” Financial Times, September 10, https://www.ft.com/content/fa3a9746-65da-4b32-afde-eb6f858e7c03.
120. Lincicome, “Doomed to Repeat It”; and Daniel J. Ikenson, “Steel Trap: How Subsidies and Protectionism Weaken the U.S. Steel Industry,” Cato Institute Trade Briefing Paper no. 14, March 1, 2002.
121. Colin Grabow, “Candy-Coated Cartel: Time to Kill the U.S. Sugar Program,” Cato Institute Policy Analysis no. 837, April 10, 2018.
122. Jeffrey P. Bialos, “Oil Imports and National Security: The Le-gal and Policy Framework for Ensuring United States Access to Strategic Resources,” University of Pennsylvania Journal of Interna-tional Law 11, no. 2 (Spring 1989): 244–5.
123. Lincicome, “Doomed to Repeat It”; and Barfield, High-Tech Protectionism.
124. “Although the program adds handsomely to large producers’ incomes, its appeal has not been strong enough to prevent a dra-matic decline in domestic wool production.” Department of Ag-riculture, “USDA01: End the Wool and Mohair Subsidy,” https://govinfo.library.unt.edu/npr/library/reports/ag01.html.
125. Lincicome, “Doomed to Repeat It,” p. 17.
126. Barfield, High-Tech Protectionism, p. 14.
127. I. M. Destler, “America’s Uneasy History with Free Trade,” Harvard Business Review, April 18, 2016, https://hbr.org/2016/04/americas-uneasy-history-with-free-trade.
128. Erich Weede, “The Diffusion of Prosperity and Peace by Globalization,” Independent Review 9, no. 2 (2004): 165–86; Jon Murphy, “In Defense of Liberal Peace,” George Mason Univer-sity working paper, revised August 3, 2020; Saumitra Jha, “Trading for Peace,” Economic Policy 33, no. 95 (August 2018): 485–526; Saba L. Mollaian, “Does Trade Equal Peace? The Role of the WTO in International Peace,” Legal Issues of Economic Integration 46, no. 1 (2019): 77–99; Shabir Ahmad Khan and Zahid Ali Khan Marwat, “CPEC: Role in Regional Integration and Peace,” A Research Jour-nal of South Asian Studies 31, no. 2 (July–December 2016), http://pu.edu.pk/images/journal/csas/PDF/8_31_2_16.pdf; and Ghaidaa Hetou, “Middle Powers’ Crucial Peace Dividend: Networking Development,” Journal of Peacebuilding & Development 13, no. 1 (April 1, 2018).
129. John R. Oneal, Bruce Russett, and Michael L. Berbaum, “Causes of Peace: Democracy, Interdependence, and
54
International Organizations, 1885–1992,” International Studies Quarterly 47, no. 3 (September 2003): 371–93.
130. Solomon W. Polachek and Carlos Seiglie, “Trade, Peace and Democracy: An Analysis of Dyadic Dispute,” Institute for the Study of Labor Discussion Paper no. 2170, June 2006.
131. Jong-Wha Lee and Ju Hyun Pyun, “Does Trade Integration Contribute to Peace?,” Review of Development Economics 20, no. 1 (2016): 327–44.
132. Patrick J. McDonald, “Peace through Trade or Free Trade?,” Journal of Conflict Resolution 48, no. 4 (2004).
133. Matthew O. Jackson and Stephen Nei, “Networks of Mili-tary Alliances, Wars, and International Trade,” Proceedings of the National Academy of Sciences 112, no. 50 (December 15, 2015): 15277–84.
134. Benny Kleinman, Ernest Liu, and Stephen J. Redding, “In-ternational Friends and Enemies,” National Bureau of Economic Research Working Paper no. 27587, July 2020.
135. Timothy M. Peterson and Cameron G. Thies, “Beyond Ricardo: The Link between Intra-Industry Trade and Peace,” British Journal of Political Science 42, no. 4 (October 2012).
136. Pavel Yakovlev, “Does Trade Promote Peace?,” Libertarianism.org, April 18, 2012.
137. Lincicome, “Testing the ‘China Shock.’”
138. Galina Hale et al., “How Much Do We Spend on Imports?,” FRBSF Economic Letter 2019-01, Federal Reserve Bank of San Francisco, January 7, 2019, https://www.frbsf.org/economic-research/publications/economic-letter/2019/january/how-much-do-we-spend-on-imports/.
139. “Trade (% of GDP),” Data, World Bank, https://data.worldbank.org/indicator/NE.TRD.GNFS.ZS?end=2019&most_recent_value_desc=false&start=2015.
140. “Imports of Goods and Services (% of GDP),” Data, World Bank, https://data.worldbank.org/indicator/NE.IMP.GNFS.ZS?most_recent_value_desc=false.
141. For example, a June 2020 analysis from Jean Imbs and Laurent Pauwels of 43 different countries’ openness (and thus
exposure to foreign trade “shocks”) finds the United States to be one of the least “open” economies in the world and the least among five of the largest global economies (Japan, Germany, China, and India being the others)—a result that is similar to the country ranking obtained by other measures of trade openness. Jean Imbs and Laurent Pauwels, “A New Measure of Openness,” Vox, Centre for Economic Policy Research, June 26, 2020.
142. Richard Baldwin and Rebecca Freeman, “Supply Chain Con-tagion Waves: Thinking Ahead on Manufacturing ‘Contagion and Reinfection’ from the COVID Concussion,” Vox, Centre for Eco-nomic Policy Research, April 1, 2020.
143. Francesco Caselli et al., “Diversification through Trade,” Na-tional Bureau of Economic Research Working Paper no. 21498, August 2015.
144. Aida Caldera-Sánchez et al., “Strengthening Economic Resilience: Insights from the Pos-1970 Record of Severe Re-cessions and Financial Crises,” Organisation for Economic Co-operation and Development Economic Policy Paper no. 20, December 2016.
145. Aida Caldera-Sánchez et al., “Economic Resilience: Trade-Offs between Growth and Economic Fragility,” Vox, Centre for Economic Policy Research, March 28, 2017.
146. Barthélémy Bonadio et al., “Global Supply Chains in the Pandemic,” National Bureau of Economic Research Work-ing Paper no. 27224, May 2020; and for example, see “Open-ness to Trade,” World Integrated Trade Solution, http://wits.worldbank.org/visualization/openness-to-trade-dashboard.html.
147. Ryan Bourne, Economics in One Virus: An Introduction to Economic Reasoning through COVID-19 (Washington: Cato Insti-tute, 2021).
148. “Quarterly National Accounts: G20—Quarterly Growth Rates of GDP in Volume,” Organisation for Economic Co-operation and Development Statistics, https://stats.oecd.org/index.aspx?queryid=33940#.
149. Tom Fairless, “Germany Expects V-Shaped Economic Re-bound from Coronavirus,” Wall Street Journal, September 1, 2020.
150. Johanna Jeansson, “International Value Chains Are Sweden’s
55
Achilles Heel,” Bloomberg, August 28, 2020.
151. Bourne, Economics in One Virus.
152. Jesús Fernández-Villaverde and Charles I. Jones, “Macro-economic Outcomes and Covid-19: A Progress Report,” Na-tional Bureau of Economic Research Working Paper no. 28004, October 2020.
153. Lino Briguglio and Melchior Vella, “Trade Openness and Vola-tility,” Occasional Paper no. 04/2016, Islands and Small States In-stitute, University of Malta, April 2016.
154. Maya Jolles, Eric Meyermans, and Bořek Vašíček, “Determi-nants of Macroeconomic Resilience in the Euro Area: An Empiri-cal Assessment of Policy Levers,” World Bank.
155. Amni Rusli, “Supply Chain Resilience,” Eight Ate Eight (blog), August 3, 2020.
156. Office of U.S. Sen. Mike Lee (R-UT), “Sen. Lee Reintroduc-es Global Trade Accountability Act,” press release, May 2, 2019, https://www.lee.senate.gov/public/index.cfm/2019/5/sen-lee-reintroduces-global-trade-accountability-act.
157. For example, see Daniel Ikenson, “Economic Self-Flagellation: How U.S. Antidumping Policy Subverts the National Export Initiative,” Cato Institute Trade Policy Analy-sis no. 46, May 31, 2011.
158. For example, see Scott Lincicome, “Countervailing Calamity: How to Stop the Global Subsidies Race,” Cato In-stitute Policy Analysis no. 710, October 9, 2012; and Daniel J. Ikenson, “Tariffs by Fiat: The Widening Chasm between U.S. Antidumping Policy and the Rule of Law,” Cato Institute Policy Analysis no. 896, July 16, 2020.
159. 50 U.S.C. § 98h–4.
160. National Defense Authorization Act for Fiscal Year 2021, S. 4049, 116th Cong. § 803.
161. National Defense Authorization Act for Fiscal Year 2021, S. 4049, 116th Cong.
162. Grabow, Manak, and Ikenson, “The Jones Act.”
163. For example, see Jacques S. Gansler and William Lucyshyn,
“Rethinking Import and Export Controls for Defense-Related Goods,” University of Maryland Center for Public Policy and Pri-vate Enterprise, revised May 2013.
164. For example, see Alex Tabarrok, “Sicken Thy Neighbor Trade Policy,” Marginal Revolution (blog), March 29, 2020.
165. For example, see General Agreement on Tariffs and Trade (GATT), art. XXI, July 1986; and GATT, art. XX(j); similar provi-sions are found in all U.S. free trade agreements.
166. For example, see Mona Pinchis-Paulsen, “Trade Multilater-alism and U.S. National Security: The Making of the GATT Se-curity Exceptions,” Michigan Journal of International Law 41, no. 1 (2020): 109–93.
167. Scott Lincicome, “Ignoring the Recent (and Ignominious) History of ‘Buy American,’” Cato at Liberty (blog), Cato Institute, July 10, 2020.
168. Harry S. Truman, “Statement by the President upon Signing the Strategic and Critical Materials Stockpiling Act,” American Presidency Project, July 23, 1946.
169. Scott Lincicome, “We’ll Do Anything for American Innovation, but We Won’t Do That,” Cato at Liberty (blog), Cato Institute, July 20, 2020.
170. Scott Lincicome (@scottlincicome), “Please note that one of the ITC’s big impediments to Chinese semiconductor domi-nance is China’s lack of human capital - something the Trump admin’s recent immigration plans are actively trying to change. Sigh.,” Twitter, July 8, 2020, 3:21 p.m., https://twitter.com/scottlincicome/status/1280945234189451264.
171. Josh Mitchell, “How Apprenticeship, Reimagined, Vaults Graduates into Middle Class,” Wall Street Journal, October 19, 2020.
172. For example, see Gail Heriot, “Apprenticeships: Useful Alternative, Tough to Implement,” Cato Institute Policy Analy-sis no. 805, November 17, 2016.
173. Numerous OECD and other countries—such as Canada, Sweden, and the United Kingdom—also imposed lower effective corporate tax rates than the United States in 2019. Chris Edwards, “U.S. Corporate Tax Still Too High,” Cato at Liberty (blog), Cato Institute, January 11, 2019; and Scott R. Baker, Stephen Teng Sun,
56
and Constantine Yannelis, “Corporate Taxes and Retail Prices,” Cato Institute Research Briefs in Economic Policy no. 224, July 22, 2020.
174. “Local property taxes are also wealth taxes. They are paid by owners of residential, commercial, and industrial real property. U.S. property taxes are relatively high. As a share of gross domestic product (GDP), we have the fourth-highest property tax revenues among 36 major industrial countries.” Chris Edwards, “Taxing Wealth and Capital Income,” Cato Institute Tax and Budget Bul-letin no. 85, August 1, 2019.
175. Ryan Bourne, “Why It’s OK That the Republican Tax Cuts Will First Finance Share Buybacks,” Cato Institute, December 6, 2017; and Erica York, “The TCJA’s Expensing Provision Alleviates the Tax Code’s Bias against Certain Investments,” Tax Founda-tion, September 5, 2018.
176. Ryan Young, “Deregulate to Stimulate: #NeverNeeded Reg-ulations Are Harming Health and Economy,” Open Market Blog, Competitive Enterprise Institute, July 21, 2020.
177. For example, the Department of Defense’s Fiscal Year 2019 In-dustrial Capabilities Report notes that the National Defense Stock-pile (NDS) Transaction Fund was projected to run a deficit due in large part to “legislatively directed disbursements” that are not related to the NDS. In particular, from FY 2003 to FY 2018, 89.8 percent of the proceeds from NDS program activities, measured in real dollars, were diverted to other defense and non-defense programs, such as the Defense Health Program, construction of the World War II Memorial, and the Federal Supplementary Medical Trust Fund. Such actions undermine the NDS’s impor-tant national security objectives. Office of Industrial Policy, Fiscal Year 2019 Industrial Capabilities Report, p. 97.
178. Office of Industrial Policy, Fiscal Year 2019 Industrial Capa-bilities Report.
179. Certain aspects of the Department of Defense report do raise concerns about its economic rigor and bias: “Machine tool production also correlates with trade deficits.” Office of Indus-trial Policy, Fiscal Year 2019 Industrial Capabilities Report, p. 112.
180. “SNS 2.0: The Next Generation: Building a More Resilient Strategic National Stockpile,” Public Health Emergency, Office of the Assistant Secretary for Preparedness and Response, De-partment of Health and Human Services, https://www.phe.gov/about/sns/Pages/sns-next-generation.aspx.
181. “Fact Sheet on U.S.-Japan Trade Agreement,” Office of the United States Trade Representative, September 2019, https://ustr.gov/about-us/policy-offices/press-office/fact-sheets/2019/september/fact-sheet-us-japan-trade-agreement; and “Annex II: Tariffs and Tariff-Related Provisions of the United States,” Office of the United States Trade Representa-tive, January 1, 2019, https://ustr.gov/sites/default/files/files/agreements/japan/Annex_II_Tariffs_and_Tariff-Related_Provisions_of_the_United_States.pdf.
182. Truman, “Statement by the President upon Signing the Stra-tegic and Critical Materials Stockpiling Act.”
183. Congressional Research Service, “Defense Primer: The Na-tional Technology and Industrial Base,” January 31, 2020.
184. For a detailed look at the history of U.S.-Canadian defense industrial cooperation, see Andrew P. Hunter et al., U.S.-Canadian Defense Industrial Cooperation (Washington: Center for Strategic and International Studies, June 2017).
185. Congressional Research Service, “Defense Primer.”
186. Section 812 of the Senate’s Fiscal Year 2021 National De-fense Authorization Act would eliminate these procurement restrictions, leaving only those for naval vessels. National De-fense Authorization Act for Fiscal Year 2021, S. 4049, 116th Cong. § 812.
187. Congressional Research Service, “Defense Primer.”
188. Office of Industrial Policy, Fiscal Year 2019 Industrial Capabili-ties Report, pp. 16–17.
189. Individuals or business entities must obtain a license from the Department of State to export materials covered by Interna-tional Traffic in Arms Regulations (ITAR). The regulation pro-vides licensing requirement exemptions for some U.S. exports to Canada and some temporary imports from Canada to the United States, but many ITAR-controlled items do not qualify for the Canadian exemptions and other NTIB members are not eligible for the Canadian exemptions.
190. Congressional Research Service, “Defense Primer”; and William Greenwalt, Leveraging the National Technology Industrial Base to Address Great-Power Competition: The Imperative to Integrate Industrial Capabilities of Close Allies (Washington: Atlantic Coun-cil, April 2019).

57
191. Qualifying countries include Australia; Austria; Belgium; Canada; Czech Republic; Denmark; Egypt; Estonia; Finland; France; Germany; Greece; Israel; Italy; Japan; Latvia; Luxembourg; Netherlands; Norway; Poland; Portugal; Slovenia; Spain; Sweden; Switzerland; Turkey; and the United Kingdom. “Reciprocal Defense Procurement and Acquisition Policy Mem-oranda of Understanding,” International Contracting, Contract Policy, Defense Pricing and Contracting, https://www.acq.osd.mil/dpap/cpic/ic/reciprocal_procurement_memoranda_of_understanding.html.
192. DFARS 225.872-1 (a) (June 29, 2018).
193. Partner countries include Australia, Canada, Finland, Italy, The Netherlands, Spain, Sweden, and the United Kingdom. “Security of Supply,” Industrial Policy, Department of Defense, http://www.businessdefense.gov/security-of-supply/.
194. 10 U.S.C. §§ 2501, 2504, 2505.
195. 50 U.S.C. § 98h; “Materials of Interest,” Strategic Materials, Defense Logistics Agency, https://www.dla.mil/HQ/Acquisition/StrategicMaterials/Materials/; and 50 U.S.C. § 98h-6.
196. Truman, “Statement by the President upon Signing the Stra-tegic and Critical Materials Stockpiling Act.”
197. Notably, the Department of Defense’s core macro findings on the “Decline of U.S. Manufacturing Capabilities and Capac-ity” ended in 2010 and are therefore essentially irrelevant given the dramatic rebound in American Manufacturing output and value-added since that time. Interagency Task Force, Assessing and Strengthening the Manufacturing and Defense Industrial Base and Sup-ply Chain Resiliency of the United States (Washington: Department of Defense, September 2018), p. 25nn26–32, https://www.hsdl.org/?view&did=817145.
198. Office of Industrial Policy, Industrial Capabilities: Fiscal Year 2018, p. 17; and Office of Industrial Policy, Fiscal Year 2019 Indus-trial Capabilities Report, pp. 34–35, 37.
199. Office of Industrial Policy, Fiscal Year 2019 Industrial Capabili-ties Report, pp. 68, 75.
200. Office of Industrial Policy, Fiscal Year 2019 Industrial Capabili-ties Report, p. 87.
201. “Of the 202 printed circuit board (PrCB) manufacturing
facilities surveyed in the U.S. Bare Printed Circuit Board Indus-try Assessment 2017, 132 facilities anticipated challenges finding experienced employees. . . . Manufacturing facilities cite that roughly 522,000 jobs remained open in the sector in September 2019. There are also limited formal education opportunities for electronic interconnect manufacturing in the United States.” Office of Industrial Policy, Fiscal Year 2019 Industrial Capabilities Report, pp. 106, 112.
202. Congressional Research Service, “Section 232 Investiga-tions”; and 19 U.S.C. § 1862.
203. Congressional Research Service, “Section 232 Investiga-tions.”
204. “Import Injury Investigations,” United States International Trade Commission, https://usitc.gov/investigations/import_injury.
205. 41 U.S.C. §§ 8301–8305.
206. “Buy America Provisions—Side-by-Side Comparison,” De-partment of Transportation, last updated March 13, 2012, https://www.transportation.gov/buy-america-provisions-side-side-comparison.
207. “Buy America(n) Acts: Sector Specific Information,” Trade Commissioner Service, Government of Canada, https://www.tradecommissioner.gc.ca/sell2usgov-vendreaugouvusa/procurement-marches/sector_chart-tableau_sectoriels.aspx?lang=eng.
208. For example, the “specialty metals restriction” codified in 10 U.S.C. § 2533b, prohibits the Department of Defense (DOD) from purchasing any “specialty metal” not melted or produced in the United States, except in specified instances. Other U.S. laws prohibit the DOD from: purchasing ball and roller bearings not manufactured in the United States or Canada; purchasing carbon, alloy, or armor steel plate melted and rolled outside the United States or Canada; and acquiring, or allowing a contrac-tor to acquire, steel for any construction project or activity for which U.S. steel companies have been denied the opportunity to compete for the acquisition.
209. “Canadian Access to the United States Defence Market,” Canadian Aerospace and Defence Industry, Government of Canada, https://www.ic.gc.ca/eic/site/ad-ad.nsf/eng/ad00271.html.

RELATED PUBLICATIONS FROM THE CATO INSTITUTE
Testing the “China Shock”: Was Normalizing Trade with China a Mistake? by Scott Lincicome, Policy Analysis no. 895 (July 8, 2020)
Debunking Protectionist Myths: Free Trade, the Developing World, and Prosperity by Arvind Panagariya, Economic Development Bulletin no. 31 (July 18, 2019)
Doomed to Repeat It: The Long History of America’s Protectionist Failures by Scott Lincicome, Policy Analysis no. 819 (August 22, 2017)
Cybersecurity or Protectionism? Defusing the Most Volatile Issue in the U.S.–China Relationship by Daniel J. Ikenson, Policy Analysis no. 815 (July 13, 2017)
Beyond the American Manufacturing Competitiveness Act: Congress Should Get More Serious about Tariff Reform by Daniel J. Ikenson, Free Trade Bulletin no. 67 (April 26, 2016)
Global Steel Overcapacity: Trade Remedy “Cure” Is Worse than the “Disease” by Daniel R. Pearson, Free Trade Bulletin no. 66 (April 11, 2016)
The Export- Import Bank and Its Victims: Which Industries and States Bear the Brunt? by Daniel J. Ikenson, Policy Analysis no. 756 (September 10, 2014)
Countervailing Calamity: How to Stop the Global Subsidies Race by Scott Lincicome, Policy Analysis no. 710 (October 9, 2012)
As Promised, Free Trade Agreements Deliver More Trade: Manufacturing Exports Receive an Extra Boost by Daniel Griswold, Free Trade Bulletin no. 45 (June 7, 2011)
Manufacturing Discord: Growing Tensions Threaten the U.S.-China Economic Relationship by Daniel J. Ikenson, Trade Briefing Paper no. 29 (May 4, 2010)
Thriving in a Global Economy: The Truth about U.S. Manufacturing and Trade by Daniel J. Ikenson, Trade Policy Analysis no. 35 (August 28, 2007)
Reforming a Defense Industry Rife with Socialism, Industrial Policy, and Excessive Regulation by Ivan Eland, Policy Analysis no. 421 (December 20, 2001)
The Perils of Managed Trade by Susan W. Liebeler and Michael S. Knoll, Policy Analysis no. 138 (August 29, 1990)
RECENT STUDIES IN THE CATO INSTITUTE POLICY ANALYSIS SERIES
906. Circumventing Section 230: Product Liability Lawsuits Threaten Internet Speech by Will Duffield (January 26, 2021)
905. COVID-19 and the U.S. Fiscal Imbalance by Jeffrey Miron (December 8, 2020)
904. Space Force: Ahead of Its Time, or Dreadfully Premature? by Robert Farley (December 1, 2020)
903. Despite Modi, India Has Not Yet Become a Hindu Authoritarian State by Swaminathan S. Anklesaria Aiyar (November 24, 2020)
902. Government in a Pandemic by Thomas A. Firey (November 17, 2020)
901. Qualified Immunity: A Legal, Practical, and Moral Failure by Jay Schweikert (September 14, 2020)
900. Democrats and Trade 2021: A Pro- Trade Policy for the Democratic Party by James Bacchus (August 11, 2020)
899. Health Care Workforce Reform: COVID-19 Spotlights Need for Changes to Clinician Licensing by Shirley Svorny and Michael F. Cannon (August 4, 2020)
898. How Property and Civil Rights Help Forest Tribes Modernize and Prosper: Lessons from India by Swaminathan S. Anklesaria Aiyar and Neeraj Kaushal (July 30, 2020)
897. Neo- Malthusianism and Coercive Population Control in China and India: Overpopulation Concerns Often Result in Coercion by Chelsea Follett (July 21, 2020)
896. Tariffs by Fiat: The Widening Chasm between U.S. Antidumping Policy and the Rule of Law by Daniel J. Ikenson (July 16, 2020)
895. Testing the “China Shock”: Was Normalizing Trade with China a Mistake? by Scott Lincicome (July 8, 2020)
894. Kicking the Habit: The Opioid Crisis and America’s Addiction to Prohibition by Josh Bowers and Daniel Abrahamson (June 29, 2020)
893. Nuclear Anti-Proliferation Policy and the Korea Conundrum: Some Policy Proposals by John Mueller (June 22, 2020)
892. “Money as a Weapons System”: The Promises and Pitfalls of Foreign Defense Contracting by Renanah Miles Joyce and Brian Blankenship (June 3, 2020)

The views expressed in this paper are those of the author(s) and should not be attributed to the Cato Institute, its trustees, its Sponsors, or any other person or organization. Nothing in this paper should be construed as an attempt to aid or hinder the passage of any bill before Congress. Copyright © 2021 Cato Institute. This work by the Cato Institute is licensed under a Creative Commons Attribution-NonCommercial-ShareAlike 4.0 International License.
891. Rightsizing Fed Ed: Principles for Reform and Practical Steps to Move in the Right Direction by Mary Clare Amselem, Lindsey Burke, Jonathan Butcher, Jamie Gass, Neal McCluskey, and Theodor Rebarber (May 4, 2020)
890. Illegal Immigrant Incarceration Rates, 2010–2018: Demographics and Policy Implications by Michelangelo Landgrave and Alex Nowrasteh (April 21, 2020)
889. Transit: The Urban Parasite by Randal O’Toole (April 20, 2020)
888. The Case for Congressional Regulatory Review by William Yeatman (April 14, 2020)
887. The Development Dimension: What to Do about Differential Treatment in Trade by James Bacchus and Inu Manak (April 13, 2020)
886. Environmental Costs of the Jones Act by Timothy Fitzgerald (March 2, 2020)
885. Maryland’s BOOST Is Promising, but More Work Is Needed by Russell Rhine (February 26, 2020)
884. Ineffective, Immoral, Politically Convenient: America’s Overreliance on Economic Sanctions and What to Do about It by Richard Hanania (February 18, 2020)
883. The More Things Change, the More They Stay the Same: The Failure of Regime-Change Operations by Benjamin Denison (January 6, 2020)
882. Rust Buckets: How the Jones Act Undermines U.S. Shipbuilding and National Security by Colin Grabow (November 12, 2019)
881. Exploring Wealth Inequality by Chris Edwards and Ryan Bourne (November 5, 2019)
880. The Problems with Economic Integration and Controlled Choice by David J. Armor (September 24, 2019)
CITATIONLincicome, Scott. “Manufactured Crisis: ‘Deindustrialization,’ Free Markets, and National Security,” Policy Analysis no. 907, Cato Institute, Washington, DC, January 27, 2021. https://doi.org/10.36009/PA.907.


![[XLS] · Web viewPAFM 125.50 907-445-2146 Awos III Yes Anaktuvuk Pass PAKP 135.75 907-661-3020 Anchorage PALH 907-245-1618 Anchorage (Intnl Arpt) PANC ATIS 907-248-2033 Asos Anchorage](https://img.pdfslide.us/doc/110x75/5ae640477f8b9a9e5d8d783f/xls-viewpafm-12550-907-445-2146-awos-iii-yes-anaktuvuk-pass-pakp-13575-907-661-3020.jpg)