Embed Size (px)
Citation preview

Seek Bright Spots in Uncertain Markets.
2016 OutlookInvestment Insights
January 2016
Investments are not FDIC-insured, nor are they deposits of or guaranteed by a bank or any other entity, so they may lose value.Past results are not predictive of results in future periods.Cover: New York, New York
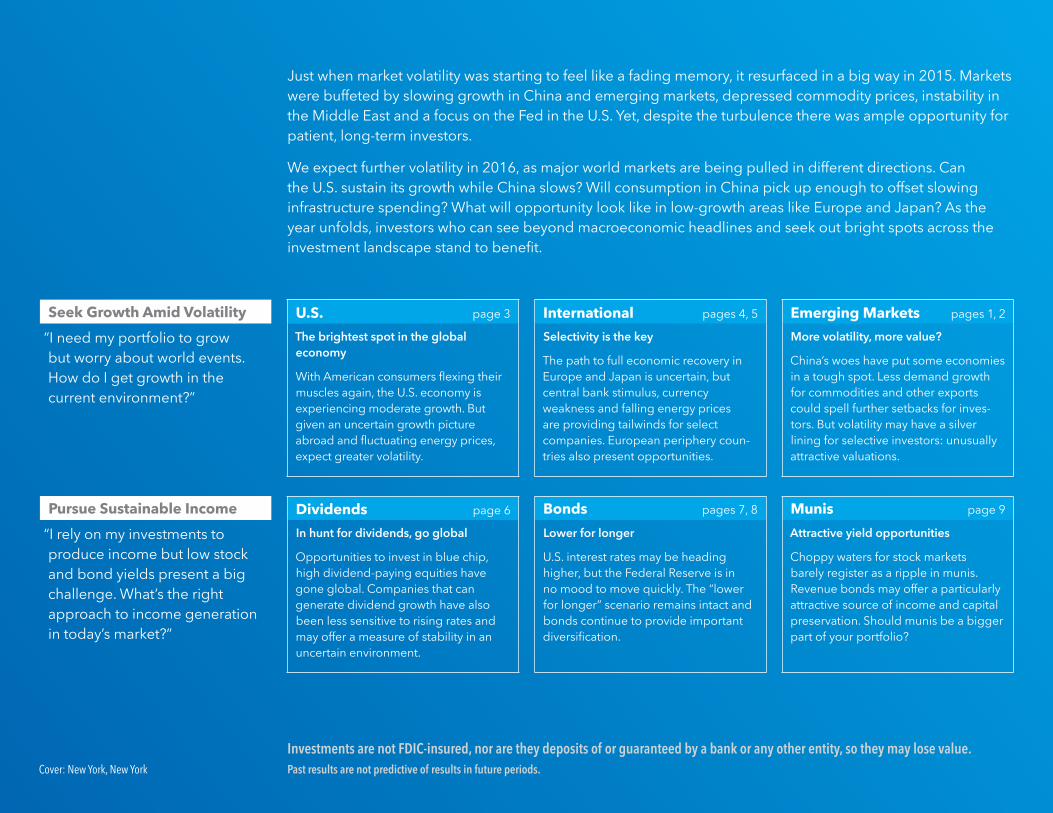
Just when market volatility was starting to feel like a fading memory, it resurfaced in a big way in 2015. Markets were buffeted by slowing growth in China and emerging markets, depressed commodity prices, instability in the Middle East and a focus on the Fed in the U.S. Yet, despite the turbulence there was ample opportunity for patient, long-term investors.
We expect further volatility in 2016, as major world markets are being pulled in different directions. Can the U.S. sustain its growth while China slows? Will consumption in China pick up enough to offset slowing infrastructure spending? What will opportunity look like in low-growth areas like Europe and Japan? As the year unfolds, investors who can see beyond macroeconomic headlines and seek out bright spots across the investment landscape stand to benefit.
Seek Growth Amid Volatility U.S. page 3 International pages 4, 5 Emerging Markets pages 1, 2
“I need my portfolio to grow but worry about world events. How do I get growth in the current environment?”
The brightest spot in the global economy
With American consumers flexing their muscles again, the U.S. economy is experiencing moderate growth. But given an uncertain growth picture abroad and fluctuating energy prices, expect greater volatility.
Selectivity is the key
The path to full economic recovery in Europe and Japan is uncertain, but central bank stimulus, currency weakness and falling energy prices are providing tailwinds for select companies. European periphery coun-tries also present opportunities.
More volatility, more value?
China’s woes have put some economies in a tough spot. Less demand growth for commodities and other exports could spell further setbacks for inves-tors. But volatility may have a silver lining for selective investors: unusually attractive valuations.
Pursue Sustainable Income Dividends page 6 Bonds pages 7, 8 Munis page 9
“I rely on my investments to produce income but low stock and bond yields present a big challenge. What’s the right approach to income generation in today’s market?”
In hunt for dividends, go global
Opportunities to invest in blue chip, high dividend-paying equities have gone global. Companies that can generate dividend growth have also been less sensitive to rising rates and may offer a measure of stability in an uncertain environment.
Lower for longer
U.S. interest rates may be heading higher, but the Federal Reserve is in no mood to move quickly. The “lower for longer” scenario remains intact and bonds continue to provide important diversification.
Attractive yield opportunities
Choppy waters for stock markets barely register as a ripple in munis. Revenue bonds may offer a particularly attractive source of income and capital preservation. Should munis be a bigger part of your portfolio?
2016 Outlook January 2016 | 1
Growth amid volatility
“From a macroeconomic standpoint, this is not a very exciting world.Then you go to the industry level and the company level and there are a lot of things to be excited about. But you have to dig deep to understand which drug companies will get their therapies approved, which components will be needed in the next generation of technology and which companies are in the markets where the next wave of growth will come.”
Rob Lovelace, Portfolio Manager
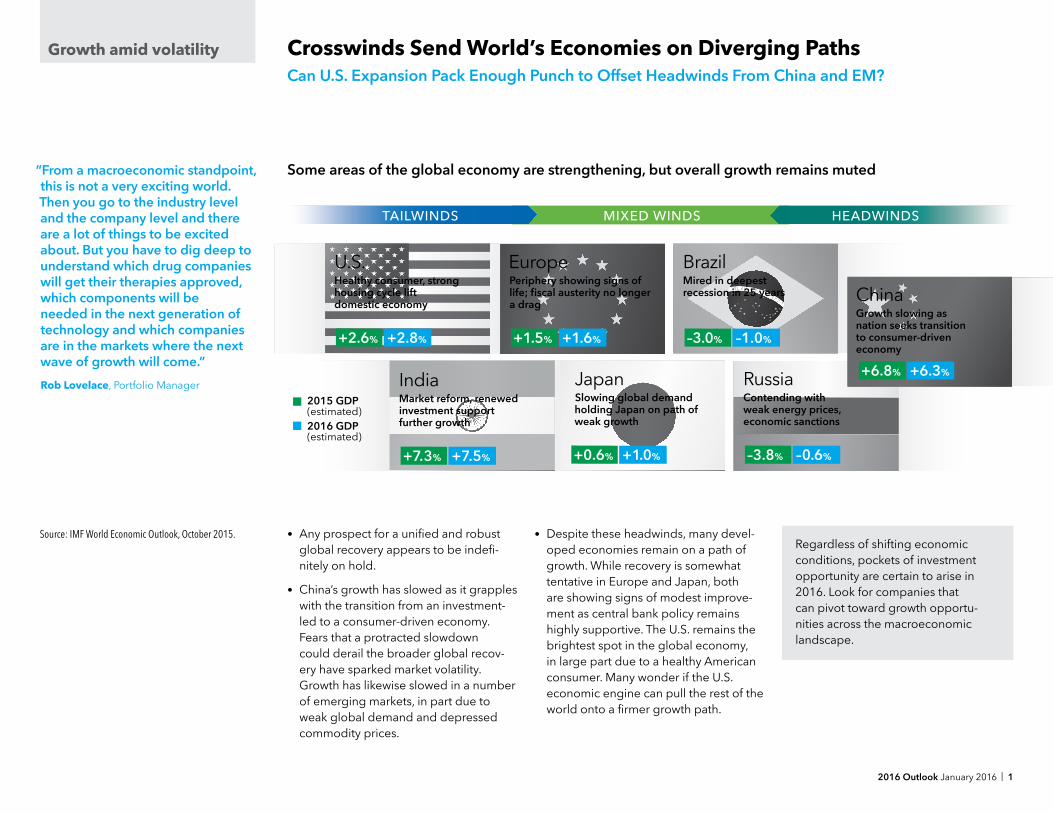
Crosswinds Send World’s Economies on Diverging PathsCan U.S. Expansion Pack Enough Punch to Offset Headwinds From China and EM?
• Any prospect for a unified and robust global recovery appears to be indefi-nitely on hold.
• China’s growth has slowed as it grapples with the transition from an investment-led to a consumer-driven economy. Fears that a protracted slowdown could derail the broader global recov-ery have sparked market volatility. Growth has likewise slowed in a number of emerging markets, in part due to weak global demand and depressed commodity prices.
• Despite these headwinds, many devel-oped economies remain on a path of growth. While recovery is somewhat tentative in Europe and Japan, both are showing signs of modest improve-ment as central bank policy remains highly supportive. The U.S. remains the brightest spot in the global economy, in large part due to a healthy American consumer. Many wonder if the U.S. economic engine can pull the rest of the world onto a firmer growth path.
Source: IMF World Economic Outlook, October 2015.
Some areas of the global economy are strengthening, but overall growth remains muted
Regardless of shifting economic conditions, pockets of investment opportunity are certain to arise in 2016. Look for companies that can pivot toward growth opportu-nities across the macroeconomic landscape.
JapanSlowing global demand holding Japan on path of weak growth
+0.6% +1.0%
India Market reform, renewed investment support further growth
+7.3% +7.5%
EuropePeriphery showing signs of life; fiscal austerity no longer a drag
+1.5% +1.6%
U.S.Healthy consumer, strong housing cycle lift domestic economy
+2.6% +2.8%
Brazil Mired in deepest recession in 25 years
–3.0% –1.0%
Russia Contending with weak energy prices, economic sanctions
–3.8% –0.6%
China Growth slowing as nation seeks transition to consumer-driven economy
+6.8% +6.3%
2015 GDP (estimated)2016 GDP (estimated)
TAILWINDS MIXED WINDS HEADWINDS
2 | 2016 Outlook January 2016
Growth amid volatility
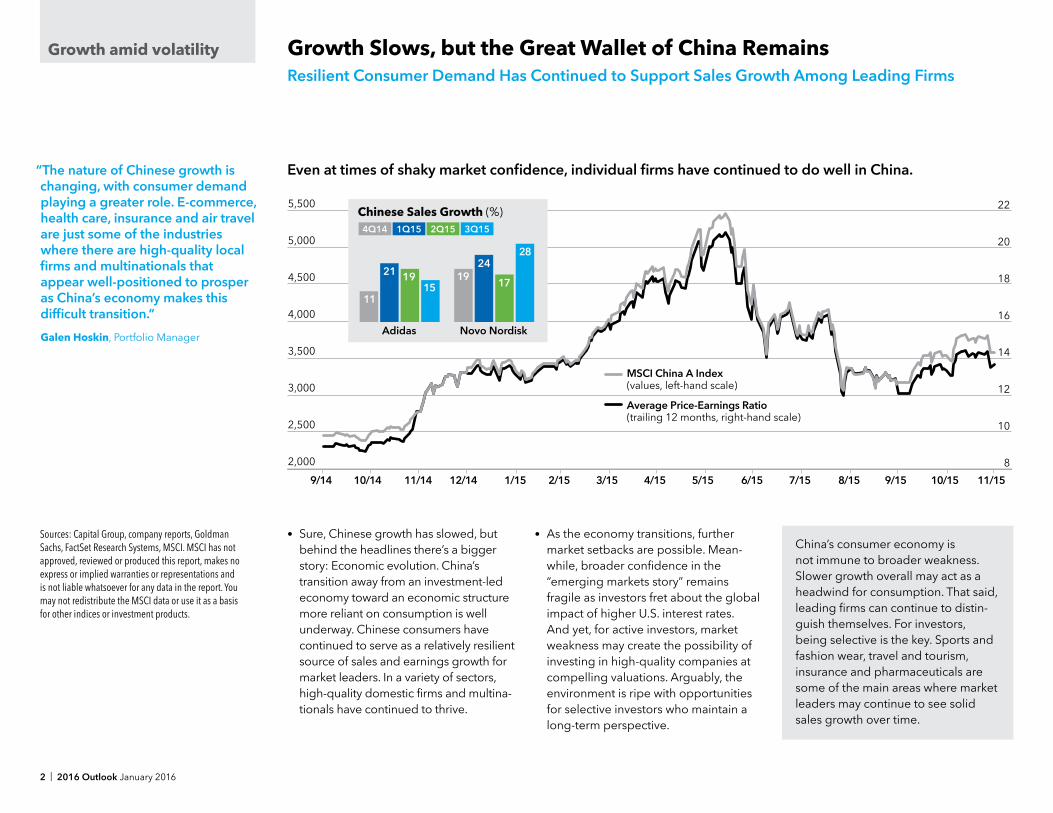
“The nature of Chinese growth is changing, with consumer demand playing a greater role. E-commerce, health care, insurance and air travel are just some of the industries where there are high-quality local firms and multinationals that appear well-positioned to prosper as China’s economy makes this difficult transition.”
Galen Hoskin, Portfolio Manager
Growth Slows, but the Great Wallet of China RemainsResilient Consumer Demand Has Continued to Support Sales Growth Among Leading Firms
• Sure, Chinese growth has slowed, but behind the headlines there’s a bigger story: Economic evolution. China’s transition away from an investment-led economy toward an economic structure more reliant on consumption is well underway. Chinese consumers have continued to serve as a relatively resilient source of sales and earnings growth for market leaders. In a variety of sectors, high-quality domestic firms and multina-tionals have continued to thrive.
• As the economy transitions, further market setbacks are possible. Mean-while, broader confidence in the “emerging markets story” remains fragile as investors fret about the global impact of higher U.S. interest rates. And yet, for active investors, market weakness may create the possibility of investing in high-quality companies at compelling valuations. Arguably, the environment is ripe with opportunities for selective investors who maintain a long-term perspective.
Sources: Capital Group, company reports, Goldman Sachs, FactSet Research Systems, MSCI. MSCI has not approved, reviewed or produced this report, makes no express or implied warranties or representations and is not liable whatsoever for any data in the report. You may not redistribute the MSCI data or use it as a basis for other indices or investment products.
9/14 10/14 11/14 12/14 1/15 2/15 3/15 4/15 5/15 6/15 7/15 8/15 9/15 10/15 11/15
22
20
18
16
14
12
10
8
5,500
5,000
4,500
4,000
3,500
3,000
2,500
2,000
MSCI China A Index(values, left-hand scale)
Average Price-Earnings Ratio (trailing 12 months, right-hand scale)
28
17
2419
151921
11
Adidas Novo Nordisk
Chinese Sales Growth (%)4Q14 1Q15 2Q15 3Q15
Even at times of shaky market confidence, individual firms have continued to do well in China.
China’s consumer economy is not immune to broader weakness. Slower growth overall may act as a headwind for consumption. That said, leading firms can continue to distin-guish themselves. For investors, being selective is the key. Sports and fashion wear, travel and tourism, insurance and pharmaceuticals are some of the main areas where market leaders may continue to see solid sales growth over time.
2016 Outlook January 2016 | 3
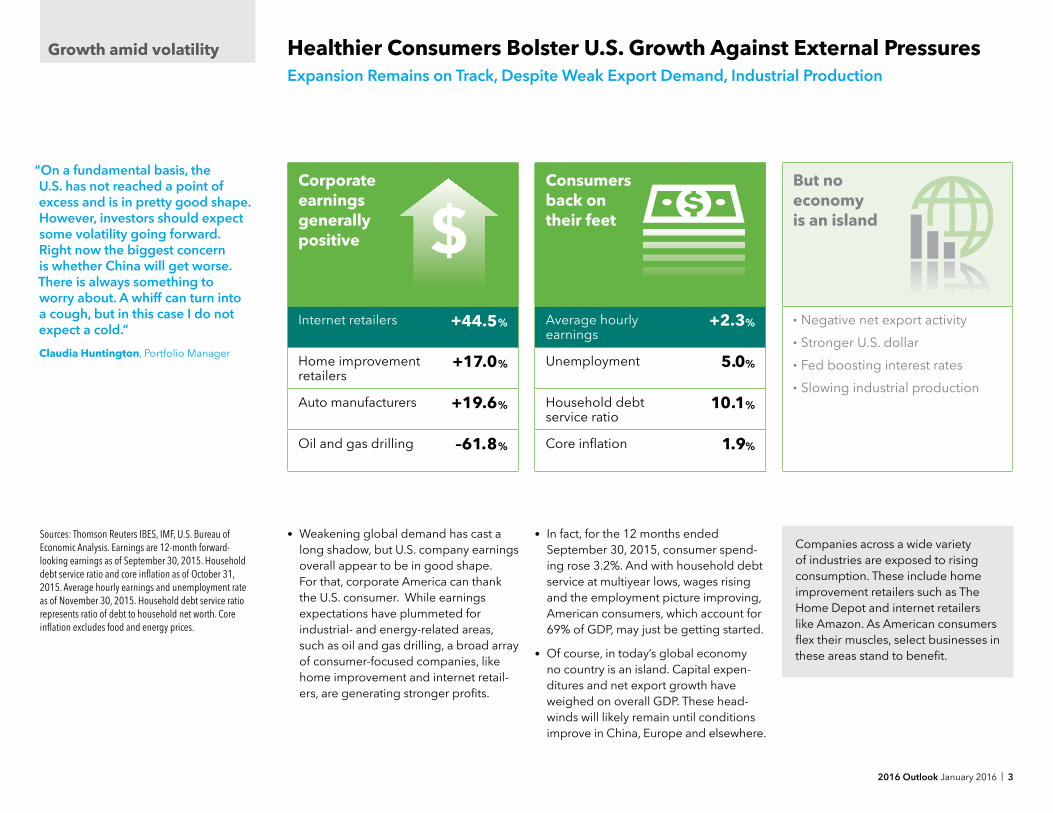
Corporate earnings generally positive
Internet retailers +44.5%
Home improvement retailers
+17.0%
Auto manufacturers +19.6%
Oil and gas drilling –61.8%
$
Growth amid volatilityGrowth Slows, but the Great Wallet of China Remains
“On a fundamental basis, the U.S. has not reached a point of excess and is in pretty good shape. However, investors should expect some volatility going forward. Right now the biggest concern is whether China will get worse. There is always something to worry about. A whiff can turn into a cough, but in this case I do not expect a cold.”
Claudia Huntington, Portfolio Manager
Healthier Consumers Bolster U.S. Growth Against External PressuresExpansion Remains on Track, Despite Weak Export Demand, Industrial Production
Sources: Thomson Reuters IBES, IMF, U.S. Bureau of Economic Analysis. Earnings are 12-month forward-looking earnings as of September 30, 2015. Household debt service ratio and core inflation as of October 31, 2015. Average hourly earnings and unemployment rate as of November 30, 2015. Household debt service ratio represents ratio of debt to household net worth. Core inflation excludes food and energy prices.
• Weakening global demand has cast a long shadow, but U.S. company earnings overall appear to be in good shape. For that, corporate America can thank the U.S. consumer. While earnings expectations have plummeted for industrial- and energy-related areas, such as oil and gas drilling, a broad array of consumer-focused companies, like home improvement and internet retail-ers, are generating stronger profits.
• In fact, for the 12 months ended September 30, 2015, consumer spend-ing rose 3.2%. And with household debt service at multiyear lows, wages rising and the employment picture improving, American consumers, which account for 69% of GDP, may just be getting started.
• Of course, in today’s global economy no country is an island. Capital expen-ditures and net export growth have weighed on overall GDP. These head-winds will likely remain until conditions improve in China, Europe and elsewhere.
Companies across a wide variety of industries are exposed to rising consumption. These include home improvement retailers such as The Home Depot and internet retailers like Amazon. As American consumers flex their muscles, select businesses in these areas stand to benefit.
Consumers back on their feet
Average hourly earnings
+2.3%
Unemployment 5.0%
Household debt service ratio
10.1%
Core inflation 1.9%
$But no economy is an island
• Negative net export activity
• Stronger U.S. dollar
• Fed boosting interest rates
• Slowing industrial production
4 | 2016 Outlook January 2016
Growth amid volatility
“The euro-zone economy is recovering, but it’s hard to do a victory lap when GDP growth is 1.5%. The feeling has been that it will never be as good as you hope for, and it will never be as bad as you fear. That’s Europe.”
Gerald Du Manoir, Portfolio Manager
In Europe, Recovery Elusive, but Valuations Look AttractiveAttractive Valuations Found Amid Currency Weakness and Central Bank Stimulus
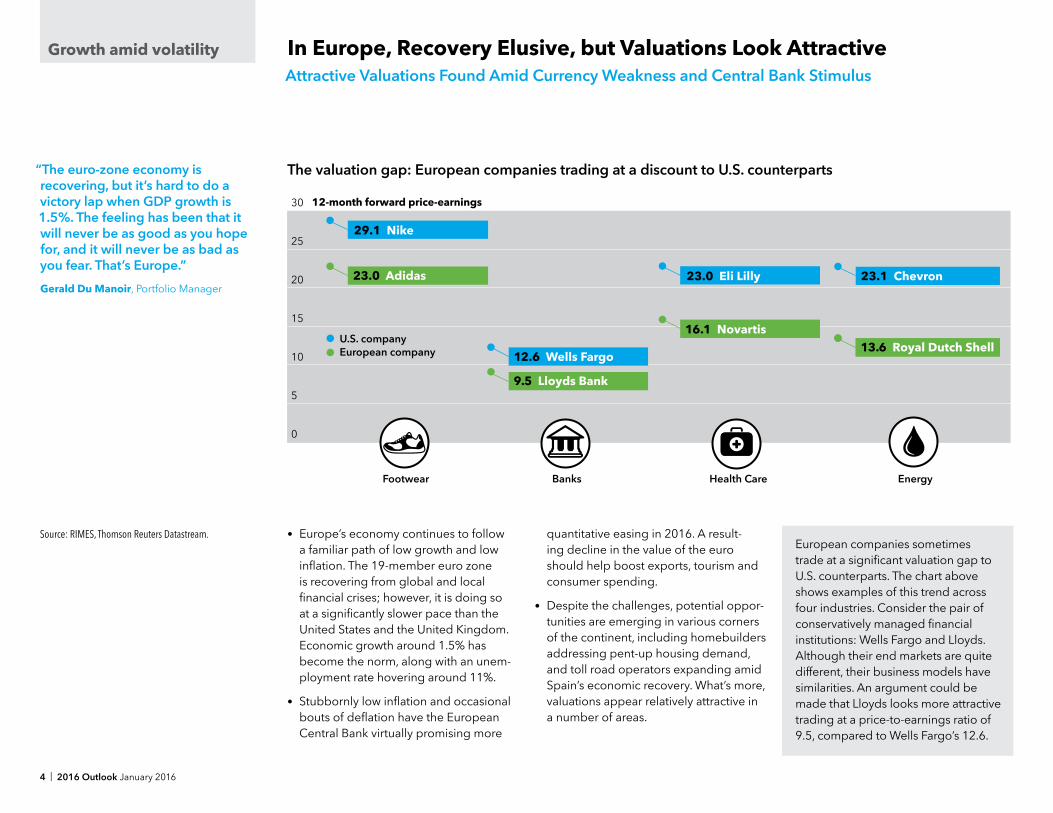
Source: RIMES, Thomson Reuters Datastream. • Europe’s economy continues to follow a familiar path of low growth and low inflation. The 19-member euro zone is recovering from global and local financial crises; however, it is doing so at a significantly slower pace than the United States and the United Kingdom. Economic growth around 1.5% has become the norm, along with an unem-ployment rate hovering around 11%.
• Stubbornly low inflation and occasional bouts of deflation have the European Central Bank virtually promising more
quantitative easing in 2016. A result-ing decline in the value of the euro should help boost exports, tourism and consumer spending.
• Despite the challenges, potential oppor-tunities are emerging in various corners of the continent, including homebuilders addressing pent-up housing demand, and toll road operators expanding amid Spain’s economic recovery. What’s more, valuations appear relatively attractive in a number of areas.
European companies sometimes trade at a significant valuation gap to U.S. counterparts. The chart above shows examples of this trend across four industries. Consider the pair of conservatively managed financial institutions: Wells Fargo and Lloyds. Although their end markets are quite different, their business models have similarities. An argument could be made that Lloyds looks more attractive trading at a price-to-earnings ratio of 9.5, compared to Wells Fargo’s 12.6.
The valuation gap: European companies trading at a discount to U.S. counterparts
30
25
20
15
10
5
0
Footwear Banks Health Care Energy
12-month forward price-earnings
23.1 Chevron
13.5 Royal Dutch Shell13.6 Royal Dutch Shell12.6 Wells Fargo
9.5 Lloyds Bank
23.0 Eli Lilly
16.1 Novartis
23.0 Adidas
29.1 Nike
U.S. companyEuropean company
2016 Outlook January 2016 | 5
Growth amid volatility
“The real question for Japan is, can quantitative easing and better corporate governance really provide a meaningful tailwind to the economy? Frankly the jury is still out. That being said, I still think it’s very much a stay-the-course moment. Valuations are low and the companies that I’ve been interested in lately have been more domestic oriented, rather than the pure exporters.”
Andrew Suzman, Portfolio Manager
Pack Your Bags for JapanSpike in Tourism Is One Bright Spot in a Mixed Economic Outlook for the Island Nation
Source: Thomson Reuters Datastream.
2,000
1,800
1,600
1,400
1,200
1,000
800
600
400
200
Monthly visitor arrivals to Japan (in thousands) 4,500
4,000
3,500
3,000
2,500
2,000
1,500
1,000
500
0
1996 1998 2000 2002 2004 2006 2008 2010 2012 2014
Direct purchases in Japan by visitors (yen in billions)
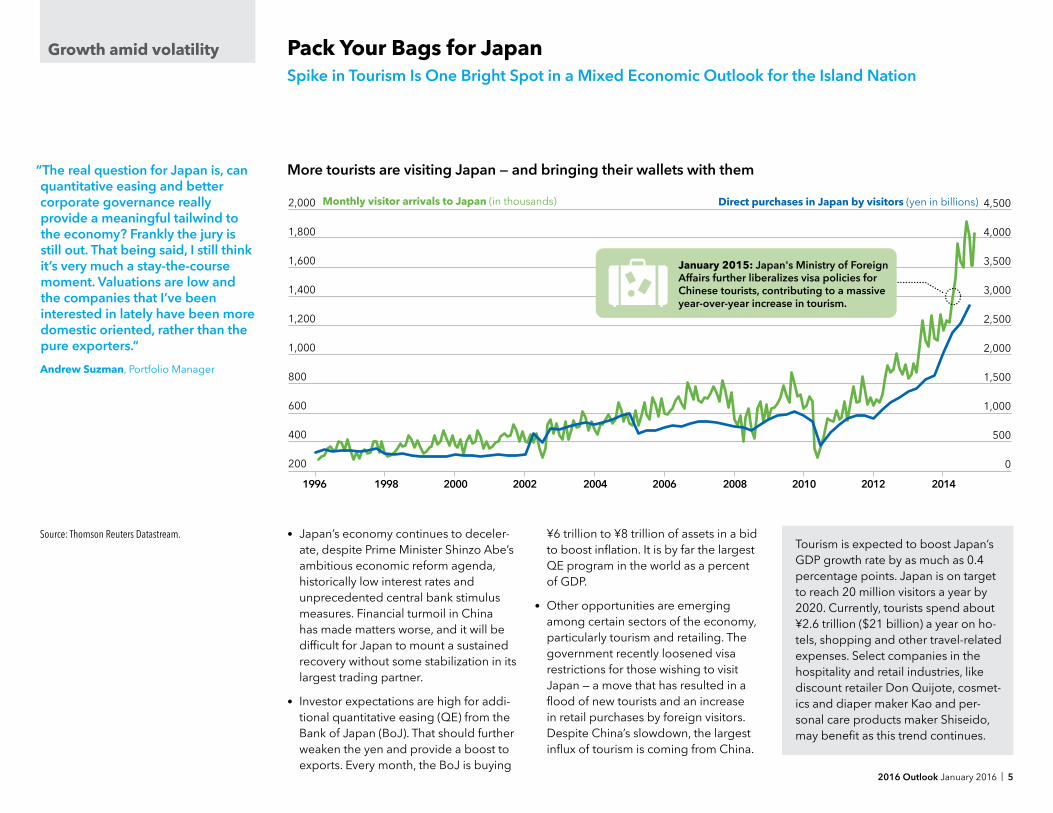
January 2015: Japan's Ministry of Foreign Affairs further liberalizes visa policies for Chinese tourists, contributing to a massive year-over-year increase in tourism.
More tourists are visiting Japan — and bringing their wallets with them
• Japan’s economy continues to deceler-ate, despite Prime Minister Shinzo Abe’s ambitious economic reform agenda, historically low interest rates and unprecedented central bank stimulus measures. Financial turmoil in China has made matters worse, and it will be difficult for Japan to mount a sustained recovery without some stabilization in its largest trading partner.
• Investor expectations are high for addi-tional quantitative easing (QE) from the Bank of Japan (BoJ). That should further weaken the yen and provide a boost to exports. Every month, the BoJ is buying
¥6 trillion to ¥8 trillion of assets in a bid to boost inflation. It is by far the largest QE program in the world as a percent of GDP.
• Other opportunities are emerging among certain sectors of the economy, particularly tourism and retailing. The government recently loosened visa restrictions for those wishing to visit Japan — a move that has resulted in a flood of new tourists and an increase in retail purchases by foreign visitors. Despite China’s slowdown, the largest influx of tourism is coming from China.
Tourism is expected to boost Japan’s GDP growth rate by as much as 0.4 percentage points. Japan is on target to reach 20 million visitors a year by 2020. Currently, tourists spend about ¥2.6 trillion ($21 billion) a year on ho-tels, shopping and other travel-related expenses. Select companies in the hospitality and retail industries, like discount retailer Don Quijote, cosmet-ics and diaper maker Kao and per-sonal care products maker Shiseido, may benefit as this trend continues.
6 | 2016 Outlook January 2016
Sustainable income
“For companies that are growing their dividends, that growth should overwhelm the interest rate cycle, not only over the longer term but the medium term. The trick is making sure you are invested in the dividend growers.”
Jim Lovelace, Portfolio Manager
Want Dividends? Go GlobalLook to Overseas Markets for Dividend Payers and Growers
Sources: RIMES, Capital Group. Yields calculated based on MSCI country indexes. Data as of November 30, 2015.
U.S. 2.1%
Brazil 4.1%
United Kingdom 4.1%
France 2.9%China 3.1%
Singapore 4.3%
Canada 3.2%
Germany 2.6%
Australia 5.2%
Hong Kong 3.0%
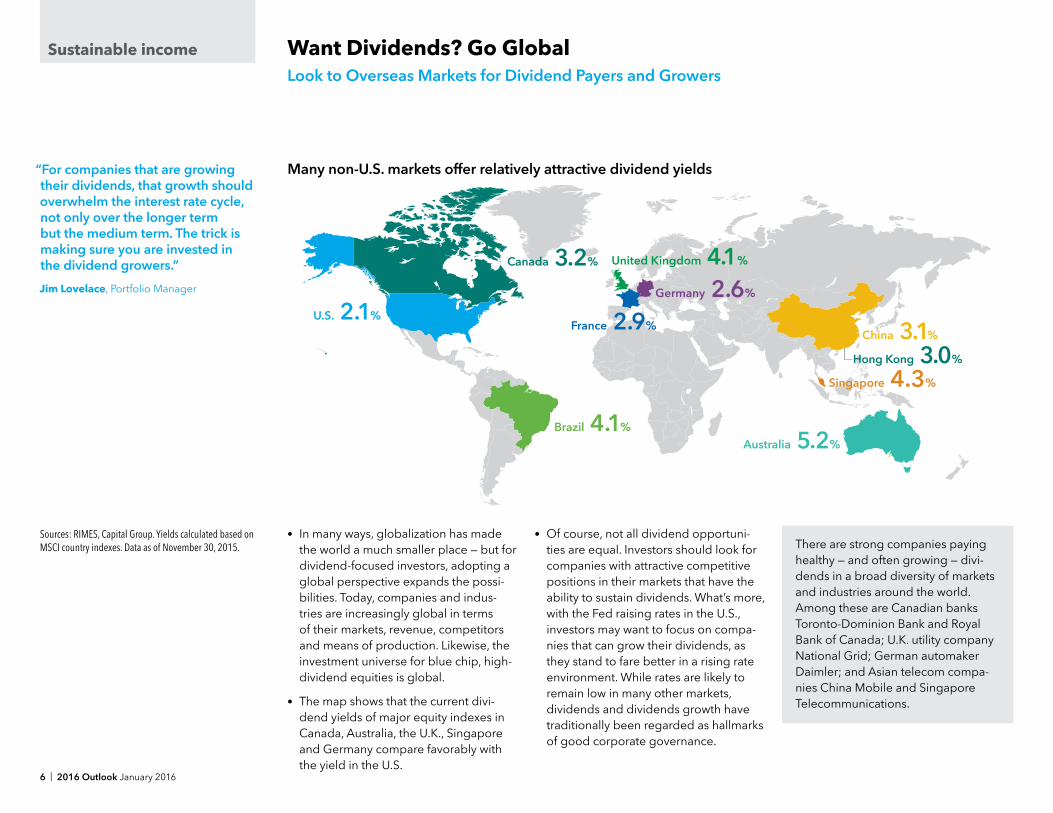
Many non-U.S. markets offer relatively attractive dividend yields
• In many ways, globalization has made the world a much smaller place — but for dividend-focused investors, adopting a global perspective expands the possi-bilities. Today, companies and indus-tries are increasingly global in terms of their markets, revenue, competitors and means of production. Likewise, the investment universe for blue chip, high- dividend equities is global.
• The map shows that the current divi-dend yields of major equity indexes in Canada, Australia, the U.K., Singapore and Germany compare favorably with the yield in the U.S.
• Of course, not all dividend opportuni-ties are equal. Investors should look for companies with attractive competitive positions in their markets that have the ability to sustain dividends. What’s more, with the Fed raising rates in the U.S., investors may want to focus on compa-nies that can grow their dividends, as they stand to fare better in a rising rate environment. While rates are likely to remain low in many other markets, dividends and dividends growth have traditionally been regarded as hallmarks of good corporate governance.
There are strong companies paying healthy — and often growing — divi-dends in a broad diversity of markets and industries around the world. Among these are Canadian banks Toronto-Dominion Bank and Royal Bank of Canada; U.K. utility company National Grid; German automaker Daimler; and Asian telecom compa-nies China Mobile and Singapore Telecommunications.
2016 Outlook January 2016 | 7
Sustainable income
“There are some attractive valuations in the U.S. high-yield bond market. Overall corporate fundamentals appear sound, though we’re keeping a close eye on rising leverage. In emerging markets debt, substantial variation among country fundamentals and policy responses is creating a varied investment environment. Consequently, there are diverse opportunities for longer term investors who are selective.”
Laurentius Harrer, Portfolio Manager
Who Said This Is a Low-Yield World?A Step-Up in “Plus Sector” Yields Suggests Greater Return Potential for Long-Term Investors
Sources: Barclays Research, J.P. Morgan.
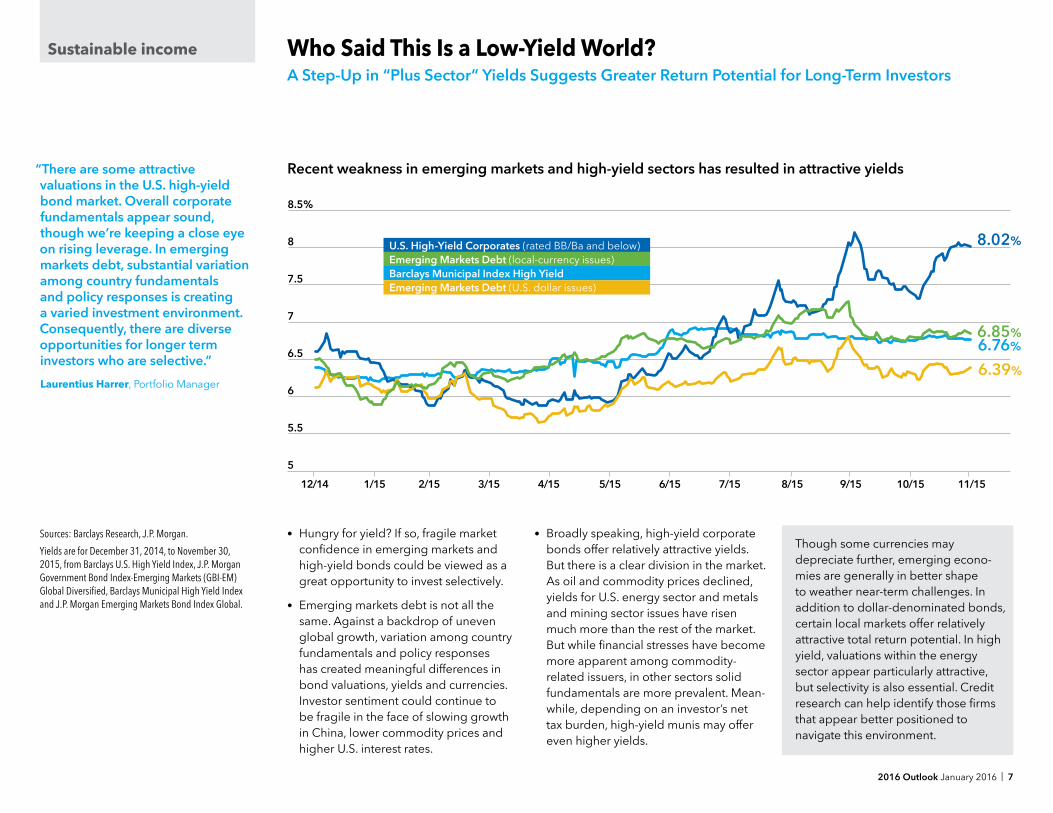
Yields are for December 31, 2014, to November 30, 2015, from Barclays U.S. High Yield Index, J.P. Morgan Government Bond Index-Emerging Markets (GBI-EM) Global Diversified, Barclays Municipal High Yield Index and J.P. Morgan Emerging Markets Bond Index Global.
8.5%
8
7.5
7
6.5
6
5.5
5
12/14 1/15 2/15 3/15 4/15 5/15 6/15 7/15 8/15 9/15 10/15 11/15
8.02%
6.85%6.76%
6.39%
U.S. High-Yield Corporates (rated BB/Ba and below)Emerging Markets Debt (local-currency issues)Barclays Municipal Index High YieldEmerging Markets Debt (U.S. dollar issues)
Recent weakness in emerging markets and high-yield sectors has resulted in attractive yields
• Hungry for yield? If so, fragile market confidence in emerging markets and high-yield bonds could be viewed as a great opportunity to invest selectively.
• Emerging markets debt is not all the same. Against a backdrop of uneven global growth, variation among country fundamentals and policy responses has created meaningful differences in bond valuations, yields and currencies. Investor sentiment could continue to be fragile in the face of slowing growth in China, lower commodity prices and higher U.S. interest rates.
• Broadly speaking, high-yield corporate bonds offer relatively attractive yields. But there is a clear division in the market. As oil and commodity prices declined, yields for U.S. energy sector and metals and mining sector issues have risen much more than the rest of the market. But while financial stresses have become more apparent among commodity-related issuers, in other sectors solid fundamentals are more prevalent. Mean-while, depending on an investor’s net tax burden, high-yield munis may offer even higher yields.
Though some currencies may depreciate further, emerging econo-mies are generally in better shape to weather near-term challenges. In addition to dollar-denominated bonds, certain local markets offer relatively attractive total return potential. In high yield, valuations within the energy sector appear particularly attractive, but selectivity is also essential. Credit research can help identify those firms that appear better positioned to navigate this environment.
8 | 2016 Outlook January 2016
Sustainable income
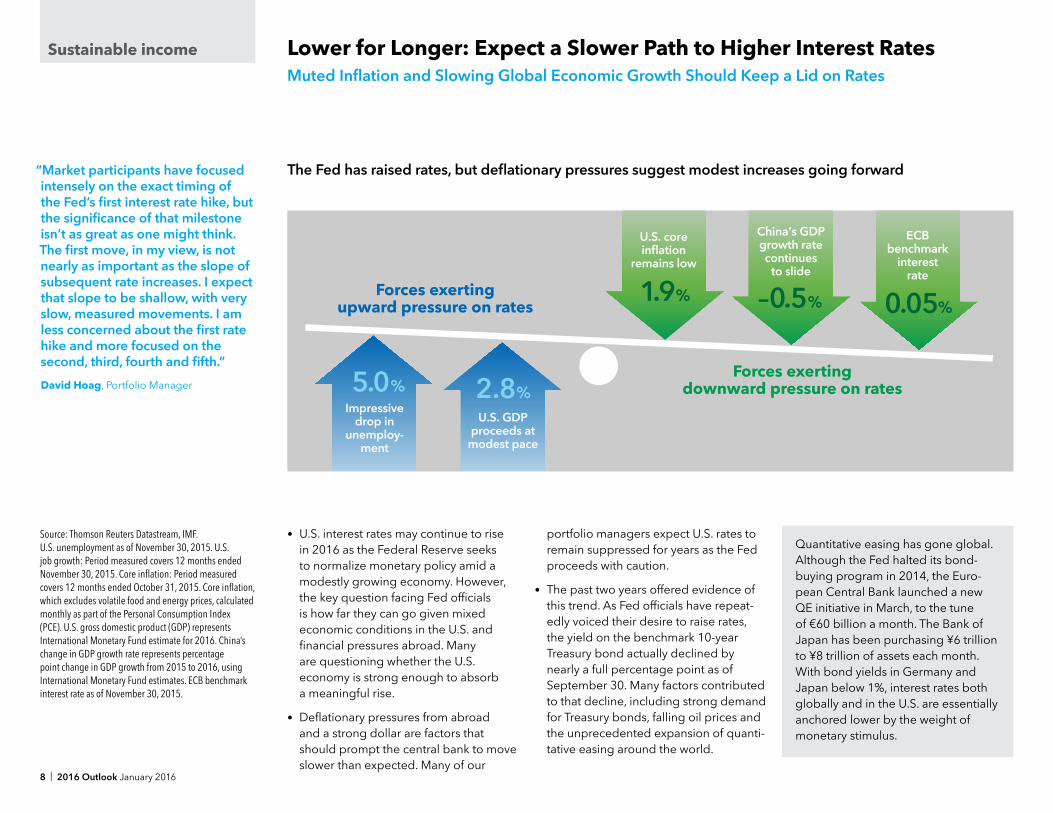
“Market participants have focused intensely on the exact timing of the Fed’s first interest rate hike, but the significance of that milestone isn’t as great as one might think. The first move, in my view, is not nearly as important as the slope of subsequent rate increases. I expect that slope to be shallow, with very slow, measured movements. I am less concerned about the first rate hike and more focused on the second, third, fourth and fifth.”
David Hoag, Portfolio Manager
Lower for Longer: Expect a Slower Path to Higher Interest RatesMuted Inflation and Slowing Global Economic Growth Should Keep a Lid on Rates
The Fed has raised rates, but deflationary pressures suggest modest increases going forward
• U.S. interest rates may continue to rise in 2016 as the Federal Reserve seeks to normalize monetary policy amid a modestly growing economy. However, the key question facing Fed officials is how far they can go given mixed economic conditions in the U.S. and financial pressures abroad. Many are questioning whether the U.S. economy is strong enough to absorb a meaningful rise.
• Deflationary pressures from abroad and a strong dollar are factors that should prompt the central bank to move slower than expected. Many of our
portfolio managers expect U.S. rates to remain suppressed for years as the Fed proceeds with caution.
• The past two years offered evidence of this trend. As Fed officials have repeat-edly voiced their desire to raise rates, the yield on the benchmark 10-year Treasury bond actually declined by nearly a full percentage point as of September 30. Many factors contributed to that decline, including strong demand for Treasury bonds, falling oil prices and the unprecedented expansion of quanti-tative easing around the world.
U.S. GDP proceeds at
modest pace
2.8%5.0%Impressive
drop in unemploy-
ment
U.S. core inflation
remains low
1.9%
China’s GDP growth rate continues
to slide
–0.5%
ECB benchmark
interestrate
0.05%Forces exerting
upward pressure on rates
Forces exerting downward pressure on rates
Quantitative easing has gone global. Although the Fed halted its bond-buying program in 2014, the Euro-pean Central Bank launched a new QE initiative in March, to the tune of €60 billion a month. The Bank of Japan has been purchasing ¥6 trillion to ¥8 trillion of assets each month. With bond yields in Germany and Japan below 1%, interest rates both globally and in the U.S. are essentially anchored lower by the weight of monetary stimulus.
Source: Thomson Reuters Datastream, IMF.U.S. unemployment as of November 30, 2015. U.S. job growth: Period measured covers 12 months ended November 30, 2015. Core inflation: Period measured covers 12 months ended October 31, 2015. Core inflation, which excludes volatile food and energy prices, calculated monthly as part of the Personal Consumption Index (PCE). U.S. gross domestic product (GDP) represents International Monetary Fund estimate for 2016. China’s change in GDP growth rate represents percentage point change in GDP growth from 2015 to 2016, using International Monetary Fund estimates. ECB benchmark interest rate as of November 30, 2015.

2016 Outlook January 2016 | 9
“With default rates that are low in historical terms and relatively stable credit fundamentals, municipal bonds are, in my view, generally among the more attractive investment opportunities. Even so, it’s crucial to develop a deep understanding of what you are investing in — bond-by-bond, issuer-by-issuer research can add value.”
Karl Zeile, Portfolio Manager
Show Me the Munis!Yields Appear Attractive Given Potential Tax Advantages, but That’s Only Half the Story
Attractive yields are on offer, but research is vital — this is not your father’s muni market
• How attractive are muni bond valua-tions? Very. With ratios — a measure of the relative “size” of before-tax muni yields compared to similarly rated corporates or Treasuries — high, many investors are taking a closer look at munis. Depending on an investor’s net tax burden, investment-grade (rated BBB/Baa and above) munis have recently offered after-tax yields that are comparable to those of similarly rated corporate bonds, while lower rated munis have consistently offered a substantial yield advantage.
• But there’s more to the story. In addi-tion to offering steady income potential, municipal bonds have tended to offer a great source of diversification. For instance, investment-grade (rated BBB/Baa and above) and, to a lesser degree, high-yield (rated BB/Ba and below) munis showed a low correlation to U.S. stocks over the 10-year period ended September 30, 2015. In other words, an investment in munis may help smooth out the overall volatility of stock-heavy portfolios.
Sustainable income
Puerto Rico’s recent financial woes have underscored that, when invest-ing in munis, credit research is crucial. Arguably, revenue bonds are the part of the market where research-driven active investors can potentially add the most value. Even better, revenue bonds — which are backed by specific revenue streams from various things such as toll roads and airports — typi-cally offer higher yields than general obligation bonds issued by states and local governments.
Yields (as of 11/30/15) 6.8%Munis (rated BB/Ba and below)
3.2%Munis (rated BBB)
2.2%10-year U.S. Treasuries
200%
150
100
50
0
Dec 2012 Jun 2013 Dec 2013 Jun 2014 Dec 2014 Jun 2015 Oct 2015
Relative to 10-year U.S. TreasuriesRelative to below-investment-grade corporates (rated BB/Ba and below)Relative to investment-grade corporates (rated BBB/Baa and above)
Ratio of Muni Yields to Corporate and Treasury Yields
Note: >100% means that munis are outyielding comparable taxable bonds — even without accounting for potential tax advantages.
Sources: Barclays Research, FactSet Research Systems, Capital Group.
As of November 30, 2015. Muni yields are from Barclays Research, and are before-tax. Ratios, expressed as percentages, of yield-to-worst of Barclays Municipal Bond Index compared to Barclays U.S. Corporate Investment Grade Index, Barclays 10-Year Municipal Bond Index compared to 10-Year U.S. Treasury yields, and Barclays Municipal High Yield Index compared to Barclays Corporate High Yield Index, for the period December 31, 2012, to November 30, 2015.
Lit.
No.
MFC
PBR-
060-
0116
P L
itho
in U
SA
CG
D/C
G/8
260-
S520
89
© 2
016
Am
eric
an F
und
s D
istr
ibut
ors
, Inc
. Pr
inte
d o
n re
cycl
ed p
aper
Investors should carefully consider investment objectives, risks, charges and expenses. This and other important information is contained in the fund prospectuses and summary prospectuses, which can be obtained from a financial professional and should be read carefully before investing. Investing outside the United States involves risks such as currency fluctuations, periods of illiquidity and price volatility, as more fully described in fund prospectuses. These risks may be heightened in connection with investments in developing countries. The return of principal for bond funds and for funds with significant underlying bond holdings is not guaranteed. Fund shares are subject to the same interest rate, inflation and credit risks associated with underlying bond holdings. Bond prices and a bond fund’s share price will generally move in the opposite direction of interest rates. For tax-exempt bond funds, income may be subject to state or local income taxes. Income may also be subject to the federal alternative minimum tax (except for The Tax-Exempt Bond Fund of America). Certain other income, as well as capital gain distributions, may be taxable. Bond ratings, which typically range from AAA/Aaa (highest) to D (lowest), are assigned by credit rating agencies such as Standard & Poor’s, Moody’s and/or Fitch, as an indication of an issuer’s creditworthiness. Market indexes are unmanaged and, therefore, have no expenses. Investors cannot invest directly in an index.The statements in 2016 Outlook are the opinions and beliefs of the speaker expressed when the commentary was made and are not intended to represent that person’s opinions and beliefs at any other time.
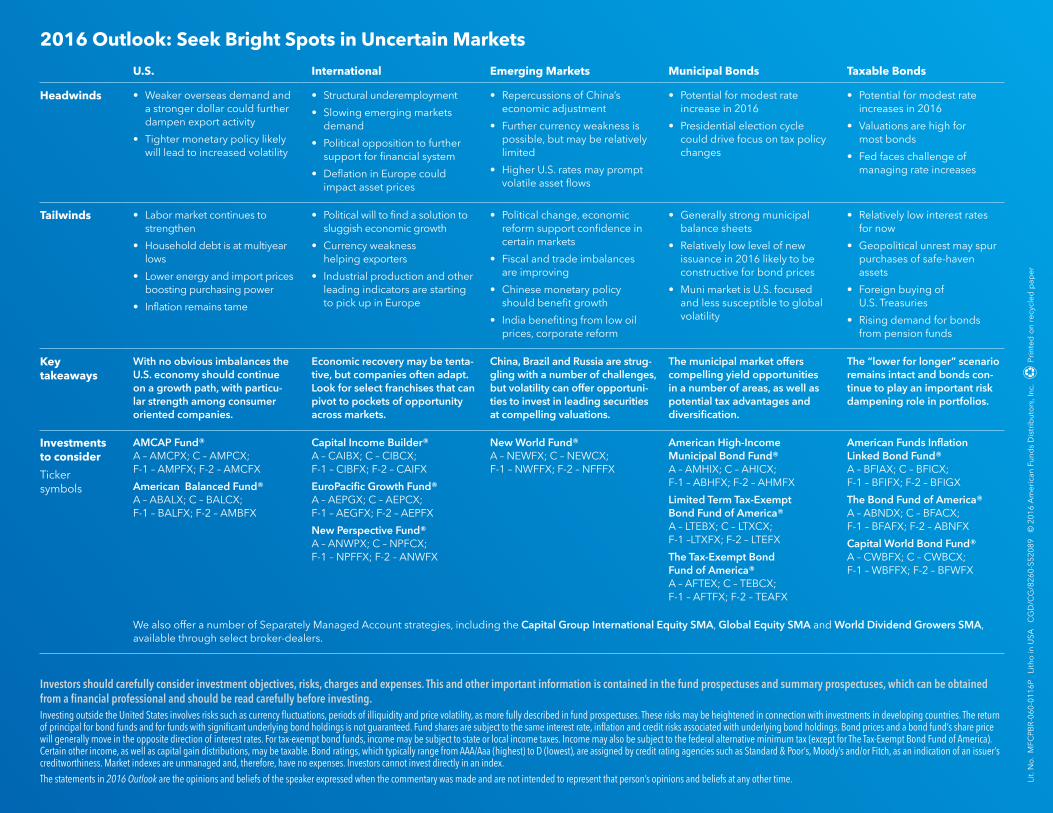
U.S. International Emerging Markets Municipal Bonds Taxable Bonds
Headwinds • Weaker overseas demand and a stronger dollar could further dampen export activity
• Tighter monetary policy likely will lead to increased volatility
• Structural underemployment
• Slowing emerging markets demand
• Political opposition to further support for financial system
• Deflation in Europe could impact asset prices
• Repercussions of China’s economic adjustment
• Further currency weakness is possible, but may be relatively limited
• Higher U.S. rates may prompt volatile asset flows
• Potential for modest rate increase in 2016
• Presidential election cycle could drive focus on tax policy changes
• Potential for modest rate increases in 2016
• Valuations are high for most bonds
• Fed faces challenge of managing rate increases
Tailwinds • Labor market continues to strengthen
• Household debt is at multiyear lows
• Lower energy and import prices boosting purchasing power
• Inflation remains tame
• Political will to find a solution to sluggish economic growth
• Currency weakness helping exporters
• Industrial production and other leading indicators are starting to pick up in Europe
• Political change, economic reform support confidence in certain markets
• Fiscal and trade imbalances are improving
• Chinese monetary policy should benefit growth
• India benefiting from low oil prices, corporate reform
• Generally strong municipal balance sheets
• Relatively low level of new issuance in 2016 likely to be constructive for bond prices
• Muni market is U.S. focused and less susceptible to global volatility
• Relatively low interest rates for now
• Geopolitical unrest may spur purchases of safe-haven assets
• Foreign buying of U.S. Treasuries
• Rising demand for bonds from pension funds
Key takeaways
With no obvious imbalances the U.S. economy should continue on a growth path, with particu-lar strength among consumer oriented companies.
Economic recovery may be tenta-tive, but companies often adapt. Look for select franchises that can pivot to pockets of opportunity across markets.
China, Brazil and Russia are strug-gling with a number of challenges, but volatility can offer opportuni-ties to invest in leading securities at compelling valuations.
The municipal market offers compelling yield opportunities in a number of areas, as well as potential tax advantages and diversification.
The “lower for longer” scenario remains intact and bonds con-tinue to play an important risk dampening role in portfolios.
Investments to consider
Ticker symbols
AMCAP Fund®A – AMCPX; C – AMPCX; F-1 – AMPFX; F-2 – AMCFX
American Balanced Fund®A – ABALX; C – BALCX; F-1 – BALFX; F-2 – AMBFX
Capital Income Builder®A – CAIBX; C – CIBCX; F-1 – CIBFX; F-2 – CAIFX
EuroPacific Growth Fund®A – AEPGX; C – AEPCX; F-1 – AEGFX; F-2 – AEPFX
New Perspective Fund®A – ANWPX; C – NPFCX; F-1 – NPFFX; F-2 – ANWFX
New World Fund®A – NEWFX; C – NEWCX; F-1 – NWFFX; F-2 – NFFFX
American High-Income Municipal Bond Fund® A – AMHIX; C – AHICX; F-1 – ABHFX; F-2 – AHMFX
Limited Term Tax-Exempt Bond Fund of America® A – LTEBX; C – LTXCX; F-1 –LTXFX; F-2 – LTEFX
The Tax-Exempt Bond Fund of America® A – AFTEX; C – TEBCX; F-1 – AFTFX; F-2 – TEAFX
American Funds Inflation Linked Bond Fund® A – BFIAX; C – BFICX; F-1 – BFIFX; F-2 – BFIGX
The Bond Fund of America® A – ABNDX; C – BFACX; F-1 – BFAFX; F-2 – ABNFX
Capital World Bond Fund® A – CWBFX; C – CWBCX; F-1 – WBFFX; F-2 – BFWFX
We also offer a number of Separately Managed Account strategies, including the Capital Group International Equity SMA, Global Equity SMA and World Dividend Growers SMA, available through select broker-dealers.
2016 Outlook: Seek Bright Spots in Uncertain Markets


![2018 Physics National 5 Finalised Marking Instructions222148]2018_NAT_5...marking instructions, and you are uncertain how to assess it, you should seek guidance from your team leader](https://img.pdfslide.us/doc/110x75/60a639644a16bd4127345ed9/2018-physics-national-5-finalised-marking-instructions-2221482018nat5-marking.jpg)