Embed Size (px)
Citation preview
Christof Rühl, Group Chief Economist
January 2013
© BP 2013
Tight oil and shale gas: global implications
Global energy trends
- Characteristics
- Implications
Energy Outlook 2030
© BP 2013
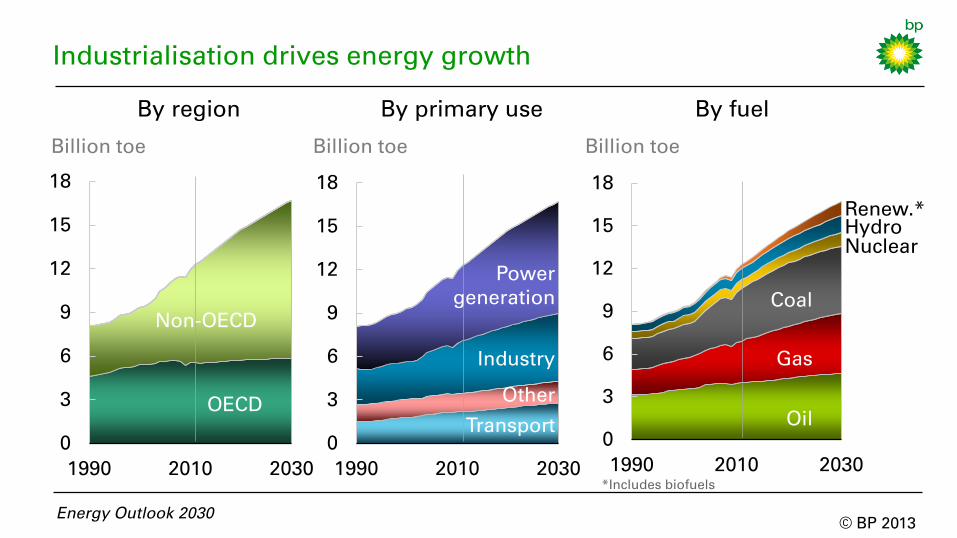
Industrialisation drives energy growth
OECD
Non-OECD
Billion toe
Energy Outlook 2030
0
3
6
9
12
15
18
1990 2010 2030
OECD
Non-OECD
0
3
6
9
12
15
18
1990 2010 2030
Other
Power
generation
Transport
By primary use By fuel By region
Oil
Coal
Gas
Billion toe Billion toe
Industry
0
3
6
9
12
15
18
1990 2010 2030
Hydro
Nuclear
Renew.*
Oil
Coal
Gas
*Includes biofuels
© BP 2013
Energy Outlook 2030
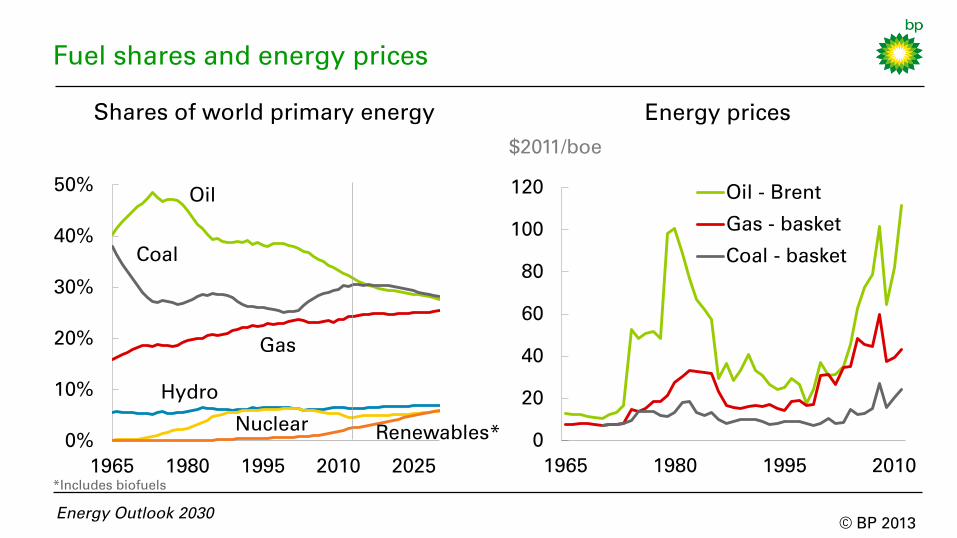
Shares of world primary energy
0%
10%
20%
30%
40%
50%
1965 1980 1995 2010 2025
Oil
Coal
Gas
Hydro
Nuclear Renewables*
*Includes biofuels
Fuel shares and energy prices
0
20
40
60
80
100
120
1965 1980 1995 2010
Oil - Brent
Gas - basket
Coal - basket
Energy prices
$2011/boe
© BP 2013
Energy Outlook 2030
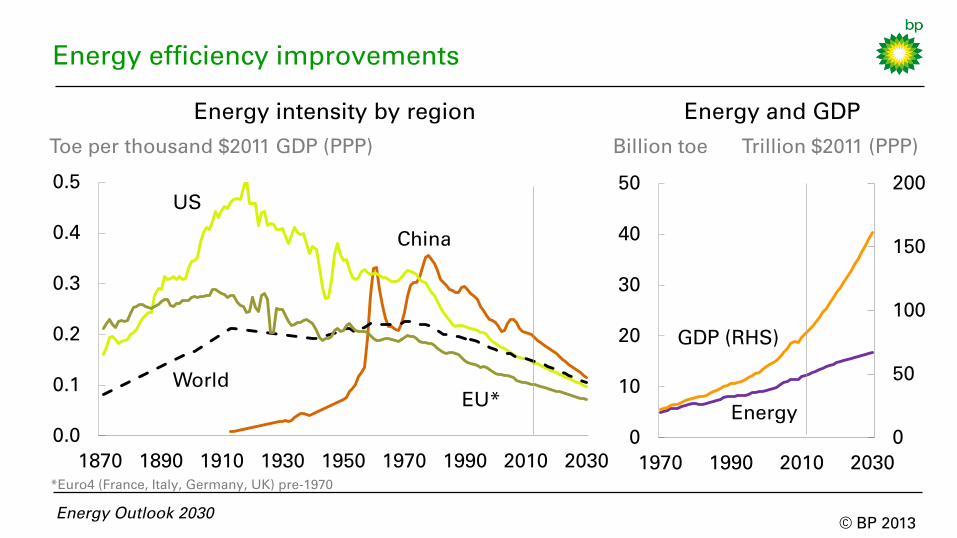
0.0
0.1
0.2
0.3
0.4
0.5
1870 1890 1910 1930 1950 1970 1990 2010 2030
Energy intensity by region
Toe per thousand $2011 GDP (PPP)
China
US
World
EU*
0
50
100
150
200
0
10
20
30
40
50
1970 1990 2010 2030
GDP (RHS)
Energy
Energy and GDP
Billion toe Trillion $2011 (PPP)
Energy efficiency improvements
*Euro4 (France, Italy, Germany, UK) pre-1970
© BP 2013
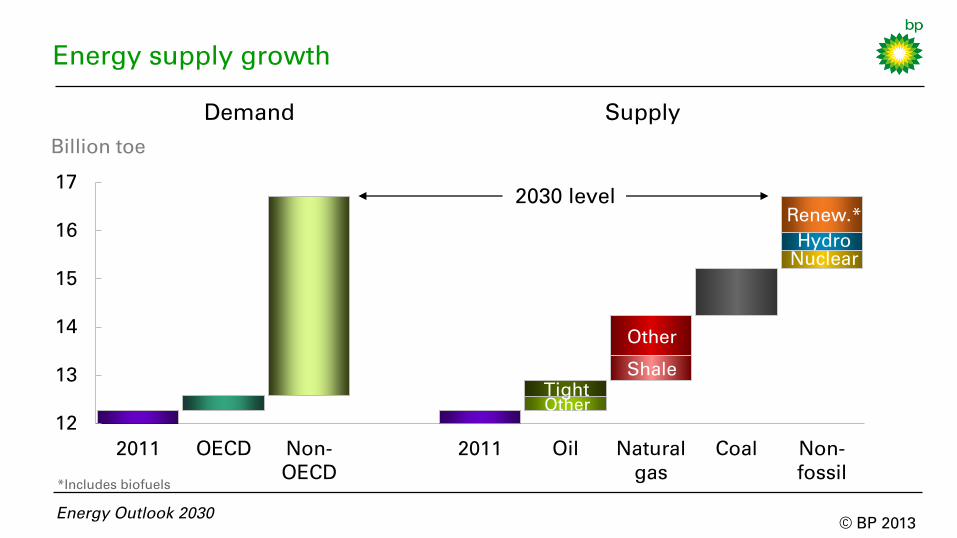
Energy supply growth
12
13
14
15
16
17
2011 OECD Non-
OECD
2011 Oil Natural
gas
Coal Non-
fossil
Demand Supply
Energy Outlook 2030
Tight
Other
Shale
Other
Nuclear
Hydro
Renew.*
Billion toe
2030 level
*Includes biofuels
© BP 2013
Tight oil and shale gas: global implications
Global energy trends
- Characteristics
- Implications
Energy Outlook 2030
© BP 2013
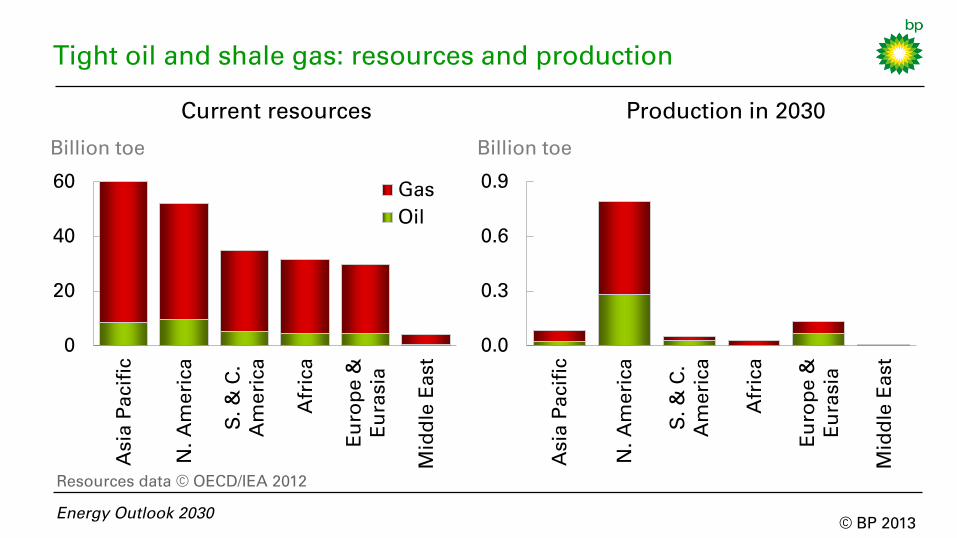
0
20
40
60
Asia P
acific
N. A
me
rica
S. &
C
.
Am
erica
Africa
Eu
ro
pe
&
Eu
ra
sia
Mid
dle
E
ast
Gas
Oil
Tight oil and shale gas: resources and production
Billion toe
Current resources Production in 2030
Energy Outlook 2030
0.0
0.3
0.6
0.9
Asia P
acific
N. A
me
rica
S. &
C
.
Am
erica
Africa
Eu
ro
pe
&
Eu
ra
sia
Mid
dle
E
ast
Billion toe
Resources data © OECD/IEA 2012
© BP 2013
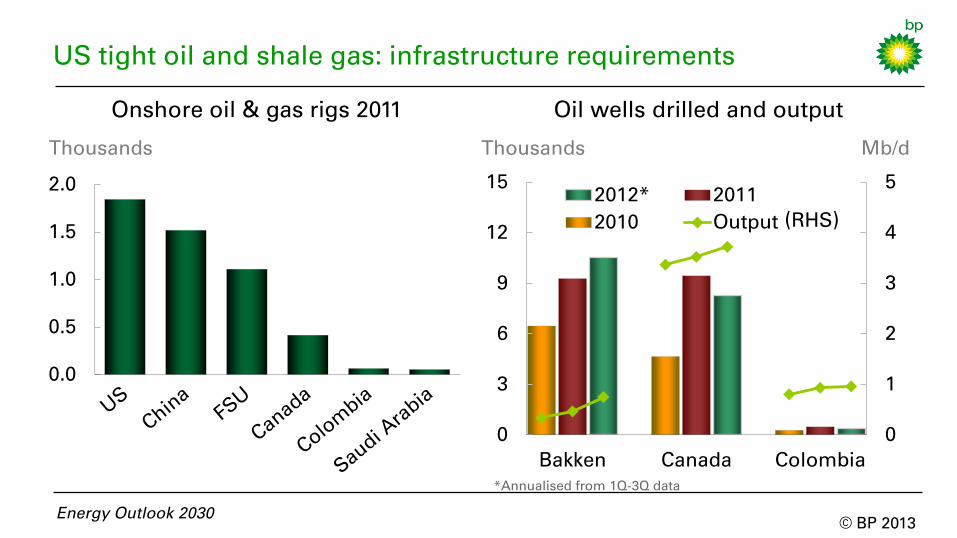
US tight oil and shale gas: infrastructure requirements
Onshore oil & gas rigs 2011
Thousands
Oil wells drilled and output
0
1
2
3
4
5
0
3
6
9
12
15
Bakken Canada Colombia
2012* 2011
2010 Output
Mb/d
Energy Outlook 2030
(RHS)
0.0
0.5
1.0
1.5
2.0
Thousands
*Annualised from 1Q-3Q data

© BP 2013
0%
2%
4%
6%
8%
10%
0
2
4
6
8
10
2000 2010 2020 2030
China
Russia
S. America
N. America
Liquids supply by type
30%
45%
0
15
30
45
60
75
90
105
1990 2000 2010 2020 2030
OPEC NGLs
OPEC crude
Biofuels
Oil sands
Tight oil
Other non-OPEC
Mb/d
NGLs
OPEC share (RHS)
Global supply growth and tight oil
Energy Outlook 2030
Tight oil output
% of total
(RHS)
Mb/d

© BP 2013
Global supply growth and shale gas
Energy Outlook 2030
Bcf/d
Gas production by type and region
0
100
200
300
400
500
1990 2000 2010 2020 2030
Non-OECD other
Non-OECD shale
OECD shale
OECD other
0%
6%
12%
18%
0
20
40
60
80
1990 2000 2010 2020 2030
RoW
China
Europe & Eurasia
Canada & Mexico
US
Shale gas production
Bcf/d
% of total (RHS)

© BP 2013
Tight oil and shale gas uncertainties
Share of global supply
growth
0
2
4
6
8
10
2010 2020 2030
Range
BP
Range of tight oil forecasts
(excludes NGLs)
Mb/d
Energy Outlook 2030
0%
25%
50%
75%
2000-10 2010-20 2020-30
Shale gas
Tight oil
0
20
40
60
80
100
120
2010 2020 2030
Range
BP
Bcf/d
Range of shale gas
forecasts

© BP 2013
Tight oil and shale gas: global implications
Global energy trends
- Characteristics
- Implications
Energy Outlook 2030
© BP 2013
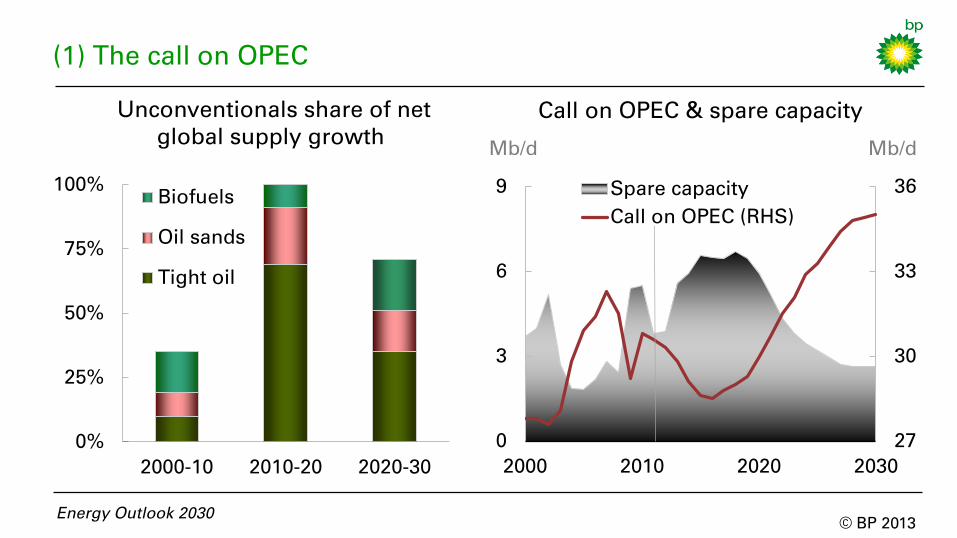
27
30
33
36
0
3
6
9
2000 2010 2020 2030
Spare capacity
Call on OPEC (RHS)
(1) The call on OPEC
Mb/d
Call on OPEC & spare capacity
Mb/d
Unconventionals share of net
global supply growth
0%
25%
50%
75%
100%
2000-10 2010-20 2020-30
Biofuels
Oil sands
Tight oil
Energy Outlook 2030

© BP 2013
0%
50%
(2) Oil and gas: reserves and production
2011 reserves
2030 output
% share of global total
Key:
Europe
N. America
S. & C. America Africa
Middle East
FSU
Asia Pacific
Energy Outlook 2030
Net exporters 2011
Net importers 2011
© BP 2013
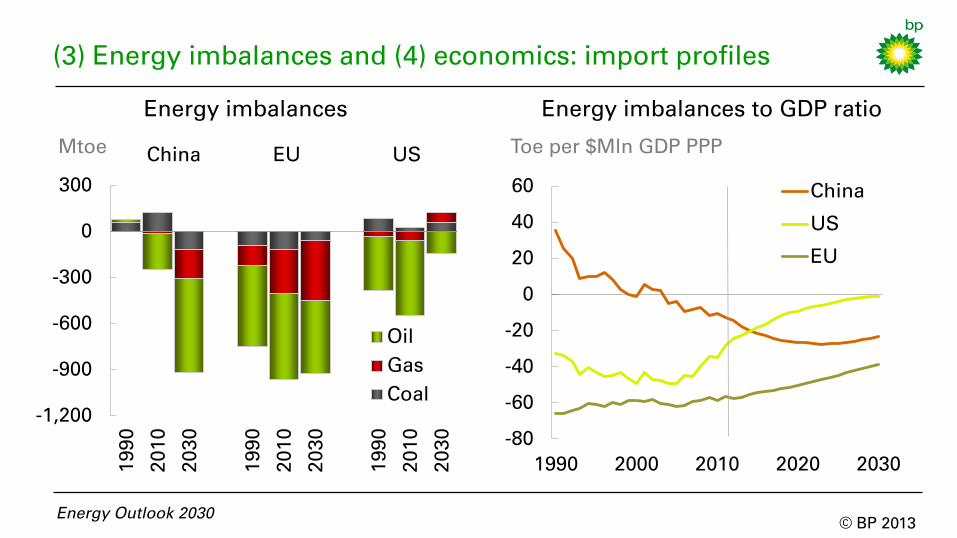
-80
-60
-40
-20
0
20
40
60
1990 2000 2010 2020 2030
China
US
EU
Energy imbalances to GDP ratio
Energy Outlook 2030
Energy imbalances
China EU US
-1,200
-900
-600
-300
0
300
199
0
201
0
203
0
199
0
201
0
203
0
199
0
201
0
203
0
Oil
Gas
Coal
Mtoe Toe per $Mln GDP PPP
(3) Energy imbalances and (4) economics: import profiles
© BP 2013
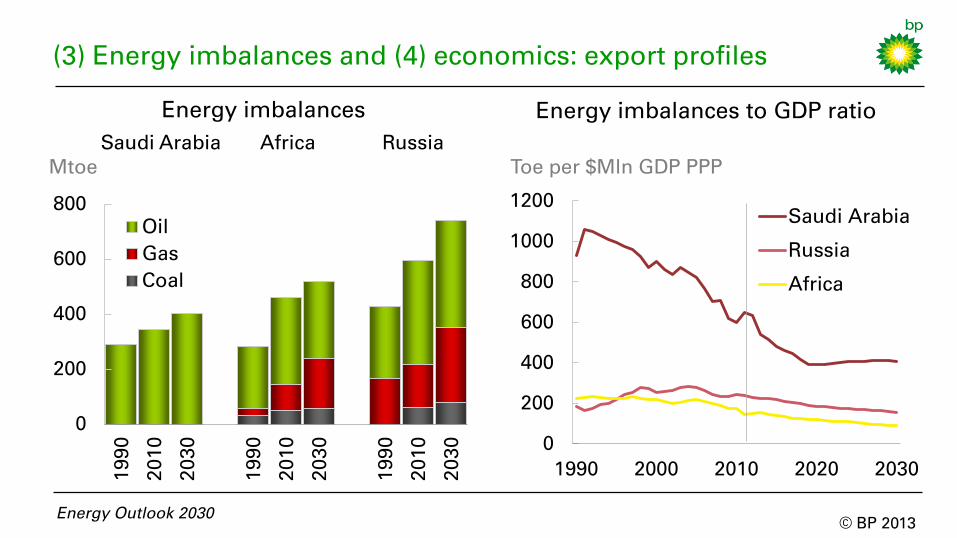
0
200
400
600
800
1000
1200
1990 2000 2010 2020 2030
Saudi Arabia
Russia
Africa
Energy imbalances to GDP ratio
Energy Outlook 2030
Energy imbalances
Saudi Arabia Africa Russia
0
200
400
600
800
199
0
201
0
203
0
199
0
201
0
203
0
199
0
201
0
203
0
Oil
Gas
Coal
Mtoe Toe per $Mln GDP PPP
(3) Energy imbalances and (4) economics: export profiles
© BP 2013
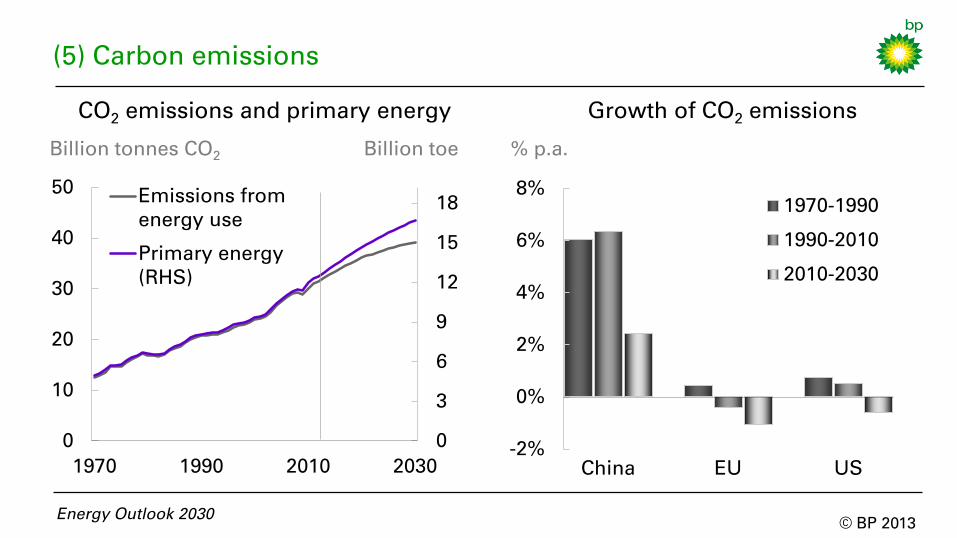
Oil
Gas
CO2 emissions and primary energy
Billion tonnes CO2
Energy Outlook 2030
Growth of CO2 emissions
% p.a.
0
3
6
9
12
15
18
0
10
20
30
40
50
1970 1990 2010 2030
Emissions from
energy use
Primary energy
(RHS)
Billion toe
-2%
0%
2%
4%
6%
8%
China EU US
1970-1990
1990-2010
2010-2030
(5) Carbon emissions
© BP 2013
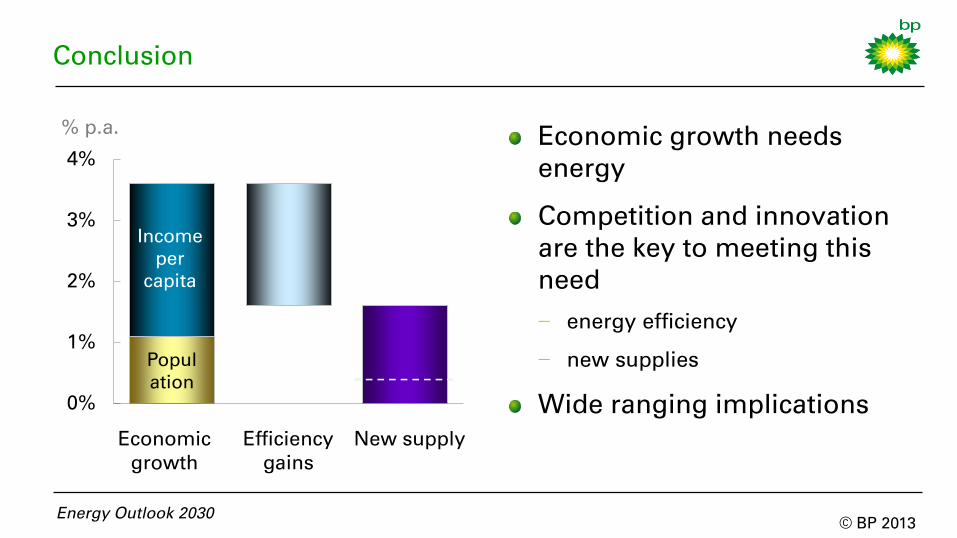
Conclusion
0%
1%
2%
3%
4%
Popul
ation
Income
per
capita
Economic
growth
Efficiency
gains
New supply
% p.a. Economic growth needs
energy
Competition and innovation
are the key to meeting this
need
− energy efficiency
− new supplies
Wide ranging implications
Energy Outlook 2030
January 2013
© BP 2013
Energy Outlook 2030
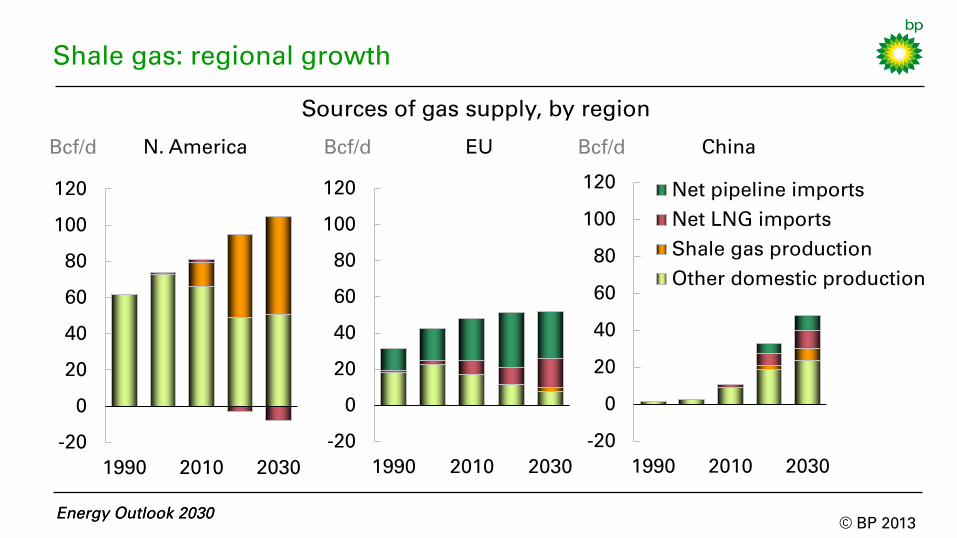
-20
0
20
40
60
80
100
120
1990 2010 2030
Net pipeline imports
Net LNG imports
Shale gas production
Other domestic production
Energy Outlook 2030
Shale gas: regional growth
Bcf/d China Bcf/d N. America Bcf/d EU
Sources of gas supply, by region
-20
0
20
40
60
80
100
120
1990 2010 2030
-20
0
20
40
60
80
100
120
1990 2010 2030
© BP 2013
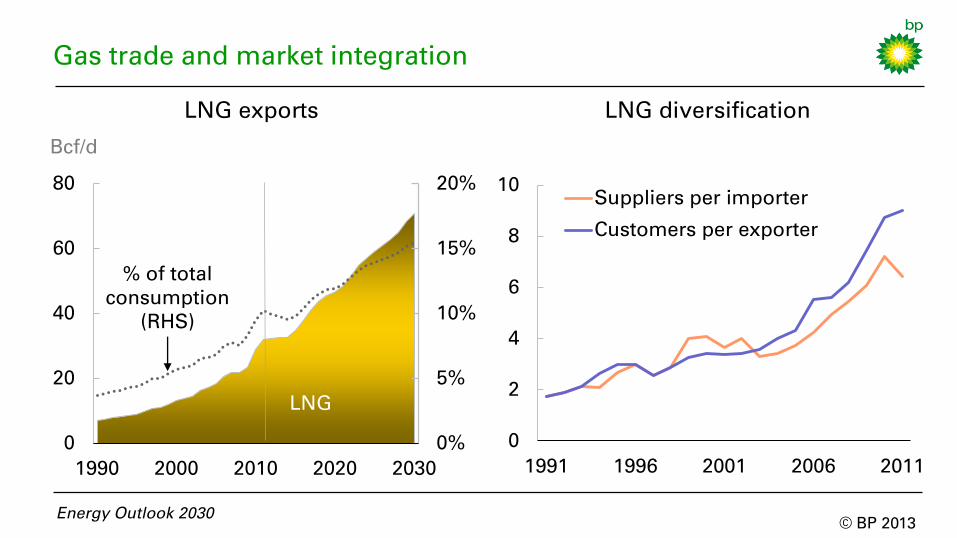
Gas trade and market integration
Energy Outlook 2030
0%
5%
10%
15%
20%
0
20
40
60
80
1990 2000 2010 2020 2030
LNG
Bcf/d
LNG exports
% of total
consumption
(RHS)
LNG diversification
0
2
4
6
8
10
1991 1996 2001 2006 2011
Suppliers per importer
Customers per exporter