Embed Size (px)
Citation preview
891012345678910123456789134567a910123456789101234567891012345678910123456789101234567891012345678910456789101234567891012345623456789101234567891012347891012345678910123456789123456789 10 123456789 10 125a789101234567891012345678910123456789101234567891345678910123456a891012345678910123456789101234567891012345678910123456a78910456789101234567891012345623456789101234567891012347891012345678910123456789123a56789 10 123456789 10 125678910123456789101234567
SIX DISRUPTIVE DEMOGRAPHIC TRENDS:
WHAT CENSUS 2010 WILL REVEAL
J ame s H. J ohn son , J r. a nd J ohn D. Ka sa rda
F RA N K H AW K INS K ENA N INSTIT U T E OF PRI VAT E EN T ERPR ISE
Kenan -F l a g l e r B u s in e s s S c h o o l
TH E U N I V ERSIT Y OF NORTH CA ROLINA AT CH A PEL H I LL
Janua r y 2011

891012345678910123456789134567a910123456789101234567891012345678910123456789101234567891012345678910456789101234567891012345623456789101234567891012347891012345678910123456789123456789 10 123456789 10 125a789101234567891012345678910123456789101234567891345678910123456a891012345678910123456789101234567891012345678910123456a78910456789101234567891012345623456789101234567891012347891012345678910123456789123a56789 10 123456789 10 125678910123456789101234567
TRENDS
Copyright © 2011 by James H. Johnson, Jr., and John D. Kasarda, Frank Hawkins Kenan Institute of Private Enterprise.
This report is available for download at www.kenaninstitute.unc.edu/2010CensusTrends
TRENDS
On December 21, 2010, the U.S. Census Bureau
announced the results of Census 2010—the resident population of
the United States is now 308,745,538. As additional data from
the Census 2010 are released over the next several years, we expect
six disruptive demographic trends of the first decade of the new
millennium to be confirmed. This report discusses the impacts of
these emergent trends on U.S. consumer markets and workplaces
as well as challenges they pose for the nation’s future competitiveness
in the global marketplace.
— James H. Johnson, Jr. & John D. Kasarda

S i x D i s r u p t i v e D e m o g r a p h i c Tr e n d s : W h a t C e n s u s 2 0 1 0 W i l l R e v e a l
INTRODUCTION
P a g e 1
policy analysts, and a broad array of interest groups anxiously await the release of this data.
Meanwhile, clues already exist regarding the nature, magnitude, and direction of the major demographic shifts of the past decade. We see six clear trends that Census 2010 will likely confirm with hard and reliable data.
In this report, we describe these emergent trends and discuss their implications for business, consumer markets, and the nation’s competitiveness in the global marketplace via analyses of intercensal statistics and reviews of scholarly demographic research. Because the specific population shifts discussed here will dramatically transform all of the nation’s social, economic, and political institutions, we refer to them collectively as disruptive demographic trends—borrowing and broadening the application of a term coined by Massachusetts Institute of Technology Professor Joseph Coughlin.1
INTRODUCTION
By all indications, Census 2010 went off without a hitch. Nearly three fourths of U.S. households reportedly returned their completed questionnaires on or before April 1—the official census day—roughly the same percentage as for Census 2000 (Williams, 2010). Field operations to collect data from non-responders to the mail questionnaire and internal evaluations of the quality of the data were completed by mid-October 2010. Most of the local census offices opened to facilitate the count reportedly were closed by mid-November 2010.
Tallies of the total population by state—the so-called “apportionment file”—were sent to the president in December. These data will be used to “determine how many representatives each state will have in the 113th Congress that will be elected in November 2012” (Estersohn, 2010). Detailed Census 2010 data for the U.S. population, disaggregated by detailed demographic characteristics and at various geographical levels, will be released over the next two years (PRB, 2010). Needless to say, academic and market researchers as well as politicians,
1 Information on Professor Coughlin’s disruptive demographics laboratory at
MIT is available at www.disruptivedemographics.com/2010/02/blended-
futures-of-aging-business.html.

DISRUPTIVE TRENDSDISRUPTIVE DEMOGRAPHIC TRENDS
S i x D i s r u p t i v e D e m o g r a p h i c Tr e n d s : W h a t C e n s u s 2 0 1 0 W i l l R e v e a l
P a g e 2
In part, as a function of this massive influx of migrants and partly due to high fertility rates among some of the newcomers (e.g., Hispanics have a total fertility rate of 2.9 versus a rate of 1.9 for non-Hispanic whites), the South’s population increased by 12.7 percent between 2000 and 2009—almost four percentage points higher than the national rate of growth (8.8 percent). During this period, the South experienced an estimated absolute population gain of 12.7 million—roughly 4 million more than the West, the region experiencing the second-largest absolute population gain. The Northeast and Midwest, as shown in Table 3, grew by only 3.0 percent and 3.6 percent, respectively, between 2000 and 2009.
It is a near certainty that Census 2010 will confirm that the geographical center of the U.S. population continued to shift from the Northeast and Midwest to the West and especially the South during the first decade of the new millennium (Kedrosky, 2010). In the upcoming reapportionment process, the South and the West will gain seats while the Northeast and the Midwest will lose seats in the U.S. House of Representatives (Wikimedia Foundation, Inc., 2010).2
The “Browning” of AmericaUndergirding the rapid geographical redistribution of
the U.S. population are dramatic changes in the complexion of U.S. society, driven by immigration and rapid non-white
Our foreshadowing of the demographic trends we see on the Census 2010 horizon is based on two sources of information: intercensal demographic and economic statistics compiled by the Census Bureau, the Bureau of Labor Statistics (BLS), the Internal Revenue Service, and other government agencies; and scholarly demographic research based on data extracted from these and other sources over the past decade. In discussing each trend, we draw on relevant data from published sources and prior research as appropriate.
The South Has Risen—AgainBetween 2000 and 2009, the U.S. population increased
by an estimated 24.8 million. Slightly more than half (51.4 percent) of this growth was concentrated in the South. The West was a distant second, capturing roughly one third of the nation’s net growth during this period. Continuing a near quarter-century-long trend, the Northeast and Midwest both experienced slow population growth between 2000 and 2009, capturing only 6.5 percent and 9.4 percent of net population growth, respectively (Table 1).
Migration has played a major role in the South’s capture of the lion’s share of U.S. net population growth since 2000. Experiencing an estimated net inflow of 2.3 million migrants between 2000 and 2008, the South was the preferred destination for movers in nearly all of the major demographic groups, including blacks, Hispanics, the elderly, and the foreign born (Table 2). No other region of the United States was a net migration magnet for all of these groups. In fact, the Northeast was a net exporter of people from all four of these groups (that is, out migration was greater than in migration for each of these groups), the Midwest was a net exporter of people in three out of the four groups, and the West was a net exporter of people in two out of the four groups.
2 Eight states are projected to gain seats in the U.S. House of Representatives:
five are southern states (Arizona, Florida, Georgia, South Carolina, and Texas)
and three are western states (Nevada, Utah, and Washington). Ten states are
projected to lose seats: four are in the Northeast (Massachusetts, New Jersey, New
York, and Pennsylvania) and five are in the Midwest (Illinois, Iowa, Michigan,
Minnesota, and Ohio). Only one of the states projected to lose one or more seats
is in the South (Louisiana) (Wikimedia Foundation, Inc., 2010).

S i x D i s r u p t i v e D e m o g r a p h i c Tr e n d s : W h a t C e n s u s 2 0 1 0 W i l l R e v e a l
P a g e 3
Table 1
SHARES OF NET POPULATION GROWTH BY REGION, 2000-2009
Region Absolute Population Change, 2000-2009 Percent of Total
United States 24,834,593 100%
Northeast 1,616,173 6.5%
Midwest 2,342,955 9.4%
South 12,757,940 51.4%
West 8,117,525 32.7%
Source: U.S. Census Bureau, Population Division, December 2009
Table 3
U.S. POPULATION CHANGE BY REGION, 2000-2009
Region 2009 Population Change, 2000-2009 Number Percentage
United States 307,006,550 24,834,593 8.8%
Northeast 55,283,679 1,616,173 3.0%
Midwest 66,836,911 2,342,955 3.6%
South 113,317,879 12,757,940 12.7%
West 71,568,879 8,117,525 12.8%
Source: U.S. Census Bureau, Population Division, December 2009
Table 2
NET MIGRATION TRENDS, 2000-2008(in thousands)
Northeast Midwest South West
TOTAL -1,032 -2,008 +2,287 +46
Black -346 -71 +376 +41
Hispanic -292 -109 +520 -117
Elderly -115 +42 +97 -27
Foreign Born -147 -3 +145 +3
Source: U.S. Census Bureau, Current Population Survey, Annual Social and Economic Supplement

S i x D i s r u p t i v e D e m o g r a p h i c Tr e n d s : W h a t C e n s u s 2 0 1 0 W i l l R e v e a l
P a g e 4
Table 4
U.S. NET POPULATION CHANGE ATTRIBUTABLE TO NON-WHITE POPULATION GROWTH, 1970-2009
Years Net Population Change Percent Due to Non-white Population Growth
1970-1980 23,333,879 55%
1980-1990 22,164,068 65%
1990-2000 32,712,033 65%
2000-2009 24,834,539 85%
Source: Gibson and Jung, 2002; U.S. Census Bureau, Population Division, May 2009
Table 5
RELATIVE DISTRIBUTION OF U.S. POPULATION BY RACE/ETHNICITY
Race/Ethnicity 2005 2050
White 67% 47%
Black 12.8% 13%
Hispanic 14% 29%
Asian 5% 9%
Source: Pew Research Center, 2008
Table 6
U.S. POPULATION CHANGE BY RACE & ETHNICITY, 2000-2009
Race 2009 Population Change, 2000-2009 Number Percentage
Total 307,806,550 24,834,539 8.8%
Non-Hispanic 258,587,226 12,057,648 4.9%
White 199,851,240 4,088,448 2.1%
Black 37,681,544 3,276,661 9.5%
American Indian & Alaska Native 2,360,807 256,564 12.2%
Asian 13,686,083 3,233,417 30.9%
Native Hawaiian & Other Pacific Islander 448,510 79,260 21.5%
Two or More Races 4,559,042 1,123,298 32.7%
Hispanic 48,419,324 12,776,945 35.8%
Source: U.S. Census Bureau, Population Division, December 2009

S i x D i s r u p t i v e D e m o g r a p h i c Tr e n d s : W h a t C e n s u s 2 0 1 0 W i l l R e v e a l
P a g e 5
population growth. Elsewhere, we have referred to this shift as the “browning” of America (Johnson, 2006). We believe Census 2010 will confirm that this trend accelerated over the past decade.
Until the mid-1960s, U.S. immigrant admissions were based on a quota system that favored Europeans over Asians, Latin Americans, and other people of color. Discriminatory in both theory and practice, the admissions policy rested on the unfounded premise that assimilation into the American mainstream would be easier for white immigrants from Europe, who were similar in phenotype to Anglo-Saxons, than for non-whites from other regions of the world. In reality, the discriminatory quota system guaranteed that immigration would not upset the nation’s population mix at the time, which was dominated by whites (Johnson, Farrell, and Guinn, 1999).
But U.S. immigration law was amended in 1965, eliminating the discriminatory provisions based on geographic origin and opening up the doors of the country to large numbers of non-white migrants. As a consequence, the United States has experienced heightened immigration from Asia and Latin America and substantially reduced immigration from Europe since the mid-1960s. Combined with modest growth among native-born blacks and declining fertility rates among native-born whites, this shift in the geographical origins of immigrants lies at the root of what we refer to as the “browning” of America.
Over the past forty or so years, non-white groups—Asians, blacks, Hispanics, and people of two or more races—have accounted for the majority of U.S. population growth. During the 1980s and the 1990s, for example, non-whites accounted for 65 percent of net population growth in the United States. Between 2000 and 2009, non-whites accounted for an estimated 85 percent of U.S. net population growth—a statistic Census 2010 is expected to confirm (Table 4).
These trends foreshadow a major color adjustment in the U.S. population—again, what we define here as the
“browning” of America. In 1995, whites constituted 75 percent of the U.S. population. Ten years later, in 2005, the white share of the total population had dropped to 67 percent of the total. By 2009, the non-Hispanic white share of the U.S. population had declined by another 2 percent—representing an estimated 65 percent of the total.
Assuming continued modest levels of immigration, above-replacement-level fertility among non-white ethnic groups, and below-replacement-level fertility among non-Hispanic whites, it is now estimated that the non-Hispanic white share of the U.S. total population will likely fall below 50 percent by 2050 (Table 5). Paralleling the decline in the non-Hispanic white share, the non-white share is projected to increase largely due to rapid growth among Hispanics and Asians combined with modest growth among African Americans. Emblematic of this emerging color adjustment, the Asian, black, and Hispanic populations of the United States increased by an estimated 31 percent, 10 percent, and 36 percent, respectively, while the non-Hispanic white population grew by only 2 percent between 2000 and 2009 (Table 6).
Marrying Out is “In”A significant increase in marriage across racial and
ethnic lines is further contributing to the browning of America. Recent research by the Pew Hispanic Center revealed that the out-marriage rate (i.e., percent of individuals marrying someone of a different race or ethnicity) has doubled since 1980 (Passel, Wang, and Taylor, 2010). Among newly married couples, the out-marriage rate was 14.6 percent in 2008, up from 6.7 percent in 1980. Among currently married couples, the rate increased from 3.2 percent to 8.0 percent during this period (Figure 1). Considering the fact that anti-miscegenation laws, barring intermarriage between blacks and whites, were in force in many states in the United States until 1967, this is a dramatic demographic development.

Figure 3
INTERMARRIAGE TYPES: NEWLY MARRIED COUPLES, 2008
Source: Passel, Wang, and Taylor, 2010
S i x D i s r u p t i v e D e m o g r a p h i c Tr e n d s : W h a t C e n s u s 2 0 1 0 W i l l R e v e a l
P a g e 6
Figure 1
INTERMARRIAGE TREND, 1980-2008: PERCENTAGE MARRIED
TO SOMEONE OF A DIFFERENT RACE/ETHNICITY
15
10
5
0
1980 1990 2000 2010
Source: Passel, Wang, and Taylor, 2010
14.6%NewlyMarried
8.0%CurrentlyMarried7.6%6.7%6.8% 4.5%3.2%
Figure 4
EDUCATION & INTERMARRIAGE: PERCENTAGE OF NEWLYWEDS WHO
MARRIED SOMEONE OF A DIFFERENT RACE/ETHNICITY, 2008
LessthanHighSchool11.0%
HighSchoolGraduate13.5%
AttendedCollege 15.5%
5% 10% 15%
Source: Passel, Wang, and Taylor, 2010
Figure 2
INTERMARRIAGE RATES BY RACE & ETHNICITY: PERCENTAGE OF NEWLYWEDS
MARRIED TO SOMEONE OF A DIFFERENT RACE/ETHNICITY, 2008
30.8%
25.7%
15.5%
8.9%
White Black Hispanic Asian
Source: Passel, Wang, and Taylor, 2010
Hispanic/White
41%
Asian/White
15%
Bothnon-white
16%
Other
17%
Black/White
11%

S i x D i s r u p t i v e D e m o g r a p h i c Tr e n d s : W h a t C e n s u s 2 0 1 0 W i l l R e v e a l
P a g e 7
But the new face of intermarriage in America is not limited to blacks and whites. In fact, the intermarriage rate was higher for Asians (30.8 percent) and Hispanics (25.7 percent) than for either whites (8.9 percent) or blacks (15.5 percent) in 2008 (Figure 2). Emblematic of how out marriage is changing the complexion of U.S. society, the Pew study revealed that 41 percent of all intermarriages in 2008 were between Hispanics and whites, 15 percent were between Asians and whites, and 11 percent were between blacks and whites. Both parties were non-white in 16 percent of the intermarriages in 2008. Other types of intermarriage accounted for 17 percent of the total (Figure 3).
Across these groups, intermarriage is correlated with the level of school completed. In 2008, the rates were highest for newlyweds who had attended college (15.5 percent). Newlyweds who were high school graduates had the second-highest rate (13.5 percent). Newlyweds with less than a high school education had the lowest rate (11.0 percent) (Figure 4).
Census statistics pertaining to the population self-identifying as members of two or more races is in part a reflection of these intermarriage trends and constitute further evidence of how the complexion of U.S. society is changing. Between 2000 and 2009, the U.S. population self-identifying as members of two or more races increased by 1.1 million to an estimated 4.6 million in 2009—4.5 percent
of the total population (Table 6). Percentage-wise, this increase (32.7 percent) is second only to the relative growth of the nation’s Hispanic population (35.8 percent).
The Silver Tsunami is About to HitAt the same time that the U.S. population is shifting
geographically and immigration and intermarriage are changing the population mix, our nation is also aging, especially the native-born population. The “graying” of America, as we have referred to this trend, is driven in part by changes in personal behavior—some people are living healthier and more active lives—and by major health care advances that have improved longevity—the average 65-year-old today will live nearly 20 more years.
But the main driver is the “aging out” of the so-called post-World War II baby-boomer population—the huge cohort born between 1946 and 1964. According to census estimates, this cohort totaled 79.3 million in 2009—leading to an increase of nearly 17 million of those aged 45 to 64 since 2000. In both absolute and relative terms, those aged 45 to 64 expanded more rapidly than any other age category between 2000 and 2009 (Table 7).
On January 1, 2011, the first baby boomer born in America turned 65 and set into motion what we refer to as the “silver tsunami.” As the 79 million baby boomers exit the U.S. workforce over the next 20 years, many will
Table 7
U.S. POPULATION CHANGE BY AGE, 2000-2009
Age 2009 Absolute Change, 2000-2009 Percentage Change, 2000-2009
<25 104,960,250 5,258,492 5.3%
25-44 84,096,278 -1,898,345 -2.2%
45-64 79,379,439 16,977,567 27.2%
65+ 39,570,590 4,496,886 12.8%
Total 307,006,550 24,834,593 8.8%
Source: U.S. Census Bureau, Population Division, June 2010

S i x D i s r u p t i v e D e m o g r a p h i c Tr e n d s : W h a t C e n s u s 2 0 1 0 W i l l R e v e a l
P a g e 8
become dependent on Social Security and Medicare. How fast will this aging process occur? Every day over the next five years, an estimated 12,300 people will turn age 50, 11,500 will turn 55, 9,200 will turn 62, and 8,000 will turn 65. Census 2010 will provide us with more precise statistics on the size and distribution of the boomer population and on the population aging process more generally.
The End of Men? Over the past decade, cyclical and structural changes
in the U.S. economy have profoundly affected the employment prospects of American workers, especially
males (Cavanaugh, 2010). Men have been more adversely affected than women, in part, because they are concentrated in economic sectors, such as manufacturing and construction, which have been most vulnerable to automation, foreign competition, and cyclical downturns. Women, on the other hand, are concentrated in economic sectors, such as government (including public education) and health services, which actually grew in the face of the recession (Table 8) and are projected to continue to be among the fastest-growing sectors over the coming decade.
At no point in history have the disparate employment impacts by gender been more apparent. According to BLS,
Table 8
JOBS LOST/GAINED BY GENDER DURING THE 2007 (Q4) – 2009 (Q3) RECESSION
Industry Women Men
Construction -106,000 -1,300,000
Manufacturing -106,000 -1,900,000
Healthcare +451,800 +118,100
Government +176,000 +12,000
Total -1,700,000 -4,700,000
Source: Cauchon, 2009
Table 9
COLLEGE CLASS OF 2010
Degree Male Female Difference
Associate’s 293,000 486,000 193,000
Bachelor’s 702,000 946,000 244,000
Master’s 257,000 391,000 134,000
Professional 46,800 46,400 -400
Doctoral 31,500 32,900 1,400
Total 1,330,300 1,902,300 572,000
Source: Perry, 2010

S i x D i s r u p t i v e D e m o g r a p h i c Tr e n d s : W h a t C e n s u s 2 0 1 0 W i l l R e v e a l
P a g e 9
men bore 80 percent of total U.S. job loss between 2007 and 2009, leading some to dub the most recent economic downturn a “man-cession” (Marks, 2010) and others to argue that this may very well signal the “end of men” as the dominant force not only in the U.S. labor market but other aspects of American life as well (Rosin, 2010).
Among other forces, men’s employment prospects have been impacted by their slipping level of educational attainment relative to women. For example, the gender ratio in college admissions has been 60 percent female and 40 percent male for most of the past decade. For the graduating class of 2010, 572,000 more associate’s, bachelor’s, master’s, professional, and doctoral degrees were awarded to women than to men (Table 9). In four-year colleges and universities, for every two males that graduated, three females graduated.
As a result of the above factors, women are close to surpassing men as the numerical majority in the paid U.S. workforce (Figure 5). In 2009, according to BLS, there were 91 million women business owners—about 40 percent of all businesses—in the United States. In addition, women held 43 percent of executive, administrative, and managerial positions in the U.S. economy. As a result, the male-female wage gap is at its narrowest point in history—in large measure because men are doing so poorly in the labor market today (Cauchon, 2010). Some market research even suggests that there is now a reverse gender gap in some cities and metropolitan areas, where women are earning as much as 20 percent more than men (Luscombe, 2010a). In married couple households, women now account for 47 percent of household income. In 2008, as Figure 6 shows, 63.3 percent of mothers were breadwinners or co-breadwinners, up from 27.7 percent in 1967 (The Shriver Report, 2009).
Census 2010 will provide additional insights into the nature and depth of these trends and whether they truly signal Hanna Rosin’s “the end of men” prediction.
Figure 5
FEMALE WORKFORCE REPRESENTATION
50 45
40
35
30
25
20
15
10
5
0 1970 1980 1990 2000 2010
Source: Bureau of Labor Statistics
49.8%
47.4% 48.0%
42.2%
36.8%

Figure 6
THE NEW WORKFORCE: SHARE OF MOTHERS WHO ARE BREADWINNERS OR CO-BREADWINNERS, 1967 TO 2008
Source: The Shriver Report, “A Woman’s Nation Changes Everything,” 2009
Source: Heather Boushey and Jeff Chapman’s analysis of Miriam King, Steven Ruggles, Trent Akexander, Donna Leicach, and Mattherw Sobek. Intergrated Public Use Microdata Series, Current Population Survey: Version 2.0 (Machine-readable database). Minneapolis, MN: Minnesota Population Center (producer and distributor), 2009
Notes: Breadwinner mothers include single mothers who work and married mothers who earn as much or more than their husbands. Co-breadwinners are wives who bring home at least 25 percent of the couples’ earnings, but less than half. The data only includes families with a mother who is between the ages of 18 and 60 and who has children under age 18 living with her.
S i x D i s r u p t i v e D e m o g r a p h i c Tr e n d s : W h a t C e n s u s 2 0 1 0 W i l l R e v e a l
P a g e 1 0
Cooling Water from Grandma’s Well—and Grandpa’s Too!
Paralleling the graying of America and the declining economic status of men in the United States is another disruptive demographic trend: the rapid growth of grandparent-headed households raising grandchildren (Stritof and Stritof, 2010; Smith 2010). A while back, the Williams Brothers, an African American gospel group, produced a popular song, “Cooling Waters from Grandma’s Well,” which epitomizes, in our view, the significance of this trend in American society. The first verse of the song is as follows:
My soul was sinking in a world of sin, but grace and mercy took me in. Took my feet out of the miry clay and placed them on a rock to stay. Oh what a relief it was when God rescued me. He loosed my chains that had me bound and then He set me free. It felt like cooling water…cooling water from grandma’s well.
Structural changes in the U.S. economy have devastated the employment prospects of working-age males, which has reduced the pool of marriageable men (especially in the African American community) and contributed to increasing rates of family dissolution, out-of-wedlock births, and even suicide among the long-term unemployed (Peck, 2010; Rosin, 2010; Lowery, 2010). Grandparents are increasingly providing their grandchildren (and in some instances, the fathers and/or mothers of their grandchildren) with “cooling water” from their reservoirs of knowledge and experience, as well as emotional and financial support (Stritof and Stritof, 2010).
In 1997, 6 percent of U.S. children (3.9 million) lived in a grandparent’s home, up 76 percent from 2.2 million in 1970 (Nolan, 1999). Between 2001 and 2010, the number of children living in grandparent-headed households increased by 26.1 percent (1.0 million) while the number of children living in all U.S. household types increased only
24.0%
Co-breadwinnermothers 39.3%
16.0%Breadwinnermothers
11.7% 1967 1969 1971 1973 1975 1977 1979 1981 1983 1985 1987 1989 1991 19931995 1997 1999 2001 2003 2005 2007
27.7%
63.3%
S i x D i s r u p t i v e D e m o g r a p h i c Tr e n d s : W h a t C e n s u s 2 0 1 0 W i l l R e v e a l
P a g e 1 1
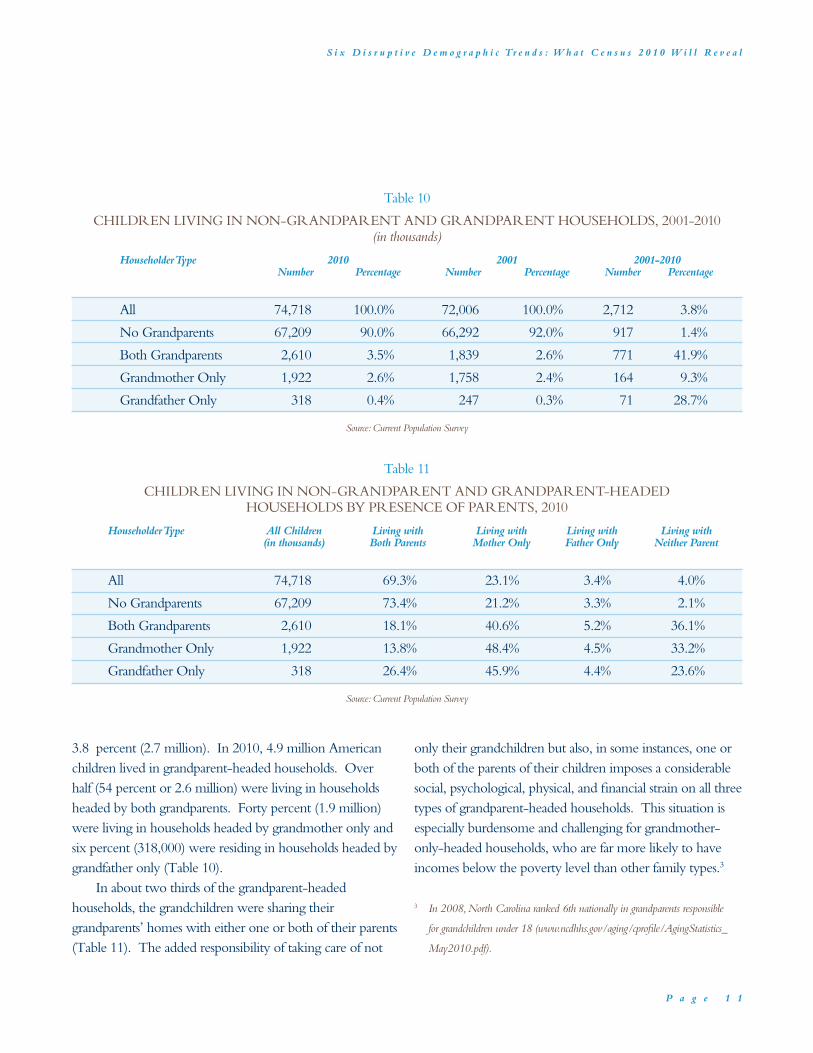
3.8 percent (2.7 million). In 2010, 4.9 million American children lived in grandparent-headed households. Over half (54 percent or 2.6 million) were living in households headed by both grandparents. Forty percent (1.9 million) were living in households headed by grandmother only and six percent (318,000) were residing in households headed by grandfather only (Table 10).
In about two thirds of the grandparent-headed households, the grandchildren were sharing their grandparents’ homes with either one or both of their parents (Table 11). The added responsibility of taking care of not
only their grandchildren but also, in some instances, one or both of the parents of their children imposes a considerable social, psychological, physical, and financial strain on all three types of grandparent-headed households. This situation is especially burdensome and challenging for grandmother-only-headed households, who are far more likely to have incomes below the poverty level than other family types.3
3 In 2008, North Carolina ranked 6th nationally in grandparents responsible
for grandchildren under 18 (www.ncdhhs.gov/aging/cprofile/AgingStatistics_
May2010.pdf).
Table 11
CHILDREN LIVING IN NON-GRANDPARENT AND GRANDPARENT-HEADED HOUSEHOLDS BY PRESENCE OF PARENTS, 2010
Householder Type All Children Living with Living with Living with Living with (in thousands) Both Parents Mother Only Father Only Neither Parent
All 74,718 69.3% 23.1% 3.4% 4.0%
No Grandparents 67,209 73.4% 21.2% 3.3% 2.1%
Both Grandparents 2,610 18.1% 40.6% 5.2% 36.1%
Grandmother Only 1,922 13.8% 48.4% 4.5% 33.2%
Grandfather Only 318 26.4% 45.9% 4.4% 23.6%
Source: Current Population Survey
Table 10
CHILDREN LIVING IN NON-GRANDPARENT AND GRANDPARENT HOUSEHOLDS, 2001-2010(in thousands)
Householder Type 2010 2001 2001-2010 Number Percentage Number Percentage Number Percentage
All 74,718 100.0% 72,006 100.0% 2,712 3.8%
No Grandparents 67,209 90.0% 66,292 92.0% 917 1.4%
Both Grandparents 2,610 3.5% 1,839 2.6% 771 41.9%
Grandmother Only 1,922 2.6% 1,758 2.4% 164 9.3%
Grandfather Only 318 0.4% 247 0.3% 71 28.7%
Source: Current Population Survey

DISCUSSION
S i x D i s r u p t i v e D e m o g r a p h i c Tr e n d s : W h a t C e n s u s 2 0 1 0 W i l l R e v e a l
P a g e 1 2
4 Emblematic of this trend, the share of the 65+ population in the workforce
increased from 11.9 percent to 16.8 percent between 1998 and 2008.
During this period, the share of the 75+ population in the workforce increased
from 4.7 percent to 7.3 percent.
DISCUSSION
These six disruptive demographic trends highlight the multiple and complex ways the U.S. population is rapidly changing. The U.S. population is far different today in terms of geographical distribution, racial and ethnic composition, age mix, family types, and economic circumstance than it was a decade ago. There is little doubt that these ongoing changes will dramatically transform our nation’s social, economic, and political institutions. Here we limit our attention to the impacts on consumer markets and workplaces. We also highlight several challenges that these trends pose for the nation’s future economic competitiveness in the global marketplace.
Impacts on Consumer Markets and Workplaces Population redistribution trends of the past decade
suggest that the largest and most diverse consumer markets for goods and services will be in the South, where close to 40 percent of the U.S. population resided in 2009. Aging boomers will also have a huge impact. Well over a third of boomer families are empty nesters, while all others will enter this phase over the next ten years. Interestingly, approximately 85 percent of empty-nester parents experience a substantial boost in discretionary income with more than a third reporting gains of $10,000 or more, according to Age Wave of Emeryville, California. Because aging boomers are increasingly well educated, youth oriented (55 is the new 35), and tech savvy, the demand for consumer electronics and other high-technology goods and services will be substantial. Those over age 55 already control more than $2.2 trillion in purchasing power annually, a figure that will expand rapidly in the decade ahead.
Similarly, Hispanic buying power, which stood at $978 million in 2009, is expected to climb to $1.3 billion by 2014 (University of Georgia, 2009) (Table 12).
Business leaders will have to figure out how to design,
package, and label goods and services that cater to the needs, cultural preferences, and consumer purchasing behaviors of both a “graying” and “browning” America. Particularly noteworthy in terms of new business opportunities is the emergence of the so-called “elder care economy.” A new array of culturally and age-appropriate products and services will be needed to serve our aging and diversifying populations.
At the same time that private businesses must prepare to tap consumer markets that are more diverse, they must also re-engineer the way they do business internally. For the first time in history, there are now four generations of workers in the U.S. labor force: pre-boomers (born before 1945); boomers (1945-64); Generation X (1965-1980); and Generation Y (1981-2000) (Glass, 2007). Among the factors contributing to the emergence of a multigenerational workforce are the following:
• Major advances in disease management and prevention, as well as a greater societal emphasis on active living and healthy eating, have enabled people to work well beyond the normal retirement age if they so desire.
• Labor shortages in critical skill areas have forced employers to retain older workers.
• As the economy tanked in the most recent recession, fewer people who were eligible to retire actually left the workforce and some who had retired prior to the downturn have been driven back into the workforce. This latter group has been dubbed the newly “unretired” (AccountingWEB, 2010).4
Because personal and lifestyle characteristics as well as work ethic, values, and behaviors vary by generation, all but

S i x D i s r u p t i v e D e m o g r a p h i c Tr e n d s : W h a t C e n s u s 2 0 1 0 W i l l R e v e a l
P a g e 1 3
the smallest businesses will have to develop more robust and flexible human resource policies to accommodate and retain their most valued and talented workers. As workplaces and consumer markets become more diverse, the demand for workers with cultural elasticity—the requisite skills to interact effectively with fellow workers and customers or clients from different linguistic, religious, lifestyle, and generational backgrounds—will increase sharply.
Challenges AheadCensus 2010 will undoubtedly confirm that the U.S.
population is far more diverse today than it was a decade ago, due in large measure to major immigrant flows from around the world. In the global economy of the 21st century, this increased diversity can be turned into a major competitive advantage for the United States in doing business with origin nations. But major challenges must be overcome before the United States can fully and effectively leverage its diversity for competitive advantage in the global marketplace. Three specific challenges are highlighted here.
First, post-2000 population redistribution trends have
set the stage for a fierce political battle over congressional reapportionment at the national level and legislative redistricting at the state level. Typically, irrespective of which political party is responsible for redrawing district boundaries, the overarching goal is either to maintain or regain political and electoral advantage. In the current era of economic uncertainty and job shortages, the political architects at the state level must avoid the temptation of pursuing the business-as-usual approach to redistricting. Instead, they must embrace an economic development-oriented strategy that strives to create districts or regions that leverage the nation’s creative capacity and entrepreneurialism for competitive advantage, both in new-venture and job creation. That is, they must leverage the redistricting process for economic advantage as opposed to political advantage.
Second, it is positive news that U.S. women have made remarkable progress in education attainment, labor market participation, and narrowing the gender gap in earnings over the past decade (Rosin, 2010; Luscombe, 2010a; Whelan, 2009). But the devastating impact of recent cyclical and structural changes in the U.S. economy on male
Table 12
U.S. BUYING POWER (AFTER-TAX PERSONAL INCOME)BY RACE AND ETHNICITY, 1990, 2009 & 2014
(billions of dollars)
Group 1990 2009 2014 Percentage Change Forecast 1990-2014
American Indian $19.7 $64.7 $82.7 319.3%
Asian $116.5 $508.6 $696.5 497.9%
Black $318.1 $910.4 $1,136.8 257.3%
Hispanic $211.9 $978.0 $1,300.0 613.5%
Multiracial n/a $108.9 $148.3 n/a
White $3,816.2 $9,125.2 $11,032.7 189.1%
Total $4,270.5 $10,717.8 $13,097.1 206.7%
* 2009 & 2014 number includes multiracial buying power, not separately measured in 1990Source: The Multicultural Economy, Selig Center for Economic Growth, Terry College of Business, The University of Georgia, 2009

S i x D i s r u p t i v e D e m o g r a p h i c Tr e n d s : W h a t C e n s u s 2 0 1 0 W i l l R e v e a l
P a g e 1 4
employment is a potentially serious threat to our nation’s future if it is not also addressed.
During the first decade of the new millennium, in contrast to prior census periods: 1) male job loss was no longer limited to mainly blue-collar workers but also included a significant number of white-collar jobholders as well; and 2) long-term joblessness—defined as being unemployed for six months or longer—increased more rapidly among the well educated and those concentrated in white-collar and service occupations than it did among the less-well-educated and blue-collar workers (Riordan, et al., 2010). This suggests that education is necessary but no longer sufficient to guarantee U.S. males a viable livelihood in a turbulent, uncertain economy characterized by blue-collar job offshoring and white-collar job outsourcing (Johnson and Kasarda, 2008).
To thrive and prosper in the years ahead, U.S. males who have either experienced economic dislocations or are at substantial risks of such dislocations will have to demonstrate greater entrepreneurial acumen, that is, “a…willingness to take higher risks for higher rewards and the ability to be agile, resilient, tenacious, and decisive in responding to unanticipated crises and opportunities” (Johnson and Kasarda, 2008, p. 28). Also, American colleges and universities will have to play a major role in nurturing and growing entrepreneurial acumen among America’s younger populations.
In order to do so, our colleges and universities must “move away from their inward-focused ivory tower orientation and become more outward-focused, outward-oriented entrepreneurial engines for new business development and job creation.” That is, they must develop an appreciation of and demonstrate a major commitment to “intellectual entrepreneurship” and design campus wide initiatives, as the University of North Carolina at Chapel Hill has done (Cherwitz, 2010; Thorp and Goldstein, 2010), that: “1) inspire students to become more entrepreneurial; 2) teach them how to be more entrepreneurial; 3) connect
them with business and social entrepreneurs to learn directly and gain experience; and 4) create new attitudes, new knowledge, and new business and social ventures” (Johnson and Kasarda, 2008, p. 29). Given that many of the males affected by the current economic downturn will have to return to school to develop or fine tune their entrepreneurial skills, higher education institutions must also pursue a variety of strategies and delivery mechanisms to address the entrepreneurial education needs of this population.
Helping dislocated males regain a foothold in the mainstream economy is not only good for the future prosperity and competitiveness of our nation, it also has the potential to strengthen the nation’s social fabric, including the institutions of marriage and family, as well as a host of other civic and philanthropic organizations that enrich our communities (Peck, 2010; Luscombe, 2010b). Not insignificantly, creating a responsible male entrepreneurial class potentially would reduce the enormous burden that increasing numbers of grandparents face in having to care for their grandchildren.
The third and, perhaps, biggest challenge emanating from the disruptive demographic trends of the first decade of the new millennium is to determine how to properly educate the current generation of primary- and secondary-age school children who are far more diverse than previous generations (Johnson, 2007; Johnson and Lichter, 2010). As the population has aged on the one hand and become more diverse through immigration-driven-population change on the other, who should have access to and who should pay for public education are two interrelated questions that have become hotly contested public policy issues (Kozol, 2005; Scott, 2008; Tyson, 2010).
The youth that are most at risk of falling through the cracks of our public education system are predominantly non-white—mainly black and Hispanic—a product of the “browning” of America (Kozol, 2005). They attend severely under-resourced and the lowest-performing

S i x D i s r u p t i v e D e m o g r a p h i c Tr e n d s : W h a t C e n s u s 2 0 1 0 W i l l R e v e a l
P a g e 1 5
schools, which are experiencing re-segregation along racial ethnic lines (Paulson, 2008). Labeled “failure factories” and “dropout factories,” these schools have on average a much lower percentage of fully licensed teachers, a much higher percentage of emergency and provisional licensed and lateral entry staff, a much higher teacher turnover rate, and administrative leadership that is less experienced than what
exists in high-performing schools (Johnson, 2007). Allowing these students to languish in under-resourced
and low-performing schools is not just an ethical or moral issue; rather, and more important, it is a competitiveness issue. Given the huge wave of baby boomers who are about to retire, we will need the skills and talents of these younger generations to prosper in the years ahead (Johnson, 2007).

REFERENCES
S i x D i s r u p t i v e D e m o g r a p h i c Tr e n d s : W h a t C e n s u s 2 0 1 0 W i l l R e v e a l
P a g e 1 6
REFERENCES CITED
• AccountingWEB in Human Resources, 2010, “‘The Unretired’ Mark New Demographic Shift in Workplace,” available at www.accountingweb.com/topic/human-resources/unretired-mark-new-demographic-shift-workplace#.
• Cavanaugh, Tim, 2010, “Manliness is Next to Joblessness,” Reason, September 6, available at http://reason.com.
• Cauchon, Dennis, 2009, “Women Gain in Historic Job Shift,” available at www.usatoday.com.
• Cauchon, Dennis, 2010, “Gender Pay Gap is Smallest on Record,” USA Today, September 14, available at
www.usatoday.com.
• Cherwitz, Richard, 2010, “UNC Chancellor Thorp Endorses Intellectual Entrepreneurship,” available at www.youtube.com/watch?v=Hq3uQ8jEcAc.
• Coughlin, Joseph, 2010, “Baby Boomers and Aging in Place: Business Opportunities for Home Services, Insurers, and Communications Providers,” available at
www.disruptivedemographics.com/2010/02/aging-baby-boomers-aging-in-place.html.
• Estersohn, Dan, 2010, “When Do the Census Results Get into Arbitron Data?” Census 2010 White Paper #1, Arbitron, Inc., available at www.arbitron.com/downloads/census_2010_whitepapers.pdf.
• Gibson, Campbell and Jung, Kay, 2002, Historical Census Statistics on Population Totals by Race, 1790 and 1990, For the United States, Regions, Divisions, and States, Population Division, Working Paper No. 56, Washington, D.C. : U.S. Census Bureau, September.
• Glass, Amy, 2007, “Understanding Generational Differences for Competitive Success,” Industrial and Commercial Training, Vol. 39, available at
www.emeraldinsight.com/journals.htm?articleid=1595306&show=abstract.
• Johnson, James H., Jr., 2006, “People on the Move: Implications for U.S. Higher Education, College Board Review, No. 209, pp. 4-9.
• Johnson, James H., Jr., 2007, “Shaping the Business Leaders of Tomorrow: America’s K-12 Education Crisis is a Higher Education Problem,” Sustainable Enterprise Quarterly 3(3), pp. 1-2.
• Johnson, James H., Jr. and Kasarda, John, D., 2008, “Jobs on the Move: Implications for U.S. Higher Education,” Planning for Higher Education, Vol. 36, No. 3 (April-June), pp. 22-33.
• Johnson, James H., Jr., Farrell, Walter C., Jr. & Guinn, Chandra, 1999, “Immigration Reform and the Browning of America: Tensions, Conflicts, and Community Instability in Metropolitan Los Angeles,” Chapter 22, The Handbook of International Migration, edited by C. Hirschman, P. Kasinitz, and J. DeWind. New York: Russell Sage, pp. 390-411.

S i x D i s r u p t i v e D e m o g r a p h i c Tr e n d s : W h a t C e n s u s 2 0 1 0 W i l l R e v e a l
P a g e 1 7
• Johnson, Kenneth M. and Lichter, Daniel T., 2010, “Growing Diversity among America’s Children and Youth: Spatial and Temporal Dimensions,” Population and Development Review, Vol. 36, pp. 151-176.
• Kozol, Jonathan, 2005, “Still Separate, Still Unequal: America’s Educational Apartheid,” Harper’s, September, available at www.mindfully.org/Reform/2005/American-Apartheid-Education1sep05.htm.
• Kedrosky, Paul, 2010, “Mean Center of U.S. Population Over Time,” available at http://paul.kedrosky.com/archives/2010/09/mean_center_of.html.
• Lowery, Annie, 2010, “Death and Joblessness: How Suicide Dogs the Long-Term Unemployed,”
Washington Independent, August 17, available at www.commondreams.org/headline/2010/08/17-2.
• Luscombe, Belinda, 2010a, “Workplace Salaries: At Last, Women on Top,” Time, September 1, available at www.time.com/time/business/
article/0,8599,2015274,00.html.
• Luscombe, Belenda, 2010b, “Who Needs Marriage?” Time, November 18, available at www.time.com/time/printout/0,8816,2031962,00.html#.
• Marks, Clifford, 2010, “‘Mancession’ Continues Despite Gains,” National Journal Online, September 9, available
at http://nationaljournal.com/njonline/ec_20100909_2592.php.
• Nolan, Jill Eversole, 1998, Grandparents Raising Grandchildren: Census Bureau Facts, SS-158-99, Ohio State University Extension, available at http://ohioline.osu.edu/ss-fact/0158.html.
• Passel, Jeffery, Wang, Wendy, and Taylor, Paul, 2010, Marrying Out, Pew Research Center Publications, June 4, available at http://pewresearch.org/pubs/1616/american-marriage-interracial-interethnic.
• Paulson, Amanda, 2008, “Resegregation of U.S. Schools Deepening,” Christian Science Monitor, January 25, available at www.csmonitor.com/USA/Society/2008/0125/p01s01-ussc.html.
• Peck, Don, 2010, “How a New Jobless Era Will Transform America,” The Atlantic, March,
www.theatlantic.com/magazine/archive/2010/03/how-a-new-jobless-era-will-transform-america/7919/.
• PRB, 2010, “U.S. Census 2010 Timetable,” Population Reference Bureau, available at www.prb.org/Articles/2009/timetable.aspx.
• Riordan, Christine, et al., 2010, “The Crisis of Long Term Unemployment and the Need for Bold Action to Sustain the Unemployment and Support the Recovery,” National Employment Law Project, June, available at http://nelp.3cdn.net/b917323b466cd26f86_wnm6bfuzu.pdf.
• Rosin, Hanna, 2010, “The End of Men,” The Atlantic, July/August, available at www.theatlantic.com/magazine/print/2010/07/the-end-of-men/8135/.

S i x D i s r u p t i v e D e m o g r a p h i c Tr e n d s : W h a t C e n s u s 2 0 1 0 W i l l R e v e a l
P a g e 1 8
• Scott, Marie, 2008, “Resegregation, Language, and Educational Opportunity: The Influx of Latino Students into North Carolina Public Schools,” Harvard Latino Law Review, Vol. 11, available at www.law.harvard.edu/students/orgs/llr/vol11/123-156.pdf.
• Smith, Alden, 2010, “Grandparents Raising Grandchildren,” available at www.doityourself.com/stry/raising-grandchildren.
• Stritof, Sheri and Stritof, Bob, 2010, “Raising Grandkids: A Growing Trend,” available at http://marriage.about.com/cs/grandparenting/a/raisinggrandkid.htm.
• The Shriver Report, 2009, “A Woman’s Nation Changes Everything.” Washington, DC: Center for American Progress, available at www.americanprogress.org/issues/2009/10/pdf/awn/a_womans_nation.pdf.
• Thorp, Holden and Goldstein, Buck, 2010, Engines of Innovation: The Entrepreneurial University of the Twenty-First Century, Chapel Hill: University of North Carolina Press.
• Tyson, Timothy B., 2010, “Resegregation is no Answer for our Schools,” newsobserver.com, available at
www.newsobserver.com/2010/01/19/286472/resegregation-is-no-answer-for.html.
• University of Georgia, 2009, The Multicultural Economy, Selig Center for Economic Growth, Terry College of Business.
• U.S. Census Bureau, Population Division, 2009, “Annual Estimates of Resident Population for the United States, Regions, States, and Puerto Rico: April 1, 2000 to July 1, 2009,” available at www.census.gov/popest/states/NST-ann-est.html.
• U.S. Census Bureau, Population Division, 2010, “Annual Estimates of Population by Sex and Age For the United States: April 1, 20000 to July 1, 2009,” available at
www.census.gov/popest/national/asrh/NC-EST2009-asrh.html.
• Whelan, Christine B., 2009, “A Feminist-Friendly Recession,” The National Marriage Project, University of Virginia: Institute for American Values, available at http://stateofourunions.org/2009/feminist_friendly_recession.php.
• Wikimedia Foundation, Inc., 2010, “2010 United States Census,” available at http://en.wikipedia.org/wiki/2010_United_States_Census.
• Williams, Shernay, 2010, “2010 Census Participation Figures Released,” Afro Briefs, October 29, available at www.afro.com/sections/news/afro_briefs/story.htm?storyid=3001.

John Kasarda
Jim Johnson
S i x D i s r u p t i v e D e m o g r a p h i c Tr e n d s : W h a t C e n s u s 2 0 1 0 W i l l R e v e a l
P a g e 1 9
AUTHORSABOUT THE AUTHORS
• James H. Johnson, Jr.
Jim Johnson is the William Rand Kenan, Jr. Distinguished Professor of Strategy and Entrepreneurship at UNC’s Kenan-Flagler Business School and director of the Urban Investment Strategies Center at the Frank Hawkins Kenan Institute of Private Enterprise. He holds degrees from North Carolina Central University (B.S., 1975), the University of Wisconsin at Madison (M.S., 1977), and Michigan State University (Ph.D., 1980).
Selected by Fast Company magazine as one of the “17…brightest thinkers and doers in the new world of work,” Johnson’s research and consulting activities focus on the workforce and workplace implications of demographic changes in the United States and on how to create highly competitive and sustainable business enterprises and communities. Johnson’s research on these and related topics has been widely cited in national media outlets, including The New York Times, The Wall Street Journal, Washington Post, Newsweek, Time, U.S. News and World Report, and BusinessWeek. He also has appeared on such national television shows as The Today Show on NBC, CNN Headline News, CBS Evening News, ABC Nightly News, Sunday Morning on CBS, Inside Politics on CNN, and This Week in Review on ABC.
• John D. Kasarda
John Kasarda is the Kenan Distinguished Professor of Strategy and Entrepreneurship at UNC’s Kenan-Flagler Business School and the director of the Frank Hawkins Kenan Institute of Private Enterprise. He received his B.S. and M.B.A. (with distinction) from Cornell University and his Ph.D. from the University of North Carolina at Chapel Hill.
Kasarda defined the “aerotropolis” concept, which positions airports as drivers of business location and urban economic growth, and is co-author of the forthcoming Aerotropolis: The Way We’ll Live Next (Farrar, Straus and Giroux).
He has published more than one hundred scholarly articles and nine books on economic development and business
issues. He is frequently quoted in The Wall Street Journal, The New York Times, and other national and international media. He has served as a consultant to the Carter, Reagan, Bush, and Clinton administrations and has testified numerous times before U.S. congressional committees on urban and economic development. Kasarda was elected a fellow of the American Association for the Advancement of Science for his research on demographics and job creation and is a trustee of the Urban Land Institute.

TRENDS KENAN INSTITUTE
S i x D i s r u p t i v e D e m o g r a p h i c Tr e n d s : W h a t C e n s u s 2 0 1 0 W i l l R e v e a l
P a g e 2 0
WHAT CENSUS 2010 WILL REVEAL
These six disruptive demographic trends highlight the multiple
and complex ways the U.S. population is rapidly changing.
The U.S. population is far different today in terms of geographical
distribution, racial and ethnic composition, age mix, family types,
and economic circumstance than it was a decade ago. There is
little doubt that these ongoing changes will dramatically transform
our nation’s social, economic, and political institutions.

891012345678910123456789134567a91012345678a101234567891012345678910123456789101234567891012345678910456789101234567891012345623456789101234567891012347891012345678910123456789123456789 10 123456789 10 125a78910123456789101234567891012a456789101234567891345678910123456a891012345678910123456789101234567891012345678910123456a78910456789101234567891012345623456789101234567891012347891012345678910123456789123a56789 10 123456789 10 125678910123456789101234567
KENAN INSTITUTEThe UNIVERSITY of NORTH CAROLINA at CHAPEL HILL
F R A N K H AW K INS K ENA N INSTIT U T E OF PRI VAT E EN T ERPR ISE
John D. Kasarda, Ph.D., director
Raymond B. Farrow III, executive director
CB 3440, Kenan Center • Chapel Hill, NC 27599-3440
Phone: 919/962-8201 • Fax: 919/962-8202
E-mail: [email protected] • www.kenaninstitute.unc.edu

891012345678910123456789134567a910123456789101234567891012345678910123456789101234567891012345678910456789101234567891012a45623456789101234567891012347891012345678910123456789123456789 10 123456789 10 125a789101234567891012345678910123456789101234567891345678910123456a891012345678910123456789101234567891012345678910123456a78910456789101234567891012345623456789101234567891012347891012345678910123456789123a56789 10 123456789 10 125678910123456789101234567
Founded in 1985, the Frank Hawkins Kenan Institute of Private Enterprise pursues leading-edge programming and research in the areas of entrepreneurship, economic development, and global competitiveness. It is part of Kenan-Flagler Business School at The University of North Carolina at Chapel Hill.
F R A N K H AW K INS K ENA N INSTIT U T E OF PR I VAT E EN T ER PR ISE
CB 3440, Kenan Center • Chapel Hill, NC 27599-3440
Phone: 919/962-8201 • Fax: 919/962-8202
E-mail: [email protected] • www.kenaninstitute.unc.edu