Embed Size (px)
Citation preview

MAGAZINE COVER - ADVANCED AQUARIST'S ONLINE MAGAZINE
CHIEF EDITOR
Terry Siegel:[email protected]
WEBSITE AND PRINT
DESIGNERS
Shane Graber: [email protected]
Leonard Ho: [email protected]
FEATURED AQUARIUMS
D. Wade Lehmann: [email protected]
INFORMATION
Publisher:Pomacanthus Publications, Inc.
Website:http://www.advancedaquarist.com/
Advertising:[email protected]
Feedback:[email protected]
COVER PHOTO
Periclimenes yucatanicus shrimp en-gaged in a commensal relationshipwith a Condylactys gigantae anemonein the drowned cayes belize.
Photograph by Mike Maddox
PUBLICATION INFORMATION
Advanced Aquarist's OnlineMagazine (ISSN 1931-6895) is pub-lished monthly online byPomacanthus Publications, Inc. Acentral goal of this publication is topromote exchange between the sci-entific community and amateuraquarists, for the benefit of both dis-ciplines and the environment. Toachieve our combined goals of great-er understanding of the natural worldand honing our husbandry skills wewill rely heavily on science and scient-ists. Advanced Aquarist's OnlineMagazine will always emphasize pro-tection and understanding of thenatural environment.
TABLE OF CONTENTS
TABLE OF CONTENTSJanuary 2009Volume VIII, Issue I
E D I T O R I A L
JANUARY 2009 ................................................................................................................ 3
By Terry Siegel
Terry discusses the magazine and the articles in this issue.
F E A T U R E A R T I C L E
HOW TO MAKE CORALS COLORFUL, PART ONE: NEW
INFORMATION, WITH PARTICULAR ATTENTION TO
BLUE-GREEN FLUORESCENT PIGMENTS ..................................................... 4
By Dana Riddle
Light intensity and its spectral characteristics play important parts in promotion of coralcoloration.
F E A T U R E A R T I C L E
THE DEVELOPMENT OF A METHOD FOR THE QUANTITATIVE
EVALUATION OF PROTEIN SKIMMER PERFORMANCE ..................21
By Ken S. Feldman, Kelly M. Maers, Lauren F. Vernese, Elizabeth A. Huber, Matthew R. Test
Department of Chemistry, The Pennsylvania State University, University Park, PA 16802. Pro-tein skimmers have become indispensable for many aquarists who strive to maintain the highwater quality necessary to keep stony corals.
Table of Contents
Advanced Aquarist | www.advancedaquarist.com 1 January 2009 | Volume VIII, Issue I
P R O D U C T R E V I E W
ANALYZING REFLECTORS: LUMENBRITE III, LUMENMAX ELITE, LUMENMAX, AND
LUMENARC III ................................................................................................................................................................................... 39
By Sanjay Joshi
Reflector design for reef aquariums has improved considerably allowing for more efficient use of light. With these reflectors we cannow light reef aquarium with fewer lamps, get deeper light penetration over larger areas.
S H O R T T A K E
TIPS FOR HEALTHY AQUARIUM INHABITANTS: PREVENTIVE MEASURES FOR
AQUARISTS, PART ONE ........................................................................................................................................................... 47
By Terry D. Bartelme
Practicing these good habits will minimize stress, prevent injury and insure that your stock will be well nourished.
S P O N S O R S
THANK YOU TO OUR SPONSORS! .................................................................................................................................... 50
We would like to thank the sponsors that make this publication possible! Through their generous sponsorship, they have made thiswebsite and online magazine available to all. Make sure that when you do business with our sponsors that you tell them that yousaw their ad on Reefs.org or Advanced Aquarist.
COPYRIGHT INFORMATION
All the information and content (content being text, design, layout and graphics)posted on this Web Site and in this PDF are the property of Advanced Aquarist'sOnline Magazine (AAOLM) / advancedaquarist.com a website owned by Pom-acanthus Publications Inc., and are protected by U.S. and other foreign copyrightand trademark laws. By accessing this Web Site and reading this periodical, youagree to the following terms and conditions.
All text, design, layout and graphics (unless otherwise noted) on this website are©2002-2008 Advanced Aquarist's Online Magazine /advancedaquarist.com a web-site owned by Pomacanthus Publications Inc. This Web Site and PDF and any of itscontents may not be copied or distributed in any manner (electronic, web, or prin-ted) without the prior written consent of AAOLM. This includes translation toother languages. With the exception of linking (see linking below).
Advanced Aquarist's Online Magazine, the Advanced Aquarist's Online Magazinelogo and advancedaquarist.com are all trademark of Pomacanthus PublicationsInc.
ADVANCED AQUARIST'S ONLINE MAGAZINE MAKES NO REPRESENTATIONS ORWARRANTIES WITH RESPECT TO THIS WEB SITE, ITS CONTENTS OR THEMANUSCRIPT, WHICH ARE PROVIDED FOR USE "AS IS" AND IS WITHOUTWARRANTY OF ANY KIND. Advanced Aquarist's Online Magazine is not liable forany losses or injury arising from inaccurate information.
Portions of this Web Site and PDF may publish readers comments and opinion(notably the discussion forums). AAOLM does not assume or have any responsibil-ity or any liability for the readers comments or opinions. For more detailedinformation about the discussion forums' terms of service and use go to ourdiscussion forum area.
LINKING TO MATERIAL ON AAOLM
You may only copy up to 20 words or paraphrase an article provided that you at-tribute the material directly to AAOLM and link to the original article. You may notuse any graphic or portion of any graphic without written permission. You maynot use images of captures (either screen or window) of AAOLM webpages.
ARTICLE SUBMISSIONS
If you are interested in writing for Advanced Aquarist's Online Magazine, pleaseemail our Editor, Terry Siegel. We offer very competitive pay rates for articles. Or,if you are interested in having your marine aquarium featured in an upcoming is-sue, please email Wade Lehmann for instructions on submitting your tank forpublication.
ADVERTISING
For information on advertising with Advanced Aquarist's Online Magazine, pleasecontact Leonard Ho at [email protected]. We have a variety of packages that shouldbe suitable for your business needs.
FEEDBACK
We welcome your feedback. If you have ideas for new subjects, articles, or for Ad-vanced Aquarist's Online Magazine in general, please let us know either in ourEditorial Discussion Forum or email them to our Editor, Terry Siegel.
SUBSCRIBE
Interested in being notified when the next issue of Advanced Aquarist's OnlineMagazine is available? Either subscribe to our website news RSS feed or send anemail to [email protected] to subscribe to our notification newsletter.(This newsletter will also occasionally contain information about reefs.org up-dates in addition to information about Advanced Aquarist.)
ADVANCED AQUARIST'S CLOTHING AND GEAR
Take a minute to head over to our online store at Cafepress. You can deck yourselfout in Advanced Aquarist's gear: t-shirts, mugs, mousepads, etc. Plus purchasingitems helps fund our online magazine to a small degree.
Table of Contents
Advanced Aquarist | www.advancedaquarist.com 2 January 2009 | Volume VIII, Issue I
E D I T O R I A L
JANUARY 2009By Terry Siegel
Terry discusses the magazine and the articles in this issue.
© Pomacanthus Publications, LLCPublished January 2009, Advanced Aquarist's Online Magazine.
Keywords (AdvancedAquarist.com Search Enabled): Editorial, Terry SiegelLink to original article: http://www.advancedaquarist.com/2009/1/aaeditorial
A s we begin a new year I thought I would talk about the edit-
orial position of Advanced Aquarist. As I've said in the past thiselectronic publication tries to position itself, in terms of con-tent, somewhere between a hobbyist magazine and a vettedscience publication. However, exactly what does that mean.
Anecdotal Information: Information based on personal observa-tion, case study reports, or random investigations rather thansystematic, quantifiable, scientific evaluation. In my opinion,most aquarists share anecdotal information, which I should addis often useful. However, one of the difficulties with anecdotalinformation is that it is often unreliable. It is certainly true thatan advanced aquarist, with a science background, is more likelyto offer anecdotal advice that is more valuable than the obser-vations of a beginner, but without careful scientific testing eventhat information is suspect
Scientific Information: This is information derived from what isknown as the scientific method; that is, principles and proced-ures for the systematic pursuit of knowledge involving therecognition and formulation of a problem, the collection ofdata through observation and experiment, and the formulationand testing of hypotheses. Also, the scientific method is the dis-interested pursuit of the truth. The key word here is"disinterested." To put it in another way, the likes, dislikes, orprejudices of the researcher are irrelevant. This is not to sug-gest that science does not come to erroneous conclusions,
which it sometimes does, but most importantly it is self correct-ing - new data, new conclusions/hypotheses. And, in that sensescience is not dogmatic, unlike religious faith.
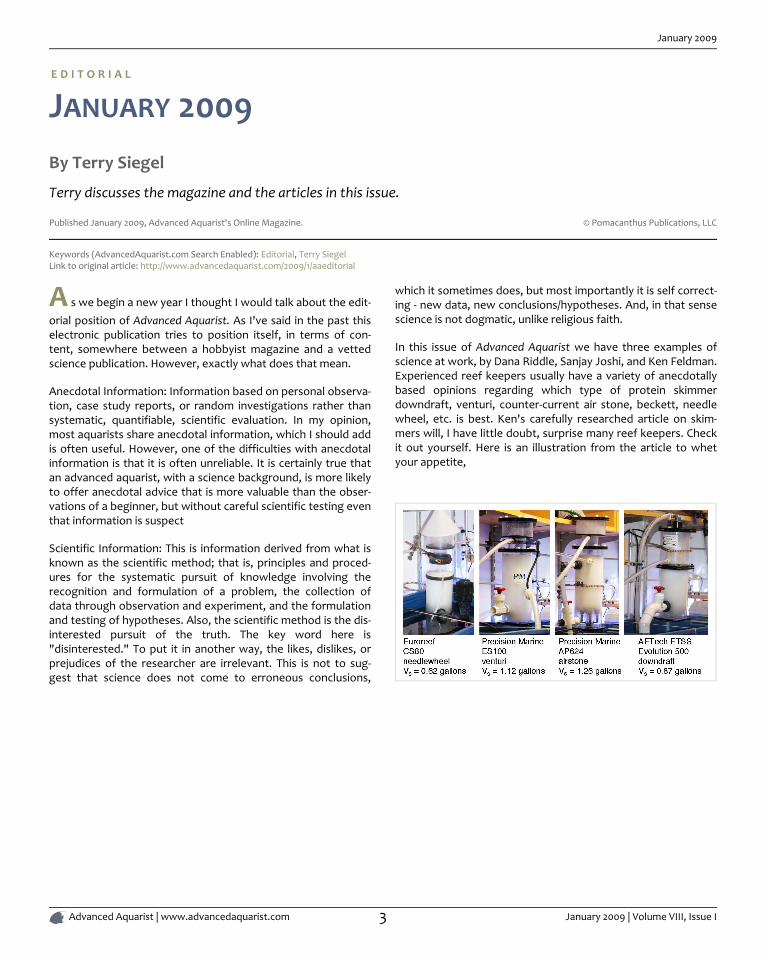
In this issue of Advanced Aquarist we have three examples ofscience at work, by Dana Riddle, Sanjay Joshi, and Ken Feldman.Experienced reef keepers usually have a variety of anecdotallybased opinions regarding which type of protein skimmerdowndraft, venturi, counter-current air stone, beckett, needlewheel, etc. is best. Ken's carefully researched article on skim-mers will, I have little doubt, surprise many reef keepers. Checkit out yourself. Here is an illustration from the article to whetyour appetite,
January 2009
Advanced Aquarist | www.advancedaquarist.com 3 January 2009 | Volume VIII, Issue I
F E A T U R E A R T I C L E
HOW TO MAKE CORALS COLORFUL, PART ONE:NEW INFORMATION, WITH PARTICULAR ATTEN-TION TO BLUE-GREEN FLUORESCENT PIGMENTS
By Dana Riddle
Light intensity and its spectral characteristics play important parts in promotion of coral coloration.
© Pomacanthus Publications, LLCPublished January 2009, Advanced Aquarist's Online Magazine.
Keywords (AdvancedAquarist.com Search Enabled): Coloration, Coral, Dana Riddle, Feature Article, Intensity, Pigment, UVLink to original article: http://www.advancedaquarist.com/2009/1/aafeature1
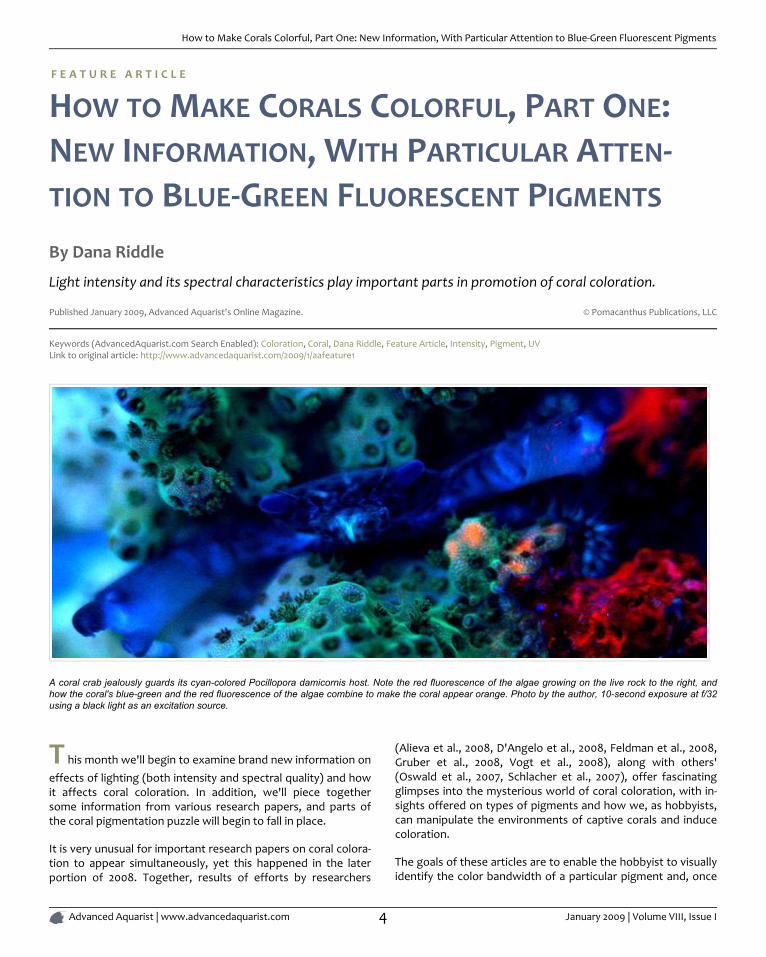
A coral crab jealously guards its cyan-colored Pocillopora damicornis host. Note the red fluorescence of the algae growing on the live rock to the right, andhow the coral's blue-green and the red fluorescence of the algae combine to make the coral appear orange. Photo by the author, 10-second exposure at f/32using a black light as an excitation source.
T his month we'll begin to examine brand new information on
effects of lighting (both intensity and spectral quality) and howit affects coral coloration. In addition, we'll piece togethersome information from various research papers, and parts ofthe coral pigmentation puzzle will begin to fall in place.
It is very unusual for important research papers on coral colora-tion to appear simultaneously, yet this happened in the laterportion of 2008. Together, results of efforts by researchers
(Alieva et al., 2008, D'Angelo et al., 2008, Feldman et al., 2008,Gruber et al., 2008, Vogt et al., 2008), along with others'(Oswald et al., 2007, Schlacher et al., 2007), offer fascinatingglimpses into the mysterious world of coral coloration, with in-sights offered on types of pigments and how we, as hobbyists,can manipulate the environments of captive corals and inducecoloration.
The goals of these articles are to enable the hobbyist to visuallyidentify the color bandwidth of a particular pigment and, once
How to Make Corals Colorful, Part One: New Information, With Particular Attention to Blue-Green Fluorescent Pigments
Advanced Aquarist | www.advancedaquarist.com 4 January 2009 | Volume VIII, Issue I
identified, categorize the pigment and apply informationprovided on light intensity and light color to induce, or main-tain, coral coloration.
We should note that a number of factors are involved whenmaking corals colorful. Light, of course, is critical, but the im-portance of this parameter should not diminish the criticality ofother co-factors such as water motion, pH, alkalinity, nutrientloadings, etc. However, it can not be denied that, when all oth-er conditions are correct, light can literally make or breakcolorful pigmentation.
In situations where the pigment can gain or lose coloration,light energy can bend the shape of the pigment molecule(called the 'hula twist'), sometimes resulting in coloration(photoconversion) or coloration loss (photobleaching). Whenthe light energy falls below a certain threshold level (either in-tensity or spectral quality), the pigment molecule 'relaxes' to itsnormal state.
In some cases, light energy breaks the molecular bond(s) com-pletely, leading to an irreversible change in apparent coloration.
This month, we'll examine pigment clades, and effects of lightquantity and quality on the blue-green (cyan) fluorescent pig-ments. But first, a review of terminology used in this andfollowing articles is in order.
GLOSSARY
The following terms will be used in this article:
Absorbance:Ability of a solution or layer of a substance to retain lightwithout reflection or transmission.
Absorption:The process in which incident radiation is retainedwithout reflection or transmission.
Brightness:The intensity of a fluorescent emission. Extinction coeffi-cient times Quantum Yield = Brightness.
Clade:For our purposes in this article, a grouping of pigmentsbased on similar features inherited from a common an-cestor. Pigments from corals includes Clades A, B, C, andD. Clades can refer to living organisms as well (clades ofSymbiodinium - zooxanthellae - are a good example.)
Chromophore:The colorful portion of a pigment molecule. In somecases, chromophore refers to a granular packet contain-ing many pigment molecules.
Chromoprotein pigment:A non-fluorescent but colorful pigment. These pigmentsappear colorful because they reflect light. For example, achromoprotein with a maximum absorption at 580nmmight appear purple because it preferentially reflectsblue and red wavelengths.
Chromo-Red Pigment:A newly described type of pigment possessing character-istics of both chromoproteins and Ds-Red fluorescentproteins. Peak fluorescence is at 609nm (super red).
Cyan Fluorescent Protein (CFP):Blue-green pigments with fluorescent emissions in therange of ~477-500nm. Cyan and green pigments share asimilar chromophore structure. Cyan pigments are ex-pressed at lower light levels than green, red or non-fluorescent pigments.
Emission:That light which is fluoresced by a fluorescent pigment.
Extinction Coefficient:The quantity of light absorbed by a protein under a specif-ic set of circumstances.
Excitation:That light absorbed by a fluorescent pigment. Some ofthe excitation light is fluoresced or emitted at a less ener-getic wavelength (color).
Ds-Red type pigment:A type of red fluorescent pigment with a single primaryemission bandwidth at 574-620nm. Originally found in thefalse coral Discosoma.
Fluorescence:Absorption of radiation at one wavelength (or color) andemission at another wavelength (color). Absorption isalso called excitation. Fluorescence ends very soon afterthe excitation source is removed (on the order of ~2-3nanoseconds: Salih and Cox, 2006).
Green Fluorescent Protein (GFP):Fluorescent pigments with emissions of 500-525nm.
'Hula Twist':A bending of a pigment molecule resulting in a change ofapparent color. Molecular bonds are not broken; there-fore the pigment can shift back and forth, withmovements reminiscent of a hula dancer.
Kaede-type pigment:A type of red fluorescent pigment with a characteristicprimary emission at ~574-580nm and a secondary(shoulder) emission at ~630nm. Originally found in thestony coral Trachyphyllia geoffroyi, but common in coralsof suborder Faviina.
How to Make Corals Colorful, Part One: New Information, With Particular Attention to Blue-Green Fluorescent Pigments
Advanced Aquarist | www.advancedaquarist.com 5 January 2009 | Volume VIII, Issue I
Kindling Protein:A protein capable of being converted from a non-fluores-cent chromoprotein to a fluorescent protein. Sometimescalled a 'Kindling Fluorescent Protein', or KFP.
Quantum Yield:Amount of that energy absorbed which is fluoresced. If100 photons are absorbed, and 50 are fluoresced, thequantum yield is 0.50.
Photobleaching:Some pigments, such as Dronpa, loss fluorescence if ex-posed to strong light (in this case, initially appearinggreen and bleaching to a non-fluorescent state when ex-posed to blue-green light). Photobleaching can obviouslycause drastic changes in apparent fluorescence. In caseswhere multiple pigments are involved, the loss of fluores-cence (or energy transfer from a donor pigment to anacceptor pigment) could also result in dramatic shifts inapparent color.
Photoconversion:A rearrangement of the chemical structure of a colorfulprotein by light. Depending upon the protein, photocon-version can increase or decrease fluorescence (inprocesses called photoactivation and photobleaching, re-spectively). Photoconversion can break proteins'molecular bonds (as with Kaede and Eos fluorescent pig-ments) resulting in an irreversible color shift, or themolecule can be 'twisted' by light energy (a 'hula twist')where coloration reversal are possible depending uponthe quality or quantity of light available. This process isknown as photoswitching).
Red Fluorescent Protein (RFP):Those pigments with an emission of ~570nm and above.Includes Ds-Red, Kaede and Chromo-Red pigments.
Stokes Shift:The difference in the maximum wavelength of fluores-cent pigment excitation light and the maximumwavelength of the fluoresced light (emission). For ex-ample, a pigment with an excitation wavelength of508nm and an emission wavelength of 535nm would havea Stokes Shift of 27nm.
Threshold or Coloration Threshold:The point at which pigment production is sufficient tomake its fluorescence (or in the case of non-fluorescentchromoproteins, it absorption) visually apparent. Theterm threshold generally refers pigment production, al-though, in some cases, it could apply to a light levelwhere a pigment disappears (as in the cases of pho-tobleaching, or photoconversion).
Yellow Fluorescent Protein:An uncommon group of fluorescent proteins with emis-sions in the 525-570 nm range (Alieva et al., 2008).
TYPES OF PIGMENTS
There are at least 9 described types of coral pigments. Note:Pigment types, such as green or red might not be structurallysimilar to another green or red pigment in a different clade - seebelow). These include:
• Cyan Fluorescent Proteins (CFP) - Cyan pigments are blue-green pigments with a maximum emission of up to ~500nm. The chromophore structure of a cyan pigment is verysimilar to that of a green fluorescent pigment.
• Green Fluorescent Proteins (GFP) - This group, by far, is themost numerous of the fluorescent proteins. The structure ofgreen fluorescent chromophores is very similar to that of cy-an fluorescent chromophores.
• Yellow Fluorescent Proteins (YFP) - An unusual type of fluor-escent protein with maximum emission in the yellowportion of the spectrum. Rare in its biological distribution,YFP is found in a zoanthid and some specimens of the stonycoral Agaricia. Personally, I've noted yellow fluorescence ina very few stony corals (Porites specimens) here in Hawaiiwhile on night dives using specialized equipment to observesuch colorations (see www.nightsea.com for details on thisequipment).
• Orange Fluorescent Protein (OFP) - I've included this protein'type' in an attempt to avoid confusion. OFP is used to de-scribe a pigment found in stony coral Lobophyllia hemprichiiand its name suggests a rather unique sort of protein. Infact, OFP is simply a variant of the Kaede-type fluorescentproteins.
• Red Fluorescent Proteins (RFP) - A group of proteins includ-ing several different subtypes (Kaede, Ds-Red and Chromo-Red). Typically, fluorescent emission is in the range of ~580nm to slightly over 600 nm.
• Dronpa - A green fluorescent protein that loses fluorescentwhen exposed to blue-green light (~490 nm) but returnswhen irradiated with violet light at ~400 nm.
• Kindling Proteins - A protein (notably from the anemoneAnemonia sculata) that changes from a non-fluorescent pig-ment to one demonstrating fluorescence. This change isswitchable/reversible and its state depends upon the spec-tral quality of light striking it.
• Chromo-Red Proteins - A new classification (Alieva et al.,2008) of a single fluorescent pigment found in the stonycoral Echinophyllia. This chromo-red pigment has qualities ofa non-fluorescent chromoprotein, but fluoresces at a max-imum of 609 nm.
How to Make Corals Colorful, Part One: New Information, With Particular Attention to Blue-Green Fluorescent Pigments
Advanced Aquarist | www.advancedaquarist.com 6 January 2009 | Volume VIII, Issue I
• Chromoproteins (CP) - This group of pigments is non-fluor-escent, or has minimal fluorescence (where the quantumyield is essentially zero). Instead of relying upon fluores-cence for coloration, these pigments instead absorb lightmost strongly in a relatively narrow portion of the visiblespectrum. Most coral chromoproteins absorb light maxim-ally at 560-593 nm. There are reports of anemonesabsorbing light at a maximum wavelength of 610nm, and acouple of reports of stony corals absorbing wavelengths inthe 480-500nm range. Some chromoproteins are very simil-ar in structure to the fluorescent Ds-Red proteins. In fact,genetic engineers have found that a single amino acid sub-stitution in a protein can make the difference between non-fluorescence and fluorescence. Chromoproteins do not getmuch attention by researchers (relative to that of fluores-cence proteins) and there are only about 40 described.
PIGMENT CLADES
Examination of pigment clades might seem a fruitless en-deavor, but, to the contrary, there is some interestinginformation to be garnered. Working on the hypothesis thatpigment clades have evolved over the millennia and could havespecific within-clade properties, we can possibly use cladaldata, along with other information, to form loose categories asto how pigments respond to various stimuli, including light andperhaps other factors. It is interesting to note that some pig-ments seem to have evolved within certain groups of animals(Clade A in anemones, or Clade D's Kaede-type pigments foundmostly in stony corals of suborder Faviina).
PIGMENT NAMES
I've attempted to list as much of the shorthand names for coralpigments within the following Tables 1 through 4. It is becom-ing common for researchers to use a pigment's given name(such as mcav4, Eos, or r1.2) without providing further informa-tion, and this information was included in the following Tablesfor my convenience, although any serious student not familiarwith these names can also benefit.
There are currently 4 major pigment clades, with Clade C con-taining several subgroups. We begin our study with:
CLADE A
Consists entirely (at present) of anemones (Actinaria genera)and contains green and red fluorescent variants, along with anumber of non-fluorescent chromoproteins. No cyan or yellowfluorescent pigments are included. See Table 1. Evidence sug-gests that photoconversion is possible in at least somefluorescent pigments of Clade A, and a transition from a non-fluorescent state to one of fluorescence is possible in the'kindling' protein from Anemonia sculata (that transforms froma non-fluorescent protein with maximum absorption at 562 nm
to a fluorescence state with maximum emission at 595 nm uponexposure to strong light).
CLADE B
Clade B is currently populated by scleractinian non-fluorescentchromoproteins (including those found in Acropora, Montipora,Pocillopora, etc.), three red fluorescent pigments (from thestony corals Porites, Montipora, and the false coralDiscosoma),along with one cyan fluorescent pigment. At present, Clade Bdoes not contain any green or yellow fluorescent pigments. SeeTable 2. Photoconversion occurs in many Clade B pigments, butis not common in the cyan pigments discussed in this article.
CLADE C, INCLUDING SUBCLADES C1, C2, AND C3
This clade is the most diverse of the 4 clades currently de-scribed, and includes some of the cyan, green, yellow and redfluorescent proteins plus one non-fluorescent chromoprotein(a 'red' pocilloporan) from the stony coral Stylophora pistillata.Green fluorescent proteins are mostly from Acropora and Mon-tipora species but also several from orders/subordersMeandriina, Fungiina and Faviina. See Table 3.
Taxon Pigment Name Type of Pigment Order/Suborder Excita-tion Emission Clade
CLADE D
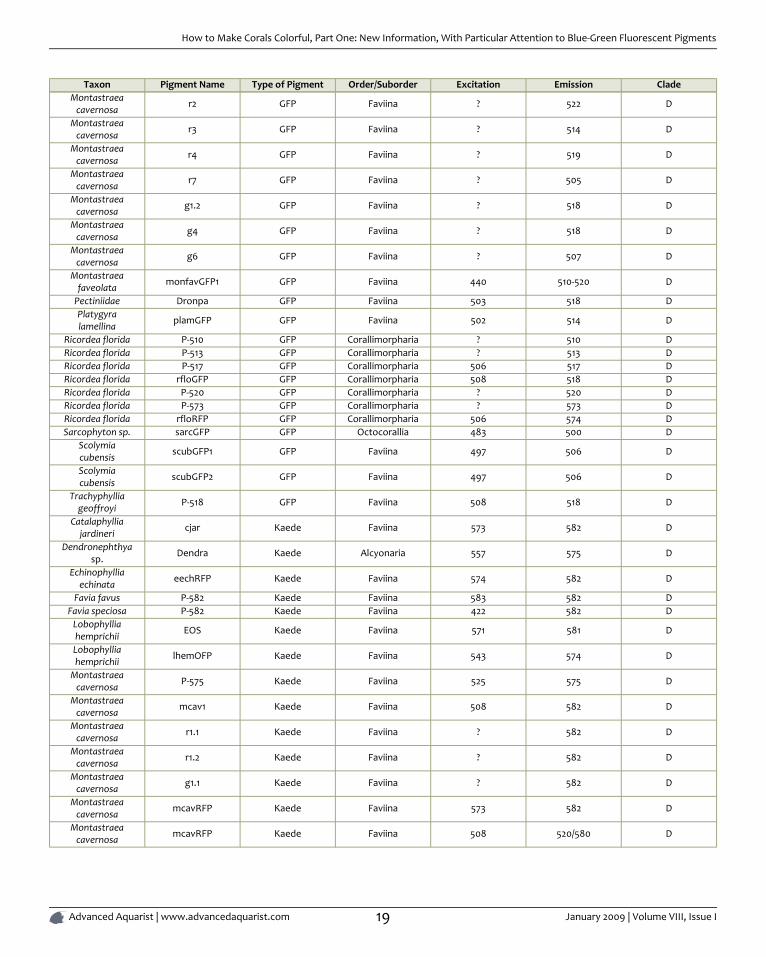
All pigments within this clade are fluorescent to some extent,and includes Ds-Red and Kaede-type orange/red fluorescentproteins (see Glossary). Clade D contains pigments found in atleast two soft corals (Clavularia and Dendronephthya species),false corals (Discosoma and Ricordea), and many stony corals.Photoconversion is possible in many Clade D pigments. Onegreen fluorescent pigment, Dronpa, bleaches upon exposure to'strong' blue-green light. Interestingly, the majority of thesepigments are from the stony coral suborder Faviina. See Table4.
EXPERIMENTAL EVIDENCE OF LIGHT INTENSITY
AND QUALITY ON EXPRESSION OF PIGMENTA-TION BY THE CORAL HOST
A recent paper (D'Angelo et al., 2008) reports the results of ex-periments designed to investigate the effects of light intensityand light quality on expression of fluorescent pigments andnon-fluorescent chromoproteins by various corals. The small-polyped stony corals used in these experiments were Acroporamillepora, Acropora pulchra, Hydnophora grandis, Montipora di-gitata and Seriatopora hystrix. It appears that typographicalerrors mislabeled some of the pigments, but it seems that atleast 11 coral pigments were examined (4 cyan fluorescent pig-ments, 3 green fluorescent pigments, 1 orange fluorescent
How to Make Corals Colorful, Part One: New Information, With Particular Attention to Blue-Green Fluorescent Pigments
Advanced Aquarist | www.advancedaquarist.com 7 January 2009 | Volume VIII, Issue I
pigment and 1 red fluorescent pigment. Two non-fluorescentchromoproteins were also studied).
Expression of coral coloration was examined with varyingphoton flux densities (PAR values classified as 'very low' (80 µ-mol·m²·sec), 'low' (100 µmol·m²·sec) 'moderate' (400µmol·m²·sec), and 'high' (700 µmol·m²·sec). Photoperiod was 12hours. Metal halide lamps producing ~50% of its visible radiationin the blue portion of the spectrum were used. See the Discus-sion section below for comments concerning how thesecategories relate to those seen in aquaria.
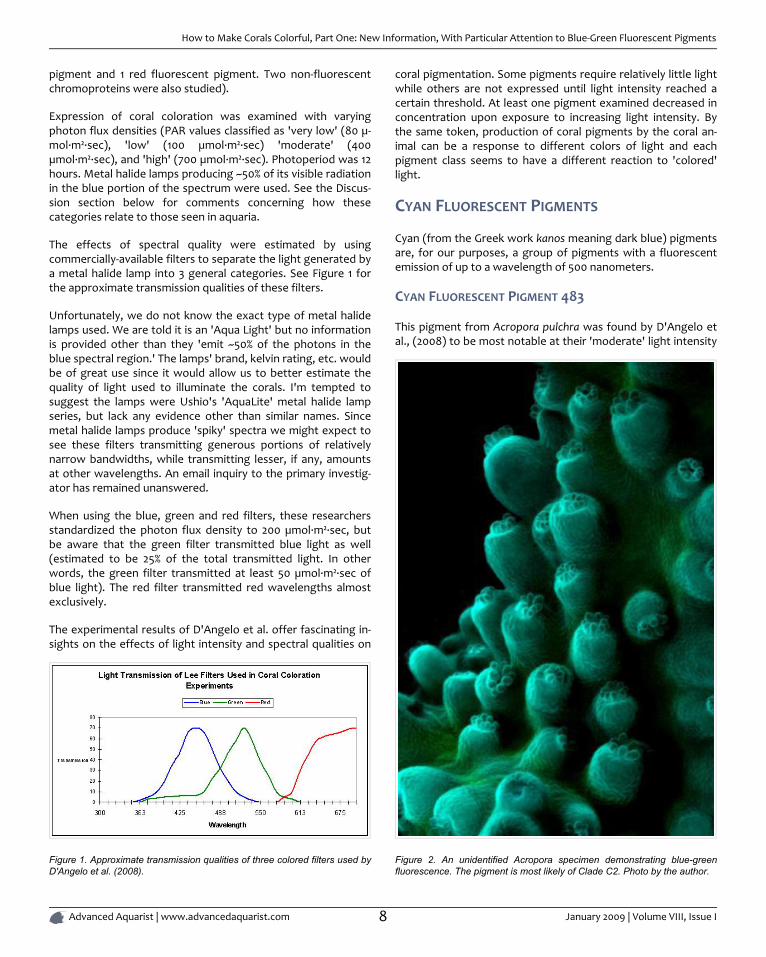
The effects of spectral quality were estimated by usingcommercially-available filters to separate the light generated bya metal halide lamp into 3 general categories. See Figure 1 forthe approximate transmission qualities of these filters.
Unfortunately, we do not know the exact type of metal halidelamps used. We are told it is an 'Aqua Light' but no informationis provided other than they 'emit ~50% of the photons in theblue spectral region.' The lamps' brand, kelvin rating, etc. wouldbe of great use since it would allow us to better estimate thequality of light used to illuminate the corals. I'm tempted tosuggest the lamps were Ushio's 'AquaLite' metal halide lampseries, but lack any evidence other than similar names. Sincemetal halide lamps produce 'spiky' spectra we might expect tosee these filters transmitting generous portions of relativelynarrow bandwidths, while transmitting lesser, if any, amountsat other wavelengths. An email inquiry to the primary investig-ator has remained unanswered.
When using the blue, green and red filters, these researchersstandardized the photon flux density to 200 µmol·m²·sec, butbe aware that the green filter transmitted blue light as well(estimated to be 25% of the total transmitted light. In otherwords, the green filter transmitted at least 50 µmol·m²·sec ofblue light). The red filter transmitted red wavelengths almostexclusively.
The experimental results of D'Angelo et al. offer fascinating in-sights on the effects of light intensity and spectral qualities on
Figure 1. Approximate transmission qualities of three colored filters used byD'Angelo et al. (2008).
coral pigmentation. Some pigments require relatively little lightwhile others are not expressed until light intensity reached acertain threshold. At least one pigment examined decreased inconcentration upon exposure to increasing light intensity. Bythe same token, production of coral pigments by the coral an-imal can be a response to different colors of light and eachpigment class seems to have a different reaction to 'colored'light.
CYAN FLUORESCENT PIGMENTS
Cyan (from the Greek work kanos meaning dark blue) pigmentsare, for our purposes, a group of pigments with a fluorescentemission of up to a wavelength of 500 nanometers.
CYAN FLUORESCENT PIGMENT 483
This pigment from Acropora pulchra was found by D'Angelo etal., (2008) to be most notable at their 'moderate' light intensity
Figure 2. An unidentified Acropora specimen demonstrating blue-greenfluorescence. The pigment is most likely of Clade C2. Photo by the author.
How to Make Corals Colorful, Part One: New Information, With Particular Attention to Blue-Green Fluorescent Pigments
Advanced Aquarist | www.advancedaquarist.com 8 January 2009 | Volume VIII, Issue I
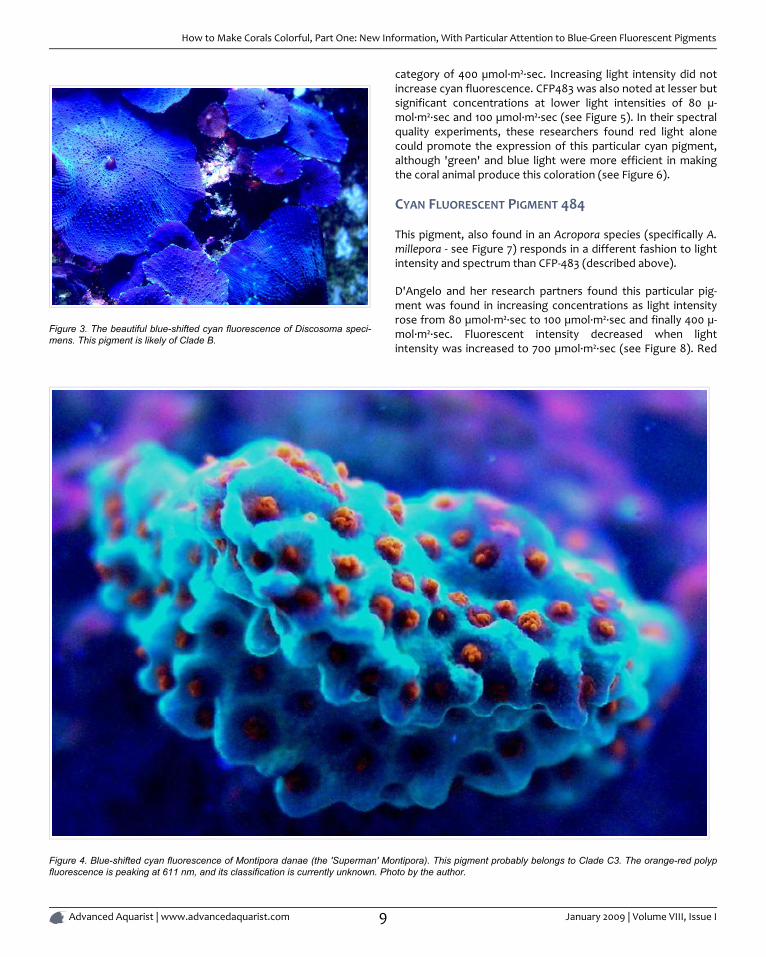
Figure 3. The beautiful blue-shifted cyan fluorescence of Discosoma speci-mens. This pigment is likely of Clade B.
category of 400 µmol·m²·sec. Increasing light intensity did notincrease cyan fluorescence. CFP483 was also noted at lesser butsignificant concentrations at lower light intensities of 80 µ-mol·m²·sec and 100 µmol·m²·sec (see Figure 5). In their spectralquality experiments, these researchers found red light alonecould promote the expression of this particular cyan pigment,although 'green' and blue light were more efficient in makingthe coral animal produce this coloration (see Figure 6).
CYAN FLUORESCENT PIGMENT 484
This pigment, also found in an Acropora species (specifically A.millepora - see Figure 7) responds in a different fashion to lightintensity and spectrum than CFP-483 (described above).
D'Angelo and her research partners found this particular pig-ment was found in increasing concentrations as light intensityrose from 80 µmol·m²·sec to 100 µmol·m²·sec and finally 400 µ-mol·m²·sec. Fluorescent intensity decreased when lightintensity was increased to 700 µmol·m²·sec (see Figure 8). Red
Figure 4. Blue-shifted cyan fluorescence of Montipora danae (the 'Superman' Montipora). This pigment probably belongs to Clade C3. The orange-red polypfluorescence is peaking at 611 nm, and its classification is currently unknown. Photo by the author.
How to Make Corals Colorful, Part One: New Information, With Particular Attention to Blue-Green Fluorescent Pigments
Advanced Aquarist | www.advancedaquarist.com 9 January 2009 | Volume VIII, Issue I
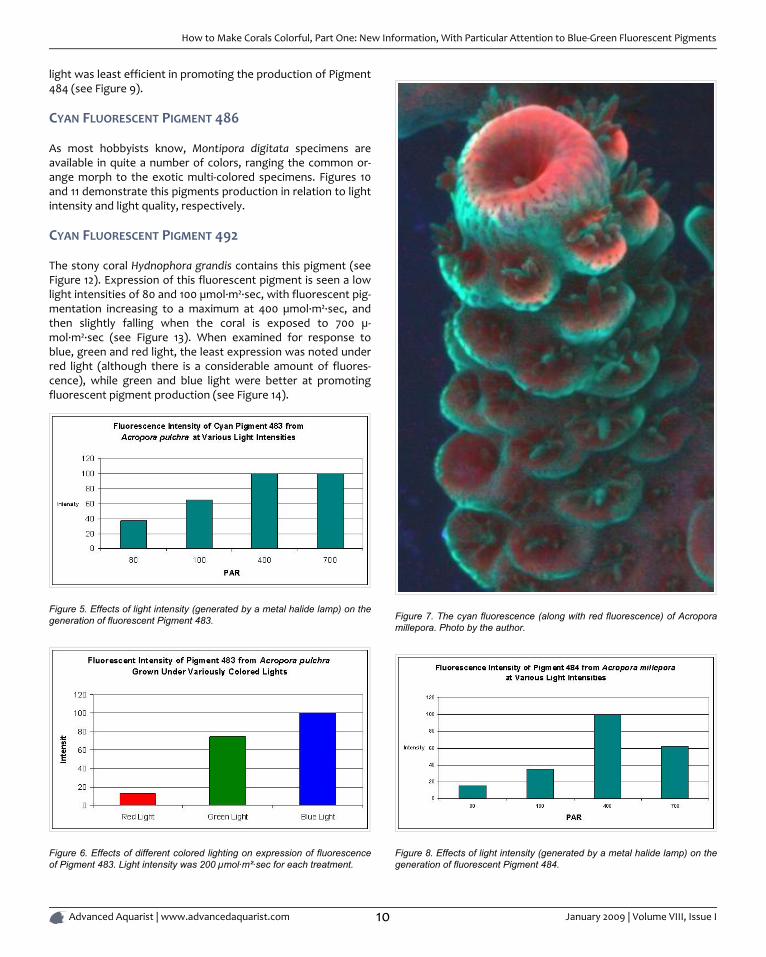
light was least efficient in promoting the production of Pigment484 (see Figure 9).
CYAN FLUORESCENT PIGMENT 486
As most hobbyists know, Montipora digitata specimens areavailable in quite a number of colors, ranging the common or-ange morph to the exotic multi-colored specimens. Figures 10and 11 demonstrate this pigments production in relation to lightintensity and light quality, respectively.
CYAN FLUORESCENT PIGMENT 492
The stony coral Hydnophora grandis contains this pigment (seeFigure 12). Expression of this fluorescent pigment is seen a lowlight intensities of 80 and 100 µmol·m²·sec, with fluorescent pig-mentation increasing to a maximum at 400 µmol·m²·sec, andthen slightly falling when the coral is exposed to 700 µ-mol·m²·sec (see Figure 13). When examined for response toblue, green and red light, the least expression was noted underred light (although there is a considerable amount of fluores-cence), while green and blue light were better at promotingfluorescent pigment production (see Figure 14).
Figure 5. Effects of light intensity (generated by a metal halide lamp) on thegeneration of fluorescent Pigment 483.
Figure 6. Effects of different colored lighting on expression of fluorescenceof Pigment 483. Light intensity was 200 µmol·m²·sec for each treatment.
Figure 7. The cyan fluorescence (along with red fluorescence) of Acroporamillepora. Photo by the author.
Figure 8. Effects of light intensity (generated by a metal halide lamp) on thegeneration of fluorescent Pigment 484.
How to Make Corals Colorful, Part One: New Information, With Particular Attention to Blue-Green Fluorescent Pigments
Advanced Aquarist | www.advancedaquarist.com 10 January 2009 | Volume VIII, Issue I
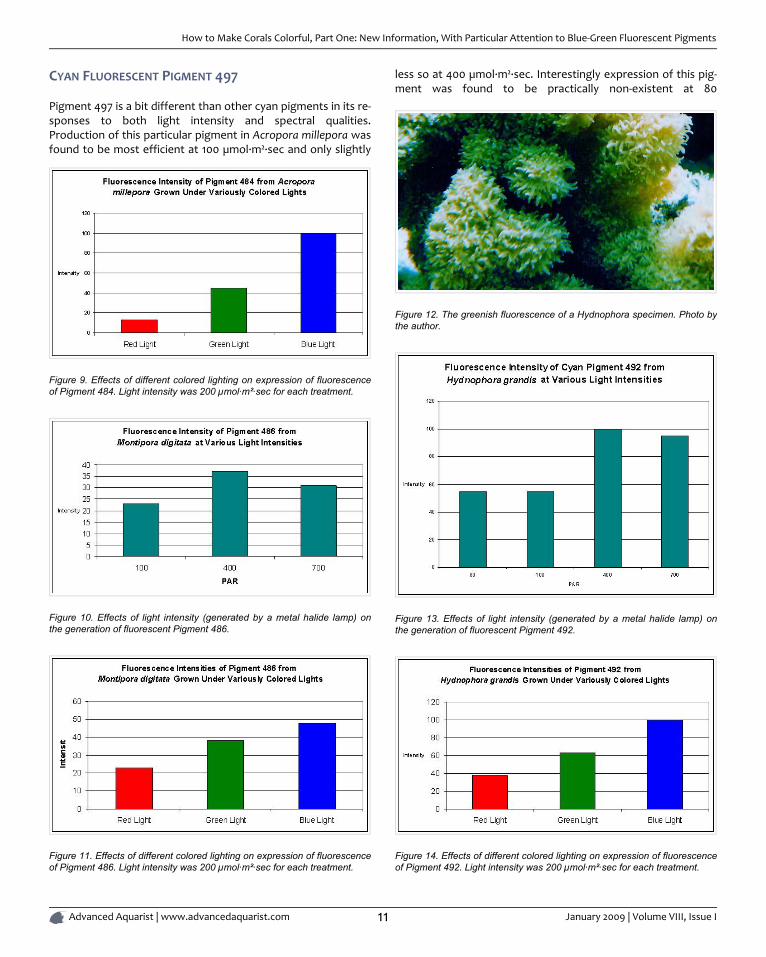
CYAN FLUORESCENT PIGMENT 497
Pigment 497 is a bit different than other cyan pigments in its re-sponses to both light intensity and spectral qualities.Production of this particular pigment in Acropora millepora wasfound to be most efficient at 100 µmol·m²·sec and only slightly
Figure 9. Effects of different colored lighting on expression of fluorescenceof Pigment 484. Light intensity was 200 µmol·m²·sec for each treatment.
Figure 10. Effects of light intensity (generated by a metal halide lamp) onthe generation of fluorescent Pigment 486.
Figure 11. Effects of different colored lighting on expression of fluorescenceof Pigment 486. Light intensity was 200 µmol·m²·sec for each treatment.
less so at 400 µmol·m²·sec. Interestingly expression of this pig-ment was found to be practically non-existent at 80
Figure 12. The greenish fluorescence of a Hydnophora specimen. Photo bythe author.
Figure 13. Effects of light intensity (generated by a metal halide lamp) onthe generation of fluorescent Pigment 492.
Figure 14. Effects of different colored lighting on expression of fluorescenceof Pigment 492. Light intensity was 200 µmol·m²·sec for each treatment.
How to Make Corals Colorful, Part One: New Information, With Particular Attention to Blue-Green Fluorescent Pigments
Advanced Aquarist | www.advancedaquarist.com 11 January 2009 | Volume VIII, Issue I
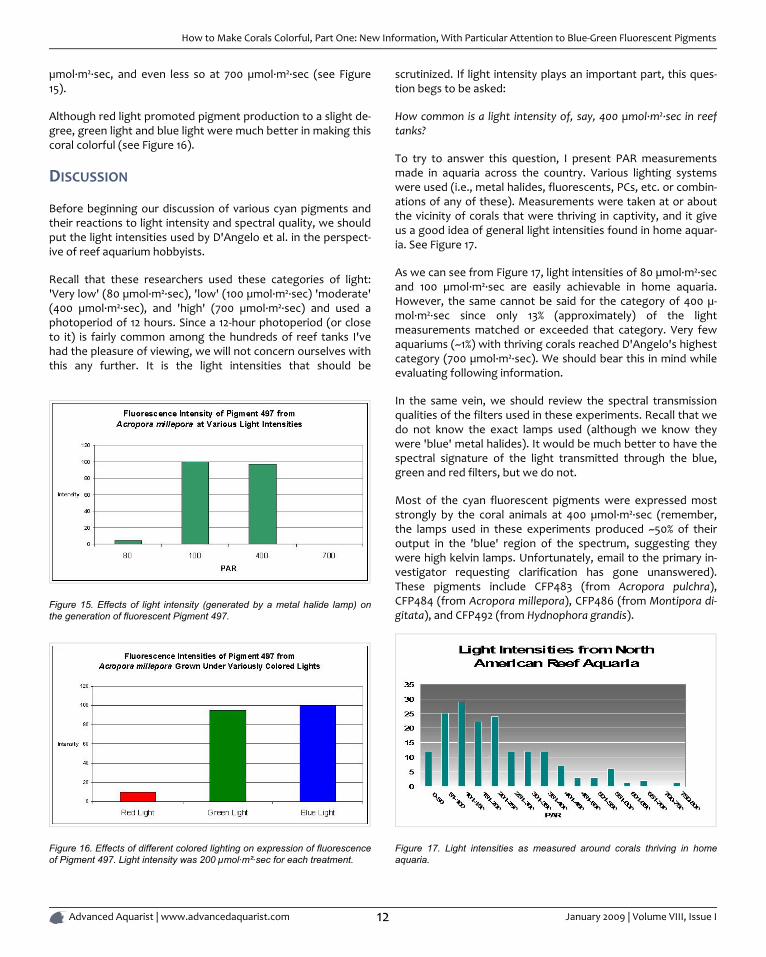
µmol·m²·sec, and even less so at 700 µmol·m²·sec (see Figure15).
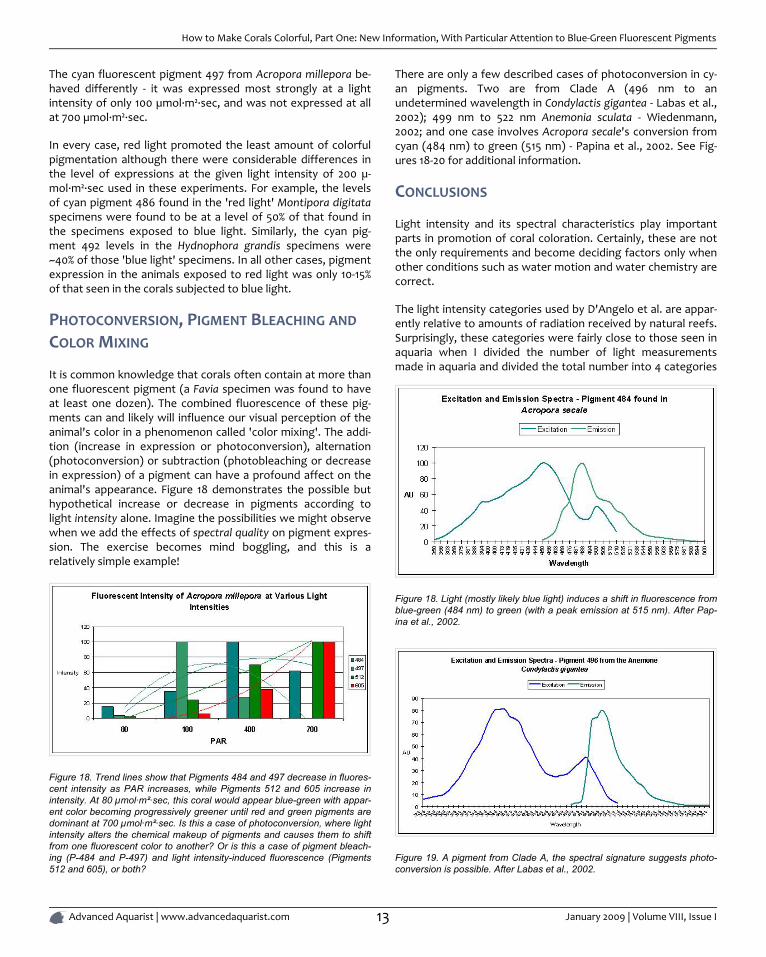
Although red light promoted pigment production to a slight de-gree, green light and blue light were much better in making thiscoral colorful (see Figure 16).
DISCUSSION
Before beginning our discussion of various cyan pigments andtheir reactions to light intensity and spectral quality, we shouldput the light intensities used by D'Angelo et al. in the perspect-ive of reef aquarium hobbyists.
Recall that these researchers used these categories of light:'Very low' (80 µmol·m²·sec), 'low' (100 µmol·m²·sec) 'moderate'(400 µmol·m²·sec), and 'high' (700 µmol·m²·sec) and used aphotoperiod of 12 hours. Since a 12-hour photoperiod (or closeto it) is fairly common among the hundreds of reef tanks I'vehad the pleasure of viewing, we will not concern ourselves withthis any further. It is the light intensities that should be
Figure 15. Effects of light intensity (generated by a metal halide lamp) onthe generation of fluorescent Pigment 497.
Figure 16. Effects of different colored lighting on expression of fluorescenceof Pigment 497. Light intensity was 200 µmol·m²·sec for each treatment.
scrutinized. If light intensity plays an important part, this ques-tion begs to be asked:
How common is a light intensity of, say, 400 µmol·m²·sec in reeftanks?
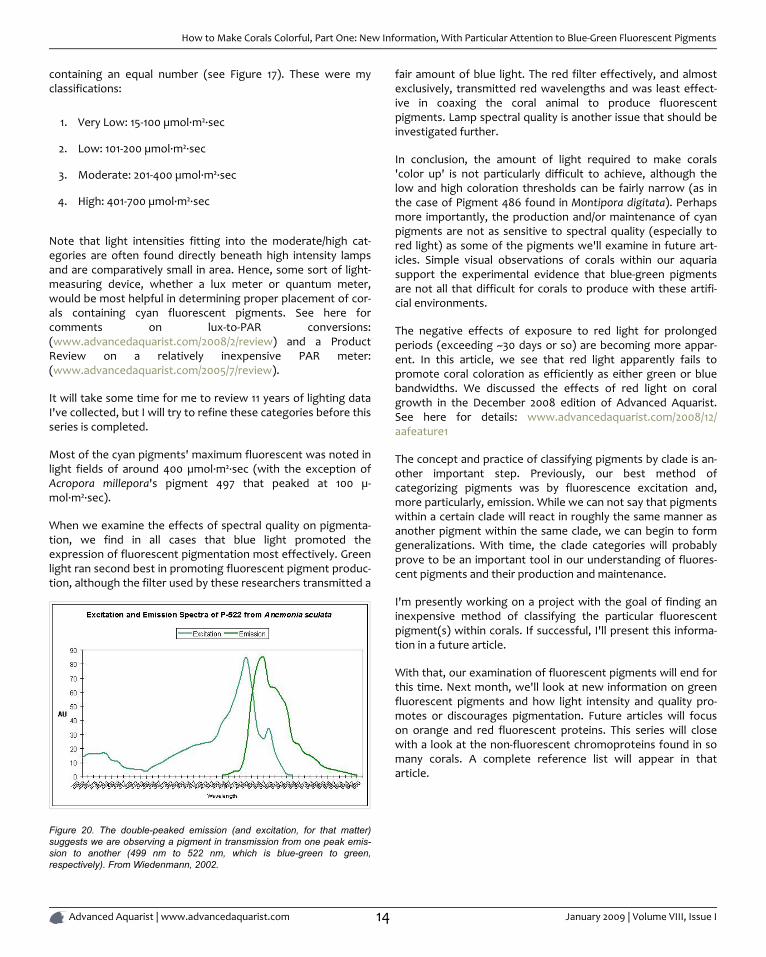
To try to answer this question, I present PAR measurementsmade in aquaria across the country. Various lighting systemswere used (i.e., metal halides, fluorescents, PCs, etc. or combin-ations of any of these). Measurements were taken at or aboutthe vicinity of corals that were thriving in captivity, and it giveus a good idea of general light intensities found in home aquar-ia. See Figure 17.
As we can see from Figure 17, light intensities of 80 µmol·m²·secand 100 µmol·m²·sec are easily achievable in home aquaria.However, the same cannot be said for the category of 400 µ-mol·m²·sec since only 13% (approximately) of the lightmeasurements matched or exceeded that category. Very fewaquariums (~1%) with thriving corals reached D'Angelo's highestcategory (700 µmol·m²·sec). We should bear this in mind whileevaluating following information.
In the same vein, we should review the spectral transmissionqualities of the filters used in these experiments. Recall that wedo not know the exact lamps used (although we know theywere 'blue' metal halides). It would be much better to have thespectral signature of the light transmitted through the blue,green and red filters, but we do not.
Most of the cyan fluorescent pigments were expressed moststrongly by the coral animals at 400 µmol·m²·sec (remember,the lamps used in these experiments produced ~50% of theiroutput in the 'blue' region of the spectrum, suggesting theywere high kelvin lamps. Unfortunately, email to the primary in-vestigator requesting clarification has gone unanswered).These pigments include CFP483 (from Acropora pulchra),CFP484 (from Acropora millepora), CFP486 (from Montipora di-gitata), and CFP492 (from Hydnophora grandis).
Figure 17. Light intensities as measured around corals thriving in homeaquaria.
How to Make Corals Colorful, Part One: New Information, With Particular Attention to Blue-Green Fluorescent Pigments
Advanced Aquarist | www.advancedaquarist.com 12 January 2009 | Volume VIII, Issue I
The cyan fluorescent pigment 497 from Acropora millepora be-haved differently - it was expressed most strongly at a lightintensity of only 100 µmol·m²·sec, and was not expressed at allat 700 µmol·m²·sec.
In every case, red light promoted the least amount of colorfulpigmentation although there were considerable differences inthe level of expressions at the given light intensity of 200 µ-mol·m²·sec used in these experiments. For example, the levelsof cyan pigment 486 found in the 'red light' Montipora digitataspecimens were found to be at a level of 50% of that found inthe specimens exposed to blue light. Similarly, the cyan pig-ment 492 levels in the Hydnophora grandis specimens were~40% of those 'blue light' specimens. In all other cases, pigmentexpression in the animals exposed to red light was only 10-15%of that seen in the corals subjected to blue light.
PHOTOCONVERSION, PIGMENT BLEACHING AND
COLOR MIXING
It is common knowledge that corals often contain at more thanone fluorescent pigment (a Favia specimen was found to haveat least one dozen). The combined fluorescence of these pig-ments can and likely will influence our visual perception of theanimal's color in a phenomenon called 'color mixing'. The addi-tion (increase in expression or photoconversion), alternation(photoconversion) or subtraction (photobleaching or decreasein expression) of a pigment can have a profound affect on theanimal's appearance. Figure 18 demonstrates the possible buthypothetical increase or decrease in pigments according tolight intensity alone. Imagine the possibilities we might observewhen we add the effects of spectral quality on pigment expres-sion. The exercise becomes mind boggling, and this is arelatively simple example!
Figure 18. Trend lines show that Pigments 484 and 497 decrease in fluores-cent intensity as PAR increases, while Pigments 512 and 605 increase inintensity. At 80 µmol·m²·sec, this coral would appear blue-green with appar-ent color becoming progressively greener until red and green pigments aredominant at 700 µmol·m²·sec. Is this a case of photoconversion, where lightintensity alters the chemical makeup of pigments and causes them to shiftfrom one fluorescent color to another? Or is this a case of pigment bleach-ing (P-484 and P-497) and light intensity-induced fluorescence (Pigments512 and 605), or both?
There are only a few described cases of photoconversion in cy-an pigments. Two are from Clade A (496 nm to anundetermined wavelength in Condylactis gigantea - Labas et al.,2002); 499 nm to 522 nm Anemonia sculata - Wiedenmann,2002; and one case involves Acropora secale's conversion fromcyan (484 nm) to green (515 nm) - Papina et al., 2002. See Fig-ures 18-20 for additional information.
CONCLUSIONS
Light intensity and its spectral characteristics play importantparts in promotion of coral coloration. Certainly, these are notthe only requirements and become deciding factors only whenother conditions such as water motion and water chemistry arecorrect.
The light intensity categories used by D'Angelo et al. are appar-ently relative to amounts of radiation received by natural reefs.Surprisingly, these categories were fairly close to those seen inaquaria when I divided the number of light measurementsmade in aquaria and divided the total number into 4 categories
Figure 18. Light (mostly likely blue light) induces a shift in fluorescence fromblue-green (484 nm) to green (with a peak emission at 515 nm). After Pap-ina et al., 2002.
Figure 19. A pigment from Clade A, the spectral signature suggests photo-conversion is possible. After Labas et al., 2002.
How to Make Corals Colorful, Part One: New Information, With Particular Attention to Blue-Green Fluorescent Pigments
Advanced Aquarist | www.advancedaquarist.com 13 January 2009 | Volume VIII, Issue I
containing an equal number (see Figure 17). These were myclassifications:
1. Very Low: 15-100 µmol·m²·sec
2. Low: 101-200 µmol·m²·sec
3. Moderate: 201-400 µmol·m²·sec
4. High: 401-700 µmol·m²·sec
Note that light intensities fitting into the moderate/high cat-egories are often found directly beneath high intensity lampsand are comparatively small in area. Hence, some sort of light-measuring device, whether a lux meter or quantum meter,would be most helpful in determining proper placement of cor-als containing cyan fluorescent pigments. See here forcomments on lux-to-PAR conversions:(www.advancedaquarist.com/2008/2/review) and a ProductReview on a relatively inexpensive PAR meter:(www.advancedaquarist.com/2005/7/review).
It will take some time for me to review 11 years of lighting dataI've collected, but I will try to refine these categories before thisseries is completed.
Most of the cyan pigments' maximum fluorescent was noted inlight fields of around 400 µmol·m²·sec (with the exception ofAcropora millepora's pigment 497 that peaked at 100 µ-mol·m²·sec).
When we examine the effects of spectral quality on pigmenta-tion, we find in all cases that blue light promoted theexpression of fluorescent pigmentation most effectively. Greenlight ran second best in promoting fluorescent pigment produc-tion, although the filter used by these researchers transmitted a
Figure 20. The double-peaked emission (and excitation, for that matter)suggests we are observing a pigment in transmission from one peak emis-sion to another (499 nm to 522 nm, which is blue-green to green,respectively). From Wiedenmann, 2002.
fair amount of blue light. The red filter effectively, and almostexclusively, transmitted red wavelengths and was least effect-ive in coaxing the coral animal to produce fluorescentpigments. Lamp spectral quality is another issue that should beinvestigated further.
In conclusion, the amount of light required to make corals'color up' is not particularly difficult to achieve, although thelow and high coloration thresholds can be fairly narrow (as inthe case of Pigment 486 found in Montipora digitata). Perhapsmore importantly, the production and/or maintenance of cyanpigments are not as sensitive to spectral quality (especially tored light) as some of the pigments we'll examine in future art-icles. Simple visual observations of corals within our aquariasupport the experimental evidence that blue-green pigmentsare not all that difficult for corals to produce with these artifi-cial environments.
The negative effects of exposure to red light for prolongedperiods (exceeding ~30 days or so) are becoming more appar-ent. In this article, we see that red light apparently fails topromote coral coloration as efficiently as either green or bluebandwidths. We discussed the effects of red light on coralgrowth in the December 2008 edition of Advanced Aquarist.See here for details: www.advancedaquarist.com/2008/12/aafeature1
The concept and practice of classifying pigments by clade is an-other important step. Previously, our best method ofcategorizing pigments was by fluorescence excitation and,more particularly, emission. While we can not say that pigmentswithin a certain clade will react in roughly the same manner asanother pigment within the same clade, we can begin to formgeneralizations. With time, the clade categories will probablyprove to be an important tool in our understanding of fluores-cent pigments and their production and maintenance.
I'm presently working on a project with the goal of finding aninexpensive method of classifying the particular fluorescentpigment(s) within corals. If successful, I'll present this informa-tion in a future article.
With that, our examination of fluorescent pigments will end forthis time. Next month, we'll look at new information on greenfluorescent pigments and how light intensity and quality pro-motes or discourages pigmentation. Future articles will focuson orange and red fluorescent proteins. This series will closewith a look at the non-fluorescent chromoproteins found in somany corals. A complete reference list will appear in thatarticle.
How to Make Corals Colorful, Part One: New Information, With Particular Attention to Blue-Green Fluorescent Pigments
Advanced Aquarist | www.advancedaquarist.com 14 January 2009 | Volume VIII, Issue I
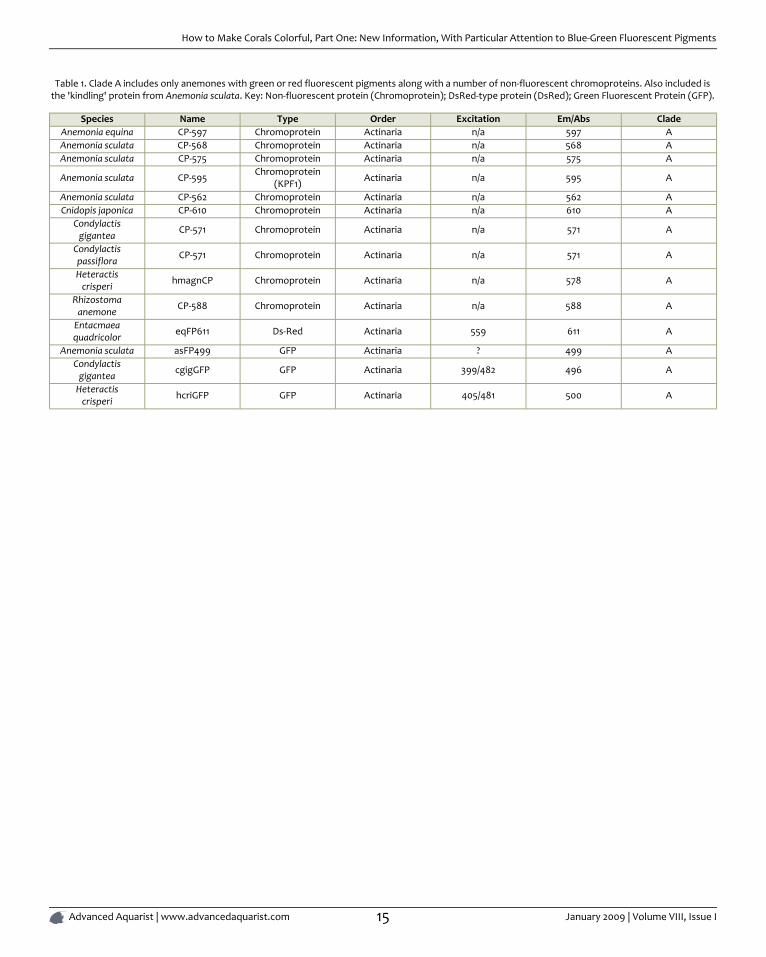
Table 1. Clade A includes only anemones with green or red fluorescent pigments along with a number of non-fluorescent chromoproteins. Also included isthe 'kindling' protein from Anemonia sculata. Key: Non-fluorescent protein (Chromoprotein); DsRed-type protein (DsRed); Green Fluorescent Protein (GFP).
Species Name Type Order Excitation Em/Abs CladeAnemonia equina CP-597 Chromoprotein Actinaria n/a 597 AAnemonia sculata CP-568 Chromoprotein Actinaria n/a 568 AAnemonia sculata CP-575 Chromoprotein Actinaria n/a 575 A
Anemonia sculata CP-595 Chromoprotein(KPF1) Actinaria n/a 595 A
Anemonia sculata CP-562 Chromoprotein Actinaria n/a 562 ACnidopis japonica CP-610 Chromoprotein Actinaria n/a 610 A
Condylactisgigantea CP-571 Chromoprotein Actinaria n/a 571 A
Condylactispassiflora CP-571 Chromoprotein Actinaria n/a 571 A
Heteractiscrisperi hmagnCP Chromoprotein Actinaria n/a 578 A
Rhizostomaanemone CP-588 Chromoprotein Actinaria n/a 588 A
Entacmaeaquadricolor eqFP611 Ds-Red Actinaria 559 611 A
Anemonia sculata asFP499 GFP Actinaria ? 499 ACondylactis
gigantea cgigGFP GFP Actinaria 399/482 496 A
Heteractiscrisperi hcriGFP GFP Actinaria 405/481 500 A
How to Make Corals Colorful, Part One: New Information, With Particular Attention to Blue-Green Fluorescent Pigments
Advanced Aquarist | www.advancedaquarist.com 15 January 2009 | Volume VIII, Issue I
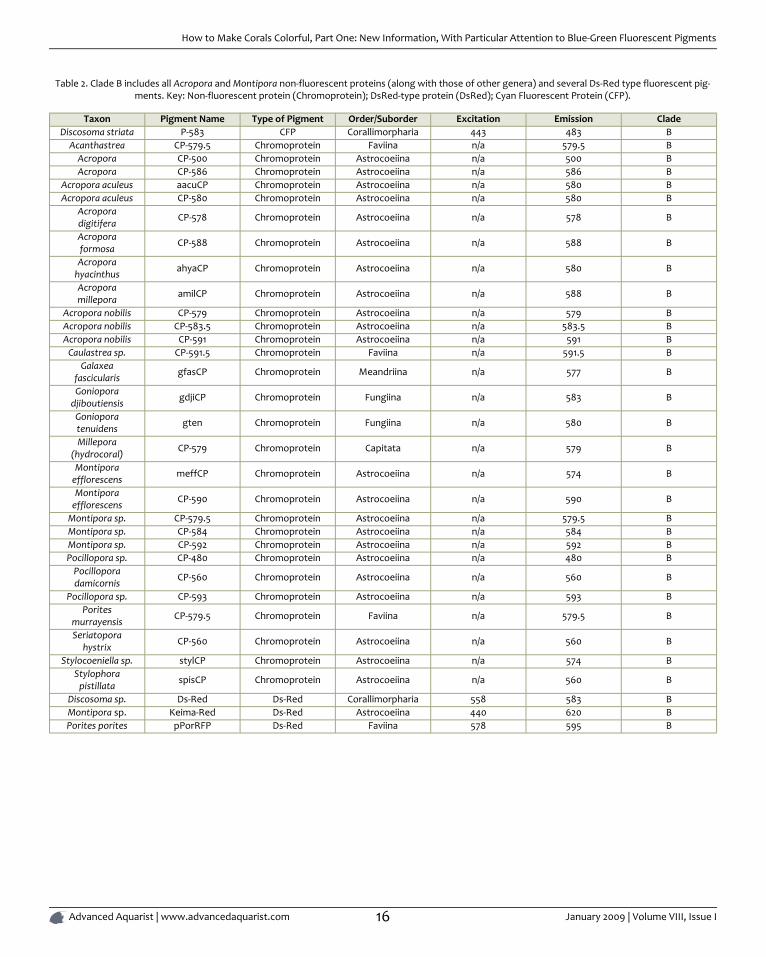
Table 2. Clade B includes all Acropora and Montipora non-fluorescent proteins (along with those of other genera) and several Ds-Red type fluorescent pig-ments. Key: Non-fluorescent protein (Chromoprotein); DsRed-type protein (DsRed); Cyan Fluorescent Protein (CFP).
Taxon Pigment Name Type of Pigment Order/Suborder Excitation Emission CladeDiscosoma striata P-583 CFP Corallimorpharia 443 483 B
Acanthastrea CP-579.5 Chromoprotein Faviina n/a 579.5 BAcropora CP-500 Chromoprotein Astrocoeiina n/a 500 BAcropora CP-586 Chromoprotein Astrocoeiina n/a 586 B
Acropora aculeus aacuCP Chromoprotein Astrocoeiina n/a 580 BAcropora aculeus CP-580 Chromoprotein Astrocoeiina n/a 580 B
Acroporadigitifera CP-578 Chromoprotein Astrocoeiina n/a 578 B
Acroporaformosa CP-588 Chromoprotein Astrocoeiina n/a 588 B
Acroporahyacinthus ahyaCP Chromoprotein Astrocoeiina n/a 580 B
Acroporamillepora amilCP Chromoprotein Astrocoeiina n/a 588 B
Acropora nobilis CP-579 Chromoprotein Astrocoeiina n/a 579 BAcropora nobilis CP-583.5 Chromoprotein Astrocoeiina n/a 583.5 BAcropora nobilis CP-591 Chromoprotein Astrocoeiina n/a 591 B
Caulastrea sp. CP-591.5 Chromoprotein Faviina n/a 591.5 BGalaxea
fascicularis gfasCP Chromoprotein Meandriina n/a 577 B
Gonioporadjiboutiensis gdjiCP Chromoprotein Fungiina n/a 583 B
Gonioporatenuidens gten Chromoprotein Fungiina n/a 580 B
Millepora(hydrocoral) CP-579 Chromoprotein Capitata n/a 579 B
Montiporaefflorescens meffCP Chromoprotein Astrocoeiina n/a 574 B
Montiporaefflorescens CP-590 Chromoprotein Astrocoeiina n/a 590 B
Montipora sp. CP-579.5 Chromoprotein Astrocoeiina n/a 579.5 BMontipora sp. CP-584 Chromoprotein Astrocoeiina n/a 584 BMontipora sp. CP-592 Chromoprotein Astrocoeiina n/a 592 BPocillopora sp. CP-480 Chromoprotein Astrocoeiina n/a 480 B
Pocilloporadamicornis CP-560 Chromoprotein Astrocoeiina n/a 560 B
Pocillopora sp. CP-593 Chromoprotein Astrocoeiina n/a 593 BPorites
murrayensis CP-579.5 Chromoprotein Faviina n/a 579.5 B
Seriatoporahystrix CP-560 Chromoprotein Astrocoeiina n/a 560 B
Stylocoeniella sp. stylCP Chromoprotein Astrocoeiina n/a 574 BStylophora
pistillata spisCP Chromoprotein Astrocoeiina n/a 560 B
Discosoma sp. Ds-Red Ds-Red Corallimorpharia 558 583 BMontipora sp. Keima-Red Ds-Red Astrocoeiina 440 620 BPorites porites pPorRFP Ds-Red Faviina 578 595 B
How to Make Corals Colorful, Part One: New Information, With Particular Attention to Blue-Green Fluorescent Pigments
Advanced Aquarist | www.advancedaquarist.com 16 January 2009 | Volume VIII, Issue I
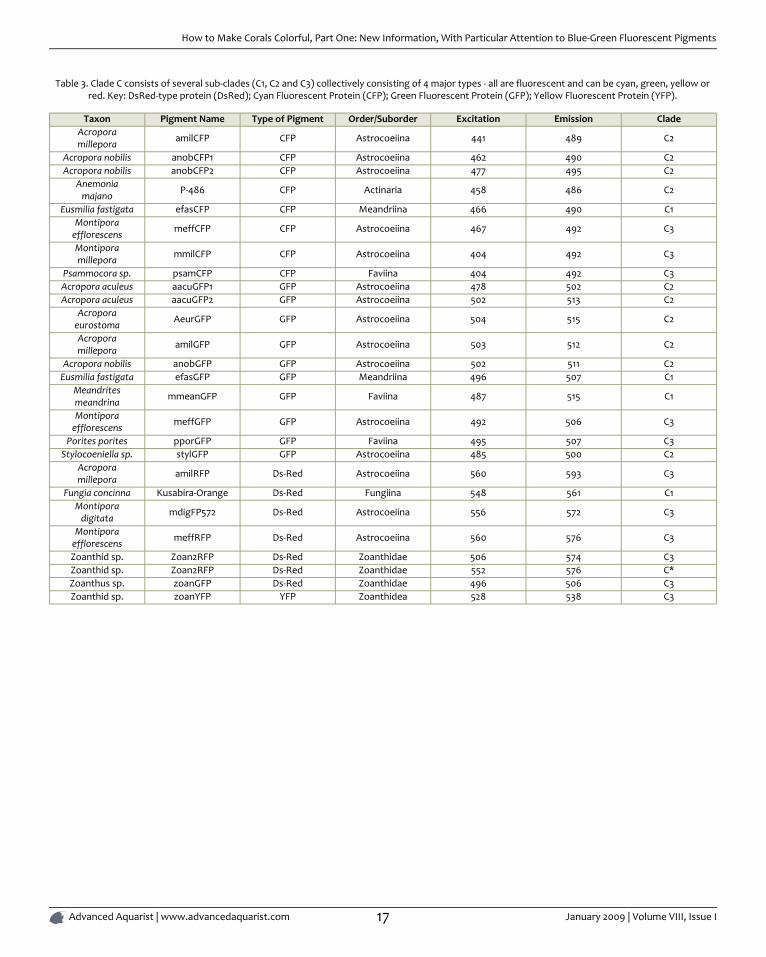
Table 3. Clade C consists of several sub-clades (C1, C2 and C3) collectively consisting of 4 major types - all are fluorescent and can be cyan, green, yellow orred. Key: DsRed-type protein (DsRed); Cyan Fluorescent Protein (CFP); Green Fluorescent Protein (GFP); Yellow Fluorescent Protein (YFP).
Taxon Pigment Name Type of Pigment Order/Suborder Excitation Emission CladeAcroporamillepora amilCFP CFP Astrocoeiina 441 489 C2
Acropora nobilis anobCFP1 CFP Astrocoeiina 462 490 C2Acropora nobilis anobCFP2 CFP Astrocoeiina 477 495 C2
Anemoniamajano P-486 CFP Actinaria 458 486 C2
Eusmilia fastigata efasCFP CFP Meandriina 466 490 C1Montipora
efflorescens meffCFP CFP Astrocoeiina 467 492 C3
Montiporamillepora mmilCFP CFP Astrocoeiina 404 492 C3
Psammocora sp. psamCFP CFP Faviina 404 492 C3Acropora aculeus aacuGFP1 GFP Astrocoeiina 478 502 C2Acropora aculeus aacuGFP2 GFP Astrocoeiina 502 513 C2
Acroporaeurostoma AeurGFP GFP Astrocoeiina 504 515 C2
Acroporamillepora amilGFP GFP Astrocoeiina 503 512 C2
Acropora nobilis anobGFP GFP Astrocoeiina 502 511 C2Eusmilia fastigata efasGFP GFP Meandriina 496 507 C1
Meandritesmeandrina mmeanGFP GFP Faviina 487 515 C1
Montiporaefflorescens meffGFP GFP Astrocoeiina 492 506 C3
Porites porites pporGFP GFP Faviina 495 507 C3Stylocoeniella sp. stylGFP GFP Astrocoeiina 485 500 C2
Acroporamillepora amilRFP Ds-Red Astrocoeiina 560 593 C3
Fungia concinna Kusabira-Orange Ds-Red Fungiina 548 561 C1Montipora
digitata mdigFP572 Ds-Red Astrocoeiina 556 572 C3
Montiporaefflorescens meffRFP Ds-Red Astrocoeiina 560 576 C3
Zoanthid sp. Zoan2RFP Ds-Red Zoanthidae 506 574 C3Zoanthid sp. Zoan2RFP Ds-Red Zoanthidae 552 576 C*Zoanthus sp. zoanGFP Ds-Red Zoanthidae 496 506 C3Zoanthid sp. zoanYFP YFP Zoanthidea 528 538 C3
How to Make Corals Colorful, Part One: New Information, With Particular Attention to Blue-Green Fluorescent Pigments
Advanced Aquarist | www.advancedaquarist.com 17 January 2009 | Volume VIII, Issue I
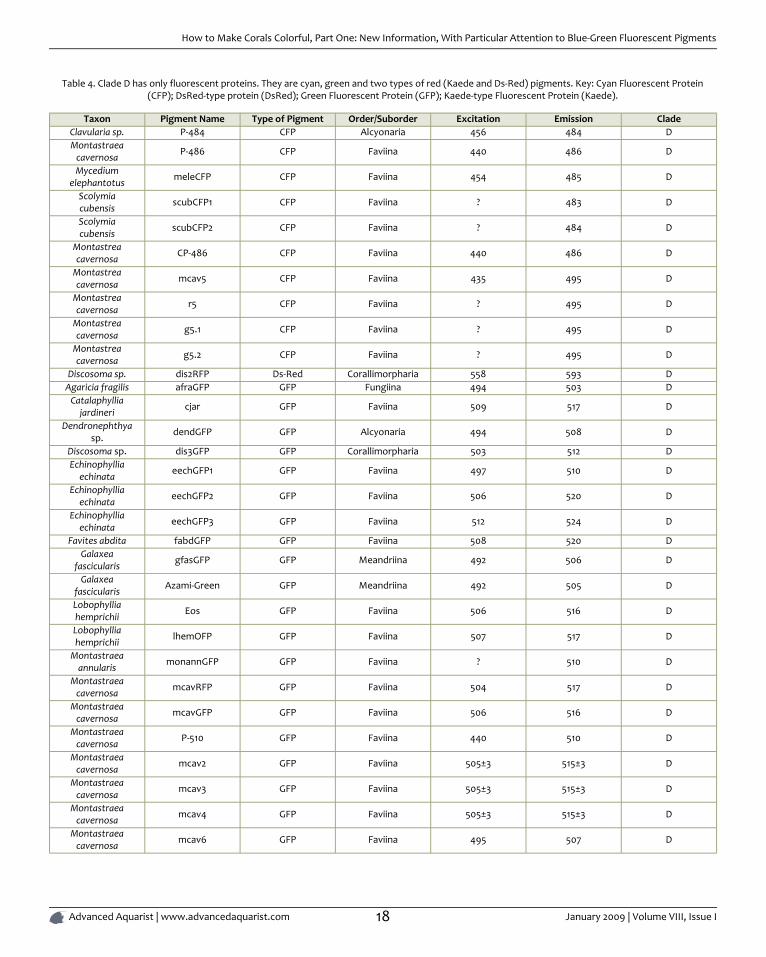
Table 4. Clade D has only fluorescent proteins. They are cyan, green and two types of red (Kaede and Ds-Red) pigments. Key: Cyan Fluorescent Protein(CFP); DsRed-type protein (DsRed); Green Fluorescent Protein (GFP); Kaede-type Fluorescent Protein (Kaede).
Taxon Pigment Name Type of Pigment Order/Suborder Excitation Emission CladeClavularia sp. P-484 CFP Alcyonaria 456 484 DMontastraea
cavernosa P-486 CFP Faviina 440 486 D
Mycediumelephantotus meleCFP CFP Faviina 454 485 D
Scolymiacubensis scubCFP1 CFP Faviina ? 483 D
Scolymiacubensis scubCFP2 CFP Faviina ? 484 D
Montastreacavernosa CP-486 CFP Faviina 440 486 D
Montastreacavernosa mcav5 CFP Faviina 435 495 D
Montastreacavernosa r5 CFP Faviina ? 495 D
Montastreacavernosa g5.1 CFP Faviina ? 495 D
Montastreacavernosa g5.2 CFP Faviina ? 495 D
Discosoma sp. dis2RFP Ds-Red Corallimorpharia 558 593 DAgaricia fragilis afraGFP GFP Fungiina 494 503 D
Catalaphylliajardineri cjar GFP Faviina 509 517 D
Dendronephthyasp. dendGFP GFP Alcyonaria 494 508 D
Discosoma sp. dis3GFP GFP Corallimorpharia 503 512 DEchinophyllia
echinata eechGFP1 GFP Faviina 497 510 D
Echinophylliaechinata eechGFP2 GFP Faviina 506 520 D
Echinophylliaechinata eechGFP3 GFP Faviina 512 524 D
Favites abdita fabdGFP GFP Faviina 508 520 DGalaxea
fascicularis gfasGFP GFP Meandriina 492 506 D
Galaxeafascicularis Azami-Green GFP Meandriina 492 505 D
Lobophylliahemprichii Eos GFP Faviina 506 516 D
Lobophylliahemprichii lhemOFP GFP Faviina 507 517 D
Montastraeaannularis monannGFP GFP Faviina ? 510 D
Montastraeacavernosa mcavRFP GFP Faviina 504 517 D
Montastraeacavernosa mcavGFP GFP Faviina 506 516 D
Montastraeacavernosa P-510 GFP Faviina 440 510 D
Montastraeacavernosa mcav2 GFP Faviina 505±3 515±3 D
Montastraeacavernosa mcav3 GFP Faviina 505±3 515±3 D
Montastraeacavernosa mcav4 GFP Faviina 505±3 515±3 D
Montastraeacavernosa mcav6 GFP Faviina 495 507 D
How to Make Corals Colorful, Part One: New Information, With Particular Attention to Blue-Green Fluorescent Pigments
Advanced Aquarist | www.advancedaquarist.com 18 January 2009 | Volume VIII, Issue I
Taxon Pigment Name Type of Pigment Order/Suborder Excitation Emission CladeMontastraea
cavernosa r2 GFP Faviina ? 522 D
Montastraeacavernosa r3 GFP Faviina ? 514 D
Montastraeacavernosa r4 GFP Faviina ? 519 D
Montastraeacavernosa r7 GFP Faviina ? 505 D
Montastraeacavernosa g1.2 GFP Faviina ? 518 D
Montastraeacavernosa g4 GFP Faviina ? 518 D
Montastraeacavernosa g6 GFP Faviina ? 507 D
Montastraeafaveolata monfavGFP1 GFP Faviina 440 510-520 D
Pectiniidae Dronpa GFP Faviina 503 518 DPlatygyralamellina plamGFP GFP Faviina 502 514 D
Ricordea florida P-510 GFP Corallimorpharia ? 510 DRicordea florida P-513 GFP Corallimorpharia ? 513 DRicordea florida P-517 GFP Corallimorpharia 506 517 DRicordea florida rfloGFP GFP Corallimorpharia 508 518 DRicordea florida P-520 GFP Corallimorpharia ? 520 DRicordea florida P-573 GFP Corallimorpharia ? 573 DRicordea florida rfloRFP GFP Corallimorpharia 506 574 DSarcophyton sp. sarcGFP GFP Octocorallia 483 500 D
Scolymiacubensis scubGFP1 GFP Faviina 497 506 D
Scolymiacubensis scubGFP2 GFP Faviina 497 506 D
Trachyphylliageoffroyi P-518 GFP Faviina 508 518 D
Catalaphylliajardineri cjar Kaede Faviina 573 582 D
Dendronephthyasp. Dendra Kaede Alcyonaria 557 575 D
Echinophylliaechinata eechRFP Kaede Faviina 574 582 D
Favia favus P-582 Kaede Faviina 583 582 DFavia speciosa P-582 Kaede Faviina 422 582 D
Lobophylliahemprichii EOS Kaede Faviina 571 581 D
Lobophylliahemprichii lhemOFP Kaede Faviina 543 574 D
Montastraeacavernosa P-575 Kaede Faviina 525 575 D
Montastraeacavernosa mcav1 Kaede Faviina 508 582 D
Montastraeacavernosa r1.1 Kaede Faviina ? 582 D
Montastraeacavernosa r1.2 Kaede Faviina ? 582 D
Montastraeacavernosa g1.1 Kaede Faviina ? 582 D
Montastraeacavernosa mcavRFP Kaede Faviina 573 582 D
Montastraeacavernosa mcavRFP Kaede Faviina 508 520/580 D
How to Make Corals Colorful, Part One: New Information, With Particular Attention to Blue-Green Fluorescent Pigments
Advanced Aquarist | www.advancedaquarist.com 19 January 2009 | Volume VIII, Issue I
Taxon Pigment Name Type of Pigment Order/Suborder Excitation Emission CladeMycedium
elephantotus meleRFP Kaede Faviina 573 579 D
Plesiastreaverispora P-574 Kaede Faviina 560 574 D
Ricordea florida rfloRFP Kaede Corallimorpharia ? 576 DScolymiacubensis scubRFP Kaede Faviina 570 578 D
Trachyphylliageoffroyi Kaede Kaede Faviina 558 582 D
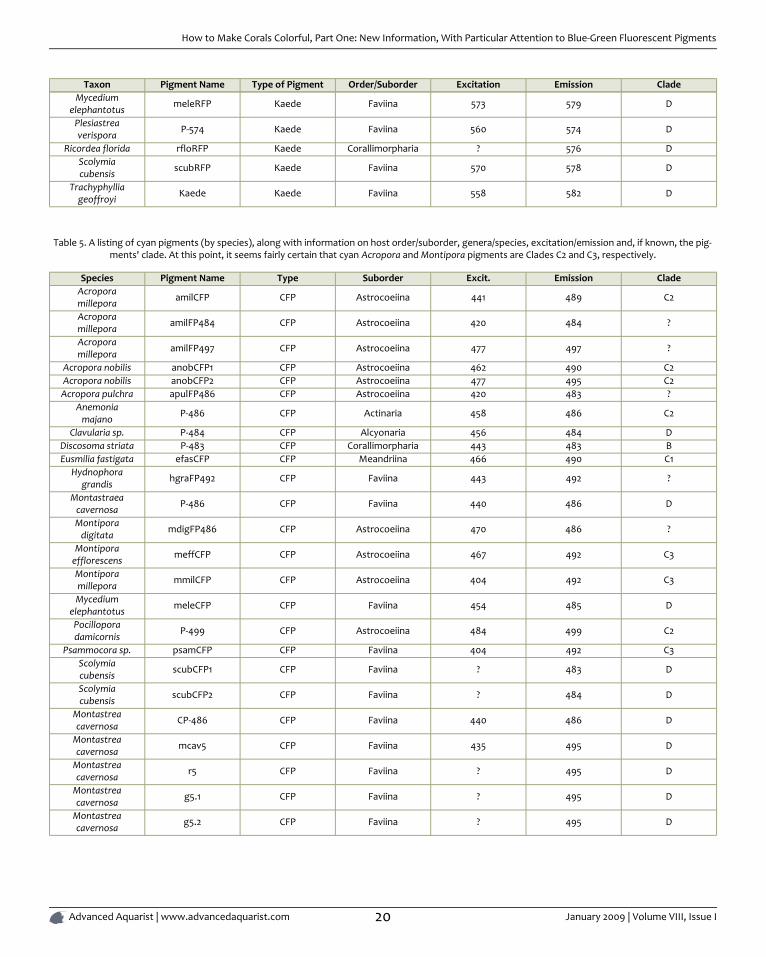
Table 5. A listing of cyan pigments (by species), along with information on host order/suborder, genera/species, excitation/emission and, if known, the pig-ments' clade. At this point, it seems fairly certain that cyan Acropora and Montipora pigments are Clades C2 and C3, respectively.
Species Pigment Name Type Suborder Excit. Emission CladeAcroporamillepora amilCFP CFP Astrocoeiina 441 489 C2
Acroporamillepora amilFP484 CFP Astrocoeiina 420 484 ?
Acroporamillepora amilFP497 CFP Astrocoeiina 477 497 ?
Acropora nobilis anobCFP1 CFP Astrocoeiina 462 490 C2Acropora nobilis anobCFP2 CFP Astrocoeiina 477 495 C2Acropora pulchra apulFP486 CFP Astrocoeiina 420 483 ?
Anemoniamajano P-486 CFP Actinaria 458 486 C2
Clavularia sp. P-484 CFP Alcyonaria 456 484 DDiscosoma striata P-483 CFP Corallimorpharia 443 483 BEusmilia fastigata efasCFP CFP Meandriina 466 490 C1
Hydnophoragrandis hgraFP492 CFP Faviina 443 492 ?
Montastraeacavernosa P-486 CFP Faviina 440 486 D
Montiporadigitata mdigFP486 CFP Astrocoeiina 470 486 ?
Montiporaefflorescens meffCFP CFP Astrocoeiina 467 492 C3
Montiporamillepora mmilCFP CFP Astrocoeiina 404 492 C3
Mycediumelephantotus meleCFP CFP Faviina 454 485 D
Pocilloporadamicornis P-499 CFP Astrocoeiina 484 499 C2
Psammocora sp. psamCFP CFP Faviina 404 492 C3Scolymiacubensis scubCFP1 CFP Faviina ? 483 D
Scolymiacubensis scubCFP2 CFP Faviina ? 484 D
Montastreacavernosa CP-486 CFP Faviina 440 486 D
Montastreacavernosa mcav5 CFP Faviina 435 495 D
Montastreacavernosa r5 CFP Faviina ? 495 D
Montastreacavernosa g5.1 CFP Faviina ? 495 D
Montastreacavernosa g5.2 CFP Faviina ? 495 D
How to Make Corals Colorful, Part One: New Information, With Particular Attention to Blue-Green Fluorescent Pigments
Advanced Aquarist | www.advancedaquarist.com 20 January 2009 | Volume VIII, Issue I
F E A T U R E A R T I C L E
THE DEVELOPMENT OF A METHOD FOR THE
QUANTITATIVE EVALUATION OF PROTEIN SKIMMER
PERFORMANCE
By Ken S. Feldman, Kelly M. Maers, Lauren F. Vernese, Elizabeth A. Huber, Matthew R.Test
Department of Chemistry, The Pennsylvania State University, University Park, PA 16802. Protein skimmershave become indispensable for many aquarists who strive to maintain the high water quality necessary tokeep stony corals.
© Pomacanthus Publications, LLCPublished January 2009, Advanced Aquarist's Online Magazine.
Keywords (AdvancedAquarist.com Search Enabled): Elizabeth A. Huber, Feature Article, Kelly M. Maers, Ken S. Feldman, Lauren F. Vernese, Matthew R. Test, Pumps,Skimmers, Water QualityLink to original article: http://www.advancedaquarist.com/2009/1/aafeature2
P urifying aquarium water with a protein skimmer represents
one of the major strategies for maintaining water quality. Thissingular piece of equipment can often constitute the major set-up capital expense after the tank itself. With its presumablypivotal role in aquarium husbandry and its high price tag, it is nosurprise that skimmer manufacturers strive to outdo one anoth-er with their exhortations and grandiose claims. For example,what aquarist can resist statements like:
Euroreef:
"Custom modified pumps, "Euro-AirTM" venturis, and"Euro-WheelTM" pinwheel style impellers are com-bined to create that incredible volume of microbubbles that provide the immense surface area result-ing in unrivaled quick removal or organics resulting ina healthy aquarium."
"The efficiency achieved with this design translates in-to higher performance at a lower operating cost toyou!"
Precision Marine:
"These skimmers will outperform anything in theirclass."
"Our fractionators strip organics from the systemquickly due to the high flow rates they are designed tooperate."
AETech (ETSS):
"This provides certain unique operational propertiesset it apart from the rest of the ETSS line. Giving yourtank gentle but highly effective waste removal thatwill never over skim your aquarium. It creates thefinest bubble size that totally fills the skimmer bodywith so much air that it turns the water to a solid milkcolor. The countercurrent action allows for far greaterair water contact time and reduces the amount of wetfoaming to a minimum."
The Development of a Method for the Quantitative Evaluation of Protein Skimmer Performance
Advanced Aquarist | www.advancedaquarist.com 21 January 2009 | Volume VIII, Issue I
These statements, which are representative and certainly notunique amongst skimmer manufacturers, raise a series ofquestions:
• What is the factual basis for these claims?
• How do the skimmer manufacturers assay skimmer"performance"?
• Are there any metrics at all available to quantify skimmerperformance?
• What does the concept of performance even mean whendiscussing skimmers?
In the article to follow, we present a new approach to address-ing these questions. We will introduce concrete definitions forskimmer performance that focus on both the rate of organiccontaminant removal and the extent of organic contaminant re-moval from saltwater. We then will introduce an experimentalprocedure, based on a model system, to measure these per-formance metrics for four representative skimmers. Finally, wewill show how this model system accurately replicates skimmerperformance with authentic aquarium water. We hope thatthese advances will prove valuable in the hands of forwardthinking skimmer designers by providing the means to optimizeskimmer performance as a function of both design variablesand operational variables. Thus, it actually might be possible toprovide, for the first time, unequivocal evidence in support ofthe claims of "best" so indiscriminately dispensed today.
WHAT IS PROTEIN SKIMMING?
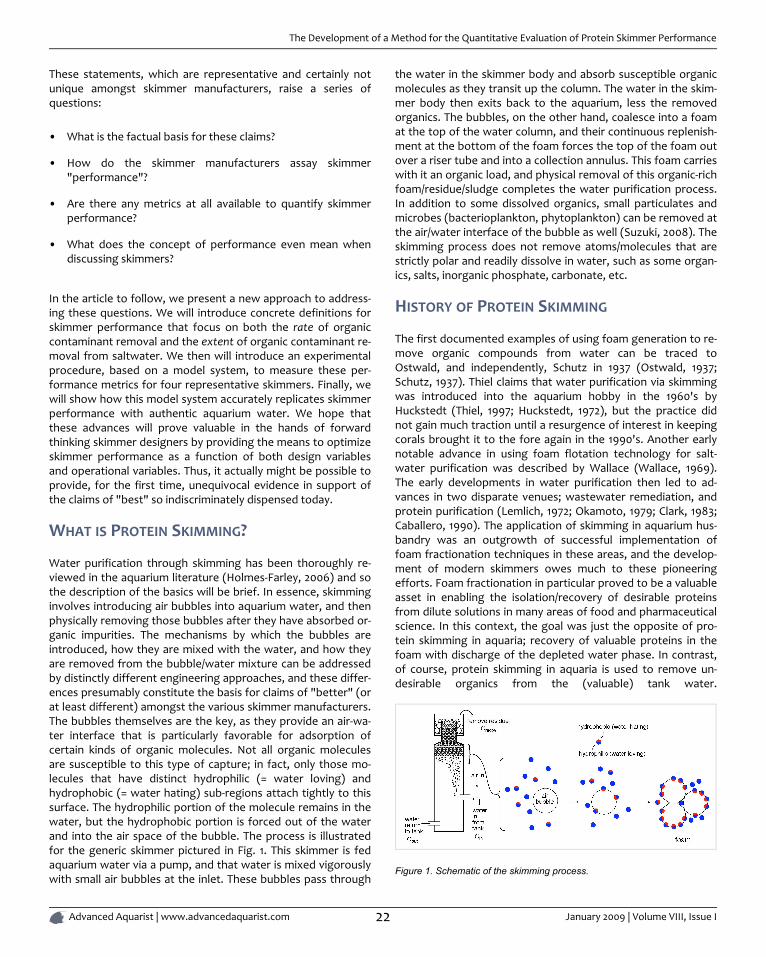
Water purification through skimming has been thoroughly re-viewed in the aquarium literature (Holmes-Farley, 2006) and sothe description of the basics will be brief. In essence, skimminginvolves introducing air bubbles into aquarium water, and thenphysically removing those bubbles after they have absorbed or-ganic impurities. The mechanisms by which the bubbles areintroduced, how they are mixed with the water, and how theyare removed from the bubble/water mixture can be addressedby distinctly different engineering approaches, and these differ-ences presumably constitute the basis for claims of "better" (orat least different) amongst the various skimmer manufacturers.The bubbles themselves are the key, as they provide an air-wa-ter interface that is particularly favorable for adsorption ofcertain kinds of organic molecules. Not all organic moleculesare susceptible to this type of capture; in fact, only those mo-lecules that have distinct hydrophilic (= water loving) andhydrophobic (= water hating) sub-regions attach tightly to thissurface. The hydrophilic portion of the molecule remains in thewater, but the hydrophobic portion is forced out of the waterand into the air space of the bubble. The process is illustratedfor the generic skimmer pictured in Fig. 1. This skimmer is fedaquarium water via a pump, and that water is mixed vigorouslywith small air bubbles at the inlet. These bubbles pass through
the water in the skimmer body and absorb susceptible organicmolecules as they transit up the column. The water in the skim-mer body then exits back to the aquarium, less the removedorganics. The bubbles, on the other hand, coalesce into a foamat the top of the water column, and their continuous replenish-ment at the bottom of the foam forces the top of the foam outover a riser tube and into a collection annulus. This foam carrieswith it an organic load, and physical removal of this organic-richfoam/residue/sludge completes the water purification process.In addition to some dissolved organics, small particulates andmicrobes (bacterioplankton, phytoplankton) can be removed atthe air/water interface of the bubble as well (Suzuki, 2008). Theskimming process does not remove atoms/molecules that arestrictly polar and readily dissolve in water, such as some organ-ics, salts, inorganic phosphate, carbonate, etc.
HISTORY OF PROTEIN SKIMMING
The first documented examples of using foam generation to re-move organic compounds from water can be traced toOstwald, and independently, Schutz in 1937 (Ostwald, 1937;Schutz, 1937). Thiel claims that water purification via skimmingwas introduced into the aquarium hobby in the 1960's byHuckstedt (Thiel, 1997; Huckstedt, 1972), but the practice didnot gain much traction until a resurgence of interest in keepingcorals brought it to the fore again in the 1990's. Another earlynotable advance in using foam flotation technology for salt-water purification was described by Wallace (Wallace, 1969).The early developments in water purification then led to ad-vances in two disparate venues; wastewater remediation, andprotein purification (Lemlich, 1972; Okamoto, 1979; Clark, 1983;Caballero, 1990). The application of skimming in aquarium hus-bandry was an outgrowth of successful implementation offoam fractionation techniques in these areas, and the develop-ment of modern skimmers owes much to these pioneeringefforts. Foam fractionation in particular proved to be a valuableasset in enabling the isolation/recovery of desirable proteinsfrom dilute solutions in many areas of food and pharmaceuticalscience. In this context, the goal was just the opposite of pro-tein skimming in aquaria; recovery of valuable proteins in thefoam with discharge of the depleted water phase. In contrast,of course, protein skimming in aquaria is used to remove un-desirable organics from the (valuable) tank water.
Figure 1. Schematic of the skimming process.
The Development of a Method for the Quantitative Evaluation of Protein Skimmer Performance
Advanced Aquarist | www.advancedaquarist.com 22 January 2009 | Volume VIII, Issue I
Nevertheless, the processes are identical, a conceptual conver-gence that becomes important in assessing the influence ofvarious input parameters on skimmer performance. Specifically,the pivotal role of foam fractionation-based purification in pro-tein recovery has prompted many research groups to conductstudies designed to optimize protein purification by tweakinginput variables. It is possible that these studies can inform theaquarium skimming area as well. Much effort has been directedto measuring how changes in (a) gas flow rate, (b) liquid flowrate, and (c) bubble size influence two important figures-of-merit in the protein purification (and by inference, aquariumskimming) area; enrichment (E) and recovery (R). Enrichment(E) is defined slightly differently by different authors. Some au-thors describe E as the ratio of the protein concentration in the(collapsed and removed) foam head relative to the protein con-centration in the skimmer feed solution (E = Crecov/Cin in Fig. 1)(Uraizee, 1996; Brown, 1990), whereas other authors define thisquantity as the ratio of protein concentration in the foam headcompared to the protein concentration in the output solutionof the skimmer (E = Crecov/Cout in Fig. 1) (Ahmed, 1975; Schnepf,1959). The numbers obtained by these two definitions do notdiffer greatly, and so this distinction is not critical. A secondfigure-of-merit often cited in these skimmer performance stud-ies is recovery (R), which is defined as the amount of proteinremoved from the solution by the skimmer relative to theamount of protein fed into the skimmer. The recovery R can beexpressed as a percent of protein removed after a specifiedtime: i.e., 50% of the protein has been recovered after 90minutes. These two measurable quantities typically run in op-posite directions; that is, those changes that increase theenrichment typically decrease the recovery, and vice versa.
Both enrichment and recovery have counterparts in the aquari-um skimming area. Dry skimming implies very little water hold-up in the foam, and this scenario is more closely aligned withenrichment. Thus, maximizing foam enrichment while dry skim-ming should maximize impurity removal from aquarium water.In contrast, wet skimming, with its proportionally larger liquidhold-up in the foam, falls more under the aegis of the"recovery" manifold of skimmer operation. That is, the removalof organic-rich foam and entrained aquarium water that con-tains organics (= wet skimming) should lead to a greater overallremoval of the organic impurities in the aquarium water. In thiscase, maximizing recovery R should lead to maximizing waterpurification. To the extent that an aquarist aligns their skim-ming technique with one or the other extreme, then thelessons learned about optimizing either enrichment or recoverymight prove insightful. Wet skimming bears the added burdenof introducing possible salinity fluctuations, as the aquariumwater removed in the foam phase must be replaced by water ofequivalent salinity in order to maintain the overall tank's salin-ity. To the extent that this match is not maintained, the tank'soverall salinity may vary. Thus, a compromise between wet anddry skimming often is sought.
In the final analysis, any operational parameter changes that in-crease the amount of organic material removed from the
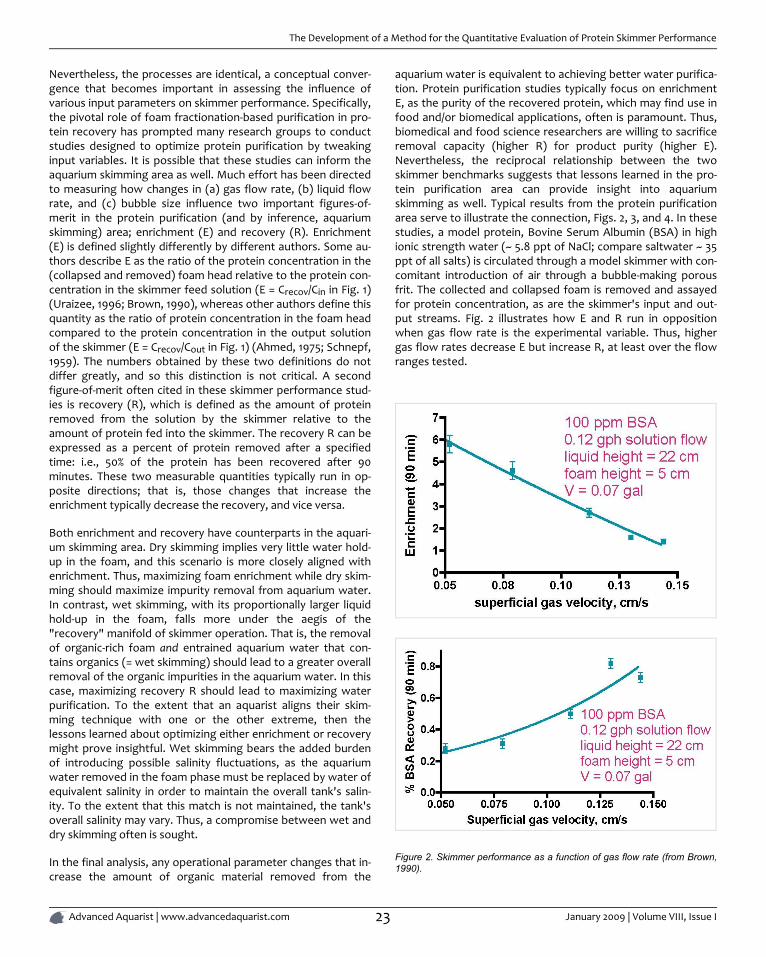
aquarium water is equivalent to achieving better water purifica-tion. Protein purification studies typically focus on enrichmentE, as the purity of the recovered protein, which may find use infood and/or biomedical applications, often is paramount. Thus,biomedical and food science researchers are willing to sacrificeremoval capacity (higher R) for product purity (higher E).Nevertheless, the reciprocal relationship between the twoskimmer benchmarks suggests that lessons learned in the pro-tein purification area can provide insight into aquariumskimming as well. Typical results from the protein purificationarea serve to illustrate the connection, Figs. 2, 3, and 4. In thesestudies, a model protein, Bovine Serum Albumin (BSA) in highionic strength water (~ 5.8 ppt of NaCl; compare saltwater ~ 35ppt of all salts) is circulated through a model skimmer with con-comitant introduction of air through a bubble-making porousfrit. The collected and collapsed foam is removed and assayedfor protein concentration, as are the skimmer's input and out-put streams. Fig. 2 illustrates how E and R run in oppositionwhen gas flow rate is the experimental variable. Thus, highergas flow rates decrease E but increase R, at least over the flowranges tested.
Figure 2. Skimmer performance as a function of gas flow rate (from Brown,1990).
The Development of a Method for the Quantitative Evaluation of Protein Skimmer Performance
Advanced Aquarist | www.advancedaquarist.com 23 January 2009 | Volume VIII, Issue I
A comprehensive and quantitative explanation for these trends(E or R vs. gas flow rate) is lacking, but a qualitative rationalefor these observations has been developed (Brown, 1996; Ura-izee, 1996; Du, 2000; Wong, 2001; Rosa, 2007). The key is thebehavior of the bubbles, both as they transverse the solutionabsorbing BSA, and then in the foam, where they coalesce.There are several different properties of bubbles in these differ-ent environments that impact the overall E or R, and some ofthese properties run in opposition. Thus, the aggregate ob-served behavior (increasing or decreasing E and R) reflects thecompetition between these opposing phenomena. Specifically,
1. The surface area of the bubbles is a key parameter, asthat is where protein absorption occurs. Smaller bubbleshave a greater surface area per unit volume. In solution,the bubbles are nearly spherical, and the surface area, A,= 6/d (d = diameter of the bubble). In the foam, thebubbles actually adopt a dodecahedral shape (= 12 sided)as a consequence of its six nearest neighbor interactions,and A = 6.6/d (Du, 2001). So, in the liquid phase, smallerbubbles will lead to greater bubble surface area for a giv-en volume, which in turn enhances both enrichment andrecovery.
2. Liquid entrained in the foam drains back down from thefoam phase into the bulk solution. For a variety of com-plicated reasons, larger bubbles result in faster foamdrainage. In general, this drainage serves to increase en-richment, E, as it removes from the foam some liquidwhich is not as rich in protein as are the bubbles them-selves. By default, the remaining foam then is more highlyenriched in protein, leading to a larger measured E. Forthese reasons, larger bubbles in the foam phase increaseenrichment.
But, what factors influence the bubble size?
The relationship between superficial gas flow rate and bubblesize is complex and appears to depend on the details of thebubble generation process. In the Brown work cited above,faster gas velocities lead to marginally smaller bubbles for the4-10 µM frit size employed (Brown, 1990). Using frits with largerpore sizes for bubble formation than the one Brown et al. em-ployed in generating the data of Fig. 2, Rosa and,independently, Wong, and Tanner report that the bubble sizeslightly increases with increasing superficial gas velocity (Wong,2001; Du, 2002; Rosa, 2007). Enhanced bubble coalescence dueto more bubble-bubble collisions at the faster gas flow rates iscited as the rationale (Wong, 2001). In no case are the changesin bubble size very large as the gas flow rate varies over therange examined.
As far as enrichment vs. gas flow rate goes, drainage from lar-ger bubbles in the foam (point 2 above) appears topredominate over the greater protein binding surface area ofthe smaller bubbles in the liquid (point 1 above) under Brown's
experimental conditions, and so the enrichment data in Fig. 2result. In actuality, slower gas velocities result in complement-ary effects that both influence E in the same direction; (a) theaforementioned greater foam drainage as a consequence ofthe larger bubbles, which increases E (Gehle, 1984), and (b)greater protein absorption due to greater bubble residencetime in the liquid phase (Bhattacharjee, 1997), which should in-crease E also (Uraizee, 1996), thus providing a physicalexplanation for the E vs. gas flow trend shown in Fig. 2. Ofcourse, at the other extreme, faster gas velocities entrain moreliquid into the foam. This dilution with relatively protein-poorwater diminishes the relative contribution of the protein ab-sorbed on the bubble surface to the overall protein present inthe foam, thus contributing to a decrease in enrichment atthese faster gas flow rates.
Recovery vs. gas velocity is a different story; in this instance,the lesser amount of foam drainage resulting from the smallerbubbles that are generated at faster gas velocities actuallyshould increase R, the recovery. That is, since the amount ofprotein residing in the foam is the sum of the (concentrated)protein on the bubble surface layer and the protein dissolved inthe interstitial hold-up liquid, then anything that decreases foamdrainage will increase the overall amount of protein presentand hence recovered from the collapsed foam, and R will in-crease (Fig. 2, second graph). Enhancing this effect is the factthat more liquid is entrained into the foam at higher gas velocit-ies (Uraizee, 1996; Wong, 2001). The complementary conclusionholds as well; larger bubbles from slower gas velocities lead tomore foam drainage and a decrease in recovery.
In a separate series of experiments, Brown also has shown thatincreasing the flow rate of the liquid through the model skim-mer leads to a measurable decrease in recovery, but not muchchange, except at very low flow rates, in the enrichment, Fig. 3.Of course, the liquid flow rates examined in these experimentsare orders-of-magnitude less that the flow rates used in aquari-um skimmers, but that disconnect is balanced out somewhat bythe fact that the model skimmer used in these studies is just abit larger than a toilet paper tube. An explanation for thesetrends is provided below.
Protein recovery as a function of liquid flow rate is determinedonce again by the intersection of two opposing effects. Fasterliquid flow rates lead to smaller bubbles both in the liquid phaseand in the foam phase (Brown, 1990; Wong, 2001; Du, 2002).The former observation is attributed to less opportunity forbubble-enlarging coalescence, whereas the latter result is ex-plained by citing diminished coalescence of bubbles in the foamas a consequence of protein concentration/bubble surface ten-sion effects (Wong, 2001). If this bubble size effect wasdominant, we might expect that recovery would increase as li-quid flow increased (= smaller bubbles), since foam drainagewould be diminished. However, that expectation is not met ex-perimentally. Therefore, another phenomenon must be in play,and Wong theorizes that faster liquid flow leads to less contact
The Development of a Method for the Quantitative Evaluation of Protein Skimmer Performance
Advanced Aquarist | www.advancedaquarist.com 24 January 2009 | Volume VIII, Issue I
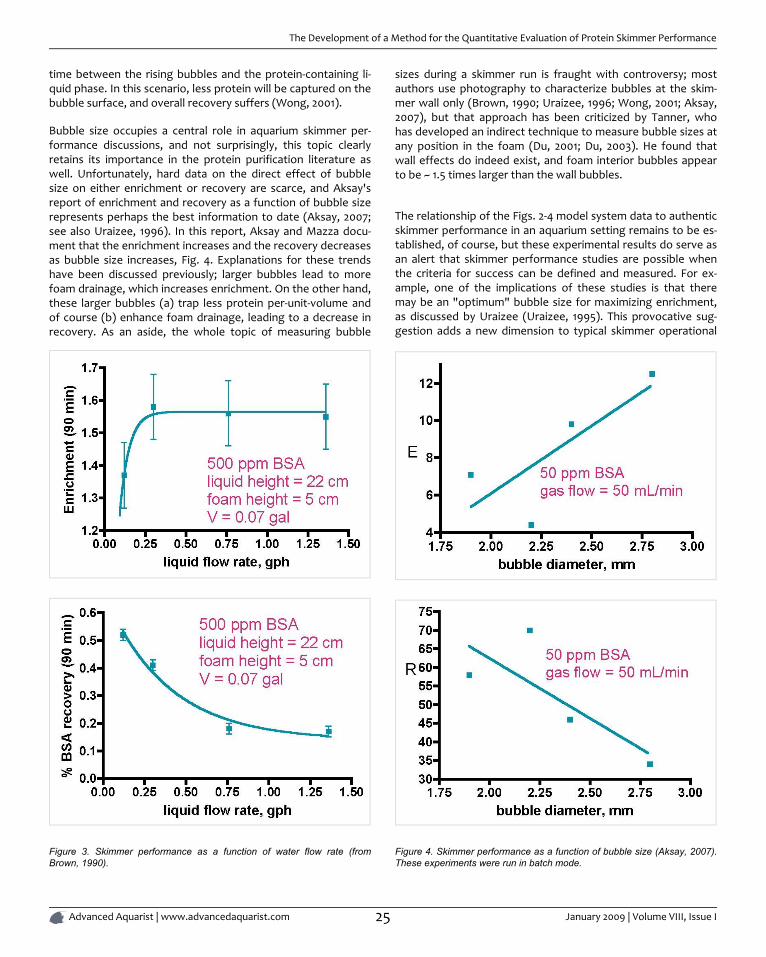
time between the rising bubbles and the protein-containing li-quid phase. In this scenario, less protein will be captured on thebubble surface, and overall recovery suffers (Wong, 2001).
Bubble size occupies a central role in aquarium skimmer per-formance discussions, and not surprisingly, this topic clearlyretains its importance in the protein purification literature aswell. Unfortunately, hard data on the direct effect of bubblesize on either enrichment or recovery are scarce, and Aksay'sreport of enrichment and recovery as a function of bubble sizerepresents perhaps the best information to date (Aksay, 2007;see also Uraizee, 1996). In this report, Aksay and Mazza docu-ment that the enrichment increases and the recovery decreasesas bubble size increases, Fig. 4. Explanations for these trendshave been discussed previously; larger bubbles lead to morefoam drainage, which increases enrichment. On the other hand,these larger bubbles (a) trap less protein per-unit-volume andof course (b) enhance foam drainage, leading to a decrease inrecovery. As an aside, the whole topic of measuring bubble
Figure 3. Skimmer performance as a function of water flow rate (fromBrown, 1990).
sizes during a skimmer run is fraught with controversy; mostauthors use photography to characterize bubbles at the skim-mer wall only (Brown, 1990; Uraizee, 1996; Wong, 2001; Aksay,2007), but that approach has been criticized by Tanner, whohas developed an indirect technique to measure bubble sizes atany position in the foam (Du, 2001; Du, 2003). He found thatwall effects do indeed exist, and foam interior bubbles appearto be ~ 1.5 times larger than the wall bubbles.
The relationship of the Figs. 2-4 model system data to authenticskimmer performance in an aquarium setting remains to be es-tablished, of course, but these experimental results do serve asan alert that skimmer performance studies are possible whenthe criteria for success can be defined and measured. For ex-ample, one of the implications of these studies is that theremay be an "optimum" bubble size for maximizing enrichment,as discussed by Uraizee (Uraizee, 1995). This provocative sug-gestion adds a new dimension to typical skimmer operational
Figure 4. Skimmer performance as a function of bubble size (Aksay, 2007).These experiments were run in batch mode.
The Development of a Method for the Quantitative Evaluation of Protein Skimmer Performance
Advanced Aquarist | www.advancedaquarist.com 25 January 2009 | Volume VIII, Issue I
descriptions in the aquarium literature that emphasize onlymaximizing bubble surface area (i.e., more smaller bubbles perunit volume) in order to maximize organic removal. An aquaristusing the information on enrichment and recovery discussedabove might be inclined to conclude that the best skimmer per-formance can be achieved by operating with a lower liquid flowrate and a higher gas velocity. We will see later that when othercriteria perhaps more relevant to aquarium skimming are in-cluded in the discussion, this conclusion does not necessarilyhold.
In addition to the three operating variables described above(liquid flow rate, gas flow rate, and bubble size), several otheraspects of protein skimmer performance have been examined.For example, the effect of (1) pH of the liquid phase, (2) feedflow concentration of BSA, and (3) liquid pool height all havebeen benchmarked vs. enrichment and recovery. Furthermore,much effort has been directed to developing mathematicalmodels with predictive value for E and R as a function of variousinput variables. Unfortunately, that modeling has not lent anygreater insight into protein skimming than could be derived byexamining the data directly. The interested reader is referred tothe articles cited above for details on all of these points.
THE GOALS OF OUR RESEARCH
The research described above on protein enrichment and re-covery with model skimmers does not directly address theneeds of aquarists, although it does provide some insight intothe relationship between operational parameters and some as-pects of skimmer performance. We sought to develop moreuseful metrics for measuring skimmer performance in an au-thentic aquarium setting. Further, we sought to apply thosemetrics to comparing directly the performance of (a) four dif-ferent but representative skimmers, and (b) a given skimmerunder different operating conditions, to illustrate how thismethodology might be employed.
DEFINING USEFUL SKIMMER PERFORMANCE
METRICS
Two measures of skimmer performance that we postulate willbe of interests to aquarists are (1) the rate (speed) by which theskimmer removes organic contaminants, and (2) the amount oforganic contaminants removed relative to the total amountpresent in the tank water. From here on, we will refer to the or-ganic contaminants as Total Organic Carbon (TOC). For a reviewof TOC values and related issues in marine aquaria, see our earli-er articles (Feldman, 2008c; Feldman, 2008d). The first of thesemetrics, the rate of TOC removal, is a kinetic quantity; thesecond (how much TOC is removed) is a thermodynamic quant-ity. They both report on different properties of skimming, andthere is no conceptual reason why they must run in parallel.That is, high rates of TOC removal do not necessarily correlatewith large amounts of TOC removal, and vice versa. These
criteria for skimmer performance are no different that the cri-teria we invoked in our earlier GAC (granular activated carbon)studies, and the interested reader can obtain further back-ground information from those articles (Feldman, 2008a;Feldman, 2008b).
THE RATE OF TOC REMOVAL - MATHEMATICAL
FORMULAE
It is essential to devise a robust mathematical model in order toextract useful quantitative information about the rate of organ-ic impurity removal by a skimmer. The recirculating reservoir/skimmer system maps quite closely onto a fundamental text-book problem in mass transfer/fluid flow encountered inintroductory chemical engineering courses called the "well-stirred reactor" problem. In this instance, both the skimmer andalso the reservoir can be modeled as "well-stirred reactors"with a given flow Q between them. A component of the wateris depleted in the skimmer by bubble-mediated removal. Sinceboth "reactors" are interconnected, the level of the componentwill drop in the reservoir as well, and our task will be to developa mathematical model that relates the removal in the skimmerwith the measured depletion in the reservoir. In our experi-mental setup, a liquid volume Vr (saltwater in a Rubbermaidtub) has an input stream and an output stream, and some or-ganic impurities in the liquid become depleted over time viabubble-mediated removal in a skimmer with water volume Vs.In actuality, Vs is just that volume in the skimmer reaction cham-ber where bubble-mediated organic extraction occurs.Inspection of the skimmers in action (see Fig. 7) permits estima-tion of this "active" skimmer volume, which is the value that wewill use for Vs. For the purposes of this analysis, we will assumethat all of the active volume is water; that is, we will ignore thevoid volume of the bubbles, as we cannot independently assessthe relative contributions of bubbles and water. This assump-tion will introduce an error into the calculations, but that errorshould be systematic for all skimmers, and since we are inter-ested in relative and not absolute skimmer performance, thiserror should not affect the conclusions. Knowledge of the pre-cise mechanism by which the skimmer's bubbles removes thewater component(s) is not required; all that we need to know isthat the concentration of the measured water component (theorganic impurity in this case) is diminishing with time in thereservoir. We have examined skimmer performance with bothBovine Serum Albumin (BSA) in freshly prepared saltwater as amodel for TOC in aquarium water, and authentic TOC in reeftank water. The mathematical derivation uses TOC for conveni-ence, but the formulae are identical with BSA as well (i.e.,substitute BSA for TOC in the equations below).
It is essential for solving this problem that both the reservoirand the skimmer water volumes are well mixed to avoid con-centration gradients (Felder, 2005). The reservoir water mixingin the experiments described below is provided by the skimmerreturn flow and by two powerheads in the reservoir. We inde-pendently tested the "well mixed" assumption in the reservoir
The Development of a Method for the Quantitative Evaluation of Protein Skimmer Performance
Advanced Aquarist | www.advancedaquarist.com 26 January 2009 | Volume VIII, Issue I
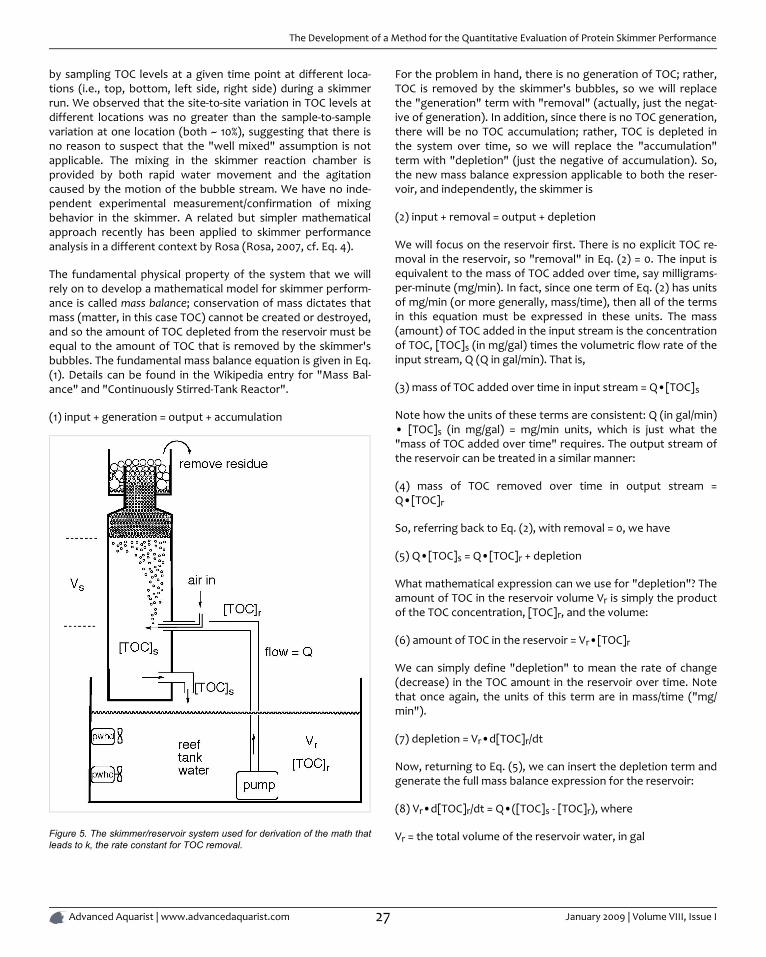
by sampling TOC levels at a given time point at different loca-tions (i.e., top, bottom, left side, right side) during a skimmerrun. We observed that the site-to-site variation in TOC levels atdifferent locations was no greater than the sample-to-samplevariation at one location (both ~ 10%), suggesting that there isno reason to suspect that the "well mixed" assumption is notapplicable. The mixing in the skimmer reaction chamber isprovided by both rapid water movement and the agitationcaused by the motion of the bubble stream. We have no inde-pendent experimental measurement/confirmation of mixingbehavior in the skimmer. A related but simpler mathematicalapproach recently has been applied to skimmer performanceanalysis in a different context by Rosa (Rosa, 2007, cf. Eq. 4).
The fundamental physical property of the system that we willrely on to develop a mathematical model for skimmer perform-ance is called mass balance; conservation of mass dictates thatmass (matter, in this case TOC) cannot be created or destroyed,and so the amount of TOC depleted from the reservoir must beequal to the amount of TOC that is removed by the skimmer'sbubbles. The fundamental mass balance equation is given in Eq.(1). Details can be found in the Wikipedia entry for "Mass Bal-ance" and "Continuously Stirred-Tank Reactor".
(1) input + generation = output + accumulation
Figure 5. The skimmer/reservoir system used for derivation of the math thatleads to k, the rate constant for TOC removal.
For the problem in hand, there is no generation of TOC; rather,TOC is removed by the skimmer's bubbles, so we will replacethe "generation" term with "removal" (actually, just the negat-ive of generation). In addition, since there is no TOC generation,there will be no TOC accumulation; rather, TOC is depleted inthe system over time, so we will replace the "accumulation"term with "depletion" (just the negative of accumulation). So,the new mass balance expression applicable to both the reser-voir, and independently, the skimmer is
(2) input + removal = output + depletion
We will focus on the reservoir first. There is no explicit TOC re-moval in the reservoir, so "removal" in Eq. (2) = 0. The input isequivalent to the mass of TOC added over time, say milligrams-per-minute (mg/min). In fact, since one term of Eq. (2) has unitsof mg/min (or more generally, mass/time), then all of the termsin this equation must be expressed in these units. The mass(amount) of TOC added in the input stream is the concentrationof TOC, [TOC]s (in mg/gal) times the volumetric flow rate of theinput stream, Q (Q in gal/min). That is,
(3) mass of TOC added over time in input stream = Q•[TOC]s
Note how the units of these terms are consistent: Q (in gal/min)• [TOC]s (in mg/gal) = mg/min units, which is just what the"mass of TOC added over time" requires. The output stream ofthe reservoir can be treated in a similar manner:
(4) mass of TOC removed over time in output stream =Q•[TOC]r
So, referring back to Eq. (2), with removal = 0, we have
(5) Q•[TOC]s = Q•[TOC]r + depletion
What mathematical expression can we use for "depletion"? Theamount of TOC in the reservoir volume Vr is simply the productof the TOC concentration, [TOC]r, and the volume:
(6) amount of TOC in the reservoir = Vr•[TOC]r
We can simply define "depletion" to mean the rate of change(decrease) in the TOC amount in the reservoir over time. Notethat once again, the units of this term are in mass/time ("mg/min").
(7) depletion = Vr•d[TOC]r/dt
Now, returning to Eq. (5), we can insert the depletion term andgenerate the full mass balance expression for the reservoir:
(8) Vr•d[TOC]r/dt = Q•([TOC]s - [TOC]r), where
Vr = the total volume of the reservoir water, in gal
The Development of a Method for the Quantitative Evaluation of Protein Skimmer Performance
Advanced Aquarist | www.advancedaquarist.com 27 January 2009 | Volume VIII, Issue I
[TOC]r = the concentration of TOC in the reservoir at any time tand also the concentration of TOC in the stream leaving thereservoir and entering the skimmer
Q = the flow through the system, in gpm
[TOC]s = the concentration of TOC in the stream leaving theskimmer and entering the reservoir
Eq. (8) says that the change in the amount of TOC in the reser-voir (the left hand side) is equal to the difference between thereservoir input and output TOC concentrations ([TOC]s - [TOC]r)times the flow rate (the right hand side). Note that this expres-sion includes information about TOC concentrations in both thereservoir and the skimmer.
A similar expression can be developed for the fate of the TOCconcentration just in the skimmer. However, in this case,"removal" does not equal 0, as the bubbles in the skimmer act-ively remove the organic impurity. So, from Eq. (2),
(9) Vs•d[TOC]s/dt = Q•([TOC]r - [TOC]s) + removal
We must include another term (removal) in Eq. (9) that expli-citly accounts for this TOC removal in order to maintain therequired mass balance. This TOC removal term must take intoaccount the function of the bubbles. The fundamental chemicalequation for TOC removal by the bubbles is:
(10) TOC + bubbles → TOC•bubbles
This simple equation undergirds the assumption that allows themathematical analysis to proceed: the key assumption is thatthe rate of TOC removed by the skimmer's bubbles is proportionalto the amount of TOC present in solution. This assumption per-mits us to connect the [TOC] changes that happen in theskimmer with the [TOC] changes that happen in the reservoir.Since the bubbles are continually being introduced in large ex-cess compared to the TOC concentration in solution, the"concentration" of the bubbles remains for all intents and pur-poses constant, and so we do not have to worry about howchanges in bubble concentration might influence the rate ofTOC removal. This model (and its underlying assumptions)greatly simplifies the mathematical analysis. In terms of the dis-cipline of chemical kinetics, this approach is called the "pseudo-first order" approximation. So, the amount of TOC in the activeskimmer reaction chamber volume Vs is given by the concentra-tion times the volume:
(11) amount of TOC in the active water volume of the skimmer =Vs•[TOC]s
By the assumption discussed above, the rate of TOC removal bythe bubbles is proportional to the amount of TOC present:
(12) rate of TOC removal by the bubbles ∝ -Vs•[TOC]s
Note that we must include a "-" sign in front of Vs•[TOC]s be-cause the amount is decreasing with time. We can introduce aproportionality constant, k, to convert Eq. (12) into an equality.
(13) rate of TOC removal by the bubbles = -k•Vs•[TOC]s
The term k•Vs•[TOC]s must have units of mass/time (i.e., mg/min) in order to "fit" into Eq. (9). Since Vs•[TOC]s has units ofmass (mg), then k must have units of /time (i.e., per min). Assuch, k is often referred to as a rate constant; it expresses howsomething changes over time ("per min"). This proportionalityconstant is not just a mathematical convenience. It will reporton a fundamentally important property of a skimmer. The con-stant k can be viewed as a measure of how efficiently thebubbles remove TOC. The efficiency of TOC removal is a com-plex function of many factors (bubble size/density, bubbleresidence time, solution diffusion, mass transfer to the bubble,foam coalescence, binding to the bubble surface, etc.). In fact,it is just this value k that we are after; k is actually a singularmeasure of skimmer efficiency in removing TOC. The larger that kis, the faster that the skimmer will remove TOC. Thus, k is an in-trinsic measure for TOC removal, and it reflects, in theaggregate, all of the parameters that contribute to the effi-ciency of TOC removal for a given skimmer. However, k doesnot offer any insight into which parameters, in particular, aremore or less important in determining skimmer performance.We can measure experimentally k for different skimmers, andcompare these values. Skimmers with larger k values will bemore efficient (i.e., faster) at removing TOC from aquarium wa-ter. So, by including the information in Eq. (13) in Eq. (9), wehave
(14) Vs•d[TOC]s/dt = Q•([TOC]r - [TOC]s) - Vs•k•[TOC]s
This rather complex equation is important because, for the firsttime, we have mathematically linked the experimentally meas-urable quantity, the concentration of TOC in the reservoir,[TOC]r, with quantities specific to the skimmer (Vs, [TOC]s).However, Eq. (14) as written is difficult to manipulate, so wewill define a new mathematical quantity that will help us simplythe math and arrive at a very useful expression. We define a di-mensionless time τ = Q•t/Vr. Applying this definition to Eq. (14),we can generate the following expression:
(15) (Vs/Vr)•d[TOC]s/dτ = [TOC]r - [TOC]s - Vs•k•[TOC]s/Q
The purpose for this seemingly arbitrary definition/substitutionexercise now can be revealed. The use of τ allows us to isolatethe dimensionless quantity Vs/Vr, which is the ratio of the activeskimmer volume to the reservoir volume. We can inject a doseof physical reality into the mathematics at this point. The reser-voir volume (30 or 35 gallons) is much larger than the skimmers'volumes (0.62 - 1.26 gallons, see below) and so the ratio Vs/Vrhovers in the 0.02 - 0.04 range. If the second term in the left-hand part of Eq. (15), d[TOC]s/dτ is not too large, then the Vs/Vrterm will dominate, and we can neglect the entire left-handterm of Eq. (15); that is, we can, to a first approximation, set
The Development of a Method for the Quantitative Evaluation of Protein Skimmer Performance
Advanced Aquarist | www.advancedaquarist.com 28 January 2009 | Volume VIII, Issue I
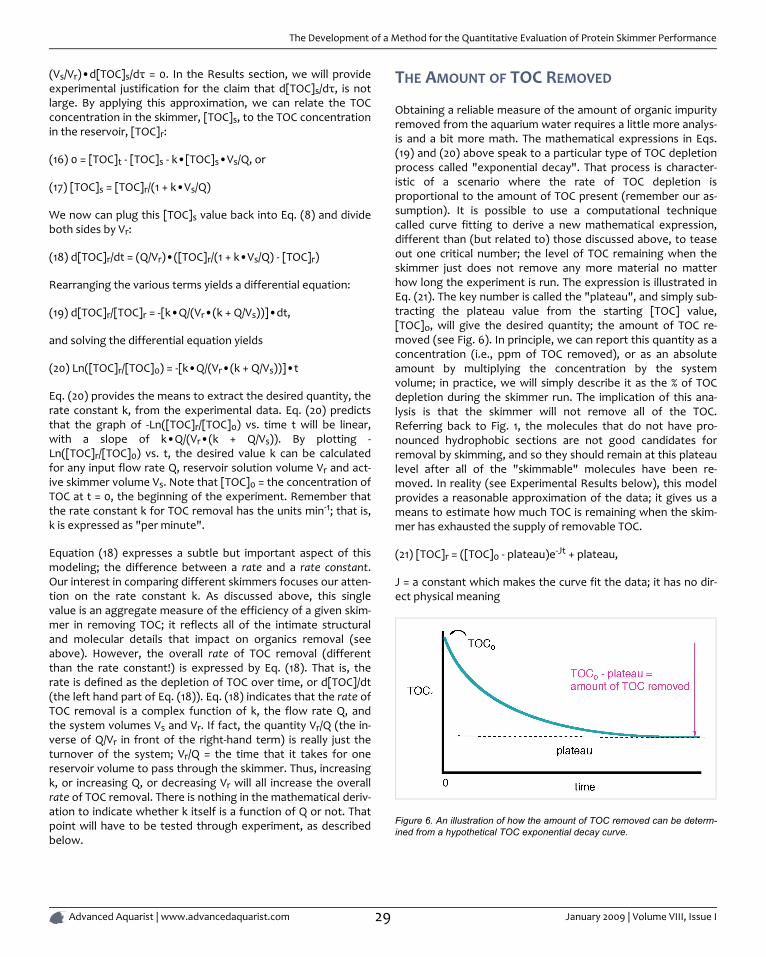
(Vs/Vr)•d[TOC]s/dτ = 0. In the Results section, we will provideexperimental justification for the claim that d[TOC]s/dτ, is notlarge. By applying this approximation, we can relate the TOCconcentration in the skimmer, [TOC]s, to the TOC concentrationin the reservoir, [TOC]r:
(16) 0 = [TOC]t - [TOC]s - k•[TOC]s•Vs/Q, or
(17) [TOC]s = [TOC]r/(1 + k•Vs/Q)
We now can plug this [TOC]s value back into Eq. (8) and divideboth sides by Vr:
(18) d[TOC]r/dt = (Q/Vr)•([TOC]r/(1 + k•Vs/Q) - [TOC]r)
Rearranging the various terms yields a differential equation:
(19) d[TOC]r/[TOC]r = -[k•Q/(Vr•(k + Q/Vs))]•dt,
and solving the differential equation yields
(20) Ln([TOC]r/[TOC]0) = -[k•Q/(Vr•(k + Q/Vs))]•t
Eq. (20) provides the means to extract the desired quantity, therate constant k, from the experimental data. Eq. (20) predictsthat the graph of -Ln([TOC]r/[TOC]0) vs. time t will be linear,with a slope of k•Q/(Vr•(k + Q/Vs)). By plotting -Ln([TOC]r/[TOC]0) vs. t, the desired value k can be calculatedfor any input flow rate Q, reservoir solution volume Vr and act-ive skimmer volume Vs. Note that [TOC]0 = the concentration ofTOC at t = 0, the beginning of the experiment. Remember thatthe rate constant k for TOC removal has the units min-1; that is,k is expressed as "per minute".
Equation (18) expresses a subtle but important aspect of thismodeling; the difference between a rate and a rate constant.Our interest in comparing different skimmers focuses our atten-tion on the rate constant k. As discussed above, this singlevalue is an aggregate measure of the efficiency of a given skim-mer in removing TOC; it reflects all of the intimate structuraland molecular details that impact on organics removal (seeabove). However, the overall rate of TOC removal (differentthan the rate constant!) is expressed by Eq. (18). That is, therate is defined as the depletion of TOC over time, or d[TOC]/dt(the left hand part of Eq. (18)). Eq. (18) indicates that the rate ofTOC removal is a complex function of k, the flow rate Q, andthe system volumes Vs and Vr. If fact, the quantity Vr/Q (the in-verse of Q/Vr in front of the right-hand term) is really just theturnover of the system; Vr/Q = the time that it takes for onereservoir volume to pass through the skimmer. Thus, increasingk, or increasing Q, or decreasing Vr will all increase the overallrate of TOC removal. There is nothing in the mathematical deriv-ation to indicate whether k itself is a function of Q or not. Thatpoint will have to be tested through experiment, as describedbelow.
THE AMOUNT OF TOC REMOVED
Obtaining a reliable measure of the amount of organic impurityremoved from the aquarium water requires a little more analys-is and a bit more math. The mathematical expressions in Eqs.(19) and (20) above speak to a particular type of TOC depletionprocess called "exponential decay". That process is character-istic of a scenario where the rate of TOC depletion isproportional to the amount of TOC present (remember our as-sumption). It is possible to use a computational techniquecalled curve fitting to derive a new mathematical expression,different than (but related to) those discussed above, to teaseout one critical number; the level of TOC remaining when theskimmer just does not remove any more material no matterhow long the experiment is run. The expression is illustrated inEq. (21). The key number is called the "plateau", and simply sub-tracting the plateau value from the starting [TOC] value,[TOC]o, will give the desired quantity; the amount of TOC re-moved (see Fig. 6). In principle, we can report this quantity as aconcentration (i.e., ppm of TOC removed), or as an absoluteamount by multiplying the concentration by the systemvolume; in practice, we will simply describe it as the % of TOCdepletion during the skimmer run. The implication of this ana-lysis is that the skimmer will not remove all of the TOC.Referring back to Fig. 1, the molecules that do not have pro-nounced hydrophobic sections are not good candidates forremoval by skimming, and so they should remain at this plateaulevel after all of the "skimmable" molecules have been re-moved. In reality (see Experimental Results below), this modelprovides a reasonable approximation of the data; it gives us ameans to estimate how much TOC is remaining when the skim-mer has exhausted the supply of removable TOC.
(21) [TOC]r = ([TOC]0 - plateau)e-Jt + plateau,
J = a constant which makes the curve fit the data; it has no dir-ect physical meaning
Figure 6. An illustration of how the amount of TOC removed can be determ-ined from a hypothetical TOC exponential decay curve.
The Development of a Method for the Quantitative Evaluation of Protein Skimmer Performance
Advanced Aquarist | www.advancedaquarist.com 29 January 2009 | Volume VIII, Issue I
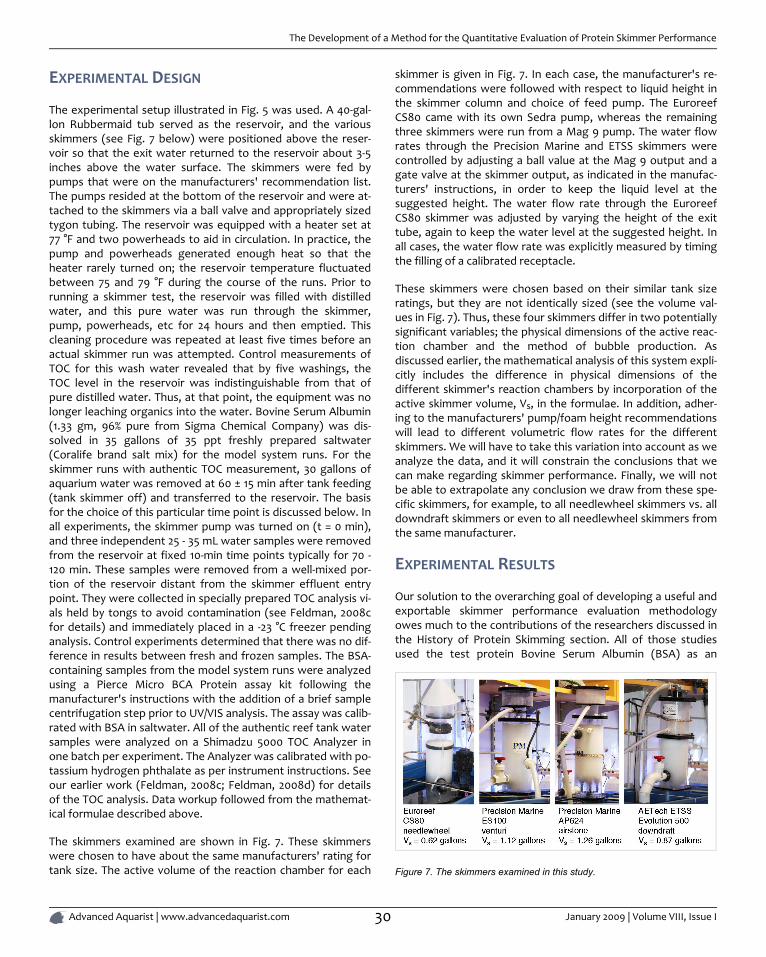
EXPERIMENTAL DESIGN
The experimental setup illustrated in Fig. 5 was used. A 40-gal-lon Rubbermaid tub served as the reservoir, and the variousskimmers (see Fig. 7 below) were positioned above the reser-voir so that the exit water returned to the reservoir about 3-5inches above the water surface. The skimmers were fed bypumps that were on the manufacturers' recommendation list.The pumps resided at the bottom of the reservoir and were at-tached to the skimmers via a ball valve and appropriately sizedtygon tubing. The reservoir was equipped with a heater set at77 °F and two powerheads to aid in circulation. In practice, thepump and powerheads generated enough heat so that theheater rarely turned on; the reservoir temperature fluctuatedbetween 75 and 79 °F during the course of the runs. Prior torunning a skimmer test, the reservoir was filled with distilledwater, and this pure water was run through the skimmer,pump, powerheads, etc for 24 hours and then emptied. Thiscleaning procedure was repeated at least five times before anactual skimmer run was attempted. Control measurements ofTOC for this wash water revealed that by five washings, theTOC level in the reservoir was indistinguishable from that ofpure distilled water. Thus, at that point, the equipment was nolonger leaching organics into the water. Bovine Serum Albumin(1.33 gm, 96% pure from Sigma Chemical Company) was dis-solved in 35 gallons of 35 ppt freshly prepared saltwater(Coralife brand salt mix) for the model system runs. For theskimmer runs with authentic TOC measurement, 30 gallons ofaquarium water was removed at 60 ± 15 min after tank feeding(tank skimmer off) and transferred to the reservoir. The basisfor the choice of this particular time point is discussed below. Inall experiments, the skimmer pump was turned on (t = 0 min),and three independent 25 - 35 mL water samples were removedfrom the reservoir at fixed 10-min time points typically for 70 -120 min. These samples were removed from a well-mixed por-tion of the reservoir distant from the skimmer effluent entrypoint. They were collected in specially prepared TOC analysis vi-als held by tongs to avoid contamination (see Feldman, 2008cfor details) and immediately placed in a -23 °C freezer pendinganalysis. Control experiments determined that there was no dif-ference in results between fresh and frozen samples. The BSA-containing samples from the model system runs were analyzedusing a Pierce Micro BCA Protein assay kit following themanufacturer's instructions with the addition of a brief samplecentrifugation step prior to UV/VIS analysis. The assay was calib-rated with BSA in saltwater. All of the authentic reef tank watersamples were analyzed on a Shimadzu 5000 TOC Analyzer inone batch per experiment. The Analyzer was calibrated with po-tassium hydrogen phthalate as per instrument instructions. Seeour earlier work (Feldman, 2008c; Feldman, 2008d) for detailsof the TOC analysis. Data workup followed from the mathemat-ical formulae described above.
The skimmers examined are shown in Fig. 7. These skimmerswere chosen to have about the same manufacturers' rating fortank size. The active volume of the reaction chamber for each
skimmer is given in Fig. 7. In each case, the manufacturer's re-commendations were followed with respect to liquid height inthe skimmer column and choice of feed pump. The EuroreefCS80 came with its own Sedra pump, whereas the remainingthree skimmers were run from a Mag 9 pump. The water flowrates through the Precision Marine and ETSS skimmers werecontrolled by adjusting a ball value at the Mag 9 output and agate valve at the skimmer output, as indicated in the manufac-turers' instructions, in order to keep the liquid level at thesuggested height. The water flow rate through the EuroreefCS80 skimmer was adjusted by varying the height of the exittube, again to keep the water level at the suggested height. Inall cases, the water flow rate was explicitly measured by timingthe filling of a calibrated receptacle.
These skimmers were chosen based on their similar tank sizeratings, but they are not identically sized (see the volume val-ues in Fig. 7). Thus, these four skimmers differ in two potentiallysignificant variables; the physical dimensions of the active reac-tion chamber and the method of bubble production. Asdiscussed earlier, the mathematical analysis of this system expli-citly includes the difference in physical dimensions of thedifferent skimmer's reaction chambers by incorporation of theactive skimmer volume, Vs, in the formulae. In addition, adher-ing to the manufacturers' pump/foam height recommendationswill lead to different volumetric flow rates for the differentskimmers. We will have to take this variation into account as weanalyze the data, and it will constrain the conclusions that wecan make regarding skimmer performance. Finally, we will notbe able to extrapolate any conclusion we draw from these spe-cific skimmers, for example, to all needlewheel skimmers vs. alldowndraft skimmers or even to all needlewheel skimmers fromthe same manufacturer.
EXPERIMENTAL RESULTS
Our solution to the overarching goal of developing a useful andexportable skimmer performance evaluation methodologyowes much to the contributions of the researchers discussed inthe History of Protein Skimming section. All of those studiesused the test protein Bovine Serum Albumin (BSA) as an
Figure 7. The skimmers examined in this study.
The Development of a Method for the Quantitative Evaluation of Protein Skimmer Performance
Advanced Aquarist | www.advancedaquarist.com 30 January 2009 | Volume VIII, Issue I
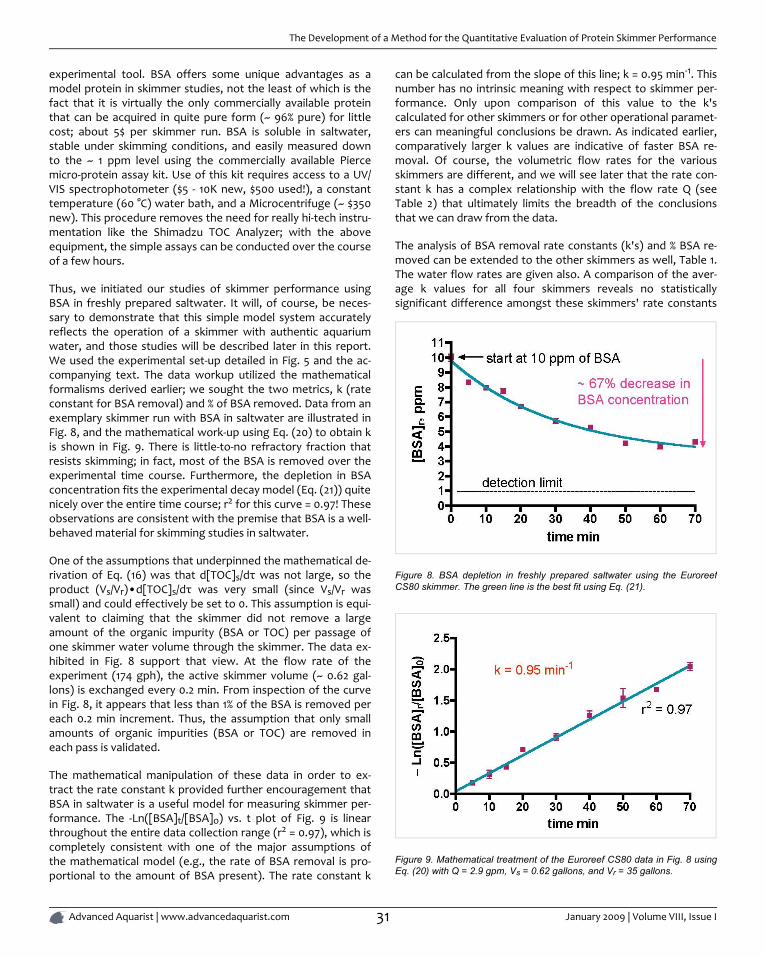
experimental tool. BSA offers some unique advantages as amodel protein in skimmer studies, not the least of which is thefact that it is virtually the only commercially available proteinthat can be acquired in quite pure form (~ 96% pure) for littlecost; about 5$ per skimmer run. BSA is soluble in saltwater,stable under skimming conditions, and easily measured downto the ~ 1 ppm level using the commercially available Piercemicro-protein assay kit. Use of this kit requires access to a UV/VIS spectrophotometer ($5 - 10K new, $500 used!), a constanttemperature (60 °C) water bath, and a Microcentrifuge (~ $350new). This procedure removes the need for really hi-tech instru-mentation like the Shimadzu TOC Analyzer; with the aboveequipment, the simple assays can be conducted over the courseof a few hours.
Thus, we initiated our studies of skimmer performance usingBSA in freshly prepared saltwater. It will, of course, be neces-sary to demonstrate that this simple model system accuratelyreflects the operation of a skimmer with authentic aquariumwater, and those studies will be described later in this report.We used the experimental set-up detailed in Fig. 5 and the ac-companying text. The data workup utilized the mathematicalformalisms derived earlier; we sought the two metrics, k (rateconstant for BSA removal) and % of BSA removed. Data from anexemplary skimmer run with BSA in saltwater are illustrated inFig. 8, and the mathematical work-up using Eq. (20) to obtain kis shown in Fig. 9. There is little-to-no refractory fraction thatresists skimming; in fact, most of the BSA is removed over theexperimental time course. Furthermore, the depletion in BSAconcentration fits the experimental decay model (Eq. (21)) quitenicely over the entire time course; r2 for this curve = 0.97! Theseobservations are consistent with the premise that BSA is a well-behaved material for skimming studies in saltwater.
One of the assumptions that underpinned the mathematical de-rivation of Eq. (16) was that d[TOC]s/dτ was not large, so theproduct (Vs/Vr)•d[TOC]s/dτ was very small (since Vs/Vr wassmall) and could effectively be set to 0. This assumption is equi-valent to claiming that the skimmer did not remove a largeamount of the organic impurity (BSA or TOC) per passage ofone skimmer water volume through the skimmer. The data ex-hibited in Fig. 8 support that view. At the flow rate of theexperiment (174 gph), the active skimmer volume (~ 0.62 gal-lons) is exchanged every 0.2 min. From inspection of the curvein Fig. 8, it appears that less than 1% of the BSA is removed pereach 0.2 min increment. Thus, the assumption that only smallamounts of organic impurities (BSA or TOC) are removed ineach pass is validated.
The mathematical manipulation of these data in order to ex-tract the rate constant k provided further encouragement thatBSA in saltwater is a useful model for measuring skimmer per-formance. The -Ln([BSA]t/[BSA]o) vs. t plot of Fig. 9 is linearthroughout the entire data collection range (r2 = 0.97), which iscompletely consistent with one of the major assumptions ofthe mathematical model (e.g., the rate of BSA removal is pro-portional to the amount of BSA present). The rate constant k
can be calculated from the slope of this line; k = 0.95 min-1. Thisnumber has no intrinsic meaning with respect to skimmer per-formance. Only upon comparison of this value to the k'scalculated for other skimmers or for other operational paramet-ers can meaningful conclusions be drawn. As indicated earlier,comparatively larger k values are indicative of faster BSA re-moval. Of course, the volumetric flow rates for the variousskimmers are different, and we will see later that the rate con-stant k has a complex relationship with the flow rate Q (seeTable 2) that ultimately limits the breadth of the conclusionsthat we can draw from the data.
The analysis of BSA removal rate constants (k's) and % BSA re-moved can be extended to the other skimmers as well, Table 1.The water flow rates are given also. A comparison of the aver-age k values for all four skimmers reveals no statisticallysignificant difference amongst these skimmers' rate constants
Figure 8. BSA depletion in freshly prepared saltwater using the EuroreefCS80 skimmer. The green line is the best fit using Eq. (21).
Figure 9. Mathematical treatment of the Euroreef CS80 data in Fig. 8 usingEq. (20) with Q = 2.9 gpm, Vs = 0.62 gallons, and Vr = 35 gallons.
The Development of a Method for the Quantitative Evaluation of Protein Skimmer Performance
Advanced Aquarist | www.advancedaquarist.com 31 January 2009 | Volume VIII, Issue I
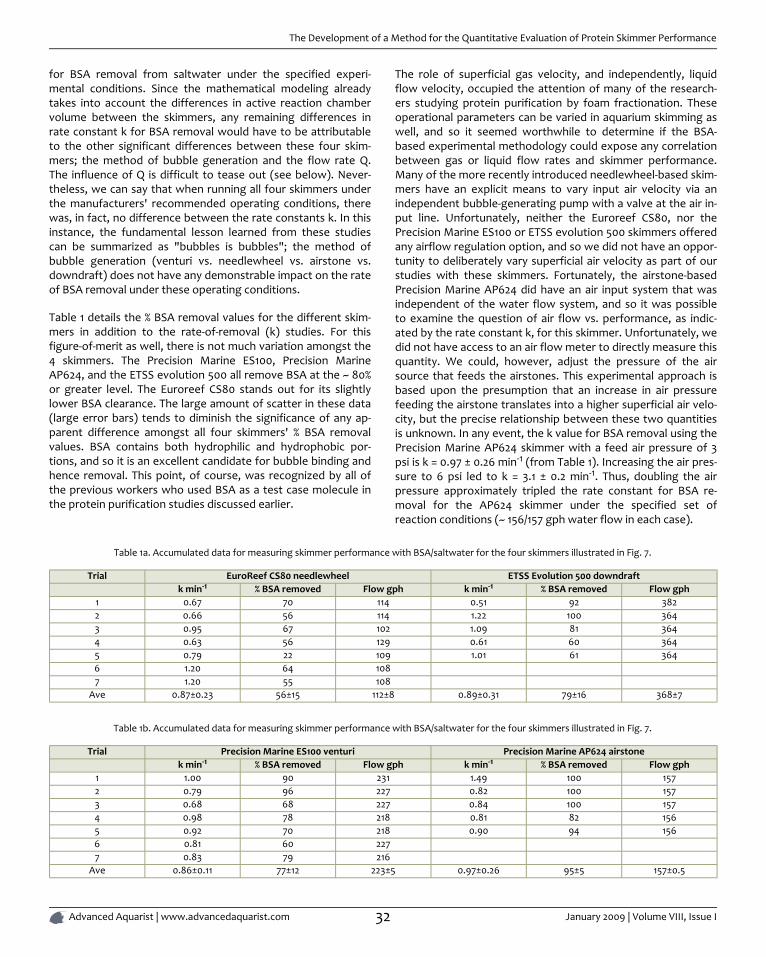
for BSA removal from saltwater under the specified experi-mental conditions. Since the mathematical modeling alreadytakes into account the differences in active reaction chambervolume between the skimmers, any remaining differences inrate constant k for BSA removal would have to be attributableto the other significant differences between these four skim-mers; the method of bubble generation and the flow rate Q.The influence of Q is difficult to tease out (see below). Never-theless, we can say that when running all four skimmers underthe manufacturers' recommended operating conditions, therewas, in fact, no difference between the rate constants k. In thisinstance, the fundamental lesson learned from these studiescan be summarized as "bubbles is bubbles"; the method ofbubble generation (venturi vs. needlewheel vs. airstone vs.downdraft) does not have any demonstrable impact on the rateof BSA removal under these operating conditions.
Table 1 details the % BSA removal values for the different skim-mers in addition to the rate-of-removal (k) studies. For thisfigure-of-merit as well, there is not much variation amongst the4 skimmers. The Precision Marine ES100, Precision MarineAP624, and the ETSS evolution 500 all remove BSA at the ~ 80%or greater level. The Euroreef CS80 stands out for its slightlylower BSA clearance. The large amount of scatter in these data(large error bars) tends to diminish the significance of any ap-parent difference amongst all four skimmers' % BSA removalvalues. BSA contains both hydrophilic and hydrophobic por-tions, and so it is an excellent candidate for bubble binding andhence removal. This point, of course, was recognized by all ofthe previous workers who used BSA as a test case molecule inthe protein purification studies discussed earlier.
The role of superficial gas velocity, and independently, liquidflow velocity, occupied the attention of many of the research-ers studying protein purification by foam fractionation. Theseoperational parameters can be varied in aquarium skimming aswell, and so it seemed worthwhile to determine if the BSA-based experimental methodology could expose any correlationbetween gas or liquid flow rates and skimmer performance.Many of the more recently introduced needlewheel-based skim-mers have an explicit means to vary input air velocity via anindependent bubble-generating pump with a valve at the air in-put line. Unfortunately, neither the Euroreef CS80, nor thePrecision Marine ES100 or ETSS evolution 500 skimmers offeredany airflow regulation option, and so we did not have an oppor-tunity to deliberately vary superficial air velocity as part of ourstudies with these skimmers. Fortunately, the airstone-basedPrecision Marine AP624 did have an air input system that wasindependent of the water flow system, and so it was possibleto examine the question of air flow vs. performance, as indic-ated by the rate constant k, for this skimmer. Unfortunately, wedid not have access to an air flow meter to directly measure thisquantity. We could, however, adjust the pressure of the airsource that feeds the airstones. This experimental approach isbased upon the presumption that an increase in air pressurefeeding the airstone translates into a higher superficial air velo-city, but the precise relationship between these two quantitiesis unknown. In any event, the k value for BSA removal using thePrecision Marine AP624 skimmer with a feed air pressure of 3psi is k = 0.97 ± 0.26 min-1 (from Table 1). Increasing the air pres-sure to 6 psi led to k = 3.1 ± 0.2 min-1. Thus, doubling the airpressure approximately tripled the rate constant for BSA re-moval for the AP624 skimmer under the specified set ofreaction conditions (~ 156/157 gph water flow in each case).
Table 1a. Accumulated data for measuring skimmer performance with BSA/saltwater for the four skimmers illustrated in Fig. 7.
Trial EuroReef CS80 needlewheel ETSS Evolution 500 downdraftk min-1 % BSA removed Flow gph k min-1 % BSA removed Flow gph
1 0.67 70 114 0.51 92 3822 0.66 56 114 1.22 100 3643 0.95 67 102 1.09 81 3644 0.63 56 129 0.61 60 3645 0.79 22 109 1.01 61 3646 1.20 64 1087 1.20 55 108
Ave 0.87±0.23 56±15 112±8 0.89±0.31 79±16 368±7
Table 1b. Accumulated data for measuring skimmer performance with BSA/saltwater for the four skimmers illustrated in Fig. 7.
Trial Precision Marine ES100 venturi Precision Marine AP624 airstonek min-1 % BSA removed Flow gph k min-1 % BSA removed Flow gph
1 1.00 90 231 1.49 100 1572 0.79 96 227 0.82 100 1573 0.68 68 227 0.84 100 1574 0.98 78 218 0.81 82 1565 0.92 70 218 0.90 94 1566 0.81 60 2277 0.83 79 216
Ave 0.86±0.11 77±12 223±5 0.97±0.26 95±5 157±0.5
The Development of a Method for the Quantitative Evaluation of Protein Skimmer Performance
Advanced Aquarist | www.advancedaquarist.com 32 January 2009 | Volume VIII, Issue I
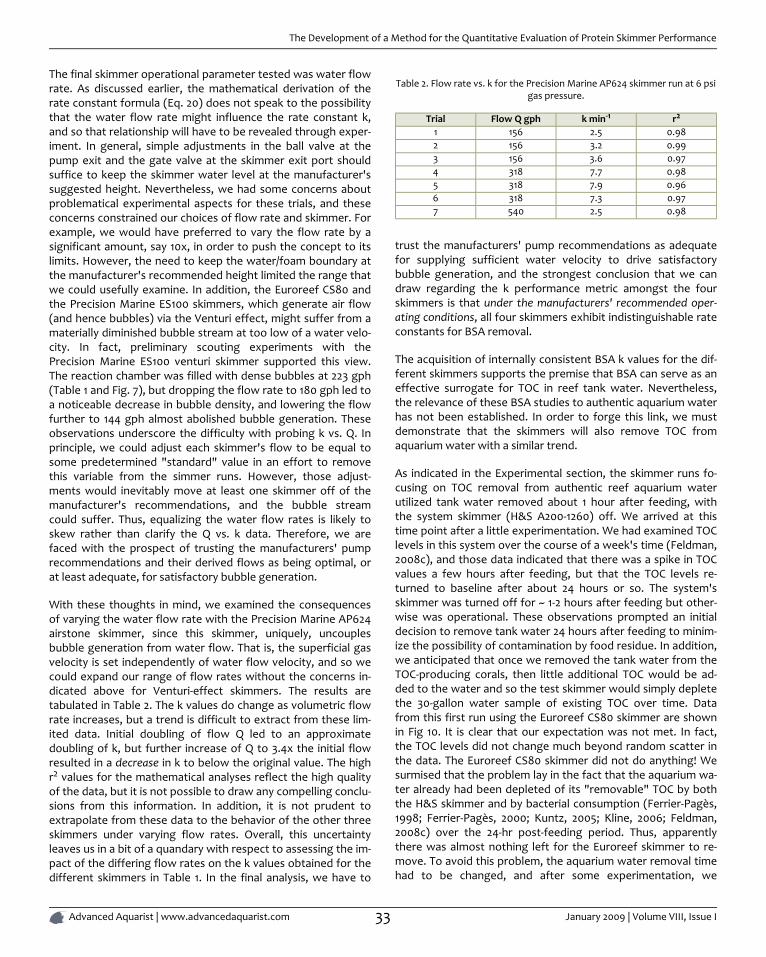
The final skimmer operational parameter tested was water flowrate. As discussed earlier, the mathematical derivation of therate constant formula (Eq. 20) does not speak to the possibilitythat the water flow rate might influence the rate constant k,and so that relationship will have to be revealed through exper-iment. In general, simple adjustments in the ball valve at thepump exit and the gate valve at the skimmer exit port shouldsuffice to keep the skimmer water level at the manufacturer'ssuggested height. Nevertheless, we had some concerns aboutproblematical experimental aspects for these trials, and theseconcerns constrained our choices of flow rate and skimmer. Forexample, we would have preferred to vary the flow rate by asignificant amount, say 10x, in order to push the concept to itslimits. However, the need to keep the water/foam boundary atthe manufacturer's recommended height limited the range thatwe could usefully examine. In addition, the Euroreef CS80 andthe Precision Marine ES100 skimmers, which generate air flow(and hence bubbles) via the Venturi effect, might suffer from amaterially diminished bubble stream at too low of a water velo-city. In fact, preliminary scouting experiments with thePrecision Marine ES100 venturi skimmer supported this view.The reaction chamber was filled with dense bubbles at 223 gph(Table 1 and Fig. 7), but dropping the flow rate to 180 gph led toa noticeable decrease in bubble density, and lowering the flowfurther to 144 gph almost abolished bubble generation. Theseobservations underscore the difficulty with probing k vs. Q. Inprinciple, we could adjust each skimmer's flow to be equal tosome predetermined "standard" value in an effort to removethis variable from the simmer runs. However, those adjust-ments would inevitably move at least one skimmer off of themanufacturer's recommendations, and the bubble streamcould suffer. Thus, equalizing the water flow rates is likely toskew rather than clarify the Q vs. k data. Therefore, we arefaced with the prospect of trusting the manufacturers' pumprecommendations and their derived flows as being optimal, orat least adequate, for satisfactory bubble generation.
With these thoughts in mind, we examined the consequencesof varying the water flow rate with the Precision Marine AP624airstone skimmer, since this skimmer, uniquely, uncouplesbubble generation from water flow. That is, the superficial gasvelocity is set independently of water flow velocity, and so wecould expand our range of flow rates without the concerns in-dicated above for Venturi-effect skimmers. The results aretabulated in Table 2. The k values do change as volumetric flowrate increases, but a trend is difficult to extract from these lim-ited data. Initial doubling of flow Q led to an approximatedoubling of k, but further increase of Q to 3.4x the initial flowresulted in a decrease in k to below the original value. The highr2 values for the mathematical analyses reflect the high qualityof the data, but it is not possible to draw any compelling conclu-sions from this information. In addition, it is not prudent toextrapolate from these data to the behavior of the other threeskimmers under varying flow rates. Overall, this uncertaintyleaves us in a bit of a quandary with respect to assessing the im-pact of the differing flow rates on the k values obtained for thedifferent skimmers in Table 1. In the final analysis, we have to
Table 2. Flow rate vs. k for the Precision Marine AP624 skimmer run at 6 psigas pressure.
Trial Flow Q gph k min-1 r2
1 156 2.5 0.982 156 3.2 0.993 156 3.6 0.974 318 7.7 0.985 318 7.9 0.966 318 7.3 0.977 540 2.5 0.98
trust the manufacturers' pump recommendations as adequatefor supplying sufficient water velocity to drive satisfactorybubble generation, and the strongest conclusion that we candraw regarding the k performance metric amongst the fourskimmers is that under the manufacturers' recommended oper-ating conditions, all four skimmers exhibit indistinguishable rateconstants for BSA removal.
The acquisition of internally consistent BSA k values for the dif-ferent skimmers supports the premise that BSA can serve as aneffective surrogate for TOC in reef tank water. Nevertheless,the relevance of these BSA studies to authentic aquarium waterhas not been established. In order to forge this link, we mustdemonstrate that the skimmers will also remove TOC fromaquarium water with a similar trend.
As indicated in the Experimental section, the skimmer runs fo-cusing on TOC removal from authentic reef aquarium waterutilized tank water removed about 1 hour after feeding, withthe system skimmer (H&S A200-1260) off. We arrived at thistime point after a little experimentation. We had examined TOClevels in this system over the course of a week's time (Feldman,2008c), and those data indicated that there was a spike in TOCvalues a few hours after feeding, but that the TOC levels re-turned to baseline after about 24 hours or so. The system'sskimmer was turned off for ~ 1-2 hours after feeding but other-wise was operational. These observations prompted an initialdecision to remove tank water 24 hours after feeding to minim-ize the possibility of contamination by food residue. In addition,we anticipated that once we removed the tank water from theTOC-producing corals, then little additional TOC would be ad-ded to the water and so the test skimmer would simply depletethe 30-gallon water sample of existing TOC over time. Datafrom this first run using the Euroreef CS80 skimmer are shownin Fig 10. It is clear that our expectation was not met. In fact,the TOC levels did not change much beyond random scatter inthe data. The Euroreef CS80 skimmer did not do anything! Wesurmised that the problem lay in the fact that the aquarium wa-ter already had been depleted of its "removable" TOC by boththe H&S skimmer and by bacterial consumption (Ferrier-Pagès,1998; Ferrier-Pagès, 2000; Kuntz, 2005; Kline, 2006; Feldman,2008c) over the 24-hr post-feeding period. Thus, apparentlythere was almost nothing left for the Euroreef skimmer to re-move. To avoid this problem, the aquarium water removal timehad to be changed, and after some experimentation, we
The Development of a Method for the Quantitative Evaluation of Protein Skimmer Performance
Advanced Aquarist | www.advancedaquarist.com 33 January 2009 | Volume VIII, Issue I
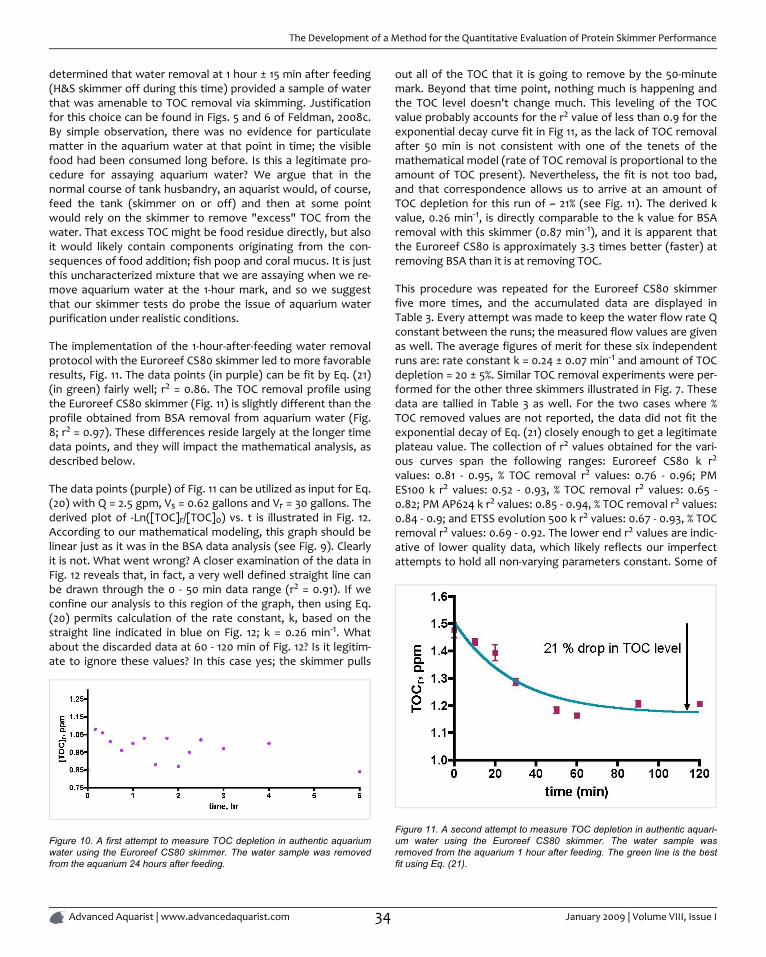
determined that water removal at 1 hour ± 15 min after feeding(H&S skimmer off during this time) provided a sample of waterthat was amenable to TOC removal via skimming. Justificationfor this choice can be found in Figs. 5 and 6 of Feldman, 2008c.By simple observation, there was no evidence for particulatematter in the aquarium water at that point in time; the visiblefood had been consumed long before. Is this a legitimate pro-cedure for assaying aquarium water? We argue that in thenormal course of tank husbandry, an aquarist would, of course,feed the tank (skimmer on or off) and then at some pointwould rely on the skimmer to remove "excess" TOC from thewater. That excess TOC might be food residue directly, but alsoit would likely contain components originating from the con-sequences of food addition; fish poop and coral mucus. It is justthis uncharacterized mixture that we are assaying when we re-move aquarium water at the 1-hour mark, and so we suggestthat our skimmer tests do probe the issue of aquarium waterpurification under realistic conditions.
The implementation of the 1-hour-after-feeding water removalprotocol with the Euroreef CS80 skimmer led to more favorableresults, Fig. 11. The data points (in purple) can be fit by Eq. (21)(in green) fairly well; r2 = 0.86. The TOC removal profile usingthe Euroreef CS80 skimmer (Fig. 11) is slightly different than theprofile obtained from BSA removal from aquarium water (Fig.8; r2 = 0.97). These differences reside largely at the longer timedata points, and they will impact the mathematical analysis, asdescribed below.
The data points (purple) of Fig. 11 can be utilized as input for Eq.(20) with Q = 2.5 gpm, Vs = 0.62 gallons and Vr = 30 gallons. Thederived plot of -Ln([TOC]r/[TOC]0) vs. t is illustrated in Fig. 12.According to our mathematical modeling, this graph should belinear just as it was in the BSA data analysis (see Fig. 9). Clearlyit is not. What went wrong? A closer examination of the data inFig. 12 reveals that, in fact, a very well defined straight line canbe drawn through the 0 - 50 min data range (r2 = 0.91). If weconfine our analysis to this region of the graph, then using Eq.(20) permits calculation of the rate constant, k, based on thestraight line indicated in blue on Fig. 12; k = 0.26 min-1. Whatabout the discarded data at 60 - 120 min of Fig. 12? Is it legitim-ate to ignore these values? In this case yes; the skimmer pulls
Figure 10. A first attempt to measure TOC depletion in authentic aquariumwater using the Euroreef CS80 skimmer. The water sample was removedfrom the aquarium 24 hours after feeding.
out all of the TOC that it is going to remove by the 50-minutemark. Beyond that time point, nothing much is happening andthe TOC level doesn't change much. This leveling of the TOCvalue probably accounts for the r2 value of less than 0.9 for theexponential decay curve fit in Fig 11, as the lack of TOC removalafter 50 min is not consistent with one of the tenets of themathematical model (rate of TOC removal is proportional to theamount of TOC present). Nevertheless, the fit is not too bad,and that correspondence allows us to arrive at an amount ofTOC depletion for this run of ~ 21% (see Fig. 11). The derived kvalue, 0.26 min-1, is directly comparable to the k value for BSAremoval with this skimmer (0.87 min-1), and it is apparent thatthe Euroreef CS80 is approximately 3.3 times better (faster) atremoving BSA than it is at removing TOC.
This procedure was repeated for the Euroreef CS80 skimmerfive more times, and the accumulated data are displayed inTable 3. Every attempt was made to keep the water flow rate Qconstant between the runs; the measured flow values are givenas well. The average figures of merit for these six independentruns are: rate constant k = 0.24 ± 0.07 min-1 and amount of TOCdepletion = 20 ± 5%. Similar TOC removal experiments were per-formed for the other three skimmers illustrated in Fig. 7. Thesedata are tallied in Table 3 as well. For the two cases where %TOC removed values are not reported, the data did not fit theexponential decay of Eq. (21) closely enough to get a legitimateplateau value. The collection of r2 values obtained for the vari-ous curves span the following ranges: Euroreef CS80 k r2
values: 0.81 - 0.95, % TOC removal r2 values: 0.76 - 0.96; PMES100 k r2 values: 0.52 - 0.93, % TOC removal r2 values: 0.65 -0.82; PM AP624 k r2 values: 0.85 - 0.94, % TOC removal r2 values:0.84 - 0.9; and ETSS evolution 500 k r2 values: 0.67 - 0.93, % TOCremoval r2 values: 0.69 - 0.92. The lower end r2 values are indic-ative of lower quality data, which likely reflects our imperfectattempts to hold all non-varying parameters constant. Some of
Figure 11. A second attempt to measure TOC depletion in authentic aquari-um water using the Euroreef CS80 skimmer. The water sample wasremoved from the aquarium 1 hour after feeding. The green line is the bestfit using Eq. (21).
The Development of a Method for the Quantitative Evaluation of Protein Skimmer Performance
Advanced Aquarist | www.advancedaquarist.com 34 January 2009 | Volume VIII, Issue I
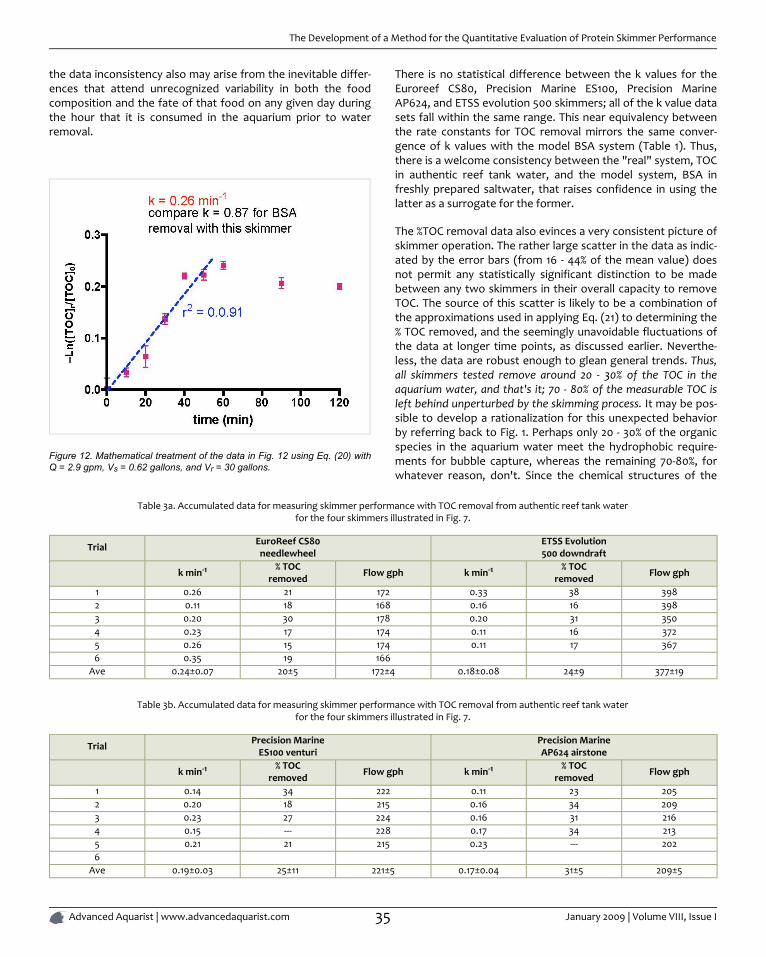
the data inconsistency also may arise from the inevitable differ-ences that attend unrecognized variability in both the foodcomposition and the fate of that food on any given day duringthe hour that it is consumed in the aquarium prior to waterremoval.
Figure 12. Mathematical treatment of the data in Fig. 12 using Eq. (20) withQ = 2.9 gpm, Vs = 0.62 gallons, and Vr = 30 gallons.
There is no statistical difference between the k values for theEuroreef CS80, Precision Marine ES100, Precision MarineAP624, and ETSS evolution 500 skimmers; all of the k value datasets fall within the same range. This near equivalency betweenthe rate constants for TOC removal mirrors the same conver-gence of k values with the model BSA system (Table 1). Thus,there is a welcome consistency between the "real" system, TOCin authentic reef tank water, and the model system, BSA infreshly prepared saltwater, that raises confidence in using thelatter as a surrogate for the former.
The %TOC removal data also evinces a very consistent picture ofskimmer operation. The rather large scatter in the data as indic-ated by the error bars (from 16 - 44% of the mean value) doesnot permit any statistically significant distinction to be madebetween any two skimmers in their overall capacity to removeTOC. The source of this scatter is likely to be a combination ofthe approximations used in applying Eq. (21) to determining the% TOC removed, and the seemingly unavoidable fluctuations ofthe data at longer time points, as discussed earlier. Neverthe-less, the data are robust enough to glean general trends. Thus,all skimmers tested remove around 20 - 30% of the TOC in theaquarium water, and that's it; 70 - 80% of the measurable TOC isleft behind unperturbed by the skimming process. It may be pos-sible to develop a rationalization for this unexpected behaviorby referring back to Fig. 1. Perhaps only 20 - 30% of the organicspecies in the aquarium water meet the hydrophobic require-ments for bubble capture, whereas the remaining 70-80%, forwhatever reason, don't. Since the chemical structures of the
Table 3a. Accumulated data for measuring skimmer performance with TOC removal from authentic reef tank waterfor the four skimmers illustrated in Fig. 7.
Trial EuroReef CS80needlewheel
ETSS Evolution500 downdraft
k min-1 % TOCremoved Flow gph k min-1 % TOC
removed Flow gph
1 0.26 21 172 0.33 38 3982 0.11 18 168 0.16 16 3983 0.20 30 178 0.20 31 3504 0.23 17 174 0.11 16 3725 0.26 15 174 0.11 17 3676 0.35 19 166
Ave 0.24±0.07 20±5 172±4 0.18±0.08 24±9 377±19
Table 3b. Accumulated data for measuring skimmer performance with TOC removal from authentic reef tank waterfor the four skimmers illustrated in Fig. 7.
Trial Precision MarineES100 venturi
Precision MarineAP624 airstone
k min-1 % TOCremoved Flow gph k min-1 % TOC
removed Flow gph
1 0.14 34 222 0.11 23 2052 0.20 18 215 0.16 34 2093 0.23 27 224 0.16 31 2164 0.15 --- 228 0.17 34 2135 0.21 21 215 0.23 --- 2026
Ave 0.19±0.03 25±11 221±5 0.17±0.04 31±5 209±5
The Development of a Method for the Quantitative Evaluation of Protein Skimmer Performance
Advanced Aquarist | www.advancedaquarist.com 35 January 2009 | Volume VIII, Issue I
TOC components are not known, any further speculation alongthese lines must await chemical structural analysis forverification.
One final observation about skimmer performance can begleaned from these experiments. Skimmer manufacturers oftendescribe a "break-in" period at start-up during which the skim-mer does not collect much skimmate but the riser tube getscoated with a biocompatible film (?) that then favors skimmatedeposition. In all of the skimmer runs described above, theskimmer was scrupulously cleaned and dried before each use.Thus, each skimmer run proceeded from the equivalent ofinitial start-up conditions. All skimmers in all runs exhibited TOCdepletion in the reservoir water by the 20-minute time point.Fifteen out of the 21 total skimmer runs exhibited marked TOCdepletion by the 10-min mark, the earliest time point in the ex-periments. There did not seem to be any preference amongstthe four skimmers; three of the skimmers generated two of the"slow start" runs each. Thus, it appears, based upon these res-ults, that a perfectly clean skimmer will begin to extract organicresidue from aquarium water before 20 minutes of operation.For the six skimmer runs that did not display a diminished TOClevel at the 10-min mark, the mathematical determination of kexcluded the 10-min data point.
CONCLUSIONS
Protein skimmers have become indispensable for many aquar-ists who strive to maintain the high water quality necessary tokeep stony corals. This singular piece of equipment is typicallythe second largest expense after the tank itself, and as of thiswriting, there are at least 23 different skimmer vendors in oper-ation. The advertising that accompanies these products oftenboasts of superlative performance, but no skimmer manufac-turer has offered any quantitative support for their claims, inpart because no useful metric for skimmer performance exists.In this article, we introduce two different measures for skimmerperformance; (1) how fast the skimmer removes organic matterfrom salt water, and (2) how much of the existing organic ma-terial actually is removed. We demonstrate how thesequantities can be obtained via experimental measurement andmathematical modeling on a model system consisting of BovineSerum Albumin (BSA) in freshly prepared saltwater. In addition,we demonstrate that the trends among the numerical valuesobtained in the BSA model system also are observed with TOCremoval from authentic aquarium (reef tank) water. The correl-ation between the BSA model system results and the TOC reeftank water results supports the hypothesis that BSA in salt-water can be used as an effective surrogate for TOC inaquarium water.
Four skimmers having four different reaction chamber volumesand representing four distinct types of bubble generation(needlewheel, venturi, airstone, and downdraft) were testedunder the manufacturers' specified conditions. These tests re-vealed that there was no demonstrable difference between the
Euroreef CS80 needlewheel skimmer, the Precision MarineES100 venturi skimmer, the Precision Marine AP624 airstoneskimmer, and the ETSS evolution 500 downdraft skimmer withrespect to the rate constant for either TOC or BSA removal.Thus it is fair to conclude that, at least for the skimmers testedunder the specified conditions, the individual manufacturers'claims of superior performance are without merit. Whether thisconclusion can be extended to other skimmers remains to beseen.
Two operational parameters were examined; airflow rate andwater flow rate. For the one skimmer tested at different airflowrates (Precision Marine AP624), the rate constant k for BSA re-moval did increase significantly as air velocity increased. Theperformance response upon varying water flow rate was notunequivocal. Using the Precision Marine AP624 airstone skim-mer as a test system, increasing the water flow rate at firstincreased, and then decreased, the rate constant k. The basisfor these divergent results has not yet been elucidated.
All four skimmers were quite similar in the second performancefigure-of-merit, the total amount of organics removed. Theskimmers typically removed greater than 80% of the BSA. Incontrast, perhaps one of the more interesting observations toemerge from these studies is the fact that all four skimmerstested removed only 20 - 30% of the total organics present in au-thentic reef tank water.
Several critical questions that cannot yet be answered concernthe generality of the conclusions drawn above. Can any skim-mer beat the 30% organic removal level, or is that an intrinsicproperty of the TOC (cf. Fig. 1)? What are the effects of eithergas flow rates or water flow rates that are far outside of the ex-amined range, on k? Are there other unrecognized factorsburied in the "k" term involved in determining skimmer per-formance? These questions can only be answered by examiningmore skimmers under a wider range of conditions.
From a different perspective, the methodology introduced inthis article, in particular the BSA model system, presents a realopportunity for skimmer designers/manufacturers actually tooptimize skimmer design/operational parameters in a deliber-ate and rational manner. Through these types of productdevelopment studies, skimmer manufacturers finally might beable to include descriptors in their advertising such as "best","fastest" etc. that really mean something.
ACKNOWLEDGMENT
We thank the Eberly College of Science at the PennsylvaniaState University for financial support, Dr. Bruce Logan and Mr.David Jones of the Pennsylvania State University Department ofCivil and Environmental Engineering for use of the Shimadzu5000 TOC Analyzer, and Dr. James Vrentas of the PennsylvaniaState University Department of Chemical Engineering for
The Development of a Method for the Quantitative Evaluation of Protein Skimmer Performance
Advanced Aquarist | www.advancedaquarist.com 36 January 2009 | Volume VIII, Issue I
assistance in developing the mathematical model described inthis article.
REFERENCES
1. Aksay, S.; Mazza, G. 2007. "Optimization of Protein Recov-ery by Foam Separation Using Response SurfaceMethodology." J. Food Eng. 79, 598-606.
2. Ahmed, S. I. 1975. "Laws of Foam Formation and FoamFractionation." Sep. Sci. 10, 673-688.
3. Bhattacharjee, S.; Kumar, R.; Gandhi, K. S. 1997."Prediction of Separation Factor in Foam Separation ofProteins." Chem. Eng. Sci. 52, 4625-4636.
4. Brown, L.; Narsimhan, G.; Wankat, P. C. 1990. "Foam Frac-tionation of Globular Proteins." Biotechnol. Bioeng. 36,947-959.
5. Caballero, M.; Cela, R.; Perez-Bustamante, J. A. 1990."Analytical Applications of Some Flotation Techniques - AReview." Talanta 37, 275-300.
6. Clark, A. N.; Wilson, D. J. 1983. Foam Flotation: Theory andApplications. Marcel Dekker, Inc. New York.
7. Du, L.; Loha, V.; Tanner, R. D. 2000. "Modeling a ProteinFoam Fractionation Process." Appl. Biochem. Biotechnol.84-86, 1087-1099.
8. Du, L.; Ding, Y.; Prokop, A.; Tanner, R. D. 2001."Measurement of Bubble Size Distribution in ProteinFoam Fractionation Column Capillary Probe with Photo-electric Sensors." Appl. Biochem. Biotechnol. 91-93,387-404.
9. Du, L.; Prokop, A.; Tanner, R. D. 2002. "Effect of BubbleSize on Foam Fractionation of Ovalbumin." Appl. Bio-chem. Biotechnol. 98-100, 1075-1091.
10. Du, L.; Prokop, A.; Tanner, R. D. 2003. "Variation of BubbleSize Distribution in a Protein Foam Fractionation ColumnMeasured Using a Capillary Probe with PhotoelectricSensors." J. Colloid Interface Sci. 259, 180-185.
11. Felder, R. M.; Rousseau, R. W. 2005. Elementary Principlesof Chemical Processes, 3rd Ed., John Wiley and Sons, NewYork.
12. Feldman, K. S.; Vernese, L. F.; Mueller, K. T.; Maers, K.2008a. "Granular Activated Carbon: Modeling of Opera-tional Parameters for Dissolved Organic Carbon Removalfrom Marine Aquaria, Part 1." Advanced Aquarist, 7,http://www.advancedaquarist.com/2008/1/aafeature1/.
13. Feldman, K. S.; Vernese, L. F.; Mueller, K. T.; Maers, K.2008b. "Granular Activated Carbon: Modeling of Opera-tional Parameters for Dissolved Organic Carbon Removalfrom Marine Aquaria, Part 2." Advanced Aquarist, 7,http://www.advancedaquarist.com/2008/2/aafeature1/.
14. Feldman, K. S.; Maers, K. M. 2008c. "Total Organic Carbon(TOC) and the Reef Aquarium; an Initial Survey. Part 1."Advanced Aquarist, 7, http://www.advancedaquarist.com/2008/8/aafeature3/.
15. Feldman, K. S.; Maers, K. M. 2008d. "Total Organic Carbon(TOC) and the Reef Aquarium; an Initial Survey. Part 2."Advanced Aquarist, 7, http://www.advancedaquarist.com/2008/9/aafeature2/.
16. Ferrier-Pagès, C.; Gattuso, J.-P.; Cauwet, G.; Jaubert, J.;Allemand, D. 1998. "Release of Dissolved Organic Carbonand Nitrogen by the Zooxanthellate Coral Galaxea fascicu-laris." Mar. Ecol. Prog. Ser., 172, 265-274.
17. Ferrier-Pagès, C.; Leclercq, N.; Jaubert, J.; Pelegri, S. P.2000. "Enhancement of Pico- and nanoplankton Growthby Coral Exudates." Aquat. Microb. Ecol., 21, 203-209.
18. Gehle, R. D.; Schügerl, K. 1894. "Protein Recovery byContinuous Flotation." Appl. Microbiol. Biotechnol. 20,133-138.
19. Holmes-Farley, R. 2006. "What is Skimming?" Reefkeep-ing, 5, http://www.reefkeeping.com/issues/2006-08/rhf/index.php.
20. Kuntz, N. M.; Kline, D. I.; Sandin, S. A.; Rohwer, F. 2005."Pathologies and Mortality Rates Caused by Organic Car-bon and Nutrient Stressors in Three Caribbean CoralSpecies." Mar. Ecol. Prog. Ser., 294, 173-180.
21. Huckstedt, G. 1972. "Foam Flotation Separation SystemParticularly Suitable for Separating Dissolved ProteinCompounds and Toxic Metallic Ions from AquariumWater." US Patn. 3,669,883.
22. Kline, D. I.; Kuntz, N. M.; Breitbart, M.; Knowlton, N.; Ro-hwer, F. 2006. "Role of Elevated Organic Carbon Levelsand Microbial Activity in Coral Mortality. Mar. Ecol. Prog.Ser., 314, 119-125.
23. Lemlich, R., Ed. 1972. Adsorptive Bubble Separation Tech-niques. Academic Press, New York.
24. Lockwood, C. E.; Bummer, P. M.; Jay, M. 1997."Purification of Proteins Using Foam Fractionation."Pharm. Res. 14, 1511-1515.
The Development of a Method for the Quantitative Evaluation of Protein Skimmer Performance
Advanced Aquarist | www.advancedaquarist.com 37 January 2009 | Volume VIII, Issue I
25. Okamoto, Y.; Chou, E. J. 1979. "Foam Separation Pro-cesses" in Handbook of Separation Techniques for ChemicalEngineers, Schweitzer, P. A., Ed. Wiley, New York.
26. Ostwald, W.; Siehr, A. 1937. "Analysis of Foams and Solu-tion by Foaming." Chem. Ztg. 61, 649-660.
27. Rosa, P. T. V.; Santana, C. C.; Carbonell, R. G. 2007."Determination of the Liquid Pool Surfactant and ProteinConcentration for Semi-Batch Foam FractionationColumns." Brazilian J. Chem. Eng. 24, 1-14.
28. Thiel, A. J. 1997. "Trends in Foam Fractionation."http://www.netpets.com/fish/reference/saltref/foam.html.
29. Schnepf, R. W.; Gaden, E. L. 1959. "Foam Fractionation ofProteins: Concentration of Aqueous Solutions of BSA." J.Biochem. Microbiol. Technol. Eng. 1, 1-11.
30. Schutz, F. 1937. "Adsorption on Foams." Nature 139,629-630.
31. Suzuki, Y.; Hanagasaki, N.; Furukawa, T.; Yoshida, T. 2008."Removal of Bacteria from Coastal Seawater by Foam Se-paration Using Dispersed Bubbles and Surface-ActiveSubstances." J. Biosci. Bioeng. 105, 383-388.
32. Uraizee, F.; Narsimhan, G. 1995. "A Model for ContinuousFoam Concentration of Proteins: Effects of Kinetics of Ab-sorption of Proteins and Coalescence of Foam." Sep. Sci.Technol. 30, 847-881.
33. Uraizee, F.; Narsimhan, G. 1996. "Effects of Kinetics of Ad-sorption and Coalescence on Continuous FoamConcentration of Proteins: Comparison of ExperimentalResults with Model Predictions." Biotech. Bioeng. 51,384-398.
34. Wallace, G. T., Jr.; Wilson, D. F. 1969. "Foam Separation asa Tool in Chemical Oceanography." Naval Research Labor-atory, Accession number: AD 0697924.
35. Wong, C. H.; Hossain, M. M.; Davies, C. E. 2001."Performance of a Continuous Foam Separation Columnas a Function of Process Variables." Bioprosess Biosys.Eng. 24, 73-81.
The Development of a Method for the Quantitative Evaluation of Protein Skimmer Performance
Advanced Aquarist | www.advancedaquarist.com 38 January 2009 | Volume VIII, Issue I
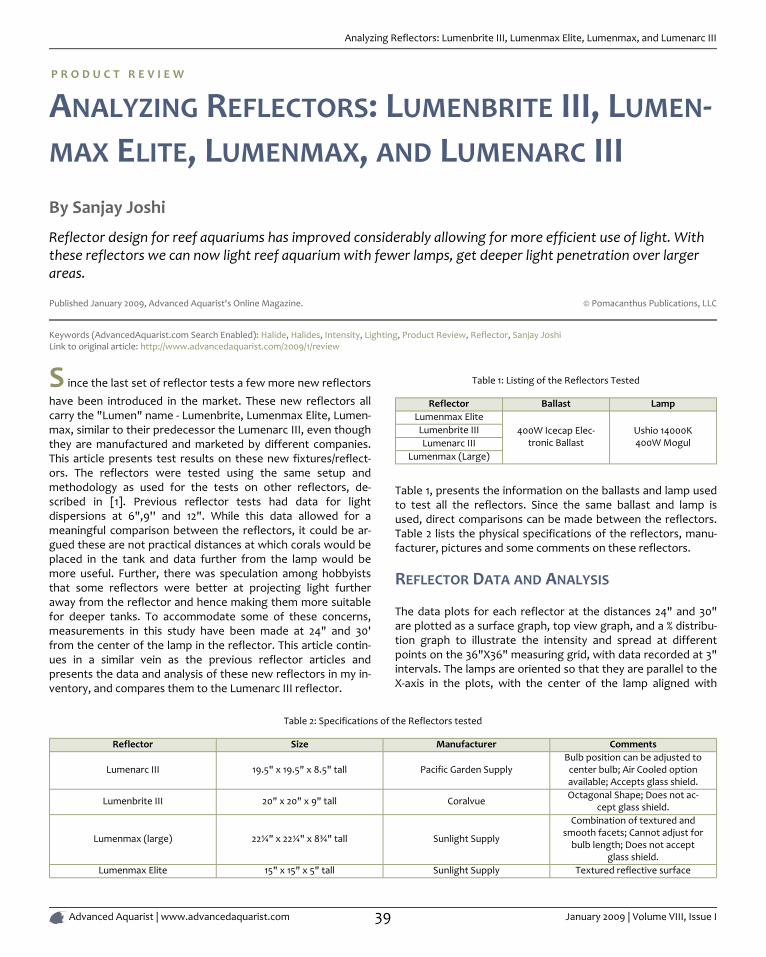
P R O D U C T R E V I E W
ANALYZING REFLECTORS: LUMENBRITE III, LUMEN-MAX ELITE, LUMENMAX, AND LUMENARC IIIBy Sanjay Joshi
Reflector design for reef aquariums has improved considerably allowing for more efficient use of light. Withthese reflectors we can now light reef aquarium with fewer lamps, get deeper light penetration over largerareas.
© Pomacanthus Publications, LLCPublished January 2009, Advanced Aquarist's Online Magazine.
Keywords (AdvancedAquarist.com Search Enabled): Halide, Halides, Intensity, Lighting, Product Review, Reflector, Sanjay JoshiLink to original article: http://www.advancedaquarist.com/2009/1/review
S ince the last set of reflector tests a few more new reflectors
have been introduced in the market. These new reflectors allcarry the "Lumen" name - Lumenbrite, Lumenmax Elite, Lumen-max, similar to their predecessor the Lumenarc III, even thoughthey are manufactured and marketed by different companies.This article presents test results on these new fixtures/reflect-ors. The reflectors were tested using the same setup andmethodology as used for the tests on other reflectors, de-scribed in [1]. Previous reflector tests had data for lightdispersions at 6",9'' and 12". While this data allowed for ameaningful comparison between the reflectors, it could be ar-gued these are not practical distances at which corals would beplaced in the tank and data further from the lamp would bemore useful. Further, there was speculation among hobbyiststhat some reflectors were better at projecting light furtheraway from the reflector and hence making them more suitablefor deeper tanks. To accommodate some of these concerns,measurements in this study have been made at 24" and 30'from the center of the lamp in the reflector. This article contin-ues in a similar vein as the previous reflector articles andpresents the data and analysis of these new reflectors in my in-ventory, and compares them to the Lumenarc III reflector.
Table 1: Listing of the Reflectors Tested
Reflector Ballast LampLumenmax EliteLumenbrite IIILumenarc III
Lumenmax (Large)
400W Icecap Elec-tronic Ballast
Ushio 14000K400W Mogul
Table 1, presents the information on the ballasts and lamp usedto test all the reflectors. Since the same ballast and lamp isused, direct comparisons can be made between the reflectors.Table 2 lists the physical specifications of the reflectors, manu-facturer, pictures and some comments on these reflectors.
REFLECTOR DATA AND ANALYSIS
The data plots for each reflector at the distances 24" and 30"are plotted as a surface graph, top view graph, and a % distribu-tion graph to illustrate the intensity and spread at differentpoints on the 36"X36" measuring grid, with data recorded at 3"intervals. The lamps are oriented so that they are parallel to theX-axis in the plots, with the center of the lamp aligned with
Table 2: Specifications of the Reflectors tested
Reflector Size Manufacturer Comments
Lumenarc III 19.5" x 19.5" x 8.5" tall Pacific Garden SupplyBulb position can be adjusted tocenter bulb; Air Cooled optionavailable; Accepts glass shield.
Lumenbrite III 20" x 20" x 9" tall Coralvue Octagonal Shape; Does not ac-cept glass shield.
Lumenmax (large) 22¼" x 22¼" x 8¾" tall Sunlight Supply
Combination of textured andsmooth facets; Cannot adjust for
bulb length; Does not acceptglass shield.
Lumenmax Elite 15" x 15" x 5" tall Sunlight Supply Textured reflective surface
Analyzing Reflectors: Lumenbrite III, Lumenmax Elite, Lumenmax, and Lumenarc III
Advanced Aquarist | www.advancedaquarist.com 39 January 2009 | Volume VIII, Issue I
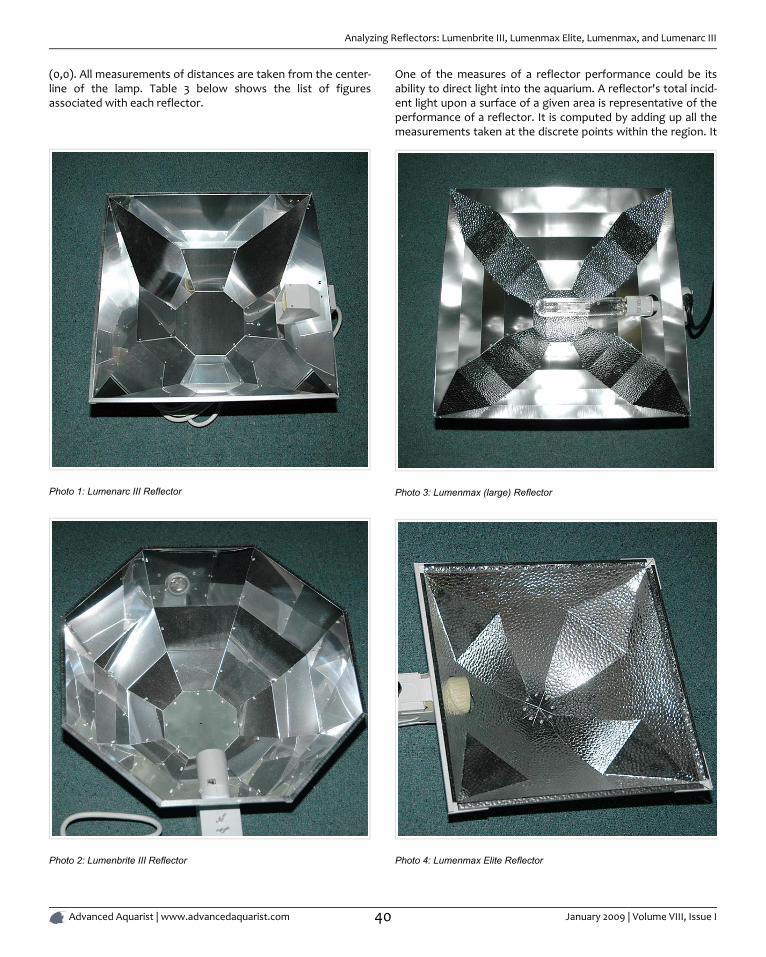
(0,0). All measurements of distances are taken from the center-line of the lamp. Table 3 below shows the list of figuresassociated with each reflector.
Photo 1: Lumenarc III Reflector
Photo 2: Lumenbrite III Reflector
One of the measures of a reflector performance could be itsability to direct light into the aquarium. A reflector's total incid-ent light upon a surface of a given area is representative of theperformance of a reflector. It is computed by adding up all themeasurements taken at the discrete points within the region. It
Photo 3: Lumenmax (large) Reflector
Photo 4: Lumenmax Elite Reflector
Analyzing Reflectors: Lumenbrite III, Lumenmax Elite, Lumenmax, and Lumenarc III
Advanced Aquarist | www.advancedaquarist.com 40 January 2009 | Volume VIII, Issue I
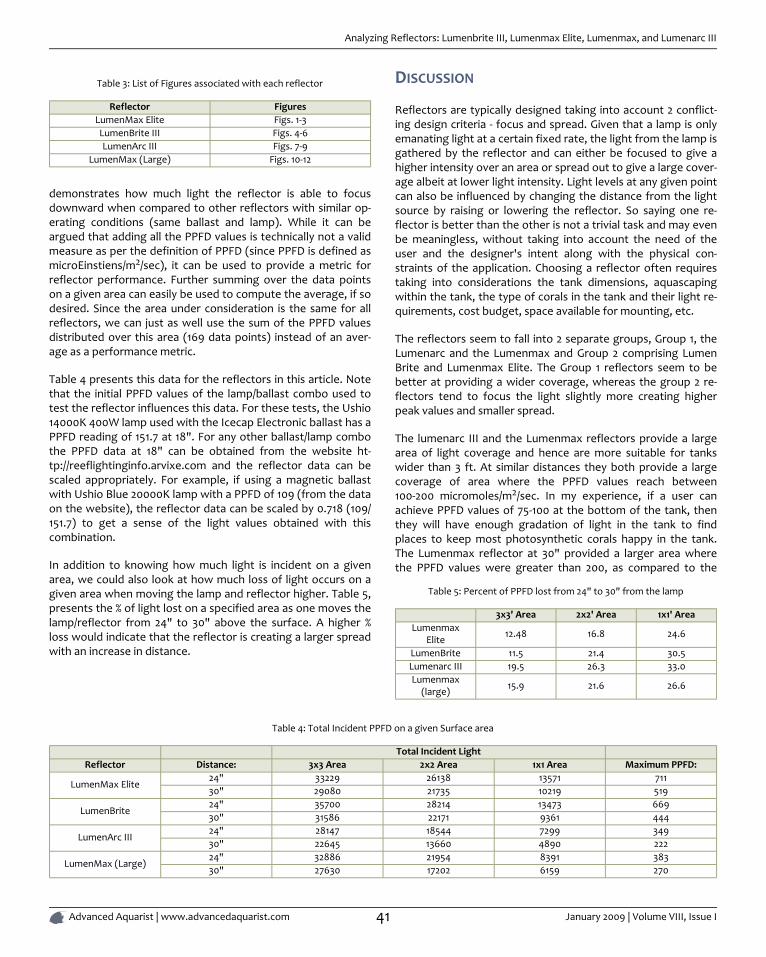
Table 3: List of Figures associated with each reflector
Reflector FiguresLumenMax Elite Figs. 1-3LumenBrite III Figs. 4-6LumenArc III Figs. 7-9
LumenMax (Large) Figs. 10-12
demonstrates how much light the reflector is able to focusdownward when compared to other reflectors with similar op-erating conditions (same ballast and lamp). While it can beargued that adding all the PPFD values is technically not a validmeasure as per the definition of PPFD (since PPFD is defined asmicroEinstiens/m2/sec), it can be used to provide a metric forreflector performance. Further summing over the data pointson a given area can easily be used to compute the average, if sodesired. Since the area under consideration is the same for allreflectors, we can just as well use the sum of the PPFD valuesdistributed over this area (169 data points) instead of an aver-age as a performance metric.
Table 4 presents this data for the reflectors in this article. Notethat the initial PPFD values of the lamp/ballast combo used totest the reflector influences this data. For these tests, the Ushio14000K 400W lamp used with the Icecap Electronic ballast has aPPFD reading of 151.7 at 18". For any other ballast/lamp combothe PPFD data at 18" can be obtained from the website ht-tp://reeflightinginfo.arvixe.com and the reflector data can bescaled appropriately. For example, if using a magnetic ballastwith Ushio Blue 20000K lamp with a PPFD of 109 (from the dataon the website), the reflector data can be scaled by 0.718 (109/151.7) to get a sense of the light values obtained with thiscombination.
In addition to knowing how much light is incident on a givenarea, we could also look at how much loss of light occurs on agiven area when moving the lamp and reflector higher. Table 5,presents the % of light lost on a specified area as one moves thelamp/reflector from 24" to 30" above the surface. A higher %loss would indicate that the reflector is creating a larger spreadwith an increase in distance.
DISCUSSION
Reflectors are typically designed taking into account 2 conflict-ing design criteria - focus and spread. Given that a lamp is onlyemanating light at a certain fixed rate, the light from the lamp isgathered by the reflector and can either be focused to give ahigher intensity over an area or spread out to give a large cover-age albeit at lower light intensity. Light levels at any given pointcan also be influenced by changing the distance from the lightsource by raising or lowering the reflector. So saying one re-flector is better than the other is not a trivial task and may evenbe meaningless, without taking into account the need of theuser and the designer's intent along with the physical con-straints of the application. Choosing a reflector often requirestaking into considerations the tank dimensions, aquascapingwithin the tank, the type of corals in the tank and their light re-quirements, cost budget, space available for mounting, etc.
The reflectors seem to fall into 2 separate groups, Group 1, theLumenarc and the Lumenmax and Group 2 comprising LumenBrite and Lumenmax Elite. The Group 1 reflectors seem to bebetter at providing a wider coverage, whereas the group 2 re-flectors tend to focus the light slightly more creating higherpeak values and smaller spread.
The lumenarc III and the Lumenmax reflectors provide a largearea of light coverage and hence are more suitable for tankswider than 3 ft. At similar distances they both provide a largecoverage of area where the PPFD values reach between100-200 micromoles/m2/sec. In my experience, if a user canachieve PPFD values of 75-100 at the bottom of the tank, thenthey will have enough gradation of light in the tank to findplaces to keep most photosynthetic corals happy in the tank.The Lumenmax reflector at 30" provided a larger area wherethe PPFD values were greater than 200, as compared to the
Table 5: Percent of PPFD lost from 24" to 30" from the lamp
3x3' Area 2x2' Area 1x1' AreaLumenmax
Elite 12.48 16.8 24.6
LumenBrite 11.5 21.4 30.5Lumenarc III 19.5 26.3 33.0Lumenmax
(large) 15.9 21.6 26.6
Table 4: Total Incident PPFD on a given Surface area
Total Incident LightReflector Distance: 3x3 Area 2x2 Area 1x1 Area Maximum PPFD:
24" 33229 26138 13571 711LumenMax Elite
30" 29080 21735 10219 51924" 35700 28214 13473 669
LumenBrite30" 31586 22171 9361 44424" 28147 18544 7299 349
LumenArc III30" 22645 13660 4890 22224" 32886 21954 8391 383
LumenMax (Large)30" 27630 17202 6159 270
Analyzing Reflectors: Lumenbrite III, Lumenmax Elite, Lumenmax, and Lumenarc III
Advanced Aquarist | www.advancedaquarist.com 41 January 2009 | Volume VIII, Issue I
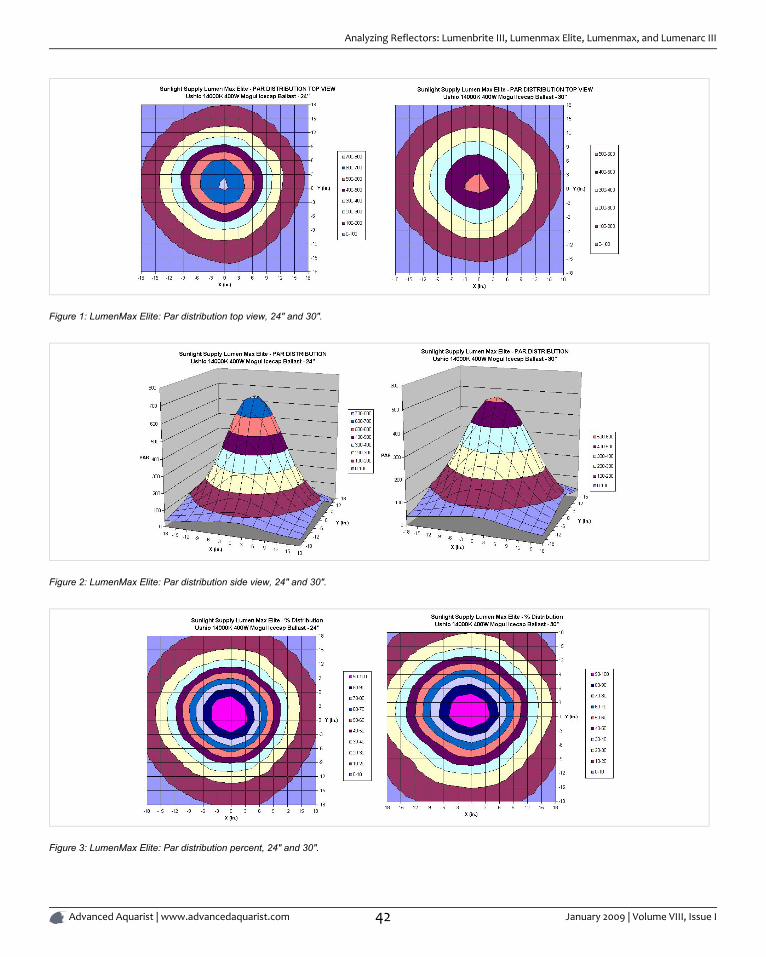
Figure 1: LumenMax Elite: Par distribution top view, 24" and 30".
Figure 2: LumenMax Elite: Par distribution side view, 24" and 30".
Figure 3: LumenMax Elite: Par distribution percent, 24" and 30".
Analyzing Reflectors: Lumenbrite III, Lumenmax Elite, Lumenmax, and Lumenarc III
Advanced Aquarist | www.advancedaquarist.com 42 January 2009 | Volume VIII, Issue I
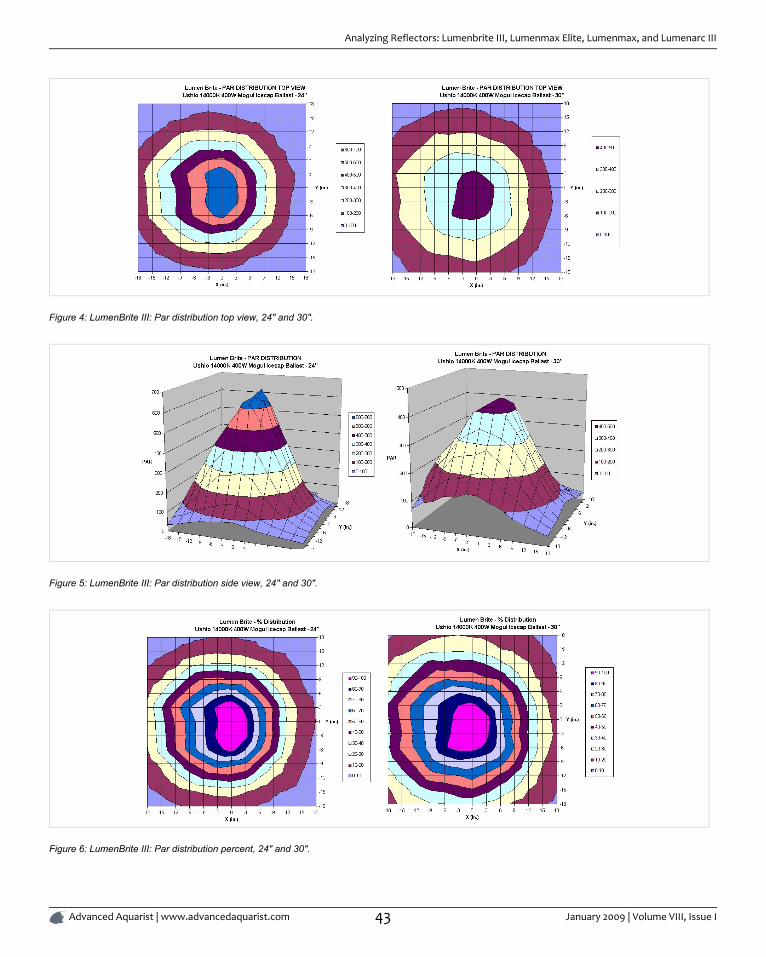
Figure 4: LumenBrite III: Par distribution top view, 24" and 30".
Figure 5: LumenBrite III: Par distribution side view, 24" and 30".
Figure 6: LumenBrite III: Par distribution percent, 24" and 30".
Analyzing Reflectors: Lumenbrite III, Lumenmax Elite, Lumenmax, and Lumenarc III
Advanced Aquarist | www.advancedaquarist.com 43 January 2009 | Volume VIII, Issue I
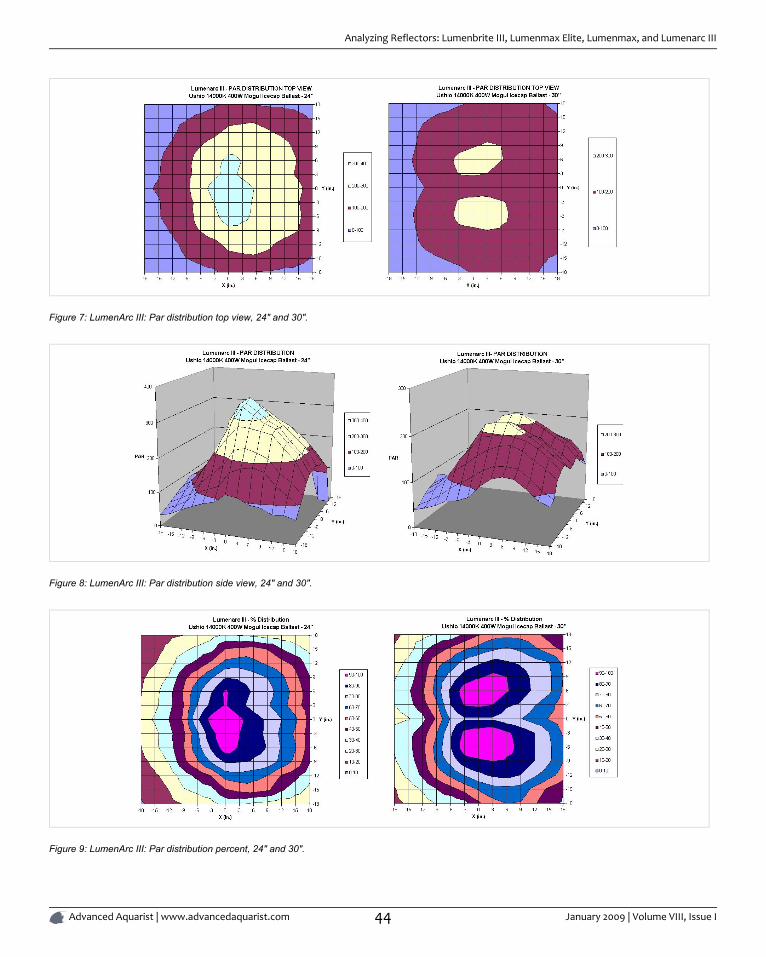
Figure 7: LumenArc III: Par distribution top view, 24" and 30".
Figure 8: LumenArc III: Par distribution side view, 24" and 30".
Figure 9: LumenArc III: Par distribution percent, 24" and 30".
Analyzing Reflectors: Lumenbrite III, Lumenmax Elite, Lumenmax, and Lumenarc III
Advanced Aquarist | www.advancedaquarist.com 44 January 2009 | Volume VIII, Issue I
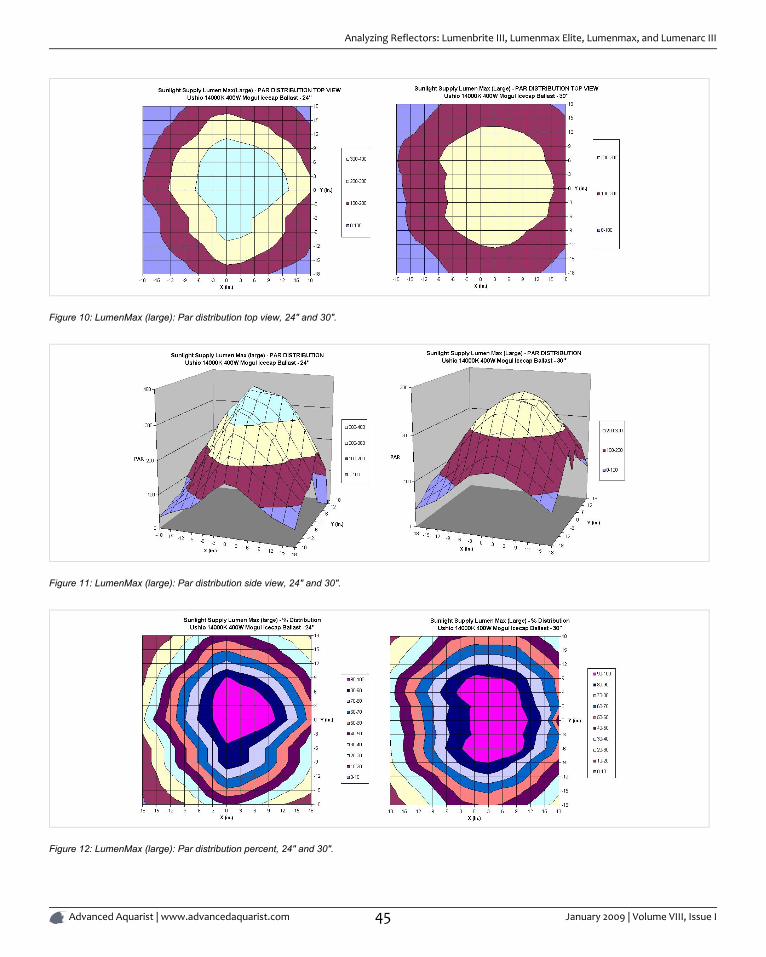
Figure 10: LumenMax (large): Par distribution top view, 24" and 30".
Figure 11: LumenMax (large): Par distribution side view, 24" and 30".
Figure 12: LumenMax (large): Par distribution percent, 24" and 30".
Analyzing Reflectors: Lumenbrite III, Lumenmax Elite, Lumenmax, and Lumenarc III
Advanced Aquarist | www.advancedaquarist.com 45 January 2009 | Volume VIII, Issue I
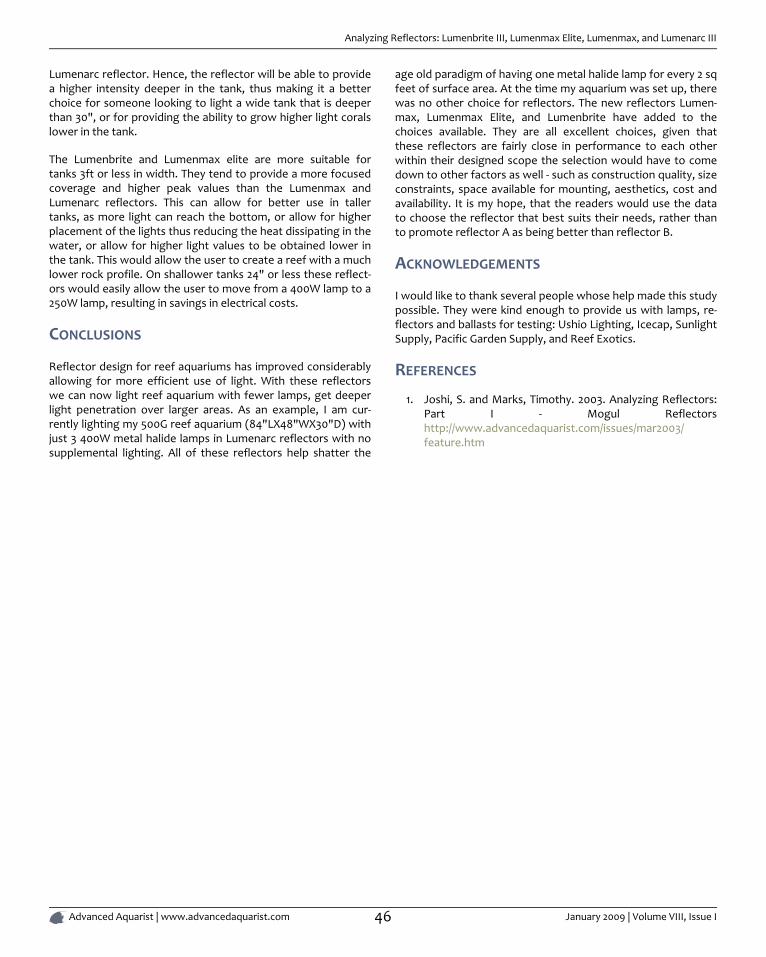
Lumenarc reflector. Hence, the reflector will be able to providea higher intensity deeper in the tank, thus making it a betterchoice for someone looking to light a wide tank that is deeperthan 30", or for providing the ability to grow higher light coralslower in the tank.
The Lumenbrite and Lumenmax elite are more suitable fortanks 3ft or less in width. They tend to provide a more focusedcoverage and higher peak values than the Lumenmax andLumenarc reflectors. This can allow for better use in tallertanks, as more light can reach the bottom, or allow for higherplacement of the lights thus reducing the heat dissipating in thewater, or allow for higher light values to be obtained lower inthe tank. This would allow the user to create a reef with a muchlower rock profile. On shallower tanks 24" or less these reflect-ors would easily allow the user to move from a 400W lamp to a250W lamp, resulting in savings in electrical costs.
CONCLUSIONS
Reflector design for reef aquariums has improved considerablyallowing for more efficient use of light. With these reflectorswe can now light reef aquarium with fewer lamps, get deeperlight penetration over larger areas. As an example, I am cur-rently lighting my 500G reef aquarium (84"LX48"WX30"D) withjust 3 400W metal halide lamps in Lumenarc reflectors with nosupplemental lighting. All of these reflectors help shatter the
age old paradigm of having one metal halide lamp for every 2 sqfeet of surface area. At the time my aquarium was set up, therewas no other choice for reflectors. The new reflectors Lumen-max, Lumenmax Elite, and Lumenbrite have added to thechoices available. They are all excellent choices, given thatthese reflectors are fairly close in performance to each otherwithin their designed scope the selection would have to comedown to other factors as well - such as construction quality, sizeconstraints, space available for mounting, aesthetics, cost andavailability. It is my hope, that the readers would use the datato choose the reflector that best suits their needs, rather thanto promote reflector A as being better than reflector B.
ACKNOWLEDGEMENTS
I would like to thank several people whose help made this studypossible. They were kind enough to provide us with lamps, re-flectors and ballasts for testing: Ushio Lighting, Icecap, SunlightSupply, Pacific Garden Supply, and Reef Exotics.
REFERENCES
1. Joshi, S. and Marks, Timothy. 2003. Analyzing Reflectors:Part I - Mogul Reflectorshttp://www.advancedaquarist.com/issues/mar2003/feature.htm
Analyzing Reflectors: Lumenbrite III, Lumenmax Elite, Lumenmax, and Lumenarc III
Advanced Aquarist | www.advancedaquarist.com 46 January 2009 | Volume VIII, Issue I
S H O R T T A K E
TIPS FOR HEALTHY AQUARIUM INHABITANTS: PRE-VENTIVE MEASURES FOR AQUARISTS, PART ONE
By Terry D. Bartelme
Practicing these good habits will minimize stress, prevent injury and insure that your stock will be wellnourished.
© Pomacanthus Publications, LLCPublished January 2009, Advanced Aquarist's Online Magazine.
Keywords (AdvancedAquarist.com Search Enabled): Acclimation, Quarantine, Short Take, Stress, Terry D. Bartelme, MedicationLink to original article: http://www.advancedaquarist.com/2009/1/short
O ne of the hallmarks of a good aquarist is practicing pre-
ventive measures. Experienced hobbyists usually realize howimportant these habits are to their long-term success. Preven-tion consists of more than merely quarantining newly acquiredfish. It also includes researching animals prior to purchase, mak-ing wise choices and being prepared in the event of anemergency. Practicing these good habits will minimize stress,prevent injury and insure that your stock will be well nourished.
QUARANTINE
Good things take time, but bad things can happen quickly in thishobby. That is why patience is such an important virtue foraquarists. While preventive measures do take some time and ef-fort they also save time in the long run. One may think that it iseasier to skip quarantine so they can get fish into the displayaquarium quicker, but taking such risks often results in lengthysetbacks. This can mean losing stock to contagious disease orparasites. How much time is actually saved if all the fish have tobe removed to another tank for treatment, because the propersteps were not taken to prevent an infectious disease from en-tering the display aquarium?
Six weeks of quarantine is recommended for recently capturedreef fish. This allows enough time for them to regain theirhealth, recover from the stress, adapt to captivity and learn toeat new foods. All newly acquired fish should be quarantined inisolation from other animals for a minimum of thirty days, re-gardless of the conditions that they came from. Exceptions canbe made for mated pairs or small groups of shoaling fish toshare a quarantine tank.
A quarantine system may be the best investment that an aquar-ist can make. Not only will it save money in the long run, it willsave time and help you to avoid heartbreaking situations.Medicating a display aquarium may destroy the biological
filtration and the invertebrates, as well as the fish, may not sur-vive the treatment. Using a quarantine system will help you tosteer clear of many situations that may make it tempting tomedicate the display aquarium.
An efficient quarantine system does not require a sizable finan-cial investment. All that is really necessary is a tank or foodgrade Rubbermaid™ container, a heater, some PVC pipe for hid-ing places and a something to provide biological filtration. Anoutside filter with a biowheel, or a sponge filter driven by an airpump will suffice. Don't forget to use a lid or screen to keep thefish from ending up on the floor. Overhead lighting is optionalfor fish, while some invertebrates require intense illumination.Place the isolation tank in a quiet location away from the maintraffic flow of the house.
Do not keep rock, substrate or other calcareous materials in aquarantine system. It is better to rely on a filter that can easilybe removed or replaced for biological filtration. Some medica-tions may destroy or inhibit the bacteria that performnitrification and calcareous materials will react with copper totake it out of solution.
Stable water conditions are important to the health of all fish,especially those that have been recently exposed to stressors.Keep a cycled quarantine tank up and running at all times soyou won't have to deal with ammonia poisoning or unstablewater parameters.
At times it may be necessary to sterilize the quarantine tankafter finishing treatment for a contagious disease or parasite.This can be accomplished by adding a little chlorine to the wa-ter for a few hours. Then remove the chlorine and change thewater. Keep a spare sponge filter or biowheel in the sump ofyour display aquarium so you always have a backup biologicalfilter ready for use in your quarantine system.
Tips for Healthy Aquarium Inhabitants: Preventive Measures for Aquarists, Part One
Advanced Aquarist | www.advancedaquarist.com 47 January 2009 | Volume VIII, Issue I
The water parameters should be monitored closely in a quar-antine system. Keep test kits for ammonia, pH, alkalinity,copper, oxygen, nitrate and nitrite near the aquarium. Regular,weekly water tests will help you keep track of the water para-meters. Record a log of the results so any trends, such as afalling pH, will become evident. Don't forget to check the expir-ation dates of your test reagents to insure accurate readings.
An easy to read thermometer should placed in or on the aquari-um. Use two small heaters rather than one that is powerfulenough to overheat the aquarium. This is safer in the event of amalfunction. One small heater can't overheat the aquariumwhile it will prevent the water temperature from falling quicklyif the second small heater stops working.
Do not use the same nets, cleaning equipment, etc., for yourquarantine and display aquarium. It is not worth the risk ofspreading a contagious disease or parasite. Use a food-gradeRubbermaid container when you give your fish a freshwater ormedicated dip. Don't forget to use a ground fault interrupterand to turn off the power whenever working on your aquarium.Just in case you might forget, a timer can be used to automatic-ally turn the power back on after you have finished.
Plastic swing-arm type hydrometers will work well enoughprovided you don't need to measure the salinity precisely. Ifyou ever need to treat your fish with hyposalinity therapy thenan accurate means of measuring the salinity is essential. A re-fractometer is a good investment and more accurate than mosthydrometers.
Observe the animals in quarantine daily for any changes in be-havior or visible symptoms of disease. Check the respirationrate to see if it is accelerated, normal, or abnormally slow. Arethe eyes clear? Are they eating and showing an interest in theirsurroundings? Do they rub against objects in the aquarium? Isthe fish swimming normally and using all of the fins? Is their col-oration bright or faded? Do they react to your approach? Whileit is essential to closely observe the specimens in quarantinedon't do it several times a day, because this may cause stressfor the animals.
To get a good look at a fish in the aquarium trap it against theglass with a specimen container or net. Then look them overclosely using a magnifying glass and a flashlight. This shouldmake it easier to identify any potential visible symptoms. Haveat least one book that you can refer to that can help you identi-fy fish diseases and infections: "Manual of Fish Health" byAndrews, Exell and Carrington is a good example. Keep noteseach day about what is happening with your quarantine tankand the inhabitants. This will help you to remember your experi-ences and assist you in the future.
Four factors in successful quarantine
1. Sufficient quarantine length
2. Monitoring the water parameters closely
3. Carefully observing the animals each day
4. Keeping accurate notes
MEDICATIONS
When fish are sick administering treatment without delay canmean the difference between success and failure. There are afew medications that should be kept on hand for some of themore common infections. Keep a good copper-based medica-tion such as Cupramine™, some praziquantel, formalin, and atleast one good antibiotic handy. Maracyn-Two™ (minocycline),nitrofurazone, Furanase™ (nifurpirinol), kanamycin and neomy-cin are some good choices for antibiotics. Do not overstockwith medications as they may expire before you use them.
CATCHING THE FISH
Netting and removing fish from the water causes stress and fre-quently leads to injuries. This can be avoided by herding the fishinto clear plastic bags or specimen containers with a net. Thenthe fish can be lifted from the aquarium in water. Clear plasticbags and specimen containers are more difficult for fish to seein the water than nets. This should make it easier to catch themand minimize the stress of chasing them around the aquarium.
SPARE EQUIPMENT
You never know when you may be faced with a power outageor equipment failure. It may not happen when it is a convenienttime for you to run to a store and purchase what you need.Stock an extra water pump, a heater, some airstones, batteriesand at least one battery operated airpump for just such an oc-casion. Make sure that you have some firewood around foryour fireplace in case you need to keep the house and theaquarium warm. It is also a good idea to make arrangementswith someone that can take care of your aquarium in an emer-gency, or when you are away on vacation.
RESEARCH THE ANIMALS PRIOR TO PURCHASE
Research may be the most important tool an aquarist can use.Knowing the needs, requirements and compatibility of eachspecies prior to purchase will help you avoid making mistakesand greatly improves the animal's chance of living a longhealthy life in your care. You may learn that a species that youwere considering has special dietary needs, requires a largertank or simply is not compatible with another fish or inverteb-rate in your aquarium.
Tips for Healthy Aquarium Inhabitants: Preventive Measures for Aquarists, Part One
Advanced Aquarist | www.advancedaquarist.com 48 January 2009 | Volume VIII, Issue I
SELECTING A SPECIMEN
Once you have thoroughly researched a particular species offish it is time to closely scrutinize each potential acquisition.Starting with a healthy specimen to begin with greatly in-creases their odds of long-term survival. Look for signals thatindicate good health: such as eating, vibrant colors, a roundedappearance, clear eyes, fully extended fins, swimming normallyand showing interest in the environment around them. Alwaysask to see the fish eat before you purchase it. Buying any fishthat is eating less than two types of food is a risky proposition.If the specimen you are interested in is not eating then go backto the dealer in a day or two for another try.
Avoid specimens that exhibit labored or rapid respiration, arelethargic, have injuries, torn fins, are emaciated, or are obvi-ously diseased. It is not uncommon for recently transported fishto be a bit thin in the stomach area. They will usually recoverfrom this once they begin eating again, provided they receivean adequate diet. Fish suffering from long term or severe star-vation will be thin behind the head and above the lateral line.These specimens may not recover.
BRINGING THEM HOME
Check the pH and water temperature in the tank of the speci-men that you are interested in at the store. Then prepare yourquarantine tank before you bring them home by matchingthose parameters as closely as possible (provided those para-meters are safe).
Take a few precautions when transporting newly acquired spe-cimens to reduce the risk of injury and stress on the animals.Start with enough water. A half gallon of water per three inchesof fish is a good guideline. The rest of the transport bag shouldbe filled with oxygen. Double bag the fish as leak insurance andto help insulate the water from temperature fluctuations. Keepthe fish in the dark during transport to decrease their aware-ness of their surroundings and help reduce stress. Then get thefish into the quarantine tank as quickly as possible.
STRESS
Any discussion of prevention and health in fish should includethe topic of stress. Stress causes a myriad of physical, chemicaland behavioral changes in fish. Stress can interfere with eatingbehaviors and digestion, cause difficulty in maintaining normalhomeostasis (such as osmotic balance) and reduce immunefunction among other things. Behavioral changes are often thefirst indicators that some sort of stress is ongoing. Be aware ofany potential sources of stress and immediately eliminate or re-duce them whenever possible.
Stress factors can be classified into four loosely fitting categor-ies: human interference, water pollution, animal interactionsand extreme changes in the physical environment. Many of thestress factors mentioned below belong in more than one ofthese categories. Some examples of stress caused by human in-terference are: handling, toxins, photo shock, transport,electrical shock, crowding, malnutrition, noise or vibrations andnetting or removing the fish from water. Water pollution wouldinclude: high ammonia, nitrite, or nitrate levels, heavy metals,high organic or suspended solids levels and other chemical tox-ins. Stressors that fall into the animal interactions category are:aggression, pathogens such as parasites and injury, hunger ornutritional problems related to aggressive behaviors. Stressorsthat fit into the extreme changes in the physical environmentinclude: high carbon dioxide, low oxygen, improper hardness,turbidity, gas super-saturation, sudden changes in temperatureor salinity, excessive water velocity, photo shock and low pH.
NEXT INSTALLMENT
Part two of this two-part series will continue with an updatedmethod for acclimation, ideas for providing a nutritious diet,and other tips for avoiding pitfalls so you can keep your stock inthe best possible health.
REFERENCES
1. Wedemeyer, G.A. "Handling and Transportation of Sal-monids," Principals of Salmonid Aquaculture. Pennel, W. &Barton, B., eds., Elsevier Publishing, Netherlands, 1996.
Tips for Healthy Aquarium Inhabitants: Preventive Measures for Aquarists, Part One
Advanced Aquarist | www.advancedaquarist.com 49 January 2009 | Volume VIII, Issue I
S P O N S O R S
THANK YOU TO OUR SPONSORS!
We would like to thank the sponsors that make this publication possible! Through their generous sponsor-ship, they have made this website and online magazine available to all. Make sure that when you do businesswith our sponsors that you tell them that you saw their ad on Reefs.org or Advanced Aquarist.
© Pomacanthus Publications, LLCPublished January 2009, Advanced Aquarist's Online Magazine.
HELLOLIGHTS
H elloLights has been in business since 1997 providing the aquarium industry with high quality lighting products and accessor-ies. Throughout the years, our mission has been to be the aquarium hobbyist? one stop source for all of their lighting needs.With unsurpassed customer service and high quality products, we truly believe we are the clear choice for aquarium lighting. Werealize that lighting is one of the major purchases that the hobbyist will make when setting up an aquarium, and we take greatpride in our role in this process.
MARINE DEPOT
M arineDepot.com is the current leader in supplying marine and reef aquarium supplies. We simply try to make as many people(including both our staff and our customers) as happy as possible. We found that we have been able to accomplish this by main-taining extremely low prices, providing friendly customer service, and simply liking what we do.
PREMIUM AQUATICS
P remium Aquatics is a family owned and operated aquarium business. We have been in business since April 1996 and we arededicated to serving the aquarium hobbyist. Our mission is to bring you the highest quality aquarium products and livestockavailable and at a reasonable price and to provide honest non-bias information on all of our products and our competitors. Ourgoal is customer satisfaction, we want your return business.
TWO PART SOLUTION
T he Two Part Solution is a method of adding calcium, alkalinity and magnesium to your reef aquarium. What's unique aboutthis solution is many of the items used are household items or just bulk supplies of the very same products you are buying twocups of for $20 just because it has a fancy package. It has been time tested by thousands of aquarists and proven to not only beincredibly effective and easy to use but also extremely affordable. There is simply no other balanced calcium, alkalinity and mag-nesium solution out there that is so ridiculously cheap and has no expensive and intimidating equipment to buy.
Thank You to our Sponsors!
Advanced Aquarist | www.advancedaquarist.com 50 January 2009 | Volume VIII, Issue I
DELTEC USA
D eltec aquarium equipment is renowned throughout theworld for its high performance and superior quality. Deltechas been in the marine aquarium business for more than 20years in Europe, and developed the pinwheel more than 19years ago.
GLOBAL AQUARIUM SUPPLY
W e are your one stop source for all your Salt Water Aquari-um needs! We carry Aquariums, acrylic aquariums, HamiltonLighting, Metal Halide lighting, Power Compacts, ProteinSkimmers, ASM Skimmers, Euroreef skimmers, AquaC Skim-mers, Iwaki pumps, Eheim Pumps, Rio pumps, MagDrivepumps, SeaSwirl, AquaUltraviolet, UV Sterilizers, Salifert testkits, CPR Filters, Calcium reactors and more.
MARINE GARDEN
W e started almost a decade ago on a small place in southFlorida now, over the years Marine Garden not only havegrown but had developed new techniques on keeping coralsand Fishes as healthiest as if they were on the Ocean. Most ofour corals are 100% captive grown by ourselves or other Pro-fessional hobbyists. By purchasing aqua cultured corals, sincethey use to be in captivity you are getting not only the bestquality but also a stronger and harder specimen. Also, you willbe helping to minimize the problem of the declining coralreefs in our oceans
REEF NUTRITION
R eef Nutrition Marine Live Feeds are produced by ReedMariculture, the world's largest producer of marine microal-gae concentrates. We supply algal feeds and zooplankton touniversities, marine ornamental growers, and over 500 fish,shrimp, and shellfish hatcheries in 70+ countries around theworld.
SOUTHERN CALIFORNIA CAULERPA ACTION
TEAM
A n important goal of the Southern California Caulerpa Ac-tion Team is the detection of undiscovered infestations of C.taxifolia or other invasive species of Caulerpa, and the preven-tion of their spread.
SUNLIGHT SUPPLY, INC.
S unlight Supply Inc. is a manufacturer and importer of HighIntensity Discharge (H.I.D.) and fluorescent lighting fixtures.We specialize in fixtures with applications in the hobby & com-mercial horticulture and reef tank aquarium industries.Sunlight Supply Inc. is a recognized and respected leadingbrand in the marketplace.
THAT FISH PLACE
W e are the original Aquatic and Pet Supply Superstore!Every year, tens of thousands of visitors come from all overthe US and Canada to explore our 110,000 square foot retailstore. Bring your pet along and check out our incomparablefish room with over 800 aquariums!
Thank You to our Sponsors!
Advanced Aquarist | www.advancedaquarist.com 51 January 2009 | Volume VIII, Issue I
AQUAFX
T he Leaders in Aquarium Water Treatment and Purification.
AQUARIUMPART.COM
A quariumPart.com is an online retailer of many hard to findparts for various aquarium lights, pumps, protein skimmers,meters, UV sterilizers and filters.
CHAMPION LIGHTING & SUPPLY
U SA's largest distributor of exclusively Saltwater products.
ECOSYSTEM AQUARIUM
T hrough extensive experiments since 1987, EcoSystemAquarium proudly brings only time tested and provenproducts to the Aquatic Industry.
E.S.V. COMPANY, INC.
S pecialty Chemicals and Products for the AdvancedAquarist.
JELLIQUARIUM
S pecializes in custom made aquariums for jellyfish.
MICROCOSM
M icrocosm™ Aquarium Explorer is the creation of an inter-national team of leading aquarium authors, marine biologists,underwater photographers, and tropical naturalists.
PHISHY BUSINESS
P hishy Business is a reef livestock mail order company dedic-ated to captive propagation of soft and SPS corals.
RED SEA
A leader in the development and introduction of new and in-novative technologies and products for the serious aquariumhobbyist.
SALTY CRITTER
Y our source for saltwater and reef aquarium supplies andequipment here online, or come visit us at our full servicewalk-in retail location.
TROPICAL FISH AUCTION
B uy and sell aquarium fish, invertebrates, coral, aquariumsupplies, and more!
TWO LITTLE FISHES
P roducts and Information for Reef Aquariums and WaterGardens.
Thank You to our Sponsors!
Advanced Aquarist | www.advancedaquarist.com 52 January 2009 | Volume VIII, Issue I

BACK COVER


![Cse Viii Advanced Computer Architectures [06cs81] Notes](https://img.pdfslide.us/doc/110x75/55cf8557550346484b8cf5b6/cse-viii-advanced-computer-architectures-06cs81-notes.jpg)