Embed Size (px)
Citation preview
January 2008, Washington
The CityMobil programme:The CityMobil programme:an overviewan overview
Professor Tony MayUniversity of Leeds, England
January 2008, Washington
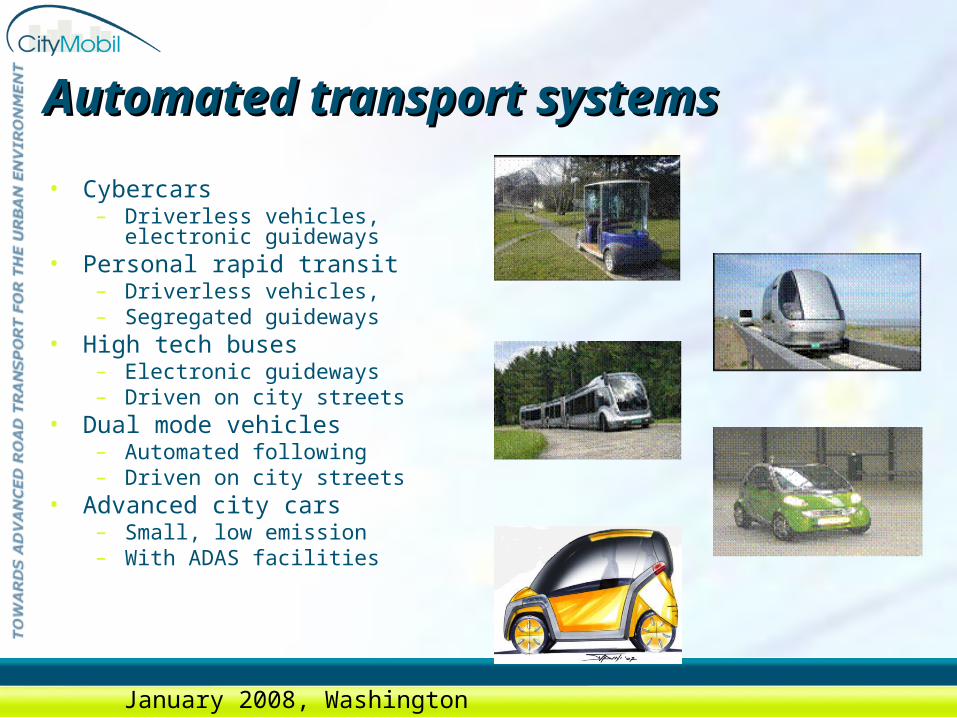
Automated transport systemsAutomated transport systems
• Cybercars– Driverless vehicles, electronic
guideways• Personal rapid transit
– Driverless vehicles,– Segregated guideways
• High tech buses– Electronic guideways– Driven on city streets
• Dual mode vehicles– Automated following– Driven on city streets
• Advanced city cars– Small, low emission– With ADAS facilities
January 2008, Washington
The CityMobil projectThe CityMobil project
• An Integrated Project within the EC FP6 programme
• Funded by EC DG Research• €11m funding; 40% on demonstrators, 60%
research• Led by TNO (Netherlands)
– With 28 partners from 12 countries• Five years from May 2006• www.citymobil-project.eu
January 2008, Washington
CityMobil: ObjectivesCityMobil: Objectives
• To achieve more effective organisation of urban transport– With more rational use of motorised traffic– Less congestion, pollution, accidents– Higher quality of life– Better integration with spatial development
• Through the application of new technologies – For passengers and freight
• Drawing on past European research– On new technologies: Netmobil (www.netmobil.org)– On land use and transport strategies: LUTR
(www.lutr.net)
January 2008, Washington

CityMobil: Project structureCityMobil: Project structure
January 2008, Washington
Demonstrations and Demonstrations and city studiescity studies
– Three major demonstrators• Cybercars: Rome• PRT: Heathrow• High Tech Buses: Castellon (Spain)
– A series of showcases• Two week demonstrations to increase public understanding• Daventry (UK), Trondheim (No): Cybercars• La Rochelle (Fr), Genoa (It): Advanced City Cars
– Predictive studies of four cities– Desk studies of two or three more cities– A Reference Group of 22 cities across Europe
January 2008, Washington
TheThe Rome Rome demonstratordemonstrator
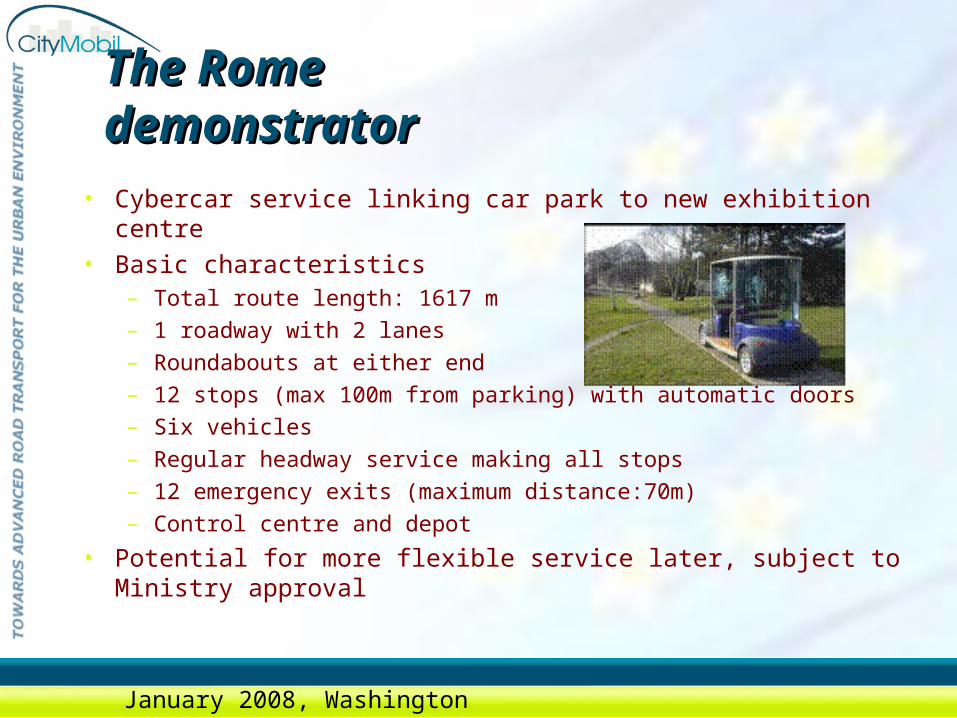
• Cybercar service linking car park to new exhibition centre• Basic characteristics
– Total route length: 1617 m– 1 roadway with 2 lanes– Roundabouts at either end– 12 stops (max 100m from parking) with automatic doors– Six vehicles– Regular headway service making all stops– 12 emergency exits (maximum distance:70m)– Control centre and depot
• Potential for more flexible service later, subject to Ministry approval
January 2008, Washington
20.2020.2020.20
3.00
3.00
3.00
1.50
1.50
1.50
1.50
1.50
1.50
5.00
5.00
5.00
6.00
6.00
6.00
5.00
5.00
5.00
1.50
1.50
1.50
5.00
5.00
5.00
6.006.006.00
3.053.053.05
6.006.006.00
3.00
3.00
3.00
5.00
5.00
5.00
3 OUT3 OUT3 OUT
6.006.006.00
5.005.005.00
8.00
8.00
8.00
4.004.004.00
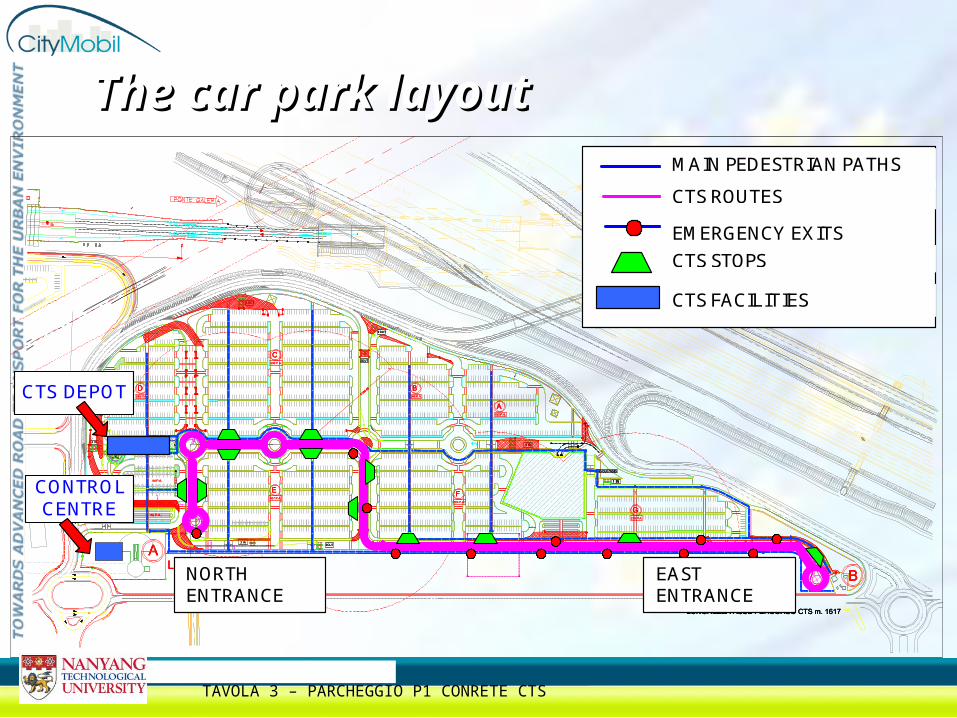
NORTH ENTRANCE
EAST ENTRANCE
CTS DEPOT
MAIN PEDESTRIAN PATHS
CTS ROUTES
EMERGENCY EXITS
CTS STOPS
CTS FACILITIES
CONTROLCENTRE
The car park layoutThe car park layout
TAVOLA 3 – PARCHEGGIO P1 CONRETE CTS
The Heathrow demonstratorThe Heathrow demonstrator
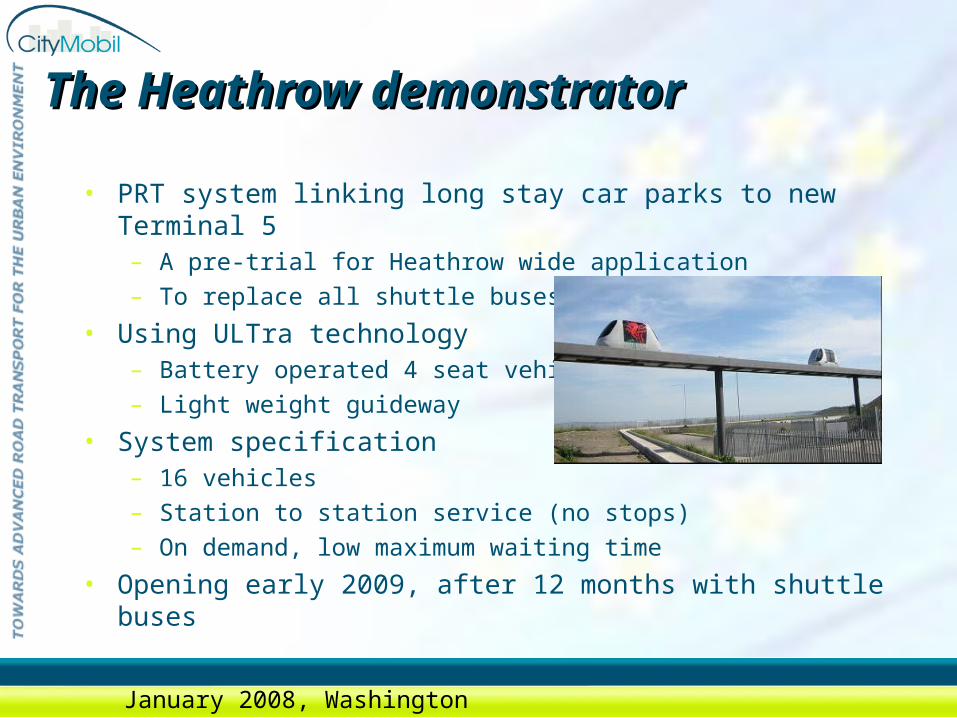
• PRT system linking long stay car parks to new Terminal 5– A pre-trial for Heathrow wide application– To replace all shuttle buses
• Using ULTra technology– Battery operated 4 seat vehicles– Light weight guideway
• System specification– 16 vehicles– Station to station service (no stops)– On demand, low maximum waiting time
• Opening early 2009, after 12 months with shuttle buses
January 2008, Washington

The Heathrow networkThe Heathrow network
January 2008, Washington
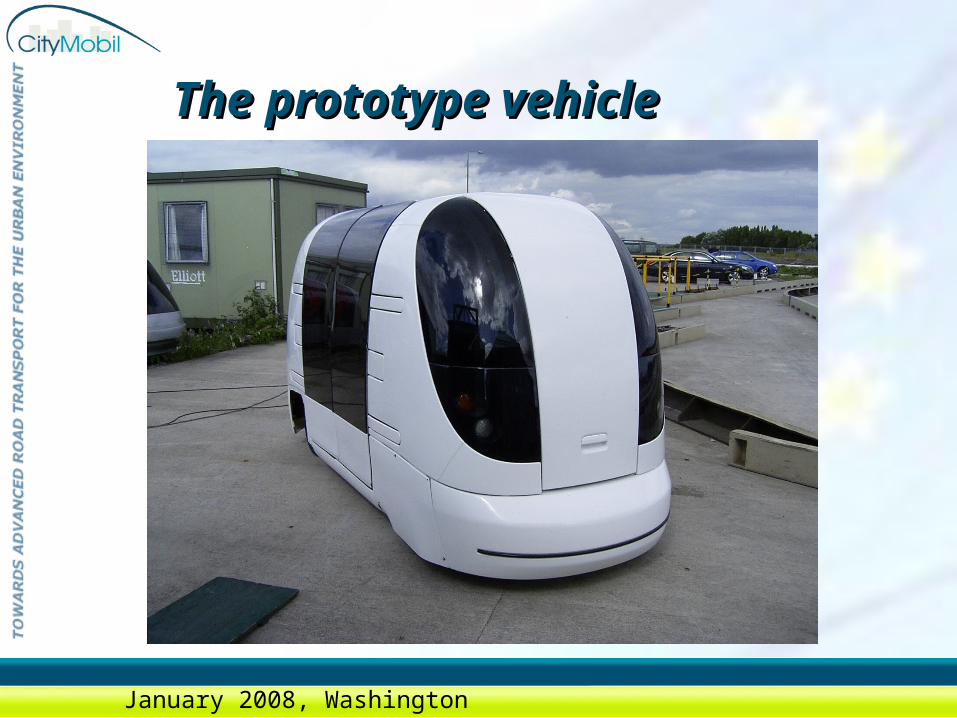
The prototype vehicleThe prototype vehicle
January 2008, Washington

The prototype vehicleThe prototype vehicle
January 2008, Washington
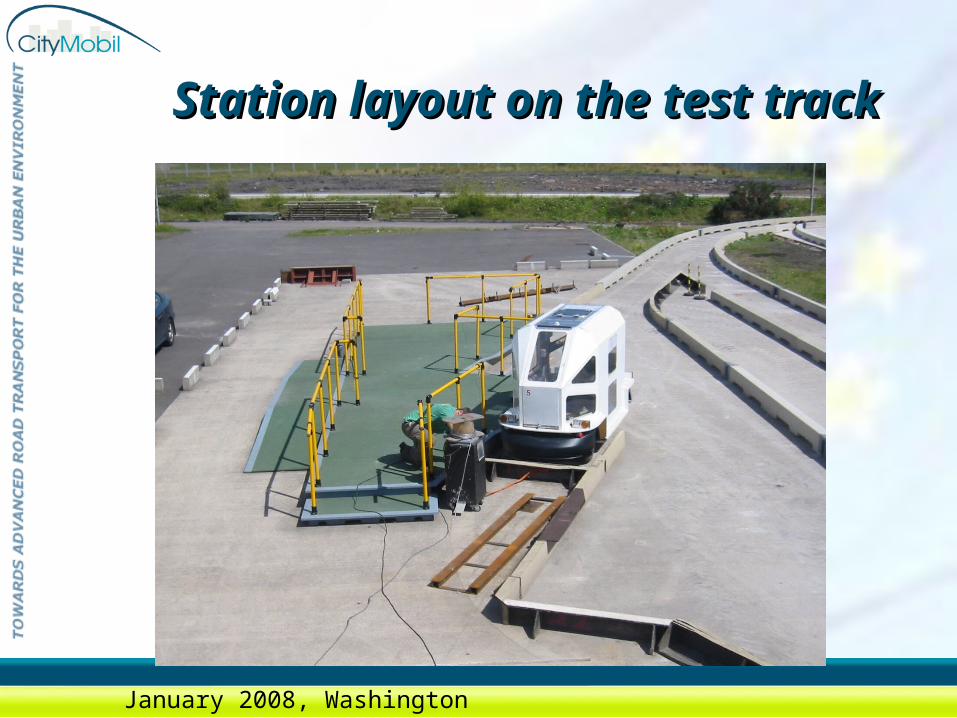
Station layout on the test Station layout on the test tracktrack
January 2008, Washington
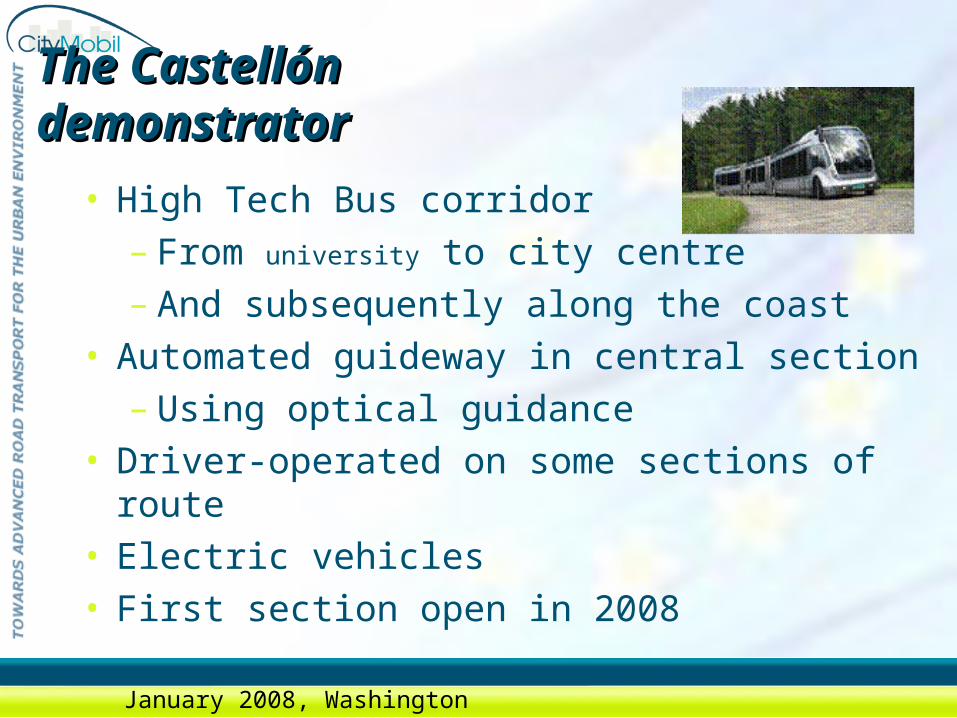
The CastellThe Castellóón n demonstratordemonstrator
• High Tech Bus corridor– From university to city centre– And subsequently along the coast
• Automated guideway in central section– Using optical guidance
• Driver-operated on some sections of route• Electric vehicles• First section open in 2008
January 2008, Washington
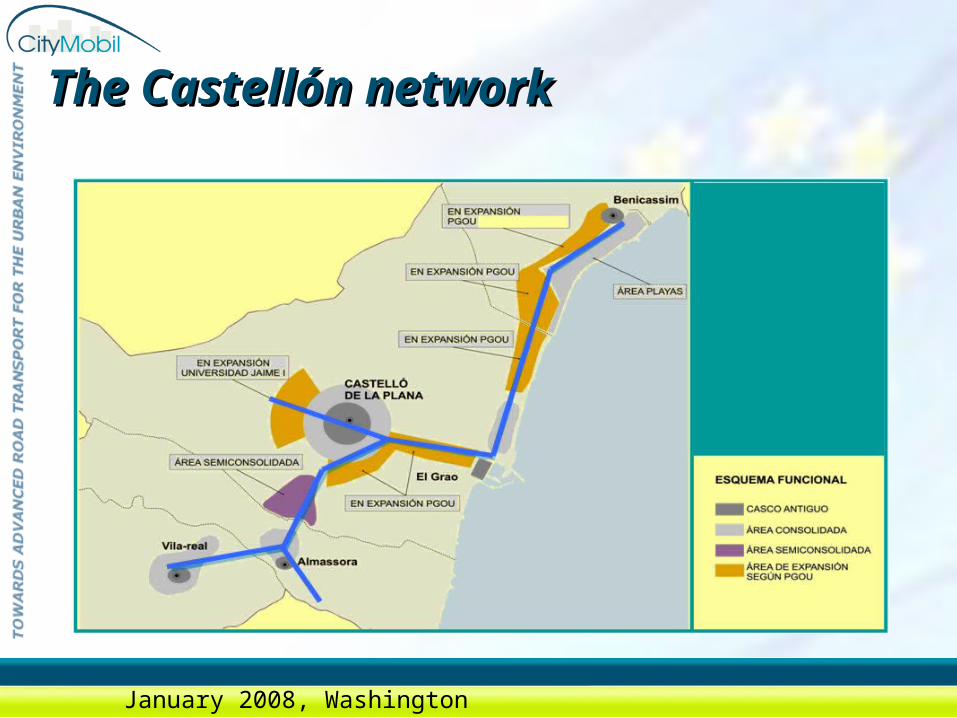
The Castellón networkThe Castellón network
January 2008, Washington

The Castellon vehiclesThe Castellon vehicles
January 2008, Washington
The Daventry showcaseThe Daventry showcase
January 2008, Washington

Future scenarios: objectives Future scenarios: objectives and work packagesand work packages
• Principal objective:– Assessing how automated transport systems
• Fit into scenarios for urban transport• Contribute to sustainability
• Work Packages1.State of the Art Report 2.Context and application scenarios3.Predictive models and case studies4.Business case models5.Guidelines for safety, security and privacy
January 2008, Washington
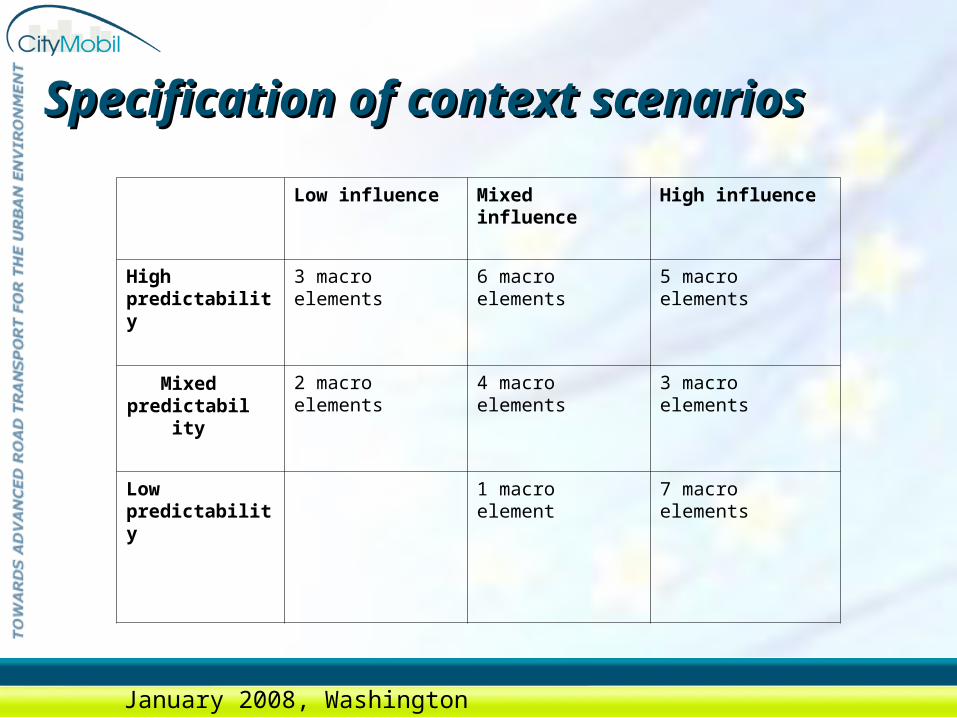
Specification of context Specification of context scenariosscenarios
Mixed predictability
Low influence Mixed influence High influence
High predictability
3 macro elements 6 macro elements 5 macro elements
2 macro elements 4 macro elements 3 macro elements
Low predictability
1 macro element 7 macro elements
January 2008, Washington
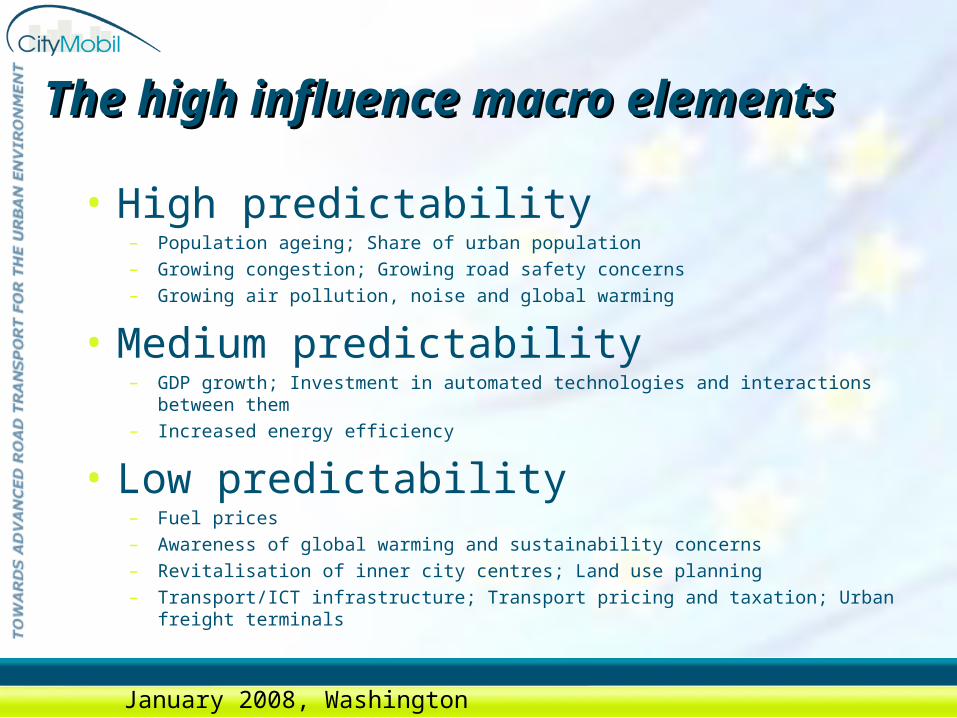
The high influence macro The high influence macro elementselements
• High predictability– Population ageing; Share of urban population– Growing congestion; Growing road safety concerns– Growing air pollution, noise and global warming
• Medium predictability– GDP growth; Investment in automated technologies and interactions between
them– Increased energy efficiency
• Low predictability– Fuel prices– Awareness of global warming and sustainability concerns– Revitalisation of inner city centres; Land use planning– Transport/ICT infrastructure; Transport pricing and taxation; Urban freight
terminals
January 2008, Washington
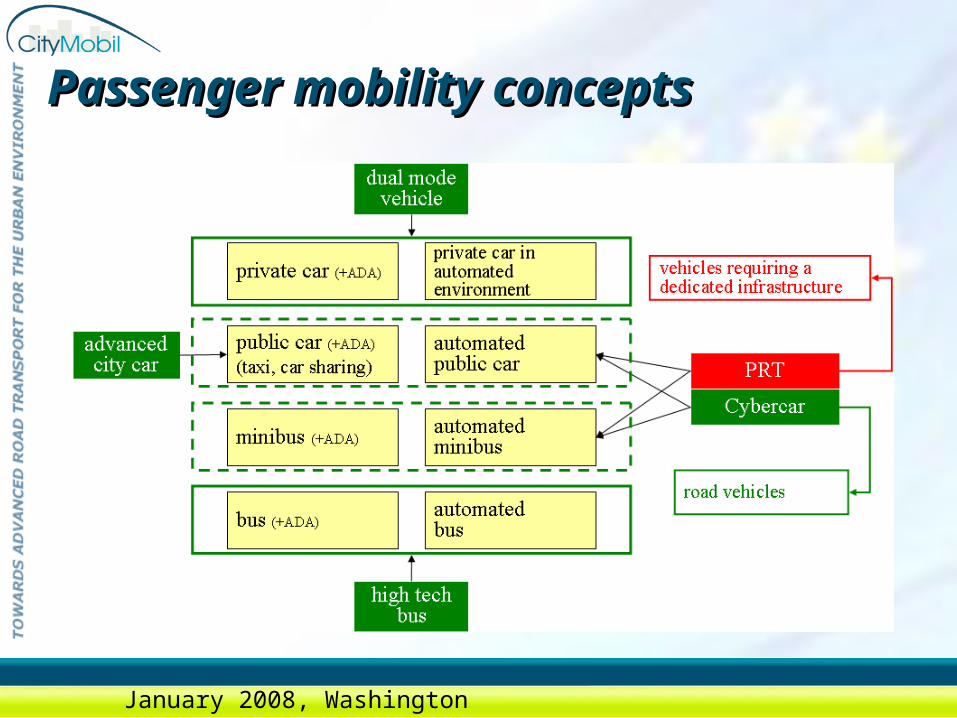
Passenger mobility conceptsPassenger mobility concepts
January 2008, Washington
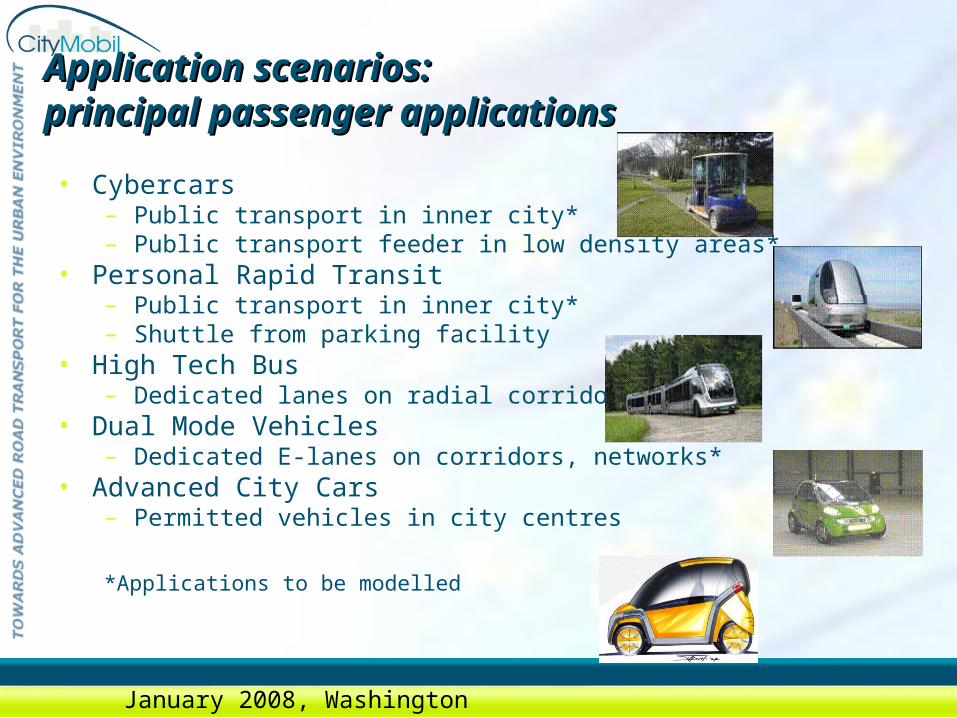
Application scenarios:Application scenarios:principal passenger applicationsprincipal passenger applications
• Cybercars– Public transport in inner city*– Public transport feeder in low density areas*
• Personal Rapid Transit– Public transport in inner city*– Shuttle from parking facility
• High Tech Bus– Dedicated lanes on radial corridors*
• Dual Mode Vehicles– Dedicated E-lanes on corridors, networks*
• Advanced City Cars– Permitted vehicles in city centres
*Applications to be modelled
January 2008, Washington
The City Application The City Application ManualManual• Designed to guide cities considering new technologies• Potentially based on Decision-Makers’ Guidebook• Possible outline:
– Scenarios– Identifying suitable options– Estimating patronage– Illustrative predictive results– High level appraisal – Illustrative appraisal results– Barriers and ways of overcoming them– Guidance on detailed design – Possible micro-simulation examples
• Planned for late 2008
January 2008, Washington

The role of the predictive The role of the predictive teststests
• To assess the likely contribution to urban transport policy objectives of each of the four technologies– If applied at a significant scale – In representative European cities
• To contribute to an ex ante evaluation of these technologies • To complement ex post evaluations of specific applications
– Cybercars in the new Rome exhibition centre– PRT in London Heathrow– High tech buses on a corridor in Castellon, Spain– A series of smaller showcase applications
January 2008, Washington
The focus of the predictive testsThe focus of the predictive tests
• Four cities– Selected to be reasonably representative of different city types
in Europe– With commonly specified policy tests and appraisal in all four
to permit comparison of the potential for each technology in each city
– But with additional tests of city-specific options and appraisal weightings
• The four cities– Almere (NL) (250k): a new city expanding to 400k– Gateshead (UK) (300k): part of a 1,100k polycentric
conurbation– Trondheim (NO) (200k): a smaller monocentric city– Vienna (AT) (1,600k): a major monocentric city
January 2008, Washington
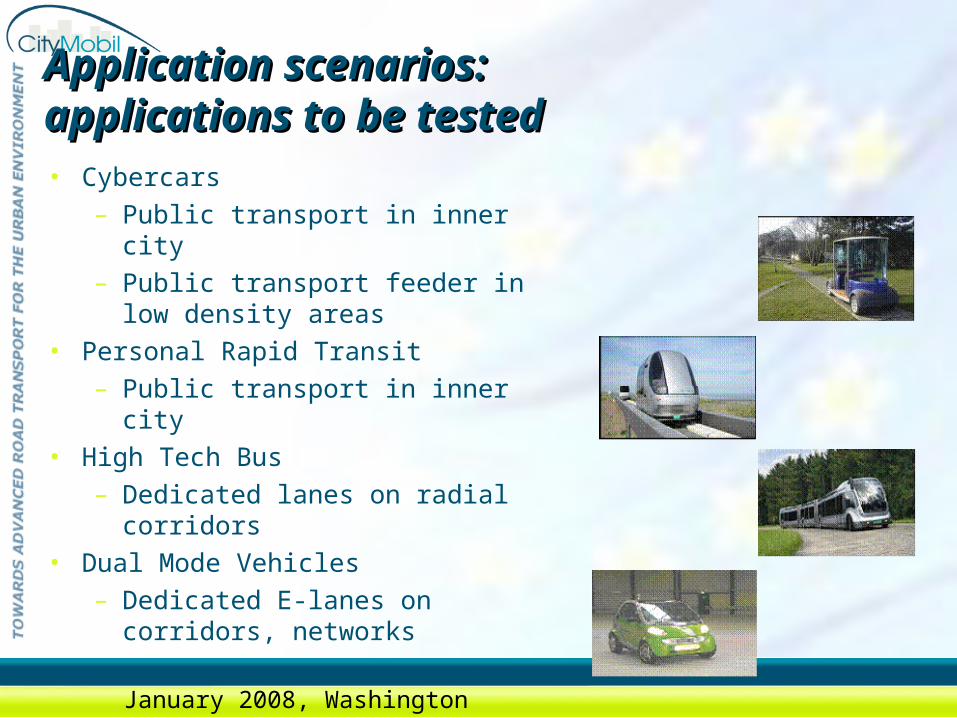
Application scenarios:Application scenarios:applications to be testedapplications to be tested• Cybercars
– Public transport in inner city– Public transport feeder in low
density areas• Personal Rapid Transit
– Public transport in inner city• High Tech Bus
– Dedicated lanes on radial corridors
• Dual Mode Vehicles– Dedicated E-lanes on corridors,
networks
January 2008, Washington
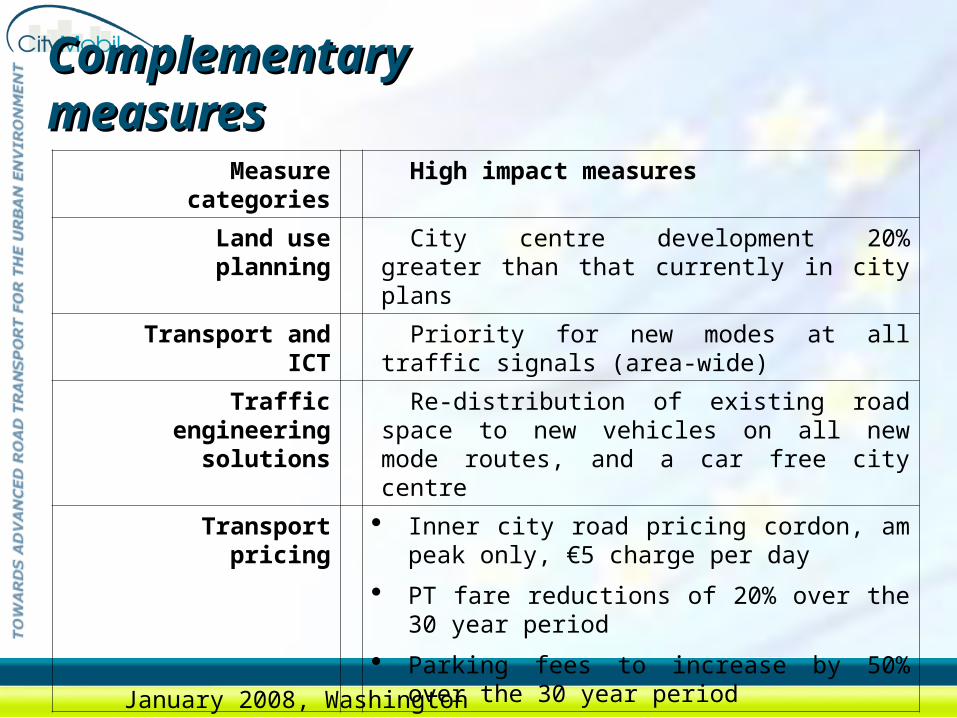
Complementary Complementary measuresmeasures
Measure categories High impact measures
Land use planning City centre development 20% greater than that currently in city plans
Transport and ICT Priority for new modes at all traffic signals (area-wide)
Traffic engineering solutions
Re-distribution of existing road space to new vehicles on all new mode routes, and a car free city centre
Transport pricing Inner city road pricing cordon, am peak only, €5 charge per day
PT fare reductions of 20% over the 30 year period
Parking fees to increase by 50% over the 30 year period
January 2008, Washington

The planned sequence of testsThe planned sequence of tests
• All conducted for four cities • For the period 2005-2035• For medium and high growth scenarios
– Do nothing (specified by each city)– Each of five application scenarios, defined to be
as consistent as possible across the four cities• Alone• With an agreed set of complementary
measures• City-specific applications as resources permit
• 22+ tests for each city = 88 tests to be compared
January 2008, Washington

The planned tests for each cityThe planned tests for each city
Exogenous trend applications
Medium growth High growth
Do nothing M0 H0
New technologies With
complementary
policies
No
complementary policies
With
complementary
policies
No
complementary policies
Cybercar (inner city) MW1 M1 HW1 H1
Cybercar (PT feeder) MW2 M2 HW2 H2
PRT MW3 M3 HW3 H3
High tech bus MW4 M4 HW4 H4
DMV (city wide) MW5 M5 HW5 H5
January 2008, Washington
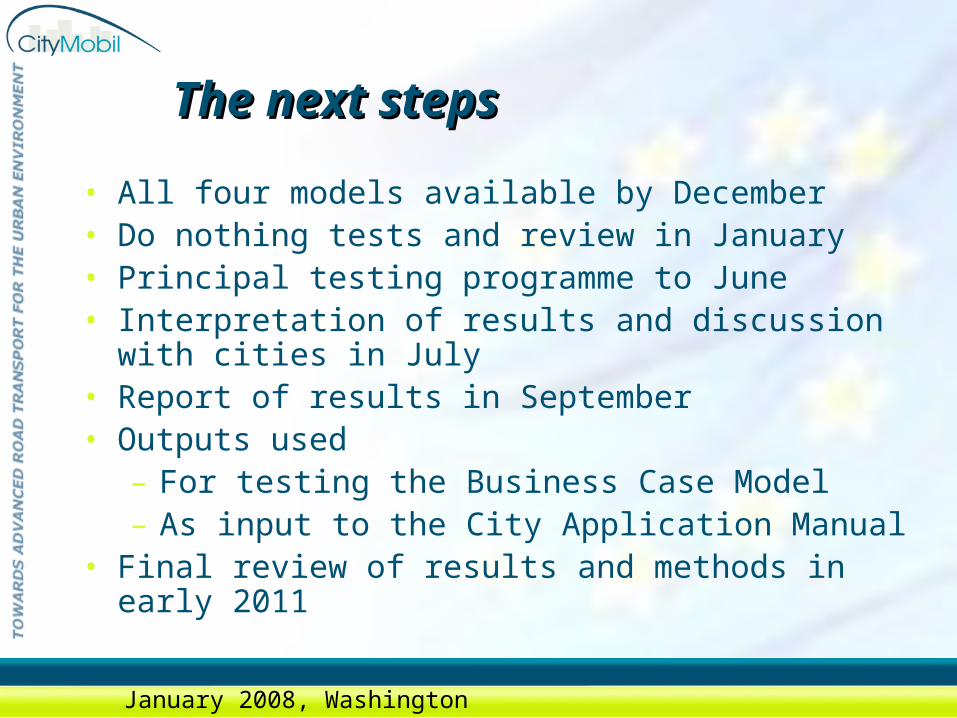
The next stepsThe next steps
• All four models available by December• Do nothing tests and review in January• Principal testing programme to June• Interpretation of results and discussion with cities
in July• Report of results in September• Outputs used
– For testing the Business Case Model– As input to the City Application Manual
• Final review of results and methods in early 2011
January 2008, Washington