Embed Size (px)
Citation preview
LAO65 YEARS OF SERVICE Elizabeth G. Hill Legislative Analyst’s Office
California’sCriminal JusticeSystem A Primer
January 2007
Contents
Introduction ...........................................................................3
An Overview of California’s Criminal Justice System ............7
The State of Crime in California ..........................................16
Adult Criminal Justice System ..............................................28
Juvenile Justice System ........................................................49
The Costs of Crime and the Criminal Justice System ...........62
Conclusion ...........................................................................71
Acknowledgments
Steenhausen, and reviewed by Dan Carson and Greg Jolivette. The Legislative Analyst’s Office (LAO) is a nonpartisan office which provides fiscal and policy information and advice to the California Legislature.
To request publications call (916) 445-4656.
This report and others, as well as an E-mail subscription service, are available on the LAO’s Internet site at www.lao.ca.gov. The LAO is located at 925 L Street, Suite 1000, Sacramento, CA 95814.
This report was prepared by Brian Brown, Edgar Cabral, and Paul

Chapter 1:
IntroductionIn recent years, the Legislature and Governor have con‑
sidered and enacted numerous laws to respond to the public’s concerns with crime and the criminal justice system in Cali‑fornia. The measures included stiffening penalties for exist‑ing criminal offenses, providing treatment for drug offenders, defining new criminal offenses, constructing new correction‑al facilities, providing financial assistance to law enforcement, and reorganizing the state corrections system.
In an effort to put the current discussion of crime in Cali‑fornia in perspective, we have prepared this report to answer several key questions, including:
• How much crime is there in California? How has the level of crime changed over time? How does crime vary within California, and among the states?
• Who are the victims and perpetrators of crime?
• How does the California criminal justice system—local law enforcement, courts, and correctional agencies—deal with adult and juvenile offenders?
• What are the characteristics of adult and juveniles under the supervision of local and state correctional agencies?
• What are the costs of crime and the criminal justice system?
• What are the key criminal justice issues for policymak‑ers today?

California’s Criminal Justice System: A Primer
�
Although this report is not designed to present compre‑hensive answers to all of these questions, it does provide ba‑sic information on these issues. It does this through a “quick reference” document that relies heavily on charts to present the information. This report relies on the most recent data available from several federal and state agencies, including the U.S. Department of Justice (U.S. DOJ), the Federal Bureau of Investigation (FBI), the California Department of Correc‑tions and Rehabilitation (CDCR), and the Criminal Justice Statistics Center in the California Department of Justice (state DOJ). Below we describe the main components of this report.
Overview of the Criminal Justice System. Chapter 2 provides a description of how the criminal justice system is structured in California, including the various roles of the federal, state, and local governments. In addition, we identify the major features of criminal sentencing law and the most significant criminal laws enacted in recent years.
The State of Crime in California. Chapter 3 provides a mixed picture of the current state of crime in California. The crime rate in California declined substantially throughout most of the 1990s, but has increased somewhat in more recent years. Violent crime in California, however, has continued to decline even in more recent years, but is still significantly higher than the national average.
Adult Criminal Justice System. Despite the decline in crime rates over recent decades, the state has experienced a significant increase in incarceration with approximately 250,000 adult inmates in jail and prison today, as well as another 450,000 adults supervised on probation or parole. Chapter 4 describes what happens to adult offenders in the criminal justice system, including a discussion of trends in criminal arrests, disposition of court cases, and incarceration.
We also discuss two important topics in today’s adult justice system: (1) the discretion that police, prosecutors, and judges have in its operation, and (2) federal court involve‑
Legislative Analyst’s Office
�
ment in the provision of prison inmate health care. (See our November 2006 report, California’s Fiscal Outlook [page 43], for our projections of the fiscal effect of three federal court cases concerning the state’s inmate health care system. Future publications by our office will provide more detailed analysis of this important issue.)
Juvenile Justice System. In many ways, juvenile crime trends are similar to those for adults. For example, the major‑ity of arrests for both groups are for misdemeanor offenses rather than felonies, and felony arrest rates for both adults and juveniles have declined in recent years. Chapter 5 de‑scribes the juvenile justice system, including arrest trends, disposition of court cases, and incarceration. We also discuss the rehabilitation mission of the juvenile justice system at both the local and state levels.
Costs of Crime and the Criminal Justice System. Chap‑ter 6 documents how spending on the criminal justice sys‑tem in California has grown steadily over the past decade, reaching $25 billion in 2003‑04. Most of this spending is done by local governments, including $11 billion for police and sheriffs. The fastest‑growing segment of the state’s criminal justice system is state corrections, with these costs growing at an average annual rate of about 10 percent during the past ten years. These costs have been driven in large part by increases in employee salaries, court‑ordered mandates (such as for the provision of health care services), as well as inmate popula‑tion growth.
Conclusion. In Chapter 7, we identify two major state criminal justice system challenges facing policymakers. The first challenge is managing prison capacity in light of pro‑jected growth in the state’s prison population. The amount of growth projected suggests that California’s incarceration capacity, which is already strained, may be unable to ade‑quately meet the future demand, and policymakers will have to carefully weigh options to balance population demands and the available capacity to meet those demands.

California’s Criminal Justice System: A Primer
�
The second challenge regards correctional rehabilitation programs. While the Legislature and Governor have in‑creased funding for programs such as education and sub‑stance abuse treatment for state inmates and parolees, this funding still only represents a very small share of the prison system budget, resulting in low participation rates for these programs. Given the number of inmates who are paroled to the community and then subsequently return to prison, it is important for policymakers to further consider the role that rehabilitation programs can play in reducing the state’s high recidivism rates.

Chapter 2:
An Overview of California’s Criminal Justice System
The criminal justice system operates at multiple levels of government: the local, state, and federal levels. Because the vast majority of criminal activity is handled by state and lo‑cal authorities, we focus in this report on the role of the state and local governments in California’s criminal justice system. The primary goal of the system is to provide public safety by deterring and preventing crime, incarcerating individuals who commit crime, and reintegrating criminals back into the community.
Criminal Sentencing LawThe criminal justice system is based on criminal sentenc‑
ing law, the body of laws that define crimes and specify the punishments for such crimes. The majority of sentencing law is set at the state level.
Types of Crimes. Crimes are classified by the seriousness of the offenses as follows:
• A felony is the most serious type of crime, for which an offender may be sentenced to state prison for a minimum of one year. California Penal Code also classifies certain felonies as “violent” or “serious.” Violent felonies include murder, robbery, and rape. Serious felonies include all violent felonies, as well as other crimes such as burglary of a residence and assault with intent to commit robbery.

California’s Criminal Justice System: A Primer
�
• A misdemeanor is a less serious offense, for which the offender may be sentenced to probation, county jail, a fine, or some combination of the three. Misdemeanors include crimes such as assault, petty theft, and public drunkenness. Misdemeanors represent the majority of offenses in California’s criminal justice system.
• An infraction is the least serious offense and is gener‑ally punishable by a fine. Many motor vehicle viola‑tions are considered infractions.
California law also gives law enforcement and prosecu‑tors the discretion to charge certain crimes as either a felony or a misdemeanor. These crimes are known as “wobblers.”
Determinate Sentencing. Prior to 1977, convicted fel‑ons received indeterminate sentences in which the term of imprisonment included a minimum with no prescribed maximum. For example, an individual might receive a “five‑years‑to‑life” sentence. After serving five years in prison, the individual would remain incarcerated until the state parole board determined that the individual was ready to return to the community and was a low risk to commit crimes in the future.
In 1976, the Legislature and the Governor enacted a new sentencing structure for felonies, called determinate sen‑tencing, which took effect the following year. Under this structure, most felony punishments have a defined release date based on the “triad” sentencing structure. The triad sentencing structure provides the court with three sentencing options for each crime. For example, a first‑degree burglary offense is punishable by a term in prison of two, four, or six years. The middle term is the presumptive term to be given to an offender found guilty of the crime. The upper and lower terms provided in statute can be given if circumstances concerning the crime or offender warrant more or less time in state prison. We would note that, in January 2007, the U.S. Supreme Court (Cunningham v. California) restricted a judges

Legislative Analyst’s Office
�
ability to assign the upper term. In some cases, offenders are still punished by indeterminate sentences today. Specifically, indeterminate sentences are provided for some of the most serious crimes, such as first‑degree murder, as well as for some repeat offenders. In fact, about 19 percent of state prison inmates are currently serving indeterminate life sentences.
Components of the Criminal Justice SystemThe criminal justice system can be thought of as having
three components: law enforcement, courts, and corrections. Figure 1 (see next page) shows the different actors in Califor‑nia’s criminal justice system, including information on their level of government and responsibilities. We discuss these components in more detail below.
Law Enforcement. State sentencing laws are primarily enforced at the local level by the sheriff and police officers who investigate crimes and apprehend offenders. Law en‑forcement is a local responsibility in California, with funding typically provided by cities and counties. At the state level, the Attorney General provides some assistance and expertise to local law enforcement in the investigation of crimes that are multi‑jurisdictional (occur in multiple counties) such as organized crime. The state also provides grants to local law enforcement for various crime‑fighting activities.
Courts. Once an individual is arrested and charged with committing a crime, he or she must go through California’s trial court system. Local district attorneys, employed by the county, charge them with a specific crime and prosecute them. If the individual cannot afford an attorney, he or she is represented by a public defender, also provided by the county. Superior Court judges preside over cases that come through the system. Judge salaries, as well as all other fund‑ing for the operation of the state’s trial courts, are a respon‑sibility of the state. The system is designed in a way that it provides flexibility for district attorneys and judges to decide

California’s Criminal Justice System: A Primer
10
Figure 1
Roles Within California’s Criminal Justice System
Who Are Subject tothe Control of…
These CriminalJustice Officials…
Must Often DecideWhether or Not or How to…
Police/Sheriffs Cities/Counties • Enforce laws• Investigate crimes• Search people, premises• Arrest or detain people• Supervise offenders in local correctional
facilities(primarily county sheriffs)
• File charges• Prosecute the accused
District Attorneys(prosecutors)
Counties
• Reduce, modify, or drop charges
Judges State • Set bail or conditions for release• Accept pleas• Determine delinquency for juveniles• Dismiss charges• Impose sentences• Revoke probation
Probation Officials Counties or • Recommend sentences to judgesJudges • Supervise offenders released on probation
• Supervise offenders (especially juveniles) inprobation camps and ranches
• Recommend probation revocation to judges
CorrectionalOfficials
State • Assign offenders to type of correctional facility
• Supervise prisoners• Award privileges, punish for disciplinary
infractions
Parole Officials State • Determine conditions of parole• Supervise parolees released to the community• Revoke parole and return offenders to prison

Legislative Analyst’s Office
11
how to prosecute specific cases and manage overall caseload. (See page 45 for a more detailed discussion of this topic.)
Corrections. The component of the system that super‑vises offenders is commonly referred to as “corrections” or the “correctional system.” In California, individuals convicted of, or adjudicated for crimes are placed under supervision either at the local level (jail and probation) or the state level (prison and parole) depending on the seriousness of the crime and the length of incarceration. Generally speaking, low‑level offenders are supervised at the local level, while more serious offenders who are sentenced to more than a year of incarceration are su‑pervised at the state level. By law, individuals who serve prison sentences are required to be on parole, typically for a mini‑mum of three years. Although those who serve jail sentences are not required by law to be on probation, the vast majority are in fact placed on probation after their release from jail.
What Is the Difference Between the State and Federal Criminal Justice Systems?
The state criminal justice system (including both state and local agencies) and the federal criminal justice system have much in common. For example, both systems have statutory criminal law, law enforcement agents, courts, and prisons. Procedurally, the systems are also similar, for example, offer‑ing the same protections to criminal defendants, such as the right to jury trial.
The key difference between the two systems relates to the criminal law statutes. Federal criminal law is limited to the powers of the federal government enumerated in the United States Constitution. Therefore, most federal criminal laws relate to the national government’s role in the regula‑tion of interstate commerce, immigration, and the protection of federal facilities and personnel. Consequently, federal law enforcement tends to focus on nonviolent crimes such as drug trafficking, immigration violations, fraud, bribery, and extortion.

California’s Criminal Justice System: A Primer
12
By comparison, state crimi‑nal law is based on the general po‑lice powers of the state and is there‑fore broader in scope. For example, as shown in Figure 2, more than one‑half of the federal prison population is made up of drug offenders, while only 21 percent of state prison inmates were imprisoned for a drug offense. However, there is some crossover, such that some crimes—for example, weapons offenses and robbery—that are prosecutable under state law may also be prosecuted under federal law. Nevertheless, most crimes are prosecuted under state law.
What Are Some Significant Changes in Criminal Law?
The underlying structure of California sentencing law has remained unchanged since the transition to determinate sentencing in 1976. However, concern about certain types of crimes, offenders, and law enforcement capabilities has led the Legislature and voters to make some significant changes to specific areas of law. We highlight below those changes to criminal law (since 1990) that have affected large numbers of offenders.
Figure 2
Federal and State Inmate Population
2005
Prison Inmates
California Federal
Offense TypeViolent 50% 10%Property 22 8Drug 21 53Immigration — 11Other 8 17
Details may not total due to rounding.
Totals 168,055 187,241
Legislative Analyst’s Office
13
Proposition 115: Speedy Trial Initiative. Approved by the voters in 1990, this measure made significant changes to criminal law and judicial procedures in criminal cases. The measure provided the accused with the right to due process of law and a speedy public trial and required felony trials to be set within 60 days of a defendant’s arraignment. Other provisions expanded the definition of first‑degree murder and the list of “special circumstances” that could lead to a longer sentence; changed the way juries are selected for crim‑inal trials; changed the rules under which prosecutors and defense attorneys had to reveal information to each other; and, under certain circumstances, allowed the use of hearsay evidence at preliminary hearings, which are conducted to de‑termine if the evidence against a person charged with a crime is sufficient to bind them over for trial.
“Three Strikes and You’re Out.” In 1994, the Legislature and voters approved the Three Strikes and You’re Out law (the legislative version is Chapter 12, Statutes of 1994 [AB 971, Bill Jones]). The most significant aspect of the new law was to require longer prison sentences for certain repeat offenders. Individuals who have one previous serious or violent felony conviction and are convicted of any new felony (it need not be serious or violent) generally receive a prison sentence that is twice the term otherwise required for the new convic‑tion. These individuals are referred to as “second strikers.” Individuals who have two previous serious or violent felony convictions and are convicted of any new felony are generally sentenced to life imprisonment with a minimum term of 25 years (“third strikers”). In addition, the law also restricted the opportunity to earn credits that reduce time in prison and eliminated alternatives to prison incarceration for those who have committed serious or violent felonies.
Proposition 21: Juvenile Crime. Proposition 21, ap‑proved by the voters in 2000, expanded the types of cases for which juveniles can be tried in adult court. The measure also increased penalties for gang‑related crimes and required con‑victed gang members to register with local law enforcement.

California’s Criminal Justice System: A Primer
1�
Proposition 36: Drug Prevention and Treatment. Also approved by the voters in 2000, Proposition 36 provided for the sentencing of individuals convicted of a nonviolent drug possession offense to probation rather than prison or jail. As a condition of probation, the offender is required to complete a drug treatment program. The measure excluded certain offenders from these provisions, including those who refuse drug treatment or are also convicted at the same time for a felony or misdemeanor crime unrelated to drug use.
Megan’s Law Database. As a result of legislation enacted in the 1950s, the state requires sex offenders to register with local law enforcement agencies at least once annually, and ad‑ditionally within 14 days of moving to a new address. Various pieces of legislation enacted in the 1990s required law en‑forcement to provide public access to the state DOJ database, commonly referred to as the Megan’s Law database, contain‑ing information on the residences of sex offenders. Initially, this information was available via a state‑operated “900” tele‑phone line and a CD‑ROM disc available at local law enforce‑ment agencies. In 2004, the Legislature enacted Chapter 745, Statutes of 2004 (AB 488, Parra), which made the Megan’s Law database available electronically via the Internet.
Proposition 69: DNA Samples. Enacted in 2004, this measure required state and local law enforcement agencies to collect samples of deoxyribonucleic acid, commonly known as DNA, from all convicted felons, some nonfelons, and certain arrestees for inclusion in the state’s DNA data bank. Samples from the data bank are compared to DNA evidence from unsolved crimes to look for potential matches. Although the state collected DNA samples from certain felons prior to passage of this measure, this measure greatly expanded the number of individuals from whom the state was required to collect DNA.
Senate Bill 1128 (Alquist) and Proposition 83: Jessica’s Law. In 2006, the Legislature enacted Chapter 337, Statutes of 2006 (SB 1128, E. Alquist), and voters approved Proposi‑

Legislative Analyst’s Office
1�
tion 83, commonly referred to as Jessica’s Law. These new laws made a number of changes regarding the sentencing of sex offenses. Among other changes, they increased penalties for certain sex offenses, required global positioning system monitoring of felony sex offenders for life, restricted where sex offenders can live, and expanded the definition of who qualifies as a sexually violent predator who can be commit‑ted to a state mental hospital by the courts for mental health treatment.

California’s Criminal Justice System: A Primer
1�
Chapter 3:
The State of Crime in CaliforniaMeasuring Crime in California
Crime is primarily measured in two different ways. One approach is based on official reports from law enforcement agencies, which are compiled and published by the FBI. California data is published by the Criminal Justice Statistics Center in the state DOJ. These are the statistics often cited in reports and newspaper articles. The other method is through national victimization surveys in which researchers ask a sample of individuals if they have been victims of crime, re‑gardless of whether the crime was reported to the police.
Crimes Reported to Law Enforcement. Since 1930, the FBI has been charged with collecting and publishing reliable crime statistics for the nation, which it currently produces through the Uniform Crime Reporting (UCR) program. Local law enforcement agencies in California and other states submit crime information, which is forwarded to the FBI. In order to eliminate differences among various states’ statutory definitions of crime, UCR reports data only on selected general crime categories, which are separated into violent and prop‑erty crimes. The violent crimes measured under UCR include murder, forcible rape, robbery, and aggravated assault. Prop‑erty crimes include burglary, larceny‑theft, and motor vehicle theft. All crime rate data provided in this chapter are based on crimes reported by local law enforcement.
The UCR crime information is typically presented in terms of rates. A rate is defined as the number of occurrences of a criminal event within a population. Crime rates are typically presented as a rate per 100,000 people. For example,

Legislative Analyst’s Office
17
California’s 2005 murder rate was 6.9, which means that there were 6.9 murders per 100,000 Californians in 2005. Present‑ing information in terms of rates makes it easier to compare criminal activity in regions with differing population sizes.
Crime Estimates Through Victimization Surveys. Crime statistics from law enforcement do not tell the entire story of crime. There is a significant amount of crime committed each year that goes unreported to law enforcement authorities and therefore is not counted in official statistics.
In order to provide a more complete picture of the amount of crime committed, the U.S. DOJ, through its National Crime Victimization Survey (NCVS), surveys households and asks whether they have been victims of crime. The NCVS is con‑ducted annually at the national level, not on a state‑by‑state basis. It provides useful nationwide information on such is‑sues as the number of violent and property crimes in the na‑tion, the likelihood of victimization for various demographic groups, the percentage of crimes reported to the police, the characteristics of offenders, and the location of crimes. The NCVS uses “victimization rates” to compare the frequency of victimization among various demographic groups. The victimization rate for a particular group is presented as a rate per 1,000 people and excludes individuals under the age of 12.
What Is the State of Crime in California?Statewide. Providing an assessment of criminal activity
in California depends on the time horizon one uses. From a longer‑term perspective, the state has seen substantial decreases in crime over time. Crime rates have decreased 51 percent since reaching their peak in 1980. However, short‑er‑term trends are not as positive. Although violent crimes have continued to decline, property crimes have increased 7 percent since 2000. Comparing California to the rest of the U.S. also results in mixed conclusions. Although California’s overall crime rate was significantly higher than the national crime rate throughout the 1980s and early 1990s, the state’s

California’s Criminal Justice System: A Primer
1�
crime rate is now slightly lower than the national rate. Cali‑fornia’s violent crime rate, however, remains higher than the U.S. rate.
Regional Variation. It is important to note that there is also significant variation in crime rates among the regions of California. Generally, the Central Valley has the highest crime rates of any region in California. Among the most populous California counties, three of the four counties with the high‑est crime rates (San Joaquin, Sacramento, and Fresno) are located in the Central Valley. The counties with the lowest crime rates are in Southern California and the Bay Area—specifically, Ventura, Orange, and Santa Clara Counties, as shown on page 22.
This chapter provides information on crime rates in California. This includes data on the prevalence of crime in California—including comparisons of California’s crime rates to those of other states and comparisons among California counties—as well as data on the offenders and victims of crime. The chapter also discusses two other crime‑related topics: (1) the major factors that have caused a decline in crime rates, and (2) the prevalence of drug crimes, which are not included in traditional crime rate data.

Legislative Analyst’s Office
1�
How Prevalent Is Crime in California?
Rise and Fall of California’s Crime Rates
Rate Per 100,000 Population1960 Through 2005
1,000
2,000
3,000
4,000
5,000
6,000
7,000
8,000
9,000
1960 1965 1970 1975 1980 1985 1990 1995 2000 2005
Total ViolentProperty
• California experienced a decline in crime rates for nine consecutive years, from 1992 to 2000. During this period, the overall crime rate decreased by 56 percent. This trend is similar to declines in crime patterns in the rest of the U.S.
• Since 2000, however, overall crime in California has in‑creased 3 percent. The increase is driven by increases in property crime, which has increased 7 percent. The violent crime rate has continued to decline, dropping 15 percent since 2000.

California’s Criminal Justice System: A Primer
20
• Overall, California reported 3,849 crimes per 100,000 people in 2005.
• Property crime accounted for about 86 percent of reported crimes in California in 2005, and violent crime accounted for 14 percent.
• Although the proportion of crime changes slightly every year, property crimes consistently represent approximate‑ly 85 percent of all reported crimes.
Most Crime Is Property Crime
2005
AggravatedAssault
Burglary
Motor VehicleTheft
Larceny-theft(over $400)
Larceny-theft(under $400)
Robbery
Homicide
Forcible Rape
Violent
Property
Legislative Analyst’s Office
21
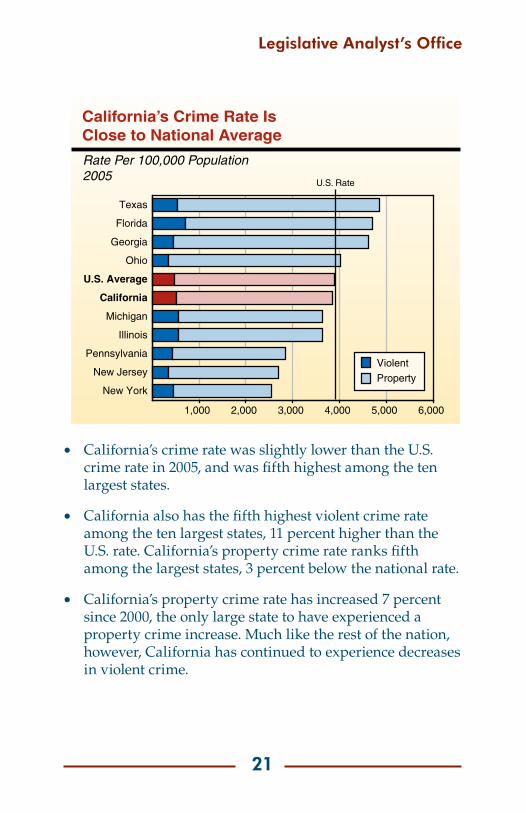
• California’s crime rate was slightly lower than the U.S. crime rate in 2005, and was fifth highest among the ten largest states.
• California also has the fifth highest violent crime rate among the ten largest states, 11 percent higher than the U.S. rate. California’s property crime rate ranks fifth among the largest states, 3 percent below the national rate.
• California’s property crime rate has increased 7 percent since 2000, the only large state to have experienced a property crime increase. Much like the rest of the nation, however, California has continued to experience decreases in violent crime.
California’s Crime Rate Is Close to National Average
Rate Per 100,000 Population 2005
1,000 2,000 3,000 4,000 5,000 6,000
New York
New Jersey
Pennsylvania
Illinois
Michigan
California
U.S. Average
Ohio
Georgia
Florida
Texas
U.S. Rate
Violent
Property

California’s Criminal Justice System: A Primer
22
• Among the 15 largest counties in California, San Joaquin had the highest violent crime and property crime rates. Ventura had the lowest violent and property crime rates.
• Since 2000, property crime rates have increased in 12 of the 15 large counties. Violent crime has increased in 5 of the 15 large counties.
• Kern had the largest increase in property crime since 2000, at 34 percent, while Fresno had the largest decrease, with a 9 percent decline.
• Between 2000 and 2005, San Mateo had the highest in‑crease in violent crime, at 22 percent, while Los Angeles had a 30 percent decrease, the largest decrease of all the large counties.
Crime Rates Vary Among Counties
Rate Per 100,000 Population2005
500 1,000 1,500 2,000 2,500 3,000 3,500 4,000 4,500
Ventura
Orange
Santa Clara
San Mateo
California
Los Angeles
San Diego
San Bernardino
Contra Costa
San Francisco
Riverside
Kern
Fresno
Alameda
Sacramento
San Joaquin
Violent
Property
California Rate

Legislative Analyst’s Office
23
Who Is Involved in Crime?
Who Commits Crime?The NCVS, conducted annually by the U.S. DOJ, provides
useful information about criminal offenders in the U.S. The 2005 NCVS shows that:
• About 79 percent of violent crimes involving one of‑fender were committed by a male.
• In 52 percent of assaults, the offender was someone known to the victim. However, the offender was some‑one known to the victim in only 20 percent of robber‑ies. In rapes and sexual assaults, offenders were known by 65 percent of their victims. For all violent crimes, females were more likely than males to be victimized by someone they know.
• About 45 percent of violent crimes were committed by individuals ages 15 through 29, despite representing only 21 percent of the overall population.
• About 28 percent of violent crimes involved an offender who was perceived to be under the influence of drugs or alcohol.

California’s Criminal Justice System: A Primer
2�
Who Are the Victims of Crime?The 2005 NCVS also provides information on the char‑
acteristics of victims of crime. Of particular interest are the following:
• Age. Individuals age 12 to 24—those most likely to commit violent crimes—were also most likely to be the victims of violent crime. The chances of becoming a victim of violent crime were significantly lower for all other age groups.
• Sex. The likelihood of being a victim of violent crime was 45 percent higher for males than for females.
• Ethnicity. Violent victimization rates for blacks were 37 percent higher than those for whites. Hispanics had violent victimization rates 24 percent higher than whites. Black households were victims of property crimes at a rate 7 percent lower than whites, and His‑panic household victimization rates were 35 percent higher than whites. These rates, however, can vary significantly from year to year.
• Economic Status. Poorer households were much more likely to experience an unlawful entry into their homes (burglary) than wealthier households. However, while wealthier households do not experience burglary as often, they were more likely to be victims of theft, which includes the taking of household items, motor vehicle accessories, or other objects without entry into the home.

Legislative Analyst’s Office
2�
Key Topics in California Crime Trends
What Major Factors Have Caused Declining Crime Rates?
During the 1990s, the U.S. experienced an unprecedented decrease in crime rates at a time when many experts were predicting that crime would reach all‑time highs. This de‑crease was consistent throughout the nation, from large urban cities to small rural areas. Numerous studies have been conducted to examine the causes of this drop in crime levels. Although there is no consensus on all causes of the decreases in the crime rate, the following factors are widely considered to be among the most significant factors in the crime drop:
• Increased Prison Population. Higher rates of incar‑ceration reduce crime for two reasons. First, keeping a higher proportion of criminals in prison keeps them from committing new crimes. Second, high incarcera‑tion rates are believed to serve as a deterrent, discour‑aging others from committing future crimes. In Cali‑fornia, the boom in the prison population was due to factors such as increases in the number of individuals sentenced to prison by the courts, higher rates of parole violators returning to prison, and the use of sentence enhancements.
• More Police. Studies have also shown that a nationwide increase in police officers per capita has been a factor in reducing crime rates. There has been little conclusive research, however, focusing on whether certain types of police strategies, such as so‑called community policing, have been effective strategies for reducing crime.
• Demographic Factors. Changes in the state’s crime rate follow changes in the portion of the population aged 18 through 24, the age group most likely to be involved in

California’s Criminal Justice System: A Primer
2�
criminal activity. In California, the share of the popula‑tion in the 18 to 24 age group increased throughout the 1970s until reaching its peak in 1978, when 18 to 24 year‑olds represented 14 percent of the population. The share of 18 to 24 year‑olds decreased consistently throughout the 1980s and 1990s, until 1997, when the share had dropped to 10 percent. This pattern follows the peaks and valleys of the state’s crime rates; California reached its peak crime rate in 1980 and its lowest crime rate in 2000, consistent with increases and decreases in the share of 18 to 24 year‑olds in the population. During the next 15 years, the share of 18 to 24 year‑olds in the state’s population is projected to remain stable at approximate‑ly 10 percent of the population.
• Economic Factors. Changes in unemployment, pover‑ty, and mean household income also affect crime rates. In the U.S., the economic boom of the late 1990s likely played a role in the reduction of crime rates. Although economic factors are often considered a central compo‑nent to variations in crime, research shows that factors such as police officers per capita and prison population may have a greater impact on the crime rate.
Drug CrimesA Significant Share of Felony Arrests and Incarceration.
The FBI Crime Index focuses solely on crimes that involve vi‑olence against persons or the loss of personal property. These statistics do not include crimes related to the possession, sale, or manufacture of illegal drugs. However, drug crimes do represent a significant portion of all crimes committed in the U.S. and within California. In 2005, felony drug arrests represented 30 percent of all felony arrests in California. As a result, approximately 21 percent of inmates in California’s prisons were incarcerated for a drug‑related crime. This is a significant increase as compared to 20 years ago when only

Legislative Analyst’s Office
27
11 percent of state inmates were incarcerated for drug offens‑es. This increase is likely due to changes in drug laws—par‑ticularly in the 1980s—that increased penalties for the posses‑sion and sale of illegal drugs.
Although there has not been a recent change in arrest or incarceration rates for drug crimes, there has been a change in the type of drugs most commonly used. California has experienced growth in the use of methamphetamines, which has become an increasingly popular drug in the western U.S. In addition, California is the primary source of methamphet‑amine sold in the U.S.
Drug Courts. Because a significant number of individu‑als are frequently imprisoned solely for drug‑related crimes, several California counties began using drug courts for managing individuals with substance abuse problems. The first drug court was established in Alameda County in 1993. Rather than seeking imprisonment, drug courts use judicially supervised treatment, mandatory drug testing, and a system of sanctions and rewards to help individuals become sober and successfully return to their communities.
This focus on treatment rather than incarceration became a statewide priority after the enactment of Proposition 36 in 2000, which provided the option of treatment for drug of‑fenders who had been convicted of only drug‑related crimes. In 2006, the Legislature increased the state’s annual funding for Proposition 36 programs, providing counties with a total General Fund appropriation of $145 million for this purpose in 2006‑07. This action was intended to allow counties to maintain the level of support for these programs in 2005‑06 using funding carried over from prior years. The Governor’s 2007‑08 budget plan proposes a net reduction of $25 million in support for Proposition 36 programs.

California’s Criminal Justice System: A Primer
2�
Chapter �:
Adult Criminal Justice System
As indicated in the prior chapter, victimization studies show that a substantial amount of crime goes unreported to law enforcement. According to NCVS studies, about 60 per‑cent of all crimes are not discovered or reported to law enforcement authorities. In addition, of the crimes reported to law enforcement officials, only about one‑fifth are solved. In 2005, for example, only about 17 percent of all reported crimes were solved or “cleared” (that is, a person was charged with a crime). This figure has remained relatively stable for a num‑ber of years.
Following an arrest, a law enforcement agency may file a complaint against the individual and he or she may be pros‑ecuted. Prosecution may result in the person being convicted. Persons who are convicted are given a fine and/or are sen‑tenced to county probation, county jail, county probation with a jail term, or state prison. The vast majority of convicted offenders end up on county probation and/or in county jail (as shown on page 33).
Although the Legislature and Governor enact laws that define crimes and set penalties, criminal justice officials exercise a great deal of discretion in enforcing these laws. The greatest discretion is at the local level, when police decide whether to arrest someone for a crime, prosecutors decide whether or how to charge a person with a crime, and courts adjudicate suspected offenders (as discussed on page 45).
This chapter provides information on the adult criminal justice system. This includes data on what happens to adult offenders from arrest through incarceration. The chapter also provides information on the characteristics of those in the

Legislative Analyst’s Office
2�
criminal justice system, such as demographics and criminal history. In addition, this chapter discusses two topics affect‑ing the adult criminal justice system: (1) the discretion of police officers, prosecutors, and judges affecting outcomes for adult offenders, and (2) federal court intervention in the prison health care system.

California’s Criminal Justice System: A Primer
30
What Happens to Adult Offenders?
Most Crimes Are Not Reported to Authorities
Percentage of Crimes Reported2005
10 20 30 40 50 60 70 80 90%
Total
Theft
Household Burglary
Motor Vehicle Theft
Property
Rape/Sexual Assault
Robbery
Aggravated Assault
Violenta
Rate for All Crime
aDoes not include homicide.
• According to NCVS studies, 41 percent of the crimes committed were reported to authorities in 2005. About 47 percent of all violent crimes were reported, while only 40 percent of property crimes were reported. (This report generally uses the term “violent” crimes to signify a catego‑ry of offenses committed against persons—such as homi‑cides and assaults—and is broader than the list of felonies defined as violent under the Three Strikes law.)
• About 83 percent of motor vehicle thefts were reported to the police, the highest rate of the major crime categories. This is likely due to the fact that individuals must file police reports in order to file auto insurance claims.
• Only 38 percent of rapes and sexual assaults were report‑ed to the police, lowest among violent crimes.

Legislative Analyst’s Office
31
• In 2005, 44 percent of violent crimes in California were solved, while 13 percent of property crimes were solved.
• A crime is typically considered solved, or cleared, when someone has been arrested, charged for the crime, and turned over for prosecution.
• Generally, those crimes in which the offender is more likely to be a relative or acquaintance of the victim, such as homicide and aggravated assault, have a higher likelihood of being solved.
Most Reported Crimes Are Not Solved
Percentage of Crimes Solved2005
10 20 30 40 50 60%
Motor Vehicle Theft
Violent
Property
Burglary
Larceny-Theft
Robbery
Forcible Rape
Homicide
Aggravated Assault
Total
Rate for All Crime

California’s Criminal Justice System: A Primer
32
• There were almost 1.5 million arrests of adults and juve‑niles for felonies and misdemeanors in California in 2005.
• About 64 percent of the arrests were for misdemeanors, while 36 percent were for felonies.
• The share of arrests that are misdemeanors and felonies has remained constant over the past ten years.
Most Arrests Are for Misdemeanors
2005
Felony
Misdemeanor

Legislative Analyst’s Office
33
Outcomes of Adult Felony Arrests in California
a “Other” includes no sentence given, sentence suspended, sentence stayed, California Rehabilitation Center, Youth Authority, fine, and death sentence.
Complaints Dismissed
15%
Complaints Filed
85%
Not Convicted
14%
Convicted
71%
Total Arrests
477,005
42% Probation With Jail
13% State Prison
11% Probation
3% Jail
3% Othera
Detail may not total due torounding.
2005
California’s Criminal Justice System: A Primer
3�
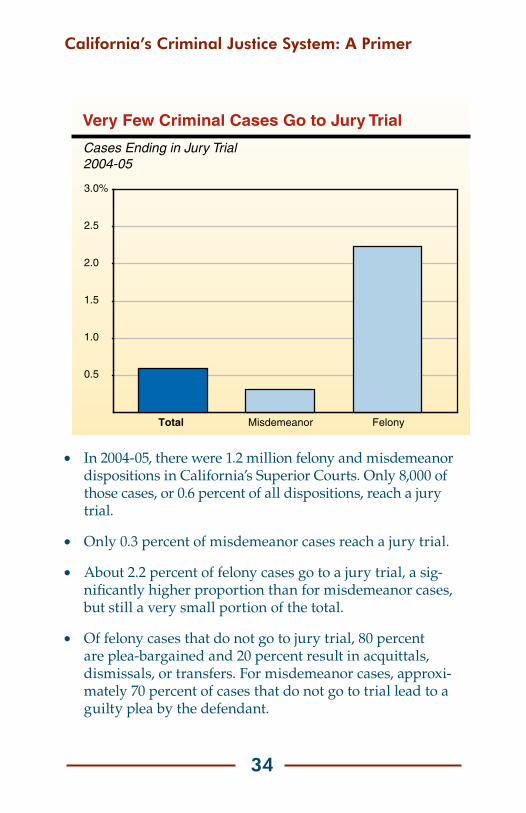
• In 2004‑05, there were 1.2 million felony and misdemeanor dispositions in California’s Superior Courts. Only 8,000 of those cases, or 0.6 percent of all dispositions, reach a jury trial.
• Only 0.3 percent of misdemeanor cases reach a jury trial.
• About 2.2 percent of felony cases go to a jury trial, a sig‑nificantly higher proportion than for misdemeanor cases, but still a very small portion of the total.
• Of felony cases that do not go to jury trial, 80 percent are plea‑bargained and 20 percent result in acquittals, dismissals, or transfers. For misdemeanor cases, approxi‑mately 70 percent of cases that do not go to trial lead to a guilty plea by the defendant.
Very Few Criminal Cases Go to Jury Trial
Cases Ending in Jury Trial2004-05
0.5
1.0
1.5
2.0
2.5
3.0%
MisdemeanorTotal Felony

Legislative Analyst’s Office
3�
• Between 1985 and 2005, the jail population grew from 51,000 inmates to 81,000 inmates (about 2 percent annu‑ally). Most of this growth occurred during the 1980s.
• The relative stability in the jail population since 1989 is in part due to federally‑imposed caps on jail population. By 2005, 20 counties had jails placed under such caps.
• Many more offenders are on probation than in jail. The number of adults on probation in California grew by less than 3 percent annually between 1985 and 2005, going from 210,000 to approximately 344,000 probationers.
• Of the 344,000 adults on probation in 2005, 77 percent were on probation for a felony, with the remainder misdemean‑ors. In some counties all probationers are convicted of a felony. In other counties, less than 50 percent of probation‑ers are convicted of a felony.
Growth in Adult Jail and Probation Populations
Average Daily Population1985 Through 2005
50,000
100,000
150,000
200,000
250,000
300,000
350,000
400,000
1985 1989 1993 1997 2001 2005
Jail
Probation

California’s Criminal Justice System: A Primer
3�
• The prison population grew from about 59,000 inmates in 1986 to 173,000 inmates in 2006 (5 percent average annual growth). Similarly, the prison incarceration rate grew from 220 to 460 inmates per 100,000 Californians over the same period (4 percent average annual growth).
• Most of this growth occurred between 1986 and 1998. This period was one of declining crime rates but also included the implementation of tougher sentencing laws and a prison construction boom that activated 20 state prisons.
• The prison population is projected to grow by more than 17,000 inmates over the next six years. This level of growth would significantly exceed the total bed capacity of the prison system in the near term, including housing in non‑traditional beds in gyms and dayrooms.
State Prison Population and Incarceration RateSlowed in Recent Years
1986 Through 2006
40,000
80,000
120,000
160,000
200,000
1986 1990 1994 1998 2002 2006
100
200
300
400
500
600Prison Population(left axis)
Prison Incarceration Rate(right axis)Prison Population
Incarceration Rate(Per 100,000)

Legislative Analyst’s Office
37
• California’s total incarceration rate, including both in‑mates in local jails and prisons is 683 (per 100,000 popula‑tion). This is relatively close to the national average of 740.
• As with most states, roughly two‑thirds of California’s incarcerated population is housed in state prisons.
• Of the ten largest states, Georgia has the highest incarcera‑tion rate (1,022), more than twice the rate of New York (480).
Total California Incarceration RateSimilar to U.S. Average
Total Incarceration Rate Per 100,000 Population2005
200 400 600 800 1,000 1,200
New York
Illinois
New Jersey
Ohio
Pennsylvania
Michigan
California
U.S. Average
Florida
Texas
Georgia
Prison
Jail
U.S. Incarceration Rate

California’s Criminal Justice System: A Primer
3�
• Most parole violators (PVs) are returned to custody (PV‑RTC) for violations of the conditions of their parole, while others are convicted in courts for new crimes with new terms (PV‑WNT).
• The total number of parole violations that resulted in an offender being returned to prison has increased five‑fold over the past 20 years from about 16,000 PVs in 1985 to 81,000 in 2005. There were about 115,000 individuals under state parole supervision at the end of 2005.
• The larger number of parole returns mostly reflects increas‑es in the total prison and parole populations, which have grown by almost four‑fold since 1985. This increase also reflects a rise in the rate at which parolees are returned to prison as PV‑RTCs. The PV‑RTC rate has increased by about 15 percent during the past 20 years due in part to changes in parole revocation regulations.
Growth in Number of Parole Returns to Prison
1985 Through 2005
10,000
20,000
30,000
40,000
50,000
60,000
70,000
80,000
90,000
100,000
1985 1989 1993 1997 2001 2005
PV-WNTs
PV-RTCs

Legislative Analyst’s Office
3�
Who Is in Corrections?
Relatively Few Jail Inmates and ProbationersConvicted for Violent Crimes
2005
Violent Crimes
Property Crimes
Other Crimes
Drug Crimes
• About 176,000 individuals were sentenced to local correc‑tions—jail, probation, or both—in 2005. About 76 percent of the total were sentenced to both jail and probation.
• Of this total, about 18 percent were convicted for violent crimes, while 55 percent were convicted for property or drug offenses. About 27 percent were convicted for other crimes, including driving under the influence or posses‑sion of a weapon.
• The fact that individuals committing violent crimes make up a relatively small share of the total sentenced to local corrections largely reflects the fact that violent crimes rep‑resent less than 19 percent of all felony convictions.

California’s Criminal Justice System: A Primer
�0
• Almost two‑thirds of court admissions to state prison are for property and drug offenses, including drug possession (15 percent), drug sales (15 percent), burglary (9 percent), and auto theft (7 percent).
• About one‑quarter of admissions to prison from the courts are for violent crimes. Of these, the most common offenses are assault (13 percent) and robbery (5 percent).
• The “other crimes” category include weapons possession (5 percent) and driving under the influence (2 percent).
Most Inmates Sent to PrisonFor Property and Drug Crimes
2005
Violent Crimes
Property Crimes
Other Crimes
Drug Crimes

Legislative Analyst’s Office
�1
• The prison population is predominantly comprised of male blacks and Hispanics age 20 through 39.
• By comparison, the California population has significantly higher percentages of women, whites, and older individu‑als than are in prison.
• During the past 20 years, the percentage of inmates who are Hispanic has increased by about 10 percent, while the percentage that is white or black has decreased. Over this period, the percentage of inmates age 50 or older, more than doubled. The gender distribution of the prison popu‑lation has remained stable.
Demographics of thePrison Population
2006
PrisonPopulation
California AdultPopulation
GenderMale 93% 50%Female 7 50
EthnicityBlack 29% 6%Hispanic 38 29White 28 51Other 6 14
Age18-19 1% 4%20-29 31 1930-39 31 2040-49 26 2150-59 9 1660 and older 2 20
Details may not total due to rounding.
Total Population 172,508 27,648,604

California’s Criminal Justice System: A Primer
�2
• About 40 percent of all strikers committed a violent crime as their current offense, while 50 percent committed a property or drug offense.
• Third strikers are more likely than second strikers to have a current offense that is a violent crime. About 44 percent of third strikers (3,514) and 39 percent of second strikers (12,935) are currently incarcerated for a violent crime.
• In 2006, strikers made up about 24 percent of the total prison population.
Striker Population by Most Recent Offense
2006
Total
Current OffenseThird
StrikersSecondStrikers Number Percent
Violent Crimes 3,514 12,935 16,449 40%Robbery 1,821 4,884 6,705 16Assault With a Deadly
Weapon 458 2,645 3,103 8Assault/Battery 426 2,432 2,858 7
Property Crimes 2,414 9,147 11,561 28%1st Degree Burglary 931 2,502 3,433 82nd Degree Burglary 479 1,701 2,180 5Petty Theft With a Prior 359 1,400 1,759 4
Drug Crimes 1,295 7,880 9,175 22%Possession of a Controlled
Substance 681 3,782 4,463 11Possession of a Controlled
Substance for Sale313 2,369 2,682 7
Sale of a ControlledSubstance 198 1,091 1,289 3
Other Crimesa 722 3,313 4,035 10%Possession of a Weapon 432 1,825 2,257 5
Totals 7,945 33,275 41,220 100%a For example, arson and driving under the influence.

Legislative Analyst’s Office
�3
• In 2005, there were more than 64,000 inmates released from prison after completing their prison sentence. On average, these inmates were incarcerated for two years.
• About 78 percent of inmates released served time for a property, drug, or other nonviolent offense. These offend‑ers were incarcerated for an average of less than two years.On average, inmates who committed violent crimes—such as kidnapping, sex offenses, or homicide (including mur‑der and manslaughter)—were incarcerated for an average of more than three years.
• Data on the average time served in prison shown above is for offenders released from prison. But some offenders are never released. As of December 31, 2005, about 31,700 in‑mates (19 percent of the inmate population) were serving life terms in prison and over 600 inmates were on death row awaiting execution.
Violent Offenders Serve LongerSentences Than Others
2005
1 2 3 4 5 6 7 8 9
Total All CrimesTheft
Drug PossessionDriving Under the Influence
Possession of WeaponBurglary
Drug Sales, ManufacturingArson
AssaultOther Sex Offenses
RobberyRape
HomicideKidnapping
Average Time Served
Years Served

California’s Criminal Justice System: A Primer
��
• Under state law, all inmates released from prison must serve a term on parole. In the 2007‑08 budget, the Gov‑ernor proposed modification of this policy, which would provide an exception for certain low‑level offenders.
• Generally, inmates leaving prison are required by law to parole to the county in which they were prosecuted. About 75 percent of the 117,000 parolees statewide are concen‑trated in ten counties. These counties represent 72 percent of the total California population.
• Los Angeles County has more than 35,000 (30 percent) of the total parole population. In total, 28 percent of Califor‑nians reside in Los Angeles County.
Three-Fourths of ParolePopulation Resides in Ten Counties
2006
County Parolees Percent
Los Angeles 35,376 30%San Bernardino 8,815 8San Diego 7,626 7Orange 7,229 6Riverside 7,193 6Santa Clara 5,344 5Fresno 4,743 4Kern 4,106 4Sacramento 3,603 3Alameda 3,309 3All other counties 29,453 25
Total California 116,797 100%
Detail may not total due to rounding.

Legislative Analyst’s Office
��
Key Topics in Adult Criminal Justice
Discretion Among Police Officers, Judges, and District Attorneys
Although it is sometimes overlooked, police (including county sheriffs), judges and district attorneys (DAs) have a great deal of discretion in carrying out their responsibilities that can significantly affect trends in punishment and incar‑ceration within county jails and the state prison system.
Police. The actions of law enforcement agencies primarily affect the nature of the criminal cases that will be reviewed by DAs and judges. Law enforcement agencies decide how to distribute officers throughout their jurisdiction and prioritize the use of their resources in enforcing criminal laws. When they encounter different types of crime, police officers decide which investigations to conduct and which individuals to arrest. Once an arrest has been made, police officers also can decide to release an arrestee without filing criminal charges.
District Attorneys. The DAs have a significant amount of authority that affects the outcome of many criminal cases. The DAs review information for various cases and decide which cases to prosecute and which to dismiss, based on available evidence and the county’s priorities. Once they decide to pros‑ecute a case, they also decide whether to plea bargain with a defendant, thereby foregoing a jury trial in exchange for a guilty plea to a lesser offense. Since a very small percentage of cases end up in a jury trial (as shown on page 34), the bargain‑ing decisions of DAs ultimately determine the punishment for virtually all criminal cases. In addition, DAs can have a sig‑nificant impact on the cases that do end up in a jury trial. For example, the DA decides whether to pursue the death penalty for an individual who has been charged with murder. Also, DAs can decide whether to seek a sentencing enhancement that would ensure a longer prison sentence upon conviction, such as under the Three Strikes law.

California’s Criminal Justice System: A Primer
��
Judges. Once an individual has been convicted of a crime, judges have final discretion in determining prison or jail sentences. Under California sentencing law, a range of pun‑ishments is provided for many types of crimes. For example, first‑degree burglary is punishable by imprisonment for either two, four, or six years; the particular sentence that a convicted burglar receives depends on the decision of the judge. However, we would note that a ruling made by the U.S. Supreme Court in January 2007 (Cunningham v. California), restricts a judge’s ability to assign sentences that are higher than the presumptive term. In addition, judges have the dis‑cretion to sentence a convicted felon to probation in lieu of a prison term, and dismiss prior strikes so that a felon is not re‑quired to serve additional prison time as otherwise required by the Three Strikes and You’re Out law.
Overall. A number of factors play a role in the decisions made by police, DAs, and judges. Some relate to the specifics of each case, such as the severity of the crime and the crimi‑nal history of the defendant. Other, broader considerations can also come into play. For example, a judge might be less likely to require jail time for a defendant if county jails are over capacity. Similarly, a DA might be more likely to plea bargain if the court is facing an overwhelming number of cas‑es. On the other hand, a growing problem in the community, such as drugs or gangs, might lead to stronger action by law enforcement, judges, and DAs, leading to higher arrest rates, less plea bargaining, and longer sentences. County sheriffs, county DAs, and superior court judges are publicly elected in each county. This explains in part why certain counties tend to hand down harsher sentences to criminal offenders than others. For example, after adjusting for population and arrest rates, Kern County is much more likely to impose longer prison sentences under the state’s Three Strikes law than San Francisco County.
The discretion that police, judges, and DAs have in these matters can have significant effects on the state criminal

Legislative Analyst’s Office
�7
justice system. Together they affect rates of arrest, lengths of imprisonment, the number of individuals incarcerated in county jails and state prison, the length of parole and proba‑tion, and, ultimately, the overall costs of the state criminal justice system and the share of these costs borne by the state and local governments.
Correctional Health Care: Federal Court Supervision
Court Findings. The CDCR operates three main types of health care programs: medical, mental health, and dental care. Each program is currently under varying levels of fed‑eral court supervision based on court rulings that the state has failed to provide inmates with adequate care as required under the Eighth Amendment to the U.S. Constitution. The courts found key deficiencies in the state’s correctional pro‑grams, including: (1) an inadequate number of staff to deliver health care services, (2) an inadequate amount of clinical space within prisons, (3) failures to follow nationally recognized health care guidelines for treating inmate‑patients, and (4) poor coordination between health care staff and custody staff.
The health care case with the greatest level of court involvement relates to CDCR’s medical program. Since April 2006, medical services have been administered by a federal receiver, whose mandate is to bring the department into com‑pliance with constitutional standards. To that end, the receiv‑er’s powers include hiring and firing medical staff, entering into contracts with community providers, and acquiring and disposing of property, including new information technology systems.
Potential Costs. Compliance with court requirements in the three health care programs is expected to result in significant additional costs to the department over the next several years, including costs to attract high‑quality health care professionals and expand clinical space to accommodate added staff. We have estimated that these costs could even‑

California’s Criminal Justice System: A Primer
��
tually exceed $1.2 billion annually by 2010‑11, particularly if the federal courts order the state to construct new health care facilities. The Legislature will play a key role as it (1) reviews support and capital outlay proposals intended to improve the delivery of health care services to inmates and (2) monitors the steps taken to improve inmate patient care with the goal of eventually having the court shift jurisdiction over these matters back to the state.
Legislative Analyst’s Office
��
Chapter �:
Juvenile Justice System
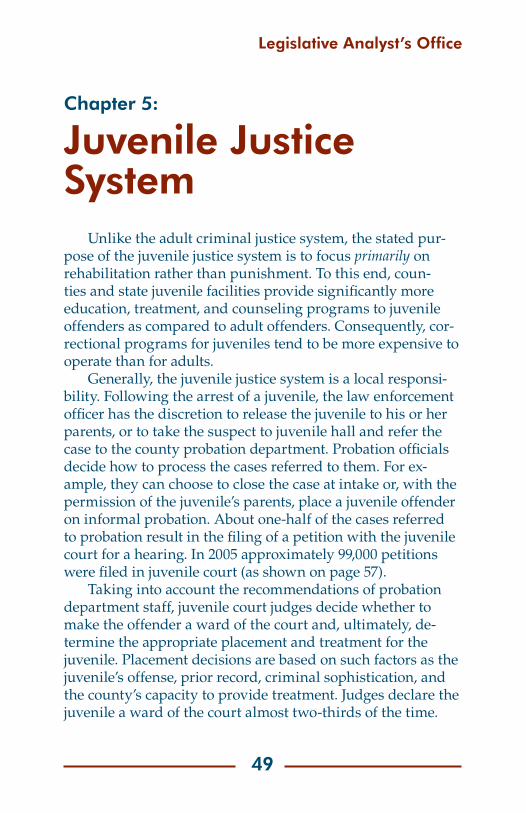
Unlike the adult criminal justice system, the stated pur‑pose of the juvenile justice system is to focus primarily on rehabilitation rather than punishment. To this end, coun‑ties and state juvenile facilities provide significantly more education, treatment, and counseling programs to juvenile offenders as compared to adult offenders. Consequently, cor‑rectional programs for juveniles tend to be more expensive to operate than for adults.
Generally, the juvenile justice system is a local responsi‑bility. Following the arrest of a juvenile, the law enforcement officer has the discretion to release the juvenile to his or her parents, or to take the suspect to juvenile hall and refer the case to the county probation department. Probation officials decide how to process the cases referred to them. For ex‑ample, they can choose to close the case at intake or, with the permission of the juvenile’s parents, place a juvenile offender on informal probation. About one‑half of the cases referred to probation result in the filing of a petition with the juvenile court for a hearing. In 2005 approximately 99,000 petitions were filed in juvenile court (as shown on page 57).
Taking into account the recommendations of probation department staff, juvenile court judges decide whether to make the offender a ward of the court and, ultimately, de‑termine the appropriate placement and treatment for the juvenile. Placement decisions are based on such factors as the juvenile’s offense, prior record, criminal sophistication, and the county’s capacity to provide treatment. Judges declare the juvenile a ward of the court almost two‑thirds of the time.
California’s Criminal Justice System: A Primer
�0
Most wards are placed under the supervision of the county probation department. These youth are typically placed in a county facility for treatment (such as juvenile hall or camp) or supervised at home. Other wards are placed in foster care or a group home.
A small number of wards (under 2 percent annually), generally constituting the state’s most serious and chronic juvenile offenders, are committed by the juvenile court to the CDCR’s Division of Juvenile Justice (DJJ) (previously known as the Department of the Youth Authority) and become a state responsibility (as shown on page 57). In addition, juveniles tried in adult criminal court for particularly serious or violent crimes are placed in a DJJ facility until their 18th birthday, at which time they are transferred to state prison for the re‑mainder of their sentence.
This chapter provides information on the juvenile justice system. This includes data on juvenile arrest rates, the char‑acteristics of juvenile offenders, and the outcomes for juvenile arrestees. The chapter also discusses two topics affecting the juvenile justice system: (1) reforming DJJ juvenile facilities, and (2) the changing roles of the state and local governments in the juvenile justice system.

Legislative Analyst’s Office
�1
Legal Categories of Juvenile Offenders
• Juveniles who have committed a minor offense.Informal ProbationersWelfare and InstitutionsCode Section 654
Known as “654s”
• Probation officers have a great deal of flexibilityand can place a juvenile on informal probation ifthe officer decides the juvenile is under thejurisdiction of the juvenile court or is likely to beunder its jurisdiction in the future.
• These juveniles are often diverted into substanceabuse, mental health, crisis shelters, or otherservices.
• Juveniles who have committed offenses unique toa juvenile, such as truancy, a curfew violation, andincorrigibility.
Status OffendersWelfare and InstitutionsCode Section 601
Known as “601s” • They can be placed on formal probation but cannotbe detained or incarcerated with criminal offenders.
• Offenders under the age of 18 years who commit amisdemeanor or felony.
• Subject to the jurisdiction of a juvenile court.
Criminal OffendersWelfare and InstitutionsCode Section 602
Known as “602s” • Can be placed on formal probation, detained beforeadjudication in a juvenile hall, and/or incarceratedafter adjudication in a county or state facility.
• They are treated differently from adults; they arenot “tried”, but “adjudicated”; they are not“convicted,” but rather, their “petition is sustained.”
• Any juvenile age 14 or older, who commitsspecified felonies and is determined not fit foradjudication in juvenile court.
• Tried in superior court as an adult.• If convicted, is sentenced to state prison and held
in a DJJ facility for all or part of sentence.
Juveniles Remanded to Superior CourtWelfare and InstitutionsCode Section 707
Known as “707Bs”or remands • If convicted, is sentenced to state prison and held in
a DJJ facility for all or part of sentence.
Who Are Juvenile Offenders?

California’s Criminal Justice System: A Primer
�2
• In 2005, males accounted for about 74 percent of all juve‑nile arrests in California. Males accounted for more than 80 percent of all juvenile felony arrests.
• Most juveniles arrested in 2005 were age 15 through 17. Only 2 percent of juvenile arrests were in the 10 and 11 age group.
• Black and Hispanic juveniles represented about one‑half of California’s juvenile population age 10 through 17 in 2005, but they accounted for almost two‑thirds of juvenile arrests.
Juvenile Arrests byGender, Race, and Age
2005
JuvenileArrests
CaliforniaYouth Population
Male 74% 51%Female 26 49
Black 17% 8%Hispanic 48 46White 28 33Other 7 14
Ages 10-11 2% 24%Ages 12-14 27 38Ages 15-17 71 38
Totals 222,512 4,493,439

Legislative Analyst’s Office
�3
How Prevalent Is Juvenile Crime in California?
Most Juvenile Arrests Are For Misdemeanor Crimes
2005
Total Arrests223,000
FeloniesMisdemeanors
Status Offenses
• There were almost 223,000 juvenile arrests in California in 2005.
• Misdemeanor crimes—including crimes such as petty theft and assault and battery—accounted for 60 percent of all juvenile arrests.
• Felony arrests, such as burglary, accounted for 27 percent of all juvenile arrests.
• So‑called status offenses, which include truancy and cur‑few violations, accounted for 13 percent of juvenile arrests in 2005.

California’s Criminal Justice System: A Primer
��
• Although the population of juveniles in California has increased by about 24 percent since 1995, the number of juvenile felony arrests has decreased by 33 percent.
• Juvenile misdemeanor arrests declined by about 6 percent between 1995 and 2005, from about 142,000 arrests in 1995 to less than 134,000 arrests a decade later.
• There is no consensus among researchers as to the cause of the declining juvenile arrest rates. One possible expla‑nation is the implementation of more effective prevention and intervention programs. In addition, some of the same factors that have led to declining crime rates nationwide—such as increased law enforcement personnel and eco‑nomic factors—may be contributing to declining juvenile crime.
California’s Juvenile Population Is Up,But Juvenile Felony Arrests Are Down
1995 Through 2005
1.0
2.0
3.0
4.0
5.0
19971995 1999 2001 2003 2005
20,000
40,000
60,000
80,000
100,000
State Juvenile Population(left axis)
Juvenile Felony Arrests(right axis)
Juvenile PopulationAges 10 Through 17
(In Miillions)Juvenile
Felony Arrests

Legislative Analyst’s Office
��
Felony Arrest Rates for Adults OvertookThose for Juveniles in the Late 1990s
Arrests Per 100,000 Population1995 Through 2005
500
1,000
1,500
2,000
2,500
3,000
1995 1997 1999 2001 2003 2005
Juvenile Felony Arrest Rate
Adult Felony Arrest Rate
• The juvenile felony arrest rate in California decreased by 46 percent between 1995 and 2005. Specifically, the number of juvenile felony arrests per 100,000 juveniles fell from more than 2,400 in 1995 to about 1,300 in 2005.
• The adult felony arrest rate also decreased during this pe‑riod but has increased in more recent years. The number of adult felony arrests per 100,000 adults was almost 2,000 in 2005.
• The adult felony arrest rate surpassed the juvenile felony arrest rate in 1999 and the “gap” between the two rates has widened every year since that time.

California’s Criminal Justice System: A Primer
��
• There were about 60,000 juvenile felony arrests in 2005.
• Property crimes—such as burglary and theft—accounted for about 40 percent of all juvenile felony arrests.
• Drug offenses accounted for 10 percent of juvenile felony arrests in 2005. The “other crimes” category, which in‑cludes such felonies as illegal possession of a firearm, accounted for 25 percent of arrests.
• Violent crimes, including homicide, rape, and robbery, ac‑counted for 25 percent of all juvenile felony arrests. There were a total of 171 juvenile arrests for homicide in 2005, less than one‑half of 1 percent of all juvenile felony arrests.
Three-Quarters of Juvenile Felony Arrests Area For Nonviolent Crimes
2005
Violent Crimes
Property Crimes
Other Crimes
Drug Crimes
Total Arrests60,000

Legislative Analyst’s Office
�7
What Happens to Juvenile Offenders?
Outcomes of Juvenile Arrests In California
Detail may not total due to rounding.
Juveniles Released
13%
Police ReferralsTo Probation
87%
Cases Heard inJuvenile Court
45%
Juveniles MadeWard of Court
28%
Total Arrests
222,512
43%
32% Cases dismissed or transferred. 7% Juveniles sent to alternative diversion program. 5% Cases heard in traffic court. 0.2% Cases referred to adult court.
17%
10% Cases dismissed or transferred. 5% Juveniles sent to alternative diversion program. 2% Cases deferred entry of judgment. 0.1% Cases sent to adult court.
17% Juveniles placed in home supervision. 9% Juveniles placed in county facility. 3% Juveniles placed in other public or private facility. 0.3% Juveniles sent to state facility.
2005

California’s Criminal Justice System: A Primer
��
• The population of juveniles incarcerated in state or county facilities has decreased every year since 2000 from about 19,000 in 2000 to 14,000 in 2005, a 27 percent decrease.
• Since 1999, the number of juveniles incarcerated in county facilities has declined by about 4 percent, from about 11,400 to 10,900.
• The number of juveniles incarcerated in state facilities declined by about 60 percent between 1999 and 2005, from almost 7,600 in 1999 to about 3,000 in 2005.
• The decline in juvenile incarceration is due largely to the decline in juvenile arrest rates and the implementation by counties of more alternatives to incarceration, such as placements in home supervision and group homes.
Number of Offenders in Youth CorrectionalFacilities is Decreasing
Average Daily Population1999 Through 2005
5,000
10,000
15,000
20,000
1999 2000 2001 2002 2003 2004 2005
State Facilities
County Facilities
Legislative Analyst’s Office
��
Key Topics in Juvenile Justice
Reforming the Division of Juvenile Justice Farrell Lawsuit. In January 2003, a lawsuit, Farrell v.
Allen, was filed against the Department of Youth Authority (as noted above, later renamed DJJ), contending that it failed to provide adequate care and effective treatment programs to youthful offenders (known as “wards”) incarcerated in state facilities. In November 2004, the administration agreed to plaintiffs’ demand that the state develop and implement remedial plans that addressed operational and programmatic deficiencies identified by court experts in six areas: educa‑tion, sex behavior treatment, disabilities, health care, mental health, and ward safety and welfare. The overarching goal of these reforms is to transform the state’s youth correctional system into a “rehabilitative model” of care and treatment for youthful offenders.
Remedial Plans. During the next several years, DJJ is required to implement reforms consistent with the remedial plans. The first priority is to reduce the level of ward‑on‑ward and ward‑on‑staff violence in the correctional facilities in order to create a suitable environment for treatment and reha‑bilitation. To do this, the remedial plan requires the division to hire various additional staff, particularly security officers, and place them in living units that will be limited to no more than 38 wards. Another priority is to train staff on treatment practices that have been successfully implemented in other states such as Texas and Washington. These “best practices” are intended to improve treatment for substance abuse, men‑tal illness, and sex‑offender behavior.
Fiscal Impact. Implementing these reforms will be a long‑term project. States such as Colorado report that it can take ten years or more to transform an underachieving youth correctional system into a successful rehabilitative model. Current estimates are that the implementation of these

California’s Criminal Justice System: A Primer
�0
reforms will cost the state more than $100 million annually once fully implemented. This amounts to approximately a 25 percent increase in state spending on juvenile corrections.
Defining State and Local Responsibilities for Juvenile Offenders
Current Local Role. As noted earlier, the juvenile justice system is primarily a local responsibility. Counties currently are responsible for more than 98 percent of all juvenile of‑fender cases, typically through their probation departments, which provide incarceration, rehabilitation services, and com‑munity supervision. The state, through DJJ, provides these services for the relatively small number of remaining juvenile offenders who generally have committed crimes that are more serious in nature or have repeatedly failed to respond to local juvenile justice programs.
Current State Role. The state’s role in the juvenile jus‑tice system has been changing in recent years. The number of offenders held in the state facilities operated by DJJ has dropped dramatically, as shown on page 58, from about 7,600 wards in 1999 to about 3,000 in 2005. (The number of wards in state facilities is even lower now and still dropping.) Mean‑while, the state has invested significant additional funding in recent years to improve its institutional programs (largely in response to litigation over conditions in DJJ facilities), as well as to expand grants to counties for community services to prevent at‑risk youth from being involved in criminal activi‑ties.
Future Roles. What roles the state and the counties should play in the juvenile justice system in the future—both in terms of funding and in setting overall policy governing the state’s approach to dealing with juvenile offenders—is the subject of continuing policy debate and discussion among criminal justice experts and governmental officials. One perspective is that, since criminal justice policies are often established by actions at the state level (such as by voter ap‑

Legislative Analyst’s Office
�1
proval of Proposition 21 in 2000, which expanded the types of cases for which juveniles can be tried in adult court), the state is obligated to retain a significant role in funding and operating youth institutions as well as parole supervision of wards who have been released into the community. In our past analyses of these issues, however, we have noted that, upon their release from state facilities, most juvenile offend‑ers return to their home communities and that these local communities thus have a significant interest in their future behavior. Counties also already administer many of the programs these individuals need to reduce their likelihood of recidivism, such as drug and alcohol treatment programs and mental health treatment.
Accordingly, one option is for part or all of the opera‑tion of existing DJJ institutions as well as parole supervi‑sion responsibilities to be shifted to counties, along with the resources to continue these programs. The Governor’s 2007‑08 budget plan proposes to shift part of the DJJ insti‑tutional population—primarily lower‑level juvenile offend‑ers—to counties along with block grant funding to offset the additional cost of this shift.
California’s Criminal Justice System: A Primer
�2
Chapter �:
The Costs of Crime And the Criminal Justice System
A number of studies have attempted to estimate the total direct and indirect costs of crime to government and society. The estimates resulting from these studies have varied, but generally conclude that nationwide costs of crime range from the tens to hundreds of billions annually.
Some components of the cost of crime can be readily es‑timated. For example, in 2003‑04, California spent more than $25 billion to fight crime, which included costs for police, prosecution, courts, probation, and incarceration (as shown on page 63). This amount was primarily funded by the state and local governments.
Other costs cannot be easily measured. For example, many crimes—such as fraud, embezzlement, or arson—often go undetected or unreported and thus their costs to society are not fully captured in some estimates. Also, some costs are difficult to estimate because the costs are “transferred” from one party to another. For example, the costs of crime in terms of the loss of goods and services may be transferred from manufacturers and retailers to consumers as the price of their products are adjusted to reflect the costs for crime prevention activities or losses from crime.
This chapter provides information on the costs of the criminal justice system. This includes data on the costs to state and local governments over time, criminal justice per‑sonnel compared to other states, and state expenditures on youth and adult corrections. The chapter also discusses two topics related to the costs of crime: (1) the cost of crime to society and (2) cost‑effective crime prevention strategies.

Legislative Analyst’s Office
�3
What Does It Cost to Operate the California Criminal Justice System?
California Spends More than $25 BillionAnnually to Fight Crime
1993-04 Through 2003-04(In Billions)
5
10
15
20
25
$30
93-94 95-96 97-98 99-00 01-02 03-04
Other State Criminal Justice
Jails and ProbationCourts and JudiciaryPrisons and Parole
Police and Sheriffs
• Total state spending on criminal justice grew from about $15 billion in 1993‑94 to more than $25 billion in 2003‑04 (the most recent complete data available).
• Criminal justice spending grew by about 6 percent annu‑ally during this period. Spending on prisons and parole grew slightly faster than other criminal justice programs, at a rate of 7 percent annually.
• Local governments support about 62 percent of total annual criminal justice costs, including approximately $11 billion for police and sheriffs.
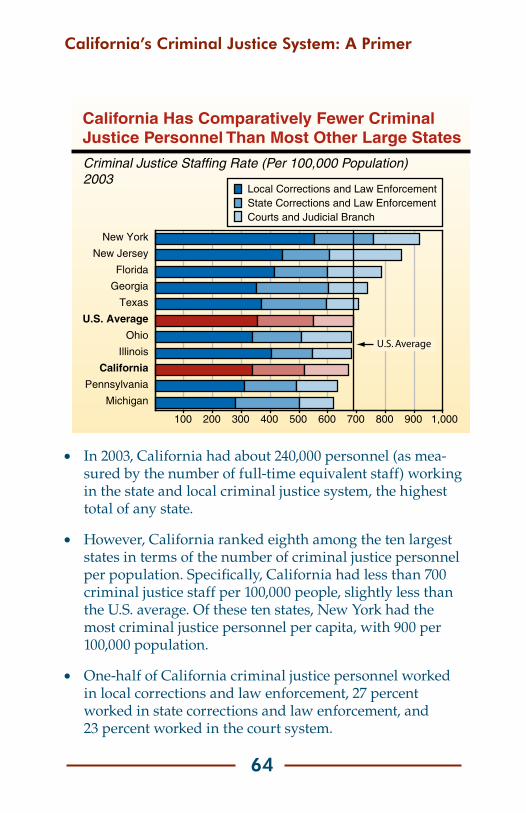
California’s Criminal Justice System: A Primer
��
• In 2003, California had about 240,000 personnel (as mea‑sured by the number of full‑time equivalent staff) working in the state and local criminal justice system, the highest total of any state.
• However, California ranked eighth among the ten largest states in terms of the number of criminal justice personnel per population. Specifically, California had less than 700 criminal justice staff per 100,000 people, slightly less than the U.S. average. Of these ten states, New York had the most criminal justice personnel per capita, with 900 per 100,000 population.
• One‑half of California criminal justice personnel worked in local corrections and law enforcement, 27 percent worked in state corrections and law enforcement, and 23 percent worked in the court system.
California Has Comparatively Fewer CriminalJustice Personnel Than Most Other Large States
Criminal Justice Staffing Rate (Per 100,000 Population)2003
100 200 300 400 500 600 700 800 900 1,000
Michigan
Pennsylvania
California
Illinois
Ohio
U.S. Average
Texas
Georgia
Florida
New Jersey
New York
Local Corrections and Law EnforcementState Corrections and Law EnforcementCourts and Judicial Branch
U.S. Average

Legislative Analyst’s Office
��
• State spending for criminal justice reached $14 billion in 2006‑07, an average annual increase of about 10 percent since 1996‑97. This growth rate outpaced that for total state spending and was only eclipsed by the growth in funding for resources/environmental programs.
• Most of the increase in spending in criminal justice pro‑grams is due to increases in salary costs, as well as court‑ordered mandates to improve parts of the prison system, such as medical care. The prison inmate population grew at an average annual rate of 2 percent over this period.
• Spending on criminal justice programs takes up a greater share of total state expenditures today than a decade ago, increasing from about 6 percent of total expenditures in 1996‑97, to about 7 percent in 2006‑07. Spending for correc‑tions makes up two‑thirds of total state criminal justice expenditures in the current year.
California Criminal Justice Spending Grew FasterThan Total State Spending
1996-97 Through 2006-07
2 4 6 8 10 12 14 16%
Social Services
All Other
Higher Education
Total
Transportation
K-12 Education
Health
Criminal Justice
Resources and Environment
Statewide AverageAnnual Growth Rate

California’s Criminal Justice System: A Primer
��
California Annual Costs toIncarcerate an Inmate in Prison
2006-07
Type of ExpenditurePer Inmate
Costs
Security $19,561
Inmate Health Care $9,330
Medical care $6,186
Psychiatric services 1,751
Pharmaceuticals 977
Dental care 416
Operations $6,216
Facility operations (maintenance, utilities, etc.) $4,377
Classification and inmate services 1,582
Reception, testing, assignment 240
Transportation 17
Administration $3,351
Inmate Support $2,527
Food $1,437
Inmate activities and canteen 485
Clothing 309
Inmate employment 296
Employment/Training $2,053
Academic education $949
Substance abuse programs 823
Vocational training 281
Miscellaneous $246
Total $43,287

Legislative Analyst’s Office
�7
• Adjusting for inflation, state expenditures for juvenile cor‑rections declined by about $137 million or 22 percent since 1995‑96.
• The ward population declined much more quickly over that period, falling from about 10,000 wards in 1995‑96 to fewer than 3,000 projected in 2006‑07, a decrease of more than 70 percent. This decrease is due primarily to the decline in juvenile arrest rates and the implementation by counties of more alternatives to incarceration, such as placements in home supervision and group homes.
• The annual cost of housing a ward in a state facility is esti‑mated to be approximately $180,000 in 2006‑07. These costs are substantially higher than the state costs to house adult offenders, primarily because juvenile facilities have higher staffing ratios and provide more education and rehabilita‑tion programs than adult facilities.
Spending for State Juvenile CorrectionsDeclined More Slowly Than Ward Population
1995-96 Through 2006-07
100
200
300
400
500
600
$700
95-96 97-98 99-00 01-02 03-04 05-06
2,000
4,000
6,000
8,000
10,000
12,000Expenditures (2006-07 Dollars)(left axis)
Ward Population(right axis)
Expenditures(In Millions)
WardPopulation

California’s Criminal Justice System: A Primer
��
Key Topics in Criminal Justice System Spending
The Cost of Crime to SocietyWhile the state’s criminal justice system requires substan‑
tial investment of government personnel and public resourc‑es, it is also important to note that crime has other significant effects on victims, families, businesses, and governments. Some of these impacts on society include:
• Medical costs paid by victims, families, and businesses and government because of injuries suffered due to crime.
• Stolen and damaged property resulting from crime. In the NCVS, victims reported that their property was either stolen or damaged in 95 percent of property crimes and 18 percent of violent crimes, resulting in an average loss of almost $700 per incident.
• Loss of productivity to society because of death or medi‑cal and mental disabilities resulting from crime.
• Loss of work time by victims of crime and their fami‑lies. According to NCVS data, about 6 percent of victims missed time from work due to crime.
• Loss of property values in neighborhoods with high rates of crime.
• Pain and suffering of crime victims, their families and friends, as well as communities plagued by crime.
• Foster care and other social services costs to provide homes and other services for children of offenders.It is difficult to identify the magnitude of these costs
because they vary so much from case to case depending in large part on the nature of the crime and the severity of the damage inflicted by criminals. In addition, some costs, such

Legislative Analyst’s Office
��
as pain and suffering and loss of productivity, are not easily quantifiable. Experts on crime have found it difficult to trans‑late these very real costs into definitive dollar amounts.
Cost-Effective Crime Prevention StrategiesThe rising costs of crime and the criminal justice system
have prompted policymakers to consider redirecting resourc‑es to crime prevention programs. Crime prevention gener‑ally refers to a broad array of strategies and programs that prevent crime by addressing the root causes of or risk‑factors associated with criminal behavior. These strategies range from early childhood development programs to mentoring and education to behavioral intervention programs targeting at‑risk juveniles and their families. The policy appeal of crime prevention programs is that such approaches would result in fewer victims of crime and reduce future taxpayer costs. Moreover, effective prevention strategies have the potential to reduce crime at a much lower cost than incarceration.
Research Findings. While crime prevention programs have long offered such benefits in concept, historically there has been only limited research available on the variety of different approaches to demonstrate which of these strate‑gies work best and which are most cost‑effective. Fortunately, today there is more research available, particularly research evaluating the effectiveness of juvenile delinquency preven‑tion and early intervention strategies. These studies have found that certain strategies are more effective than others. Some of the most effective programs at reducing juvenile crime and other delinquent behavior include parenting train‑ing for parents of at‑risk children, early education programs, and behavior modification training and therapy for juvenile offenders and their families.
Importantly, new research has found that some of these crime prevention programs and strategies, particularly those that target delinquency prevention, can be cost‑effective when well designed and implemented. That is, these pro‑

California’s Criminal Justice System: A Primer
70
grams can provide greater savings to taxpayers, victims, of‑fenders, and families than the costs to operate the programs. Research by the Washington State Institute for Public Policy shows that investment in certain prevention programs can yield significant net savings. For example, effective interven‑tion programs for juvenile offenders yield net benefits be‑tween $1,900 to $31,000 per youth participant. Some programs that involve professionals, such as nurses or social workers, visiting the homes of high‑risk mothers and children are also cost‑effective, yielding between $6,000 and $17,000 per youth. In addition, there are a number of other programs that generate net savings. Even some that yield comparatively small net savings, such as certain substance abuse prevention programs, are cost‑effective and are relatively inexpensive to operate. In California, a wide array of state and local agencies offer prevention and intervention programs. The degree to which these programs are evaluated for their cost‑effective‑ness varies considerably.
Fiscal Outcomes. It is important to note, however, that not all prevention and early intervention programs produce net savings, either because they are ineffective strategies or because they are too expensive. Program effectiveness also depends on which individuals are selected for participation. Some individuals may be more likely than others—based on their criminal history, age, or other risk factors—to be suc‑cessful in a program or otherwise amenable to treatment. Therefore, it is important that state and local government agencies that implement prevention and intervention pro‑grams target them to those individuals shown to most likely benefit from the services.

Legislative Analyst’s Office
71
Chapter 7:
ConclusionThe criminal justice system affects all Californians, either
directly or indirectly. Moreover, it costs taxpayers tens of billions of dollars annually to operate the agencies that make up the criminal justice system, including police, courts, jails, probation, prisons, and parole.
Because the criminal justice system plays an important role in the lives of Californians and is a significant share of state and local government budgets, it is important for poli‑cymakers to consider the major challenges facing the future of criminal justice in California. We discuss two of the most important challenges facing the Legislature below.
Inmate Population ManagementDuring the past 20 years, jail and prison populations
have increased significantly. County jail populations have increased by about 66 percent over that period, an amount that has been limited by court‑ordered population caps. The prison population has grown even more dramatically during that period, tripling since the mid‑1980s.
Projected Growth. Of particular concern is the projected growth in the state prison population. As shown in Figure 3 (see next page), the inmate population is projected by CDCR to increase from its current level of about 173,000 to about 190,000 inmates during the next five years. This growth, should it materialize, would put significant pressures on an already overcrowded prison system. More than 15,000 in‑mates—approximately 10 percent of the total prison popula‑tion—are housed in gyms, dayrooms, holding cells, and even hallways, and it would be very difficult for the current facili‑ties to safely accommodate the additional 17,000 prisoners that have been projected. Moreover, corrections officials state
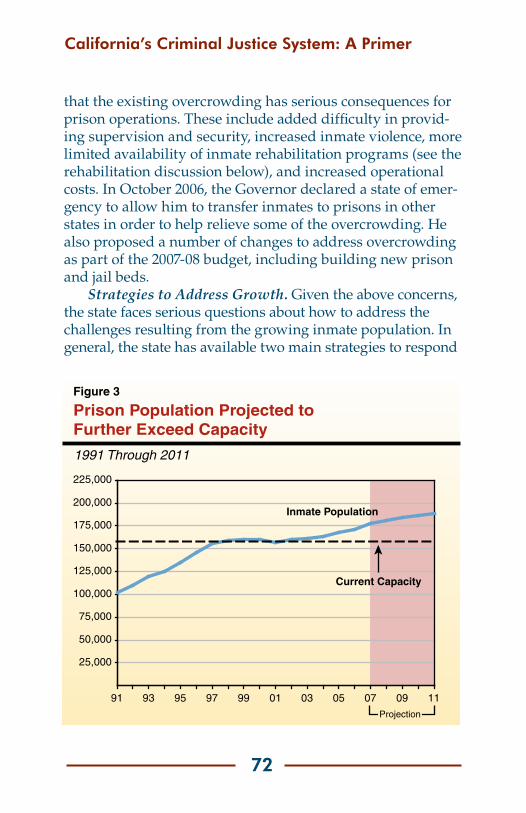
California’s Criminal Justice System: A Primer
72
that the existing overcrowding has serious consequences for prison operations. These include added difficulty in provid‑ing supervision and security, increased inmate violence, more limited availability of inmate rehabilitation programs (see the rehabilitation discussion below), and increased operational costs. In October 2006, the Governor declared a state of emer‑gency to allow him to transfer inmates to prisons in other states in order to help relieve some of the overcrowding. He also proposed a number of changes to address overcrowding as part of the 2007‑08 budget, including building new prison and jail beds.
Strategies to Address Growth. Given the above concerns, the state faces serious questions about how to address the challenges resulting from the growing inmate population. In general, the state has available two main strategies to respond
Prison Population Projected toFurther Exceed Capacity
1991 Through 2011
25,000
50,000
75,000
100,000
125,000
150,000
175,000
200,000
225,000
91 93 95 97 99 01 03 05 07 09 11
Inmate Population
Current Capacity
Projection
Figure 3

Legislative Analyst’s Office
73
separately or in combination to this situation: expand system capacity and reduce population.
• Expand Capacity. The prison system can be expanded in a number of ways. New prison construction is the most expensive option—especially given that the most recently constructed state prison cost about $400 mil‑lion. Individual housing units could also be construct‑ed at a number of existing prison sites. Finally, CDCR could expand its use of contracts with public and pri‑vate community correctional facilities (CCFs) to house additional inmates. Currently, the state has 14 such contracts for about 6,000 inmate beds for low‑level offenders. Historically, the state cost on a per‑in‑mate basis is similar for housing low‑security offenders in either a state‑operated prison or a CCF when taking into account the type of inmates placed in CCFs as well as medical costs. Expansion of CCF contracts could al‑low the state to add new facilities for offenders without having to directly pay for construction costs.
• Reduce Inmate Population. There are also a number of ways to reduce the inmate population, or at least slow its rate of growth. Expansion of the state’s inmate rehabilitation programs and the broader use of alter‑native sanctions for parole violators could reduce the number of offenders who return to prison. Shorter sentences could be provided for some inmates through (1) early release of selected groups of inmates—such as the elderly or very sick—or (2) changes in state sentenc‑ing laws. In late 2006, the Governor proposed changes in sentencing laws to house certain nonviolent felons in local jails instead of state prisons as required under current law. It is also worth noting that the administra‑tion could use its existing authority regarding parole returns, parole discharges, and release of certain in‑mates with life sentences to reduce population without

California’s Criminal Justice System: A Primer
7�
a change to current law or additional resources. The options provided above would reduce the prison popu‑lation, but would also entail some level of risk to the public, in that they permit some offenders to remain in the community who would otherwise be in prison under existing law and correctional practices.
Both of these general strategies have advantages and disadvantages. One approach would be to combine both strategies by targeting different strategies towards different types of offenders. For example, early‑release options could be implemented for nonviolent and low‑risk offenders. Alter‑native parole sanctions could be used primarily for offenders who would also benefit from available treatment services. New construction could be targeted at housing higher‑secu‑rity inmates who may not be suitable candidates for the other strategies.
Interconnectivity. Finally, it is worth noting that while local governments are responsible for funding and operating local jails, actions taken at one level of the criminal justice system can often affect other levels. For example, an expan‑sion of state prison capacity could result in more inmates being sentenced to state prison by the courts due to local con‑straints on jail populations. Alternatively, changes in sentenc‑ing law or parole practices that resulted in some offenders spending less time in state prison could increase the likeli‑hood that they end up in the local corrections system. These examples suggest that any changes made by the Legislature to affect prison population or capacity should also consider the possible impacts to, and responses by, the criminal justice system at the local level.
Prison and Parole Rehabilitation Programs and Public Safety
A second challenge facing the Legislature is the lack of rehabilitation programs for state prison inmates and parol‑

Legislative Analyst’s Office
7�
ees and the resulting public safety consequences. More than 80 percent of all inmates currently in prison will eventu‑ally be paroled to local communities, most within a couple of years of being sent to prison. More than 122,000 inmates were released in 2005 including 64,000 offenders released after serving their court‑imposed sentence, as well as 58,000 offenders released afer being returned for a parole violation. Unfortunately, California has one of the highest recidivism rates in the nation, with almost 60 percent of released offend‑ers returning to prison within three years, often because of new criminal activity. With so many offenders returned to the community, and with such high recidivism rates among parolees, state officials have emphasized the need to design and implement effective strategies to reduce recidivism.
Benefits from Rehabilitation Programs. Various stud‑ies have demonstrated that well‑designed rehabilitation programs such as drug treatment, academic and vocational education, and cognitive behavioral therapy can reduce recidivism when targeted to the right offenders by address‑ing issues that contribute to their criminal behavior. Such programs can benefit public safety by reducing criminal behavior, as well as reducing the prison population and ame‑liorating overcrowding conditions. Some corrections officials also argue that prison rehabilitation programs benefit prison operations and staff safety by engaging inmates in meaning‑ful work and preventing idleness.
Availability of Programs. Despite these apparent ben‑efits, the availability of rehabilitation programs is limited in California. For example, currently about 5 percent of spend‑ing on prison operations is for rehabilitation programs such as academic and vocational education (as shown on page 66). Studies suggest that most inmates have significant substance abuse problems and only about one‑third can read at a high school level. Nevertheless, at any given time the state has only enough drug treatment slots for about 6 percent of all inmates and classroom academic and vocational education
California’s Criminal Justice System: A Primer
7�
programs are only available to about 12 percent of the total inmate population. In part, this reflects the state’s historical emphasis on punishment over rehabilitation, as well as ongo‑ing funding constraints due to state budget problems. The 2007‑08 state budget does include about $51 million in addi‑tional funds for inmate and parolee rehabilitation programs. Most of this funding is part of the administration’s “Recidi‑vism Reduction Strategies” proposal, and amounts to about a 12 percent increase in funding for these programs.
Barriers to Programs. Should the state wish to make rehabilitation programs a higher priority, it will need to in‑vest additional funds, as well as address other barriers to the implementation of effective programs for inmates and parol‑ees. Most notably, those inmates who are assigned to reha‑bilitative programs are often not able to attend them because of high teacher vacancies and frequent prison lockdowns. In addition, program expansion is difficult in existing prisons because the physical space within prison walls that could be used for prison programs is now often filled with bunks of inmates due to prison overcrowding.
Ultimately, an approach that addresses inmate population management as well as increased rehabilitation programs would likely reduce prison overcrowding, inmate recidivism and, therefore, criminal justice system costs.