Embed Size (px)
Citation preview
January 2003
This sample business plan has been made available to users of Business Plan Pro®, business planning software published by Palo Alto Software. Names, locations and numbers may have been changed, and substantial portions of text from the original plan may have been omitted to preserve confidentiality and proprietary information.
You are welcome to use this plan as a starting point to create your own, but you do not have permission to reproduce, publish, distribute or even copy this plan as it exists here.
Requests for reprints, academic use, and other dissemination of this sample plan should be emailed to the marketing department of Palo Alto Software at [email protected]. For product information visit our Website: www.paloalto.com or call: 1-800-229-7526.
Copyright Palo Alto Software, Inc., 1995-2003
Confidentiality Agreement
The undersigned reader acknowledges that the information provided by _________________________ in this business plan is confidential; therefore, reader agrees not to disclose it without the express written permission of _________________________.
It is acknowledged by reader that information to be furnished in this business plan is in all respects confidential in nature, other than information which is in the public domain through other means and that any disclosure or use of same by reader, may cause serious harm or damage to _________________________.
Upon request, this document is to be immediately returned to _________________________.
___________________ Signature
___________________Name (typed or printed)
___________________Date
This is a business plan. It does not imply an offering of securities.
1.0 Executive Summary . . . . . . . . . . . . . . . . . . . . . . . . . . . . . . . . . . . . . . . . . . . . . . . . . 11.1 Objectives . . . . . . . . . . . . . . . . . . . . . . . . . . . . . . . . . . . . . . . . . . . . . . . . . . . .21.2 Mission . . . . . . . . . . . . . . . . . . . . . . . . . . . . . . . . . . . . . . . . . . . . . . . . . . . . . . 21.3 Keys to Success . . . . . . . . . . . . . . . . . . . . . . . . . . . . . . . . . . . . . . . . . . . . . . . .2
2.0 Company Summary . . . . . . . . . . . . . . . . . . . . . . . . . . . . . . . . . . . . . . . . . . . . . . . . . 32.1 Company Ownership . . . . . . . . . . . . . . . . . . . . . . . . . . . . . . . . . . . . . . . . . . . . 32.2 Start-up Summary . . . . . . . . . . . . . . . . . . . . . . . . . . . . . . . . . . . . . . . . . . . . . .3
3.0 Products and Services . . . . . . . . . . . . . . . . . . . . . . . . . . . . . . . . . . . . . . . . . . . . . . . 4
4.0 Market Analysis Summary . . . . . . . . . . . . . . . . . . . . . . . . . . . . . . . . . . . . . . . . . . . . 54.1 Market Segmentation . . . . . . . . . . . . . . . . . . . . . . . . . . . . . . . . . . . . . . . . . . . . 54.2 Target Market Segment Strategy . . . . . . . . . . . . . . . . . . . . . . . . . . . . . . . . . . . 64.3 Service Business Analysis . . . . . . . . . . . . . . . . . . . . . . . . . . . . . . . . . . . . . . . . . 7
4.3.1 Competition and Buying Patterns . . . . . . . . . . . . . . . . . . . . . . . . . . . . . . 7
5.0 Strategy and Implementation Summary . . . . . . . . . . . . . . . . . . . . . . . . . . . . . . . . . 85.1 Competitive Edge . . . . . . . . . . . . . . . . . . . . . . . . . . . . . . . . . . . . . . . . . . . . . . 85.2 Marketing Strategy . . . . . . . . . . . . . . . . . . . . . . . . . . . . . . . . . . . . . . . . . . . . . 85.3 Sales Strategy . . . . . . . . . . . . . . . . . . . . . . . . . . . . . . . . . . . . . . . . . . . . . . . . .9
5.3.1 Sales Forecast . . . . . . . . . . . . . . . . . . . . . . . . . . . . . . . . . . . . . . . . . . . 95.4 Milestones . . . . . . . . . . . . . . . . . . . . . . . . . . . . . . . . . . . . . . . . . . . . . . . . . . . .11
6.0 Web Plan Summary . . . . . . . . . . . . . . . . . . . . . . . . . . . . . . . . . . . . . . . . . . . . . . . . . 116.1 Website Marketing Strategy . . . . . . . . . . . . . . . . . . . . . . . . . . . . . . . . . . . . . . . 126.2 Development Requirements . . . . . . . . . . . . . . . . . . . . . . . . . . . . . . . . . . . . . . . 12
7.0 Management Summary . . . . . . . . . . . . . . . . . . . . . . . . . . . . . . . . . . . . . . . . . . . . . . 127.1 Personnel Plan . . . . . . . . . . . . . . . . . . . . . . . . . . . . . . . . . . . . . . . . . . . . . . . . .13
8.0 Financial Plan . . . . . . . . . . . . . . . . . . . . . . . . . . . . . . . . . . . . . . . . . . . . . . . . . . . . . 138.1 Important Assumptions . . . . . . . . . . . . . . . . . . . . . . . . . . . . . . . . . . . . . . . . . . 138.2 Break-even Analysis . . . . . . . . . . . . . . . . . . . . . . . . . . . . . . . . . . . . . . . . . . . . .148.3 Projected Profit and Loss . . . . . . . . . . . . . . . . . . . . . . . . . . . . . . . . . . . . . . . . . 158.4 Projected Cash Flow . . . . . . . . . . . . . . . . . . . . . . . . . . . . . . . . . . . . . . . . . . . . . 188.5 Projected Balance Sheet . . . . . . . . . . . . . . . . . . . . . . . . . . . . . . . . . . . . . . . . . . 208.6 Business Ratios . . . . . . . . . . . . . . . . . . . . . . . . . . . . . . . . . . . . . . . . . . . . . . . . 20
Table of Contents
1.0 Executive Summary
Your T-Shirt! is an exciting new business that allows people to custom design a shirt (specifically the design on the front or back) any way that they would like. By intelligently leveraging cutting edge technology, Your T-Shirt! will harness the power of computer sublimation to allow custom shirt printing in production runs as small as one unit. The company was founded in 2003 by David Inkler. The company is set up as a Washington L.L.C. Your T-Shirt! will have a storefront in Seattle as well as a comprehensive website that allows ordering to occur anywhere.
Imagine the ability to create a totally custom shirt. You choose the material and style of the shirt, and then the image or graphic you want on the front and/or back. This is the ultimate form of expression. There are no limits to what you can communicate. Some people might show their fanaticism for a particular sports team, others a musician. Or you might have a social message or cause on your shirt. Whatever you may decide, you can print any image on your shirt.
Products
Your T-Shirt! will offer customers a variety of options for creating their own custom shirts. The majority of orders will be for t-shirts, however other style shirts will be available. Your T-Shirt! has developed a strategic relationship with Hewlett-Parkard's (HP) printer division. We will use their printer sublimation technology that allows a computer image to be applied to a shirt in a high quality, high resolution, economically feasible manner. This technology creates an image durable enough to withstand thousands of washings. Its photo-like quality, due to signifcantly higher printer resolution than anything on the market, will show off any image. The technology is cost effective enough to offer customers the ability to order just one unit. Most other competitors' costs prohibit printing custom shirts in one-off production runs. Finally, the customer may choose from an extensive library of existing images, supply their own image, or have an artist create an image for them.
Competitive Edge
Your T-Shirt! has two sustainable competitive edges to assist them in market penetration. The first edge is a enormous catalog of graphic images. By establishing strategic partnerships with companies that have existing graphic image libraries, Your T-Shirt! is able to offer an unprecedented number of options. Their second edge is the high quality of sublimation offered. From previous work experience, David has established close business and personal ties with HP's printer division and will exclusively be using prototype technology that offers an unprecedented high resolution sublimation process for shirts.
Management
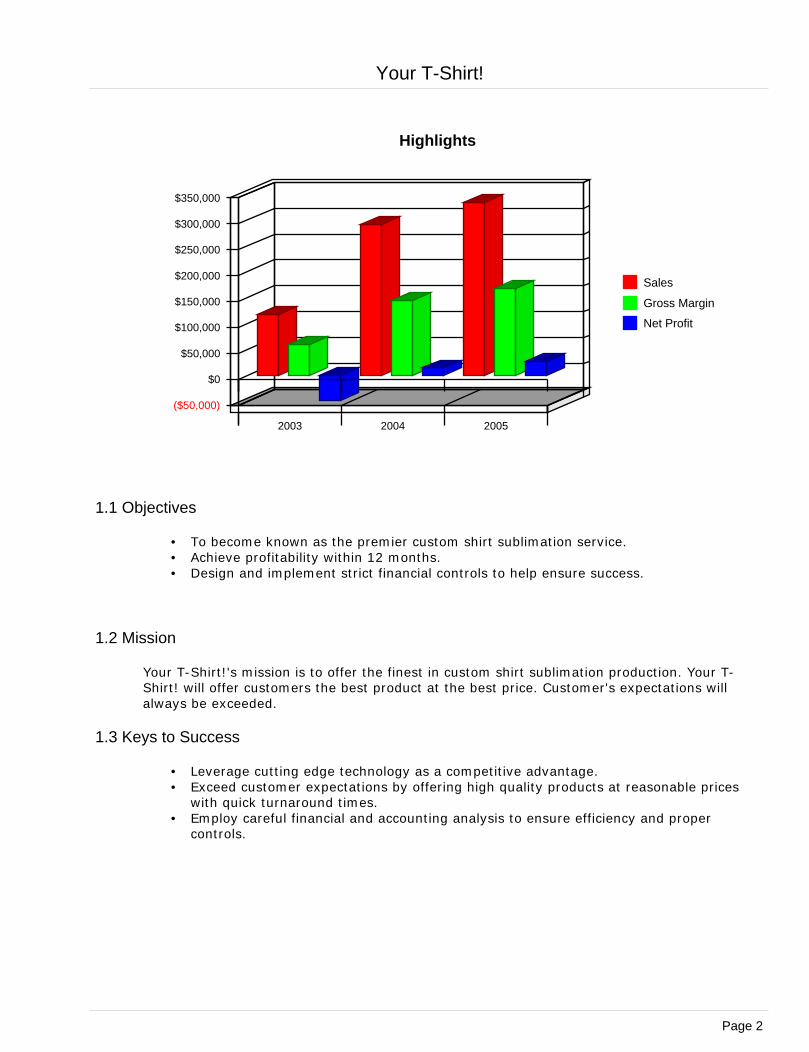
Your T-Shirt! will be led by David Inkler and is not his first t-shirt venture. While in college David produced and sold tie-dye shirts. This early business experience gave David valuable insight into the market, the products, and the customer's needs and desires. Since leaving college David worked in Hewlett-Packard's printer division, and it was this experience that provided useful business and professional contacts within the shirt sublimation technology industry that he is currently leveraging. After three years in marketing at HP, David went back to school to earn his MBA. David will use his educational skills, his technological business contacts, and his previous shirt industry experience to make Your T-Shirt! profitable. Sales forecasts indicate that Your T-Shirt! will achieve $290,000 and $334,000 in sales for years two and three respectively. Net profit will correspondingly be $13,900 and $26,600.
Your T-Shirt!
Page 1
($50,000)
$0
$50,000
$100,000
$150,000
$200,000
$250,000
$300,000
$350,000
2003 2004 2005
Sales
Gross Margin
Net Profit
Highlights
1.1 Objectives
• To become known as the premier custom shirt sublimation service. • Achieve profitability within 12 months.• Design and implement strict financial controls to help ensure success.
1.2 Mission
Your T-Shirt!'s mission is to offer the finest in custom shirt sublimation production. Your T-Shirt! will offer customers the best product at the best price. Customer's expectations will always be exceeded.
1.3 Keys to Success
• Leverage cutting edge technology as a competitive advantage.• Exceed customer expectations by offering high quality products at reasonable prices
with quick turnaround times.• Employ careful financial and accounting analysis to ensure efficiency and proper
controls.
Your T-Shirt!
Page 2
2.0 Company Summary
Your T-Shirt! is a start-up organization. It has been formed as a Washington registered L.L.C. by David Inkler. The L.L.C. formation was chosen as a way to minimize personal liability issues for the owner and avoiding the double taxation found in traditional corporations.
2.1 Company Ownership
David Inkler is the Founder and President of Your T-Shirt!
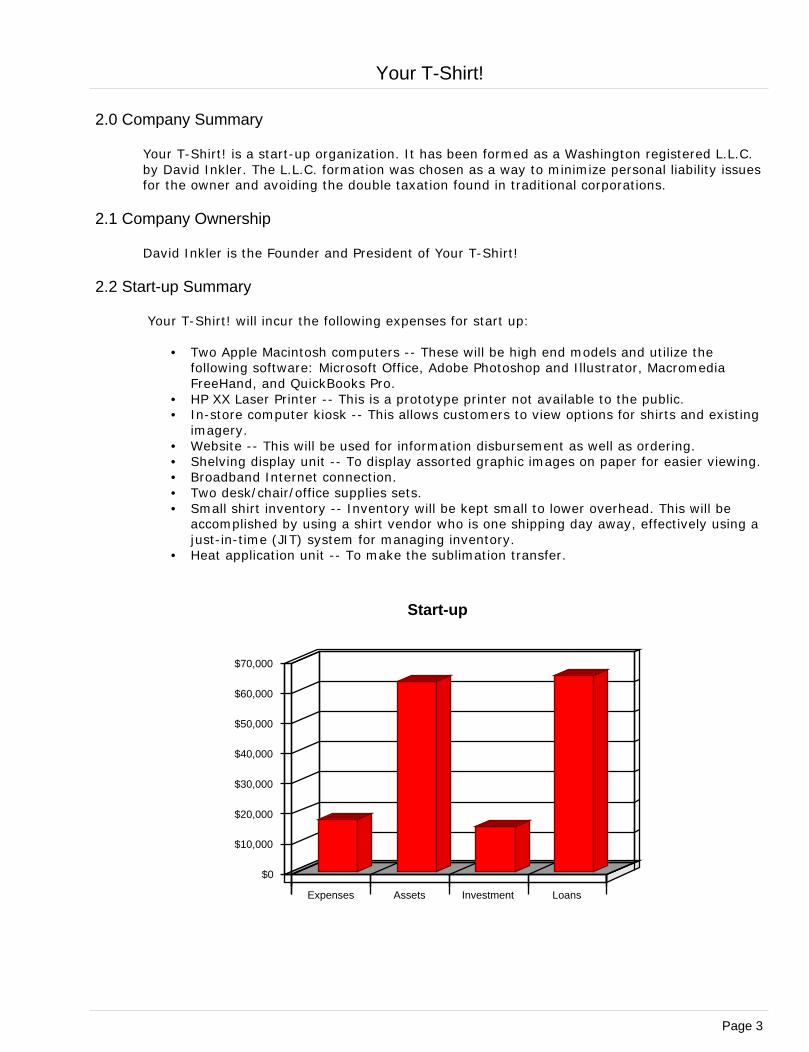
2.2 Start-up Summary
Your T-Shirt! will incur the following expenses for start up:
• Two Apple Macintosh computers -- These will be high end models and utilize the following software: Microsoft Office, Adobe Photoshop and Illustrator, Macromedia FreeHand, and QuickBooks Pro.
• HP XX Laser Printer -- This is a prototype printer not available to the public.• In-store computer kiosk -- This allows customers to view options for shirts and existing
imagery.• Website -- This will be used for information disbursement as well as ordering.• Shelving display unit -- To display assorted graphic images on paper for easier viewing.• Broadband Internet connection.• Two desk/chair/office supplies sets.• Small shirt inventory -- Inventory will be kept small to lower overhead. This will be
accomplished by using a shirt vendor who is one shipping day away, effectively using a just-in-time (JIT) system for managing inventory.
• Heat application unit -- To make the sublimation transfer.
$0
$10,000
$20,000
$30,000
$40,000
$50,000
$60,000
$70,000
Expenses Assets Investment Loans
Start-up
Your T-Shirt!
Page 3
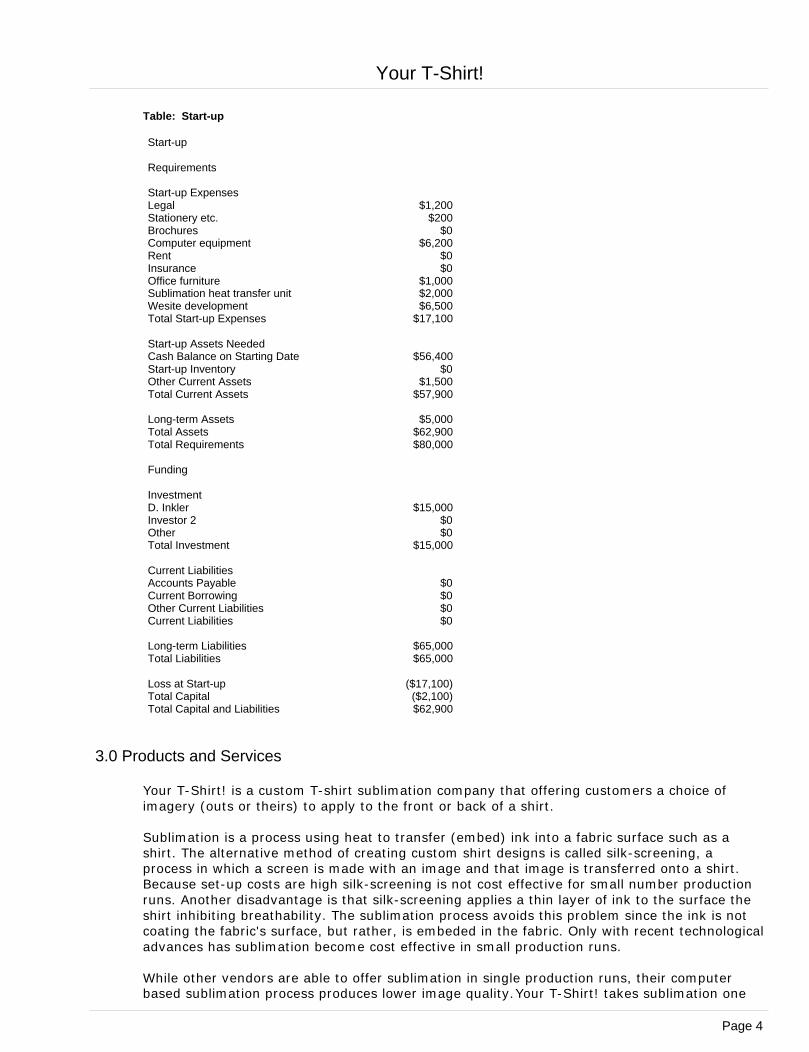
Table: Start-up
Start-up
Requirements
Start-up ExpensesLegal $1,200Stationery etc. $200Brochures $0Computer equipment $6,200Rent $0Insurance $0Office furniture $1,000Sublimation heat transfer unit $2,000Wesite development $6,500Total Start-up Expenses $17,100
Start-up Assets NeededCash Balance on Starting Date $56,400Start-up Inventory $0Other Current Assets $1,500Total Current Assets $57,900
Long-term Assets $5,000Total Assets $62,900Total Requirements $80,000
Funding
InvestmentD. Inkler $15,000Investor 2 $0Other $0Total Investment $15,000
Current LiabilitiesAccounts Payable $0Current Borrowing $0Other Current Liabilities $0Current Liabilities $0
Long-term Liabilities $65,000Total Liabilities $65,000
Loss at Start-up ($17,100)Total Capital ($2,100)Total Capital and Liabilities $62,900
3.0 Products and Services
Your T-Shirt! is a custom T-shirt sublimation company that offering customers a choice of imagery (outs or theirs) to apply to the front or back of a shirt.
Sublimation is a process using heat to transfer (embed) ink into a fabric surface such as a shirt. The alternative method of creating custom shirt designs is called silk-screening, a process in which a screen is made with an image and that image is transferred onto a shirt. Because set-up costs are high silk-screening is not cost effective for small number production runs. Another disadvantage is that silk-screening applies a thin layer of ink to the surface the shirt inhibiting breathability. The sublimation process avoids this problem since the ink is not coating the fabric's surface, but rather, is embeded in the fabric. Only with recent technological advances has sublimation become cost effective in small production runs.
While other vendors are able to offer sublimation in single production runs, their computer based sublimation process produces lower image quality. Your T-Shirt! takes sublimation one
Your T-Shirt!
Page 4
step further by producing the graphic images at a higher resolution than other existing technologies. Through a strategic relationship with David's former employer, Hewlett-Packard, Your T-Shirt! has access to their new prototype sublimation high resolution printer giving Your T-Shirt! a significant advantage.
Your T-Shirt! will offer custom sublimation mainly on T-shirts, but will have other shirt styles available. Customers can choose from traditional cotton-blend shirts or all natural fiber cotton shirts.
Customers can then choose from pre-existing graphics or custom artwork. The pre-existing graphics are chosen from an extensive catalog. Your T-Shirt! has developed strategic relationships with several companies that offer a wide range of graphic images. The relationships allow Your T-Shirt! to list the other company's graphics within their catalog thereby significantly options. These images can be viewed and ordered online, providing customers with flexibility and convenience. Your T-Shirt! will have a comprehensive Website that will allow ordering a customer's home, or where ever they may be. Additionally, Your T-Shirt! will have a computer kiosk in the store front as an in-store catalog.
Your T-Shirt! will also offer custom artwork or graphic options for sublimation. The customer may bring in a graphic or may use Your T-Shirt!'s sub-contracted artist to realize their vision. Your T-Shirt!'s artist can take a customer's pencil drawing or even articulated thoughts and turn them into a new design.
Your T-Shirt! will offer a range of different shirt options. As indicated by the name, there will be an emphasis on T-shirts. Short sleeves, long sleeves, organic fabrics, and a variety of polo, rugby and other styles will also be offered.
4.0 Market Analysis Summary
Your T-Shirt! has segmented the market into two groups, organized by the type of product that they purchase. The first group is customers that desire an already created graphic image to be placed on the their shirt. The second group are those that prefer custom artwork to be placed on their shirt. Your T-Shirt! has decided to divide the market by the products that they purchase because it offers an intuitive, easy method of targeting the two different groups. An additional reason for segmenting the market based on the two products is because the demographics for the buyers of the two products are distinct enough to group them separately.
4.1 Market Segmentation
Your T-Shirt! has segmented their market into two distinct groups. As mentioned previously, the two segments are grouped by the type of product they chose. Although Your T-Shirt! is dividing the market by product type, it is effectively dividing the market by age as well since the customers who purchase the custom artwork shirts tend to be older than the group preferring the ready-made graphics. While this is not a hard and fast rule, it is a fairly accurate generalization.
Graphics -- This is group purchases a shirt and has an existing graphic placed on the shirt. This is the less expensive option and lends itself to low production numbers, as low as one, since there is not the inherent expense of artwork creation.
• Ages 14-25• 69% are students• Median individual income is $26,000• Go out to eat 3.4 times a week• Listen to 3.6 hours of music a week
Your T-Shirt!
Page 5
Artwork -- This segment prefers having custom artwork created and placed on their shirt. They generally have the image or style in mind and will direct the artist to create it. Occassionally when the customer will not have an exact image in mind but will rely on the artist's skills to help shape the work. Some of these customers will use Your T-Shirt!'s partner artist, others will have a friend or other service provider develop the art.
• Ages 24-43• Median individual income is $42,000• Go out to eat 2.7 times a week• Listen to 3.3 hours of music a week• 18% are using the shirt as a form of communication for a cause or a message
Table: Market Analysis
Market AnalysisPotential Customers Growth 2003 2004 2005 2006 2007 CAGRGraphics 7% 7,879,664 8,431,240 9,021,427 9,652,927 10,328,632 7.00%Artwork 8% 5,969,854 6,447,442 6,963,237 7,520,296 8,121,920 8.00%Total 7.43% 13,849,518 14,878,682 15,984,664 17,173,223 18,450,552 7.43%
Graphics
Artwork
Market Analysis (Pie)
4.2 Target Market Segment Strategy
Your T-Shirt! has chosen these two market segments because their demographics (reasonably young) have the highest likelihood of purchasing a custom shirt. Both of these segments are reasonably young. This is important because most of Your T-Shirt!'s products are T-shirts and younger people tend to wear them frequently.
Music is also an important interest for the target markets since both segments listen to and watch more than average amount of music. T-shirts are particularly popular at music events. This phenomenon may be explained in part by the expressive nature of both music and T-shirt graphics. Your T-Shirt! will provide a form of expression, allowing each customer to choose what aesthetic or idea they want to communicate.
Your T-Shirt!
Page 6
Lastly, the business will be located in Seattle which has a young, hip scene. There are many music and other venues that cater to Your T-Shirt!'s demographic and these will be useful in developing awareness of Your T-Shirt!
4.3 Service Business Analysis
The T-shirt design industry is a primarily brick and mortar based industry. Most companies offer either silk-screening or sublimation services to typically local customers. While most of the products are T-shirts, there is a niche of companies that offer these printing services for uniforms, team jerseys, etc. Most of the participants in the industry fall into two categories, those that sell to individuals and those that sell in multi-unit production runs. The companies that sell to individuals are almost always silk-screeners who have a limited number of silk-screens already developed. The customer chooses which one they want and a T-shirt is made. This type of vendor is often the typical T-shirt maker that you see at fairs. The second type of sells most of their products in larger production lots. This can be explained by the fact that for custom work, whether silk-screens or sublimations, it is not cost effective to produce in small lots.
Recently, a number of companies began offering computer-based sublimation enabling them to offer low production runs. The technology the various companies are using, with Your T-Shirt! being an exception, are is in its infancy an is of low resolution. While the new technology allow companies to offer sublimation using computers, the image quality is average at best. Your T-Shirt! is able to leverage proprietary technology as a competitive edge to produce a much higher quality computer sublimation.
4.3.1 Competition and Buying Patterns
Your T-Shirt! has identified three competitors, two are local companies, the third is an Internet-based shirt designer.
• T-shirt World -- This local competitor specializes in silk-screening. 70% of their business is silk-screening with the remaining 30% sublimation. They require a minimum order of 10 with a 2-3 week lead time. This company only uses pre-existing designs for their silk-screening and for sublimations you must use their artist.
• Shirt Shack -- This local retailer is geared toward organizations or teams with production runs of 20 or more. They do fairly good work but are rigid regarding custom work.
• Design House -- This is an Internet-based retailer that primarily offers computer sublimations. Design House has a catalog of approximately 200 images for the customer to choose from. They do allow customers to use their own graphic. The quality of the sublimations is mediocre at best because they can only use off the shelf technology.
Another minor source of competition comes from home kits that turn your ink jet printer into a T-shirt making machine. While these kits do offer some competition, the image quality is not good, therefore this will only appeal to children or the home hobbyist, someone not very concerned with image quality.
Your T-Shirt!
Page 7
5.0 Strategy and Implementation Summary
Your T-Shirt! will leverage their two competitive edges to quickly gain market share. The competitive edges are an unprecedented catalog of graphic images and the quality of their computer generated sublimations, a function of using prototyped HP sublimation technology. The marketing campaign will emphasize the ability to completley customize a shirt. Youth events and student groups will be targeted. The sales campaign will emphasize making the experience as easy and pleasing as possible to encourage repeat customers and word of mouth referrals.
5.1 Competitive Edge
Your T-Shirt! has two competitive edges that they will use to their advantage to achieve market penetration.
• Large catalog of graphics -- Your T-Shirt! is developing several strategic relationships with existing graphics companies that have an extensive images catalogs. It would be difficult and expensive for Your T-Shirt! to create their own library of graphics but by developing relationships with companies who own existing libraries, Your T-Shirt! is able to offer its customers an expansive array of imagery. Your T-Shirt! pays a royalty for use of these graphics.
• Quality of the sublimation -- Due to its networking contacts at Hewlett-Packard, and the use of prototype technolgy, Your T-Shirt! will be able to produce sublimations of much higher quality than any of their competitors. This gives Your T-Shirt! a fantastic competitive edge. At some point within the next two years this technology may be available to the public, however because of the close contacts Mr. Inkler shares with HP, Your T-Shirt! will always have cutting edge technology available, well in advance of any public release.
5.2 Marketing Strategy
The marketing campaign will seek to increase visibility for Your T-Shirt!, emphasizing the ability of the customer to completely customize their design. Your T-Shirt! will use several different venues to communicate this message.
• Advertising -- Your T-Shirt! will run ads in several teen/young adult magazines whose readership demographics are similar to Your T-Shirt!'s.
• Youth events -- Many different events will be sponsored as a means of increasing visibility. These include but are not limited to music festivals and sporting events along with the new genre of extreme sporting events.
• Student groups -- Your T-Shirt! will attempt to gain awareness of the different student groups who actively purchase shirts for their members. Awareness will be achieved through a combination of sponsorship of student organization events as well as advertisements in magazines that specifically target this demographic.
Your T-Shirt!
Page 8
5.3 Sales Strategy
The sales strategy will emphasize the fact that ordering a shirt from Your T-Shirt! is a very easy and pleasing experience. The sales effort will work on the continual development of the website, the main tool used for ordering. It will be quite important to have a friendly, easy to use web interface for two main reasons. One, there are so many choices available that it could become daunting to the customer. The second reason is that a large portion of sales will be placed on the website. It is imperative to make it so easy that people don't stop part way through ordering due to cumbersome or difficult instructions. The website embraces the philosophy of making the experience so easy and pleasing that the customer comes back to buy more.
Your T-Shirt! will also rely on three other factors to help boost sales. The first is exemplary customer service. Having excellent service will provide the customer with the feeling that the business is looking out for the customer's interest. Second, when a customer places an order, they will probably be excited to see the finished product, so Your T-Shirt! will ensure the fastest turnaround time possible. Lastly, sales will be boosted by offering customers a high quality product. We will use high grade cotton shirts and state-of-the-art sublimation printing materials.
5.3.1 Sales Forecast
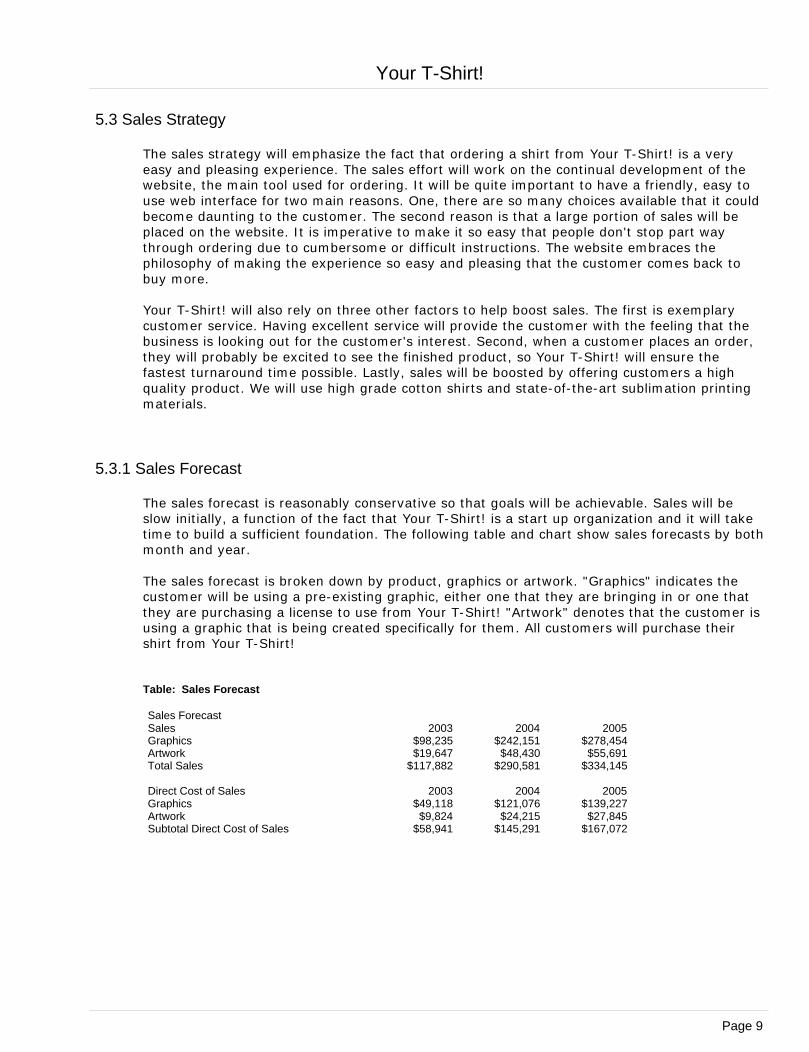
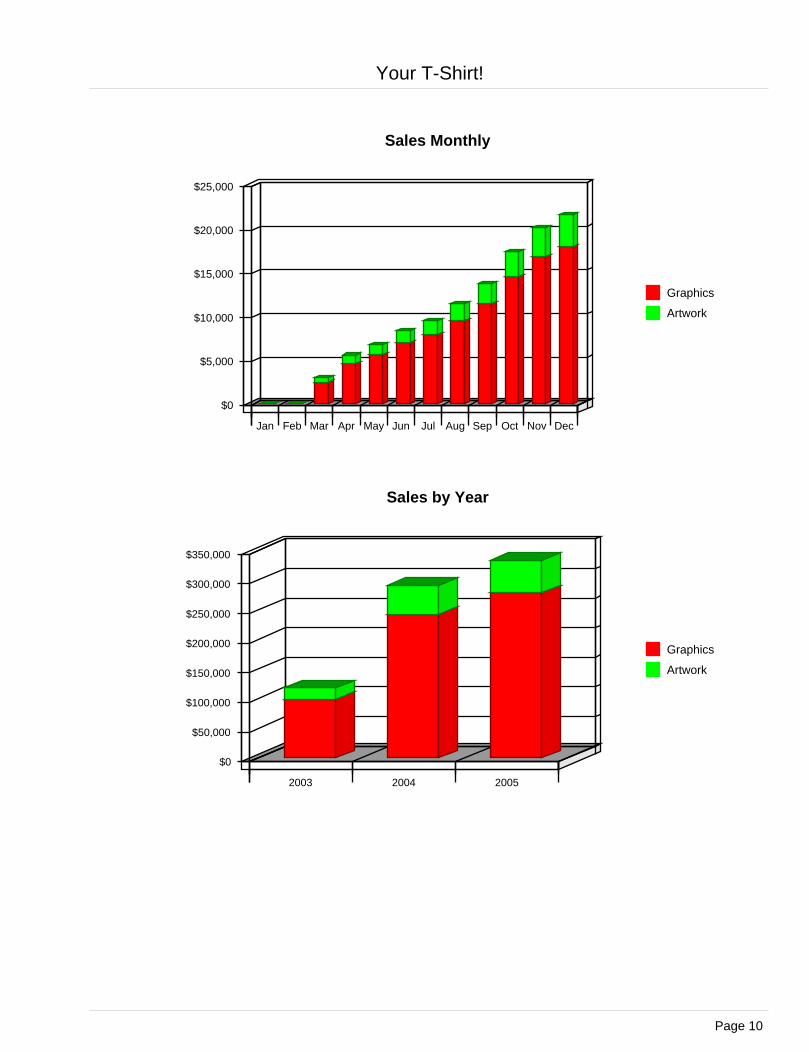
The sales forecast is reasonably conservative so that goals will be achievable. Sales will be slow initially, a function of the fact that Your T-Shirt! is a start up organization and it will take time to build a sufficient foundation. The following table and chart show sales forecasts by both month and year.
The sales forecast is broken down by product, graphics or artwork. "Graphics" indicates the customer will be using a pre-existing graphic, either one that they are bringing in or one that they are purchasing a license to use from Your T-Shirt! "Artwork" denotes that the customer is using a graphic that is being created specifically for them. All customers will purchase their shirt from Your T-Shirt!
Table: Sales Forecast
Sales ForecastSales 2003 2004 2005Graphics $98,235 $242,151 $278,454Artwork $19,647 $48,430 $55,691Total Sales $117,882 $290,581 $334,145
Direct Cost of Sales 2003 2004 2005Graphics $49,118 $121,076 $139,227Artwork $9,824 $24,215 $27,845Subtotal Direct Cost of Sales $58,941 $145,291 $167,072
Your T-Shirt!
Page 9
$0
$5,000
$10,000
$15,000
$20,000
$25,000
Jan Feb Mar Apr May Jun Jul Aug Sep Oct Nov Dec
Graphics
Artwork
Sales Monthly
$0
$50,000
$100,000
$150,000
$200,000
$250,000
$300,000
$350,000
2003 2004 2005
Graphics
Artwork
Sales by Year
Your T-Shirt!
Page 10
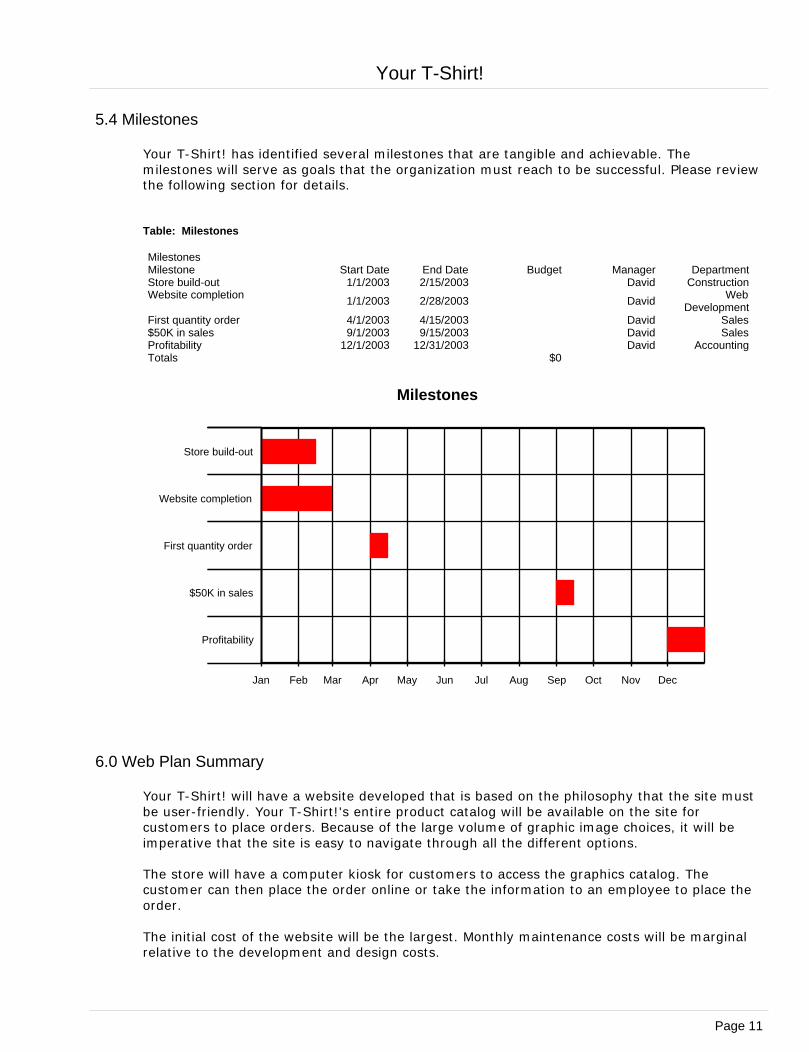
5.4 Milestones
Your T-Shirt! has identified several milestones that are tangible and achievable. The milestones will serve as goals that the organization must reach to be successful. Please review the following section for details.
Table: Milestones
MilestonesMilestone Start Date End Date Budget Manager DepartmentStore build-out 1/1/2003 2/15/2003 David ConstructionWebsite completion
1/1/2003 2/28/2003 DavidWeb
DevelopmentFirst quantity order 4/1/2003 4/15/2003 David Sales$50K in sales 9/1/2003 9/15/2003 David SalesProfitability 12/1/2003 12/31/2003 David AccountingTotals $0
Jan Feb Mar Apr May Jun Jul Aug Sep Oct Nov Dec
Store build-out
Website completion
First quantity order
$50K in sales
Profitability
Milestones
6.0 Web Plan Summary
Your T-Shirt! will have a website developed that is based on the philosophy that the site must be user-friendly. Your T-Shirt!'s entire product catalog will be available on the site for customers to place orders. Because of the large volume of graphic image choices, it will be imperative that the site is easy to navigate through all the different options.
The store will have a computer kiosk for customers to access the graphics catalog. The customer can then place the order online or take the information to an employee to place the order.
The initial cost of the website will be the largest. Monthly maintenance costs will be marginal relative to the development and design costs.
Your T-Shirt!
Page 11
6.1 Website Marketing Strategy
The website will be integral in Your T-Shirt!'s marketing effort as the site is a key sales tool for both local and distant customers. The URL address will always be used in promotional material, encouraging people to check out the company, concept, and the products. In additional to inclusion in the traditional marketing campaigns, Your T-Shirt! will submit their website to a variety of search engines, significantly increasing the number of inquiries from people searching out custom shirts.
6.2 Development Requirements
A computer programmer/designer has been identified as a candidate to manage the design, implementation, and maintenance of the website. The majority of the tasks will be completed by him, a few tasks that are outside of his skill set will be subcontracted to hsi associates.
7.0 Management Summary
Your T-Shirt! has been founded and will be led by David Inkler. David received his undergraduate degree in accounting/marketing from Seattle University. Upon graduation David moved down to Corvallis, Oregon and worked with Hewlett-Packard in their printer division. David spent three years with HP as a product marketing specialist, providing marketing assistance at a national level as well as being responsible for more grass roots, event specific marketing.
Recognizing that he did not want to spend the rest of his life working for someone else and recognizing that he did not have a sufficient skill set to start his own company yet, David enrolled in the University of Washington's MBA program. David did a cost benefit analysis and determined that it would be wise to take on debt and forgo two years of wages to be able to pursue his dream of opening his own business.
The completion of the MBA program forced David to then make some significant decisions regarding what business he wanted to start. While in college David had a few years of experience with t-shirts making and selling tie-dyed shirts to friends and at various music events. Within that niche, David quickly got a sense of what his customers wanted in tie-dyed t-shirts. Making the tie-dyes also gave David an outlet for his creativity.
When working for HP David became quite good friends with several of the unit leaders. It was these relationships that provided David with the opportunity to use cutting edge technology for his t-shirts. HP had been working on sublimation technology for several years, continually trying to increase the resolution quality. HP saw David's business idea as an excellent marketing project to test the technology and the business model. David and HP entered into an agreement where David would receive HP's latest equipment and in return David would provide HP with a wealth of product and marketing feedback. This appeared to be a win-win situation.
David's idea of developing a custom t-shirt printing business was a marriage of his business skills, his previous t-shirt experience, the leveraging of exclusive cutting-edge technology and his creativity. The more he thought about it the more he was convinced that this idea would satisfy his need for a challenging yet enjoyable job/business.
Your T-Shirt!
Page 12
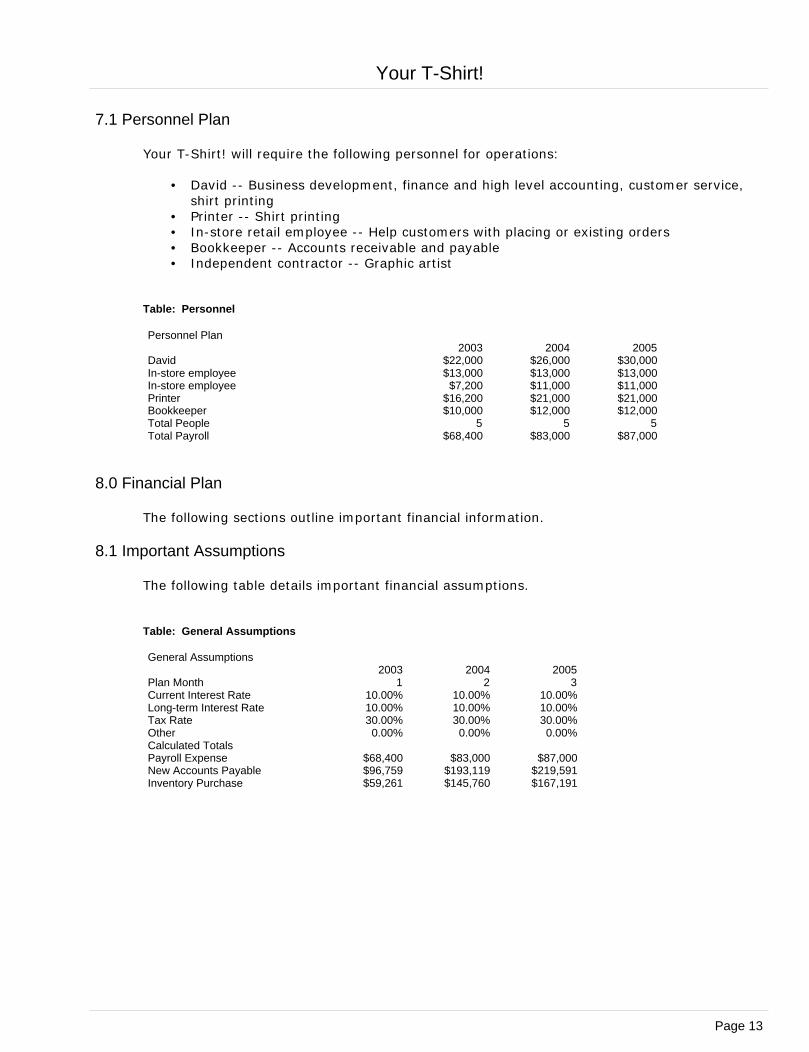
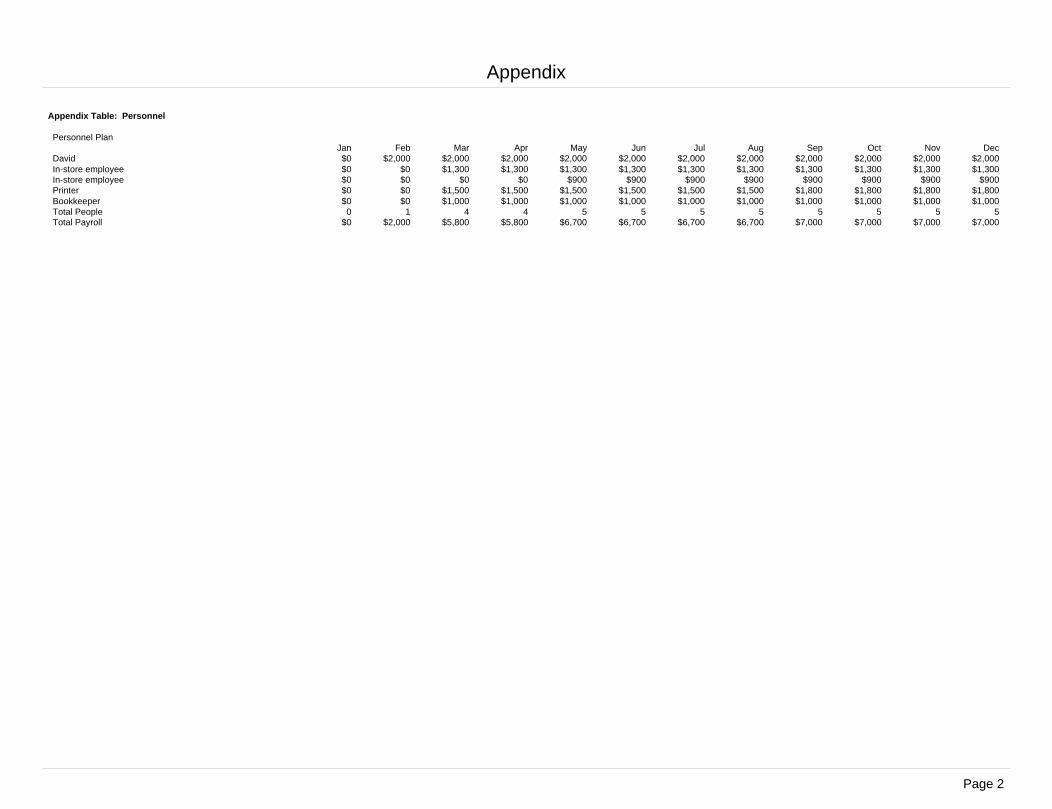
7.1 Personnel Plan
Your T-Shirt! will require the following personnel for operations:
• David -- Business development, finance and high level accounting, customer service, shirt printing
• Printer -- Shirt printing• In-store retail employee -- Help customers with placing or existing orders• Bookkeeper -- Accounts receivable and payable• Independent contractor -- Graphic artist
Table: Personnel
Personnel Plan2003 2004 2005
David $22,000 $26,000 $30,000In-store employee $13,000 $13,000 $13,000In-store employee $7,200 $11,000 $11,000Printer $16,200 $21,000 $21,000Bookkeeper $10,000 $12,000 $12,000Total People 5 5 5Total Payroll $68,400 $83,000 $87,000
8.0 Financial Plan
The following sections outline important financial information.
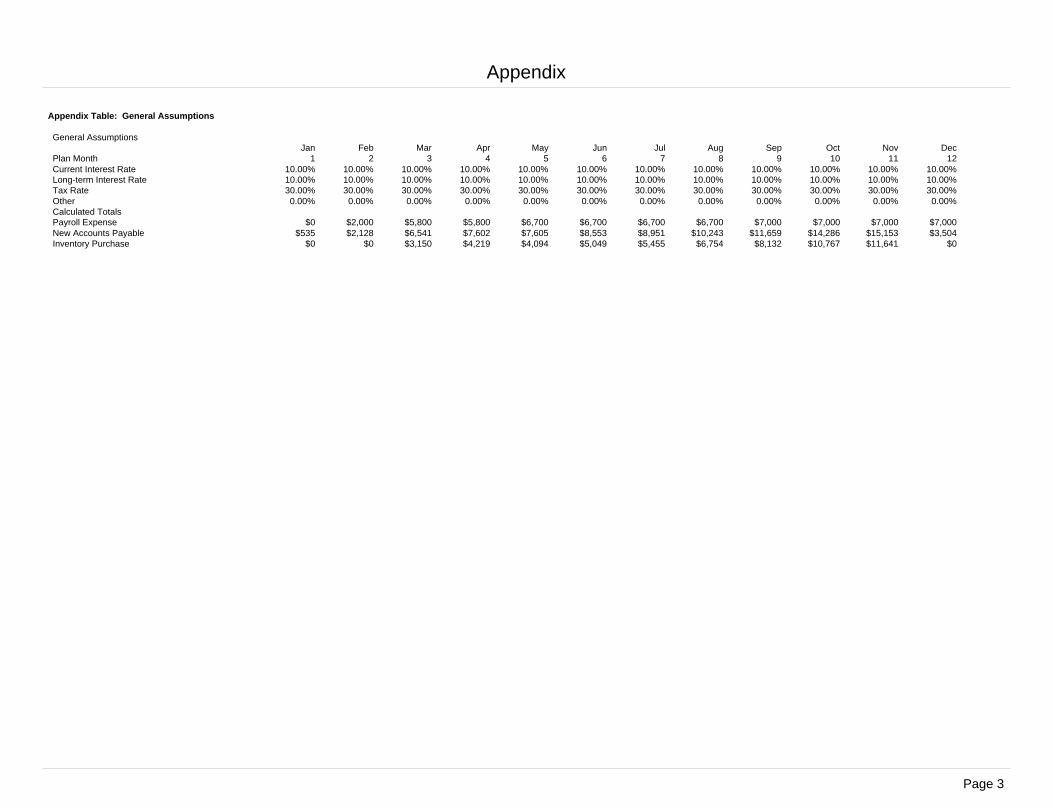
8.1 Important Assumptions
The following table details important financial assumptions.
Table: General Assumptions
General Assumptions2003 2004 2005
Plan Month 1 2 3Current Interest Rate 10.00% 10.00% 10.00%Long-term Interest Rate 10.00% 10.00% 10.00%Tax Rate 30.00% 30.00% 30.00%Other 0.00% 0.00% 0.00%Calculated TotalsPayroll Expense $68,400 $83,000 $87,000New Accounts Payable $96,759 $193,119 $219,591Inventory Purchase $59,261 $145,760 $167,191
Your T-Shirt!
Page 13
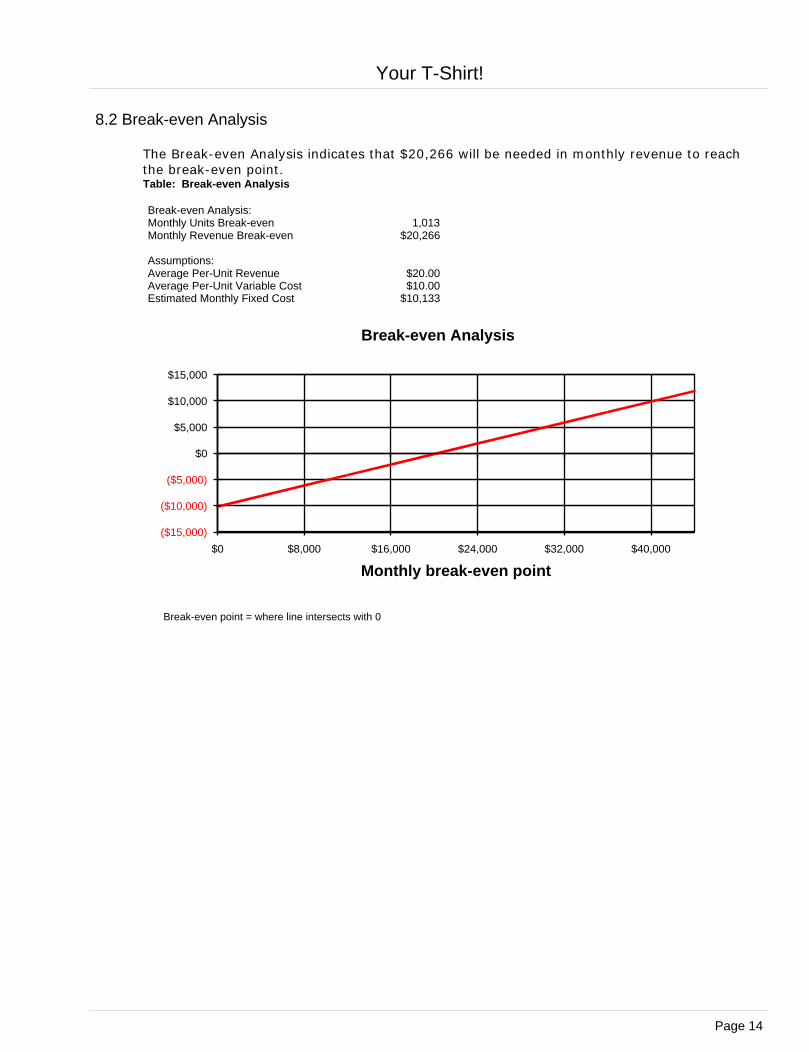
8.2 Break-even Analysis
The Break-even Analysis indicates that $20,266 will be needed in monthly revenue to reach the break-even point.Table: Break-even Analysis
Break-even Analysis:Monthly Units Break-even 1,013Monthly Revenue Break-even $20,266
Assumptions:Average Per-Unit Revenue $20.00Average Per-Unit Variable Cost $10.00Estimated Monthly Fixed Cost $10,133
($15,000)
($10,000)
($5,000)
$0
$5,000
$10,000
$15,000
$0 $8,000 $16,000 $24,000 $32,000 $40,000
Monthly break-even point
Break-even point = where line intersects with 0
Break-even Analysis
Your T-Shirt!
Page 14
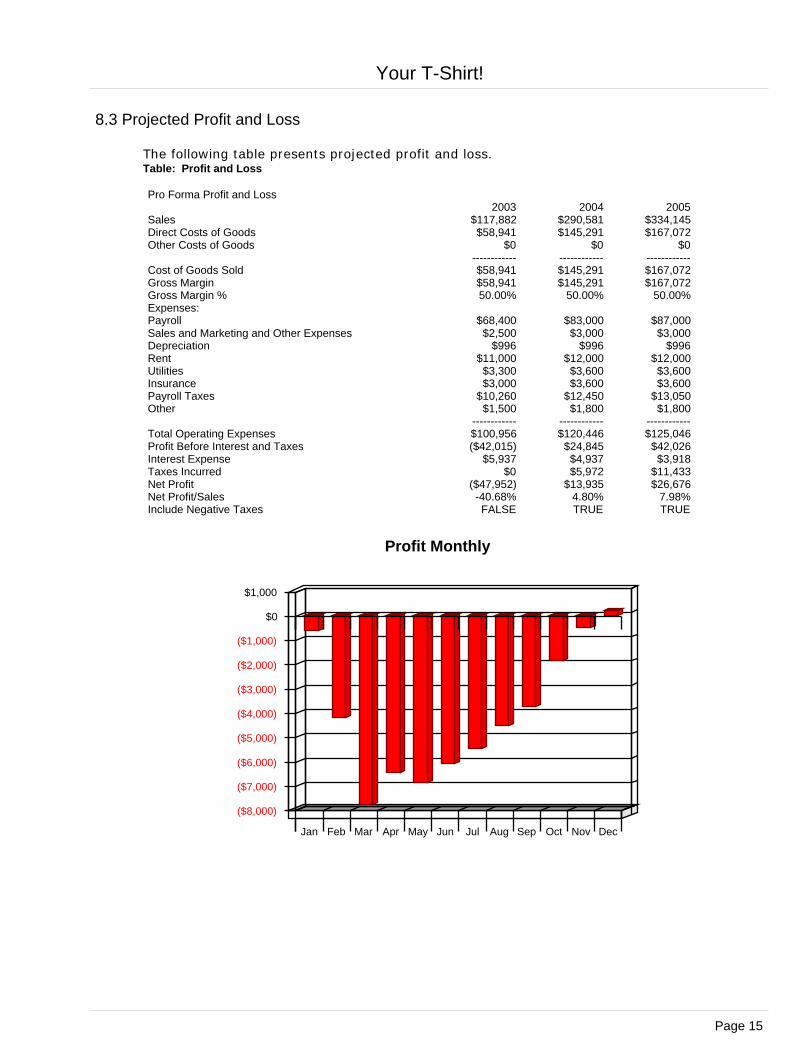
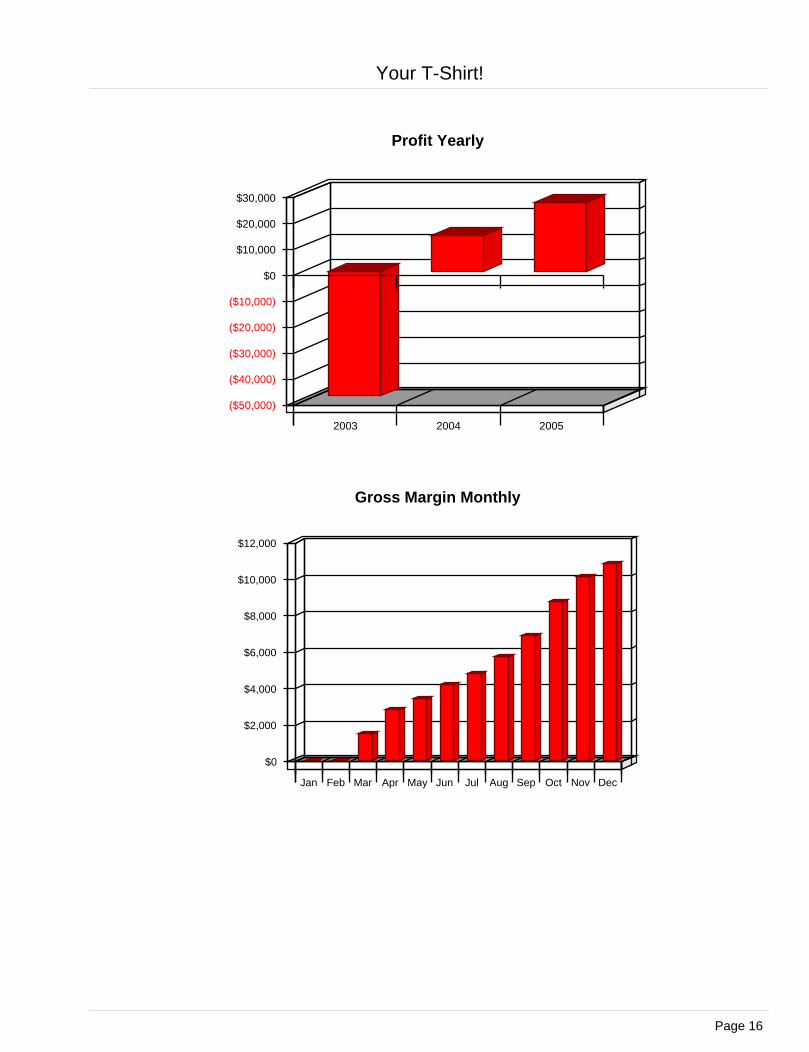
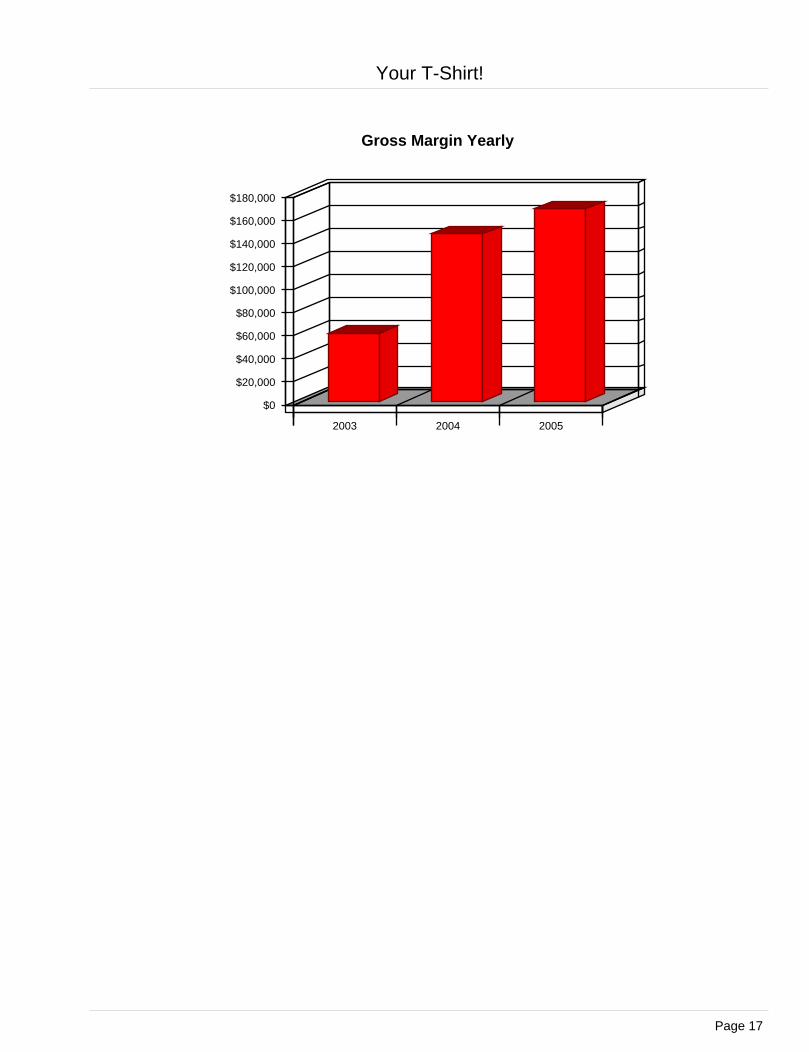
8.3 Projected Profit and Loss
The following table presents projected profit and loss.Table: Profit and Loss
Pro Forma Profit and Loss2003 2004 2005
Sales $117,882 $290,581 $334,145Direct Costs of Goods $58,941 $145,291 $167,072Other Costs of Goods $0 $0 $0
------------ ------------ ------------Cost of Goods Sold $58,941 $145,291 $167,072Gross Margin $58,941 $145,291 $167,072Gross Margin % 50.00% 50.00% 50.00%Expenses:Payroll $68,400 $83,000 $87,000Sales and Marketing and Other Expenses $2,500 $3,000 $3,000Depreciation $996 $996 $996Rent $11,000 $12,000 $12,000Utilities $3,300 $3,600 $3,600Insurance $3,000 $3,600 $3,600Payroll Taxes $10,260 $12,450 $13,050Other $1,500 $1,800 $1,800
------------ ------------ ------------Total Operating Expenses $100,956 $120,446 $125,046Profit Before Interest and Taxes ($42,015) $24,845 $42,026Interest Expense $5,937 $4,937 $3,918Taxes Incurred $0 $5,972 $11,433Net Profit ($47,952) $13,935 $26,676Net Profit/Sales -40.68% 4.80% 7.98%Include Negative Taxes FALSE TRUE TRUE
($8,000)
($7,000)
($6,000)
($5,000)
($4,000)
($3,000)
($2,000)
($1,000)
$0
$1,000
Jan Feb Mar Apr May Jun Jul Aug Sep Oct Nov Dec
Profit Monthly
Your T-Shirt!
Page 15
($50,000)
($40,000)
($30,000)
($20,000)
($10,000)
$0
$10,000
$20,000
$30,000
2003 2004 2005
Profit Yearly
$0
$2,000
$4,000
$6,000
$8,000
$10,000
$12,000
Jan Feb Mar Apr May Jun Jul Aug Sep Oct Nov Dec
Gross Margin Monthly
Your T-Shirt!
Page 16
$0
$20,000
$40,000
$60,000
$80,000
$100,000
$120,000
$140,000
$160,000
$180,000
2003 2004 2005
Gross Margin Yearly
Your T-Shirt!
Page 17
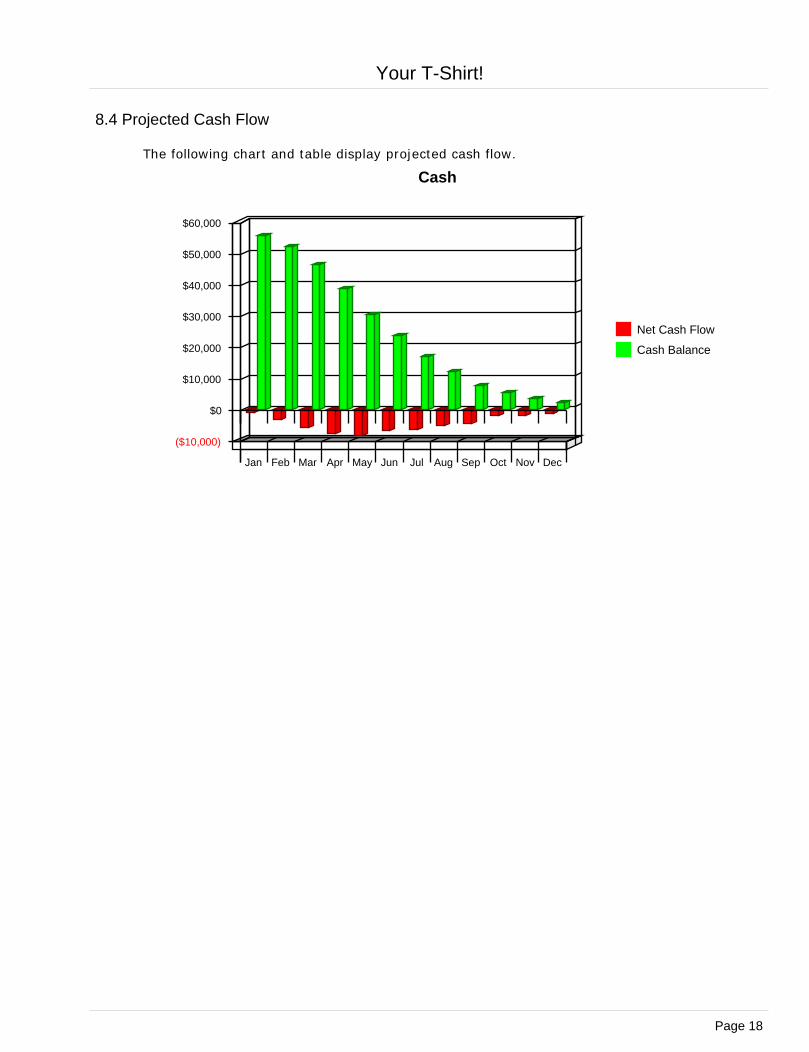
8.4 Projected Cash Flow
The following chart and table display projected cash flow.
($10,000)
$0
$10,000
$20,000
$30,000
$40,000
$50,000
$60,000
Jan Feb Mar Apr May Jun Jul Aug Sep Oct Nov Dec
Net Cash Flow
Cash Balance
Cash
Your T-Shirt!
Page 18
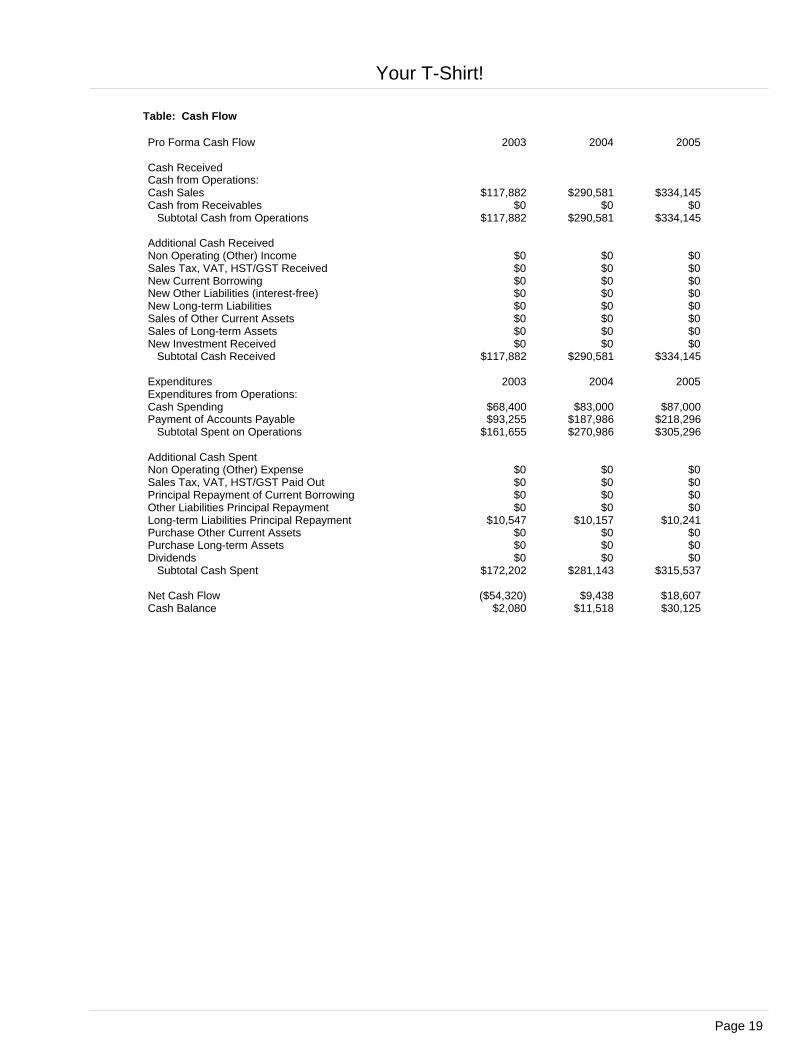
Table: Cash Flow
Pro Forma Cash Flow 2003 2004 2005
Cash ReceivedCash from Operations: Cash Sales $117,882 $290,581 $334,145Cash from Receivables $0 $0 $0 Subtotal Cash from Operations $117,882 $290,581 $334,145
Additional Cash ReceivedNon Operating (Other) Income $0 $0 $0Sales Tax, VAT, HST/GST Received $0 $0 $0New Current Borrowing $0 $0 $0New Other Liabilities (interest-free) $0 $0 $0New Long-term Liabilities $0 $0 $0Sales of Other Current Assets $0 $0 $0Sales of Long-term Assets $0 $0 $0New Investment Received $0 $0 $0 Subtotal Cash Received $117,882 $290,581 $334,145
Expenditures 2003 2004 2005Expenditures from Operations:Cash Spending $68,400 $83,000 $87,000Payment of Accounts Payable $93,255 $187,986 $218,296 Subtotal Spent on Operations $161,655 $270,986 $305,296
Additional Cash SpentNon Operating (Other) Expense $0 $0 $0Sales Tax, VAT, HST/GST Paid Out $0 $0 $0Principal Repayment of Current Borrowing $0 $0 $0Other Liabilities Principal Repayment $0 $0 $0Long-term Liabilities Principal Repayment $10,547 $10,157 $10,241Purchase Other Current Assets $0 $0 $0Purchase Long-term Assets $0 $0 $0Dividends $0 $0 $0 Subtotal Cash Spent $172,202 $281,143 $315,537
Net Cash Flow ($54,320) $9,438 $18,607Cash Balance $2,080 $11,518 $30,125
Your T-Shirt!
Page 19
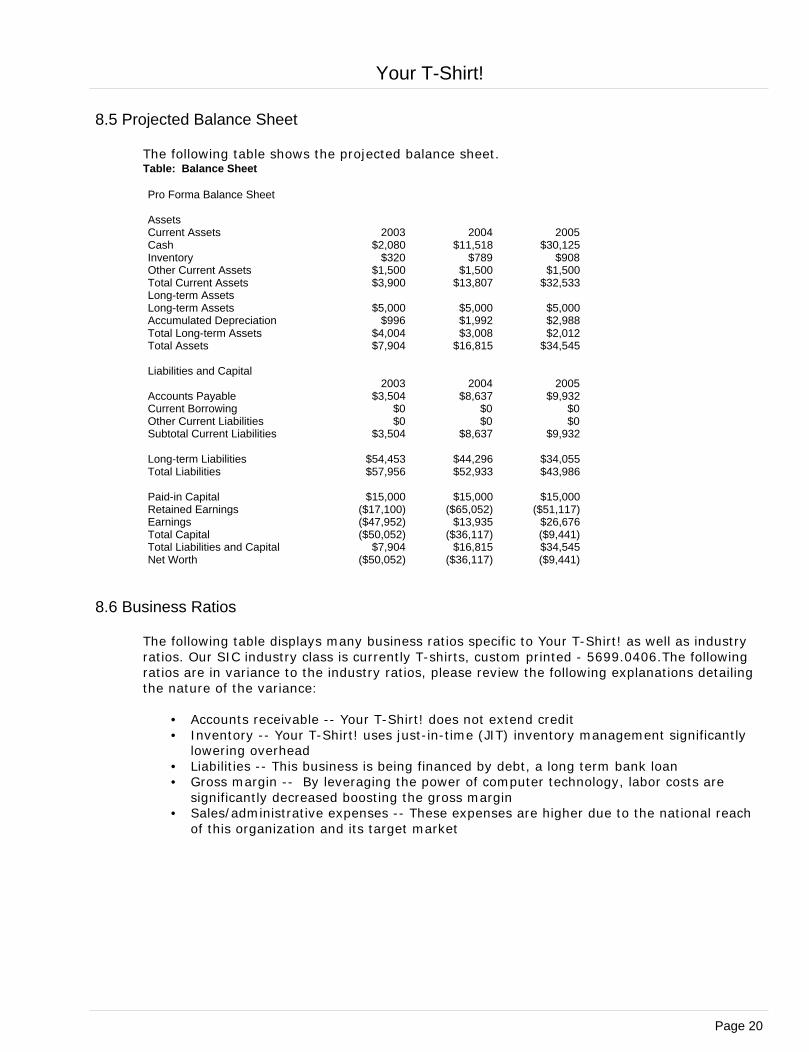
8.5 Projected Balance Sheet
The following table shows the projected balance sheet.Table: Balance Sheet
Pro Forma Balance Sheet
AssetsCurrent Assets 2003 2004 2005Cash $2,080 $11,518 $30,125Inventory $320 $789 $908Other Current Assets $1,500 $1,500 $1,500Total Current Assets $3,900 $13,807 $32,533Long-term AssetsLong-term Assets $5,000 $5,000 $5,000Accumulated Depreciation $996 $1,992 $2,988Total Long-term Assets $4,004 $3,008 $2,012Total Assets $7,904 $16,815 $34,545
Liabilities and Capital2003 2004 2005
Accounts Payable $3,504 $8,637 $9,932Current Borrowing $0 $0 $0Other Current Liabilities $0 $0 $0Subtotal Current Liabilities $3,504 $8,637 $9,932
Long-term Liabilities $54,453 $44,296 $34,055Total Liabilities $57,956 $52,933 $43,986
Paid-in Capital $15,000 $15,000 $15,000Retained Earnings ($17,100) ($65,052) ($51,117)Earnings ($47,952) $13,935 $26,676Total Capital ($50,052) ($36,117) ($9,441)Total Liabilities and Capital $7,904 $16,815 $34,545Net Worth ($50,052) ($36,117) ($9,441)
8.6 Business Ratios
The following table displays many business ratios specific to Your T-Shirt! as well as industry ratios. Our SIC industry class is currently T-shirts, custom printed - 5699.0406. The following ratios are in variance to the industry ratios, please review the following explanations detailing the nature of the variance:
• Accounts receivable -- Your T-Shirt! does not extend credit• Inventory -- Your T-Shirt! uses just-in-time (JIT) inventory management significantly
lowering overhead• Liabilities -- This business is being financed by debt, a long term bank loan• Gross margin -- By leveraging the power of computer technology, labor costs are
significantly decreased boosting the gross margin• Sales/administrative expenses -- These expenses are higher due to the national reach
of this organization and its target market
Your T-Shirt!
Page 20
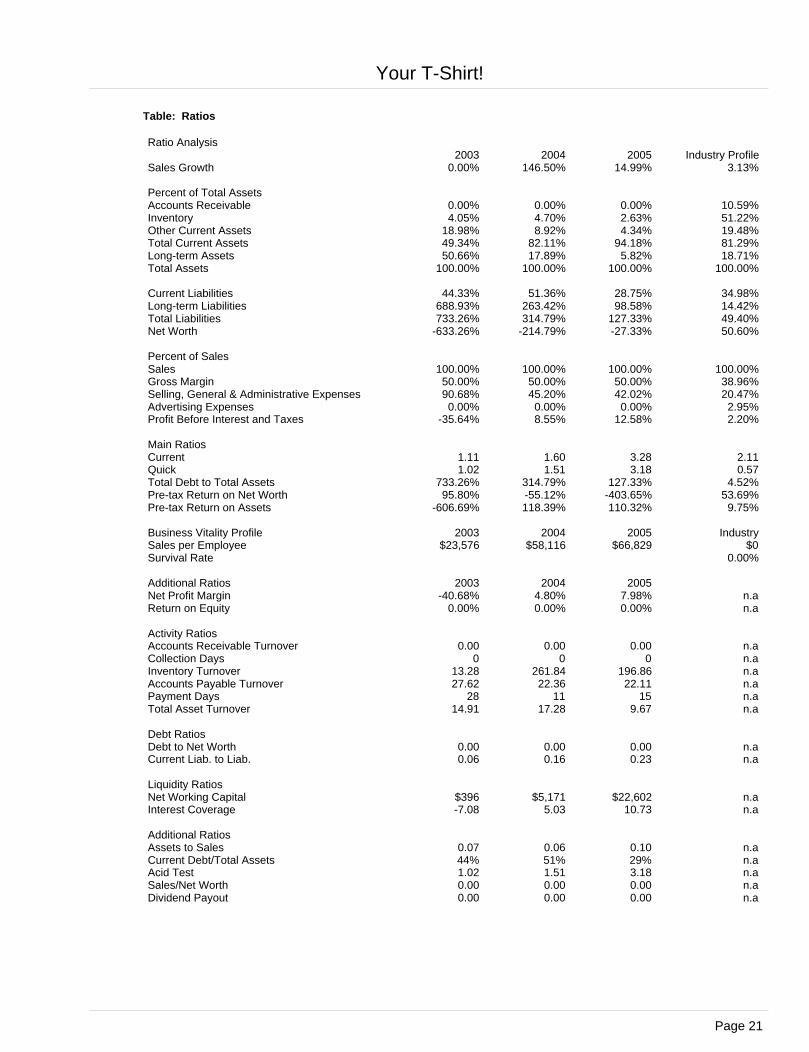
Table: Ratios
Ratio Analysis2003 2004 2005 Industry Profile
Sales Growth 0.00% 146.50% 14.99% 3.13%
Percent of Total AssetsAccounts Receivable 0.00% 0.00% 0.00% 10.59%Inventory 4.05% 4.70% 2.63% 51.22%Other Current Assets 18.98% 8.92% 4.34% 19.48%Total Current Assets 49.34% 82.11% 94.18% 81.29%Long-term Assets 50.66% 17.89% 5.82% 18.71%Total Assets 100.00% 100.00% 100.00% 100.00%
Current Liabilities 44.33% 51.36% 28.75% 34.98%Long-term Liabilities 688.93% 263.42% 98.58% 14.42%Total Liabilities 733.26% 314.79% 127.33% 49.40%Net Worth -633.26% -214.79% -27.33% 50.60%
Percent of SalesSales 100.00% 100.00% 100.00% 100.00%Gross Margin 50.00% 50.00% 50.00% 38.96%Selling, General & Administrative Expenses 90.68% 45.20% 42.02% 20.47%Advertising Expenses 0.00% 0.00% 0.00% 2.95%Profit Before Interest and Taxes -35.64% 8.55% 12.58% 2.20%
Main RatiosCurrent 1.11 1.60 3.28 2.11Quick 1.02 1.51 3.18 0.57Total Debt to Total Assets 733.26% 314.79% 127.33% 4.52%Pre-tax Return on Net Worth 95.80% -55.12% -403.65% 53.69%Pre-tax Return on Assets -606.69% 118.39% 110.32% 9.75%
Business Vitality Profile 2003 2004 2005 IndustrySales per Employee $23,576 $58,116 $66,829 $0Survival Rate 0.00%
Additional Ratios 2003 2004 2005Net Profit Margin -40.68% 4.80% 7.98% n.aReturn on Equity 0.00% 0.00% 0.00% n.a
Activity RatiosAccounts Receivable Turnover 0.00 0.00 0.00 n.aCollection Days 0 0 0 n.aInventory Turnover 13.28 261.84 196.86 n.aAccounts Payable Turnover 27.62 22.36 22.11 n.aPayment Days 28 11 15 n.aTotal Asset Turnover 14.91 17.28 9.67 n.a
Debt RatiosDebt to Net Worth 0.00 0.00 0.00 n.aCurrent Liab. to Liab. 0.06 0.16 0.23 n.a
Liquidity RatiosNet Working Capital $396 $5,171 $22,602 n.aInterest Coverage -7.08 5.03 10.73 n.a
Additional RatiosAssets to Sales 0.07 0.06 0.10 n.aCurrent Debt/Total Assets 44% 51% 29% n.aAcid Test 1.02 1.51 3.18 n.aSales/Net Worth 0.00 0.00 0.00 n.aDividend Payout 0.00 0.00 0.00 n.a
Your T-Shirt!
Page 21
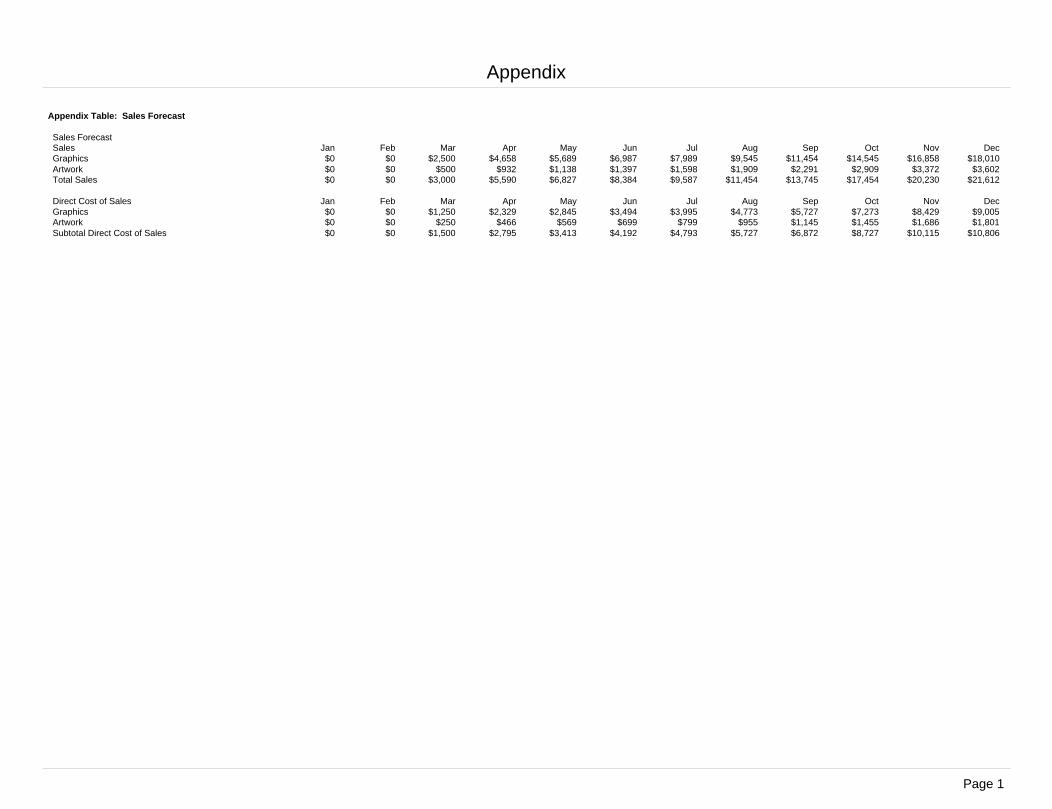
Appendix Table: Sales Forecast
Sales ForecastSales Jan Feb Mar Apr May Jun Jul Aug Sep Oct Nov DecGraphics $0 $0 $2,500 $4,658 $5,689 $6,987 $7,989 $9,545 $11,454 $14,545 $16,858 $18,010Artwork $0 $0 $500 $932 $1,138 $1,397 $1,598 $1,909 $2,291 $2,909 $3,372 $3,602Total Sales $0 $0 $3,000 $5,590 $6,827 $8,384 $9,587 $11,454 $13,745 $17,454 $20,230 $21,612
Direct Cost of Sales Jan Feb Mar Apr May Jun Jul Aug Sep Oct Nov DecGraphics $0 $0 $1,250 $2,329 $2,845 $3,494 $3,995 $4,773 $5,727 $7,273 $8,429 $9,005Artwork $0 $0 $250 $466 $569 $699 $799 $955 $1,145 $1,455 $1,686 $1,801Subtotal Direct Cost of Sales $0 $0 $1,500 $2,795 $3,413 $4,192 $4,793 $5,727 $6,872 $8,727 $10,115 $10,806
Appendix
Page 1
Appendix Table: Personnel
Personnel PlanJan Feb Mar Apr May Jun Jul Aug Sep Oct Nov Dec
David $0 $2,000 $2,000 $2,000 $2,000 $2,000 $2,000 $2,000 $2,000 $2,000 $2,000 $2,000In-store employee $0 $0 $1,300 $1,300 $1,300 $1,300 $1,300 $1,300 $1,300 $1,300 $1,300 $1,300In-store employee $0 $0 $0 $0 $900 $900 $900 $900 $900 $900 $900 $900Printer $0 $0 $1,500 $1,500 $1,500 $1,500 $1,500 $1,500 $1,800 $1,800 $1,800 $1,800Bookkeeper $0 $0 $1,000 $1,000 $1,000 $1,000 $1,000 $1,000 $1,000 $1,000 $1,000 $1,000Total People 0 1 4 4 5 5 5 5 5 5 5 5Total Payroll $0 $2,000 $5,800 $5,800 $6,700 $6,700 $6,700 $6,700 $7,000 $7,000 $7,000 $7,000
Appendix
Page 2
Appendix Table: General Assumptions
General AssumptionsJan Feb Mar Apr May Jun Jul Aug Sep Oct Nov Dec
Plan Month 1 2 3 4 5 6 7 8 9 10 11 12Current Interest Rate 10.00% 10.00% 10.00% 10.00% 10.00% 10.00% 10.00% 10.00% 10.00% 10.00% 10.00% 10.00%Long-term Interest Rate 10.00% 10.00% 10.00% 10.00% 10.00% 10.00% 10.00% 10.00% 10.00% 10.00% 10.00% 10.00%Tax Rate 30.00% 30.00% 30.00% 30.00% 30.00% 30.00% 30.00% 30.00% 30.00% 30.00% 30.00% 30.00%Other 0.00% 0.00% 0.00% 0.00% 0.00% 0.00% 0.00% 0.00% 0.00% 0.00% 0.00% 0.00%Calculated TotalsPayroll Expense $0 $2,000 $5,800 $5,800 $6,700 $6,700 $6,700 $6,700 $7,000 $7,000 $7,000 $7,000New Accounts Payable $535 $2,128 $6,541 $7,602 $7,605 $8,553 $8,951 $10,243 $11,659 $14,286 $15,153 $3,504Inventory Purchase $0 $0 $3,150 $4,219 $4,094 $5,049 $5,455 $6,754 $8,132 $10,767 $11,641 $0
Appendix
Page 3
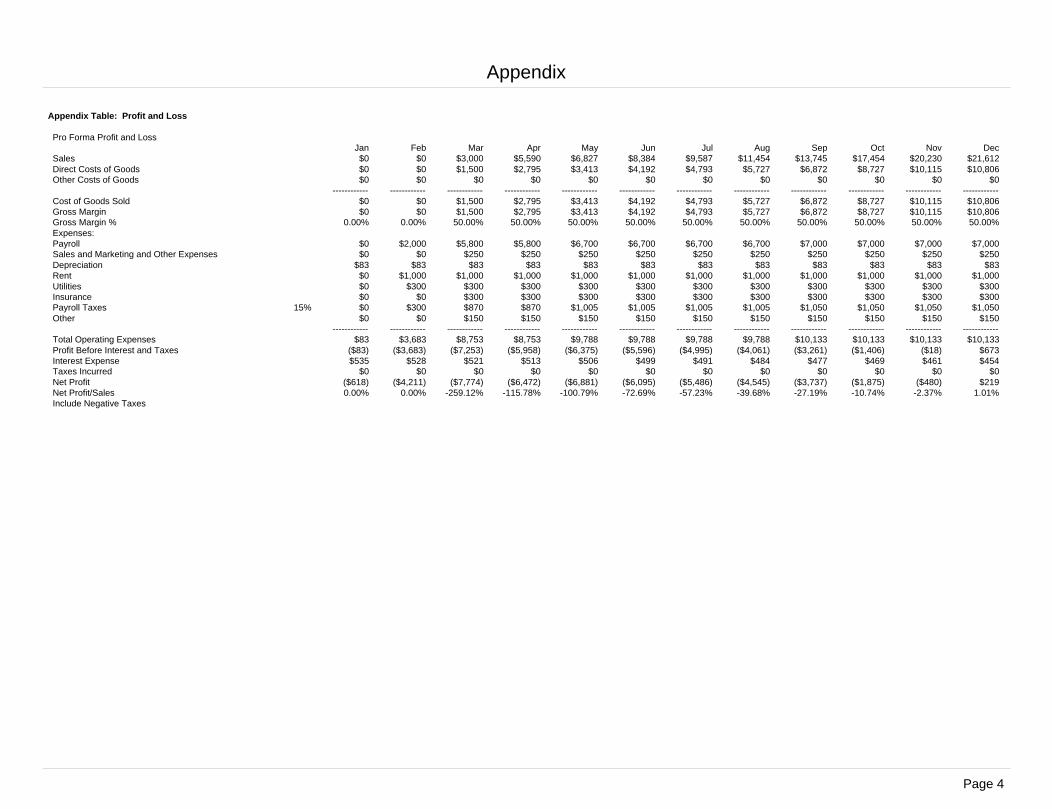
Appendix Table: Profit and Loss
Pro Forma Profit and LossJan Feb Mar Apr May Jun Jul Aug Sep Oct Nov Dec
Sales $0 $0 $3,000 $5,590 $6,827 $8,384 $9,587 $11,454 $13,745 $17,454 $20,230 $21,612Direct Costs of Goods $0 $0 $1,500 $2,795 $3,413 $4,192 $4,793 $5,727 $6,872 $8,727 $10,115 $10,806Other Costs of Goods $0 $0 $0 $0 $0 $0 $0 $0 $0 $0 $0 $0
------------ ------------ ------------ ------------ ------------ ------------ ------------ ------------ ------------ ------------ ------------ ------------Cost of Goods Sold $0 $0 $1,500 $2,795 $3,413 $4,192 $4,793 $5,727 $6,872 $8,727 $10,115 $10,806Gross Margin $0 $0 $1,500 $2,795 $3,413 $4,192 $4,793 $5,727 $6,872 $8,727 $10,115 $10,806Gross Margin % 0.00% 0.00% 50.00% 50.00% 50.00% 50.00% 50.00% 50.00% 50.00% 50.00% 50.00% 50.00%Expenses:Payroll $0 $2,000 $5,800 $5,800 $6,700 $6,700 $6,700 $6,700 $7,000 $7,000 $7,000 $7,000Sales and Marketing and Other Expenses $0 $0 $250 $250 $250 $250 $250 $250 $250 $250 $250 $250Depreciation $83 $83 $83 $83 $83 $83 $83 $83 $83 $83 $83 $83Rent $0 $1,000 $1,000 $1,000 $1,000 $1,000 $1,000 $1,000 $1,000 $1,000 $1,000 $1,000Utilities $0 $300 $300 $300 $300 $300 $300 $300 $300 $300 $300 $300Insurance $0 $0 $300 $300 $300 $300 $300 $300 $300 $300 $300 $300Payroll Taxes 15% $0 $300 $870 $870 $1,005 $1,005 $1,005 $1,005 $1,050 $1,050 $1,050 $1,050Other $0 $0 $150 $150 $150 $150 $150 $150 $150 $150 $150 $150
------------ ------------ ------------ ------------ ------------ ------------ ------------ ------------ ------------ ------------ ------------ ------------Total Operating Expenses $83 $3,683 $8,753 $8,753 $9,788 $9,788 $9,788 $9,788 $10,133 $10,133 $10,133 $10,133Profit Before Interest and Taxes ($83) ($3,683) ($7,253) ($5,958) ($6,375) ($5,596) ($4,995) ($4,061) ($3,261) ($1,406) ($18) $673Interest Expense $535 $528 $521 $513 $506 $499 $491 $484 $477 $469 $461 $454Taxes Incurred $0 $0 $0 $0 $0 $0 $0 $0 $0 $0 $0 $0Net Profit ($618) ($4,211) ($7,774) ($6,472) ($6,881) ($6,095) ($5,486) ($4,545) ($3,737) ($1,875) ($480) $219Net Profit/Sales 0.00% 0.00% -259.12% -115.78% -100.79% -72.69% -57.23% -39.68% -27.19% -10.74% -2.37% 1.01%Include Negative Taxes
Appendix
Page 4
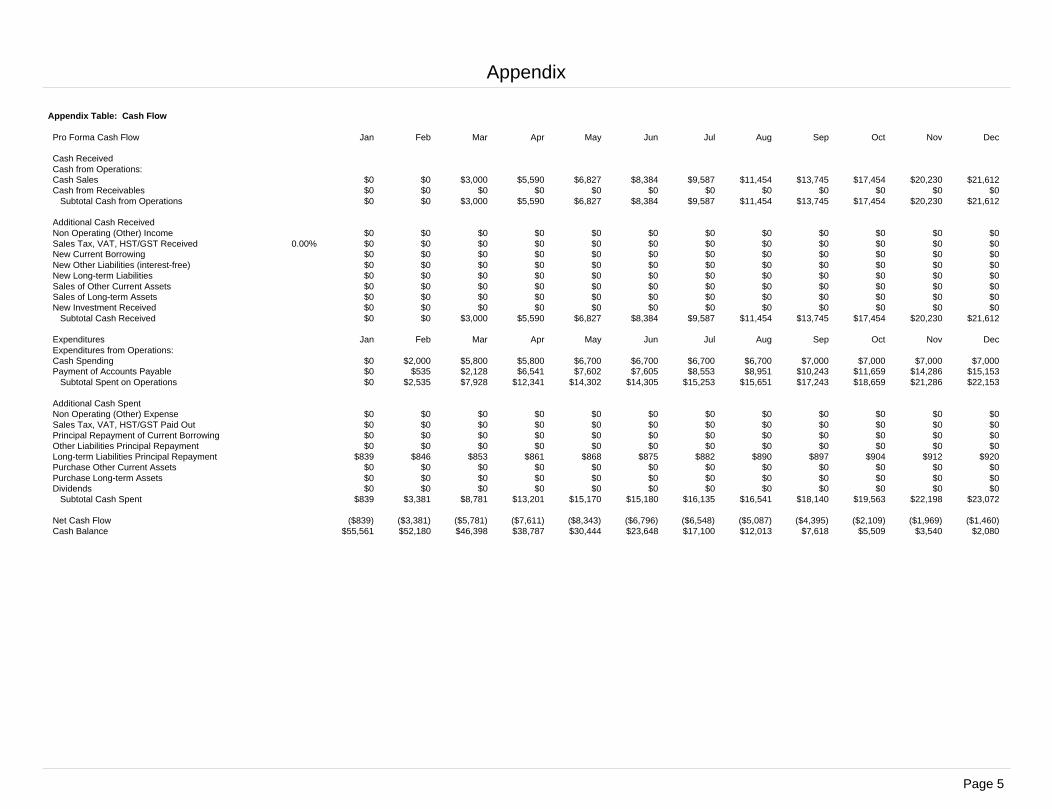
Appendix Table: Cash Flow
Pro Forma Cash Flow Jan Feb Mar Apr May Jun Jul Aug Sep Oct Nov Dec
Cash ReceivedCash from Operations: Cash Sales $0 $0 $3,000 $5,590 $6,827 $8,384 $9,587 $11,454 $13,745 $17,454 $20,230 $21,612Cash from Receivables $0 $0 $0 $0 $0 $0 $0 $0 $0 $0 $0 $0 Subtotal Cash from Operations $0 $0 $3,000 $5,590 $6,827 $8,384 $9,587 $11,454 $13,745 $17,454 $20,230 $21,612
Additional Cash ReceivedNon Operating (Other) Income $0 $0 $0 $0 $0 $0 $0 $0 $0 $0 $0 $0Sales Tax, VAT, HST/GST Received 0.00% $0 $0 $0 $0 $0 $0 $0 $0 $0 $0 $0 $0New Current Borrowing $0 $0 $0 $0 $0 $0 $0 $0 $0 $0 $0 $0New Other Liabilities (interest-free) $0 $0 $0 $0 $0 $0 $0 $0 $0 $0 $0 $0New Long-term Liabilities $0 $0 $0 $0 $0 $0 $0 $0 $0 $0 $0 $0Sales of Other Current Assets $0 $0 $0 $0 $0 $0 $0 $0 $0 $0 $0 $0Sales of Long-term Assets $0 $0 $0 $0 $0 $0 $0 $0 $0 $0 $0 $0New Investment Received $0 $0 $0 $0 $0 $0 $0 $0 $0 $0 $0 $0 Subtotal Cash Received $0 $0 $3,000 $5,590 $6,827 $8,384 $9,587 $11,454 $13,745 $17,454 $20,230 $21,612
Expenditures Jan Feb Mar Apr May Jun Jul Aug Sep Oct Nov DecExpenditures from Operations:Cash Spending $0 $2,000 $5,800 $5,800 $6,700 $6,700 $6,700 $6,700 $7,000 $7,000 $7,000 $7,000Payment of Accounts Payable $0 $535 $2,128 $6,541 $7,602 $7,605 $8,553 $8,951 $10,243 $11,659 $14,286 $15,153 Subtotal Spent on Operations $0 $2,535 $7,928 $12,341 $14,302 $14,305 $15,253 $15,651 $17,243 $18,659 $21,286 $22,153
Additional Cash SpentNon Operating (Other) Expense $0 $0 $0 $0 $0 $0 $0 $0 $0 $0 $0 $0Sales Tax, VAT, HST/GST Paid Out $0 $0 $0 $0 $0 $0 $0 $0 $0 $0 $0 $0Principal Repayment of Current Borrowing $0 $0 $0 $0 $0 $0 $0 $0 $0 $0 $0 $0Other Liabilities Principal Repayment $0 $0 $0 $0 $0 $0 $0 $0 $0 $0 $0 $0Long-term Liabilities Principal Repayment $839 $846 $853 $861 $868 $875 $882 $890 $897 $904 $912 $920Purchase Other Current Assets $0 $0 $0 $0 $0 $0 $0 $0 $0 $0 $0 $0Purchase Long-term Assets $0 $0 $0 $0 $0 $0 $0 $0 $0 $0 $0 $0Dividends $0 $0 $0 $0 $0 $0 $0 $0 $0 $0 $0 $0 Subtotal Cash Spent $839 $3,381 $8,781 $13,201 $15,170 $15,180 $16,135 $16,541 $18,140 $19,563 $22,198 $23,072
Net Cash Flow ($839) ($3,381) ($5,781) ($7,611) ($8,343) ($6,796) ($6,548) ($5,087) ($4,395) ($2,109) ($1,969) ($1,460)Cash Balance $55,561 $52,180 $46,398 $38,787 $30,444 $23,648 $17,100 $12,013 $7,618 $5,509 $3,540 $2,080
Appendix
Page 5
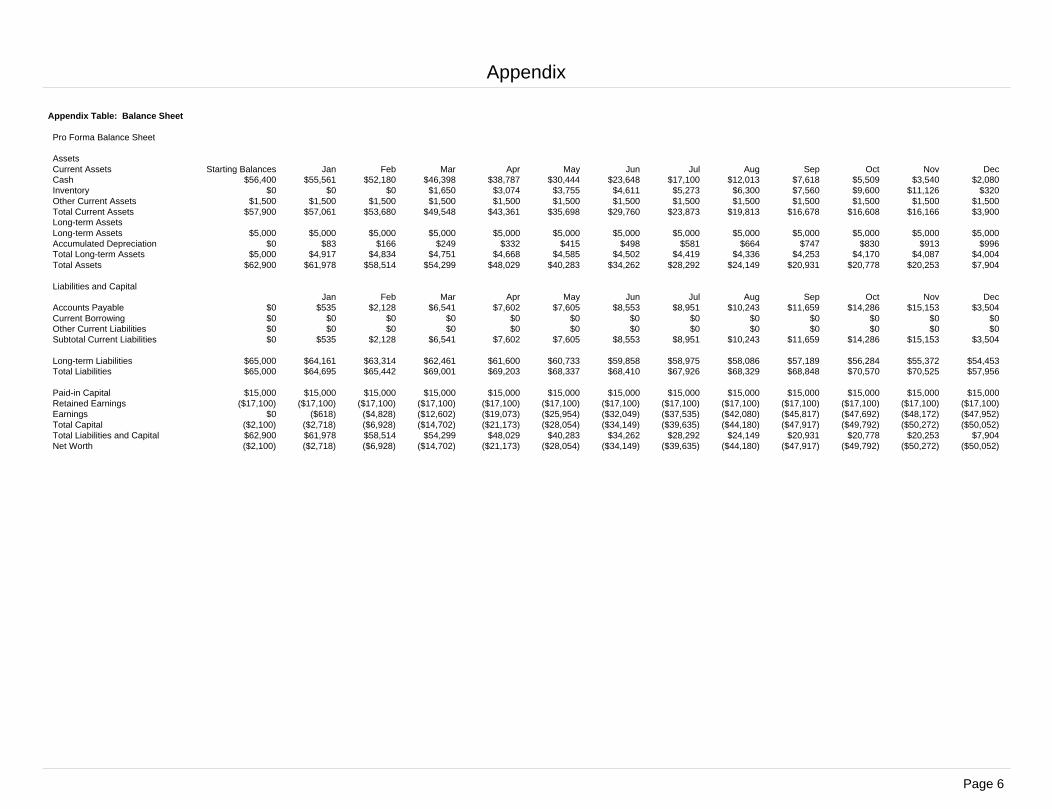
Appendix Table: Balance Sheet
Pro Forma Balance Sheet
AssetsCurrent Assets Starting Balances Jan Feb Mar Apr May Jun Jul Aug Sep Oct Nov DecCash $56,400 $55,561 $52,180 $46,398 $38,787 $30,444 $23,648 $17,100 $12,013 $7,618 $5,509 $3,540 $2,080Inventory $0 $0 $0 $1,650 $3,074 $3,755 $4,611 $5,273 $6,300 $7,560 $9,600 $11,126 $320Other Current Assets $1,500 $1,500 $1,500 $1,500 $1,500 $1,500 $1,500 $1,500 $1,500 $1,500 $1,500 $1,500 $1,500Total Current Assets $57,900 $57,061 $53,680 $49,548 $43,361 $35,698 $29,760 $23,873 $19,813 $16,678 $16,608 $16,166 $3,900Long-term AssetsLong-term Assets $5,000 $5,000 $5,000 $5,000 $5,000 $5,000 $5,000 $5,000 $5,000 $5,000 $5,000 $5,000 $5,000Accumulated Depreciation $0 $83 $166 $249 $332 $415 $498 $581 $664 $747 $830 $913 $996Total Long-term Assets $5,000 $4,917 $4,834 $4,751 $4,668 $4,585 $4,502 $4,419 $4,336 $4,253 $4,170 $4,087 $4,004Total Assets $62,900 $61,978 $58,514 $54,299 $48,029 $40,283 $34,262 $28,292 $24,149 $20,931 $20,778 $20,253 $7,904
Liabilities and CapitalJan Feb Mar Apr May Jun Jul Aug Sep Oct Nov Dec
Accounts Payable $0 $535 $2,128 $6,541 $7,602 $7,605 $8,553 $8,951 $10,243 $11,659 $14,286 $15,153 $3,504Current Borrowing $0 $0 $0 $0 $0 $0 $0 $0 $0 $0 $0 $0 $0Other Current Liabilities $0 $0 $0 $0 $0 $0 $0 $0 $0 $0 $0 $0 $0Subtotal Current Liabilities $0 $535 $2,128 $6,541 $7,602 $7,605 $8,553 $8,951 $10,243 $11,659 $14,286 $15,153 $3,504
Long-term Liabilities $65,000 $64,161 $63,314 $62,461 $61,600 $60,733 $59,858 $58,975 $58,086 $57,189 $56,284 $55,372 $54,453Total Liabilities $65,000 $64,695 $65,442 $69,001 $69,203 $68,337 $68,410 $67,926 $68,329 $68,848 $70,570 $70,525 $57,956
Paid-in Capital $15,000 $15,000 $15,000 $15,000 $15,000 $15,000 $15,000 $15,000 $15,000 $15,000 $15,000 $15,000 $15,000Retained Earnings ($17,100) ($17,100) ($17,100) ($17,100) ($17,100) ($17,100) ($17,100) ($17,100) ($17,100) ($17,100) ($17,100) ($17,100) ($17,100)Earnings $0 ($618) ($4,828) ($12,602) ($19,073) ($25,954) ($32,049) ($37,535) ($42,080) ($45,817) ($47,692) ($48,172) ($47,952)Total Capital ($2,100) ($2,718) ($6,928) ($14,702) ($21,173) ($28,054) ($34,149) ($39,635) ($44,180) ($47,917) ($49,792) ($50,272) ($50,052)Total Liabilities and Capital $62,900 $61,978 $58,514 $54,299 $48,029 $40,283 $34,262 $28,292 $24,149 $20,931 $20,778 $20,253 $7,904Net Worth ($2,100) ($2,718) ($6,928) ($14,702) ($21,173) ($28,054) ($34,149) ($39,635) ($44,180) ($47,917) ($49,792) ($50,272) ($50,052)
Appendix
Page 6


![v ] Æ ABC Company Business Plan - Amazon S3s3.amazonaws.com/thrivingbusiness/SampleBusinessPlan.pdf54 v ] Æ Confidentiality Agreement The undersigned reader acknowledges that the](https://img.pdfslide.us/doc/110x75/5e9b63ddd6a9ee1aa9518db6/v-abc-company-business-plan-amazon-s3s3-54-v-confidentiality-agreement.jpg)