Embed Size (px)
Citation preview

Agenda Item 7
Janet M. Coffman, MPP, PhD
Dr. Janet M. Coffman is an associate professor at Philip R. Lee Institute for Health Policy Studies, the Healthforce Center, and the Department of Family and Community Medicine at the University of California, San Francisco. She previously worked for UC Berkeley, the US Senate Committee on Veterans Affairs, and the San Francisco Department of Public Health.
Dr. Coffman has authored numerous publications on supply and demand for healthcare workers, geographic maldistribution, and strategies for improving racial/ethnic diversity among health professionals. She has been the project director for three voluntary surveys of California physicians conducted in partnership with the Medical Board of California that have addressed physician participation in Medi-Cal and use of electronic health records. Her other research interests include health care reform, access to care for vulnerable populations, and innovations in management of chronic illnesses.
Dr. Coffman received a PhD in Health Services and Policy Analysis and a master’s degree in Public Policy from the University of California, Berkeley.
BRD 7 - 1

Agenda Item 7
Physician Participation in Medi‐Cal Is Not Keeping Pace with Growth in Enrollment
Janet Coffman, MPP, PhD Associate Professor,
Philip R. Lee Institute for Health Policy Studies University of California, San Francisco
January 26, 2017
1
BRD 7 - 2
Agenda Item 7
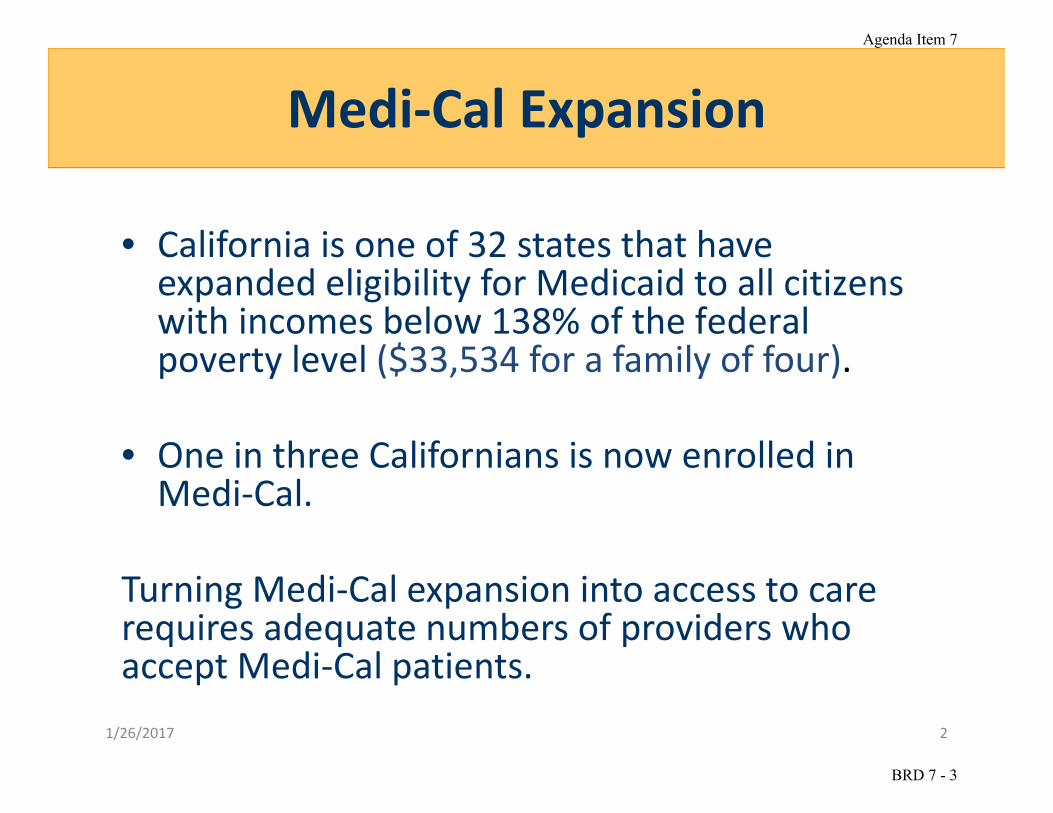
Medi‐Cal Expansion
• California is one of 32 states that haveexpanded eligibility for Medicaid to all citizenswith incomes below 138% of the federalpoverty level ($33,534 for a family of four).
• One in three Californians is now enrolled inMedi‐Cal.
Turning Medi‐Cal expansion into access to carerequires adequate numbers of providers whoaccept Medi‐Cal patients.
1/26/2017 2
BRD 7 - 3

Agenda Item 7
Updates Findings from Report on Physician Participation in Medi‐Cal in 2013
1/26/2017 3
BRD 7 - 4

Agenda Item 7
1/26/2017 4
Methods
• Voluntary survey mailed to MDs with renewalsdue from June 2015 through December 2015
• Linked responses to voluntary survey to– Responses to mandatory survey– Data in core license file
• Analyzed responses from physicians– Practicing in California– Not in training– Providing patient care at least 20 hours per week
BRD 7 - 5

Agenda Item 7
1/26/2017 5
Response Rate and Sample Size
# Eligible MDs who Received Voluntary Survey
34,212
Response Rate Among Eligible MDs 18%
Sample Size 6,163
Estimates were weighted to reflect demographic characteristics and practice locations of the population of physicians who provide patient care in California.
BRD 7 - 6
Agenda Item 7
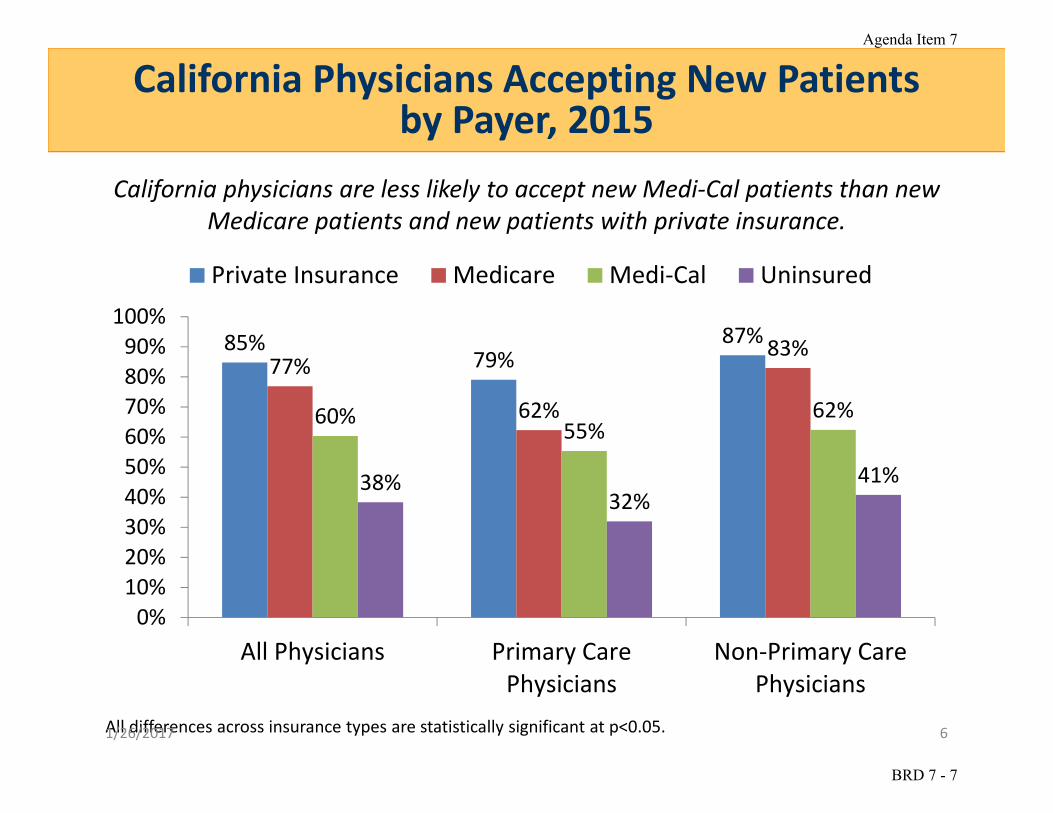
California Physicians Accepting New Patientsby Payer, 2015
85% 79%
87% 77%
62%
83%
60% 55%
62%
38% 32%
41%
0% 10% 20% 30% 40% 50% 60% 70% 80% 90%
100%
Private Insurance Medicare Medi‐Cal Uninsured
California physicians are less likely to accept new Medi‐Cal patients than new Medicare patients and new patients with private insurance.
All Physicians Primary Care Non‐Primary Care Physicians Physicians
All differences across insurance types are statistically significant at p<0.05. 1/26/2017 6
BRD 7 - 7

Agenda Item 7
CA Physicians Accepting New Medi‐Cal Fee‐for‐Service and Managed Care Patients, 2015
Most California physicians who accept new Medi‐Cal patients accept both fee‐for‐service and managed care patients.
% of Physicians Accepting New Medi‐Cal Patients
11% 18%
71%
0%
10%
20%
30%
40%
50%
60%
70%
80%
Only Medi‐Cal Fee‐for‐ Only Medi‐Cal Managed Both FFS and Managed Service Care Medi‐Cal
1/26/2017 7
BRD 7 - 8

Agenda Item 7
CA Physicians Accepting New
Medi‐Cal Patients by Specialty, 2015
37%
46%
54%
57%
61%
64%
68%
76%
Psychiatry
General Internal Medicine
Family Medicine
Surgical Specialties
Medical Specialties
Obstetrics‐Gynecology
General Pediatrics
Facility‐based (mostly ER med)
% Accepting New Medi‐Cal Patients
The percentage of California physicians accepting new Medi‐Cal patients varies substantially across major physician specialties.
0% 10% 20% 30% 40% 50% 60% 70% 80%
Differences between facility‐based specialties and all other specialties and between psychiatry and all other specialties are statistically significant at p<0.05.1/26/2017 8
BRD 7 - 9

Agenda Item 7
CA Physicians Accepting New Medi‐Cal Patients by Practice Type, 2015 – All Physicians
Physicians who practice in community/public clinics are more likely to accept new Medi‐Cal patients than physicians who practice in other settings.
% Accepting New Medi‐Cal Patients
Community/Public Clinic
Kaiser Permanente
Group Practice
Solo Practice
Other 33%
44%
66%
78%
88%
0% 20% 40% 60% 80% 100%
All differences among practice types are statistically significant at p<0.05.1/26/2017 9
BRD 7 - 10

Agenda Item 7
Primary Care Physicians Accepting New Medi‐Cal Patients by Region, 2015
The percentage of primary care physicians accepting new Medi‐Cal patients varies across region from 40% to 70%.
% Accepting New Medi‐Cal Patients
50% 45% 53%
70% 60%
40%
59% 53% 50%
63%
0% 10% 20% 30% 40% 50% 60% 70% 80%
Many differences across regions were not statistically significant. Exceptions include differences between the Inland Empire, the region with the highest rate of accepting new Medi‐Cal patients, and the Bay Area, Central Coast, North, and San Diego regions. 1/26/2017 10
BRD 7 - 11

Agenda Item 7
Non‐Primary Care Physicians Accepting New Medi‐Cal Patients by Region, 2015
The percentage of non‐primary care physicians accepting new Medi‐Cal patients varies across region from 56% to 71%.
% Accepting New Medi‐Cal Patients
64% 60% 71% 66%
59% 66% 71%
61% 56% 68%
0% 10% 20% 30% 40% 50% 60% 70% 80%
Many differences across regions were not statistically significant. Exceptions include differences between San Diego, the region with the smallest rate of acceptance of new Medi‐Cal patients, and Central Valley/Sierra, North, North Valley/Sierra, and South Valle/Sierra regions.1/26/2017 11
BRD 7 - 12

Agenda Item 7
for primary care physicians.
CA Physicians with Any Patients by Payer, 2015
87% 86% 87%
74%
64%
78%
64% 63% 64% 55%
50% 57%
0%
10%
20%
30%
40%
50%
60%
70%
80%
90%
100%
Private Insurance Medicare Medi‐Cal Uninsured
California physicians are less likely to have Medi‐Cal patients in their practices than privately insured or Medicare patients.
All Physicians Primary Care Physicians Non‐Primary Care Physicians
All differences are statistically significant at p<0.05 except the difference between Medi‐Cal and Medicare 1/26/2017 12
BRD 7 - 13

Agenda Item 7
1/26/2017
Percentage of Patients Enrolled in Medi‐Cal, Primary Care vs. Non‐Primary Care Physicians, 2015
In the practices of most California physicians who have any Medi‐Cal patients, less than 30% of all patients are Medi‐Cal beneficiaries.
100%
90%
80%
70%
60%
50%
40%
30%
20%
10%
0%
34% 32%
20% 22%
27%
19% 30% + Medi‐Cal
10‐29%
1‐9%
0%
18%
28%
PCPs Non‐PCPs
BRD 7 - 14
13

Agenda Item 7
1/26/2017
Two Benchmarks for Assessing Adequacy of Supply
• Council on Graduate Medical Education (COGME)ratios of FTE primary care and non‐primary carephysicians per 100,000 population:• 60 ‐ 80 PCPs per 100,000 people• 85 ‐ 105 Non‐PCPs per 100,000 people
• The CA Department of Health Care Services(DHCS) standard for the number of Medi‐Calbeneficiaries per primary care physician:• 50 PCPs per 100,000 beneficiaries (1 PCP per 2,000beneficiaries)
BRD 7 - 15
14

Agenda Item 7
In 2015, the ratios of FTE physicians to Medi‐Cal enrollees fall below DHCS minimum standards and federally recommended levels for primary care and non‐primary care physicians.
56
87
36
61
0
10
20
30
40
50
60
70
80
90
100
2013
2015
85 (COGME)
60 (COGME)
50 (DHCS)
Primary Care Non‐Primary Care
Notes: Number of physicians reflects full time equivalents (FTEs). DHCS minimum reflects network adequacy standards (based on 2,000 enrollees per primary care physician FTE). DHCS has not set minimum standards for specialists. The COGME minimum reflects the lower end of the range of physicians per enrollee recommended by the Council on Graduate Medical Education (60‐80 for primary care; 85‐105 for specialists).1/26/2017 1515
FTE Medi‐Cal Physicians per 100,000 Beneficiaries, 2013 and 2015
BRD 7 - 16

Agenda Item 7
Percentage of California Physicians Reporting Difficulty Obtaining Referrals, 2015
California physicians are more likely to report having difficulty obtaining referrals for Medi‐Cal patients than for privately insured patients.
Privately Insured Patients Medi‐Cal Patients
7% 6%
17%
27%
39% 40%
0% 5%
10% 15% 20% 25% 30% 35% 40% 45% 50%
Diagnostic Imaging Specialist Physicians Mental Health Services Note: Combines responses from physicians who reported that they almost always or frequently have difficulty obtaining referrals. All differences are statistically significant at p<0.05. 1/26/2017 16
BRD 7 - 17

Agenda Item 7
Reasons for Limiting Number of Medi‐Cal Patients in Practice, 2015
The most common reasons why California physicians limit the number of Medi‐Cal patients in their practices concern Medi‐Cal payment and
administrative challenges.
% of Physicians Who Limit # of Medi‐Cal Patients in Their Practices
Amount of Medi‐Cal Payment
Administrative Hassles
Delays in Medi‐Cal Payment 72%
72%
78%
0% 20% 40% 60% 80% 100%
Note: Combines responses from physicians who reported that a reason was very important or moderately important.1/26/2017 17
BRD 7 - 18

Agenda Item 7
Reasons for Limiting Number of Medi‐Cal Patients in Practice, 2015
California physicians were less likely to cite characteristics of Medi‐Cal patients or that their practices were full as reasons for limiting the number
of Medi‐Cal patients their practices serve.
% of Physicians Who Limit # of Medi‐Cal Patients in Their Practices
Medi‐Cal Patients Have Complex Needs
Practice is Full
Medi‐Cal Patients Are Disruptive 20%
40%
37%
0% 20% 40% 60% 80% 100%
Note: Combines responses from physicians who reported that a reason was very important or moderately important.1/26/2017 18
BRD 7 - 19

Agenda Item 7
1/26/2017
Summary of Major Findings
1. California physicians are less likely to accept new Medi‐Cal patients than new patients with Medicare or private health insurance but more likely to accept them than uninsured patients.
2. The number of FTE Medi‐Cal physicians in California grew between 2013 and 2015 but did not keep pace with the large increase in Medi‐Cal beneficiaries.
3. Supply of FTE Medi‐Cal physicians relative to beneficiaries is below federal and state standards.
BRD 7 - 20
19

Summary of Major Findings
4. California physicians are more likely to report difficulty obtaining referrals for Medi‐Cal patients than for privately insured patients.
5. The most frequent reasons that physicians limit the number of Medi‐Cal patients in their practices concern payment rates and program administration.
Agenda Item 7
1/26/2017
BRD 7 - 21
20

Agenda Item 7
Limitations
• Relied on self‐reported data from physicians
• Response rate was low
• Do not know whether physicians answered from perspective of: – Having ever accepted new Medi‐Cal patients, or – Accepting new Medi‐Cal patients at time they completed the survey
1/26/2017 21
BRD 7 - 22

Agenda Item 7
Acknowledgments
Funders • California Health Care Foundation • Robert Wood Johnson Foundation
Partner • Medical Board of California
Research Team • Andrew B. Bindman, MD • Margaret Fix, MPH • Denis Hulett, MS • Lena Libatique
1/26/2017 22
BRD 7 - 23