Embed Size (px)
Citation preview

AD-AO9A 310 ROCKWELL INTERNATIONAL CANOGA PARK CA ROCKETDYNE DIV F/A 21/5TURBINE W INOAGE TORQUE TESTS.(U)JAN Al R F SUTTON F33A15 79-C 2073
UNCLASSIFIED RI/RD-AI-220 AFWAL-TR-A0-2123 N
1 2
nUammmuUaiiaiEUEE~lEilEihEIn fllfluflnulunl,.EhIEEEE=EEEm U

1111IL25
M I ,, y P I

AFWAL-7R-80-21'23
TURBINE WINDAGE TORQUE TESTS
R. F. SUTTON
ROCKWELL INTERNATIONALCANOGA PARK, CA 91304
JANUARY 1981
TECHNICAL REPORT AFWAL-TR-80-2123Final Report for period August 1979 - October 1980
I Approved for public release; distribution unlimited.
_ DTICAERO PROPULSION LABORATORY
AIR FORCE WRIGHT AERONAUTICAL LABORATORIES , APR 29 1981AIR FORCE SYSTEMS CONMMWRIGHTAPATIERSON AIR FORCE BASE, OHIO 45433
Si 29 001?

NOTICE
When Government drawings, specifications, or other data are used for any purposeother than in connection with a definitely related Government procurement operation,the United States Government thereby incurs no responsibility nor any obligationwhatsoever; and the fact that the government may have formulated, furnished, or inany way supplied the said drawings, specifications, or other data, is not to be re-garded by implication or otherwise as in any manner licensing the holder or aAyother person or corporation, or conveying any rights or permission to manufactureuse, or sell any patented invention that may in any way be related thereto.
This report has been reviewed by the Office of Public Affairs (ASD/PA) and isreleasable to the National Technical Information Service (NTIS). At NTIS, it willbe available to the general public, including foreign nations.
This technical report has been reviewed and is approved for publication.
PHILLIP G. COLEGROVE RICHARD D. FRANKLIN, MAJOR, USAFProject Engineer Chief, Power Systems Branch
FOR THE CONMANDER
'JAM D. AW"Chief Aerospace Pow D~dWhoAsro Propulsion Laboratory
"If your address has changed, if you wish to be removed from our mailing list, orif the addressee is no longer employed by your organization please notify. g&,W,.1W-PAFB, OH 45433 to help us maintain a current mailing list".
Copies of this report should not be returned unless return is required by securityconsiderations, contractual obligations, or notice on a specific document.AIR FONCE/87/ AO ,rI 1981 - 110
I

*S SEU CLASSIFCTINU T1FIOAGE (A Dow;, d) _________________
REPORT DOCUMENTATION PAGE READ INSTRUCTIONS1. REPORT NUMBR 3. RECIPIENT' CATALOG NUMBER
.• T Ar PERIOD COVERED
RBI4 E DAGE 2'~ e 7f FALP*7 - coe-8(REPORT NUB~tR
VRutton E7 F33615-79-C-2 73 J
S. PERFORMING ORGANIZATION NAME AND ADDRESS 10 PROGRAM ELEMENT. PRO CT, TASKRocketdyne Division [,,AREA G WRK UNITo _f
Rockwell International 45_1416633 Canoga Ave., Canoga Park, CA 91304 n 7 0
II CONTROLLING OFFICE NAME AND ADDRESSAero Propulsion LaboratoryJ JanueompmW181
Wright Patterson Air Force Base 1" NUMBER OF PAGES
Ohio 4543314. MONITORING AGENCY NAME ADDRESS(f dfferint from Cuntrollingl Offce) IS SECURITY CLASS (of (his report)
Unclassi fled
-.IS. DECLASSIFICATION DOWNGRADINGSCHEDULE
1OISTRIBUTION STATEMENT (f this Report)
Approved for public release; distribution unlimited
17 DISTRIBUTION STATEMENT (of the abstract etIered in Block 20. if different from Report)
OI. SUPPLEMENTARY NOTES
It KEY WORDS (CeorIlnue o .mde s.tne noe. l end identify by block nunber)
Windage torque, shrouded and unshrouded turbine disc, disc friction,vane pumping, rotary torque transformer
S BSTRACT (Coriftue o reverse side If npcoeiaery, end Identify by block number)
Systems for producing high electrical power on demand include the use of aturbine/gas generator system. The power absorption by turbine windage isan important factor in determining the sizes of the vacuum pump and drive,if the turbine exhaust cavity is to be evacuated, and the size and qualityof the vacuum isolation valve on the turbine exhaust system. Rocketdyneconducted windage torque tests on a K15E3-2 turbine at speeds up to 30,000RPM where torque contributions of shrouded and unshrouded wheels, single wheel,and bearing and seal power losses were determined at turbine cavity air--_
DO I "o 1473 EDITION OF I NOV 66 Is OSSOL9TE -
f4 SECURITY CLASSIFICATION Oil THIS PAGE 8%* 11at F --- d)I JANO hi t -

20. pressure of 0.3 psia to atmospheric pressure (14.3 psia). Windage torquelosses of the shrouded two-wheel system at atmospheric conditionsrepresented about 2.6 percent of the overall rated turbine horsepower(155 versus 6,000 HP).

PREFACE
The work herein was conducted under Contract F32615-79-C-2073, Project 3145,Task 314501, Work Unit Number 31450141, for the Air Force Wright Aeronautical
Laboratories from 20 August 1979 through October 1980 by Rocketdyne, a division
of Rockwell International. At Rocketdyne, Mr. R. S. Siegler, Program Manager,
and Mr. R. F. Sutton, Project Engineer, were responsible for the overall
direction of the Turbine Windage Testing using the MK 15E3-2 turbine.
Mr. P. Colegrove of the Air Force Propulsion Laboratory was the focal point
for the direction and coordination of the program between the USAF and Rocket-
dyne.
Important contribution to the conduct of the program and to the preparation
of the report material were made by the following Rocketdyne personnel.
Turbomachinery: Mr. J. Boynton
Rotordynamics: Mr. B. RowanMr. J. Hodges
Development Laboratory: Mr. D. ButmanMr. C. Brown
iii

TABLE OF CONTEATS
PAGE
Introduction 1Task I - Design/Analysis 2
Drive System and Mounting 2Torquemeter Selection 10
Rotordynamic Analysis 11
Task II - Hardware Preparation 22Task III - Testing 40
Facility Preparations 40System Alignment 45
Lube System Flow Checks 47System Dynamic Balancing 47Windage Tests 49Post Test Disassembly/Storage 73
Task IV - Data Analysis/Results 74Data Reduction 74Data Analysis 77Results 89Concl usi ons 89Recommendations 90
Appendix A - Windage Tester Assembly Drawing P/N R0012809 91Appendix B - Turbine Windage Tests Data Compilation 94
Appendix C - Data Reduction Program 115Appendix D - Reduced Test Data and Parameters 121Appendix E - Revised Predicted Torques and Torque Ratio 128
References 140
V- --

LIST OF ILLUSTRATIONS
PAGE
1. Rotary Dynamics Test Facility Schematic 3
2. Rotary Dynamics Test Chamber 5
3. MKl5E3-2 Windage Torque Schematic 6
4. Front Bearing Carrier Modification 7
5. MKl5E3-2 Windage Test Configuration 12
6. MKl5E3-2 Mode Shapes (1 & 2) 13
7. MKl5E3-2 Mode Shapes (3 & 4) 14
8. MKl5E3-2 Quill Shaft Deflection 15
9. MKl5E3-2 Torquemeter Displacement vs Load 16
10. Runner Replacement 23
11. Turbine Bearing Oil Jet, View A 24
12. Turbine Bearing Oil Jet, View B 25
13. Runner/Turbine Bearing Oil Jet Installation 26
14. Rear Bearing Carrier 27
15. Assembly Push-Pull Apparatus 28
16. Turbine Assembly Push-Pull Results 29
17. Mount Assembly 32
18. Turbine Exhaust Cover 33
19. Rear Bearing Cover/Oil Jet 34
20. Quill Shafts and Quill Adapter 35
21. Model 1604-116 (500 in-lb) Torquemeter, View A 36
22. Model 1604-116 (500 in-lb) Torquemeter, View B 37
23. Second Stage Wheel Replacement Disc 38
24. First and Second Stage Wheel Replacement Disc 39
25. MKl5E3-2 System Requirement Schematic 41
26. MKl5E3-2 Instrumentation and Controls 43
27. Bently and Turbine Accelerometer Oscilloscope Systems 44
28. MK5E3-2 Alignment and Installation 46
29. MK5E3-2 Turbine Windage Outboard and Inboard Bearing
Flow versus Tube Jet Pressure 48
vi

List of IllustrationtPAGE
30. Test 1-003 RPM and Turbine Radial Acceleration
versus Test Time 5031. MK15E3-2 Balance Equipment 51
32. View of MKl5E3-2 Windage Tester - Drive End 5333. View of MKl5E3-2 Windage Tester 5434. View of E3 Second Stage Wheel Test Series #1
- Cover Removed 5535. Test Series #2 and #3 Configuration - Exhaust
Cover Removed 5736. El Second Stage Unshrouded Wheel - Test Series #4 5837. MKl5E3-2 Power Losses - Test Series #1 (Two Wheel) 60
38. MKl5E3-2 Power Losses - Test Series #2 (Single Wheel) 6139. MK15E3-2 Power Losses - Test Series #3 (Bearing and Seal) 6240. MKl5E3-2 Power Losses - Test Series #4 (E3 and El Wheels) 63
41. Rotating Machinery Vibration Severity Guide 65
42. Predicted Bearing Torque 7643. No Disc Tests - Original Torque Ratio versus Speed 8044. Predicted Oil Face Seal Torque 31
45. No Disc Tests - Revised Torque Ratio versus Speed 8246. Predicted Turbine Floating Ring Seal Torque 3447. Low Cavity Pressure Tests - Torque Ratio versus Speed 85
48. Single Rotor Tests - Torque Ratio versus Speed 8749. Two Rotor Tests - Torque Ratio versus Speed 88
vii

LIST OF TABLES
PAGE1. Bearing Stiffness versus Critical Speed, Standard
Case - 500 in-lb Torquemeter 17
2. Bearing Stiffness versus Critical Speed, StandardCase - 100 in-lb Torquemeter 17
3. Bearing Stiffness versus Critical Speed, End Disc
Replaced - 500 in-lb Torquemeter 18
4. Bearing Stiffness versus Critical Speed, End Disc
Replaced - 100 in-lb Torquemeter 18
5. Bearing Stiffness versus Critical Speed, Both Discs
Replaced - 500 in-lb Torquemeter 19
6. Bearing Stiffness versus Critical Speed, Both DiscsReplaced - 100 in-lb Torquemeter 19
7. MK15E3-2 Turbine Windage Torque Hardware 318. MK15E3-2 Turbine Windage Torque Test Instrumentation
List 42
9. f1KI5E3-2 Test Matrix 5210. MK15E3-2 Windage Torque Test Summary 5911. Turbine Geometry Summuary 78
12. Predicted Torques for Each Configuration 79
viii

SUMMARY
The objective of the Turbine Windage Torque Program was to obtain test data
on windage losses on various configurations of the MKI5E3-2 turbine, and to
develop a method of predicting windage losses on other turbines of similar
design.
The Rocketdyne Engineering Laboratory rotary dynamics vacuum test chamber,
with a 0-60,000 RPM, 300 HP dynamometer, was selected as the test facility.
A rotary transformer (brushless) torque sensor, using air/oil mist lubrication
for the bearings and mounted between the dynamometer output shaft and the
turbine, was selected. For test speeds to 30,000 RPM, the brushless rotary
transformer represented the most positive, low risk system to acquire the
torque data.
Modifications of the turbine and fabrication of supportive hardware for the
windage tester began in September 1979 and ended with the successful accomplish-
ment of all testing during the month of September 1980. A total of twenty-two
tests were run encompassing the entire test matrix at turbine cavity pressures
of from 0.3 psia to atmospheric conditions. A total of 32,810 seconds turbine
run time, including in-place balance spin up, was accumulated on the windage
tester system with no major problems. Considerable difficulty was experienced
in the alignment of the turbine-torquemeter-dynamometer system. however,
final alignment was well within the requirements. Post test examination of
the spline teeth showed virtually no scuffing, or wear. Balancing of the
torquemeter system also proved difficult since an unusually high residual
unbalance was indicated at the normal in-place balance speed of 2,000 RPM.
Empirical test results and a re-balance at 5,000 RPM resolved the problem
with no further difficulties encountered throughout the test program.
The data acquired during the testing was evaluated and compared with the
results of previous analysis and test investigations. Torque predictions
for the turbine bearings and oil seal differed from the test values for the
ix

no disc configuration. The previous analytical predictions were updated to
more closely agree with the test torque. The turbine floating ring seal
torque predictions also differed from the test derived value. Again, the
predictions were updated to more closely approximate the test value. For
the two-rotor tests, the test torque value averaged 98 percent higher than
the updated torque predictions at 14 psia cavity pressure from the 20,000
to 30,000 RPM region. At 7 psia cavity pressure, for the same speed region,
the test torque averaged 66 percent higher than the updated predictions. In
the case of the single-wheel test, the test torque averaged 33 percent
higher than the updated predictions at 14 psia cavity pressure and in the
20,000 to 30,000 RPM speed region. At 7 psia cavity pressure, the recorded
torque averaged 11 percent higher than the updated predictions. AIo observable
torque difference was noted between the shrouded E3 second stage wheel and
the unshrouded El second stage wheel. The unpowered turbine power loss,
including disc friction, vane pumping, bearing and seal friction at 30,000
RPM and 14 psia was approximately 2.6 percent of the total designed MKl5E3-2
turbine horsepower, or 155 versus 6,000 horsepower. Based on the results
of this test program, the experimentally based correlation derived by previous
investigators did not adequately predict the actual observed disc friction,
vane pumping, and shroud ring friction torque. Predicted torque deviated
from the empirical results for the two-wheel configuration. The non-
symmetrical, reaction type blading of the second rotor apparently causes
greater windage losses than previously calculated when using torque
coefficients from tests of symmetrical blading. The effect of the type of
blading should be studied in greater detail.
Figure A presents the empirical results of the two-wheel shrouded configura-
tion MK15E3-2 turbine for the initial test series (Tests 1-006, 1-)09 and
1-010). At maximum rotor speeds (30,000 RPM), the horsepower requirenent for
this configuration was 155, 93 and 27 HP at cavity pressures of 14, 8 and ).3
psia, respectively. Raw test data for the remainder of the test configura-
tions may be found in the appendix. Turbine exhaust pressure level is a strong
influence on the total windage power requirements during coast periods of an
x

operational turbine. Methods to lower the cavity pressure, or de~isity, willbenefit the overall system operation.
A0TE: Power losses include Vane pm4Wlng, disc,friction, bearing and! seals Vanes areshrouded.
160 . ..... 1-006 (14 psia)
140 .
120.Pjwer. HP L I
100(Psial
60 1
20
Q510 1s 20 25 30
, . . Rotor Speed .KRPM
Figure A. MKl5E3-2 Power Losses SummaryHorsepower versus Rotor Speedversus Cavity Pressure
xi

INTRODUCTION
Various methods have been proposed for rapidly producing high electrical
power on demand using a turbine/generator system. One scheme is to spin
the generator at operating speed, with the turbine at rest and connect
the turbine to tne generator by means of an overrunning clutch. The turbine
can then be brought up to speed very quickly under no-load condition and
engage the generator by means of the clutch. This approach requires the
development of a high spFed, high power overrunning clutch which may be
very difficult to accomplish.
Anc"er possibility is the concept of idling the entire turbine/generator
as a unit at no-load condi ion by means of an electric or hydraulic motor.
This approach is much more desirable than the overrunning clutch concept
if the turbine windage torque is low enough to idle it at full speed. The
power required to idle the system is unknown and cannot be accurately
calculated analytically. The power absorption by windage is an important
factor in determining the feasibility of this approach because it will
determine the required size of the idling motor. It will also determine
the sizes of the vacuum pump and drive, if the turbine housing is to be
evacuated and the size and quality of the vacuum isolation valve in the
turbine exhaust.
The objective of the windage torque program was to obtain test data on the
windage losses of various configurations of the Mark 15 E3-2 (fast start)
turbine and to develop a method of predicting windage losses on other turbines
of similar design.
The program was divided into four tasks: Task I - Design/Analysis,
Task II - Hardware Preparation 1, Task III - Testing and Task IV - Data
Analysis. The program began in September 1979 with all testing conducted
in September 1980.

TASK I - DESIGN/ANALYSIS
Design and analytical studies were conducted to support the test of an
MK 15E3-2 turbine assembly, P/N XEOR 943562, Unit No. 2, a Government
Furnished Part.
Task I effort consisted basically of three major subtasks: (1) a method had
to be devised to mount and drive the turbine, (2) because of specific require-
ments to measure torque as a function of turbine back pressure, a method was
necessary to vary and control the turbine exhaust pressure from low partial
vacuum levels to atmospheric conditions and (3) incorporate a system to
measure torque during turbine spin operations to 31,000 rpm.
Drive Systems and Mounting
A review of the major requirements led to the decision to drive the MK 15E3-2
turbine by an electric motor housed in the Rocketdyne Engineering Laboratory
Rotary Dynamics Test facility.
The Rotary Dynamics Test Facility encompasses an area of approximately
1,000 sq. ft. with an enclosed control and instrumentation room and adjoining
test cell below factory floor level test area (Fig. 1). The testing is
conducted from the control room which also contains the recording equipment
and visual display of selected parameters. The console in the Control Room
contains the dynamometer control panel and gages and pressure requlators used
in operation of the test.
Access to the test area, 12 feet below the factory floor level, is by a
stairwell at the northwest corner of the area. The test chamber is
cylindrical, 14 feet in diameter by 11 feet tall, with a removable domed
cover and has a 2- by 4-foot oval personnel access door. Evacuation of the
of the chamber is possible by two mechanical-type vacuum pumps that can reduce
the entire chamber pressure to 100 mm Hg absolute in approximately 10 minutes
and can maintain 400 mm Hg absolute with 0.5 lb/sec of gaseous nitrogen being
injected into the chamber.
2

IFI
FIGUIE 1. Rotary Dynamnics Test Facility Schematic
3

The prime mover for this facility is a 300 hp, 0 to 6000 rpm, d-c dynamometer
with its output shaft extended through the test chamber wall and coupled to the
input shaft of a 10:1 speed increasing gearbox (Fig. 2). The gearbox output
high-speed pinion shaft is coupled to the test rotating assembly with a splined
shaft approximately 6 inches long to clear the gearbox assembly. Gearbox
lubrication is accomplished with a recirculation system for chamber vacuum
levels above 100 mm Hg (11 para) absolute and a single-pass blowdown system
for chamber vacuun levels below 100 mm Hg absolute.
The Rotary Dynamics Test Facility had been successfully utilized in 1978
during diagnostic laboratory testing of the Space Shuttle Fuel High Pressure
Turbine Blade Evaluation.' Similar speed levels and rotor masses were used
during that testing.
The tester was designed with the MKI5E3-2 turbine mounted with the rotor
horizontal, using an in-line rotary transformer for torque measurement mounted
between the turbine and the dynamometer output shaft (Figure 3). A discussion
of the necessary turbine modifications and design analysis is presented below:
A. Turbine Assembly, P/N XEOR 943562 Modifications
Four basic modifications to the turbine design will be necessary to permit
adapting to the Windage Torque Tester (Fig. 3):
1. Front Bearing Carrier, P/N XEOR 939902D3
Adequate oil lubrication drainage in the tester's horizontal position
requires enlargement of one of the existing drain slots. This modifi- Ication will not cause any future operational problems when tested as a
turbine only assembly. Figure 4 shows the modification area of the
front bearing carrier.
'Rocketdyne Report RSS-8626 High Speed Rotating Diagnostic Laboratory Testing,R. F. Sutton, November 1978, Rockwell International.
4

(1*6
Fj§qUre 2. potarY Dyn~amics lest Chamber

r_ 7
1802
Figure 3. MK15E3-2 Windage Torque Schematic
6

3.15 R
AWAVSECTION A-A
Figure 4: Front Bearing Carrier Nodificat ion
7

2. Bronze Thrust Washer, P/N XEOR 939903D1
The bronze thrust washer must be removed from the assembly to lower the
required torque necessary to rotate the turbine. The high torque re-
quirement inherent with the installed bronze thrust washer would mask
the actual windage torque caused by the turbine wheels.
3. Turbine Bearing Oil Jet Assembly, P/IN XEOR 939902D3
At the same time the bronze thrust washer is removed, a replacement oil
jet assembly must be installed. Without the thrust washer, oil lubri-
cation of the bearings would not be effective since leakage from the
oil transfer tubes would prevent adequate bearing lubrication flow.
The replacement oil jet assembly would be patterned from the original
jet assembly except three jets of 0.055 inch diameter in place of the
single jet will be used to assure adequate oil lubrication in the
horizontal position. Control of the upstream pressure will permit a
large variation in the bearing flow (0-2 GPM), as required, to maintain
bearing temperatures below 150°F.0
4. Runner, P/N XEOR 939902D9
In spite of the drainage modification to the front bearing carrier (see
Item 1 above), a possibility exists that oil will accu!ijlate in the
runner area and will contact the outer diameter of the runner during
operation. Foaming of the oil with additional drag caused by contact
with the runner requires the runner to be replaced with a spacer. A
design similar to the balance spacer, P/N XEOR 939921D2, will be used
to provide the required axial pre-load on the bearings. Actual runner
width was measured (2.197 inches) to assure the correct pre-load
afforded by the new spacer. The runner can be replaced with a spacer
since stack balancing (component by component) procedure was used in
the balancing of the MK-15E3-2 turbine. That is, the runner was
balanced after installation on the balanced shaft. The turbine wheels
were added and the final balance made at the planes of the Ist and 2nd
stage turbine wheel.
8

B. Mount Assembly, P/N ROO12810
In order to mount the turbine in the horizontal position, a nunt was de-
signed to attach to the 16-hole bolt-circle flange of the XEOR 939902DlD
turbine carrier assembly. The mount is attached to a large mass base
(Kirtsite) of the test cell by bolting. Shimming, if required, is pro-
vided between the base plate and the base. (See assembly drdwing, P/d
R0012809.) In addition, the rotary transformer torquenietei is fwounted at
a pad provided on the mount with shimming provided, if required.
C. Front Bearing Oil Cap, P/11 R0012812
Lubrication of ',ne front bearing and oil drain provisions from both bear-
ings necessite-.ed the design of the front bearing oil cap. Three lube jets
of 0.055 incai fiame~er each are provided, similar to the turbine bearing
oil jet assen Y.y and will supply about 0.5 gpm per jet at 100 psig supply
pressure. The front bearing and turbine bearing oil supply is a common
source with i.,dividual oil jet flow measurements. A one-inch diameter
drain ba4e is provided to drain the estimated 3 gpm maximum lubrication
oil flow. To enhance draining, the cavity drain line is attached to a
scavenge pump of 5 gpm capacity.
D. Quill Shafts (Drive P/N R0012816; Turbine P/N R0012815)
Each quill shaft has been designed for minimum mass (aluminum) and best
fit alignment to minimize wear on the torquemeter bearings (two per
torquemeter). Two additional critical speeds appear in the test system
with the addition of the torquemeter. A detailed discussion of the system
rotordynamics is discussed later.
E. Turbine Cover, P/14 R0012311
One of the major design considerations was the ability to control the
turbine back pressure and monitor windage heating. A simple solution was
to adapt a steel cover to the bolt circle of the turbine exhaust flange.
The cover is designed with two large threaded posts (2.2 inch diameter) at
9

the outer diameter. At partial vacuum conditions, one port is capped
(bottom) while the other port (top) is connected to the facility vacuum
pumping system by a one-inch diameter Cres line through a heat exchanger
and then through a flow control valve. Steady partial vacuum levels
within the turbine exhaust cavity can be maintained. The heat exchanger
was added to cool the heated exhaust air to prevent damage to the soft
seat material of the flow control valve. At atmospheric conditions, both
large ports are opened to provide free flow of atmospheric air. The steel
cover, although very heavy, was chosen to provide adequate stress margin
for the expected l000F windage heating temperature. Instrumentation
bosses were added to permit pressure and temperature profiles across the
turbine disc diameter.
Torquemeter Selection
Selection of the torquemeter was made based on analytical calculation of
the expected torque which set the required torquemeter range and the most
reliable type to withstand the projected high speed operation with minimum
risk to operation and data acquisition. In the final selection, two rotary
torquemeter transformers (brushless) of 100 and 500 in-lb torque ranges
were selected from Lebow Associates, Inc. of Troy, Michigan. Special air/
oil mist lubrication for the Model 1604-100 (100 in-lb) and Model 1604-500
(500 in-lb) torquemeter bearings was included with the purchase order. In
addition, since prolonged operation at the 30,000 RPM levei was antici-
pated, special thermocouple insertion ports in the outer case of the
torquemeter housings were requested to permit installation of 1/16-inch
diameter thermocouples. As a speed backup system, the speed sensor option
was also renuested from Lebow for each torquemeter. A magnetic pickup
sensor detects speed by a 60-tooth gear installed on the torquemeter shaft
within the housing. Signal conditioning and readout capability is pro-
vided by the Lebow Model 7540 signal conditioner which is specifically
suited for these torquemeter models. Expected windage torque was calcu-
lated to be between 90-150 in-lb plus bearing and seal torque (perhaps
50 in-lb); therefore, the 500-in-lb range model was selected for the tests
10

7'4
determining wheel/vane pumping torque while the 100 in-lb range model was
selected to monitor tests when bearing and seal torque was to be determined.
Rotordynami c Analysis
Once the turbine mounting, torquemeter selection and oupling arrangements
were defined, a rotordynamics analysis was accomplished to determine the
critical speed(s) of the system. A series of design-analysi -redesign
effort was accomplished to eventually arrive at the most reliable and
stable rotor system. An existing rotordynamic analysis model was modified
to correspond to the turbine windage tester design (reference Figure 3).
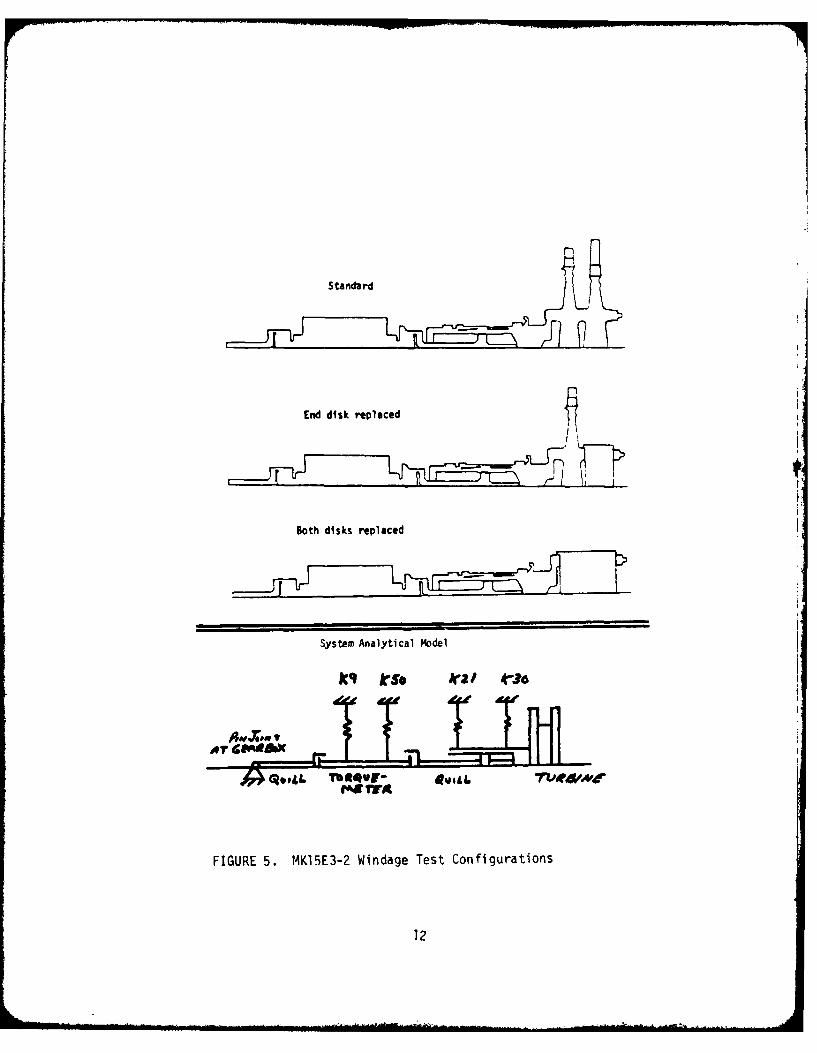
Figure 5 shows a schematic of the three test configurations (two discs,
end disc replaced and both discs replaced) along with the corresponding
system analytical model.
Referring to the Figure 5 schematics, the MKl5E3-2 Windage tester in its
three configurations will be tested with both turbine discs, with the
outer disc replaced with a mass, and with both discs replaced with a mass.
The existing model was updated to incorporate these and other minor changes
to the shaft. The torquemeter has been modeled in two configurations for
comparison. The 500 in-lb torquemeter has a "square" cross-section where
strain gages are attached while the 100 in-lb torquemeter has a "squirrel
cage" section. The couplings have been modeled as unlocked, utilizing
moment releases at appropriate model nodes. This analysis assumes an
aluminum quill shaft. Red-line values for the test were chosen on the
peak deflections of the torquemeter shaft. This is required because the
critical speeds of the torquemeter shaft are the ones which will ultimately
damage the torquemeter. Referring to Figure 8, the shaft was analytically
loaded statically and maximum displacements were obtained for both assumed
bearing spring rates. Figure 9 is a plot of bearing load vs. torquemeter
displacement. Actual torquemeter shaft displacement red-line recommend-
ation is 0.016 inch radial displacement. Mode shapes are shown for a
typical case in Figures 6 and 7 and remain typical for all cases except for
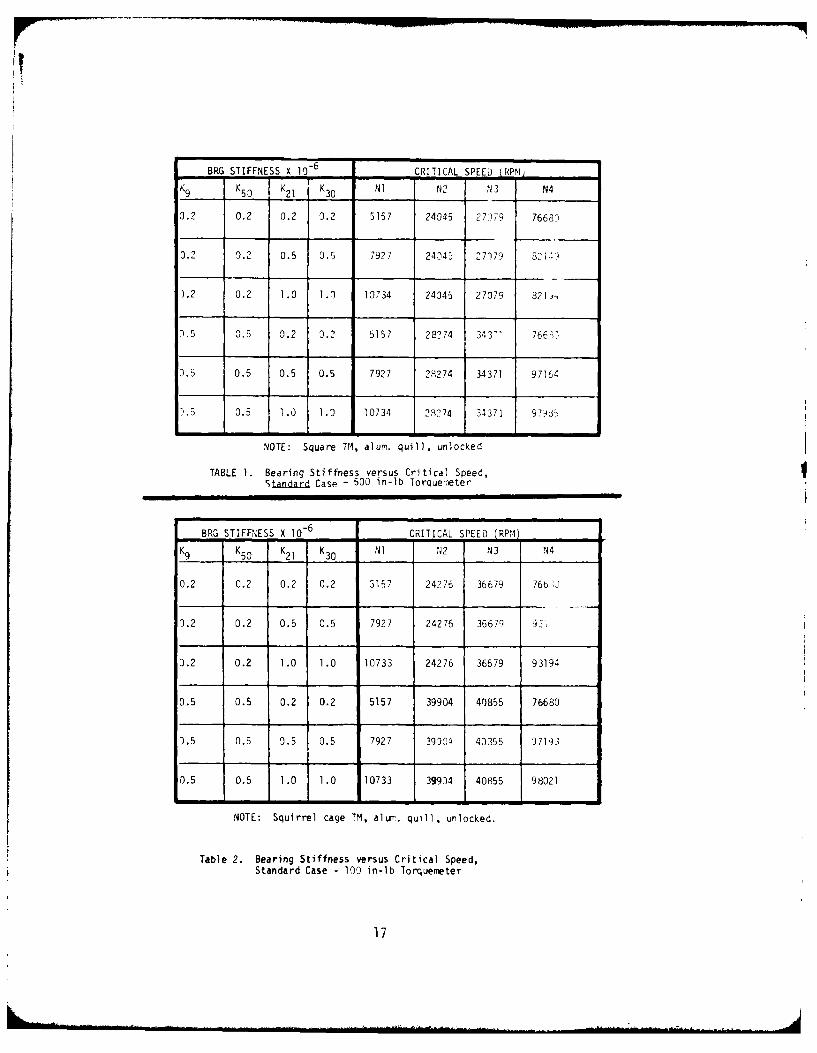
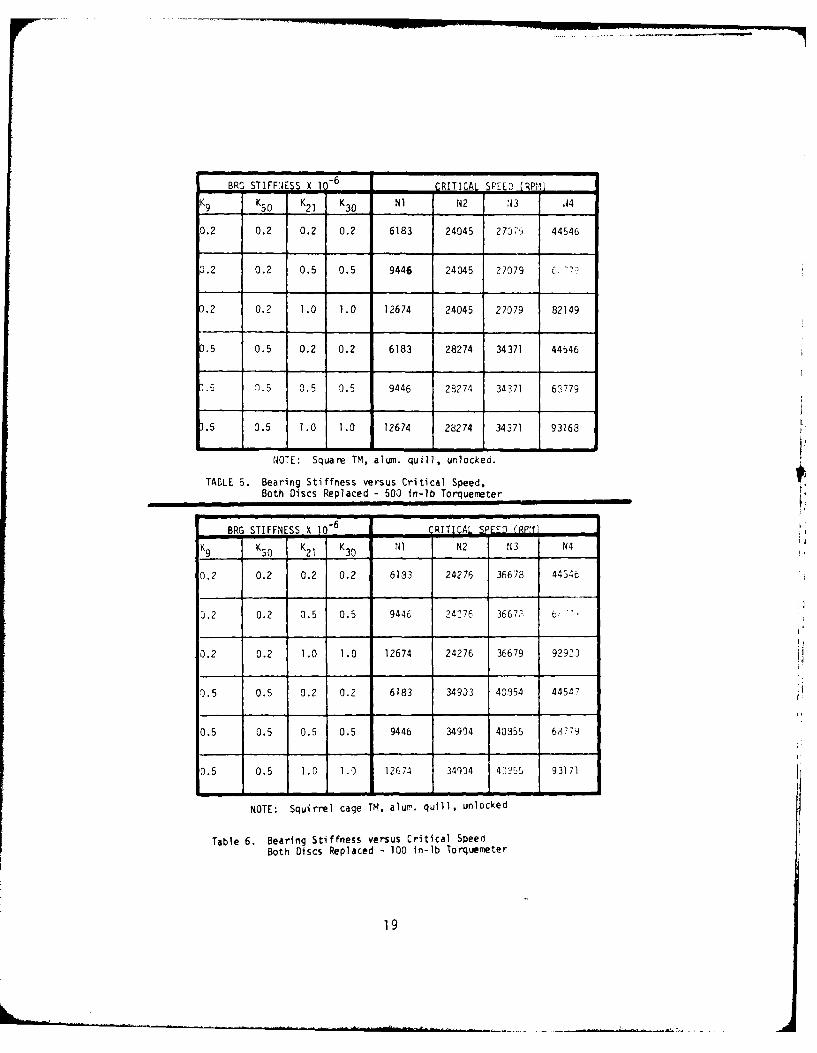
changes in displacement amplitude. Comparative results of the six config-
urations are tabulated in Tables 1 through 6.
11_
Standard
End disk replaced V
Both disks replaced
System Analytical Model
FIGURE 5. MK15E3-2 Windage Test Configurations
12

rh~eEnt
Quill End
6000 por
0 - BEAAINGS
FIGURE 6. MKI5E3-2 Mode Shapes
13

Turbine End
Quill End K
0 - Bearings
FIGURE 7. 14K15E3-2 Mode Shapes
14
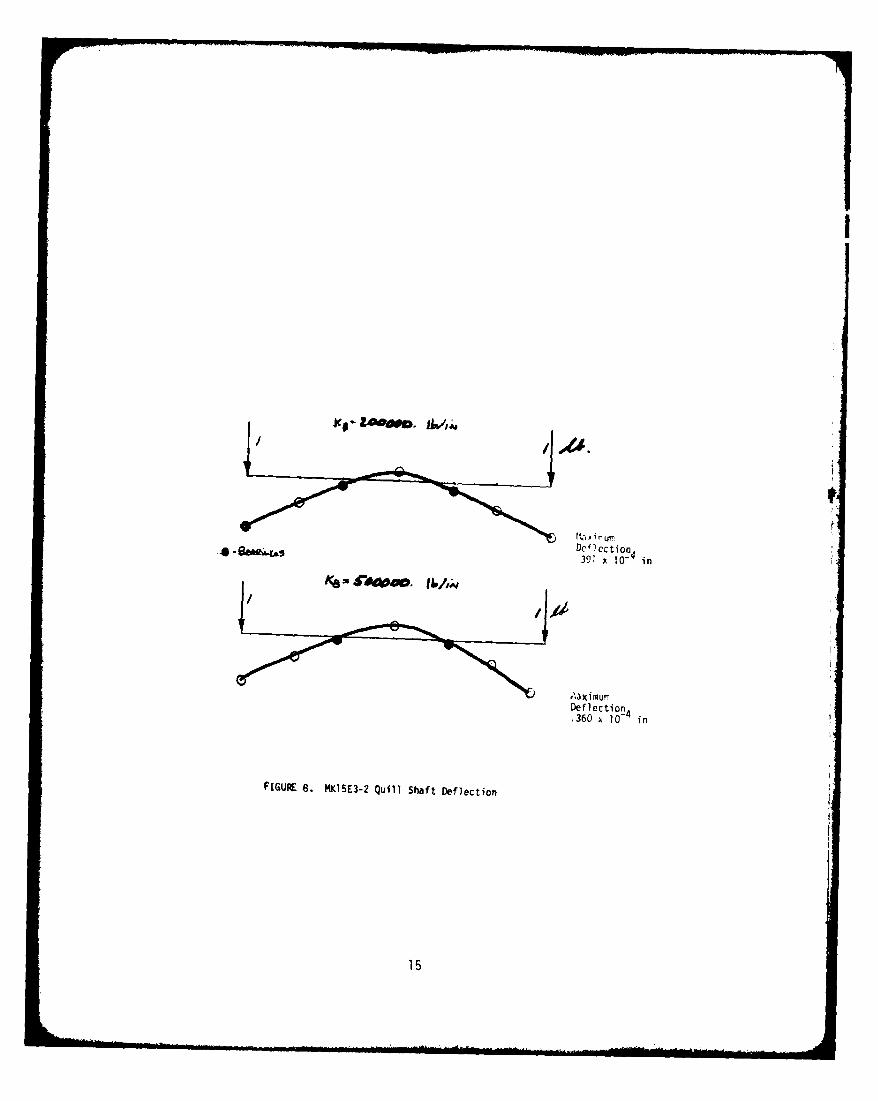
. 391 x io- in
.""jimurrDeflection.360 x 104 in
F[GUW- 8. MK15E3-2 Quill Shaft Deflection
15

Ice. -j
I. 10 50
0
to ________________ -
Torque Meter Displacement in
FIGURE 9. MKl5E3-2 Torque-Meter Displacement vs Load
16
I
BRG STIFFNESS X CRITICAL SPEED ( PM-
K9 K5 0 K2 1 K30 Nl N2 N 3 N4
0.2 0.2 0.2 3.2 5157 24045 27-79 76683
0.2 3.2 0.5 0.5 7927 24045 27179 3- i.:I
1.2 0.2 1.0 1.0 10734 24045 27079 32114
"1.5 0.5 0.2 0.2 5157 28274 343-1 766 )0
3.5 0.5 0.5 0.5 7927 28274 34371 97164
5 0.5 1.0 1.0 10734 2827 34371 979)
0. - - -74 3
NOTE: Square TM, alum. quill, unlocked
TABLE 1. Bearing Stiffness versus Critical Speed,S t ndard Case - 500 in-lb TorQuemeter
BRG STIFFNESS X 10-6 CRITICAL SPEED (RPM)
K9 K50 K21 K30 NI N2 N3 N4
0.2 0.2 0.2 0.2 3157 24276 36679 766:3,J
3.2 0.2 0.5 0.5 7927 24276 36679 921
0.2 0.2 1.0 1.0 10733 24276 36679 93194
0.5 0.5 0.2 0.2 5157 39904 40855 76680
3.5 0.5 0.5 0.5 7927 393'1 43355 97193
0.5 0.5 1 .0 1.0 10733 399)4 40855 98021
NOTE: Squirrel caqe TM, alum. quill, unlocked.
Table 2. Bearing Stiffness versus Critical Speed,Standard Case - 100 in-lb Torquemeter
17

BRG STIFFNESS X 10- 6 CRITICAL SPEED (RPM)
K9 KSO K21 K30 N1 N2 N3 N4
0.2 0.2 0.2 0.2 5944 24045 27J79 62793
0.2 0.2 0.5 0.5 9140 24045 27079 32149
0.2 0.2 1.0 1.0 12380 24045 27079 82141f
0.5 0.5 0.2 0.2 5944 28274 34371 62792
0.5 0.5 0.5 0.5 9140 28274 34371 92135
.5 0.5 1.0 1.0 12380 28274 34371 97929
NOTE: Square TM, alum. quill, unlocked.
TABLE 3. Bearing Stiffness versus Critical Speed,End Disc Replaced - 500 in-lb Torquemeter
ORG STIFFNESS X io- 6 CRITICAL SPEED (RPM)
K9 K50 K21 K30 NI N2 N3 14
0.2 0.2 0.2 0.2 5944 24276 36678 62793
3.2 0.2 0.5 0.5 9140 24276 36672 4207.-
0.2 0.2 1.0 1.0 12380 24276 36673 9319
3.5 0.5 0.2 0.2 5944 34934 40855 62794
0.5 0.5 0.5 0.5 9140 34904 40855 92133
0.5 0.5 1.0 1.0 12380 34934 40355 97965
NOTE: Squirrel cage TM, alu. quill, unlocked.
TABLE 4. Bearing Stiffness versus Critical Speed,End Disc Replaced - 100 in-lb Torquemeter
18
BR STIFF:E SS X 10-6 CRITICAL SPEED (WRpi
K9 K50 K2 1 K30 NI N2 :43 A4
0.2 0.2 0.2 0.2 6183 24045 2737,, 44546
0.2 0.2 0.5 0.5 9446 24045 27079 C, U
0.2 0.2 1.0 1.0 12674 24045 27079 82149
.5 0.5 0.2 0.2 6183 28274 34371 44546
.5 1.5 0.5 0.5 9446 28274 34371 63779
.5 0.5 1.0 1.0 12674 28274 34371 93163
NOTE: Square TM, alum. quill, unlocked.
TABLE 5. Bearing Stiffness versus Critical Speed,Both Discs Replaced - 500 in-lb Torquemeter
-- 6I I
BRG STIFFNESS x 1O6 CRITICAL S EEO (RPNI
K9 K30 K21 K Ni N2 13 N4
0.2 0.2 0.2 0.2 6133 24276 36673 44346
3.2 0.2 0.5 0.5 9446 24276 36677 6"
0.2 0.2 1.0 1.0 12674 24276 36679 9292D
0.5 0.5 0.2 0.2 6183 34933 40354 44547
0.5 0.5 0.5 0.5 9446 34904 40355 681?79
0.5 0.5 1.0 1.3 12674 34904 4255 93171
NOTE: Squirrel cage TM, alurr. qui11, unlocked
Table 6. Bearing Stiffness versus Critical SpeedBoth Discs Replaced - 100 in-lb Torquemeter
19
Referring to Tables I through 6, note that the lowest torquemeter mode is
slightly above 24,000 RPM. Adhering to a 20% margin on the critical speed
to account for magnification factors on bearing loads, the maximum safe
running speed is found to be 20,000 RPM. However, this system has been
modeled with loose couplings. As bending occurs, the couplings will tend
to lock up and stiffen the shaft, pbrhaps raising this mode above 30,000
RPM. In addition, the relative latitude in bearing stiffness and torque-
meter configuration impose a difficulty in characterizing systemr, criterion.
Once empirical test data is obtained, more accurate estimations of thebearing support stiffnesses are possible.
Because of the uncertainty of the system bearing support stiffnesses, no
attempt would be made to dwell within plus or minus 20 percent of the 1st,
2nd or 3rd critical speed regions during the initial test attempts. Once
the critical speeds and bearing stiffnesses are determined (by empiricalresults and analysis), the test dwell speeds can be closely controlled toreduce operational interference of any system critical speed.
Additional stress analysis was accomplished to define the maximum speed
ramps with respect to both torquemeter configurations.
As presented earlier, the maximum allowable radial deflection at the ends
of the torquemeter shaft is 0.016 inches. This deflection is measuredfrom the original (non-rotating) shaft axis. This allowable deflection is
based on the third mode shape (see Figure 7). The critical failure mode
condition is high cycle fatigue of the shaft.
The maximum allowable torque that can be transmitted through the two
torquemeter configurations and the corresponding maximum rotating accel-
eration is presented below. The minimum time to decelerate the turbine
from 30,000 RPM to zero RPM, assuming constant deceleration (constant
20

torque), is also presented.
Maximum Maximum MaximumTorquemeter Allowable Factor Allowable AllowableConfiguration Torque of Acceleration Deceleration
(in-lb) (in-lb) S (RPM/sec) Time (sec)
100 200 2.2 330 34.
500 2100 4.2 8400 3.7
Maximum possible deceleration of the facility dynamometer from 30,000 to
zero is about 7 seconds. No problem is anticipated with the 500 in-lb
torquemeter in the event of an emergency stop command, but caution must be
exercised in the acceleration or deceleration of the 190 in-lb torque-
mete r.
21
TASK II - HARDWARE PREPARATIONS
Hardware preparations for the program began in September 1979 with the re-
trieval of the MKI5E3-2 turbine assembly, P/N XEOR 943562, from storage.
Previous history of this assembly included testing in 1977 as part of the Fast
Start Turbine Project using a hydrazine gas generator to power the turbine. The
turbine incorporated 37 inlet nozzles in place of the previously tested 41 to
raise the turbine blade torsional mode resonance speed. A total test time of
9 tests for 37.4 seconds was accumulated during the Fast Start Project at a
maximum speed of 31,800 RPM. Following that test program, the turbine was
placed in storage at Rocketdyne without being disassembled.
The turbine assembly was partially disassembled for the Windage test program to
remove the thrust washer and runner and to replace the oil jet assembly which
becomes inoperative due to the removal of the washer and runner. A close exam-
ination of the turbine end bearing revealed some flaking of the bearing cart-
'ridge silver plate. The silver flakes were removed by flushing with oil. The
relatively soft silver acts as a seating agent as the balls run-in, and the
amount of flaking observed is not sufficient to impair the operation of the
bearing.
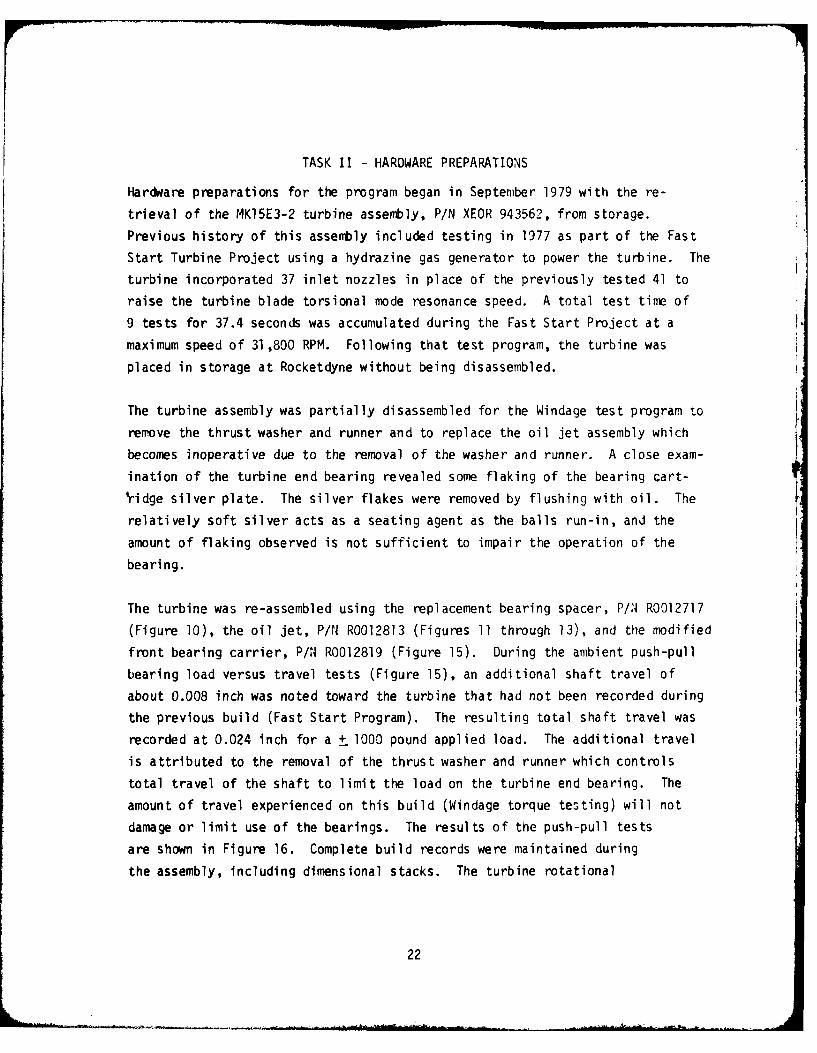
The turbine was re-assembled using the replacement bearing spacer, P/.1 R0012717
(Figure 10), the oil jet, P/N R0012813 (Figures 11 through 13), and the modified
front bearing carrier, P/N R0012819 (Figure 15). During the ambient push-pull
bearing load versus travel tests (Figure 15), an additional shaft travel of
about 0.008 inch was noted toward the turbine that had not been recorded during
the previous build (Fast Start Program). The resulting total shaft travel was
recorded at 0.024 inch for a + 1000 pound applied load. The additional travel
is attributed to the removal of the thrust washer and runner which controls
total travel of the shaft to limit the load on the turbine end bearing. The
amount of travel experienced on this build (Windage torque testing) will not
damage or limit use of the bearings. The results of the push-pull tests
are shown in Figure 16. Complete build records were maintained during
the assembly, including dimensional stacks. The turbine rotational
22

4LC4 -1r /2I, -~I
Figure 10. Runner Replacement

Figure 11 Turbine Bedrinq Oi I Je't, 'iewA

riqure 12. Turt',irw Bearing Oil Jet, View B

Figure 1I~ Punner/Turbinf- Iear1'-

Figure 14. Rear Bearing Carrier
27

I--own
Figure 15, Assembly Push-Pull Apparatus

1000
800
. 600
400 U"LOADINGo, 400
200
0 2 4 6 8 0 14 16 18 20 22 24 29 3DEFLECTION (in x 10
_j 200
NOTE: TOTAL TRAVEL = 0.024 INCH
S 400
600
, 800 t
00
FIGURE 16. Turbine Assembly Push-Pull Results
29

breakaway torque was 10-20 in-lbs with a running torque of 5-10 in-lbs.
Hardware to support the Windage torque testing was ordered from three outside
vendors: APV Manufacturing (majority of the tester hardware), Grove Gear
(quill shafts and quill shaft adapters) and Lebow Associates, Inc. (torque-
meters and Signal Conditioning Unit). Delivery of all the hardware on time
was the only significant problem experienced during the program. The quill
shafts and quill adapters were received only ten days behind schedule, but
dimensional discrepancies precluded their use without rework by the vendor.
The quill shafts and spline adapters were re-machined by Grove Gear to correct
out of tolerance pilot fits between the quill shafts and the spline adapters.
Actual dimensions of the pilots (see drawings P/N R0012814, R0123l5 and
R0012816) were not per print but the fit-up dimensions were held (i.e., dia-
metral clearance dimension was maintained).
No problems were anticipated with the change in actual diameters as long as
the same pilot fit was maintained.
Table 7 presents the Windage torque tester hardware manufactured for
the program. The assembly drawing is supplied as Appendix A of this report
with actual photographs shown in Figures 10 through 24. Copies of the
individual drawings are available at Rocketdyne.2
2 Copies available from Rocketdyne Division of Rockwell International,6633 Canoga Ave., Canoga Park, CA 91304, Attention: R. F. Sutton
30
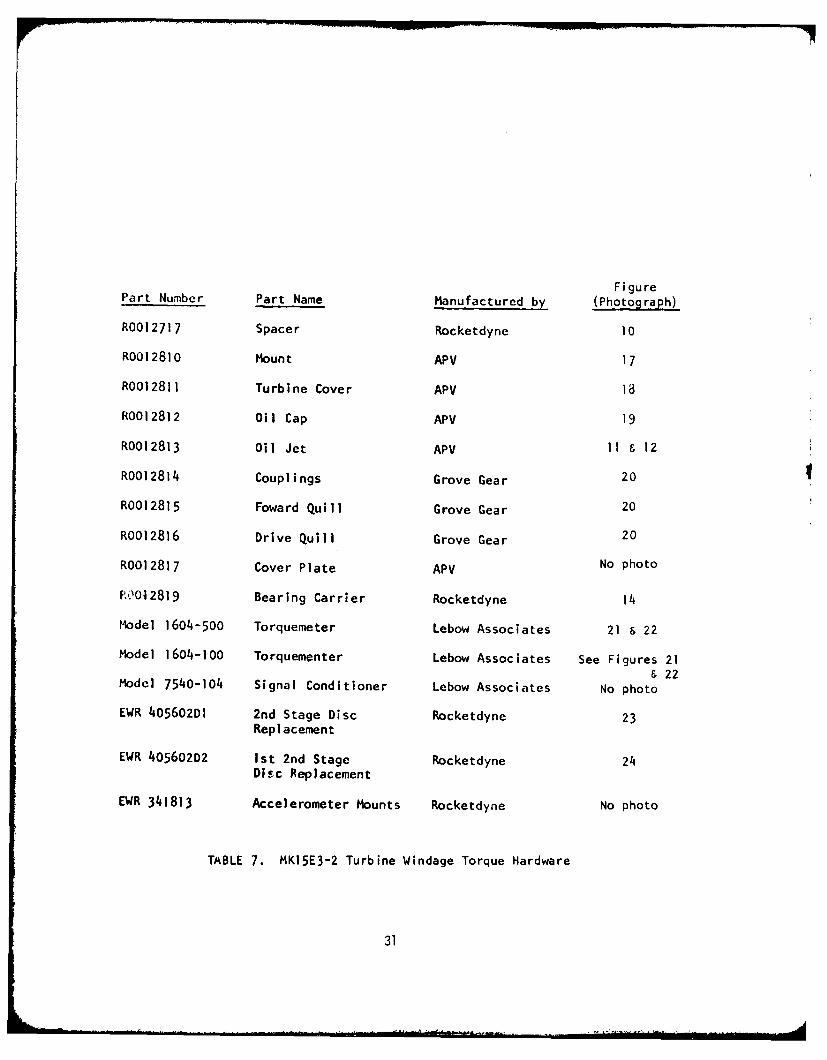
Figure
Part Number Part Name Manufactured by (Photograph)
R0012717 Spacer Rocketdyne 10
R0012810 Mount APV 17
R0012811 Turbine Cover APV 18
R0012812 Oil Cap APV 19
ROO12813 Oil Jet APV 11 & 12
ROO12814 Couplings Grove Gear 20
R0012815 Foward Quill Grove Gear 20
R0012816 Drive Quill Grove Gear 20
R002817 Cover Plate APV No photo
RC00l2819 Bearing Carrier Rocketdyne 14
Model 1604-500 Torquemeter Lebow Associates 21 & 22
Model 1604-100 Torquementer Lebow Associates See Figures 21
& 22Model 7540-104 Signal Conditioner Lebow Associates No photo
EWR 405602DI 2nd Stage Disc Rocketdyne 23Replacement
EWR 405602D2 ist 2nd Stage Rocketdyne 24Disc Replacement
EWR 341813 Accelerometer Mounts Rocketdyne No photo
TABLE 7. MK15E3-2 Turbine Windage Torque Hardware
31

Figure 17. Mount Assembly
32

Figure 18. Turbine Exhaust Cover
33

Fiur 1. ea Bain Cve/Ol0e
340

Figure 20. Quill Shafts and Quill Adapter

Figure 21 Model li't)-1 1(, n1)

Figure 22. Model 1604-116 (500 in-ib) Torquemeter, View B
37

IXY52-2/21 /80-Cl
Figure 23. Second Stage Wheel Replacement Disc
38

lob%
wi (Ire )4 Fir, t inl( d q ,o nIi w

TASK III -
Effort conducted during task iii, although gerer Ily iass ie, , we es,
included facility mechanical and instrumentation plei ;t ions, ,', e 5/SW'
balancing, actual data runs (tests), disassembly , t tester Ir.lj Ird
storage preparations. The followirng se,.tions discuss t,,,,r s.juu-ti : e , lrt
conducted during the r.IKlSE3-? TrBine 'indane iorque cre.;ric .
Facility Preparations
FPeparations of the facility to adapt the MKIE3-2 Wiodage Tor; -,es* ,rti :le
began by adapting the existing Brayoil lOIS/LKTL797 bearing luoe r,',l syste ,o
the specific requirements of the MKlE3-2. Fiqure 25 presents Q sc'JiPe,1atic -:
the required operational system including the air/oil mist lubrlcatfir f,.r te
torquemeter bearings. The heat exchanger at the exhaust cavity wa, ad.ed .o
prevent damaging the soft seat o' toe vacuuri flow( control valve. ,ie syster,
was sized for a maximum exhaust flow of about 0. 'lb lb/sec (air) or nearly ten
times the expected rate. Instrumentation necessary to obtain winc(qe oata anci
turbine system operational data is listed in Table 8. As testing progresseJ,
however, two additional radial accelerometers were mounted on the torq-aemeter
housing to monitor housing displacement or a red-line backup syster, fn' then
quill shaft(s) orbital displacement. Figure 26a shows the dynr'-niivteI; (,rtrHl
panel with lube oil system controls. Fiqure 26b shows the iis:,,rntaricn
systems which recorded the various windaqe torque data, inc:.i:... mie YiVL
analyzer. Figure 27a shows the three dual Dean oscilloscpe, .1-;ed Ih tjr ie
accelerometer, drive end and turbine end Bently orbital d'splJy. uic: re Z"11;
shows an actual example of the system drive end Bentiy -)rbital mce.
photo, one centimeter equals 0.005 inch. The two spikes repreien- te .'
inch pre-rachined calibration marks on the outside dia:-,eter or t' l ii
shaft. For the display shown, shaft total de>'eio nf Ily c. r'c 1,
iriicatei, or- well within the " in.d ch m d1a' '- ' "
,r analyzer systerr ;canned the ap; ri ,,Icd rjrP' rr P-, ,
prooirauirled to prnr cut the data on Ir" tapo 'rli . 1 , 1 ,
seui rrds, which is te instrument Ii t. he :, ',n ' n, ',-... .
atir)n acquisition proved to be of no &Jr1s, , . ' ' ,,,', . , r "0 ;n s ',
4i

LUS6ESUPPLY BroyoIITANK 1015
0-(1000 RPMq
GEAROX -TURBINE INLET FLANGE-4f To VACUUM PUMP9S
TURBINE .- CAVITY Ceo
.TONOUEMETER - WHEELS PLATE o 1^
SCAVENGE
OIL PUMPC ATC HTANK
FIGURE 25. MK15E3-2 System Requirement Schematic
41

GAUGE 0001I0 Im TAPE MOLINE*PAIIAMITIA 4.9440 ID 00*0. CHIANNEL c 1941*11 VALUE _________________
0-50.000 a' Panel III, 6 6 '33.000
0oq -500 T Lb- 7 - lIO*0 -1-1, M04.1 110 lb *0 PI..'
or7540 too f. 1 6 0 Rp fr,.,0-I00
1.obl,, C~oP... 01 I 1 15 psis TCPI - I-
lurbl00 C*V. free, 54 f5 psi@ TC04 G-9. 2 --
St I Stct Out Pr. 15 ps* P2 3
TurbI.,e Jet In P,. 200 psig P1.52 G..q. - VTurbine C., tw 120SF 0004 So-1, 11 - '1000*P
Torb,1M Wlct e 12DOF TO? - 13 -
T.06100 Ottb'd frg t..M 700! T&02 0Sorb 12 - 200OF 150-F bI.-I IN.
L. oi i. Thr*,S 0-2 GPM Q1 panel Mbr 4 -
Lub. OillPia,#, Outb'd 0-2 GPM Q2 Panel lmtr 5 -
Ocoible. Radial VonI 20 0*115 Tf 0SC - 1 1I0 0*910
tore,. tor:. In":y -. 2" 952 3 1" 0,,
TABLE S. r4K15E3-2 Turbine 'Aindage Torque TestInstrumentation List
42

a) MK15E3-2 Control Panel
Lebow Model 7540
Doric Analyzer RPM(Digital Output)
SignalConditioning
b) Data Acquisition System
FIGURE 26. MK15E3-2 Instrumentation and Controls
43

Drive EnoTurbine Bently DisplayAcDce 1
Turbine EndFBently Display
0 0II,/
a) Observer Oscilloscopes
b) Typical Bently OrbitalDisplay - Photographedduring 5000 RPM SteadyState
FIGURE 27. Bently and Turbine Accelerometer Oscilloscope Systems
44
turbine speed was allowed to stabilize for a minimum of 30 seconds, or at
least three stabilized level printouts on the Doric tape.
System A ignment
Alignment of the torquemeter to the turbine (before installation in the test
cell) and to the dynamometer output shaft proved to be very difficult. The
two quill shafts (drive end, P/N R9012816 and turbine end, P/N R0012315) were
designed with uncoupled (%0.001 inch maximum loose fit) splines to withstand
the rotordynamic conditions expected. An alignment tolerance of 0.092 inch
per inch length was required in both parallelism and concentricity. Actual
turbine end alignment was done on the bench with a maximum of 0.0006 inch/inch
alignment achieved. A special alignment tool was fabricated to aid in the
alignment procedure (Figure 23a). Once the torquemeter was aligned, the
torquemeter foot mount was pinned to the turbine mount pedestal. The assembly
(turbine, mount, torquemeter) was then lowered into the rotary test cell for
mounting (Figure 28b).
During the alignment of the turbine (and torquemeter) to the gearbox, several
problems were encountered. First, an alignment fixture similar to the bench
alignment fixture had to be fabricated to move the massive assembly, both in
yaw and pitch. Second, because of gearbox shaft centerline growth (about
0.006 inch upward), when at operating oil temperature (%I00 F), the gearbox
lube system heaters had to be turned on while performing the alignment. Third,
an output shaft aligning head had to be fabricated to locate the center of the
drive shaft perpendicular to the torquemeter (and turbine) shaft. Lastly, the
gearbox shaft rotational centerline centers within about 0.002 inch at speeds
above 1000 RPM. The aligning procedure accounted for all of these variables,
and as can be expected, proved to be very laborious. Nevertheless, final
alignment to 0.0004 inch/inch was achieved. It is recommended that particular
care be taken during future alignments since spline wear or failure can be
the result of an improper alignment.
45

a) Turbine to Torquemeter Alignment
Flow ControlValve (vacuum)
MKI5E3-2 Heat Exchanger
10:1 Gearbox
b) MK15E3-2 Test Cell Installation
FIGURE 28. MKI5E3-2 Alignment and Installation
46

Lube System Flow Checks
After alignment, the lube oil systems were checked to determine bearing lube
flowrate versus tank and lube jet pressure. Two 3/8-inch lines were plumbed
in parallel to each turbine jet manifold. In one leg (turbine end bearing),
a hand valve served as a variable orifice. The tank was pressurized until
the unobstructed lube supply line (rear bearing) flowed about one GPM. The
hand valve was then adjusted to also flow about one GPM, thus providing similar
hydraulic resistances in the two systems. A series of pressure versus flow-
rates were then run to construct a bearing lube flowrate curve (Figure 29).
The purpose of this blowdown test was to aid in determining required bearing
flowrate during a test, depending on the temperature of the bearing. Each
system resistance proved to be slightly different (see Figure 29). Only the
outboard bearing temperature was monitored for the test series, it having the
lowest flowrate. No problems were encountered during any of the testing with
a lube jet pressure of about 180 psig (1.0 to 1.2 GPM) setting. As can be
seen in the raw test data compilation, flowrates above 1.2 GPM were recorded,
but generally this is attributed to the type of test conducted - usually
vacuum conditions in the exhaust cavity.
System Dynamic Balancing
The quill shafts and turbine were dynamically balanced prior to the first test.
A Hofmann in-place balance system was used to balance the systems to less than
one gram-inch unbalance. Considerable difficulty was experienced in the first
balance operation when balancing at about 2000 RPM. The turbine single plane
unbalance was reduced to 0.25 gram-inch, or well within the 1.0 gram inch
required by the assembly drawing. The torquemeter on the other hand indicated
a balance correction at each end of the shaft of about 12 gram-inches. The
magnitude of the suggested correction could not be accounted for in either
misalignment, torquemeter residual unbalance or fit-up within the cplines.
The corrections were made, however, and the first three tests were conducted
using the Hofmann balance accelerometers at the radial position of each torque-
meter bearing as a red-line monitor. Housing displacement in micrometers was
closely monitored as a r red-line. On the third test, an unacceptable torque-
47

71.--7 7
Ad-bv-
0 -0~ 4 -
K?-4 -K _
Z0 300lye
FIUR 9.1KE - <K bneWn ageOtor/ n nbadBaigFovesu LueJe res
-- C--- -#48

meter housing displacement of about 30 micrometers was obtained at about
12,000 RPM. A decision was made to balance the torquemeter system (quill
shaft plus torquemeter) at 9500 RPM. The balance speed of 9500 RPM was
selected after reviewing the high speed FM data or the minimum G-level
resonance value below the anticipated first critical system speed (Figure 30).
After balancing at 9500 RPM, the residual unbalance was only about one gram-
inch. Set screw correction weights were installed with no further problem
with the torquemeter accelerations. For data analysis backup, two radial
accelerometers were installed to monitor the torquemeter. Figure 31 shows the
Hofmann UGA2000 analyzer and the location of the balance accelerometers while
balancing the turbine end.
Windage Tests
The MKl5E3-2 was readied for the first test on 8 September 1980 after com-
pleting all necessary preparatory checkouts. Testing continued until
26 September 1980, accumulating 25 tests, 5 balance operations and approxi-
mately 32,810 seconds of rotor operation. During the test series, another
turbine cavity test media (helium) was used to gain additional empirical
windage data on six tests for 2213 seconds on two different turbine config-
urations. The helium testing was sponsored by Rocketdyne and the results are
available to the Air Force Aero Propulsion Laboratory.' The total turbine
time mentioned above includes the helium media testing.
The test matrix presented in Table 9 was successfully accomplished in a total
of 19 tests. Of these tests, ten were necessary to satisfy the requirements
of the first series, while three each completed the next three series.
Figures 32 and 33 show the MKl5E3-2 turbine windage tester with the exhaust
cover installed for partial vacuum conditions. For the atmospheric tests, the
two large plugs in the cover were removed (see Figure 32). Figure 34 shows
the shrouded E3 second stage wheel which represents test series #1. Figure
3 ITR-80-076, available through Rocketdyne Division of Rockwell International,6633 Canoga Ave., Canoga Park, CA 91304, Attention: R. F. Sutton
49

IF.P I J, F I
.24 T D I T * F1 1 # 3z; 4 L .
L,' ,1 KF--t[
" "-T
F.Fb
06 1
E. Or -
0. CTii r, 4-.-n j oi i-. r,, _ -n CL. LJ r.
T. I F
J , T H4- E T., rv F-, I ' ~ 7 I - I] ' x '
t E, NUMirE= 'E1 -PF
CAL VOLTS- 604 V RMITIME BRSE EXPANSION
= I I
DE GCAIN 3 dt,
FIGURE 30. Test 1-003 RPM and Turbine Radial Acceleration
versus Test Time
30

a) Hofmann UGA2000 Balance Analyzer
Secondary Balance
Primary Balance Plane
Plane
b) Balance Accelerometer Locations
FIGURE 31. MK15E3-2 Balance Equipment
51

TU RB INETEST TEST CONFIGURATION CAVITY SPEEDSERIES # (WHEELS) PRESSURE RPM
1 1-001 E3 1st & 2nd stages Ambient 15,000
1-002 Ambient 31,000
1-003 7 psia 31,000
1-004 1 psia 31,000
2 2-005 E3 Ist stage - Replacement Disc Ambient 31,003
- 2nd stage
2-006 7 psia 31,000
2-007 1 psia 31,0J0
3 3-008 Replacement Disc - 1st & 2nd stage Ambient 31,003
3-009 7 psia 31 ,000
3-010 1 psia 31 ,0 0
4 4-011 E3 Ist stage - El 2nd stage Ambient 31 ,000
4-012 7 psia 31 ,0004-013 1 psia 31,000
TABLE 9. MK15E3-2 Test Matrix
52

Figure 32. View of MK15E3-2 Windage Tester -Drive End
53

44
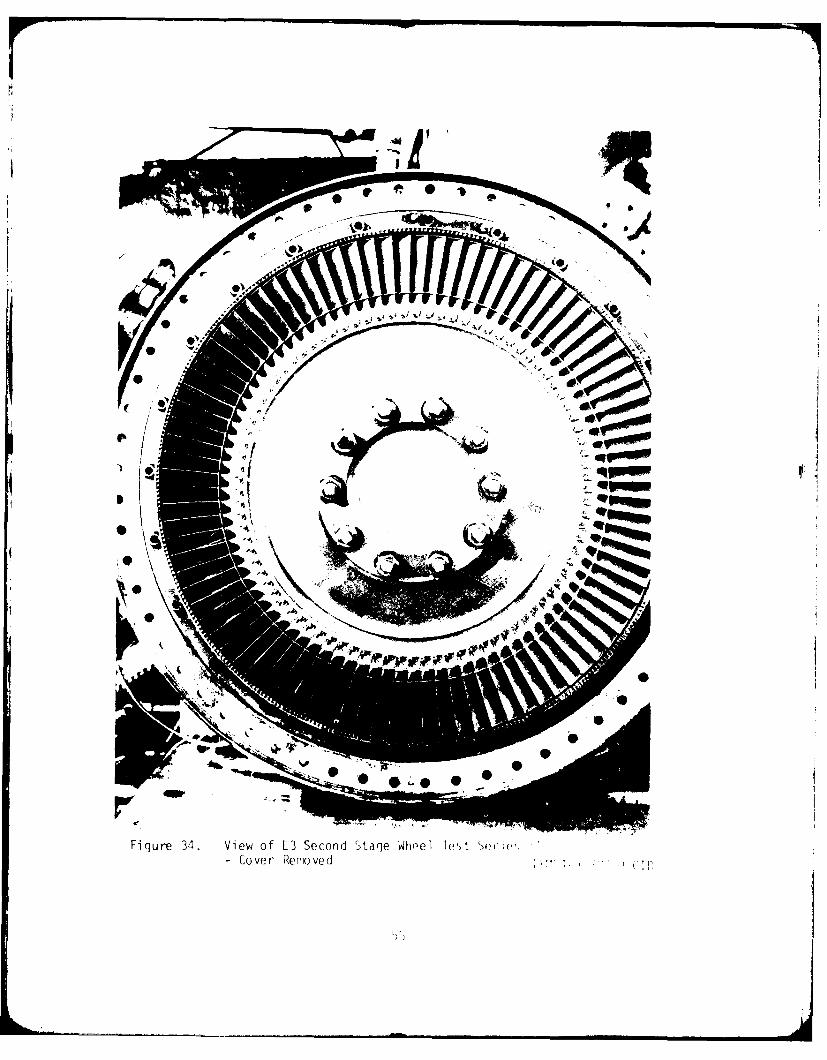
Figure 34. View of E3 Second Stage 'Whpel Tet, SeWrf-,-Cover Reirioved

35a shows the small cylinder replacement second stage wheel installation (test
series #2), while 35b shows the large cylinder replacement for the first and
second stage wheels (test series #3). As a weight comparison, the E3 second
stage wheel weighs about 27 pounds, the small cylinder weighs about 16 pounds.
The first and second stage wheels in combination weigh about 50 pounds, while
the large cylinder weighs about 28 pounds. The difference in masses had no
effect on the steady state torque data. The use of the replacer-ent discs was
necessary only to secure the wheel studs which could not be removed without
total turbine disassembly - a costly procedure. Figure 36 shows the El second
stage unshrouded wheel which was installed for the fourth test series.
A test by test discussion is presented below, while a summary of the testing is
shown in Table 10. Figures 37 through 40 present the observed power loss
versus rotor speed and cavity pressure for the four test configurations of the
MKI5E3-2 turbine. Included in the power loss are vane pumping, disc friction
and bearing and seal friction. A detailed analysis is presented in Task IV.
Test: 1-001
Test Date: 9-3-80
Duration: 385 seconds
Objective: 1. Checkout system to 5000 RPM.
2. Atmospheric pressure windage torque data with E3
1st and 2nd stage wheels.
3. Validate balance operation.
Results: Obtained torque data at 100, 2000, 3000, 4000 and 5J0,
RPM levels. Maximum torque at 5010 RPM was 39 in-lbs.
All data acquisition systems functioned well. iHaximum
Bently displacement at the 5K RPM level was 0.J012 inch
radial at the drive end quill shaft. The Hofmann balance
analyzer shows comparable results.
Analysis: Because of the apparent large unbalance corrections at the
torquemeter, the next test will be conducted to verify the
unbalance at 5000 RP1 versus the balance speed of .,N) RPM.
The Hofmann analyzer will be used as a red-line monitor tnr
torquemeter displacements.
7)';1

a) Small Cylinder - Test Series #2
b) Large Cylinder - Test Series #3
FIGURE 35. Test Series #2 and #3 Configurations- Exhaust Cover Removed
57

q\ !J
Figure 36. El Second Stage Unshrouded Wheel Test Series #4
58

ACCUMULATED MAX I MUM
DATE TEST DURATION, DURATION, SPEED,OF TESI # SECONDS SECONDS RPM
I2 I IIfm :
9/5/80 Balance #1 %7200 7200 2000
9/8/80 1-001 385 7585 5910
9/9/80 1-002 953 8538 5000
9/10/30 1-003 256 8794 11900
9/11/30 Balance #2 %3600 12394 9540
9/11/80 1-004 222 12616 9550
9/11/80 1-005 222 12838 9540
9/12/80 1-006 683 13521 30350
9/12/80 1-007 630 14151 30240
9/15/80 1-008 102 14253 9780
9/15/80 1-009 399 14652 303209/15/80 1-010 416 15068 29870
9/17/80 Balance #3 %360) 18668 50,00
9/18/80 2-011 604 19272 30140
9/18/80 2-012 290 19562 29770
9/19/80 2-013 563 20125 25570
9/22/80 Balance #4 %3600 23725 5000
9/23/80 3-014 594 24319 27630
9/23/80 3-015 488 24807 277509/23/80 3-016 359 25166 25060
9/23/80 3-017H 254 25420 25080
9/23/80 3-018H 345 25745 250209/23/80 3-019H 335 26080 25020
9/25/80 Balance #5 %3600 29630 50009/26/80 4-020 673 30353 29440
9/26/80 4-021 651 31004 27080
9/26/80 4-022 527 31531 26779
9/26/80 4-023H 468 31999 27020
9/26/80 4-024H 440 32439 27460
9/26/80 4-025H 371 32810 28000
NOTE: a) Total time = 9 hours, 6.83 minutesb) X-XXXH = helium environment in cavity
TABLE I0. MKl5E3-2 Windage Torcue Test Suntmary
59

NOTE: Power losses include vane puvmina, discfriction, bearto and seals. Vanes areshrouded.
160 1-006 (14 psla)
140
Power. DIP
100A 1-010 (8 psI.)
.s0 --
660
40.0 00 /0,- I5)9 (0.3 psia)
20
-0 10Oh
Rotor Speed - KRPM
FIGURE 37. MK1SE3-2 Power Losses -Test Series aj1 (Two Wheel)
60

NOIE: Pc~mel lisses tncludi vane puMping, discfriction, bearing and seals. Vanes are
00 shmiUded.
0 .2-011 .(14 psia)
,10" C
I -
40 '30
2-012 (0.7 psi&)
0 10 15 20 25 30
40tor S~eed -KIRPM
FIGURE 38. MK15E3-2 Power Losses - Test Series #2 (Single Wheel)
61

* 22* NOT : Poer losses include drun friction, 3-014 (14 911l)
bearing and fade seal. Does notinclude shaft riding Seal. 3-dl6 (7 psU)
14I
At .1
, Power .. H" 1 0 ... .. . ... ... ..olo
* 86
5 10 I5 21 25 3)
FIGURE 39. MKl5E3-2 Power Losses Test Series f3 (Bearinnand Seal)
62
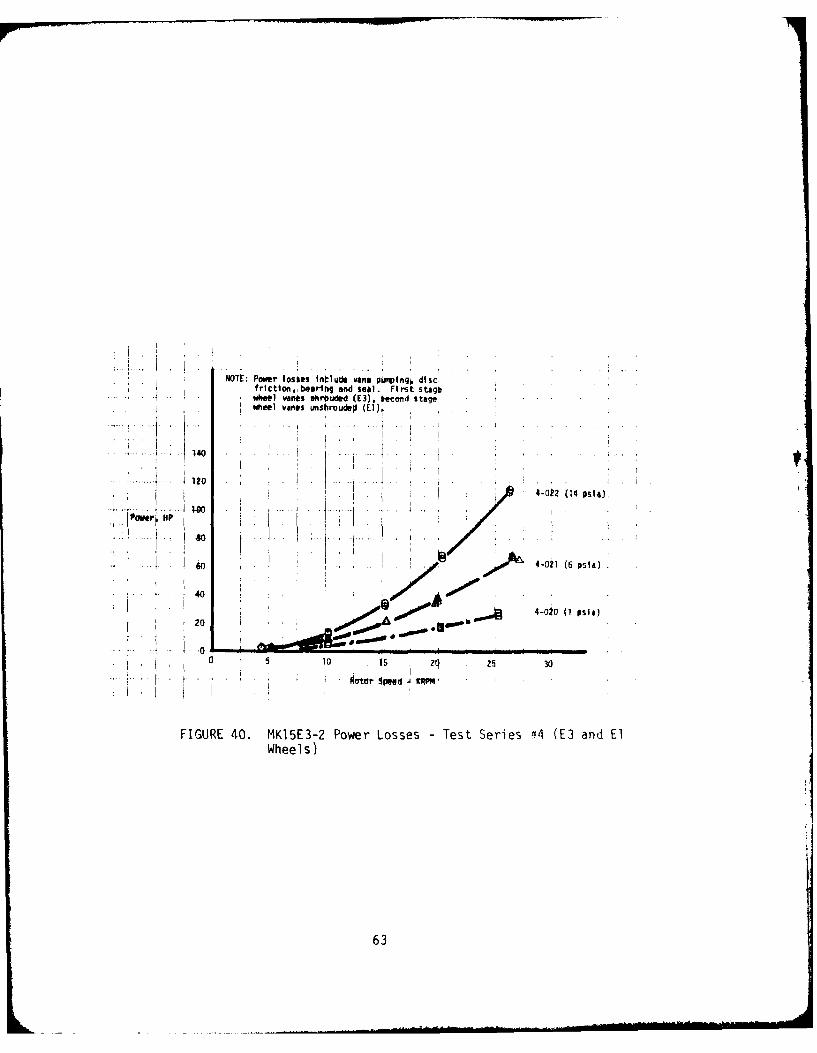
NOTE: Power losses Intlude wane pumqing% discfrictiol, bearing and seal. First staqe
w.eel vanes arouded (E3), eand stagewheel vanes unshroudes (El)o
i 140° .. . ... t. ... .- . , . . . .
. .40.. ..* ...1o.. .. . . . . . .
-. 60 .. . .*4-0*1 (6 esll)
20 4-020 (1 Osit)
I. ..1. .o, , i I I I I I I I I
1 15 20 25 30
" 'otor fpead 4KR 1
FIGURE 40. MKI5E3-2 Power Losses - Test Series 4 (E3 and ElWheels)
63

Tes t: 1-002
Test Date: 9-9-80
Duration: 953 seconds
Objective: 1. Atmospheric pressure wind lo, torque data with E3 Ist
and 2nd stage wheels to 5JjO RWt,.
2. Investigate capability of torqjemeter quill shafts to,
indicated unbalance.
Results: Torque data consistent with previous test at 1K RPi incre--
ments from 1K to 5K RPM. Bently orbital deflections
about the same as previous test.
Analysis: An attempt will be made to ramp to 30,000 RPM on the next
test using the Hofmann analyzer as a red-line for the
torquemeter displacement.
Test: 1-003
Test Date: 9-10-80
Duration: 256 seconds
Objective: 1. Atmospheric pressure windage torque data with E3 1st
and 2nd stage wheels to 30,000 RPM.
2. Obtain comparative displacement data between Bently
orbital plots and Hofmann analyzer.
Results: Test terminated by the Hofmann analyzer red-line observer
when torquemeter housing displacement reached 30 micro-
meters. This is an unacceptable displacement when
compared to industry standards for comparable rotating
machinery systems. Figure 37 was used for the guide as
the vibration severity indicator for this type of rotati,
machinery. Maximum acceleration of the turbine radial
accelerometer was only 0.12 GRMS maximum - the red-line
being set at 10 GRMS (refer to Figure 30). iuring trie
test, torque data was recorded at stabilized steady start,
speeds to 11,180 RPM. Testing was halted at this poln
since steady state speeds of 30,000 RPM seemed unlikeiy
with the existing balance. The torquemeter/quili sh a,
64

T-
4?
Rotor Speeo a KRPM
FIGURE 41 Rotating Machinery Vibration SeverityGuide
65

system was then re-balanced at 9500 RPM to 0.13 gram-inch
(turbine quill) and 0.38 gram-inch (drive quill).
Test: 1-004
Test Date: 9-11-80
Duration: 222 seconds
Objective: 1. Atmospheric pressure windage torque data with E3 1st
and 2nd stage wheels to 30,000 RPM.
2. Torquemeter balance verification
Results: Hofmann analyzer red-line observer terminated test at
approximately 12,000 RPM when the vibration amplitude of
the torquemeter housing exceeded 10 micrometers. Bently
orbital plots show maximum of only 0.002 inch deflection
with no large excursions. Torque data successfully
acquired up to cutoff.
Analysis: Lead shot bags were placed around the torquemeter pedestal
in an effort to dampen the system. The turbine vibration
was very low, about 0.1 to 0.2 GRMS. An additional test
to 30,000 RPM will be attempted using only the Bently's
and turbine accelerometer red-lines.
Test: 1-005
Test Date: 9-11-80
Duration: 222 seconds
Objective: 1. Atmospheric pressure windage torque data with E3 Ist
and 2nd stage wheels to 30,003 RPM.
Results: Test terminated at approximately 14,000 RPM (determined
from Statos charts) when the Lebow speed sensor (red-line
parameter) failed to indicate the proper speed. The
speed count did not indicate greater than 12,000 RP
while the control panel rough indication was about 15,000
RPM. The Lebow Model 7540 siqral conditioner is used to
convert 60 pulses per revolution into RPM readout and
66

provide the signal to the Doric analyzer for permanent
speed recording. Torque data was recorded at 5000 and
9500 RPM.
Analysis: The speed sensor is a magnetic pickup and was set at 0.026
inch gap (pickup to rotor teeth gap). The gap was evi-
dently too wide for this particular system, although the
gap had been set per manufacturer's instructions. The
gap was reset to 0.911 inch with no additional speed
monitoring problems encountered throughout the remainder
of the test program.
Test: 1-006
Test Date: 9-12-80
Duration: 683 seconds
Objective: 1. Atmospheric windage torque data with E3 1st and 2nd
stage wheels to 30,000 RPM.
Results: Objective achieved. Torque at 30,350 RPM was 325 in-lbs.
RPM was increased in increments to the 30,000 RPM level,
then decreased in the same increments. Maximum turbine
exhaust cavity temperature recorded was 937° F (red-line
was set at 1000°F). The maximum rear bearing temperature
was 1380 F, well below the 200°F red-line. All systems
performed satisfactorily.
Test: 1-007
Test Date: 9-12-80
Duration: 630 seconds
Objective: 1. Windage torque data at 7 psia cavity pressure with
E3 1st and 2nd stage wheels to 30,000 RPM.
Results: Objective achieved. Cavity pressure varied between 4 and
9 psia. Maximum torque of 39 in-lbs at 30,240 RPI.
67

Test: 1-008
Test Date: 9-15-80
Duration: 102 seconds
Objective: 1. Windage torque data at one psia cavity pressure wito
E3 1st and 2nd stage wheels to 30,)00 RPH.
Results: Test terminated after recording torque at )7d0 RPM due
to Doric paper strip malfunction. Cavity pressure of
about 0.3 psia was maintained.
Test: 1-009
Test Date: 9-15-80
Duration: 399 seconds
Objective: 1. Windage torque data at one psia cavity pressure with
E3 1st and 2nd stage wheels to 30,uJ) RPII.Results: Objective achieved. Torque at 30,320 RP was about 53
in-lbs. Cavity temperature maximuv temperat,re was 330°F.
Test: 1-010
Test Date: 9-15-80
Duration: 416 seconds
Objective: 1. Repeat of test 1-007 to provide more stahilized
pressure conditions within exhaust ,avity.
2. Windage torque data at seven psia cavity pressure
with E3 1st and 2nd stage wheels to 30,000 RPI.Results: Objectives achieved. Stabilized cavity pressure of about
7.5 psia maintained with a maximum torque of 197 in-lbs
recorded at 29,870 RPM. This test completed the series
number 1 configuration - E3 1st and 2nd stage wheels.
Test: 2-011
Test Date: 9-18-80
Duration: 604 seconds
Objective: Windage torque data at atmospheric cavity pressure wit!,
68

E3 1st stage wheel and replacement cylinder for the E3
second stage wheel.
Results: Objective achieved. Windage torque for this configuration
(Series No. 2) was about one-half that of the two wheels
in combination (159 versus 325 in-lbs, respectively).
Maximum speed obtained was 30,140 RPM with a maximum
cavity temperature of 492 0 F.
Test: 2-012
Test Date: 9-18-80
Duration: 290 seconds
Objective: Windage torque data at one psia cavity pressure with the
E3 Ist stage wheel and replacement cylinder for the E3
second stage wheel.
Results: Steady state torque data obtained for 1)K and 21K RPIM
levels. During speed ramp from 21K to 30K RPM, the
turbine vibration level indicated slightly rore than 10
GRMS at a maximum speed of 29,770 RPM. The speed was
immediately reduced to obtain steady state torque data
on the downramp at the 20K and 10K RPM levels. 'o evi-
dence of hardware failure or additional problems was
noted.
Analysis: A review of the orbital displays for the Bently trans-
ducers indicated no abnormal deflections during the test
(no greater than about 0.010 inch). However, at about
23K-24K, an increase in the normal deflection ( 0.006
inch) was noted which quickly subsided at about 25K.
While ramping toward 30K RPM, another increase in Bently
orbital deflection was noted starting at about 2K until
the speed was backed off. Coupled with these observations,
the turbine vibration level started to increase from
approximately 1 GRMS at 23K RPM to the 10 GRMS red-line
at the 29,770 RPM obtained. Several possibilities can
explain the increase in "G" level at the 23K RPM level.
69
I. Too high a residual unbalance for this nardware cun-
figuration. (Actual residual unbalance was 0./7 grar3-
inch. )2. Slight movement, or seating, of the replacerient
cylinder pilot press fit causing an increase and/or
shift in the residual unbalance.
3. Bearing wear because of the accumulated run time
(19,562 seconds).
4. Response of the turbine to the thiro critical ,bending,
speed of the (torquemeter) system.
A rigorous rotordynamic analysis of these possibilities
was not performed, but the most probable reason for the
noted increase in turbine vibration level at the 28K to
30K RPM is the coupling, or transmittal, ')f the torque-
meter vibration at its bending mode critical speed (see
Table 3). Calculated critical speed was between 27,079
and 34,371 RPM depending on the bearing support stiffness;
the noted vibration occurred at 28K RP l \,nrc: is in good
agreement with the analytical estimates. It is also
postulated that the second critical speeJ (torquemeter)
of the system occurred between 23K and ?4K as noted by
the increase in Bently displacement. Araln, referring
to Table 3, the second critical speed w a; Analytically
projected to be between 24,045 to 23 ,27A R1h.I For the
second and third critical speeds to be between 2.'K to
28K, the apparent torquemeter bearing support stiffness
should be about 200,000 lb/in. It thus appears that ttre
analytical and empirical results are in qooJ agreement.
Test: 2-013
Test Date: 9-19-80
Duration: 563 seconds
Objective: Windage torque data at seven psia cavity nressure wittn
70

E3 Ist stage wheel and replacement cylinder for the E3second stage wheel.
Results: Objective achieved. Maximum steady state speed of
25,570 RPM resulted in a torque value of 33 in-lbs at a
cavity temperature of 339°F.
Test: 3-014
Test Date: 9-23-80
Duration: 594 seconds
Objective: Windane torque data at atmospheric cavity pressure with
a replacement cylinder for the 1st and 2nd stage wheels.
Results: Objective achieved. Steady state torque data obtained
up to 27,630 RPM.
Test: 3-015
Test Date: 9-23-80
Duration: 488 seconds
Objective: Windage torque data at one psia cavity pressure with a
replacement cylinder for the 1st and 2nd stage wheels.
Results: Objective achieved. Cavity pressure of about 1.2 psia
was maintained throughout speed excursions to 27,700 RPM.
Maximum torque recorded was 40 in-lbs at a cavity temper-
ature of l0°wF.
Test: 3-016
Test Date: 9-23-80
Duration: 359 seconds
Objective: Windage torque data at seven psia cavity pressure with a
replacement cylinder for the 1st and 2nd stage wheels.
Results: Objective achieved. Cavity pressure of about 7.3 psia
was maintained with a maximum torque of 43 in-lbs obtained
at 25,000 RPM.
71

Test: 4-020
Test Date: 9-26-80
Duration: 673 seconds
Objective: Windage torque data at one psia ca' ity pressure with the
shrouded E3 Ist stage wheel and unshrouded El second
stage wheel.
Results: Objective achieved. A maximum speed of 29,440 RPM was
achieved for only a short time due to the high turbine
vibration level increasing from about 1 GRJIS at 28K to
just over 10 GRMS at the maximum RPM. The speed was
immediately reduced with stabilized torque data obtained
at lower speed levels. (Refer to Test 2-012 test
analysis.)
Test: 4-021
Test Date: 9-26-80
Duration: 651 seconds
Objective: Windage torque data at seven psia cavity pressure with
shrouded E3 1st stage wheel and unshrouded El second
stage wheel.
Results: Objective achieved. A stabilized cavity pressure of about
6.1 psia was maintained with a maximum torque of 159 in-
lbs obtained at 26,880 RPM.
Test: 4-022
Test Date: 9-26-80
Duration: 527 seconds
Objective: Windage torque data at atmospheric cavity pressure with
shrouded E3 1st stage wheel and unshrouded El second
stage wheel.
Results: Objective achieved. A maximum torque of 272 in-lbs was
recorded at 26,770 RPM with a cavity temperature of 3670F.
This test completed the program test requirements.
72

Post-Test Di sassembly/Sto rage
Following the test program, the E3 second stage wheel was re-installed, studs
elongated 0.013 and lock tabs secured. Because of the extensive time accumu-
lated on the bearings, Rocketdyne recommended that no further powered
rotation of the turbine be attempted before disassembly, inspection of hard-
ware, refurbishment if required, and re-assembly including balance at 5030
RPM.
The MKI5E3-2 turbine tester assembly, P/N R0012809, was placed in a wooden
storage container along with all other supportive hardware, including the
Lebow Associates, Inc. Model 1604-100 and -500 torquemeters and Model 7540
signal conditioner.
Data Records and Appendices
Appendix B presents the raw data compilation as determined from the Doric
analyzer and other supportive systems. Appendix C is the nomenclature and
data reduction program written for this program. Appendix D is the reduced
data as compiled by the computer program written for this project, while
Appendix E is the revised torque and torque ratio printout.
73

TASK IV DATA ANALYSIS AiD RESULTS
Data Reduction
Average rotor cavity conditions were calculated for each test point. Average
cavity pressure was the average of the Stage 1 outlet static pressure (P2),
turbine cavity pressure number 1 (TCPl), and turbine cavity pressure number
4 (TCP4). Average cavity temperature was the average of turbine inlet
temperature (TTI) and turbine cavity temperature number 4 (TCT4). Turbine
rotor cavity specific weight was calculated using the average pressure and
temperature in the equation of state for air. The absolute viscosity of air
was calculated as a function of the average cavity temperature.
The Reynolds number was calculated for each test point. Reynolds number is
the product of the test speed, the effective diameter squared where the
effective diameter is the turbine blading mean diameter with turbine rotors
or the maximum drum diameter with no turbine rotors, and the cavity specific
weight divided by the absolute viscosity.
Predicted torques were calculated for each test point. Predicted torques
for the bearings, oil face seal, and turbine floating ring seal were functions
of speed. The bearing torque characteristic is shown in Figure 4?. The
equations were supplied by the Mechanical Elements Specialist and are listed
in Appendix C. The rotor disc friction torques were predicted using the
empirically based method by Daily and Nece The blading windage torques
were predicted using the test data correlation reported by Balje and Binslecy.
4Dailey, J. W., and Nece, R. E., "Chamber Dimension Effects on Induced Flowand Frictional Resistance of Enclosed Rotating Disks', Journal of BasicEngineering, ansactions of the ASIIE, Series D, Volume 21, 'lumber 1, 'larch1960, pages 217-232.
5Balje, 0. E., and Binsley, R. L., "Axial Turbine Performance Evaluation.Part A - Loss-Loss-Geometry Relationships", Journal of Engineering forPower, Transactions of the, October 1961, pages 3H1-348.
74

The shroud ring friction torque was predicted using an empirically developed
method by Bilgen and Boulos. 6 Predicted torques for the drums used in place
of the discs were the sum of cylindrical surface torques and the radial face
torque. The equation for each predicted torque is given in Appendix C.
Torque coefficients were calculated as functions of Reynolds number using the
empirical correlations reported in the references.
6Bilgen, E.', and Boulos, R., "Functional Dependence of Torque Coefficient ofCoaxial Cylinders on Gap Width and Reynolds Number", Journal of FluidsEngineering, Transactions of the ASME, March 1973, pages 122-126.
75

C
C
CDC
C4 +
=3 L~ 3
L- L~. j rf
i x C) v,In -C
I- L M Li.
~ LL
ac
~ '0
1 L.A - -It
FIGUE 42 PREDCTEDBEARNG TRUU

The turbine geometry dimensions are summarized in Table 11. Using these
values, the predicted torque for each test point was the summation of the
component torques for the configuration and test. The component torques for
each configuration are listed in Table 12. A torque ratio (TR) was deter-
mined for each test point. The torque ratio is defined as the test torque
divided by the total predicted torque. A torque ratio of 1.3 means the
predicted torque equaled the test torque.
The reduced test data and parameters for each test point are tabulated in
Appendix D. The predicted torques and torque ratios are tabulated in Appendix
E.
Data Analysis
The torque ratios, TR (test torque divided by the predicted torque) for each
point was plotted versus speed for each test. The test configuration and
average cavity pressure were listed on each plot. The torque parameter plots
were compared resulting in the following observations:
NJo Disc Tests. The no-disc tests had predicted torques for the bearings, oil
face seal, and the drum cylinder and end face. The torque ratio versus
speed for the original predicted torques is shown in Figure 43. At 5,000 RPM,
the torque ratio was approximately 1.6 and at 30,003 RPM, the torque ratio
was approximately 0.8. All of the no-disc tests had approximately the same
torque ratio versus speed characteristic which did not vary with cavity
pressure. This substantiates the prediction that drum friction torques were
small compared with the predicted bearing and seal torque. A revised oil
face seal torque characteristic was derived to reduce the data scatter based
on the no-disc tests and the assumption that the predicted bearing torque was
correct and neglecting the drum friction torque. The original and revised
predicted oil face seal torque characteristics are shown in Figure 44. The
torque ratio was recalculated using the revised oil seal torque characteristic
for the no-disc tests and is shown in Figure 45. Figure 45 indicated an
acceptable prediction of the torque and a significant reduction in the 2-sigla
scatter as shown in the following:
77

t f) ci
ro L )k %. mn nn inD CD CD " m cc -7 f ) in Lo efl C: 0 CD) c---, C)zl .CD '. -n C) n i C') 'D-in
in L n V w~ L/) in C'.). C'.C) =3 M . 2 ) M) ofL o
- e m m- -D m :ofo EC\ M) F5 CE) M: FMS 2- cc
CL C) m C) c. -n .-O -/ Lo. c'j C). -j. C) C) -j - --
4-)0
di0 0
c-4 l S-. s-o, 0
a) aiC) 4-' 4-'-- 0 C
m) C ~ CE cC
E E e -. 0 0
di d en S.- -0 .3Mn S- S.- ) 4-' :3 0 -
4-) C j 4- 04- E V)4-
-C'. 4-' C L U U s ZU mn i i - f n i n 4' CO~Z .C C) in Ci. - ~04-S- 0 0 - L2 ) U) ) 0 0 ~ (A 4-
0.D di C i~C ) 4 C .0 0- C: ,
Ofn i n E U : C), (7 (01 n ctS.- S.- o. o 0 (3- d .- C C C C ) 0j
Cl w MO 4 IS Z AZ -
Ad Ai S.- 0i WO) Ei Ui CL) 0)d i S.-
i C CM 04-' U UL U V U) U) _TI _TI CI C C C -
4_ 0-- . 0 to (0 fa to r L CL Q.-0.- --.- .- 4-' Co- Of 0 M~ 0.0.0.0C0.CL-) in io - - '- - COf
a, >0 in in V ni iniVnV V >1 >) >., >oC L-.) UI 0 .- - .- (-) (- (_j () 1
4-' C. . . . . . . .e- e- - 41 an E E 0n to to en eu ev mn . ' E E L L 0n
m. S. *- di ) X X C c Of e CnS-3 n M L (n
TABLE 11. Turbi ne Ge ome try Sunrnary

41 L U L
X 0 0 >< ><~-
I L I
Z:) Md' VI U C:) CD)'co LI) V) Z : L...- C\j
>- CD U- - .- .- ~- -' C\i CJ CC CC CV) F -F -F -F F- F- F- F- F- F- F-
U) CLU S-E
- S.- 0o ~t 0 4-)'( E 0) C 0 4-'
LJ - 4-' 0 E a) m ' S- C -a t-' 0C) C 0 to S- I V -4-3 -- 7 0 L
T- - tfl - 0 4-' C: M~ &- 0L/,) 4-' 4-' CCC F- 4-' C: M S.- (A 3 - _I-7LUj ro tA 0 7- % 3- -C 0L-0 CO L/)
F- 5- -J OL V) UD M)~
m)0-. C/C LU 0) to- S.. U U 0 0 ro "0 VCC j C/) W U U o 0 A tn -4-3 4-' W C C
4-LU V) (A 0f 4-J 4J-' " 0 0CQ ) .- .- 0 0C Of) Of ~-
0 0., W- n. C') QC 0 > >S..)C ft.. C -0 V . -) C-)
-. ' 4-' 4--' +-' C C- C: CS- .00 A C 0 0 0 0 E 5to-s- - 5 S.- U U UUnn:a) -- 3 LZ 0) a) (1) (1 S- S.- L-I
CO C) f- V) L.0 C~- / ) U) C/C MC -Cl r
TABLE 12. Predicted Torques for each Configuration
79

0
0 TEST 3-014, PCAV = 14 PSIA
X TEST 3-016, P = 7 PSIACAV
# TEST 3-015, PCAV 1 PSIA
,., 000
00
1 2
I00
1- 00
0 80
0 7
0 69 400 8600 12000 1660 23033 24000 29000 323
SPEEO IRPM!
FIGURE 43. N1o Disc Tests - Original Torque Ratio versus Speed
8')

C-,),
LA-
CL.
0- C
Lii
ckJLii
- zSLii
* LL0 Li
C)C
CY.
* JN
0
Lii-J CC,
U.' 'nso ~sm
FIGUE4 . Pe ice/iba e lTru
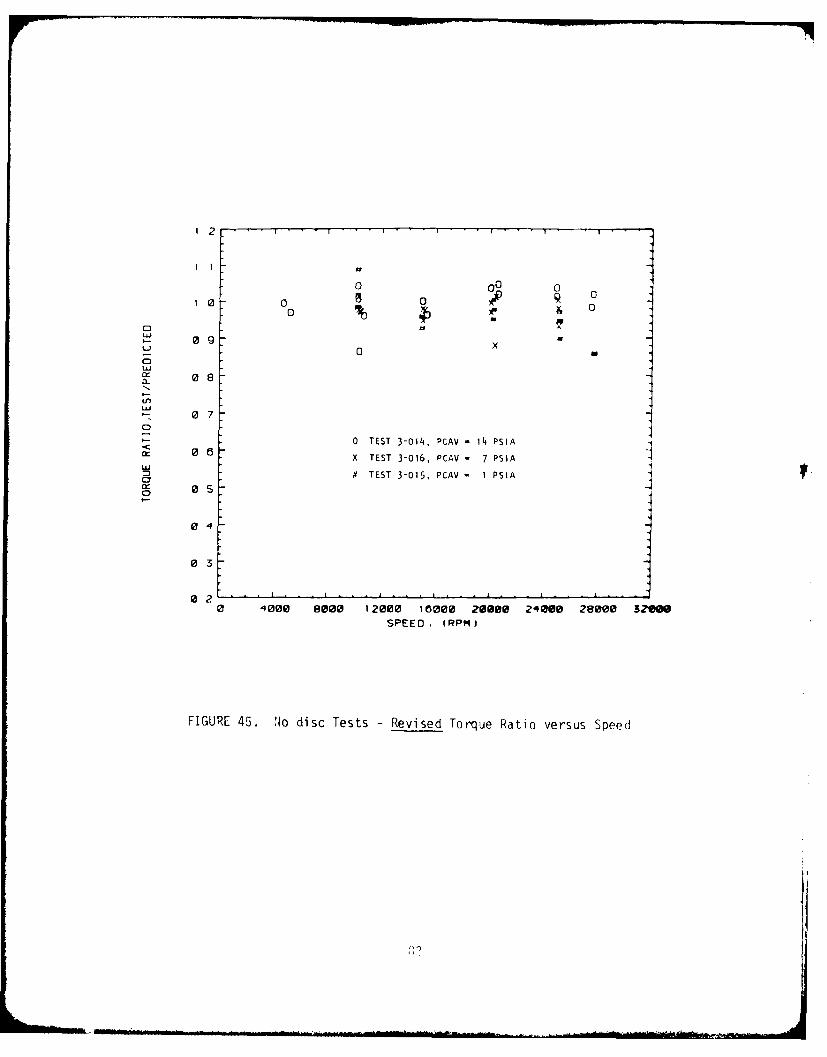
'2
0 ~01 0 0 0
S 00
C)0
00
08x
Ln
0? 0
0 TEST 3-014, PCAV - 14 PSIAa: 0 6 X TEST 3-016, PCAV - 7 PSIA
D TEST 3-015, PCAV - I PSIA2o .
0 4
0 3
0 0 8000 12000 16000 20000 24000 28000 320M
SPEED. (RPM)
FIGURE 45. NJo disc Tests - Revised Torque Ratio versus Speed

Test Numbers 3-014, 3-,)15, 3-116
Range of Cavity Pressure, psia 0.3 to 14
Oil Seal Torque Prediction Original Revised
Number of Test Points 52 52
Average Torque Ratio 0.9911 J.9752
2-Sigma Scatter, Percent 41.58 9.61
Low Cavity Pressure Tests (1.3 psia max.). The low cavity pressure tests,
with either a single rotor or two rotors, had similar torque ratio character-
istics as the no-disc tests with the original predicted torques for all
components. At low cavity pressures, the predicted rotor friction and
windage torques were a small percentage of the total predicted torque. The
turbine floating ring seal was the additional mechanical torque for the tests
with either single or two rotors. Torque ratio using the original prediction
equations was considerably less than 1.0 09.4 minimum) for most test points.
A revised predicted turbine floating ring seal torque characteristic was
derived based on the test torque, the revised oil face seal torque character-
istic, and neglecting the rotor friction and windage torques at the low
cavity pressures. The original and revised turbine seal torque character-
istics are shown in Figure 46 and a substantial decrease in predicted turbine
seal torque is shown. The torque ratio was recalculated usinq tne revised
oil seal and turbine seal characteristics and is shown in Figure 4/. The
revised characteristics resulted in predicted torques closer to test torques
and a significant reduction in data scatter as shown below:
Test lumbers 1-0,)9, 2-012, 4-020
Configurations 2 rotors, E3; 1 rotor, E3;
rotor 1 - E3; rotor 2 - El
Range of Cavity Pressure, psia 0.3 to 1.3
Seal Torque Predictions Original Revised
Number of Test Points 43 43
Average Torque Ratio 0.6793 ).9565
2-Sigma Scatter, Percent 48.49 21.37
L3

-J
C
zx
C-o C
C
IC
N
a.
I-
-J a
o ruEC
CU:' ~- I-
CC:'C
CQC
I--J4IJJ
UJ
0
- C
I I I I
R .2---- ~
~II~URE 46 Predicte Turbine Floatinq Rj~t~ Seal T3rque

AO-AO98 310 ROCKWELL INTERNATIONAL CANOGA PARK CA ROCKETOTNE DIV F/S 21/5TURBINE WINDAGE TORQUE TESTS.(U)JAN A1 R F SUTTON F33615 79-C 2073
UNCLASSIFIED RI/RDAA0220 AFWAL TR- 123 ML
II

HU~~ IIIIIQ111111L.5

1 3
1 2
€:3X
Lai 11 0X X
x x
0 0-
I-8
x0
o--
- 0
o 07
0 TEST 1-009, 2 ROTORS-E3, PCAV - 0.3 PSIA
0 S X TEST 4-020, E3 1ST ROTOR,PCAV - 1.3 PSIAEl 2ND ROTOR
# TEST 2-012, SINGLE ROTOR,PCAV - 0.8 PSIA0 4 . I I . . . I .
0 4000 8000 12000 15000 20000 24000 28009 3200@
SPEED (RPM)
FIGURE 47. Low Cavity Pressure Tests - Torque Ratio versus Speed
85

Single Rotor Tests. The torque ratio was calculated using the revised oil
face seal and turbine floating ring seal torque characteristics for the
single rotor tests. Torque ratio versus speed is shown in Figure 48 and
indicates an increasing torque ratio with speed from 5,000 to 20,000 RPM
and approximately constant torque ratio from 20,300 to 30,000 RPM. The
torque ratio also increases with cavity pressure. The average torque ratios
from 20,000 to 30,000 RPM are listed below as a function of cavity pressure.
Target Cavity Pressure, psia 14 7
Number of Test Points 8 8
Average Torque Ratio 1.3324 1.1126
2-Sigma Scatter, Percent 7.74 8.51
Two Rotor Tests. The torque ratio was calculated using the revised oil and
turbine seal characteristics for the two rotor tests. Torque ratio versus
speed is shown in Figure 49. A large increase in torque ratio is shown for
speeds from 5,000 to 20,000 RPM for both cavity pressures. The torque ratio
values from 20,000 to 30,000 RPM4 are much higher than for the single rotor
tests. Torque ratio increases with cavity pressure. Test points taken
during the ascending speed steps had higher torque ratio values than data
from descending speed steps. No observable difference is shown in the data
between tests with the E3 second rotor with shrouded and fir-treed blading
and the El second rotor with unshrouded integral blading. The blade profiles
from hub to tip are the same for both second rotors.
Average torque ratio values between 20,000 and 30,000 RPM are listed below:
Target Cavity Pressure, psia 14 7
Second Rotor E3 El E3 RI
Number of Points 6 6 8 8
Average TR 1.9215 2.0383 1.7090 1.6086
2-Sigma Scatter, Percent 15.42 15.71 12.55 13.37
86
. .... ' .. . . . . .. . . ..I l " -- m .. III II I I L . .. . . .... I' I . ... . .. 0-

16 .-
I S
01 4
o0 0
1 30
0 0
2 1
a-.xx x1 0 0 x
Y* x0 . ~x x
ox" x
0 9
0 0 TEST 2-OI, PCAV - 14 PSIA
X TEST 2-013, PCAV = 6.3 PSIA
97
.S . . . . . .. . 3
3 466 O66O 16206 16000 266 2406 26666 3216SPEED IRPMID
FIGURE 48. Single Rotor Tests - Torque Ratio versus Speed
87

2 20
21 0 00
20 0
LL)
B ,'8 0
w Aw
0 A(x x A
16 A
3 xx
2 X
13 TEST -OO6,3 SECOD ROTORPCAV=4 PSIAIx
X TEST 1-OO,E3 SECOND ROTOR,PCAV- 7 PSIAI P # TEST 4-022,EI SECOND ROTORPCAV-1I PSIA
A TEST 4-021,E1 SECOND ROTOR.PCAV- 7 PSIA
0 4009 8900 12600 16009 269W6 2436 263 320
SPEED (RPMI
FIGURE 49. Two Rotor Tests - Torque Ratio versus Speed
88

Res ul ts
Predicted torque for the bearings and oil seal differed from the test torques
for the no-disc tests. The predicted oil seal torque characteristic wasrevised to better agree with the test torque.
Predicted torque for the turbine floating ring seal differed from a test
derived value. A revised turbine seal torque characteristic was developed
to better agree with the test data.
For the single rotor tests, the test torque averaged 33 percent higher than
the revised predicted torque at 14 psia cavity pressure from 20,000 to30,000 RPM. At 7 psia cavity pressure, the test torque averaged 11 percent
higher than the revised predicted torque.
For the two rotor tests, the test torque averaged 98 percent higher than the
revised predicted torque at 14 psia cavity pressure from 20,000 to 30,000 RPM.
At 7 psia cavity pressure, the test torque averaged 66 percent higher than
the revised predicted torque.
No observable difference was shown between the shrouded E3 second rotor and
the unshrouded El second rotor.
Conclusions
The original predictions of mechanical element torques (bearings and seals)were not representative for the test setup. Mechanical element torques should
be verified or derived as part of the testing.
The experimentally based correlations from the references did not adequately
predict the disc friction, blade windage, and shroud ring friction torques.Torque ratios varied with both speed and cavity pressure for both single and
two rotor tests.
Predicted torque deviated the most from the test torque for the configuration
89

with two rotors. The nonsymmetrical, reaction type blading of the secondrotor apparently cause greater windage torque than predicted using torquecoefficients from tests of symmetrical blading. The effect of the type ofblading should be studied in more detail.
Recommendations
Modify the no-disc drums so the no-disc, tare tests could be run with the
turbine floating ring seal installed.
Install additional temperature and pressure measurements to detemine condi-
tions upstream and downstream of each disc and blade row.
Run the single rotor configuration with the blades removed and the fir tree
slots filled to determine the blading torque for the nearly symmetrical
impulse first rotor blades.
Run the second rotor alone, with and without blades, to determine the blading
torque for the nonsymmetrical reaction type second rotor blading.
90
APPENDIX A
Windage Tester
Assembly Drawing
P/N R0012809
91

i'15 14 112
F P0012814-3 CI~C4A4
RWI12616-3 QUILL SHAFT I
S29~24 0-RING I REMOD
NASaMC3A4 SET SCREW AS
OT-3 PLATE RDRE-amg GASKET IREQO
AN111-21 DOLT 16 REIDAMO-816 WASHER 16 REQDMS38h-.4 NU T 15 REQO
14 1s 14 13 12
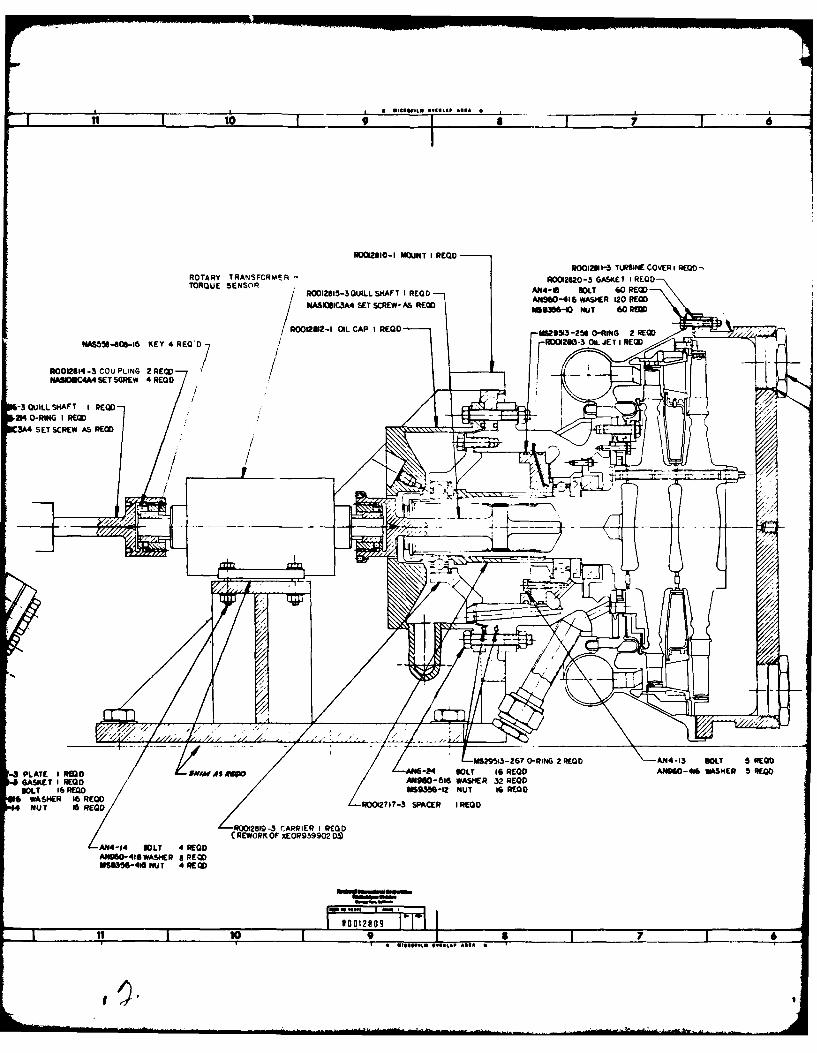
0012810-t MOUNT I REGO
R00121 -" TURBINE COVER I REGO -ROTARY TRANSFCRMEFA R002420-3 GASKET I REGOTORQUE SENSOR R0012815-3 QUILL SH4AFT I REGO ANM-I 1 BOLT GO RED
ANSEO-41 6 WASHER 120 REGONASlWIC3A4 SET SCREW- AS REO M5.9561 NUT 60 RE
R0012112-1 OIL CAP I REGO k=9g513 -256 O-RING 2 REQDNAS550-808-46 KEY 4 REQ'/ 07 r
0 2 0 3 OLJTI OECD
N0012814 -3 COU PLING 2 REO /NAMIOC4A4 SET SCREW 4 REQD
3A4 SET SCREW AS REGO
uc~K
L _s2 - 0RIG ED \ -N-3 9T 5RG
-6 ASETI E13M6061 MWSER 326 0-RNG2GOQ
BOLT 16 REGO MS9356-12 NUT 16 REGQO6 WASHER 16 REGO OI7-3SCE IRD
4 NUT IC REGO/ W?1I PCE RO
R02819 -3 (fARRIEP I REGO(REWORKOF XE0R939902 O!D
Aft4-,4 BOLT 4 REGOANUO416 WASHER a REQD
U5544 NUT 4RQ
1001280911 10 9£7
.4"t me.f. .. w .. 0
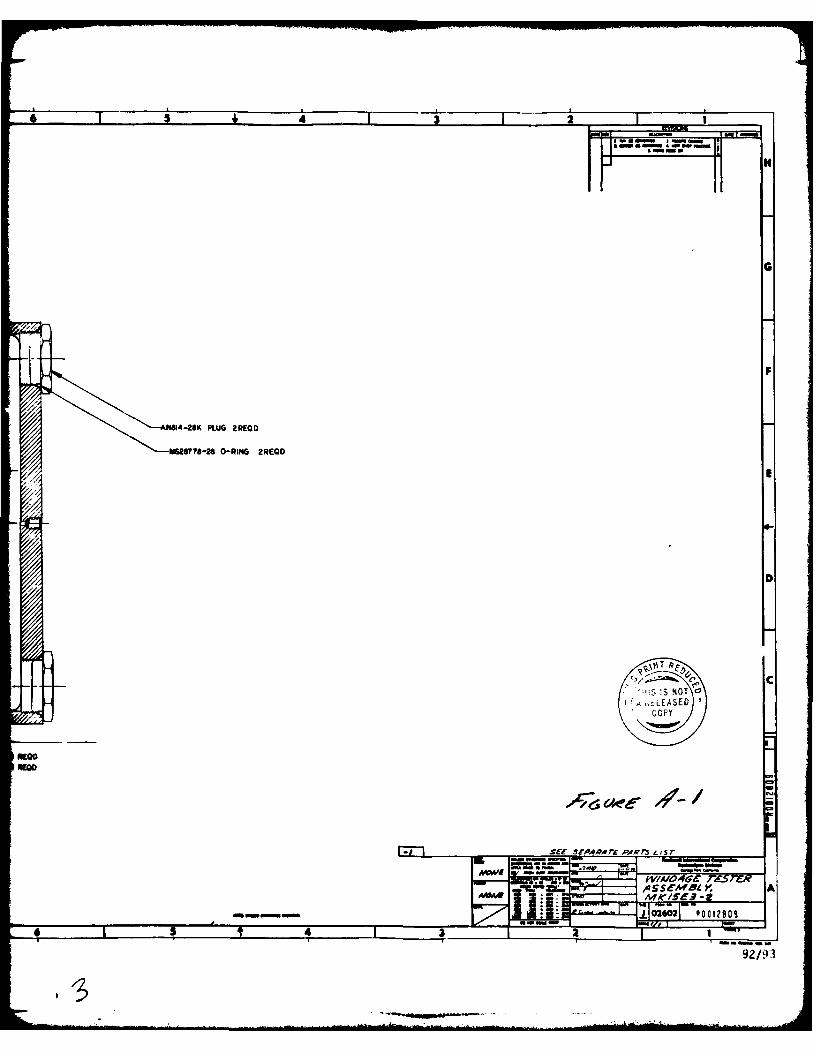
4 - - - - 3 21
N1N4-2K PLUG ZREQO
1518778-26 O-ING 2REQfJ
D
: ;sS NOT0I--ZLEASED
~cop
szer sro.4RArc PAR 73 i./sr
a.7 fz Ce --
* - 17 0202 1e2
92/9:3

APPEN1DIX B
Turbine Windage Tests
-Data Compilation
94
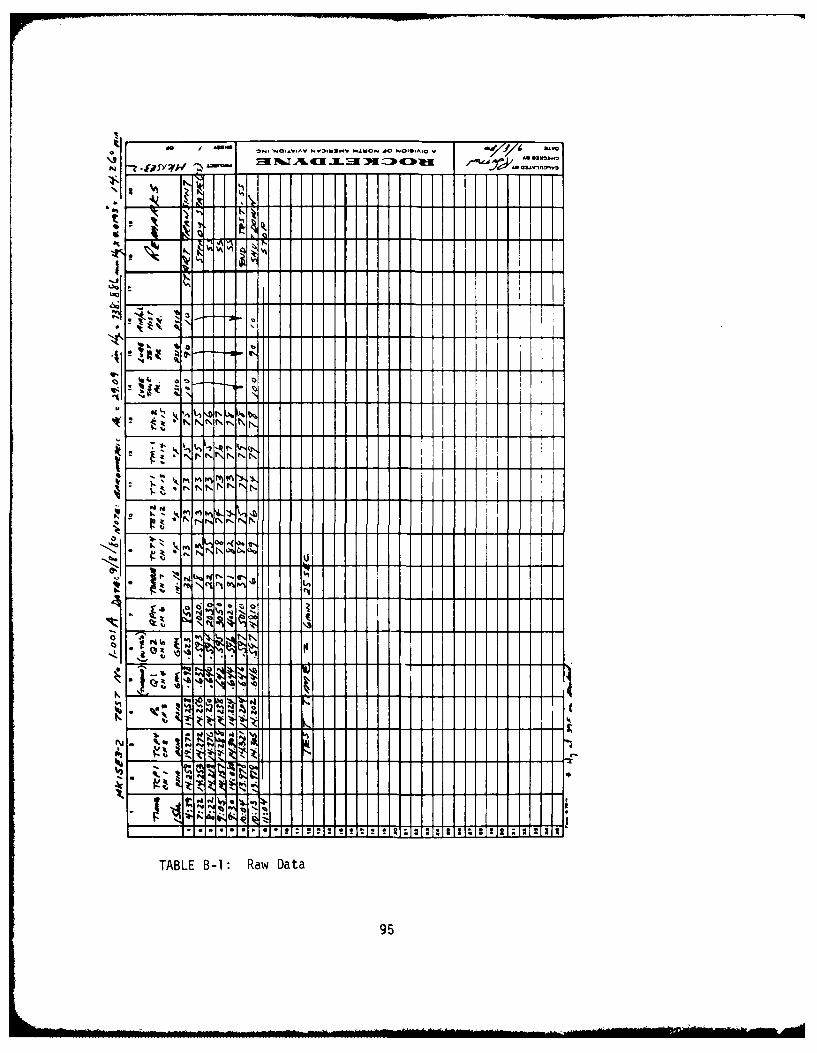
Noll,,,V NW W W h± f sIa~
Vi c x.~ ~
TAL Bi awDt
Pft 95

-r~~rf/ --.. wo. 1216A~ R
*wow Eff P%6 a;: Cm: :JnL EK a::Z (
TABLE -2: RwmDat
l96

N 3Z-~l~ i3
0A0
TABLE B-3: Raw Data
97

qkj
~ -cZ %A
TABL B-: Ra Da A
0. D9N

0 1
~!t~% +1
141
TABLE B-5: Raw Data
99

-Z _____________________________ ____________
t21b.
TABLE B-6: Raw Data
l100

bal- Got.i
I a ,.* *t~tq
0 J., 104

A~W AL~?I Cl a.~t ]0.: V& aa )
'-T
-a IN ___%
0)I
-*o ~~e~-Z
S. -tV s
aI 3"o,
'.~ 1
10?4

ItI
E I IIt
tea I
X-4
TABLE B-9: Raw Data
103

- i / a 06 I S..!
1--I I - 1
14
a I
0. 0
L 4~
TABL B IA Pa w i -t t
o~ 1IN

o , 111L a u I. -I 7
* I ,
. f, K
TAL B-1 RwData~
105

Oft
* - . Ii
-%- 1-3 I
P 11 lJ i J i N " A N 1, e, g
N , I. ft q,
_ _ I " I' I
_- ------ t-- ,--.--
1• _____ N N , ,
____" N" :
iti
I A
.1 0

*1 ~ ~ L T11 H
*(A-i
4t~
14'
TABLE B-13: Raw Data
101

#A/ ..
'I'r
~bol
F, k_ _ _ _
'0.
TAL B-4 awDt
~10E
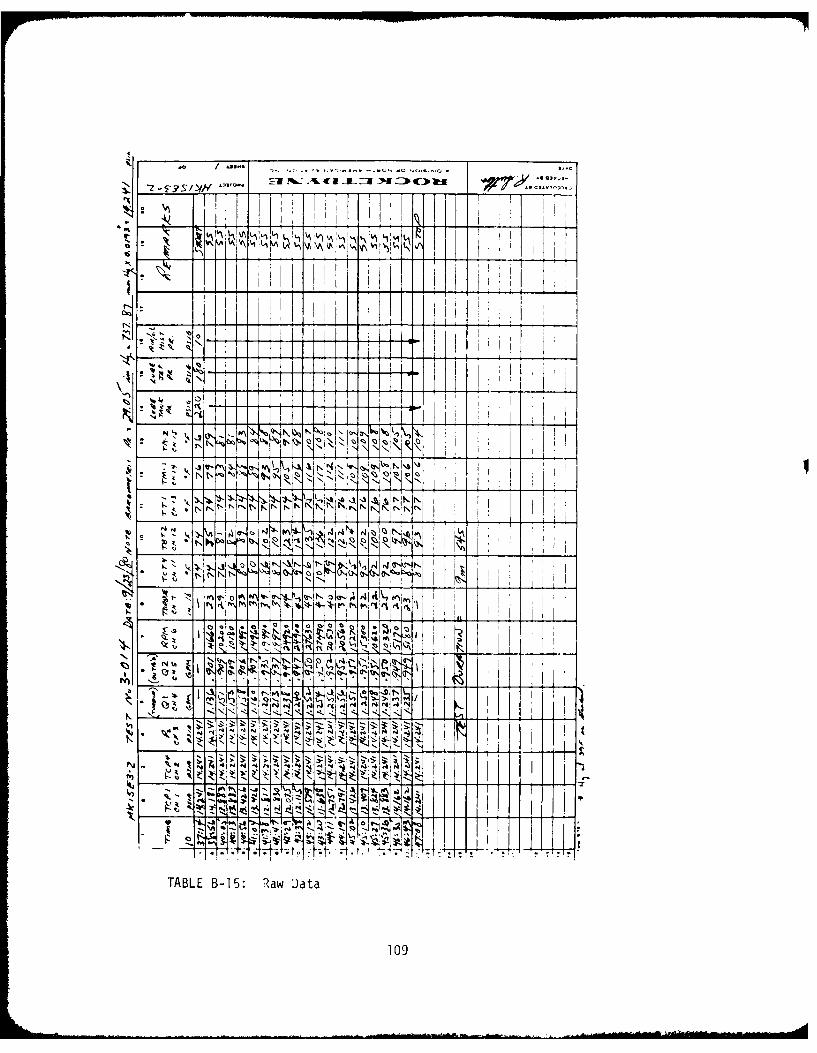
e.- II
NN-t
14 IN
f, 7-,
_____ I NNNI~N~rr~NN .,
-~~~~~~~ 4I-" *~yNvH ~ II
TABLE B- : RwDt
109-

'vit
IfI
NJ T71-
IA N Il
411
I AA
i A
~ ~czi
~t
TABLE B-16: Raw Data
110

1 T1
1Q1.

r-9 %J'zCi
IA'
1112

rNd E ~h X _ X"b [o7t
6Y
\4
TALr-4 : RwDt
111
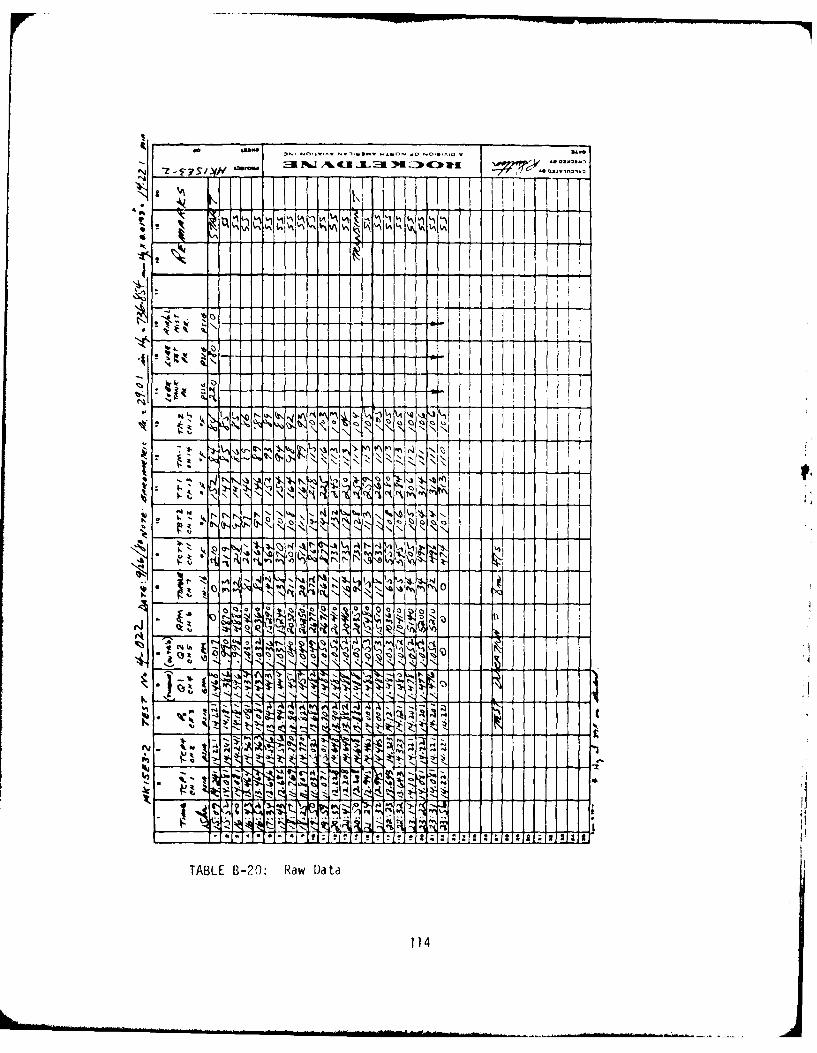
45.-
4a 2 i Za.. u~
C4 LfflW
;~V
fu~~ \ ~
TABLE 1-20: Raw Da ta
1 14
APPENDIX CData Reduction
Program
115

MARK 15E3-2 WINDAGE TORQUE TESTS
APPENDIX C, DATA REDUCTION PROGRAM
NOMENCLATURE
P CAV - Average Cavity Pressure - psia
T CAV - Average Cavity Temperature - 0R
RO - Average Cavity Specific Weight - LB/FT 3
N - Speed - RPM
T - Torque - IN-LB
VIS - Absolute Viscosity - LB/FT-HR
OD - Drum Cylinder Diameter - inch
D - Diameter - inch
H - Height - inch
S - Axial Space - inch
T - Radial Space - inch
L - Cylinder Length - inch
NIR - Reynolds Number
CM - Torque Coefficient
FS - Drum End Face
R - Rotor
1 - First
2 - Second
M - Mean
DK - Disk
DM - Drum
US - Upstream
DS - Downstream
SH - Shroud
TABLE C-1: Data Reduction Nomenclature
116

TEST DATA
N , RPM Speed
P2 , psia Pressure at Nozzle Outlet
TCPl , psia Downstream Cavity Centerline Pressure
TCP4 , psia Downstream Cavity Tip Pressure
TT1 OR Manifold Temperature
TCT4 R Downstream Cavity Tip Temperature
GAS PROPERTIES FOR AIR
Gas Constant - R = 53.36 FT LBf/LBm0R
Absolute Viscosity - VIS = 0.012210 + 6.0101-5 LB
x 10 x TCAU AVG, Lr-Br
CALCULATION EQUAT IONS
P CAV P2 + TCPl + TCP4 psia
TTI + TCT4 0T CAV = R
RO CAV P CAV x 144 LBRO~Rx CAV Fr~'-~vr~I
NR N x (DM) 2 x RO x064= VIS • x 0.6545
PREDICTED TORQUE EQUATIONS
TBG - 1.16 + 0.0283 x (N)2/3
Original Seal Equations
TOFS - 9.58 x 10 4 x N
TFRS - 1.634 x 10"3 x N
TABLE C-2: Data Reduction Formula
117

Revised Seal Equations
TOFS 14.0 for N : 4,000 to 16,000 RPM
TOFS 30.980461 - 0.013353118 x N
+ 0.9912415? x 10-6 x (4) 2
- 0.3275304 x 101,9x (A)
+ 0.41408091 x 10 15 x () 4
for N greater than 16,000 RPM
NRIDK x (DMHIR) 2 x RO x 0.6545N RIDKVIS
C:41US 0.102 x (2 x SIDKUS4DM-HIR)0 ".(NRI DK) 0
TIDKUS CM1US x RO x (N)2 x (DM-HIR) 5 x 1.2842 x 1J-
0.102 (2 x SIDKDS/(OM-HIR) 0 .1
CM1DS - N1K 0 .2(N R IDK) 0 "
TIlDKDS CMIDS x RO x (N)2 x (DLI-H1R) 5 x 1.2842 x 1')- 10
NR1BD N x M+ HR) 2 x RO 0.6545VIS x
0.574 (HIR/(DM + HIR)) 0 . 6
CMI1BD - (NRIBD)0.14 29
TIBD CMIBD x RO x (N)2 x (Dri)5 x 2.5684 x 10- I0
NIRlSH N (OM + HMR) x TIR x ROVISS x 1. 3090
CM1SH 0.065 (2 x T1R/(D4 + Hl1R)
(NR1 SH) 0.2
TISH = CM1SH x RO x (N)2 x (DM + HIR) 4 x LIRSH x 1.6125 x 1i) - 9
TABLE C-2: Data Reduction Formula
118

NR2DK N D H2R)2 ~2 x RO x 0.6545
=MU 0.102 (2_xS2DKUS/(EI4 - H2R)) 0.1
CMUS(NR2DK)0.2
T2DKUS CM2US x RO x (.4) 2 x (DM - H2R) 5 x 1.2342 x 13- 13
CM2DS 0.102 (2 x S2DKDS/(OM - H2R))0.
(N R2 K) 0.2
NR2BD N x(M+HR2xRD 0.6545
- 0.57 (H2R/([XM + H2R)) 9.6C2D(,NR2BD)
0 * 429
T2BD = CM2BD x RO x (:4)2 (DM) 5 x 2.5684 x 101310
NR2SH - N x (DM + H2R) x T2R x RO x 1.309)
CM2SH - 0.065 (2 x T2R/ DlM + 2)0.
(.NR2SH) 0
T2SH = CM2SH x RO x (N) 2x (DM~ + H2R) 4x L2RSH x 1.612b x 1J 9
D014AV - Df41 + 0DM?
NRDMOD - RO x N x DDMAV x TOM x 1. 3099)V's
CMMO- 0.065 (2 x TDM/DDMVAV)0.CMDMOD(N RDMOD 00.2
NRDMFS - OxNx(O2 x 0.6545
CMDMFS 0.102 x 2 x SONDON? 0.1
TDMFS = CMOMFS x RO x (N) 2 x (DM?) 5 x 1.284? x 1-1
TABLE C-2: Data Reduction Formula
119
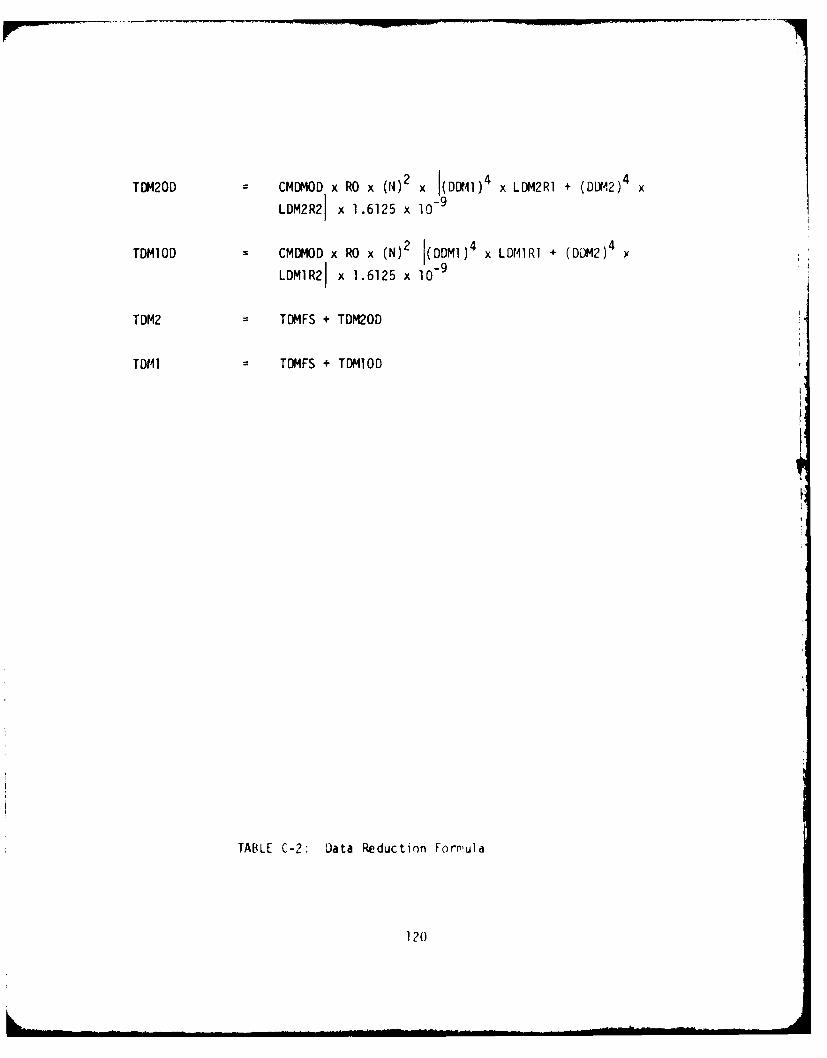
TDM20D CMDMOD x RO x (N)2 x I(DDMI) 4 x LDM2RI + (DLDIA2) 4
LDM2R21 x 1.6125 x 1O- 9
TDM1OD CMDMOD x RO x (N)2 j(DDMi)4 x LDMIRI + (DDM2) 4 x
LDM1R21 x 1.6125 x 10-9
TDM2 TDMFS + TDM20D
TDMI TDMFS + TDMIOD
TABLE C-2: Data Reduction Formula
120

APPENDIX D
Reduced Test Data
and Parameters
121

MARK1 I5.13-2 WINDAGE TONOUE 11370
APENDIX * muvuogs ,, Te? DATAAN PARAMET908
TEST Time SPEED TORQUE PCOV TCAV ROCAV VISCOSITY ofNO Room IM-69 P616 a Le/iB'S0 LI"FTlHg
l00o 9.04s Sl$-- 400 116- 1 Siell of?* .00 104690 6774407F03000 6003 Soto: 43.0 14.134 545, '0100 *04491 07211t.o1000 10.11 sol0, 406 14135 545, orr'o '0449? Tflz?2t.003006 103 9530, agog 13*91N 513. 9095% .04662 9131411.071006 $Tell 911209 0,0 13.9IS S75, 00654 .04614 .131631.00
-1000 18619 14 97O #s Isis* 13.5741 650, .0504 #sitit .1039?1.0?1006 10.e0 $goes, 159.0 13.570 055, '0900 ,O5INS .101299071000 1045 118310. 1ol90 13.309 776, .0463 .050'l *17197t.o?100* 19.51 813.10. 393,0 1333 761, 00461 '05910 .17210701000 l0.30 100@ 3100 110761 loos. 0043 067156 .141%3E+011000 10.45 30350, 315.0 180790 lo010. *0339 '07339 .1160B1.01000 _ 1.930 94.- 390 5,4 910, .0394 .067SO .*1js0oofg1000 164 190 171.00 13434 9223, .0393 006768 .11440940?190 #a.30 1340. 111** 116746 000t, 00410 .00555 .9s5s1f#061000 18644 I10. al0.0 13,749 409, 00417 6605&Y 095111001000 13.30 9540 03.0 160038 059, *@*41 .06344 .4,521SE0061000 1044 9500. 600 14.030 050, .0441 .06376 050371001000 -A.0 107, - 30 3.0 39, '04S6 .06100 03011619066
10 0117 500 34, allo? 6, .04s1 .00151 .301531.001000 05.10 5300, 41.0 60,107 030, .0457 '06 .30977E#00
PARK 111613.8 WMAI TOSU TESTS
APPENIX f Ng73019 TEST DATA AND PARAMETES
TEST Time 11PERD TORQUE PCAV TCAV ROCAY VISCOSITY MENo Rpm IN.Le PIlO 0 L91F?"S LOIFT04R
left0 lowI050 33.0 '310 540, .0011 s0450 .189111109910o* 3819 10000 33.0 .390 506, '0016 004503 .111191E00%l00o 30.30 10430, S0,* '356 s00, *poll 0641193 .30?701.0t00$ 30o$? 19640, Also *343 564, 000 ,06700 .01530914053000 1340 19600 43.0 .343 505, .0611 ,04734 060111.053009l 3.54 19000 400 343 500, '0030 '04 .6011594109t00* 34046 30100. 10 :309 000, '9013 *05114 6710?E11403009 14.114 3030. ISS '529 000, Offs .053 176a921#013009 35.00 30030 03'0 .30 073, '403 '05203 0731510011009 35ms1 3017, 55,0 S3ao 074, .0013 'o05l ?724[*OSl009 31.53 0000 4,0 *33 090011 .00436 001.102
1009 30.0 8000 __ , .3 03, .0104938 05010009 .0 of 0000. t' 11, *30 61?, '1013 0499 ,00111
3000 30.53 39060 30.0 ,349 500, #$1:o :04116 .34f011.051oo0* 31.01 30000 30's I34 So0, '0016 seats? 03511.00(o100,t 3l.10 30090 38's .34o ST9. .0030 '04703 .350931.051009 31.3 f03st, 36,0 '344 576, '0016 .04691 ,350041*05o
TABLE D-1: Reduced Data -Tests 1906 and 1399
122

PARK 15-13-2 WND~AGE TONGUE TEDS
APPINh0:1 11 EVISED 1001 DATi AND PARAMIEER
TEST TINE SPEED TORU PCAV ICAW ROCAV VISCOSITY MENo Rpm SN.LI P01* R Lw'Tee3 Lq/PHR
tellS -10.9 *, 10 1.3139 sle0els 9e, $Isis .004196 *660906 6lot# 0648 9o?0, s9,0 1.38) So8, '0334 ,00770 4611474EOo100 $0.36 tast, 59,0 1.313 192, .0334 .04776 9691361.00l0t0 47o44 5993$, 1011,0 1,093 732, .0162 '01020 4916121066logo 103 90, 5 og 31.0 felt* ?:;9, *east .o,.u9 099o.071#01010 411491 20400,. £300 095 14?. .0210 .070s 8696699001010 401 1196741 Sol** 0645 951, 69194 '009se .024310~465080 19.05 R9os0 19,00 61 910, 00191 .07036 110311106l050 49.09 89190. 591,0 4.667 900, sell* '07146 .?65161#061050 s0.0$ 8030 S11.0 1.913 906. s0lls .005 .03711006t0l0 30.00l 8080 is$,# Y0976 900, @sal0 .06670 613771091010 10.-19 -101116 %9o0 -70899 033 *630 o416 0688? #3974[o6Isis 11.06 10191, see0 1.306 030, '4136 .06209 040111E008080 viols losse. $0.0 ?*lob 089, $ease 600300 0016710
"NN 51.13.2 WINDAGE TONGUE TESTS
APPENDIX S 41EYSSIS 110? DATA AND PARAMETERS
TEST Time 11PIEOO ?DNOUC PCAY VC*V NOCAW VISCOSITY NJNo Rpm ZNOLD 061A R Le/PTees 1.11IT~m
305l Sally III0 86's 1:023 Say, $lot3 04504 707604Roll Ri.3% 1090. 16,0 14.383 107, ,071 .06509 *1844110068085 8500 S16 300 50.23 547, clot8 04509 .702671.0l0l1 Reels 50430, Sloe 14.04 103, $0676 .00a ,9111C07R055 118043 19400 00,0 10,004 564e .0674 990611 SIS0111.01loll5 112051 loll$*-- 460 -. 49014 S65. ,0671 .04614 ,581 .E071011 0S33 is1i0,. 12,0 53,695 S94, 0131 ,04791 ,91761.0?8015 I3sa3 5s1a0@ 74,0 13*691 197, '0626 .04600 6196019007R085 8308 11006.$ 13,0 130691 400, 0021s .00624 9193111.072011 84.43 80140 92,0 13117 049, .0509 Ostia8 912131.E00&MS 84.13 8010. 92,0 53,064 0 0 53, O0141 ,0 116,131407818 8080100 95,6l 53,004 0. 010 Gos0$194 oas)oo1*o?2011 01.43 30ot0 1 0. 116129 156, 066 .0174 .a4IT71*0?s0i1 l1.11 30620, 519,0 11,800$ 770, '0010 0094 483111140?Rll 80.00 30000 140, $3,as1 i96, *0416 .019 .031.0?2011 84.48 20410. 91,0 13,711 760 '0465 .01004l ,00914@
a 1 1 8 4 1 5 S e a9 0 , S o , I3I 59 7 0 , 0 69 67 0 1 6 4 0 6 , S 4 9 7 0 1205 471 so30. 19, - 5390 78 $011 .01s00 .91011,09?
2011 6436. ISO's aOs3 74 .10:531.9 10l0ll 19.49 l1ll, Ries 14.:314 0'956, .013 o0S396 911331190486l8 39.1 1oll: 8460 540,10 090, 0113$ .01369 oSISM60
TABLE [D-2: Reduced Data -Tests 19M9 and 2011
123

PARK l161m WINDAGE TORSUK ?t6y$
AP9INSZN 5 615301 71M? DATA AND PARAMMI?6
usT Tint I'uus Topoul PC., TCAV Paca, VisCOgUiT PCNO pp IN-69 !01A R 681PTO03 LgIFTHm
loll Does% 10136, 86.6 If .7 35, '0036 loses? 00111g005lots $S.1O 10130. sees si7? is) 035 003 .0$03 9oo11190062018 65*9 19430, 0 S7 ory 053, *0031 O05146 .1mII9t06Sl& 90.0 59930, 7.0s .77 053. .@as0011 34010 1161000
.8o1l 5007 - 8960060. 30.0, -- all?3 *61, .003 .05194 41166090Ila 91019 l053, 36.0 *766 001, SODS@ .01191 .114601406
MARK 15-93-2 WINDAGE TORQUE TFSTS
APPENDIX S REV1310 7107 DATA AND PARAMETERS
TEST TIME 6PEED TORQUE PCAV TCAV POCaW VISCOSIY MENo RON IN-Lb6 P61A LU/PT**3 LSi/PTMP
l013 819.03 10500. 10.0o *.173 553, .0)1* 51 .009551.OSSE002013 15.50 1010, 3600 0.373 553, .0311 .06565 6067E*002013 16010 loose, s0.0 0.314 579, oats5 .04690 .9Z664E*062013 26.19 1460. 400 6.314 S6l. '0294 .00710 94al101002013 127.20 IWO,0 60,0 6,160 61. Cara1 .06950 1112foo1013 17.37 19870, Os.0 6,Z46 620, '0170 '04971 .100SE10072013 16.10 &S310. 6110 6.142 070, .0244 '05296 I11569E*072013 la.s7 1510 63o0 4.142 60, $021 '05319 911392fo07lots 19.16 15550. 77,0 0.155 Ill. 0,732 Qs55a7 6104ft"01013 29-30 I5570. 76.0 0,15S 720, '0230 .05509 '1063GC007lots 30.,19 l0350, 05,0 &.?S5 700, .0238 *05070 ,677)0a013 3ta.l0 30600 000 0.155 ?to, '0234 '05665 ,6?73E0a013 steel 15100. 69.0 6.340 09?Z, easy7 .057 .0600002013 s1ate Isis@10, l 65. ,300 091. '0246 .0S371 '690261006l013 Blest 10370 S0.0 4,391 672, .0257 .05100 l5011610001013 31.01 101600 36.0 0,303 070, lots? 00546 9503S01000
PARK 19.13.1 WNDNAGE TORQUE1 710,6
APPINSIR S WINDO 713? DATA AND PARAM11IR
1167 timei oPmE iOmou PCAV TCAY POdSV VISCOSITY PCNo RlP" IN.LS PSll a LO#Pi** LU/PINE
3016 6001 1600.# 0. 14.118 535. .0* '96630 14110003016 St.53 10100 I0.0 14,121 531. '1711 '04430 .13011006Sol$ 60.50 14990, 330 Sir,0 '3. 0708 64448 o4660190063010 0106 54600 33.0 13.90 537. '00 6048 .4042910903014 : 1830 1990, 3900 -- 130764 $46 60 0466 .009531.00
3010 t61.? 1970 *6,:637 65 000 *60 .0061?90
3014 4619 16910. 4,, 113.519 565, '0009 0@6601 $734511.0063016 608 8016 8690. 610 9331538 56. '069 '06500 o73309(0003016 63-11 87030. 49.0 336 53S 51. l0oss '46S31 .790591003616 a3.00 17490. 41.0 a53.373 551, .0055 '16531 976690160
301 :_ 6.5 1:S530_ 60.0 13.744 106. .0077 804911 01031906301 6619 a00 39, 6-3,796 sale .006I S04S1 461161514463016 60.00 15876, 31.0 11,964 56. .0691 '06500 .661163016 Slate 15300. 310 5.903 546, 0691 Some6 61001.0063016 65017 10010.6 a6*0 101 506, 4070 096 8117501.60
3el 4016 6ago$1, 130- ,1 563. SIM0 6640 6316"15006
3016 00.6 U 10,* 3.0 1.19 561. 40766 '4606664011
TABLE D-3: Reduced Data - Tests ?112, 2013 and 3-314
124

04NK SS-93-2 WINDAGE TORQUE lits
APINI * IIC Tg1V Data $NO 0PAMENGU
It$ TIME ept TOGU pcAV Tcav ROCAV vlocOSI? a
No Rpm ZN-LI Pf1* a LSJP I.') LO/F1W
3015 @301 0010.e 1., 1.106 94. .006 , .00060 ,0l104 05
3091 S l oas 6 010.0 Alo0 Isis? 543, .0044 041.4 .20775E*99
s0ts @Sa00 10196% 36.0 1::1 Soso .0063 '00493 .501551,05
s01s esmse a@~6 37,0 1.14 S0. 001 04497 :964661#05
lots 65oso 15006. at'0 las Sale *0061 ,0006 *o01051.0
301s 01.41 RPM:0 :000 least Sao. .0001 O051ASIS0i6
30ts 60.09 36 00 14 4S0les .061 least$ '741911095
sags #Too? &sid0s 3o'0 lots? Safe 001 04931 *o70501*6%
sots @6.47 811 35.0 14167 S50, #cost 104503 es5.59co05
3085 @.0 OI, 35.0 I,&&? 54* 00 .4503 OS50001*05
s0ts 001 £0. a 0, 1.is, o5 0063 10449? *.tjOSE*65
3011 seats 141930, Di.0 We$0 545. sees) .00097 .01177to05
3015 10.11 ge13@$ B0.0 Ilj94 SoS. 464 .04490 &83t os0
s0ts l0w&* 11146. Root $.290 500. .004 *04490 281t os0
MARK Isll-a~ WINDAG ONGU toaEI ut
*P~g"OjX a pfVgfff tell @01* AND P*PIVl1
test ftIN SPEED TORGUE PCAV TCAV NOCAV VZSCOSItT at
NO MeN IN.Le PoIA R 6P1 LO/FWU
361e 5709 1 000 as'0 1.300 50. .0360 .00919 '10013te*6
s010 1060 £10. 0 so$1 tes0s .031 0 oasi 41619006
sots 80*00 10996. 32.0 7,243 SSG: :03416 ,0051?, 'Zi331sE*0
3016 16050 We00s 37.0 7.109 5530 '0140 0044 13004006
1010 3l5 A000 0.4 ?,Rao SS3. .011 .04S63 .3622CO06
3030 10.40 Se000@ 40. T9996 We7 *0344 '04S64 3?a110
R0oos#0 5000 3. 7,301 555. a0ls0 '0655t .30960too00
3010, 36.39 1530 33:9 I'm1 555. g0ist .0*SS? 3YSf
3010 slo19 £11:. 32.0 1:300 553. .GIST 805 33592900
3080 Bass.0106 39.0 1,36? 5SI. o031s030 91611114906
1010 &awl0 10130. los0 1.367 5%3 a60 falls0 .10ll9*06
TABLE D-4: Reduced Data - Tests 3015 and 3n16
125

APPENDIX~~~~ D2 RI7E VC6 .05 N PR 9O
620 49.09 10150. is'0 I.2O sea. .00.1 .0447S .113611400
4020 of-pit 10l00. 36.0 leis* im, . *14 .065ya *g3260f.o
4020 4600 111046 A.. It'll so. ': .00' *6764 6110'.2tt,
0020 46010 15100. 63.0 IOM1 %*I. wos .0417 *5?5161*06
0020 49.01 20140. 51.0 1,164 614, .0050 *@020a *2090(*86
We~ 69.09 80110. 53,0 tole$ 619, lose9 .0s001 *)9067't~ot
4020 0.99 a916 69.0 1616 beat .8006 .041422 *aoos6t*9
6020 l0v00 25110. A5.0 1.16 ?Ole '00as 9%561 .804S11006
4020 92.05 20190. 47,0 isles 702, .006 'I63 l06T%6EO0
0020 2.804 2070. 46,0 toles 60. '00046 *0562 1116t#4
4020 SI3.89 111244 4.. toil@ base '0649 .*Ml5 1160F466
90036.0 so0 390 toil* 6, .0069 052019 ,16It2I*00
6020 $*R@ I000 is'0 1.224 We7 .9005 .*0506 *l0awoot0
6020 16036 101864 35.0 leis$ 630. '1492 .01463 410614t*00
4020 5.035 8310, 20 .A30 617. .40%4 *e6926 *90105f#05
0000 9.43 oil0 230 1.3 10, 11994 '04983 '961401#65
PbRR 13413.a WINDAGE TORQUE Tf9T9
TEST Tint 11P910 TORGUE PCAY TCAv ROCAV VISCOSITY a
No 0.0l 1'-Lb 01 Wff""M L/'4
4021 Ito% Silo$ 31.0 6.120 020. '0300 0Q6041
4021 404 to$0, la.0 600%4 61, *0ass OS5073 sism00
4021 $3.0s 10360, S3.01 6*061 63. oass) .0%041 .112001.0b
6021 0343 1500 90. 05935 0ag, va133 .0350 foba~iL-Qb
4081 .04.39 1930., 107.0 56609 700, *lo09 '05709 .71201foob
6081 04.43 59070, 116.0 lose$ 70, .207 #%all2 .7006@f#006021 60.92 19980, 107.0 Some3 772, :0206 .o0516'0m0
60111 I0.33 1179866 Isl.0 50796 S97, *0174 '0011 .10116106
0021 09.41 a6000 159.0 solo$ 900, 0017, '00076 060761400402 09.0 86740 1610 9.764 9% ,0170 t06719 *ol60 ob
4021 60.7 see0@ . 03.0 $0909 1?77is .0664@40 6566391006
6021 07.09s 20470, lose$ 9,909 :09 0160 01 0505936S91#00
6021 $030 14070, 60.0 9,996 664, ,09 06244 144219t00
4025 07.39 89, 090 .0 83 0:1:2 @21,59.P
602 00.3ee? 10240, 52,0 60007 080, .0001 '001al 1312S11406
6021 660.46 1, 1. so00 S:l .0l1 .06119 ,311'#1006
608 __*.SO 980,-- 30.04 .601 ;:4, 000 .90j?jV6Co*
_ 09 it Iop *0its9. 00 . 790, .0809 :16,99'olf0
TABLE Di-5: Reduced DaLd les ts 4)2:) anu '4 )21
126

MMN 115.8 011111 TOM"U T99TS
Ammoin I aping Tusy DmIi Ans PAPAuuyuuYI0T WeN vPeo TSog - 0 Teaw iNOAV MZC99ITT sNo RN :00OLO 061A a LSVUT**$ WSITNN
"bIh ~ AToo is VOTiW 6MI, off" googolU5I'04ola 16000 wigb 38.3 1,166 6ea. Ise *easo 5ST10080 16"S 10480. 1, 83. .59.9 66e A 0 655 .809 0115540
CO U R 1 7 0 3? A 9 1 9 %, 1 10 6 a s f i l l. i s t. S O W~ @ 1 ,5 6 1 6 0 9 3 9 0 0 7esMia -A T0 3 181, asc 11011-- late a01 *00035 013111007,sell w if1 203ysS. 1: 63bbs lo.ea s e ::S16 '07355 aSIS ss'.i04088 town0 ano: 11960* 13946? seat. 904aa 4604 PS9esg#s0 1 1 1 999 810.j4Oi&i R660. -16 16119 3Sse 917aag1 1168944ola "l-e ales,, a91. "i ::386 '069s 0118O. 0CV441-sell -N 11115 8@466m 14--5 cOb, 1M.~ 06646 .*e1EOST
.'. alear---51t v o .841 469 O33C14K6__
SeeS feea *Sesss "To #449 641
TABLE D-6: Reduced Data, Test 4022
127

APPENDIX E
Revised PredictedTorque and Torque
Ratio
128

#at-
- - - - a--- ----10S U
it 1. %C@S ~ .0 4 4e
sa - in A -
so ~* a ... .... .a .. e9
* a41 Bw = C l
2B:000
Uff* safBa0 U10.0...:000 :0 10.
TABLEBB E-1: Rvised redictd Torq e Ts 10
129.. --

00-
-t I* .04#04 *4 6 .9~
Ba
wam ea
10 - - -- -
I- a. aaaaaa @
S.40
B 0
5- a" a4 .1. 4. 6.4. 1a..* a
* D *0 0 E.-B-a*
TABE E,, Rw sidPr-dite Trqes- es 1l
13

rQ
son -- - - -
e .... ....N . .....0 .- a Male e~ee
a A
so eaom -Oo40-0
• tft
* * 0 .. O**O** Ofb**
* S. w w mmaaamwa
to . we 09.o
9. A M -O - -t - M
W .. . . . . .
s C4A.Vi@@
---- - -S - N - -----
TABLE E-3: Rev i ~se rd t Tr-iII ;

02 0
*:z 0b 4 0 4D*4 4 b 0 0 0
* 01-
wb 0
0 4.4.4V,.0 W-4@444444
Sb- -4----------
13044 4*44
a .. ....... . . . . .0ro
.44 444 2 4QIs4-1. 19.-:
.4 -
-1211
6 a ft..ftftf no- a
132

aba
-.... .......... awo- o n a .-to .. ~aaaa~a~n
..*... ..n ...... . ....- .- ~0% 44aaWI 0 ***@'.WQ* *..
W.-0 - - - - - - t m- - -
.0.0 ......
cc C ana cae a a,
.64 .. .Ai S54 4-16- 9- S
113

*5o #. .. a... a! a* ** . .
go a a
*a .oo . o
*0.
S0 o e o ~ oe o o o .
S o o o o o ~ o o o o
3 aa .S--.oao .o .. eo -Sb o o o o oo o o o oS..S o o oo e o
S.o. esaa aa oa ee eaaa e
.50
- n
* S.
OO OOSO 0
TAL E6 evsdPrdcedTrijs"a+ .
..x asc aaa caa aa1 sa

r0 l 0 0..1 l 00 00to
*fN; f~o -f 0& 0@* e.0e * w . . 404:4
Oft UD qltWpo d f 1q
** 104: tt. t 4: *4: It 4 t414 .: ** 40 0 .4e0 ~ e
ftGSf 0O0 4~ 0 04 Ab
0 f S a4 t
7S
a10------------
tS
W.
t
... ........
.-S ------
ZOO 01 01 sw;z =20
SOl
TABLE [-7 R vie * Pedct WUUrq**s Tst 1"
hSb

a
ata
clu CP
X0 4Dw0c Pc cyf DaC
AS a ,... 0 0a A a 0
inn
60 9co a .. ......
41 oboe210 C. W.WW oCoW, W, W,0
0a 0 o040f
* S.
lob *0W0 0-::::::d 0 -- - ----- -
I. :2:z: - :.1AbA
TABE -8: Reise Peditp 'Pt
-a~~w -.. -O
oa @@

0* !n
100
Wa-
0 8 aOw ...o .... . ... 4 .
V. o -oo oooooaaooooao
z woooooaaaooaooooooo
t s
0 .. ..a .... .. . .
O.
B.-Z
.. Q Q ..... lfl ..
..................:( ~~. .-.. .--o..--.. ... .
-*!*3 00l *
a-Ul --- *---------- - a
-a . - "a
-o .oo .... ..oofn.o-..*BOw
ILI
Ba Oa a: ::: mom am fomma
so- alto* 0.0000000~
TABLE E-9: Revised Predicted Torques -Test 41)20
137
44 0 4 4L*
..... .... . m---- de emUm

so
0
t ftw we O e w P w 4 tf
1.0-" b kIts a wat -
IW a. .C. aooe ~ o
00 . . .. . . . . . . . ..o w l
O-Z :mnto
o0o e
. ta no. n 001:: 00ooooooooo0AL -O 3-4se Prditd orus Ts 42
em8", Now& aSaw~aftai
awI

a
0"hi tb~ * w a OW " f
as- - - -04.
60
S0 - --
. . .. .. ... ...-. 4... @
sa- mmsa--#mmm.a**mmr
a
02.
33
a
o*f a o m "
to 4r4 wa
TABLEE-11 Revisd I Prdite Torues Tes
a13

REFERENCES
1 40

REFERENCES
'Rocketdyne Report RSS-8626 High Speed Rotating Diagnostic Laboratory Testing,
R. F. Sutton, November 1978, Rockwell International
2Copies available from Rocketdyne Division of Rockwell International,
6633 Canoga Ave., Canoga Park, CA 91304, Attention: R. F. utton
3ITR-80-076, available through Rocketdyne Division of Rockwell International,
6633 Canoga Ave., Canoga Park, CA 91304, Attention: R. F. Sutton
'Dailey, J. W., and Nece, R. E., "Chamber Dimension Effects on Induced Flow
and Frictional Resistance of Enclosed Rotating Disks", Journal of Basic
Engineering, Transactions of the ASME, Series D, Volume 82, Number 1,
March 1960, pages 217-232.
SBalje, 0. E., and Binsley, R. L., "Axial Turbine Performance Evaluation.
Part A - Loss-Loss-Geometry Relationships", Journal of Engineering for
Power, Transactions of the ASME, October 1963, pages 341-348.
6Bilgen, E., and Boulos, R., "Functional Dependence of Torque Coefficient
of Coaxial Cylinders on Gap Width and Reynolds Number", Journal of Fluids
Engineering, Transactions of the ASME, March 19/3, pages 122-126.
141.U.S.Government Printing Office: I 98) 757 002/465

I


![Windage resistance of steam-turbine wheels - NIST Pagenvlpubs.nist.gov/nistpubs/bulletin/10/nbsbulletinv10n2p191_A2b.pdf · Buckinoham] WindageLossesofSteamTurbines 193 Theunitsofm,I,and](https://img.pdfslide.us/doc/110x75/5a71c0647f8b9a98538d259b/windage-resistance-of-steam-turbine-wheels-nist-pagenvlpubsnistgovnistpubsbulletin10nbsbulletinv10n2p191a2bpdfpdf.jpg)