Embed Size (px)
Citation preview
Jan 27, 2003 CSE 510 - Winter 2003 1
Interacting with Large Data Sets
Richard AndersonKen Fishkin
Jan 27, 2003 CSE 510 - Winter 2003 2
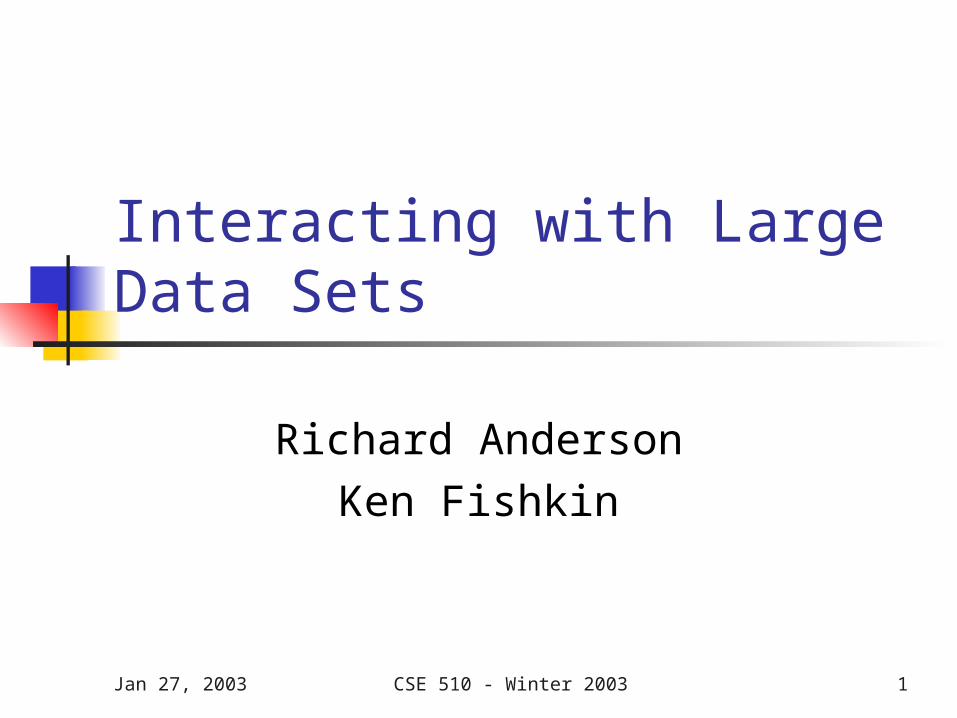
Issue is not amount of data

Jan 27, 2003 CSE 510 - Winter 2003 3
Issue: dimensionality date built, property value, architect,
owner, wheelchair-accessible, building-code violations, seismic stability, etc., etc.
Jan 27, 2003 CSE 510 - Winter 2003 4
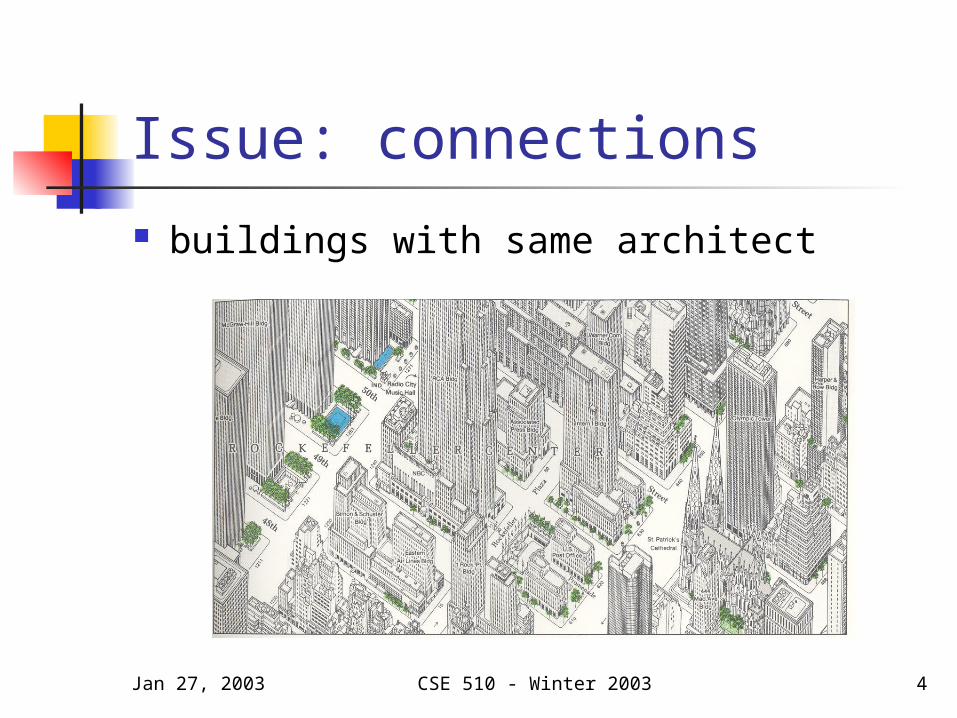
Issue: connections buildings with same architect
Jan 27, 2003 CSE 510 - Winter 2003 5
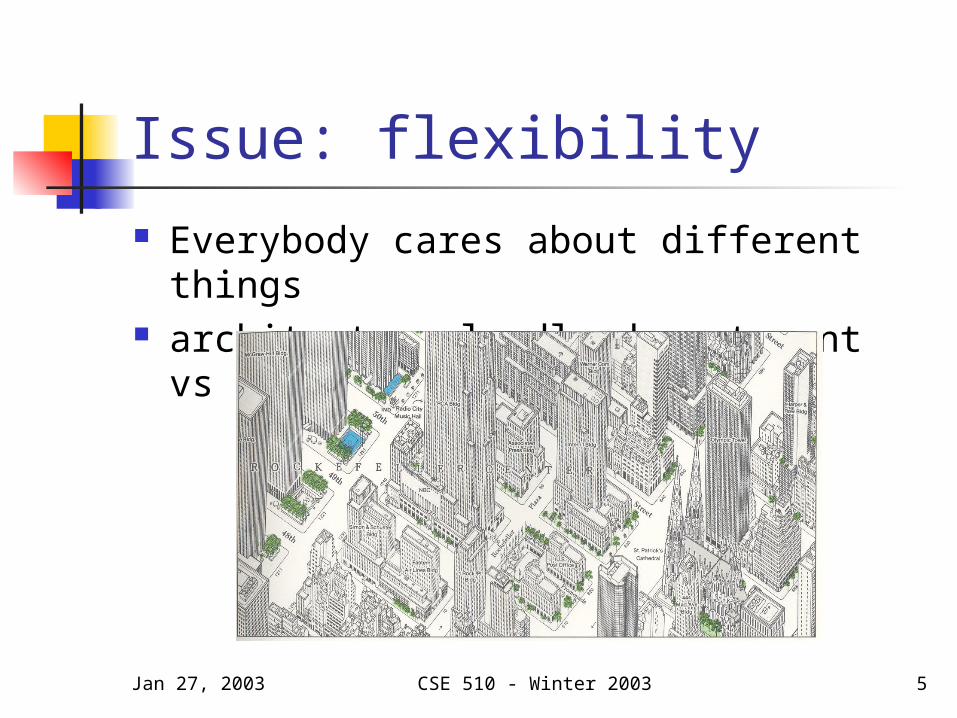
Issue: flexibility Everybody cares about different things architect vs landlord vs tenant vs ….
Jan 27, 2003 CSE 510 - Winter 2003 6
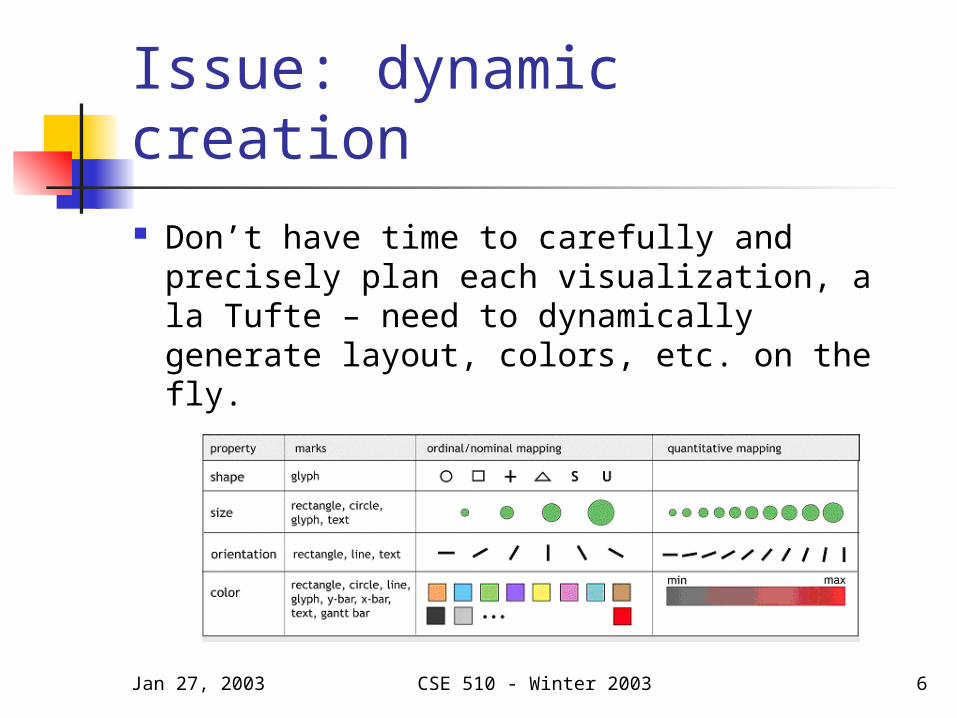
Issue: dynamic creation Don’t have time to carefully and
precisely plan each visualization, a la Tufte – need to dynamically generate layout, colors, etc. on the fly.
Jan 27, 2003 CSE 510 - Winter 2003 7
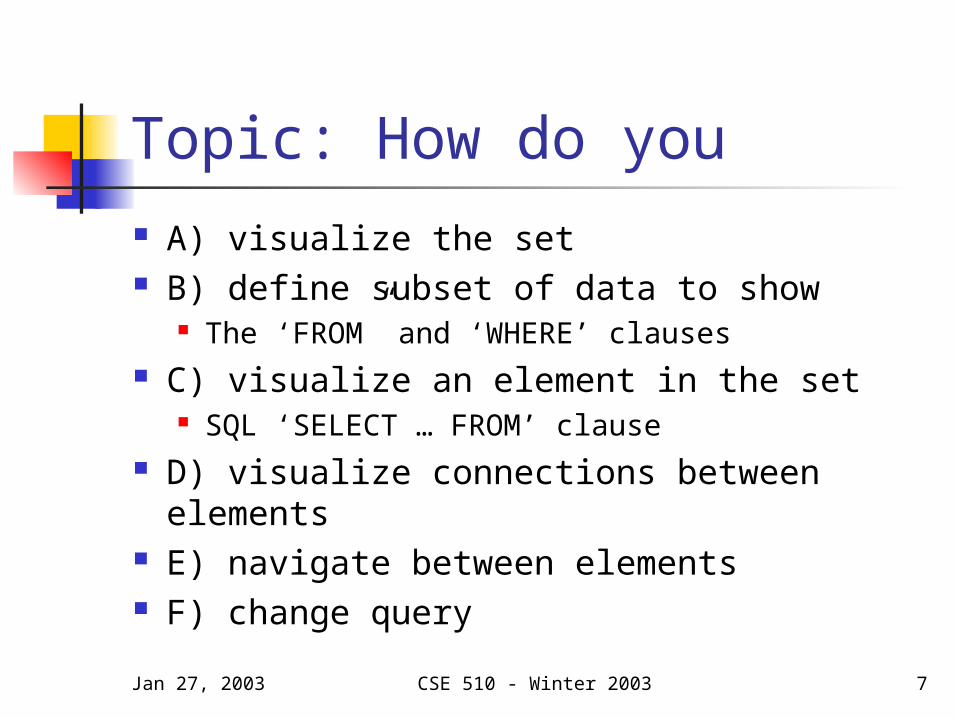
Topic: How do you A) visualize the set B) define subset of data to show
The ‘FROM” and ‘WHERE’ clauses C) visualize an element in the set
SQL ‘SELECT … FROM’ clause D) visualize connections between
elements E) navigate between elements F) change query
Jan 27, 2003 CSE 510 - Winter 2003 8
Two Main Types of Techniques
Those that focus on data (e.g. Stolte) Emphasis is on forming queries, showing
results Those that focus on connections
between data (e.g. Ping) Emphasis is on interactive nagivation,
showing space of elements Let’s do connections first (easier!)
Jan 27, 2003 CSE 510 - Winter 2003 9
Showing connections
Many techniques ignore this Whole new ball of wax Examples of when useful: org.
chart, bib. Citations, internet message traffic, gnutella

Jan 27, 2003 CSE 510 - Winter 2003 10
Connections: (A) showing set
Need to scale well for large networks
All employ various “fade-out” techniques Ping: works on arbitrary graphs, so
long as 1 conn. Component.
Jan 27, 2003 CSE 510 - Winter 2003 11
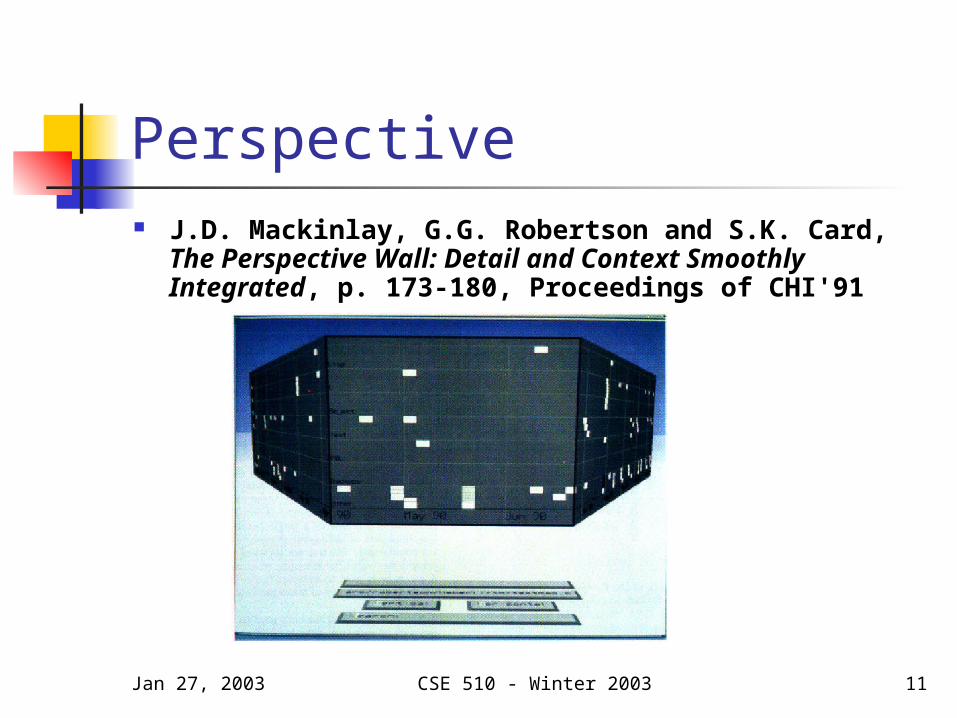
Perspective J.D. Mackinlay, G.G. Robertson and S.K. Card, The
Perspective Wall: Detail and Context Smoothly Integrated, p. 173-180, Proceedings of CHI'91
Jan 27, 2003 CSE 510 - Winter 2003 12
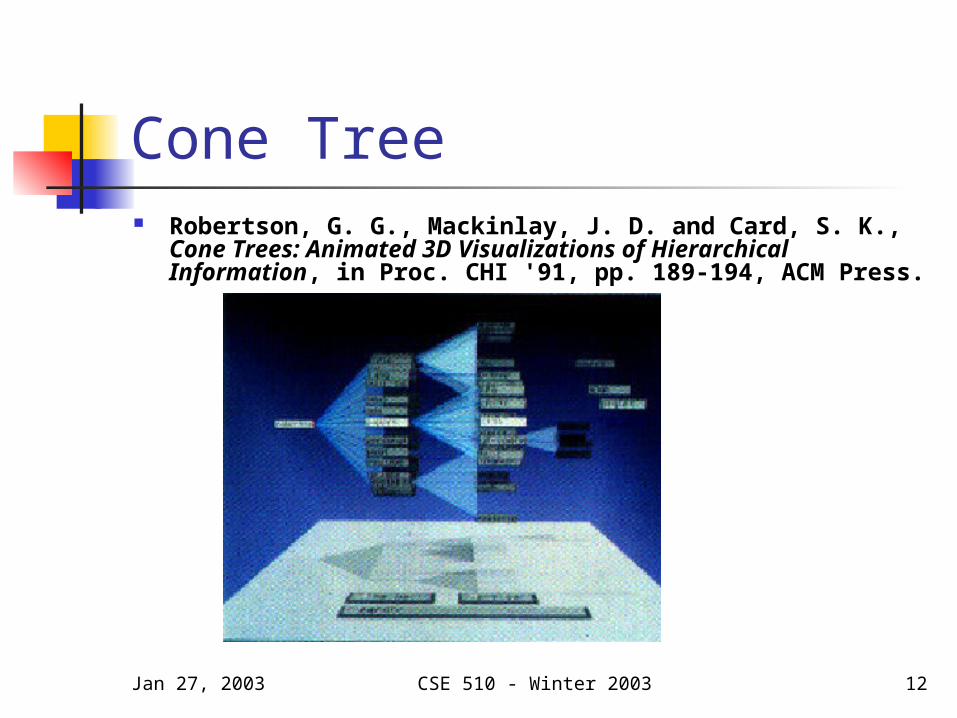
Cone Tree Robertson, G. G., Mackinlay, J. D. and Card, S. K., Cone
Trees: Animated 3D Visualizations of Hierarchical Information, in Proc. CHI '91, pp. 189-194, ACM Press.
Jan 27, 2003 CSE 510 - Winter 2003 13
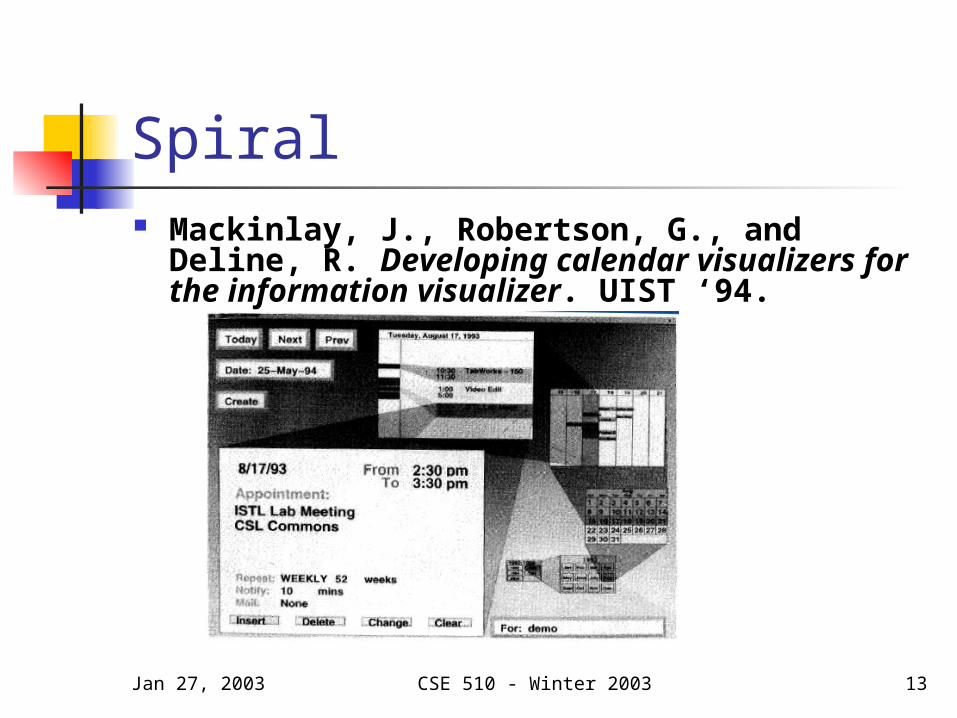
Spiral Mackinlay, J., Robertson, G., and Deline,
R. Developing calendar visualizers for the information visualizer. UIST ‘94.

Jan 27, 2003 CSE 510 - Winter 2003 14
Sphere Lamping, J. and Rao, R., "The Hyperbolic Browser:
A Focus + Context Technique for Visualizing Large Hierarchies," CHI ’96.
Jan 27, 2003 CSE 510 - Winter 2003 15
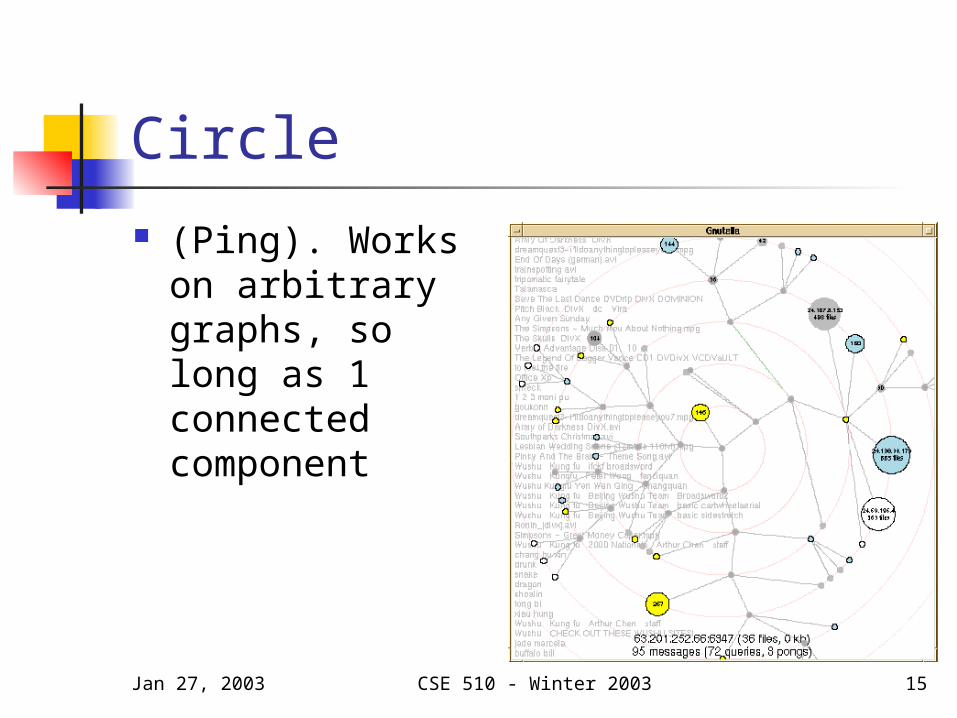
Circle (Ping). Works
on arbitrary graphs, so long as 1 connected component
Jan 27, 2003 CSE 510 - Winter 2003 16
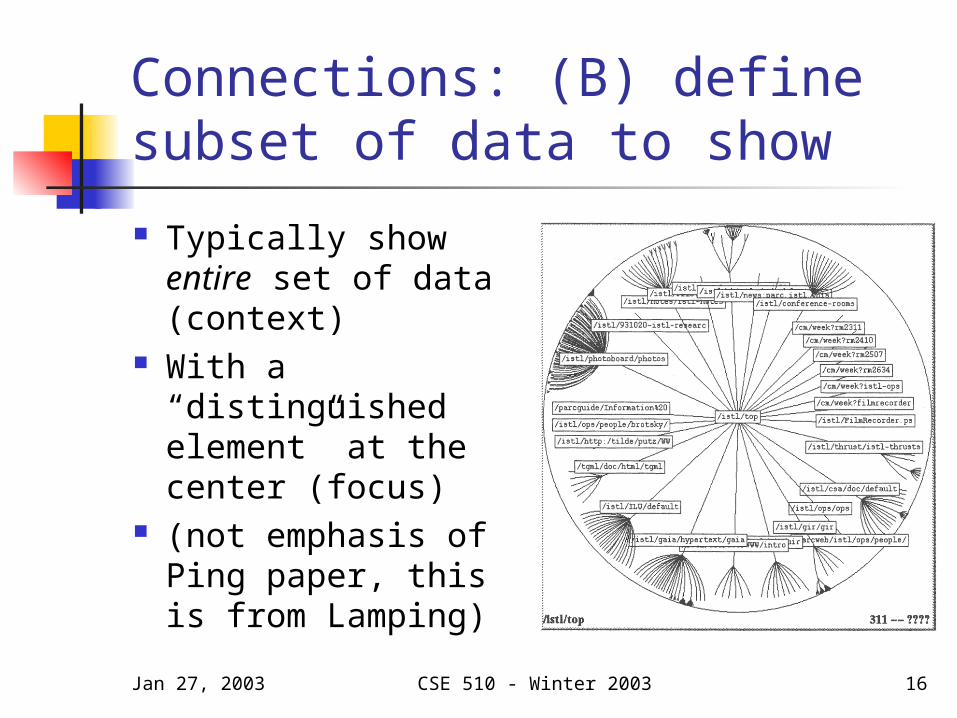
Connections: (B) define subset of data to show
Typically show entire set of data (context)
With a “distinguished element” at the center (focus)
(not emphasis of Ping paper, this is from Lamping)
Jan 27, 2003 CSE 510 - Winter 2003 17
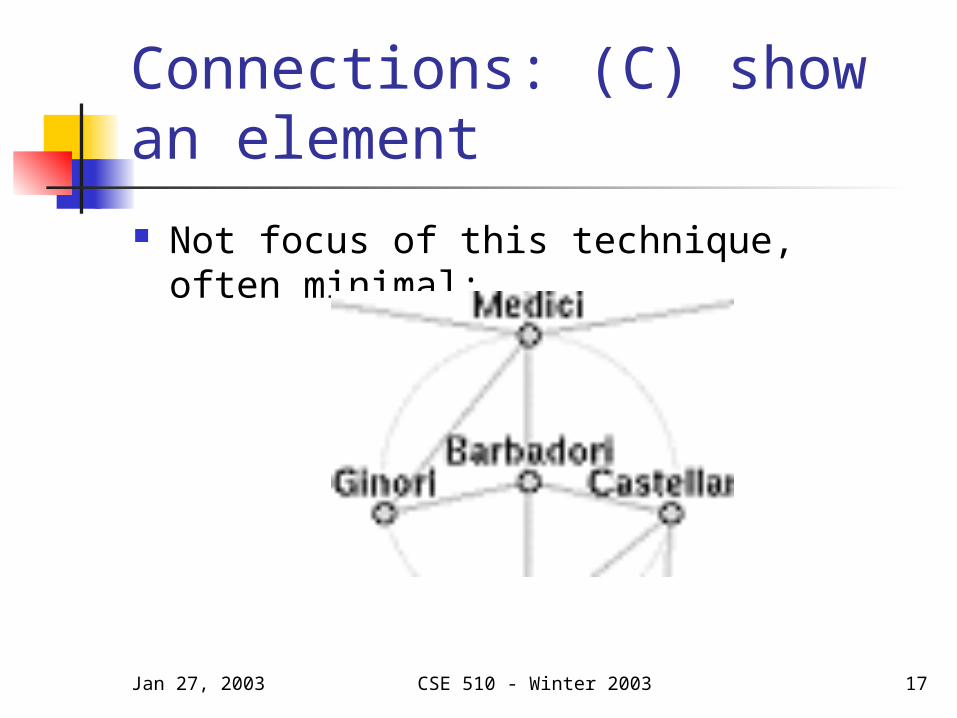
Connections: (C) show an element Not focus of this technique, often
minimal:
Jan 27, 2003 CSE 510 - Winter 2003 18
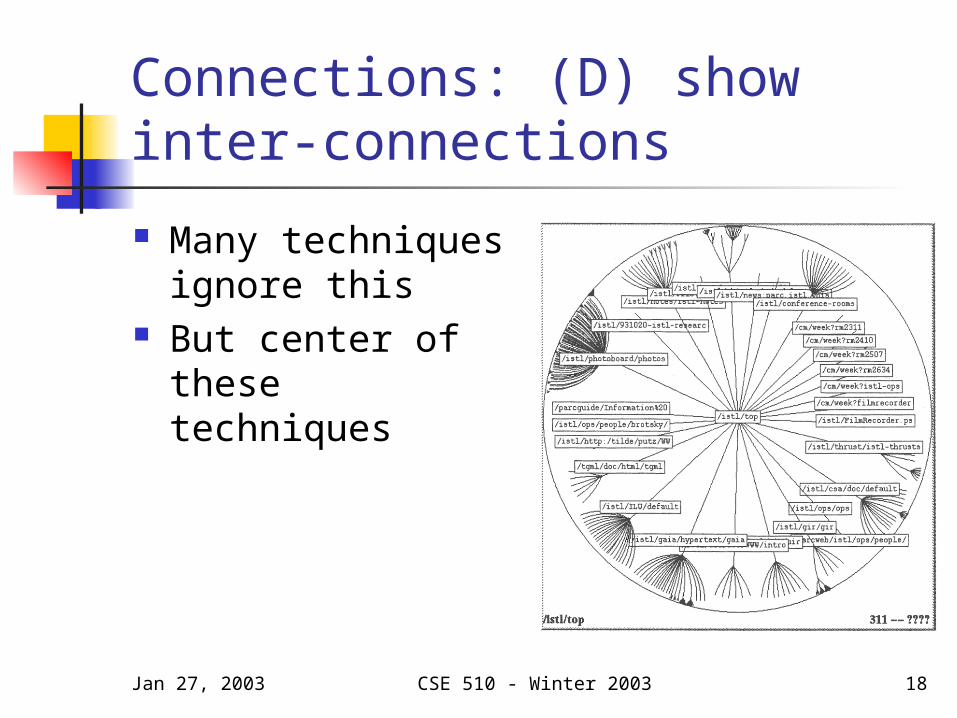
Connections: (D) show inter-connections
Many techniques ignore this
But center of these techniques
Jan 27, 2003 CSE 510 - Winter 2003 19
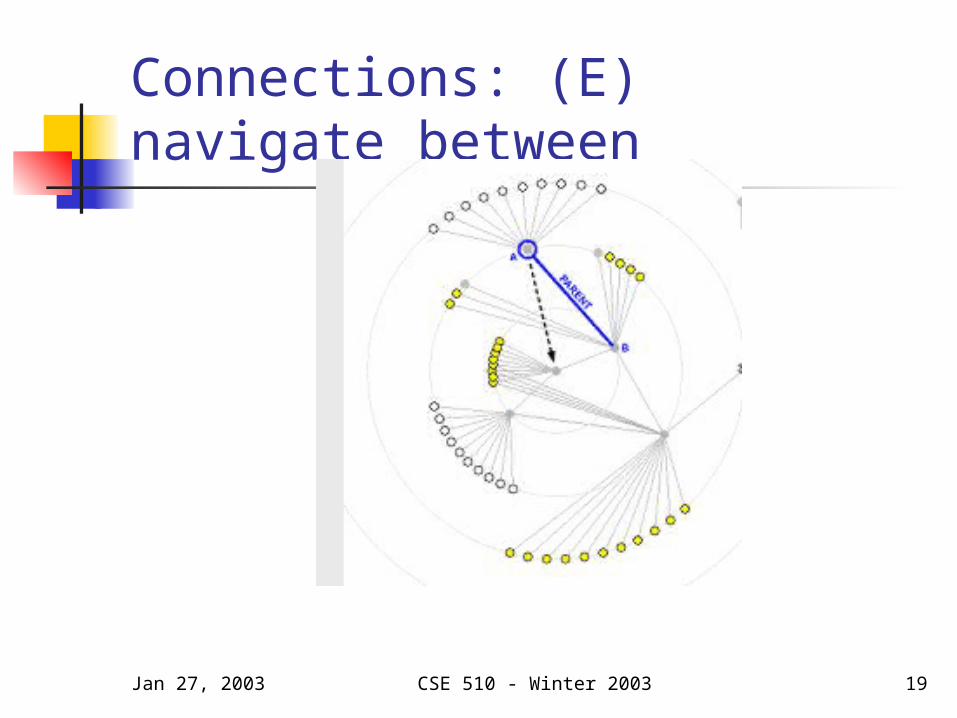
Connections: (E) navigate between
Jan 27, 2003 CSE 510 - Winter 2003 20
Connections: (F) change query
Navigation is implicitly changing the query
Jan 27, 2003 CSE 510 - Winter 2003 21
Yee Paper: Summary How to visualize networks
Small amount of data/node How to intuitively do transition Handles scaling problem by mapping to circle –
not infinite, but good Allocate children radially, space is F(subtree
size). Bit of a kludge with non-tree edges (don’t
“count” in tree size) Transition done via polar rotation Also vector between old and new root
maintained Also animation used (slow-in, slow-out)
Jan 27, 2003 CSE 510 - Winter 2003 22
Digression This work started
from a class project in a class similar to this

Jan 27, 2003 CSE 510 - Winter 2003 23
Digression “it makes more sense to linearly
interpolate the polar coordinates of the nodes, rather than their rectangular coordinates” WHY? Their answers:
“Since the nodes are radially positioned”. Clustering nodes “reduces effort to understand
the animation”, since nodes move in chunks Moving in arcs is “an effective technique from
traditional animation” My answer: To better match the metaphor
This is theme we will expand upon later

Jan 27, 2003 CSE 510 - Winter 2003 24
Stolte Paper
Much harder problem. Why? A) handle infinite number of fields B) handle queries and show data of
various types, with various visualizations
They show a “swiss army knife” that can generate many different queries/visualizations.
Jan 27, 2003 CSE 510 - Winter 2003 25
(But….. It’s really even harder) In “real life”, most tables use numerous levels
of ‘join’, which these techniques largely gloss over.
E.g. the query “find customers who ordered a book from a publisher in their same state” will typically require at least: (Customer JOIN order) (JOIN asset) (JOIN book) (JOIN publisher)
Some queries are virtually impossible to answer any other way than via a complex SQL query, e.g. “find all publishers in New York who have sold > 1000 Bibles in the last year”
Jan 27, 2003 CSE 510 - Winter 2003 26
Step 1: Pick major axes Drag-and-drop 2 fields onto X and Y
axes, “shelves” Minimal filtering (bounds, undefined
subset-choosing). All fields are of 2 types:
Quantitative (i.e. real #s: price, salary…)
Ordinal (i.e. enum’s: state, month, …) So we get 3 possibilities:
Jan 27, 2003 CSE 510 - Winter 2003 27
1) Quant vs. Quant
Classic chart or scatterplot Chatterplot: (student height vs.
GPA) Can turn scatterplot into graph by
using SUM, AVG, MIN, etc.: (student height vs AVG(GPA))
Jan 27, 2003 CSE 510 - Winter 2003 28
2) Ordinal vs. Quant
Bar chart, dot plot, or gantt chart Bar chart: (birth state vs. GPA)

Jan 27, 2003 CSE 510 - Winter 2003 29
Gantt chart: like Microsoft project timelines:
Jan 27, 2003 CSE 510 - Winter 2003 30
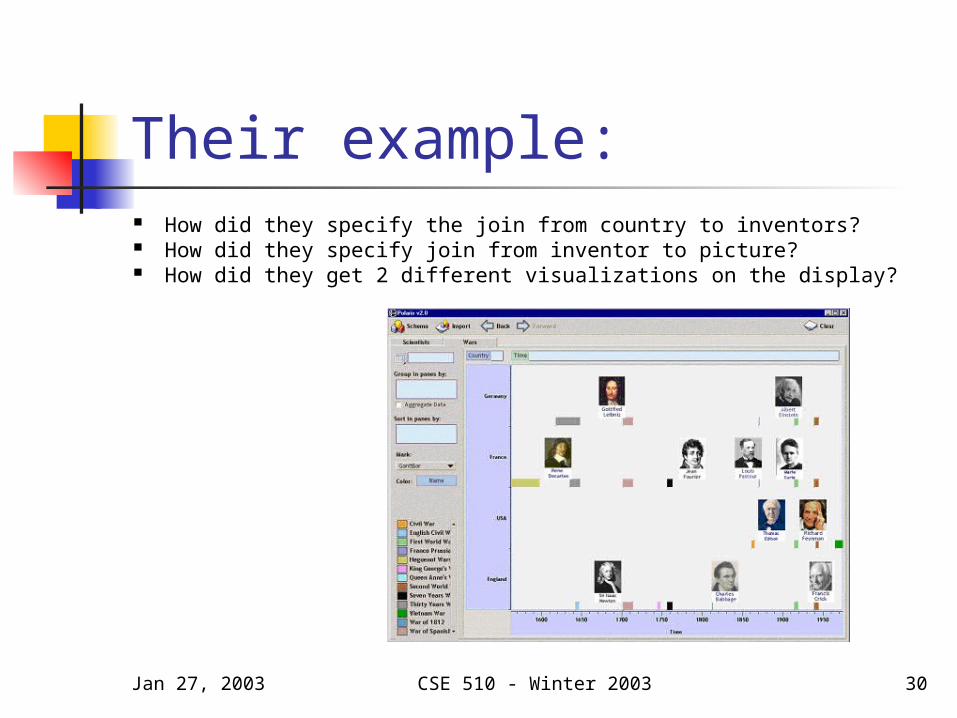
Their example: How did they specify the join from country to inventors? How did they specify join from inventor to picture? How did they get 2 different visualizations on the display?
Jan 27, 2003 CSE 510 - Winter 2003 31
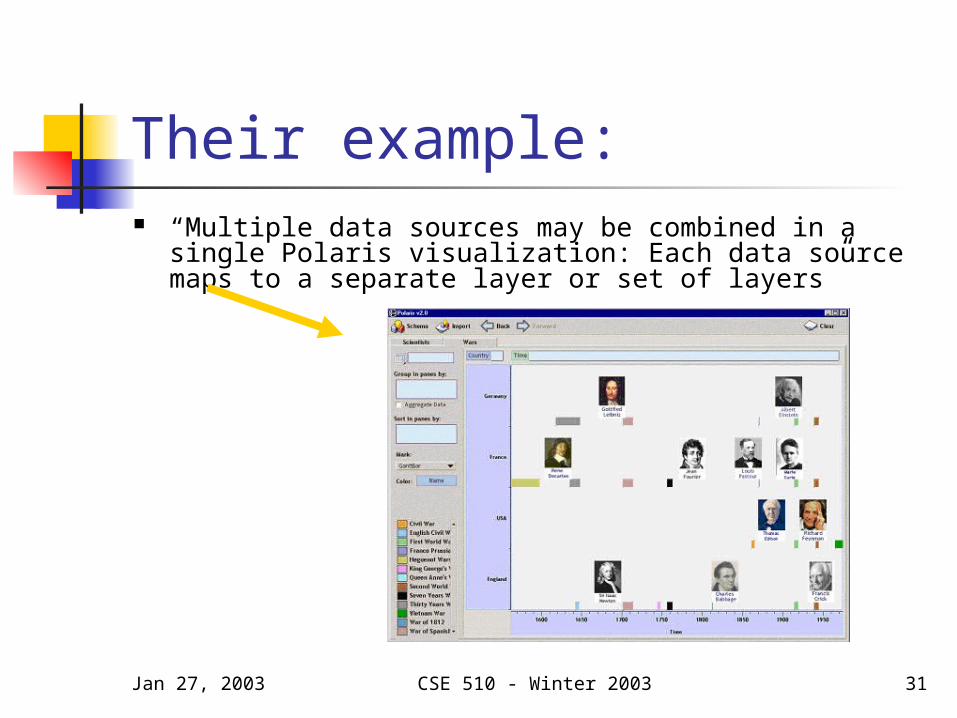
Their example: “Multiple data sources may be combined in a single
Polaris visualization: Each data source maps to a separate layer or set of layers”
Jan 27, 2003 CSE 510 - Winter 2003 32
3) Ordinal vs. Ordinal
Axis variables are typically independent (e.g. birth state vs. birth month)
You can then introduce additional dimensions
Jan 27, 2003 CSE 510 - Winter 2003 33
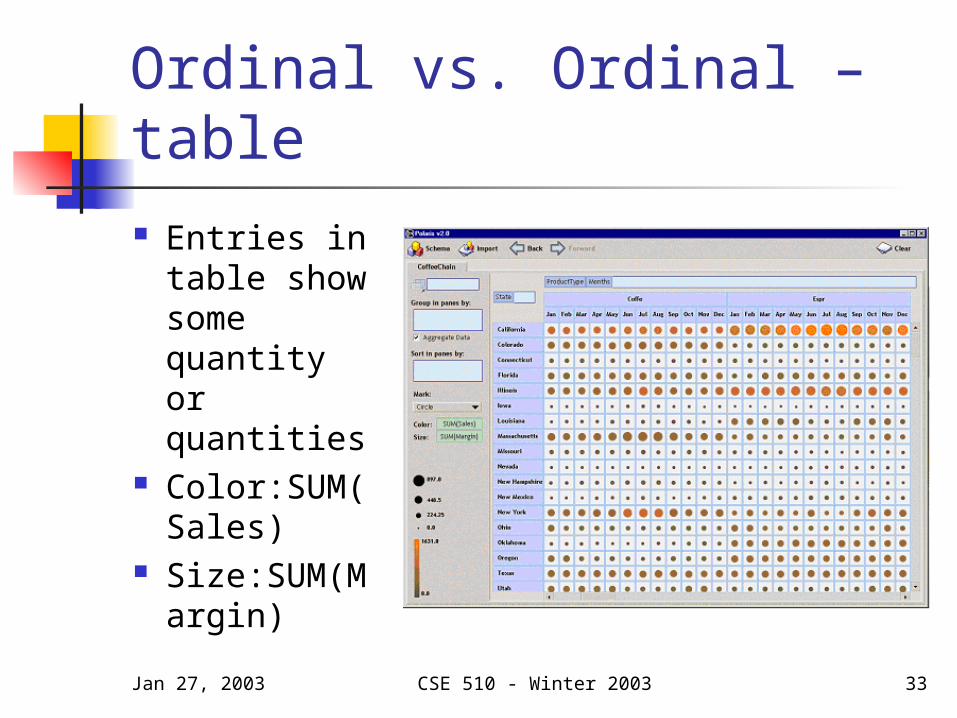
Ordinal vs. Ordinal – table Entries in
table show some quantity or quantities
Color:SUM(Sales)
Size:SUM(Margin)
Jan 27, 2003 CSE 510 - Winter 2003 34
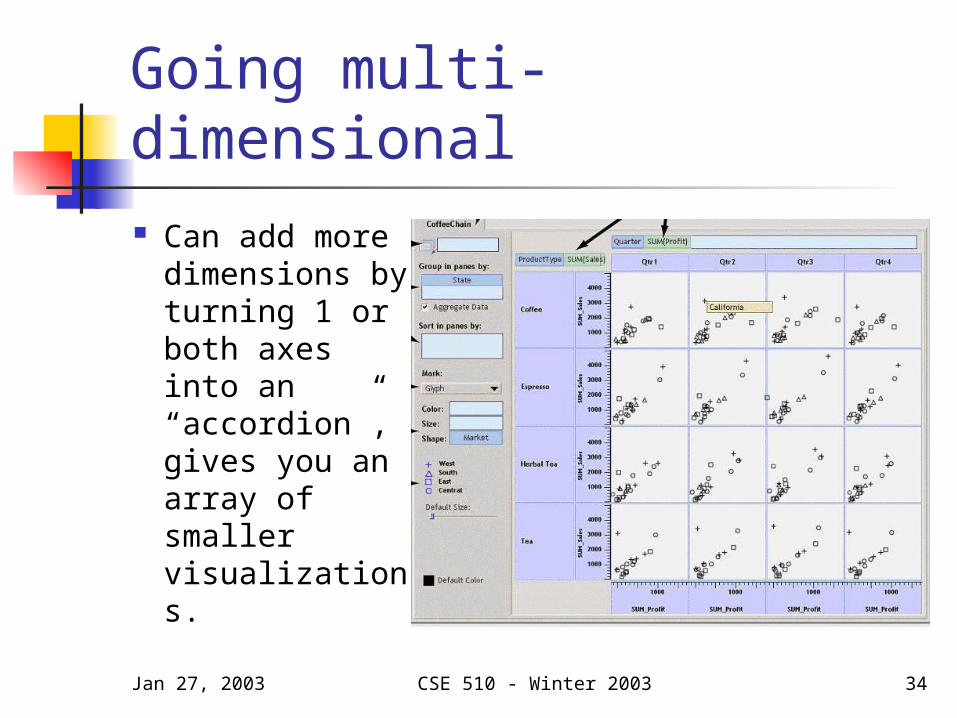
Going multi-dimensional Can add more
dimensions by turning 1 or both axes into an “accordion”, gives you an array of smaller visualizations.
Jan 27, 2003 CSE 510 - Winter 2003 35
Stolte: (A) showing set
Not done. You could do a “null query” and get a scatterplot, if you so desired.
Jan 27, 2003 CSE 510 - Winter 2003 36
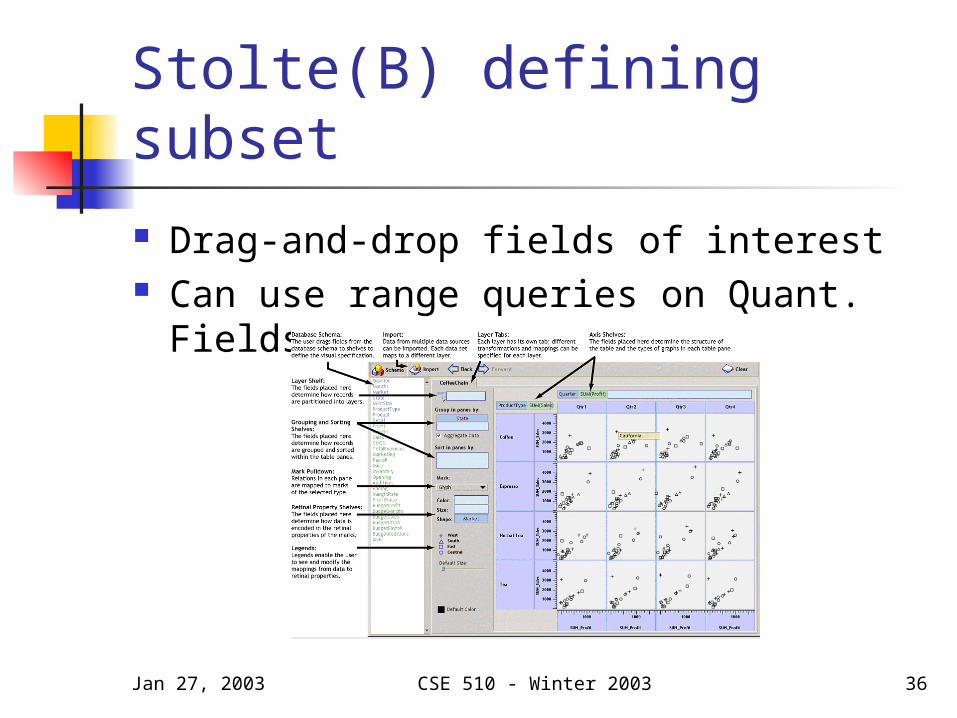
Stolte(B) defining subset Drag-and-drop fields of interest Can use range queries on Quant. Fields
Jan 27, 2003 CSE 510 - Winter 2003 37
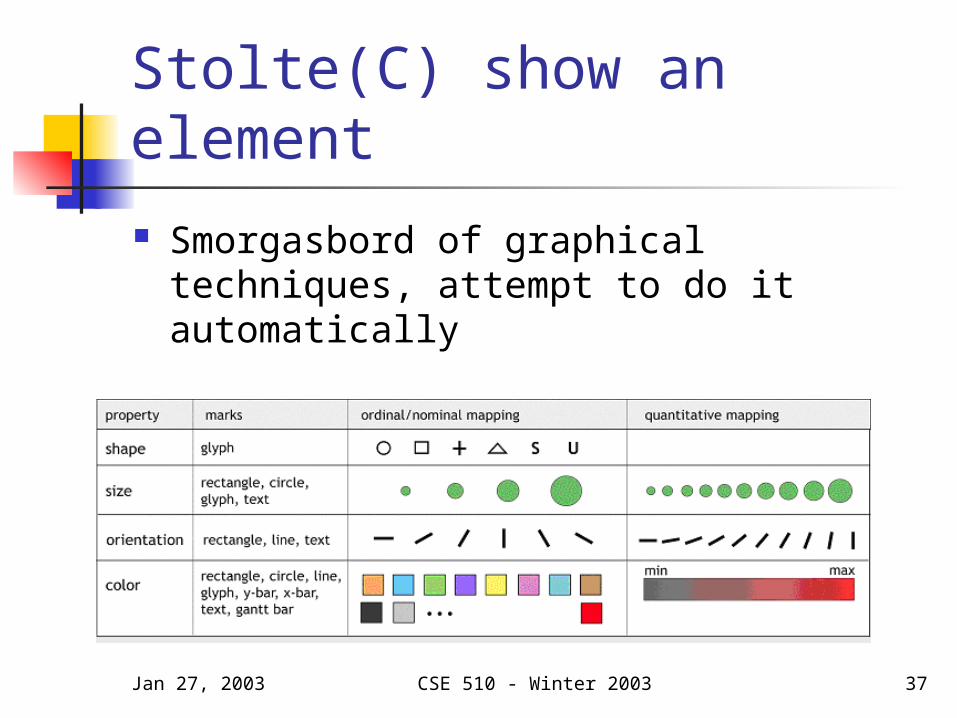
Stolte(C) show an element Smorgasbord of graphical techniques,
attempt to do it automatically

Jan 27, 2003 CSE 510 - Winter 2003 38
Stolte(D) show inter-connections Can overlay graphs, but not their emphasis. Supports “brushing”
Jan 27, 2003 CSE 510 - Winter 2003 39
Stolte(E) Navigate between elements
N.A. – you build up queries and modify them, use GUI.

Jan 27, 2003 CSE 510 - Winter 2003 40
Stolte(F) Change query Use drag-and-drop, pull-downs, etc.
Jan 27, 2003 CSE 510 - Winter 2003 41
Project
One reason queries are so complicated is because they work in “SQL space”. Could they be more readily described in “tuple space”? What if the “operands” are tuples in the database, and the queries become “find more like these”, “compare ones like this to ones like those”, etc.
Jan 27, 2003 CSE 510 - Winter 2003 42
Project Amazon.com has made a subset of its
database available for Web programming (http://associates.amazon.com/exec/panama/associates/ntg/browse/-/567632) . Here both the elements, and the connections between them, are available and of interest. Explore visualization techniques which show both elements and connections, using the Amazon data.
Jan 27, 2003 CSE 510 - Winter 2003 43
Project
All these techniques focus on showing how the data is now. Sometimes, what is also (or even mainly!) of interest is showing trends in the data and its interconnections over time. Explore visualization techniques that focus on deltas in connections over time (possible IRS project).
Jan 27, 2003 CSE 510 - Winter 2003 44
Projects from Yee Small graphs and large ones had
different preferences for transition models. This implies that perhaps a third model would do better. Find it.
Extend it to work on very large graphs (as they suggest)
Extend it to show temporal changes – right now, only done if watching animation.
Jan 27, 2003 CSE 510 - Winter 2003 45
Project
New “fade-out” technique
Jan 27, 2003 CSE 510 - Winter 2003 46
Next Time
No readings! Guest Lecturer: Alan Borning, will
talk about “Visualization Challenges in Urban Sim”
This will end the Visualization exploration – next stop, Pen Computing