Embed Size (px)
Citation preview
James Tam
When To Use Pictures: Their Strength
• People have a powerful ability to recognize images that they have previously seen.
–e.g., Standing et. al. (1970)1 had over a 90% accuracy rate with test subjects recognizing whether or not they had previously seen an image (out of 2560 viewed over several days)
1 Standing, L., Auto Numbering, I., and Haber, R.N. (1970) Perception and memory for pictures: single trial learning of 2560 visual stimuli. Psychonomic Science 19: 73 – 74).
James Tam
Pictures Vs. Words
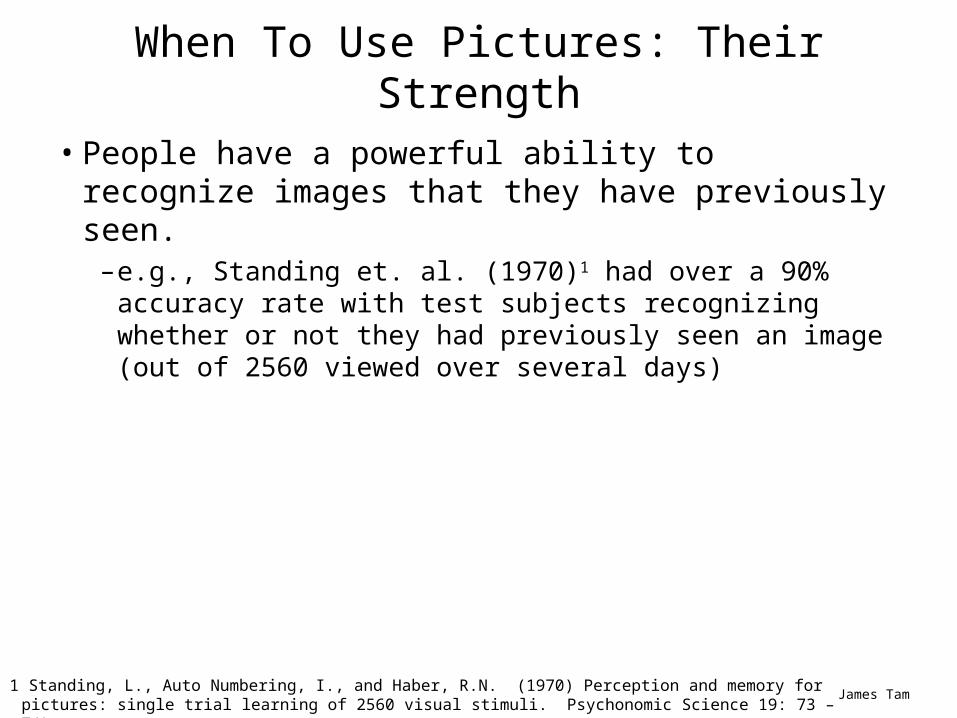
• Pictures are better than text for showing structural relations.
Text
Jane is Jim’s boss.
Jim is Joe’s boss.
Anne works for Jane.
Mark works for Jim
Anne is Mary’s boss.
Anne is Mike’s boss.
Structure diagram
Jane
Jim Anne
Joe Mark Mike Mary
James Tam
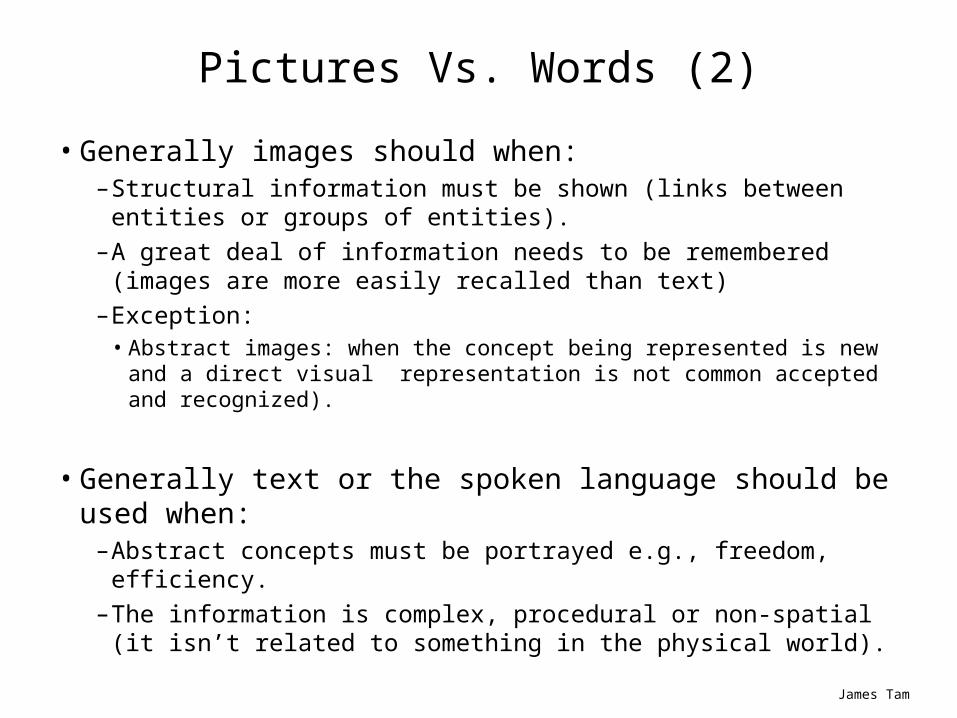
Pictures Vs. Words (2)
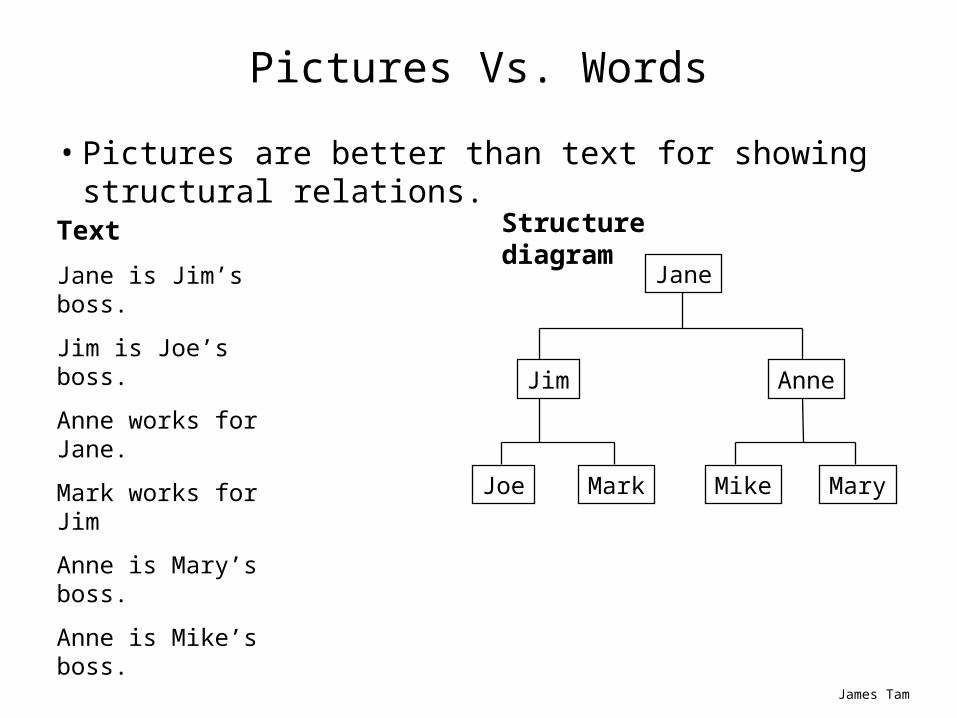
• Generally images should when:–Structural information must be shown (links between entities or groups
of entities).–A great deal of information needs to be remembered (images are more
easily recalled than text)–Exception:
• Abstract images: when the concept being represented is new and a direct visual representation is not common accepted and recognized).
• Generally text or the spoken language should be used when:–Abstract concepts must be portrayed e.g., freedom, efficiency.–The information is complex, procedural or non-spatial (it isn’t related to
something in the physical world).
James Tam
What Representation Should Be Used In A Spreadsheet?
• Text?• A graph?
–What type of graph? (Pie, bar, scatter etc.)
James Tam
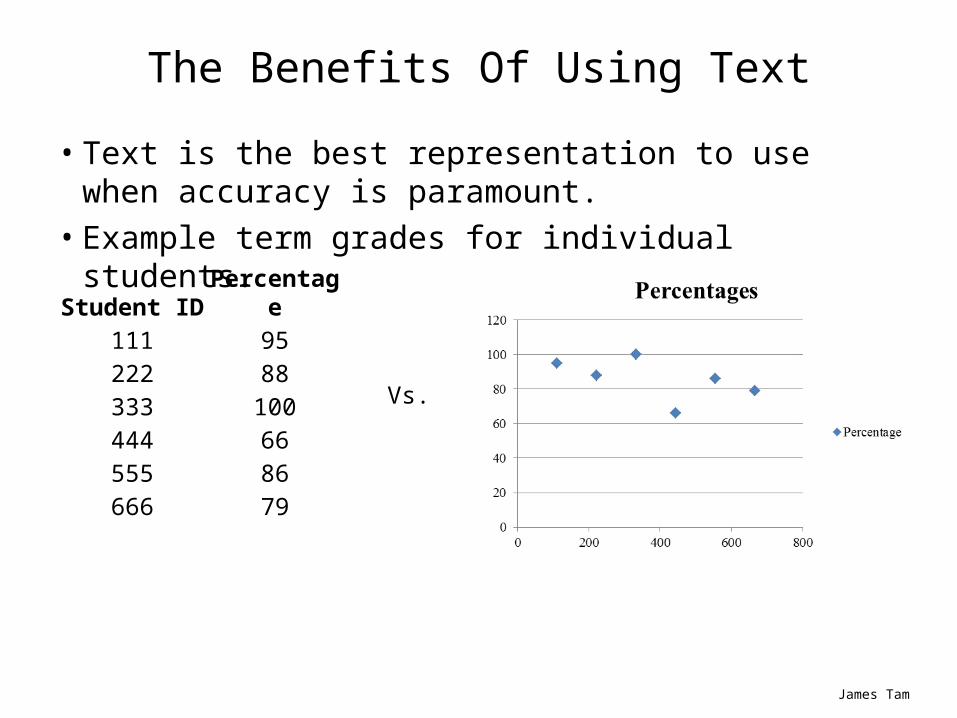
The Benefits Of Using Text
• Text is the best representation to use when accuracy is paramount.
• Example term grades for individual students.
Student ID Percentage111 95222 88333 100444 66555 86666 79
Vs.
James Tam
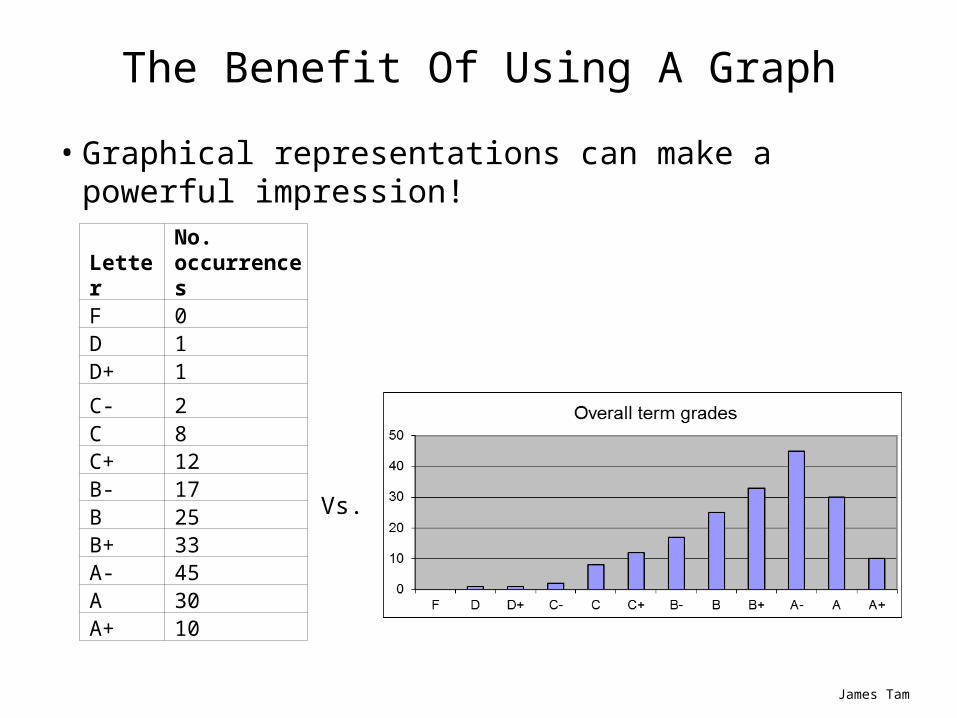
The Benefit Of Using A Graph
• Graphical representations can make a powerful impression!
LetterNo. occurrences
F 0D 1D+ 1
C- 2C 8C+ 12B- 17B 25B+ 33A- 45A 30A+ 10
Vs.
James Tam
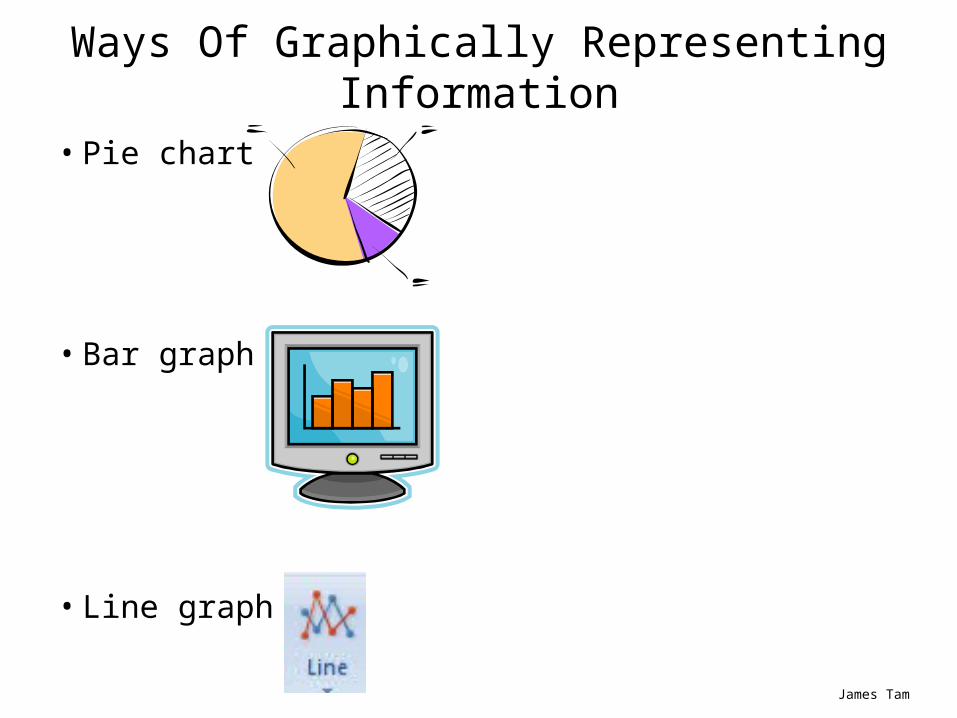
Ways Of Graphically Representing Information
• Pie chart
• Bar graph
• Line graph
James Tam
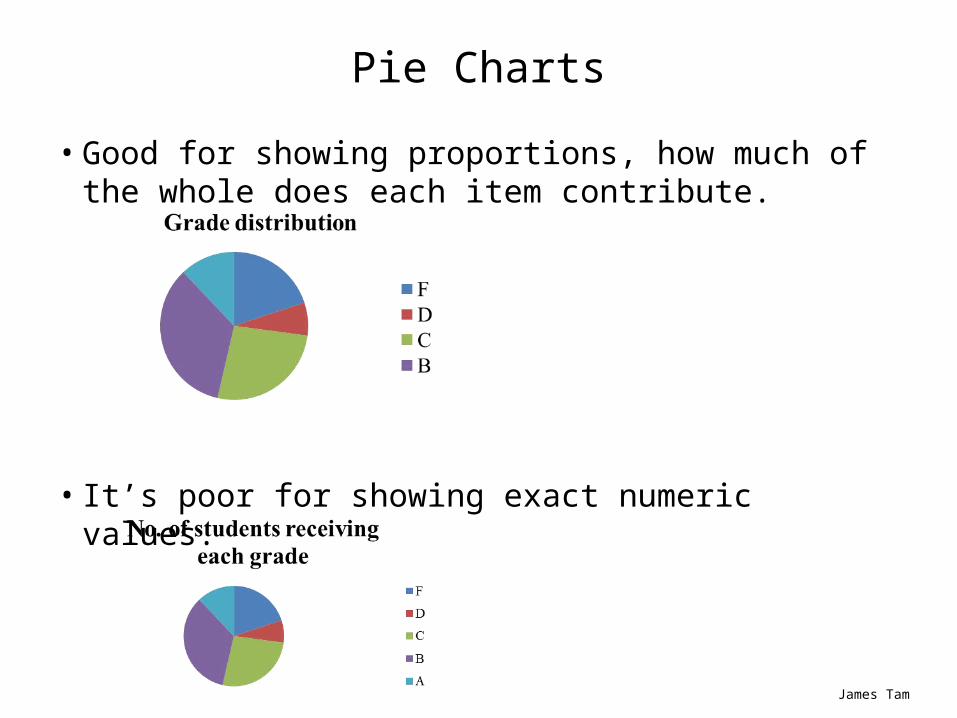
Pie Charts
• Good for showing proportions, how much of the whole does each item contribute.
• It’s poor for showing exact numeric values.
James Tam
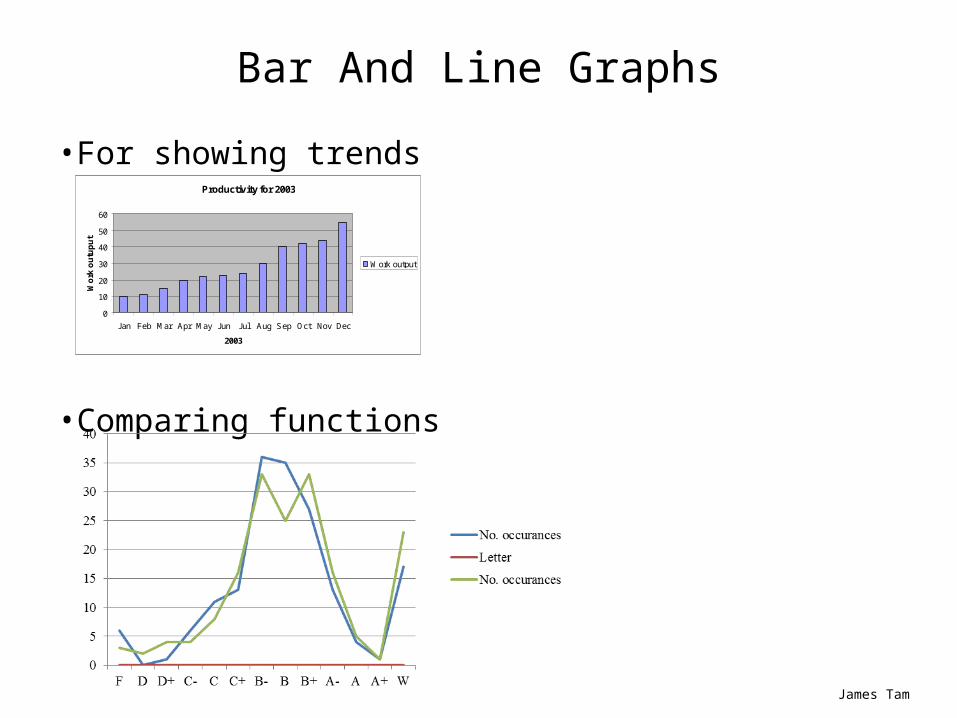
Bar And Line Graphs
•For showing trends
•Comparing functions
Productivity for 2003
0
10
20
30
40
50
60
Jan Feb Mar Apr May Jun Jul Aug Sep Oct Nov Dec
2003
Wo
rk o
utu
pu
t
Work output
James Tam
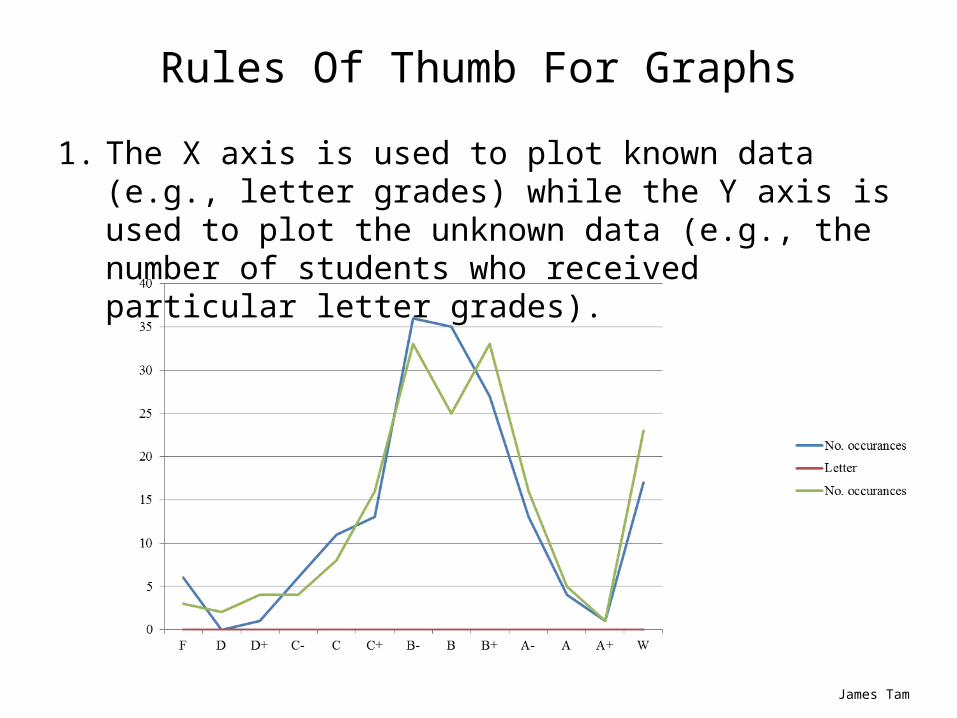
Rules Of Thumb For Graphs
1. The X axis is used to plot known data (e.g., letter grades) while the Y axis is used to plot the unknown data (e.g., the number of students who received particular letter grades).
James Tam
Rules Of Thumb For Graphs (2)
2. Bar graphs are used to plot non-continuous data e.g., the number of patients that were admitted to different hospitals.
3. Line graph are used to plot continuous data e.g., mortality trends over time.
James Tam
Use Color Sparingly
• Don’t use color like did when you were a kid.
James Tam
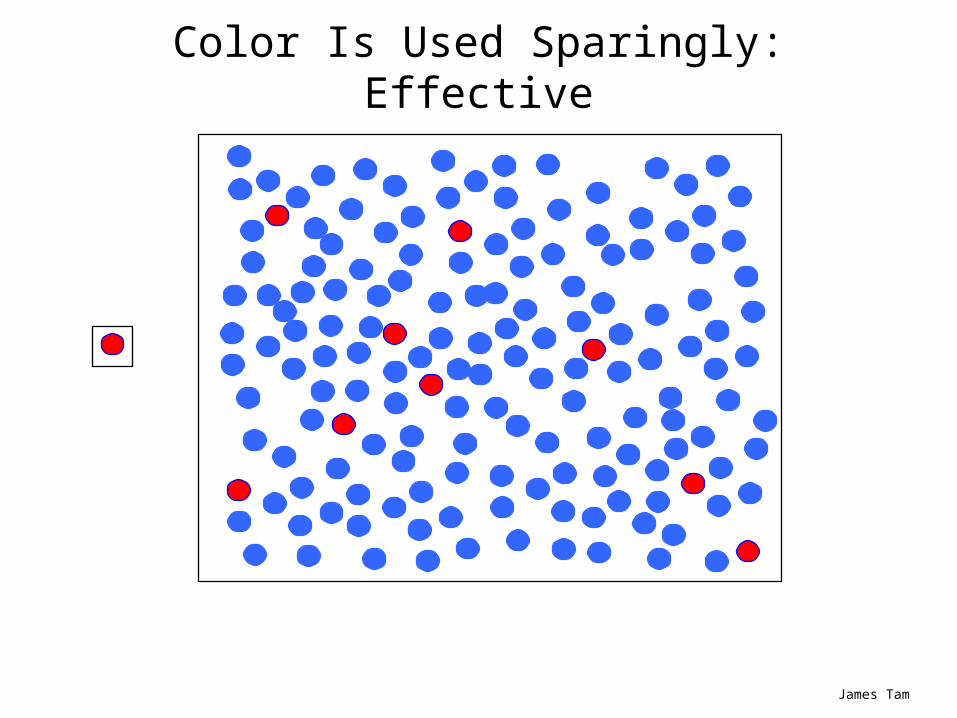
Color Is Used Sparingly: Effective
James Tam
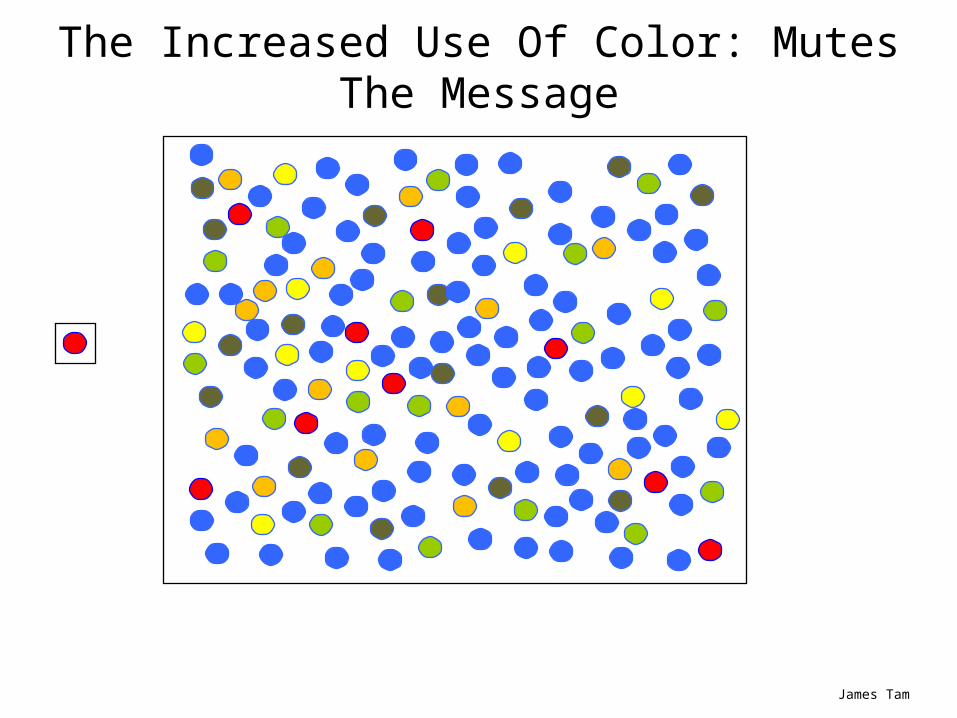
The Increased Use Of Color: Mutes The Message
James Tam
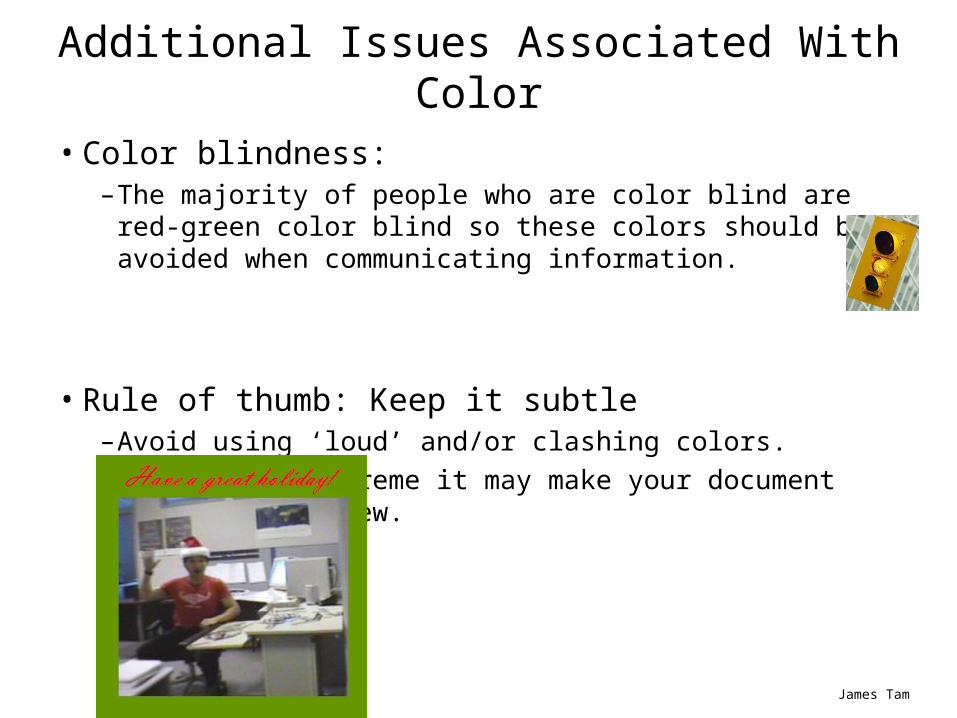
Additional Issues Associated With Color
• Color blindness:–The majority of people who are color blind are red-green color blind so
these colors should be avoided when communicating information.
• Rule of thumb: Keep it subtle–Avoid using ‘loud’ and/or clashing colors.–Taken to an extreme it may make your document difficult to view.
James Tam
Additional Issues Associated With Color (2)
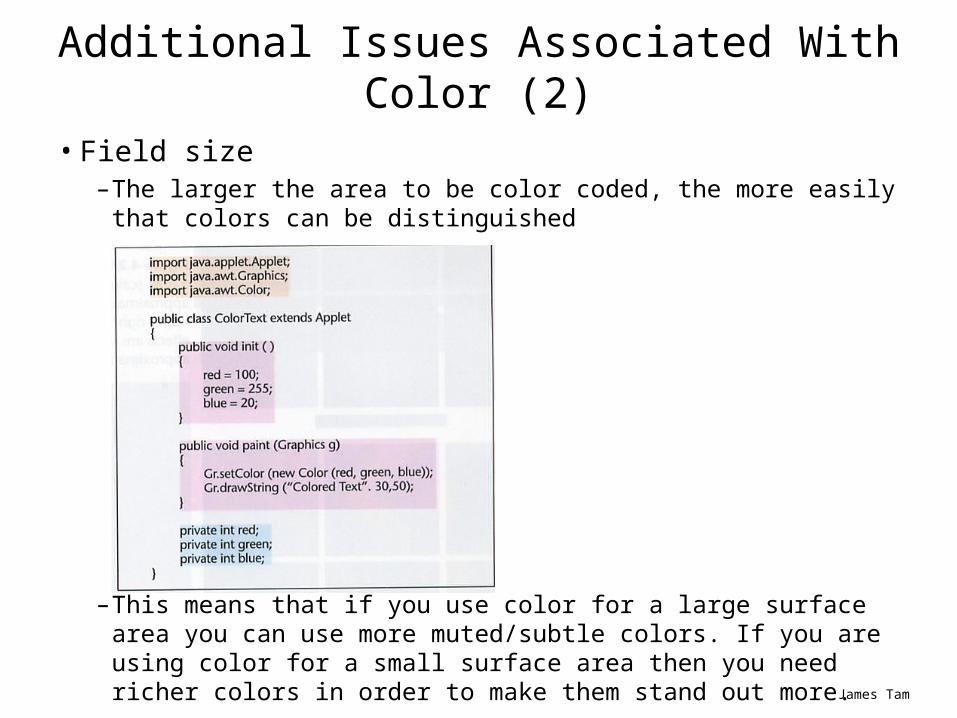
• Field size–The larger the area to be color coded, the more easily that colors can be
distinguished
–This means that if you use color for a large surface area you can use more muted/subtle colors. If you are using color for a small surface area then you need richer colors in order to make them stand out more.
James Tam
Additional Issues Associated With Color (2)
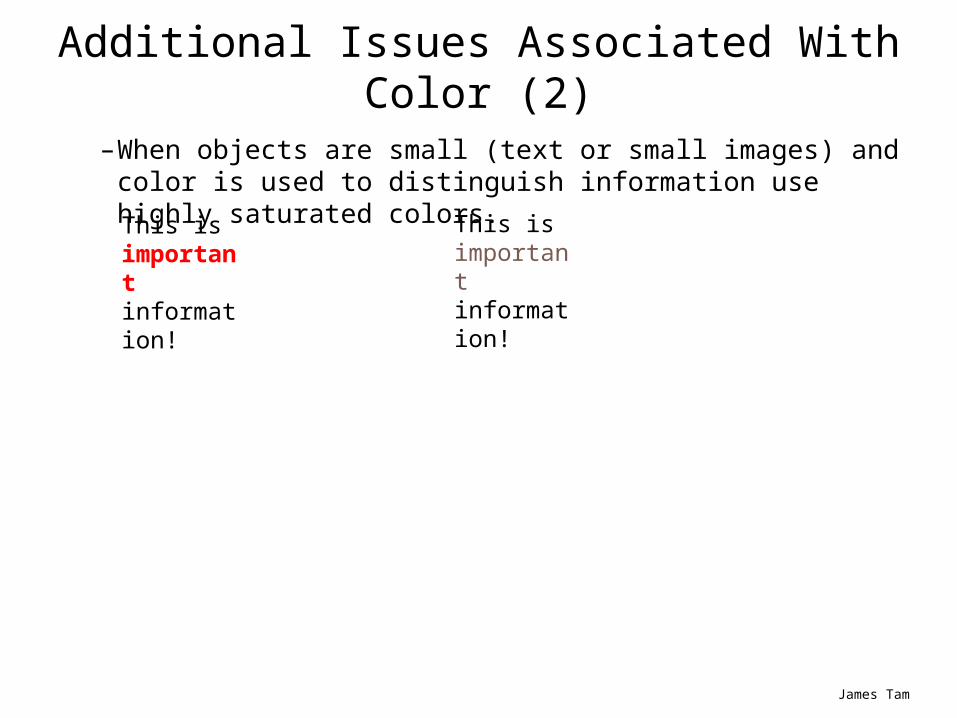
–When objects are small (text or small images) and color is used to distinguish information use highly saturated colors.
This is important information!
This is important information!