Embed Size (px)
Citation preview
James Nowotarski
29 May 2008
IS 425Enterprise Information
Spring 2008
2
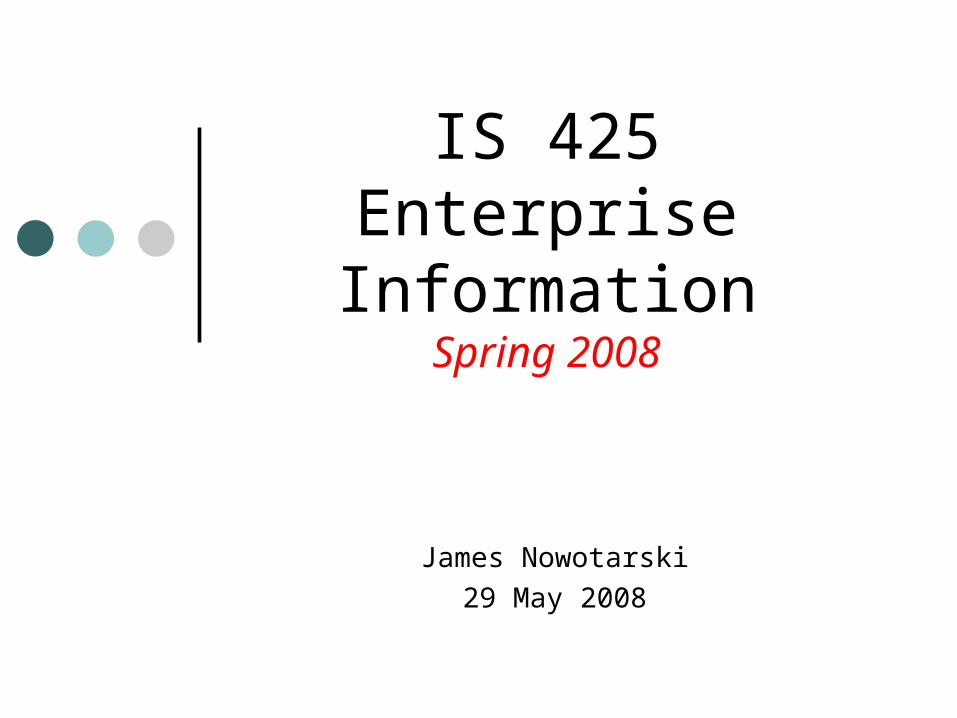
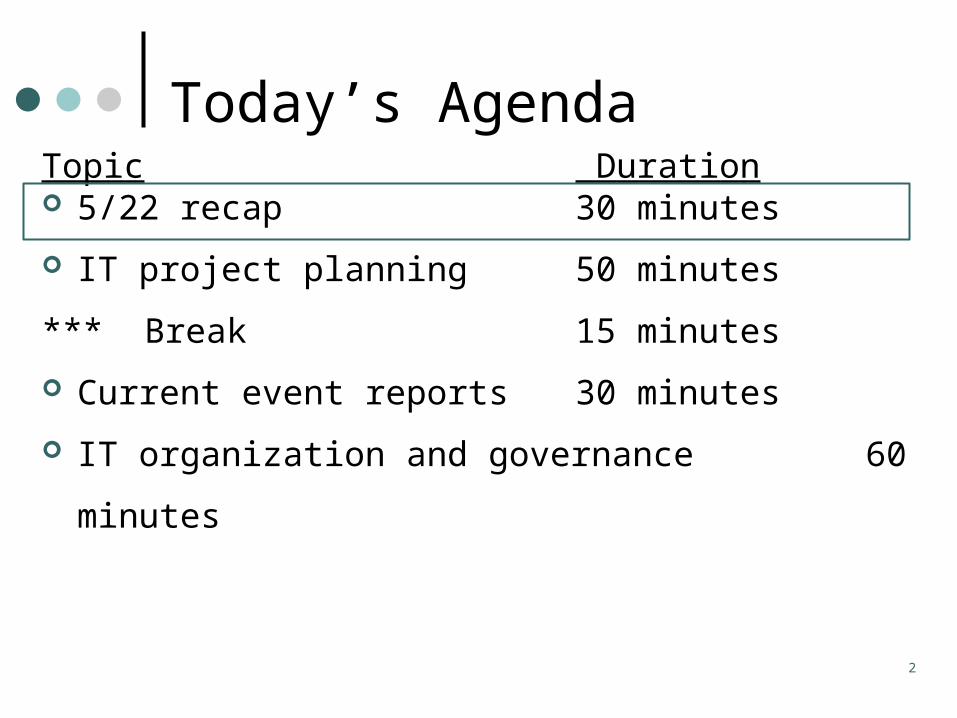
Topic Duration 5/22 recap 30 minutes
IT project planning 50 minutes
*** Break 15 minutes
Current event reports 30 minutes
IT organization and governance 60 minutes
Today’s Agenda
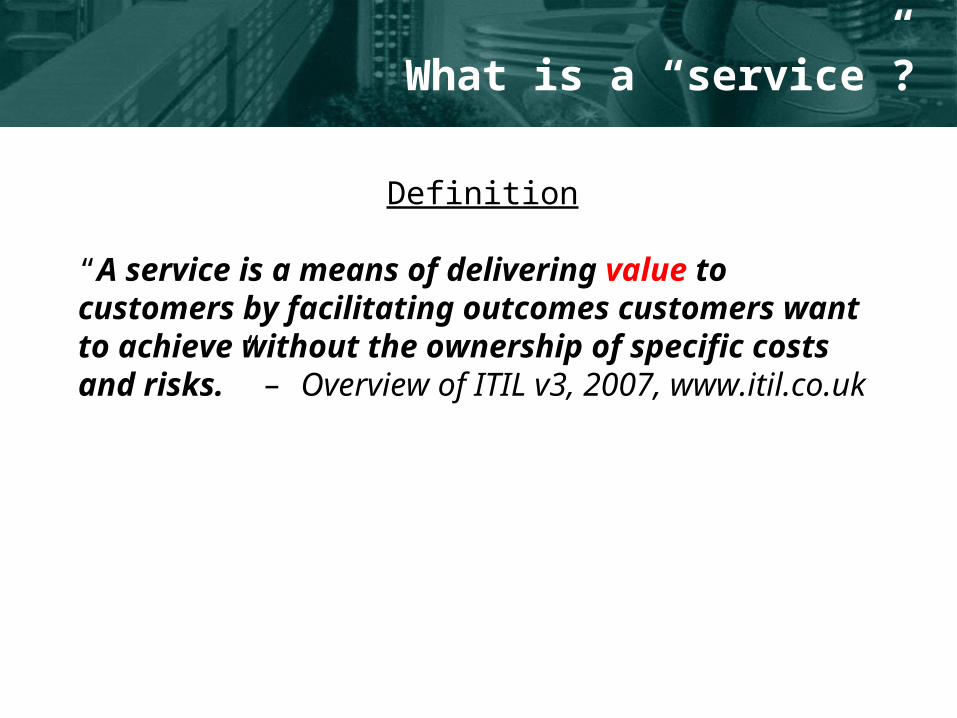
What is a “service”?
Definition
“A service is a means of delivering value to customers by facilitating outcomes customers want to achieve without the ownership of specific costs and risks.” – Overview of ITIL v3, 2007, www.itil.co.uk
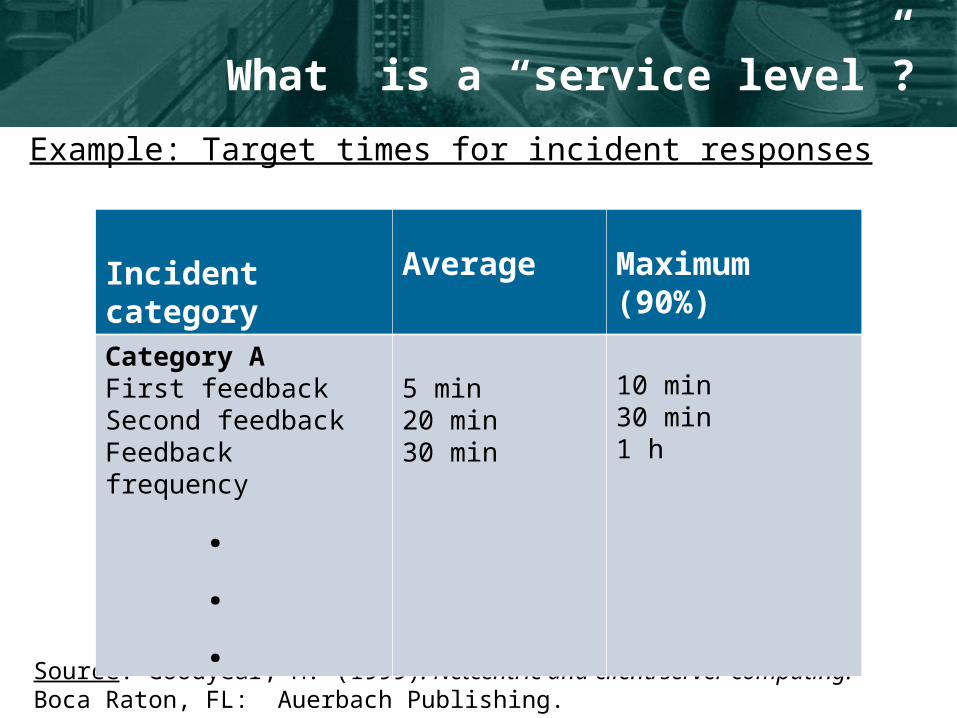
What is a “service level”?
Example: Target times for incident responses
Source: Goodyear, M. (1999). Netcentric and client/server computing. Boca Raton, FL: Auerbach Publishing.
Incident category Average Maximum (90%)
Category AFirst feedbackSecond feedbackFeedback frequency
.
.
.
5 min20 min30 min
10 min30 min1 h
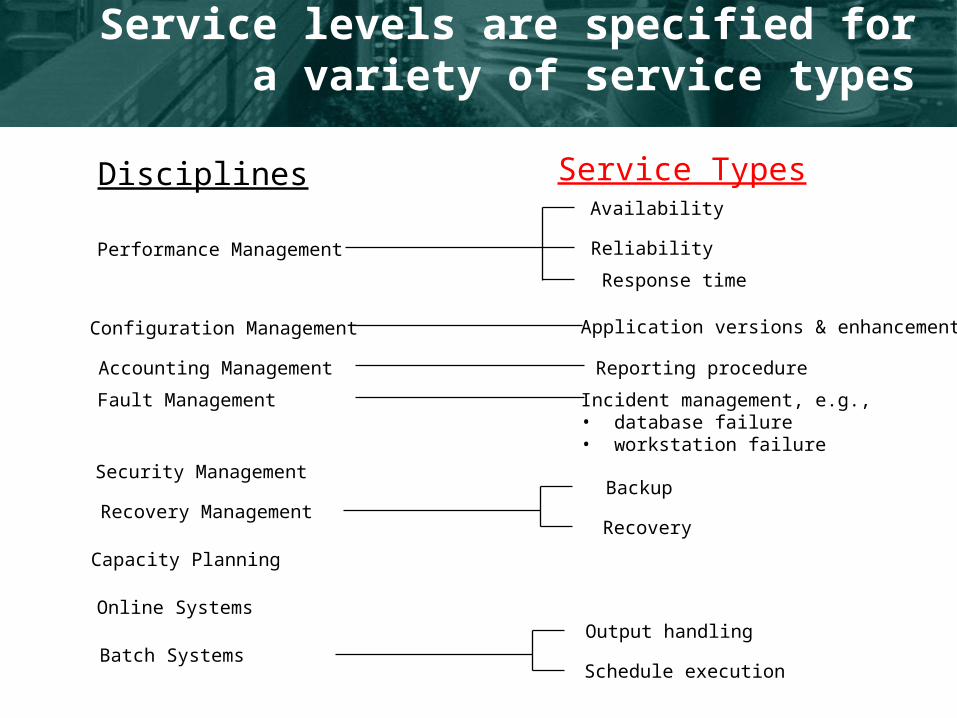
Service levels are specified for a variety of service types
Disciplines
Performance Management
Configuration Management
Availability
Reliability
Response time
Application versions & enhancements
Accounting Management Reporting procedure
Fault Management Incident management, e.g., • database failure• workstation failure
Security Management
Recovery ManagementBackup
Recovery
Capacity Planning
Online Systems
Batch SystemsOutput handling
Schedule execution
Service Types
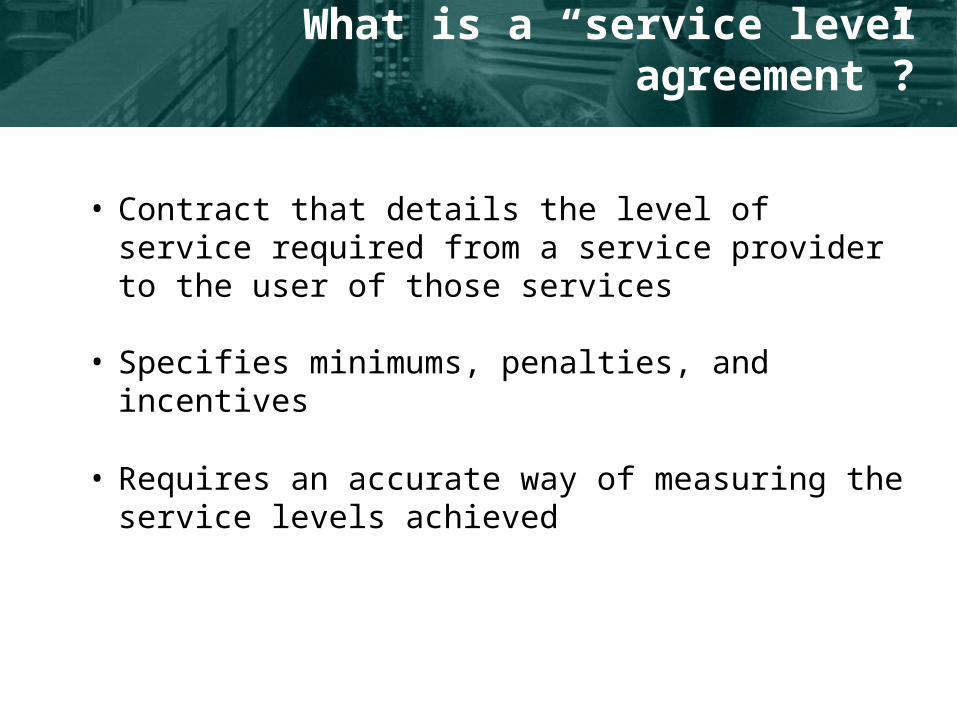
What is a “service level agreement”?
• Contract that details the level of service required from a service provider to the user of those services
• Specifies minimums, penalties, and incentives
• Requires an accurate way of measuring the service levels achieved
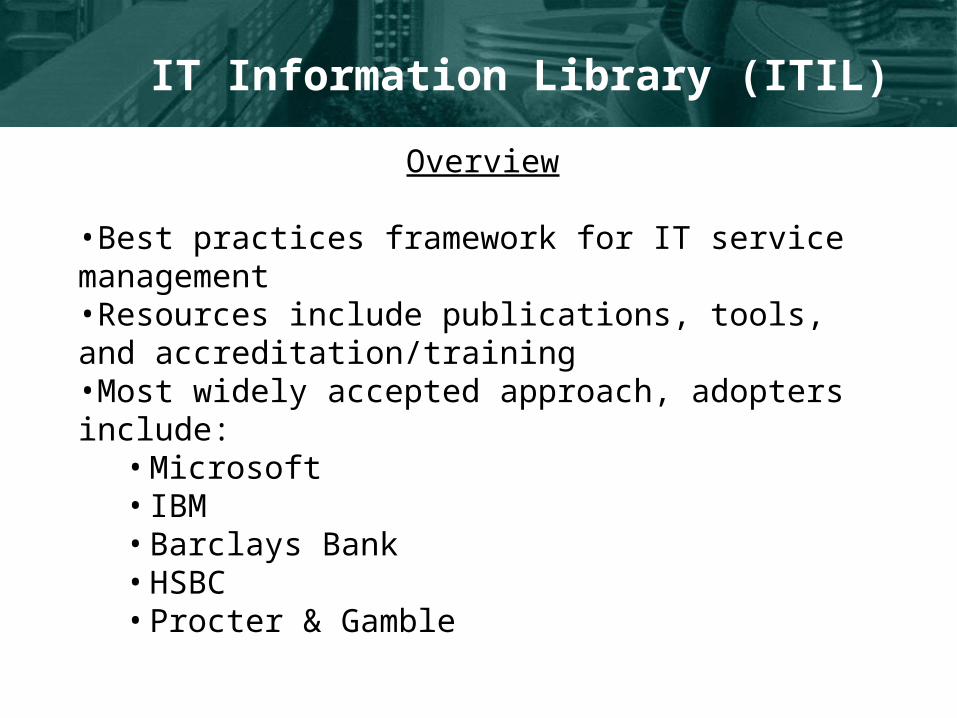
IT Information Library (ITIL)
Overview
•Best practices framework for IT service management•Resources include publications, tools, and accreditation/training •Most widely accepted approach, adopters include:
• Microsoft • IBM • Barclays Bank • HSBC • Procter & Gamble
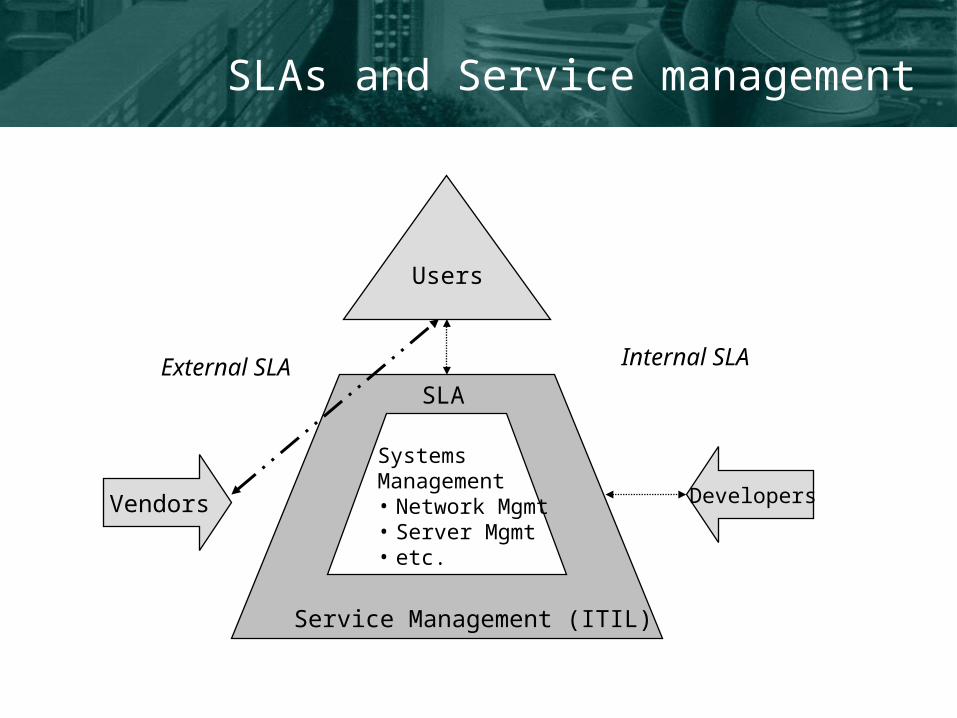
SLAs and Service management
Users
Service Management (ITIL)
SLA
Vendors Developers
SystemsManagement• Network Mgmt• Server Mgmt• etc.
Internal SLAExternal SLA
9
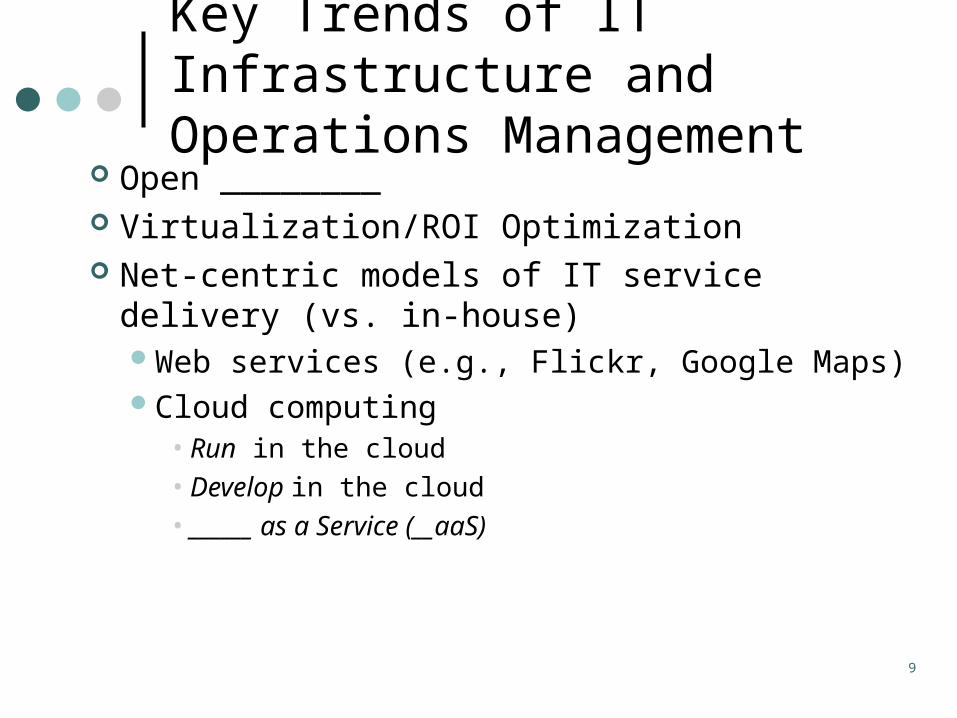
Key Trends of IT Infrastructure and Operations Management
Open ________ Virtualization/ROI Optimization Net-centric models of IT service delivery (vs.
in-house)Web services (e.g., Flickr, Google Maps)Cloud computing
• Run in the cloud• Develop in the cloud• ______ as a Service (__aaS)
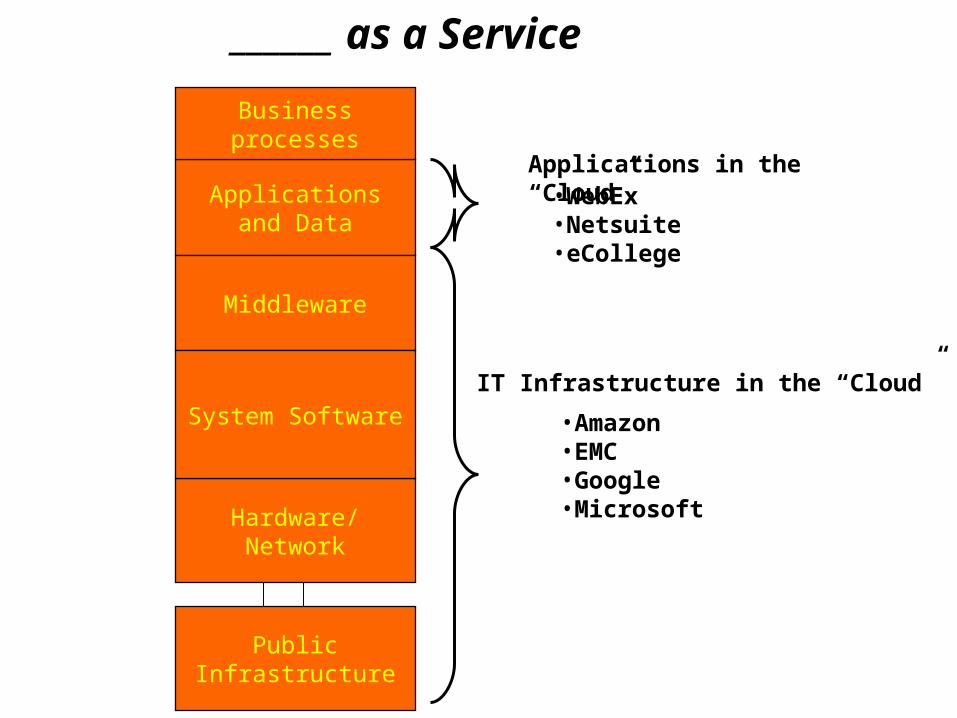
Applications and Data
Middleware
Hardware/Network
System Software
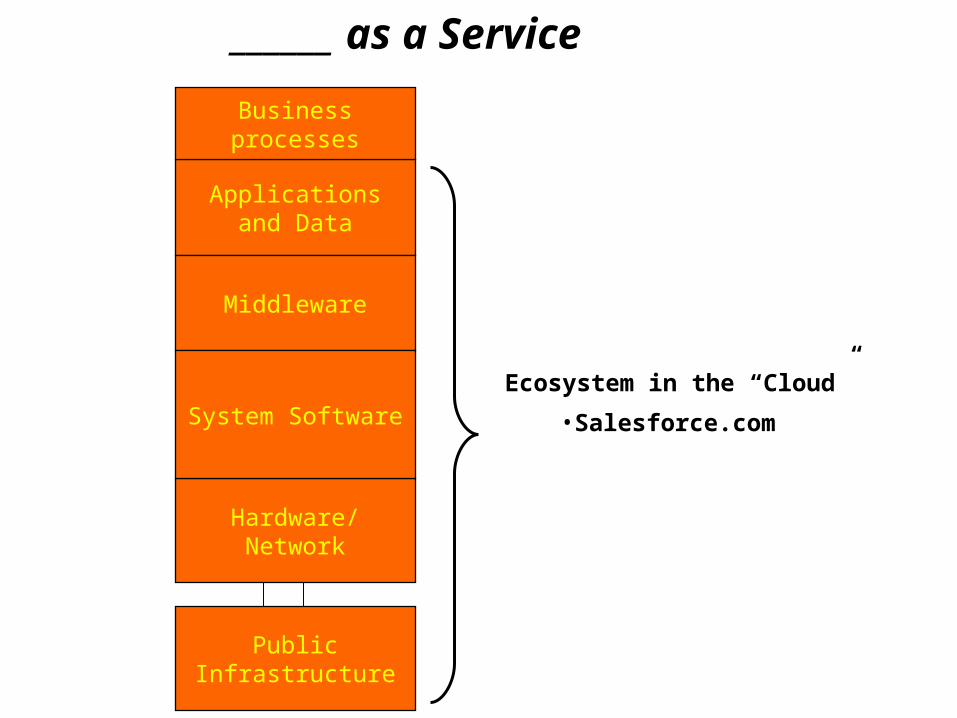
______ as a Service
Public Infrastructure
Business processes
IT Infrastructure in the “Cloud”
• Amazon • EMC• Google• Microsoft
• WebEx• Netsuite• eCollege
Applications in the “Cloud”
Applications and Data
Middleware
Hardware/Network
System Software
______ as a Service
Public Infrastructure
Business processes
Ecosystem in the “Cloud”
• Salesforce.com
12
Project management skills are critical in today’s business environment
“The whole discipline and art of project management is going to be the essence of management training, operational excellence, and value added”
- Tom Peters
13
Discussion
1. What is a project?
2. Compare/Contrast project with process
3. Compare/Contrast project with program
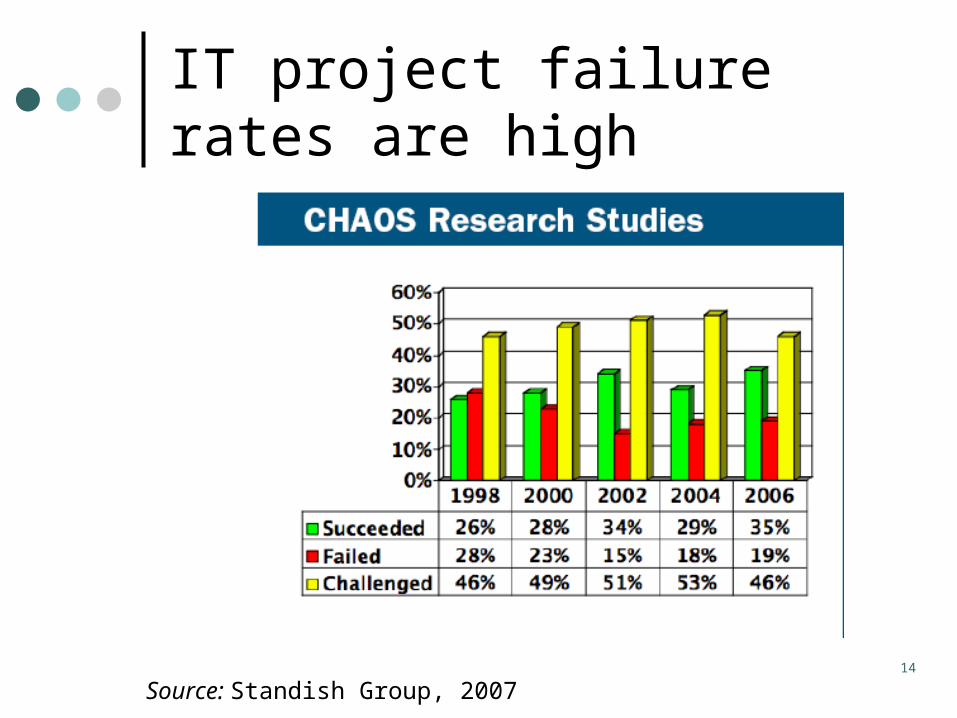
IT project failure rates are high
14
Source: Standish Group, 2007
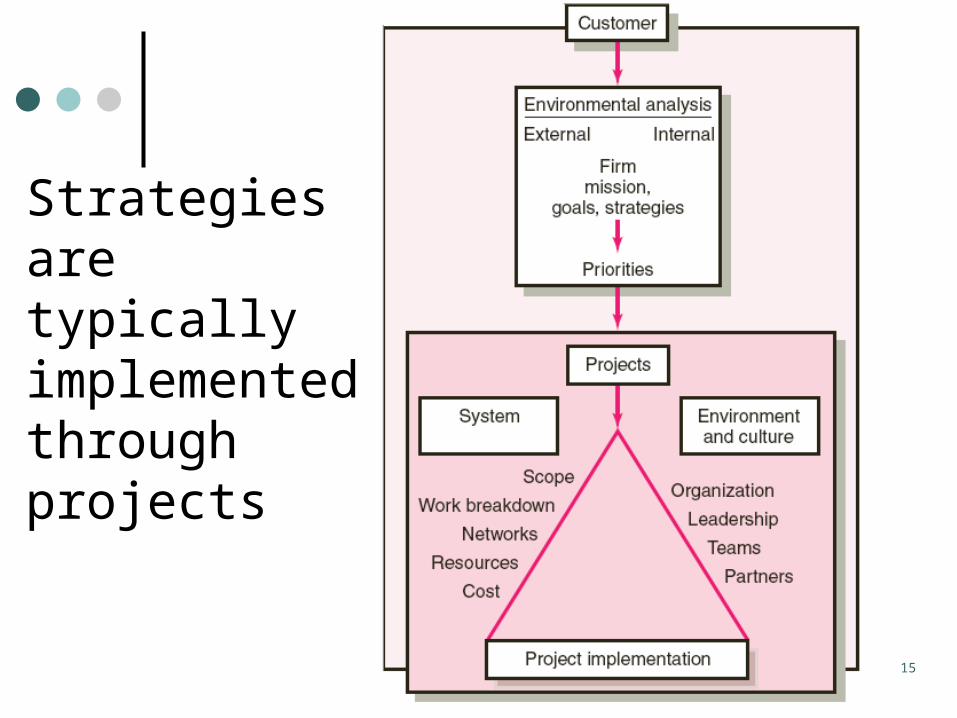
15
Strategies are typically implemented through projects
Project Summit, Nov. 13, 2006
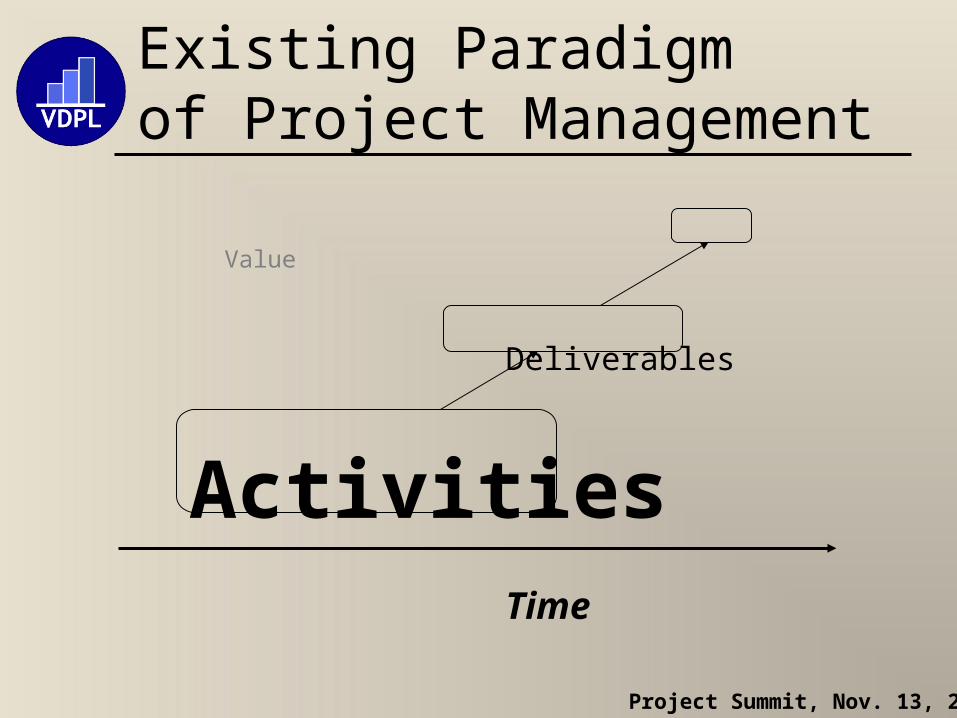
Existing Paradigmof Project Management
Value
Deliverables
ActivitiesTime
17
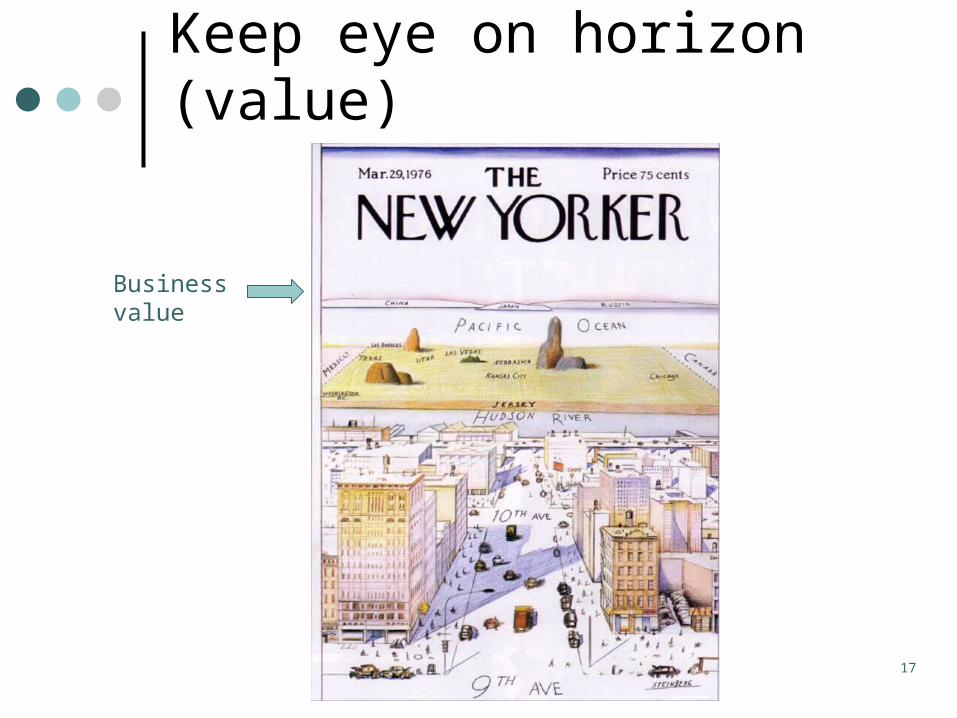
Keep eye on horizon (value)
Businessvalue
18
• High-level executive who endorses and provides political support for the completion of a project
Key to project success:Project sponsor
19
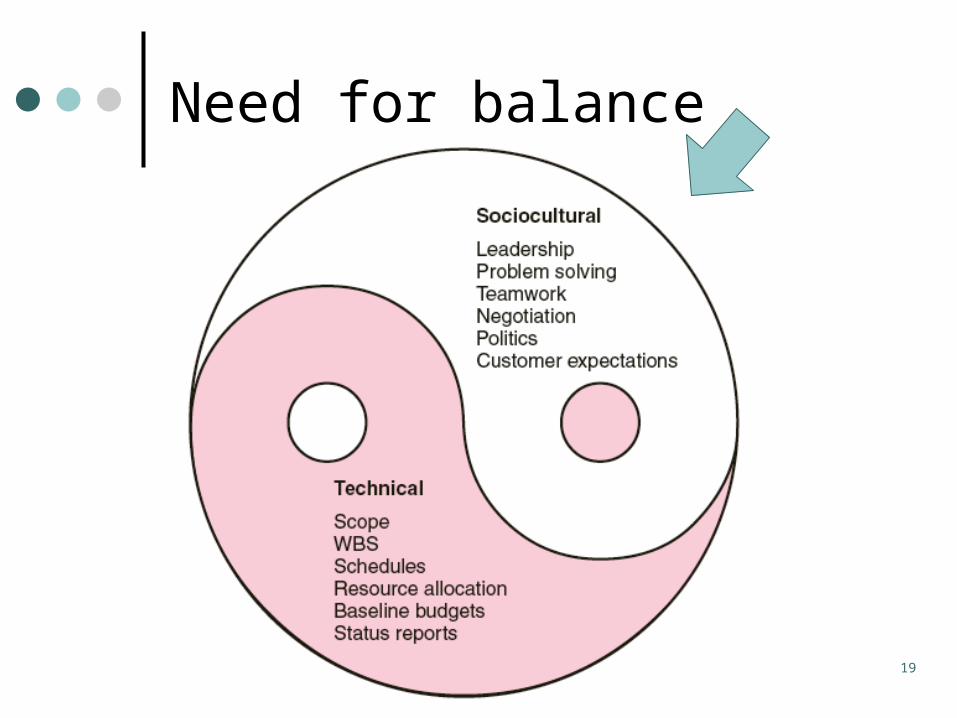
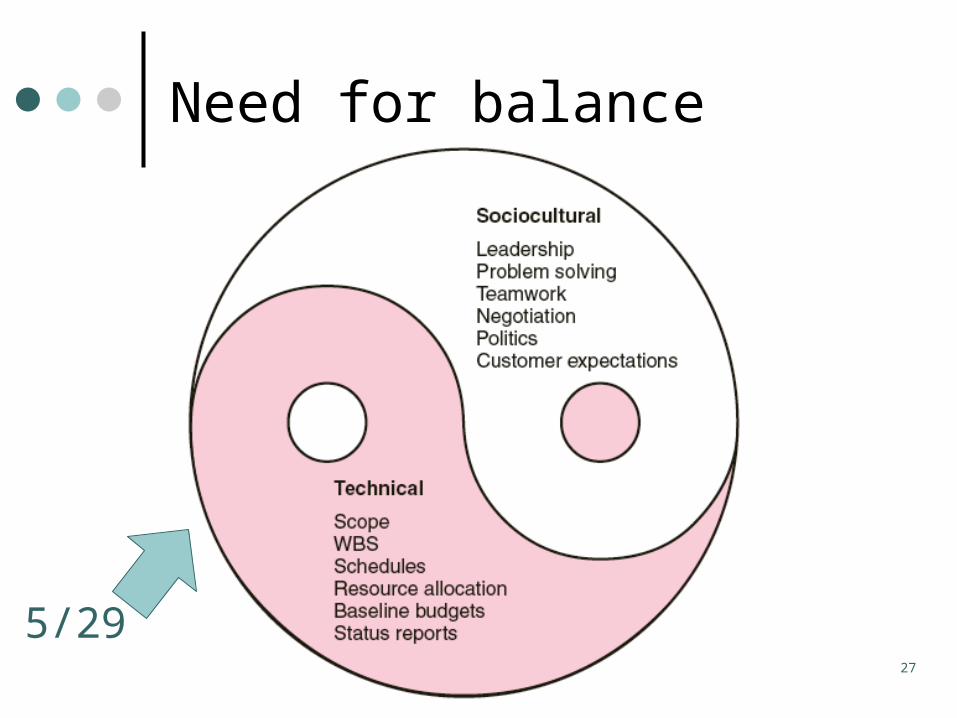
Need for balance
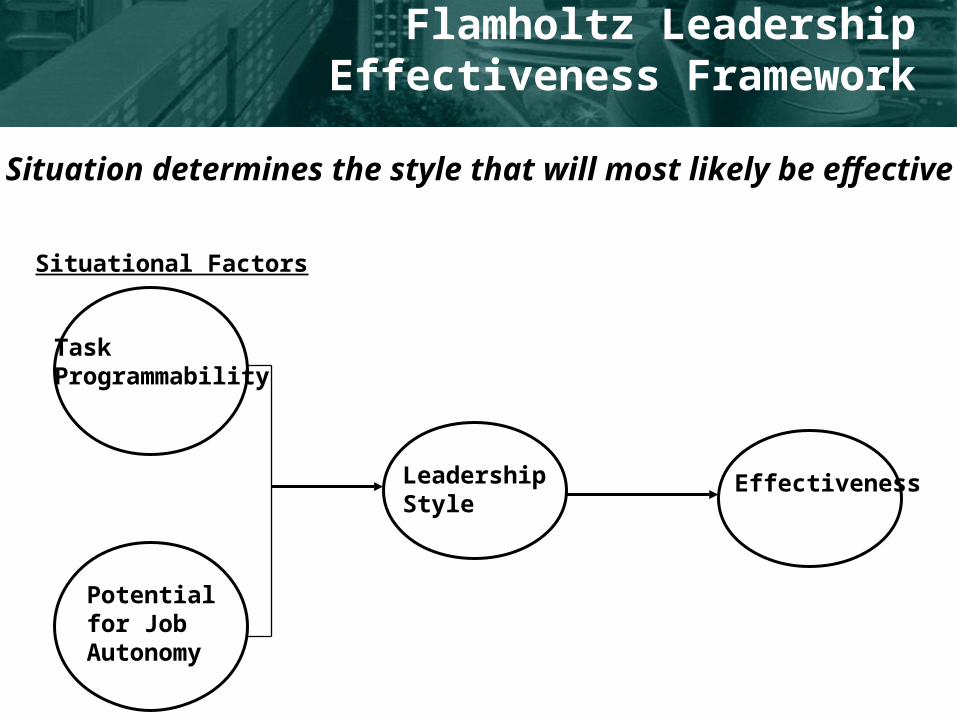
Flamholtz Leadership Effectiveness Framework
EffectivenessLeadershipStyle
TaskProgrammability
Potentialfor JobAutonomy
Situational Factors
Situation determines the style that will most likely be effective
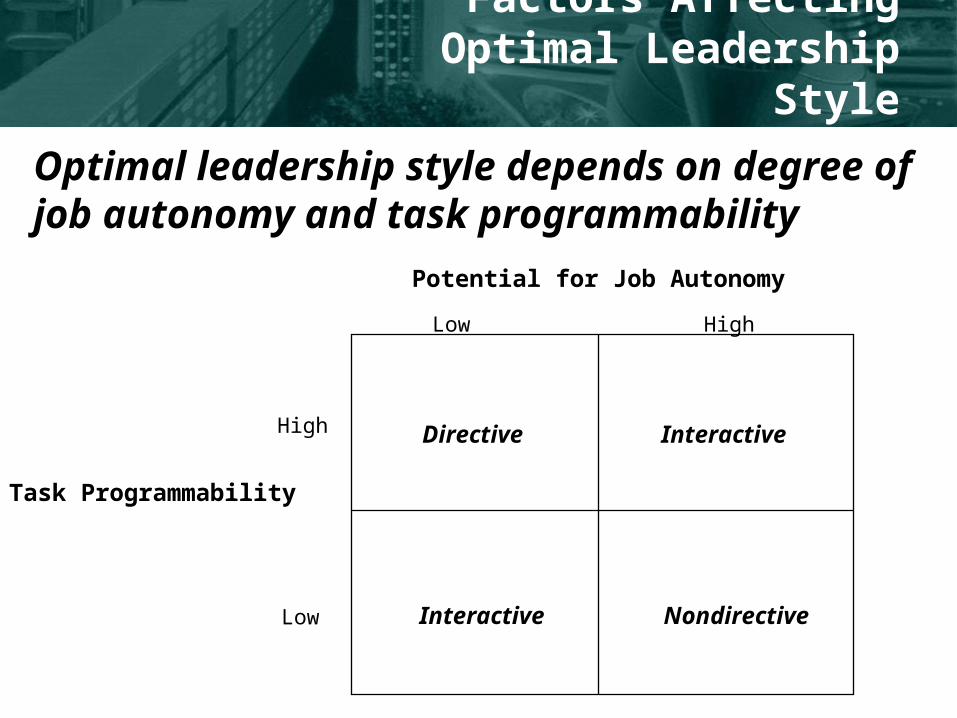
Optimal leadership style depends on degree of job autonomy and task programmability
Factors Affecting Optimal Leadership Style
Potential for Job Autonomy
Low High
Low
High
Task Programmability
Directive
Interactive
Interactive
Nondirective
Project Organization Structure

23
Functional Organization
Marketing Engineering Manufacturing Customer Svc
Function 1
Function 1
Function 1
Function 1
CEO Project coordination
Project
24
Function 1
Marketing Engineering Manufacturing Customer Svc
Function 1
Function 1
Function 1
CEO
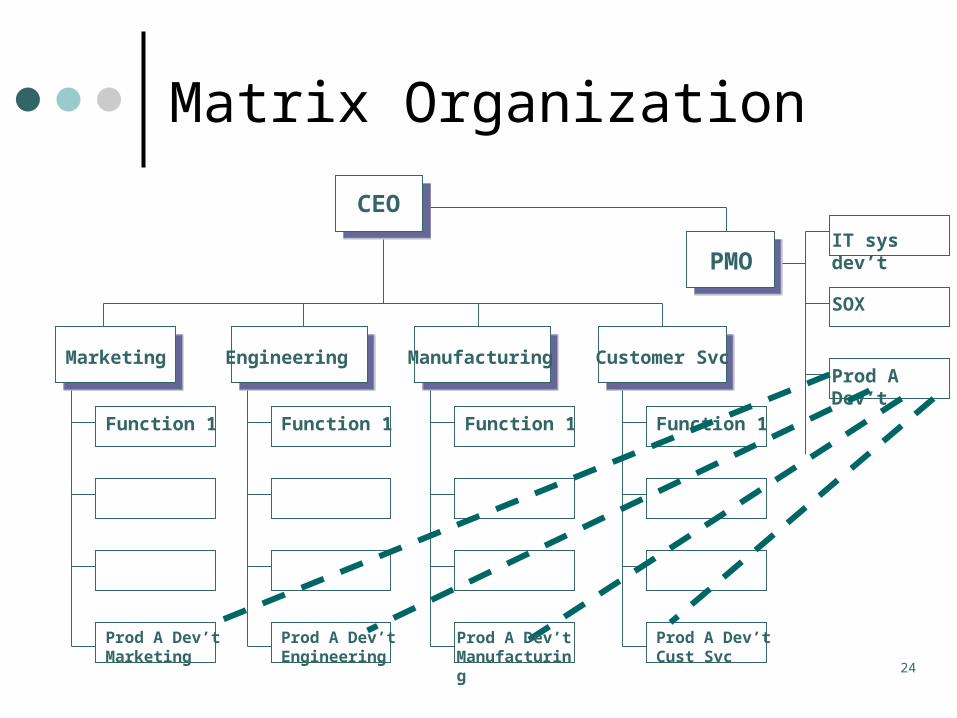
Matrix Organization
PMO
SOX
Prod A Dev’t
IT sys dev’t
Prod A Dev’t Cust Svc
Prod A Dev’t Marketing
Prod A Dev’t Engineering
Prod A Dev’t Manufacturing
25
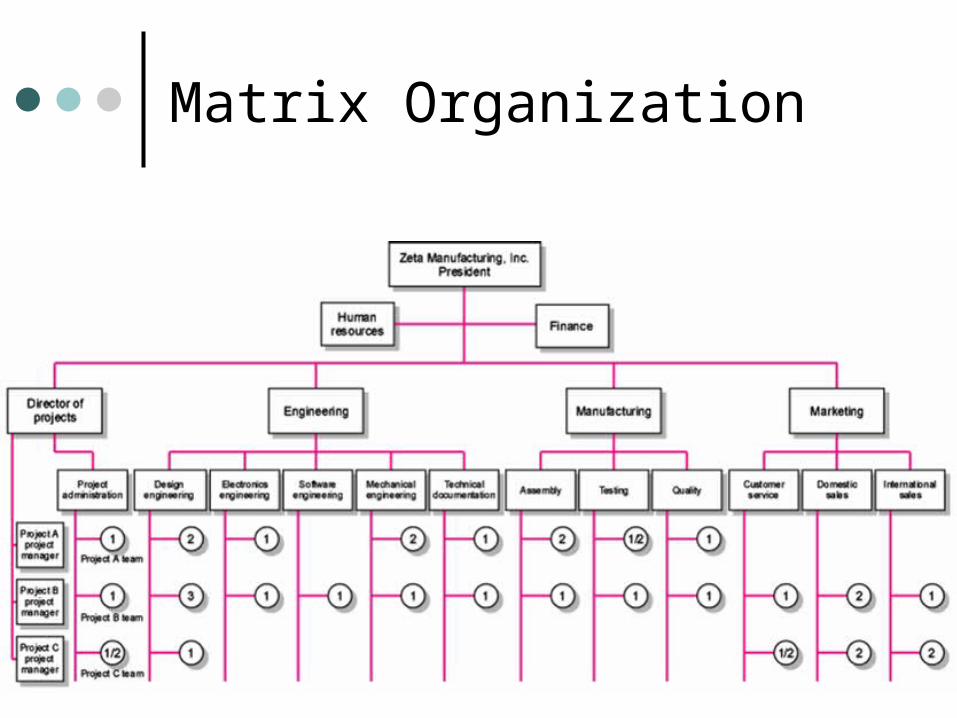
Matrix Organization
26
Matrix Organization
Advantages Disadvantages
27
Need for balance
5/29
28
Topic Duration 5/22 recap 30 minutes
IT project planning 50 minutes
*** Break 15 minutes
Current event reports 30 minutes
IT organization and governance 60 minutes
Today’s Agenda
29
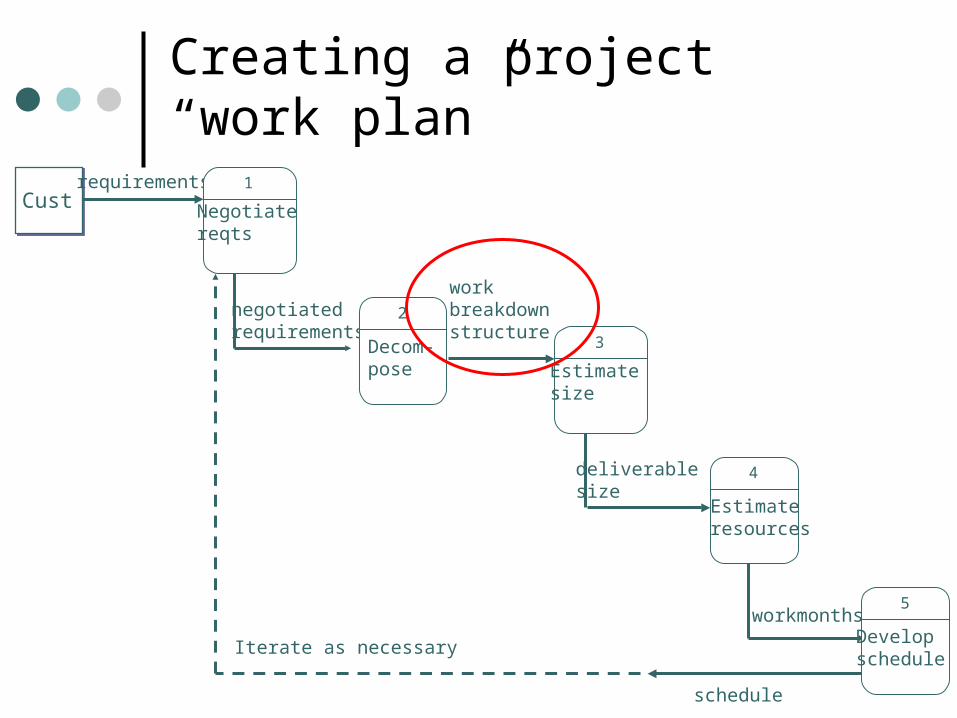
Creating a project “work plan”
Custrequirements 1
Negotiatereqts
negotiatedrequirements
2
Decom-pose
workbreakdownstructure
4
Estimateresources
workmonths
3
Estimatesize
deliverablesize
5
Developschedule
schedule
Iterate as necessary
30
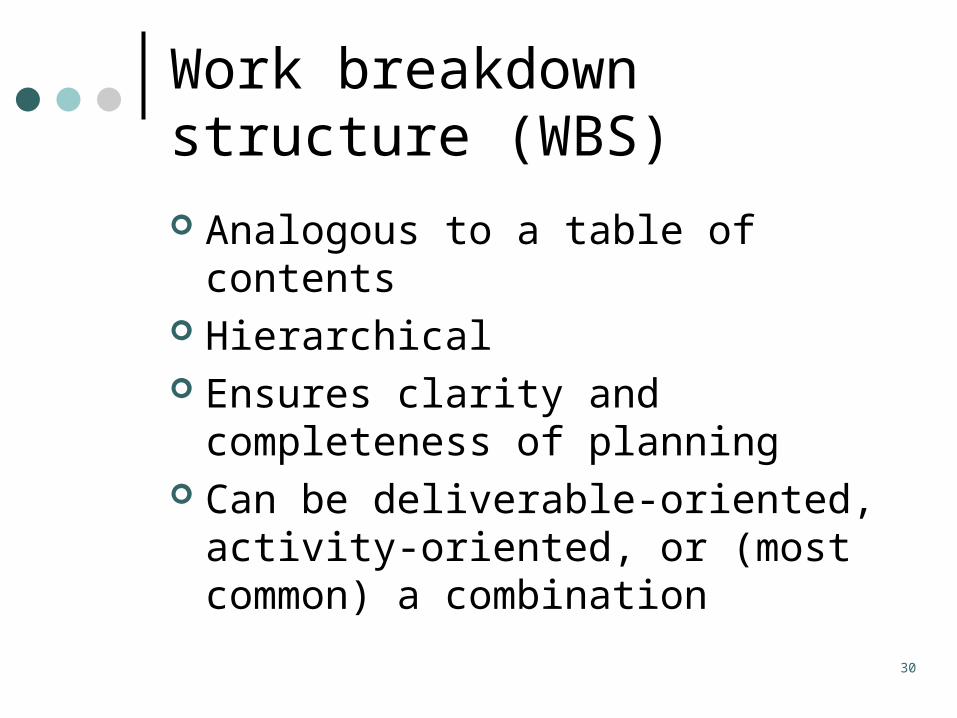
Work breakdown structure (WBS)
Analogous to a table of contents Hierarchical Ensures clarity and completeness of
planning Can be deliverable-oriented, activity-
oriented, or (most common) a combination
31
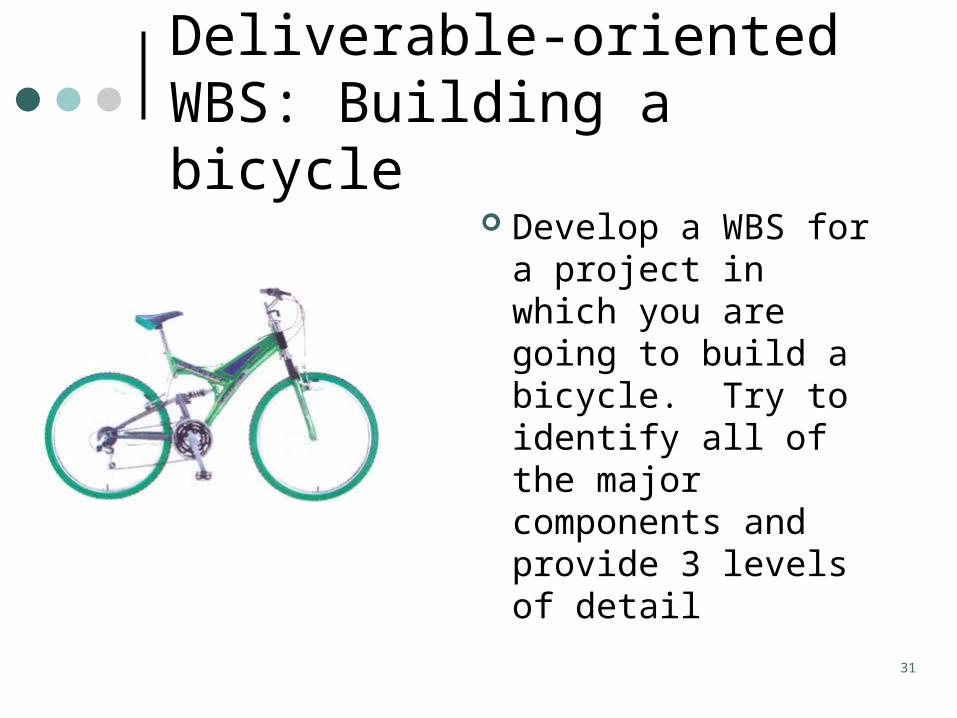
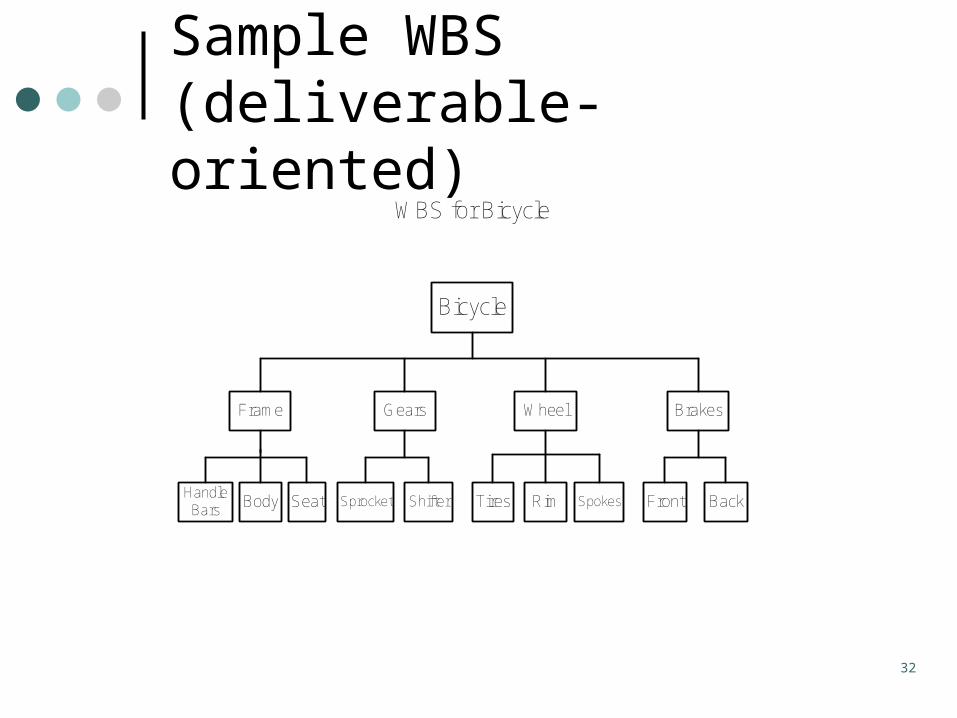
Deliverable-oriented WBS: Building a bicycle
Develop a WBS for a project in which you are going to build a bicycle. Try to identify all of the major components and provide 3 levels of detail
32
Sample WBS (deliverable-oriented)
Bicycle
Frame Gears Wheel Brakes
HandleBars
Body Seat Sprocket Shifter Tires Rim Spokes Front Back
WBS for Bicycle
Copyright Copyright © © 2006 The 2006 The McGraw-Hill Companies. All McGraw-Hill Companies. All rights reserved. rights reserved.
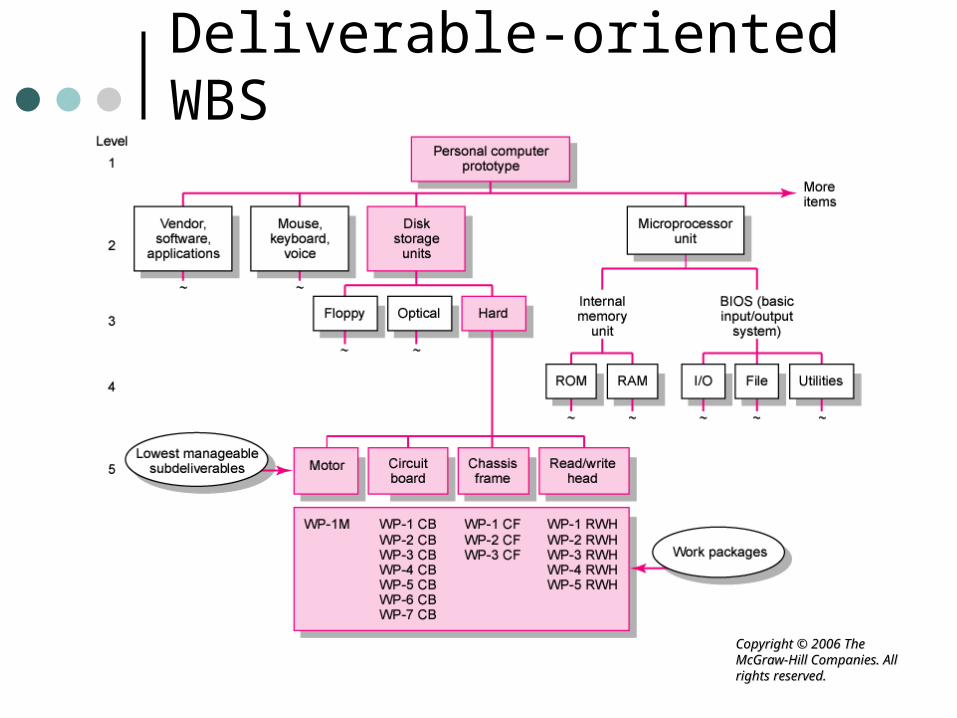
Deliverable-oriented WBS
34
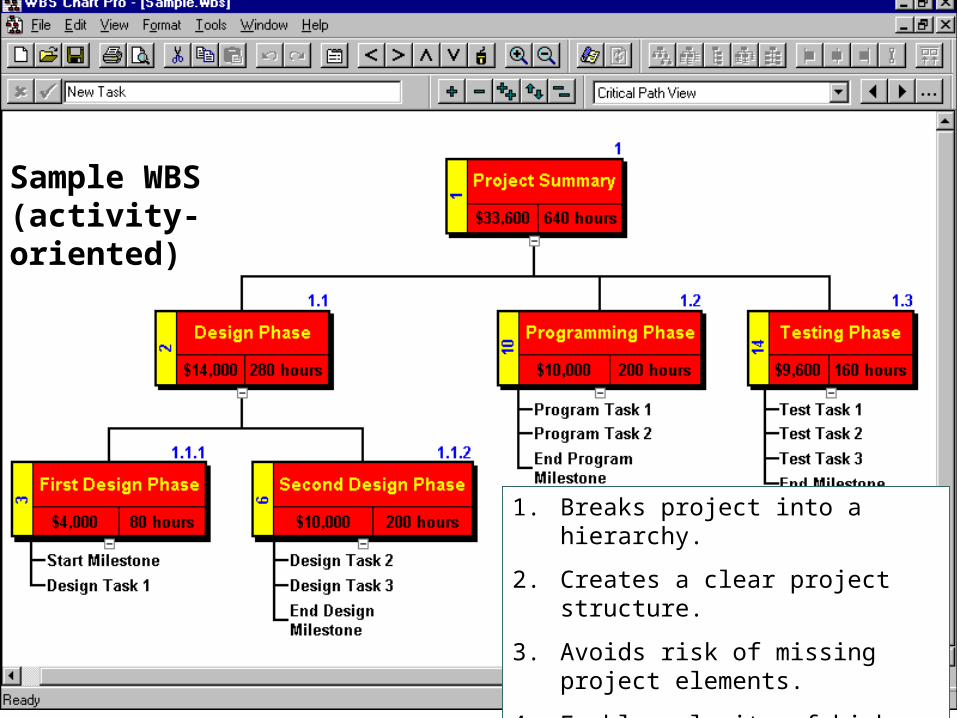
1. Breaks project into a hierarchy.
2. Creates a clear project structure.
3. Avoids risk of missing project elements.
4. Enables clarity of high level planning.
Sample WBS (activity-oriented)
Copyright Copyright © © 2006 The 2006 The McGraw-Hill Companies. All McGraw-Hill Companies. All rights reserved. rights reserved.
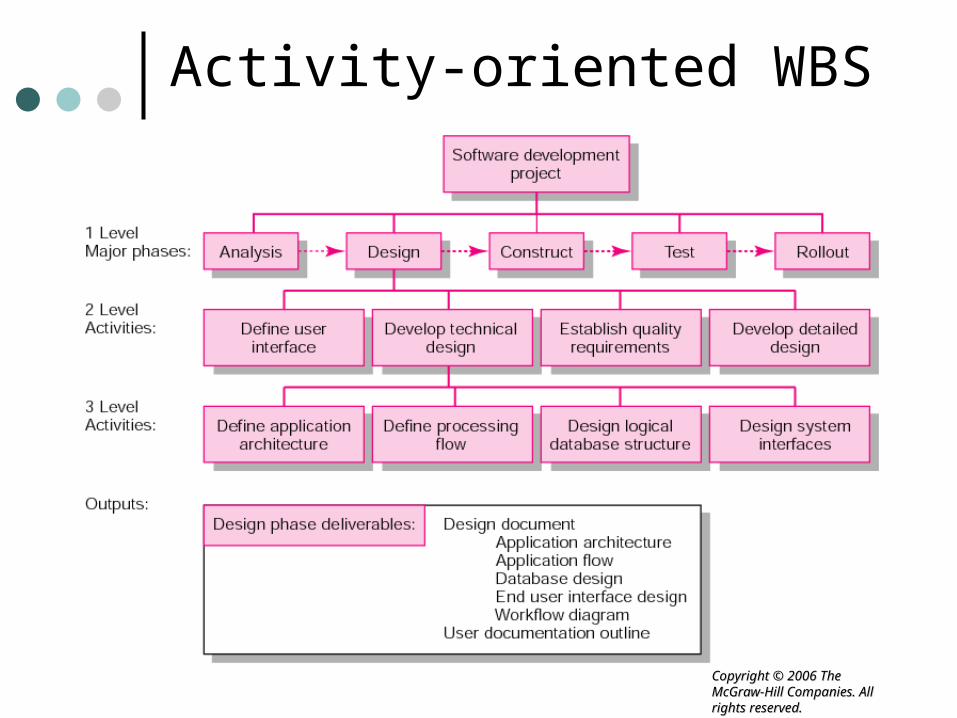
Activity-oriented WBS
36
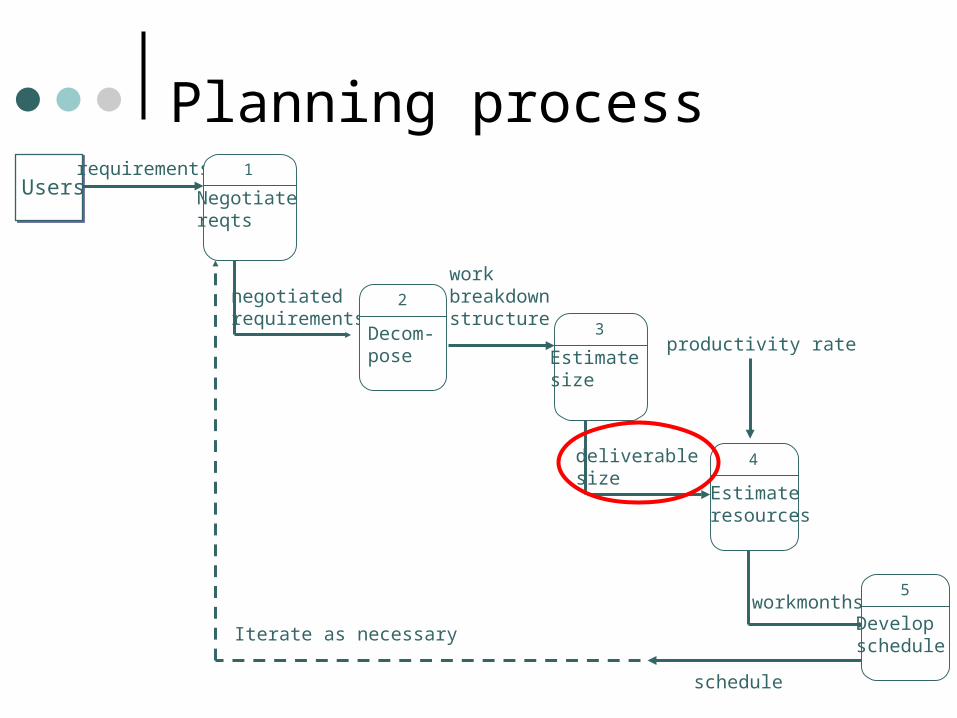
Usersrequirements 1
Negotiatereqts
negotiatedrequirements
2
Decom-pose
workbreakdownstructure
4
Estimateresources
workmonths
3
Estimatesize
deliverablesize
5
Developschedule
schedule
Iterate as necessary
productivity rate
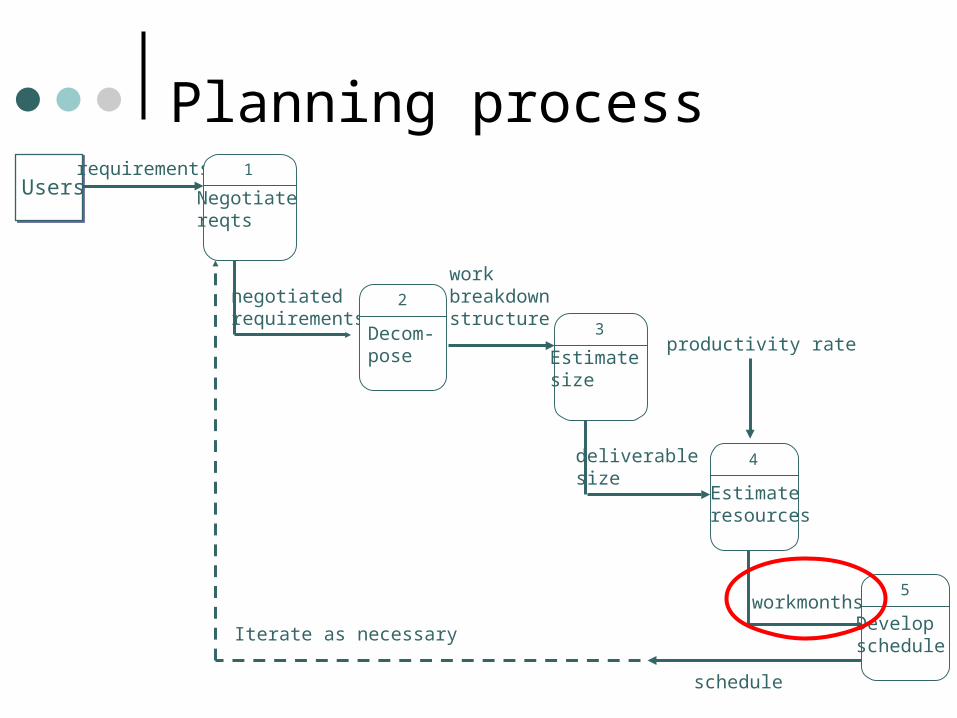
Planning process
37
Units of software size
Lines of code (LOC)
Function points (FP)
Components
38
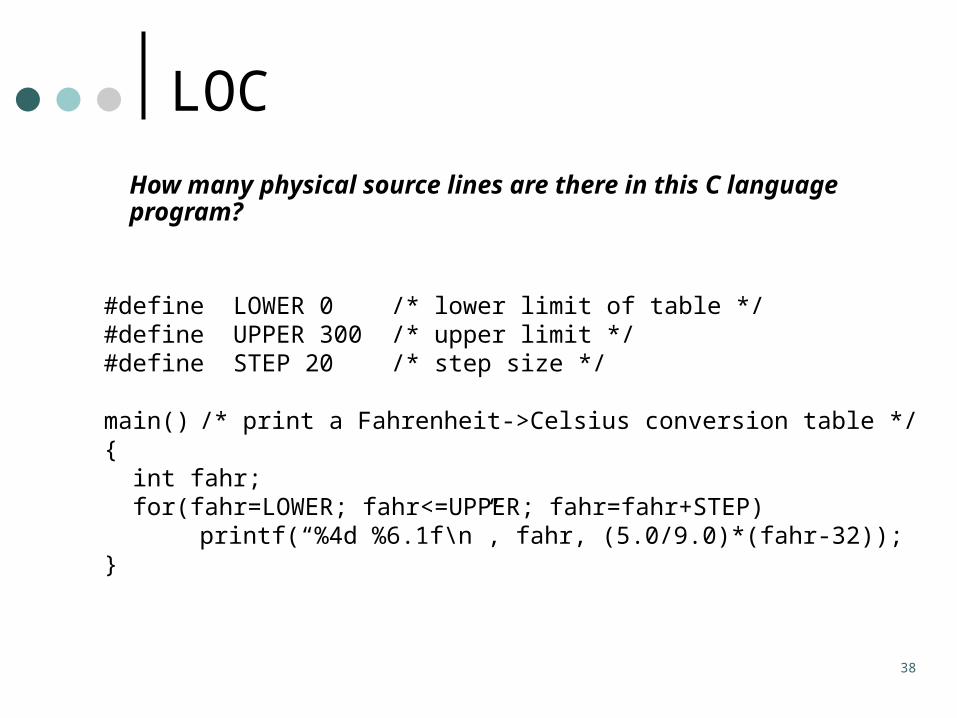
LOC
How many physical source lines are there in this C language program?
#define LOWER 0 /* lower limit of table */#define UPPER 300 /* upper limit */#define STEP 20 /* step size */
main() /* print a Fahrenheit->Celsius conversion table */{ int fahr; for(fahr=LOWER; fahr<=UPPER; fahr=fahr+STEP)
printf(“%4d %6.1f\n”, fahr, (5.0/9.0)*(fahr-32));}
39
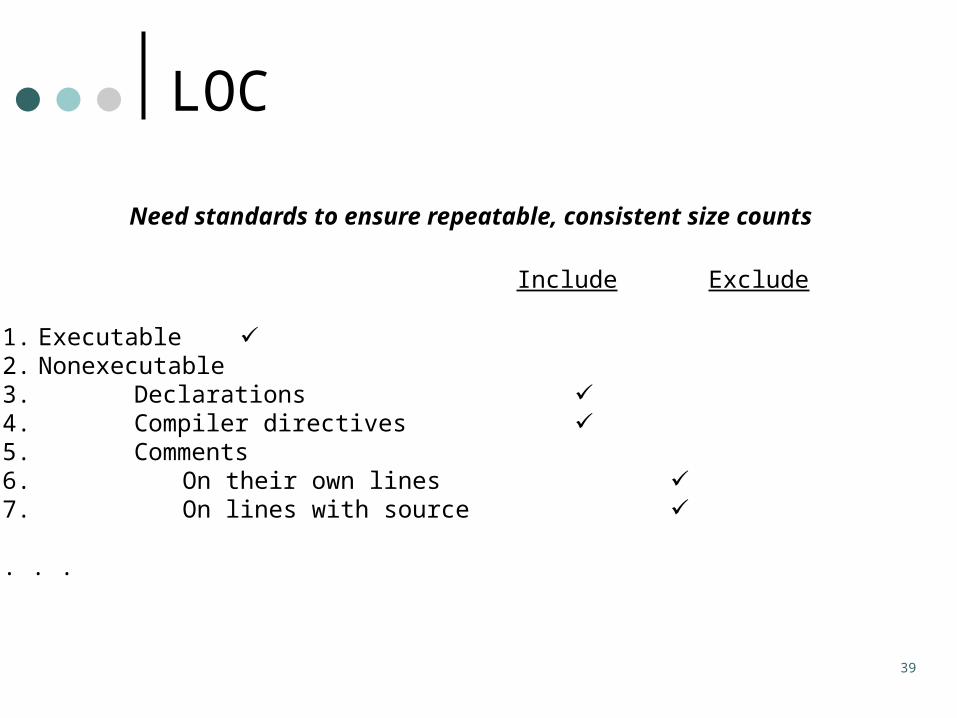
LOC
Need standards to ensure repeatable, consistent size counts
Include Exclude
1. Executable 2. Nonexecutable3. Declarations 4. Compiler directives 5. Comments6. On their own lines 7. On lines with source
. . .

40
Estimation of LOCCAD program to represent mechanical parts
Estimated LOC = (Optimistic + 4(Likely)+ Pessimistic)/6
Major Software Functions
Opt-imistic
Most Likely
Pess-imistic
Estimated LOC
User interface and control facilities UICF 1,500 2,300 3,100 2,300
Two-dimensional geometric analysis 2DGA 3,800 5,200 7,200 5,300
Three-dimensional geometric analysis 3DGA 4,600 6,900 8,600 6,800
Database management DBM 1,600 3,500 4,500 3,350
Computer graphics display features CGDF 3,700 5,000 6,000 4,950
Peripheral control PC 1,400 2,200 2,400 2,100
Design analysis modules DAM 7,200 8,300 10,000 8,400
Estimated lines of code 23,800 33,400 41,800 33,200
41
LOC
“Lines of code is a useless measurement in the face of code that shrinks when we learn better ways of programming” (Kent Beck)
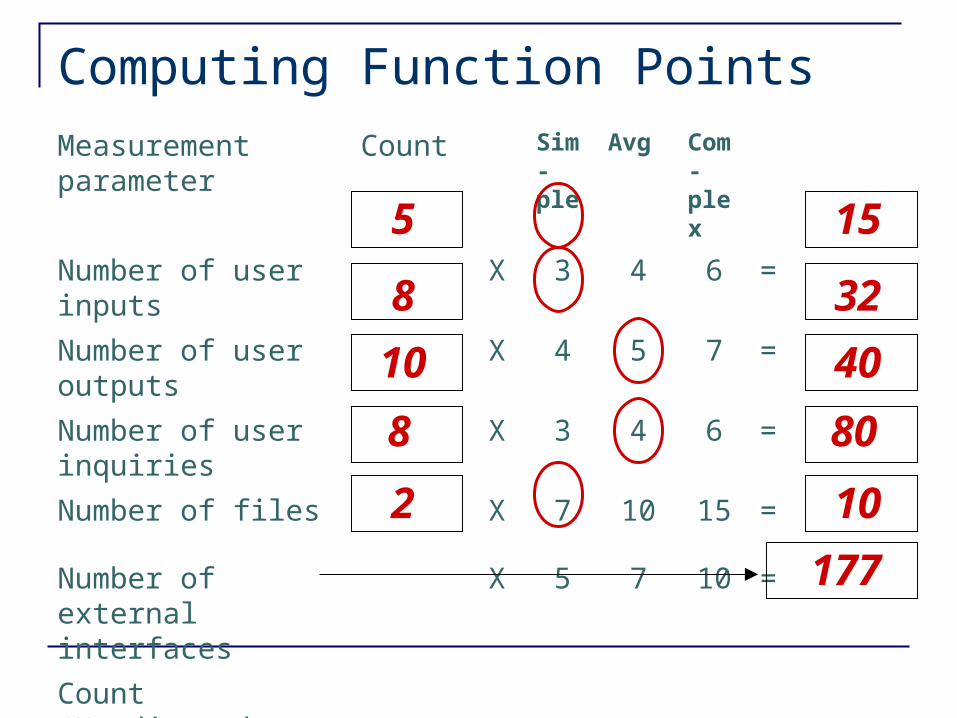
Computing Function PointsMeasurement parameter Count Sim-
pleAvg Com
-plex
Number of user inputs X 3 4 6 =
Number of user outputs X 4 5 7 =
Number of user inquiries
X 3 4 6 =
Number of files X 7 10 15 =
Number of external interfaces
X 5 7 10 =
Count (Unadjusted Function Points) UFP
5
8
10
8
2
15
32
40
80
10
177
43
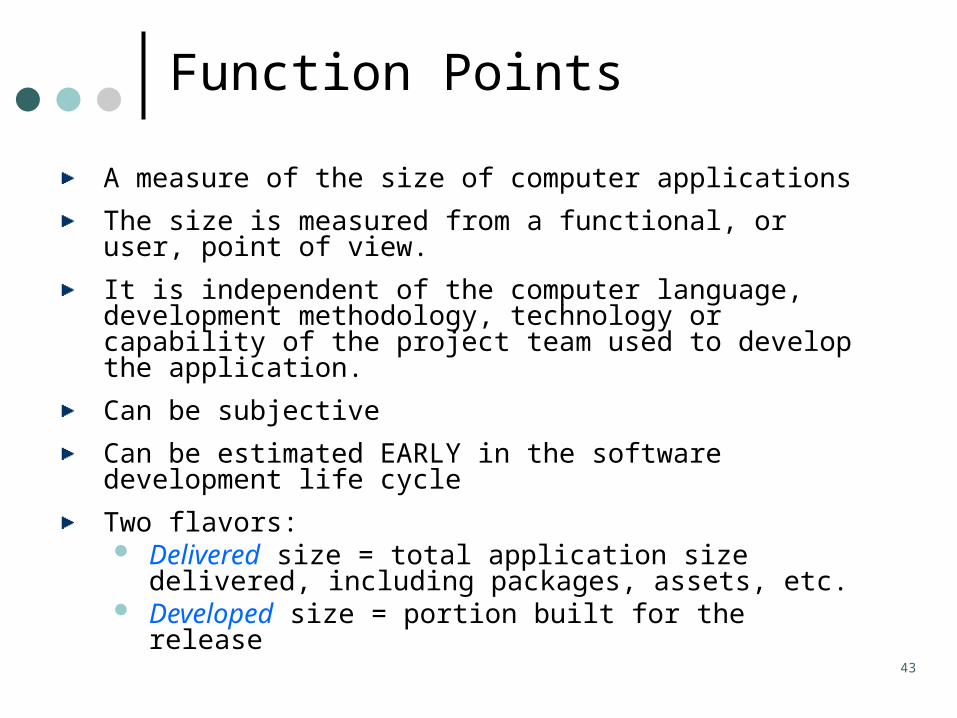
Function Points
A measure of the size of computer applications
The size is measured from a functional, or user, point of view.
It is independent of the computer language, development methodology, technology or capability of the project team used to develop the application.
Can be subjective
Can be estimated EARLY in the software development life cycle
Two flavors: Delivered size = total application size delivered,
including packages, assets, etc. Developed size = portion built for the release
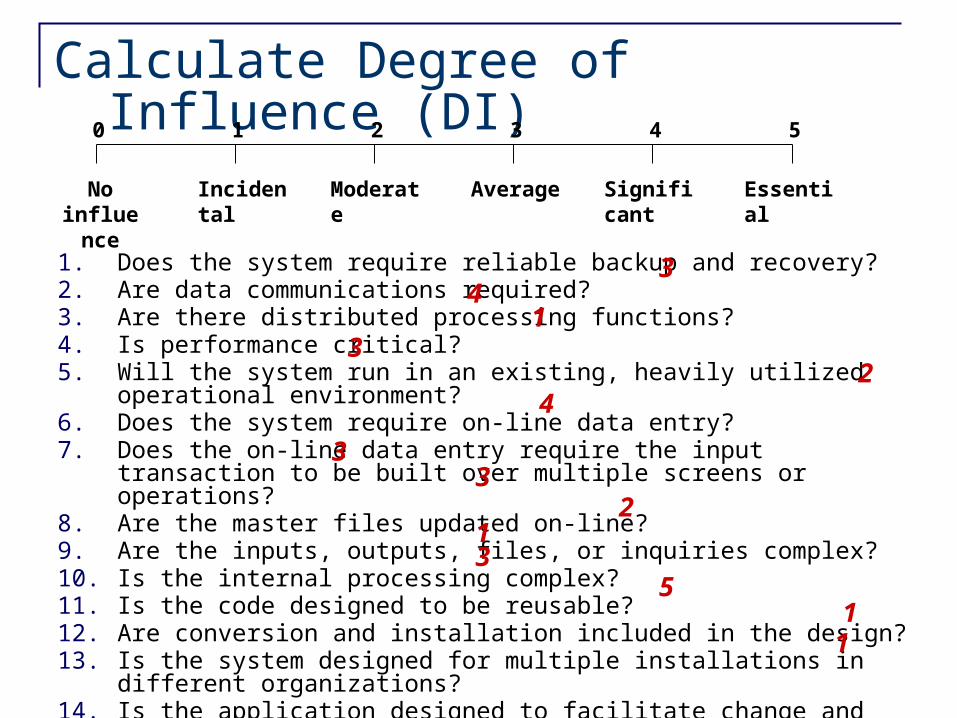
Calculate Degree of Influence (DI)0 1 2 3 4 5
No influence
Incidental Moderate Average Significant Essential
1. Does the system require reliable backup and recovery?2. Are data communications required?3. Are there distributed processing functions?4. Is performance critical?5. Will the system run in an existing, heavily utilized operational environment?6. Does the system require on-line data entry?7. Does the on-line data entry require the input transaction to be built over multiple
screens or operations?8. Are the master files updated on-line?9. Are the inputs, outputs, files, or inquiries complex?10. Is the internal processing complex?11. Is the code designed to be reusable?12. Are conversion and installation included in the design?13. Is the system designed for multiple installations in different organizations?14. Is the application designed to facilitate change and ease of use by the user?
3
3
33
1
4
4
35
1
2
1
2
1
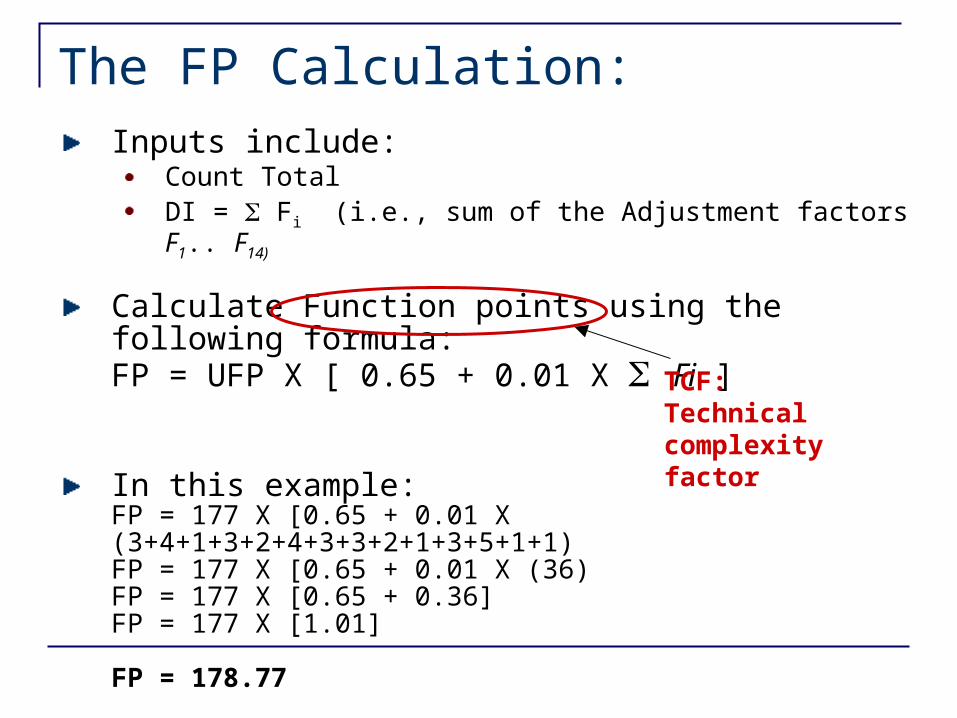
The FP Calculation:Inputs include:
Count TotalDI = Fi (i.e., sum of the Adjustment factors F1.. F14)
Calculate Function points using the following formula:FP = UFP X [ 0.65 + 0.01 X Fi ]
In this example:FP = 177 X [0.65 + 0.01 X (3+4+1+3+2+4+3+3+2+1+3+5+1+1)FP = 177 X [0.65 + 0.01 X (36)FP = 177 X [0.65 + 0.36]FP = 177 X [1.01]
FP = 178.77
TCF: Technical complexity factor
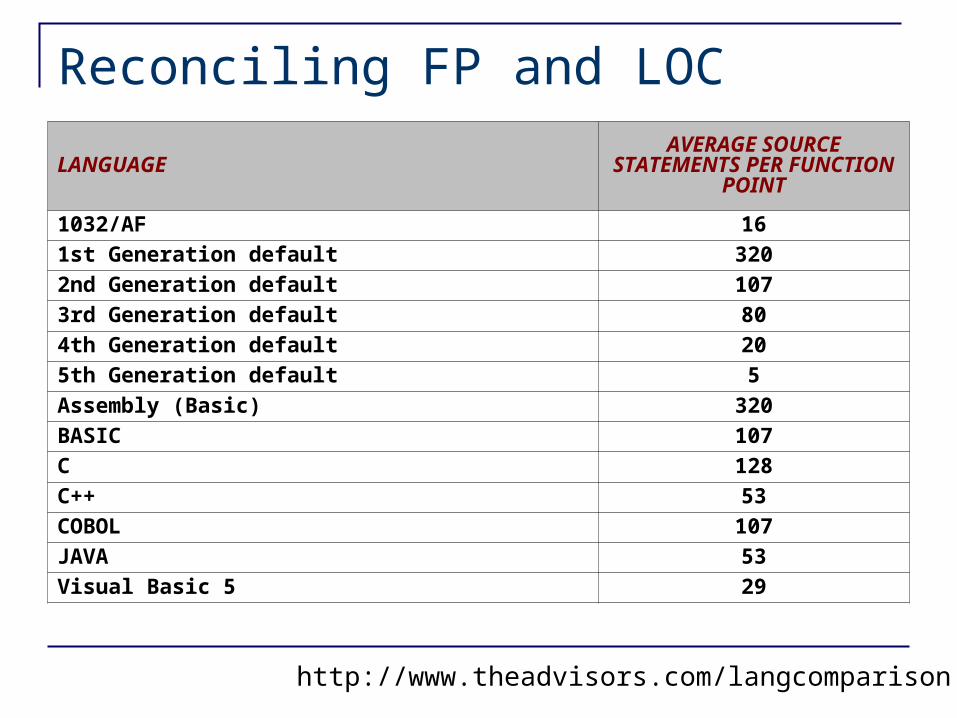
Reconciling FP and LOC
http://www.theadvisors.com/langcomparison.htm
LANGUAGEAVERAGE SOURCE STATEMENTS PER FUNCTION POINT
1032/AF 16
1st Generation default 320
2nd Generation default 107
3rd Generation default 80
4th Generation default 20
5th Generation default 5
Assembly (Basic) 320
BASIC 107
C 128
C++ 53
COBOL 107
JAVA 53
Visual Basic 5 29
47
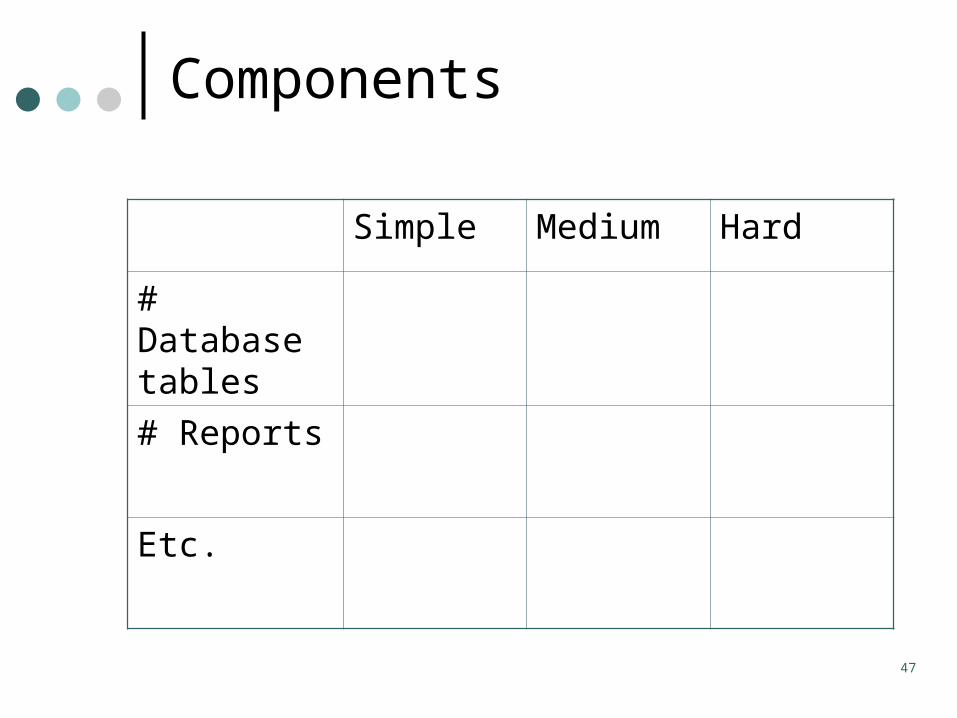
Components
Simple Medium Hard
# Database tables
# Reports
Etc.
48
Usersrequirements 1
Negotiatereqts
negotiatedrequirements
2
Decom-pose
workbreakdownstructure
4
Estimateresources
workmonths
3
Estimatesize
deliverablesize
5
Developschedule
schedule
Iterate as necessary
productivity rate
Planning process
49
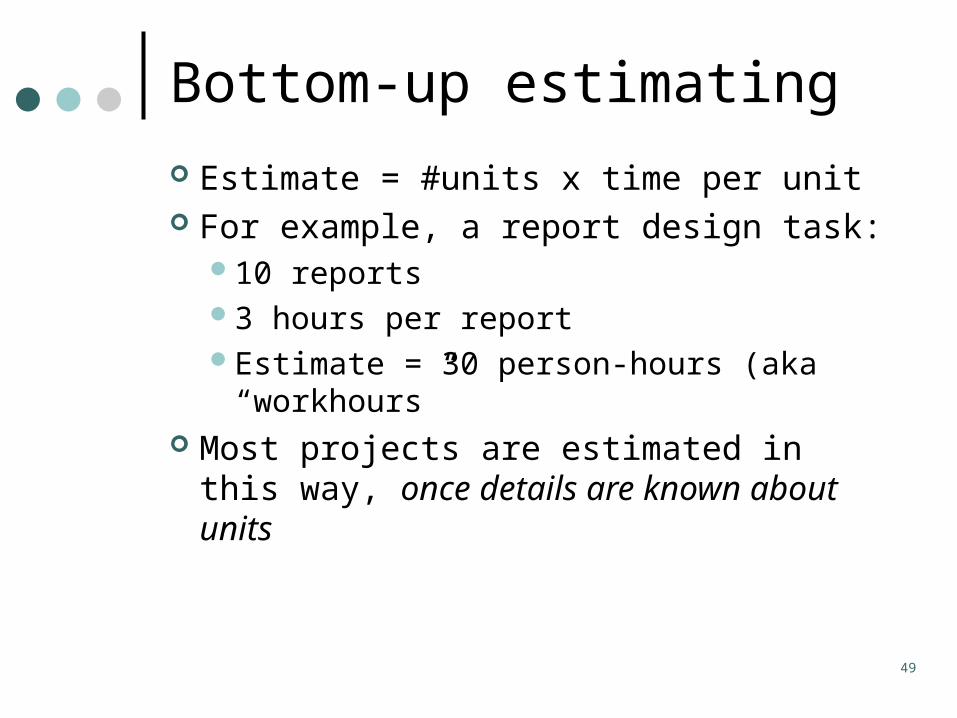
Bottom-up estimating
Estimate = #units x time per unit For example, a report design task:
10 reports3 hours per reportEstimate = 30 person-hours (aka
“workhours” Most projects are estimated in this way,
once details are known about units
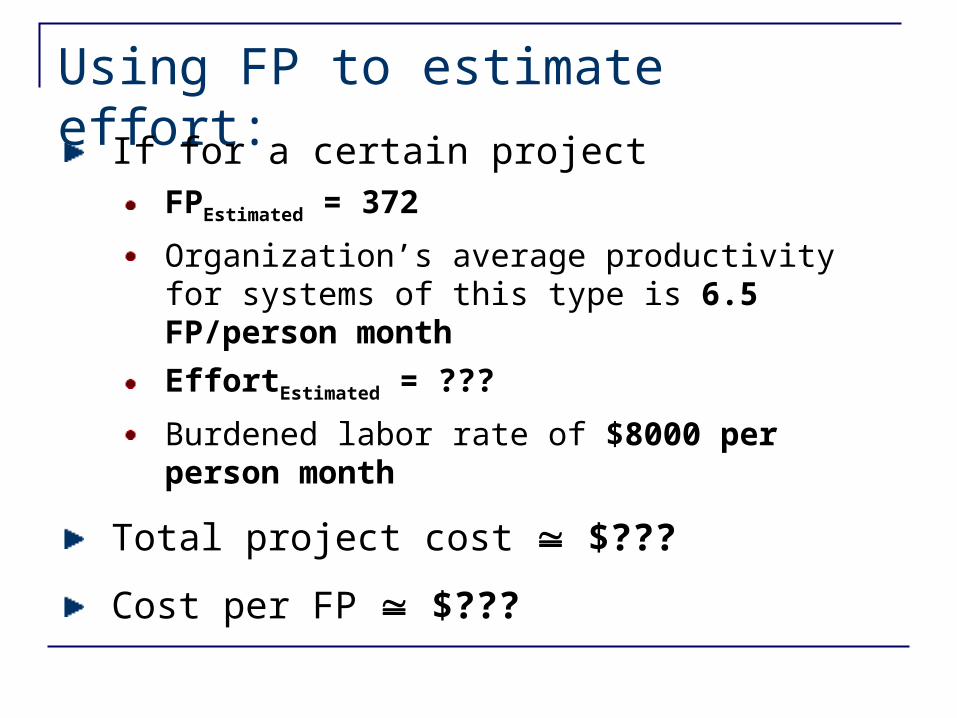
Using FP to estimate effort:
If for a certain projectFPEstimated = 372
Organization’s average productivity for systems of this type is 6.5 FP/person month
EffortEstimated = ???
Burdened labor rate of $8000 per person month
Total project cost $???
Cost per FP $???
51
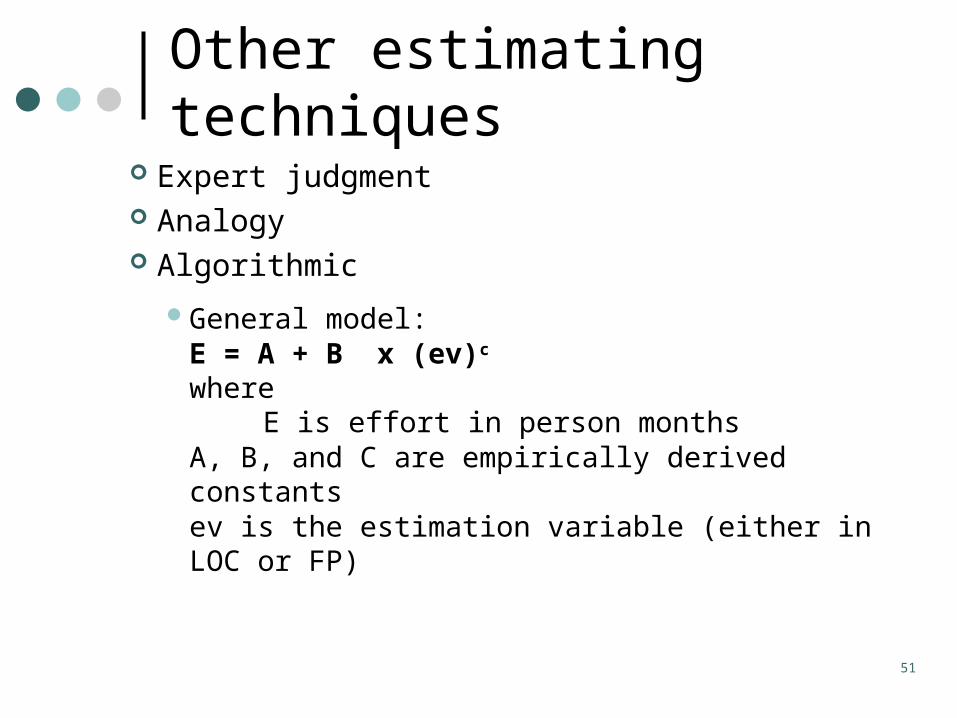
Other estimating techniques
Expert judgment Analogy Algorithmic
General model:E = A + B x (ev)c where E is effort in person months
A, B, and C are empirically derived constantsev is the estimation variable (either in LOC
or FP)
52
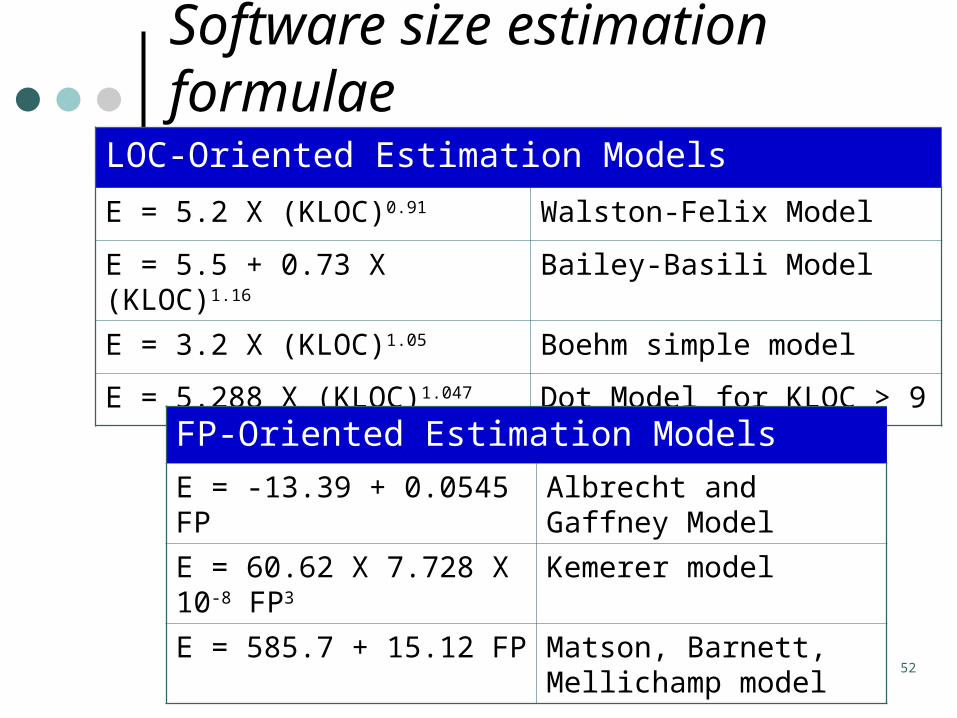
LOC-Oriented Estimation Models
E = 5.2 X (KLOC)0.91 Walston-Felix Model
E = 5.5 + 0.73 X (KLOC)1.16 Bailey-Basili Model
E = 3.2 X (KLOC)1.05 Boehm simple model
E = 5.288 X (KLOC)1.047 Dot Model for KLOC > 9
FP-Oriented Estimation Models
E = -13.39 + 0.0545 FP Albrecht and Gaffney Model
E = 60.62 X 7.728 X 10-8 FP3
Kemerer model
E = 585.7 + 15.12 FP Matson, Barnett, Mellichamp model
Software size estimation formulae
53
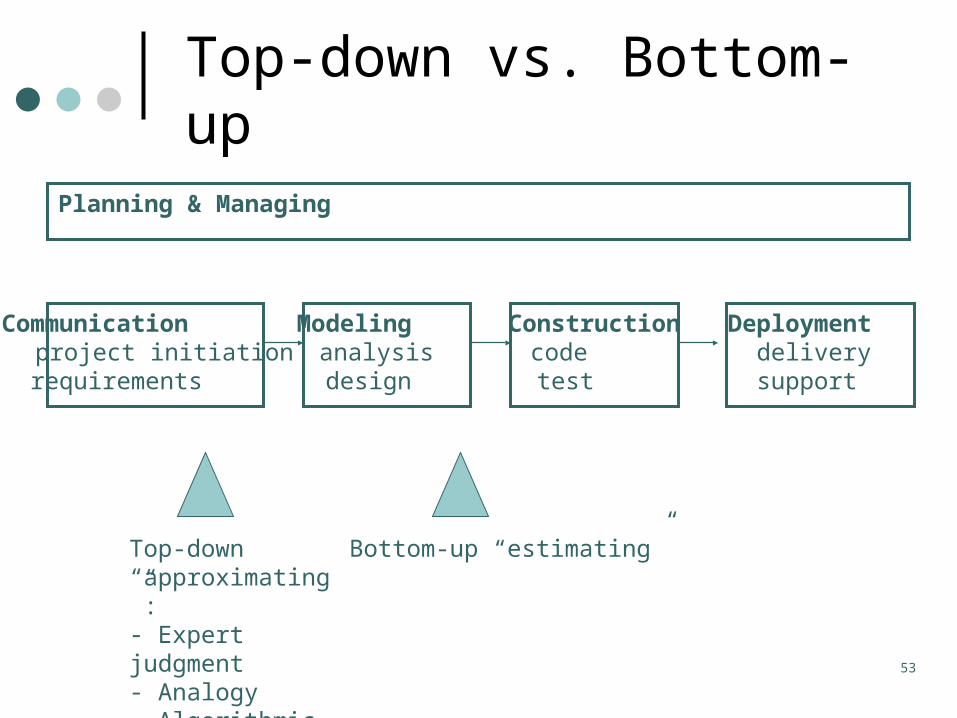
Top-down vs. Bottom-up
Communication project initiation requirements
Modeling analysis design
Construction code test
Deployment delivery support
Planning & Managing
Top-down “approximating”:- Expert judgment- Analogy- Algorithmic
Bottom-up “estimating”
54
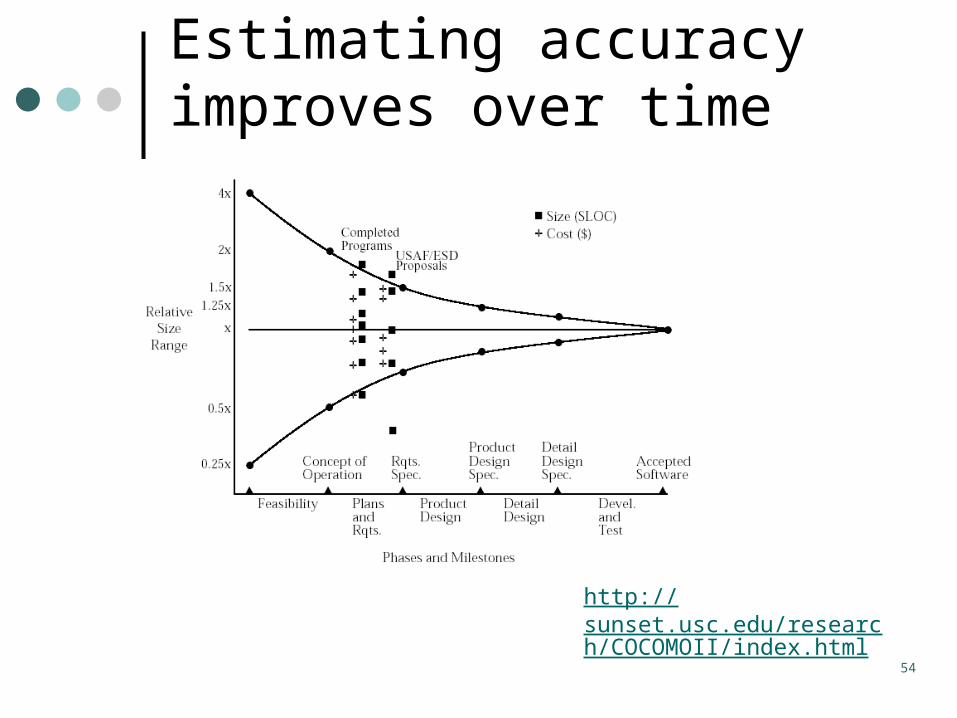
Estimating accuracy improves over time
http://sunset.usc.edu/research/COCOMOII/index.html
55
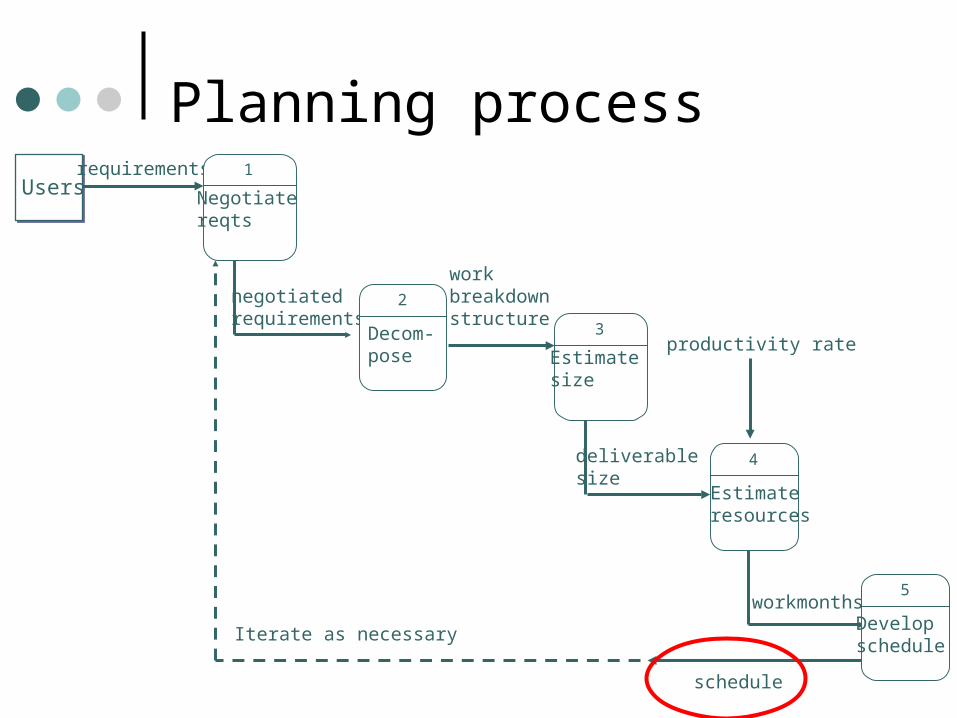
Usersrequirements 1
Negotiatereqts
negotiatedrequirements
2
Decom-pose
workbreakdownstructure
4
Estimateresources
workmonths
3
Estimatesize
deliverablesize
5
Developschedule
schedule
Iterate as necessary
productivity rate
Planning process
56
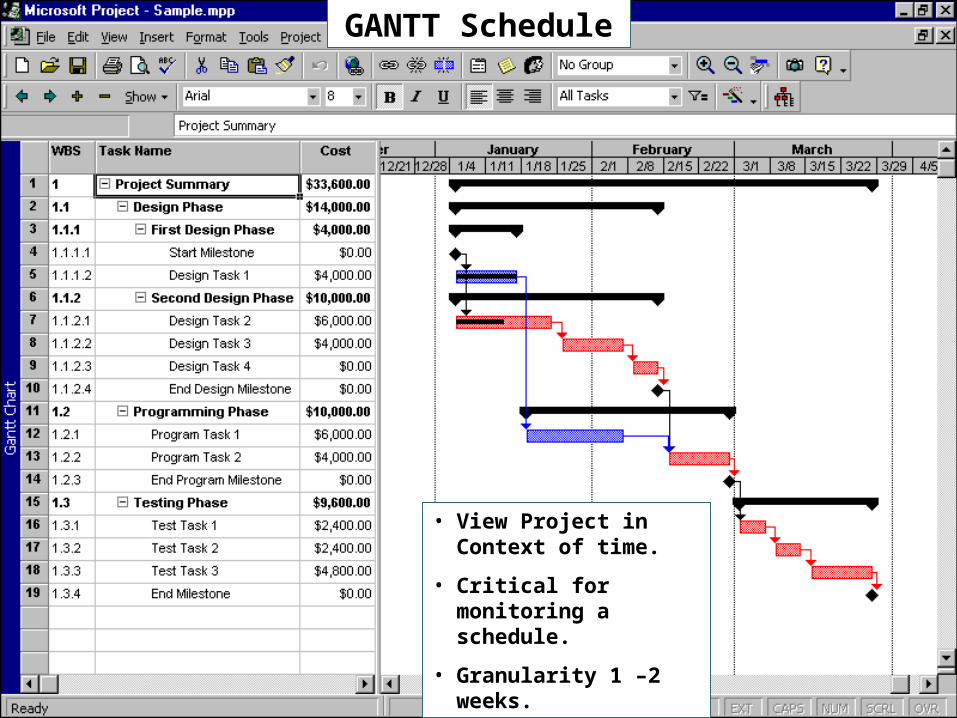
GANTT Schedule
• View Project in Context of time.
• Critical for monitoring a schedule.
• Granularity 1 –2 weeks.
57
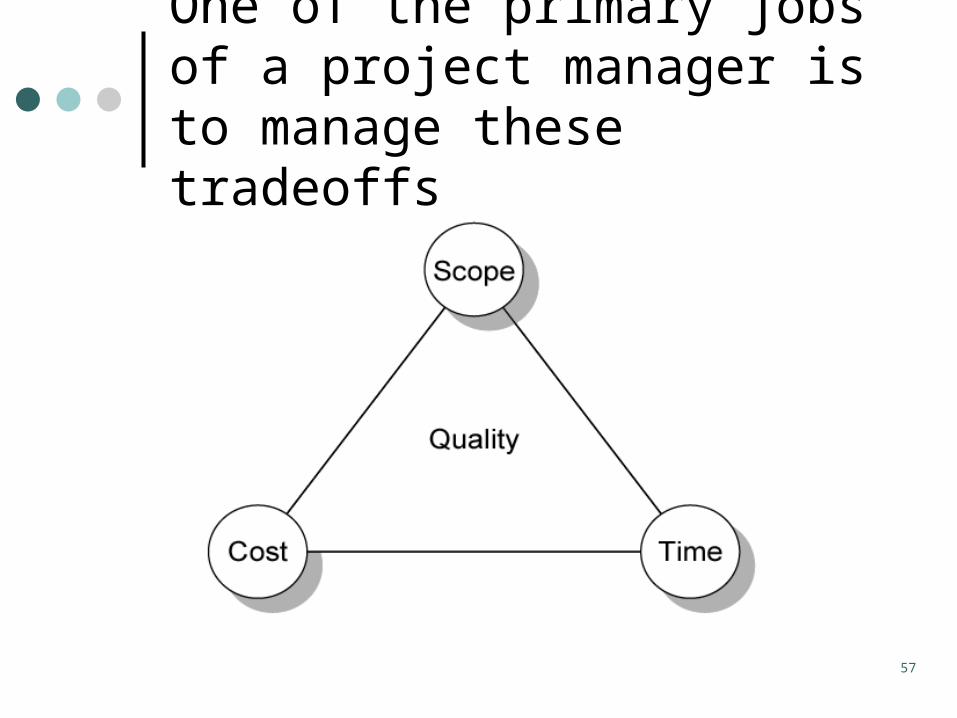
One of the primary jobs of a project manager is to manage these tradeoffs
58
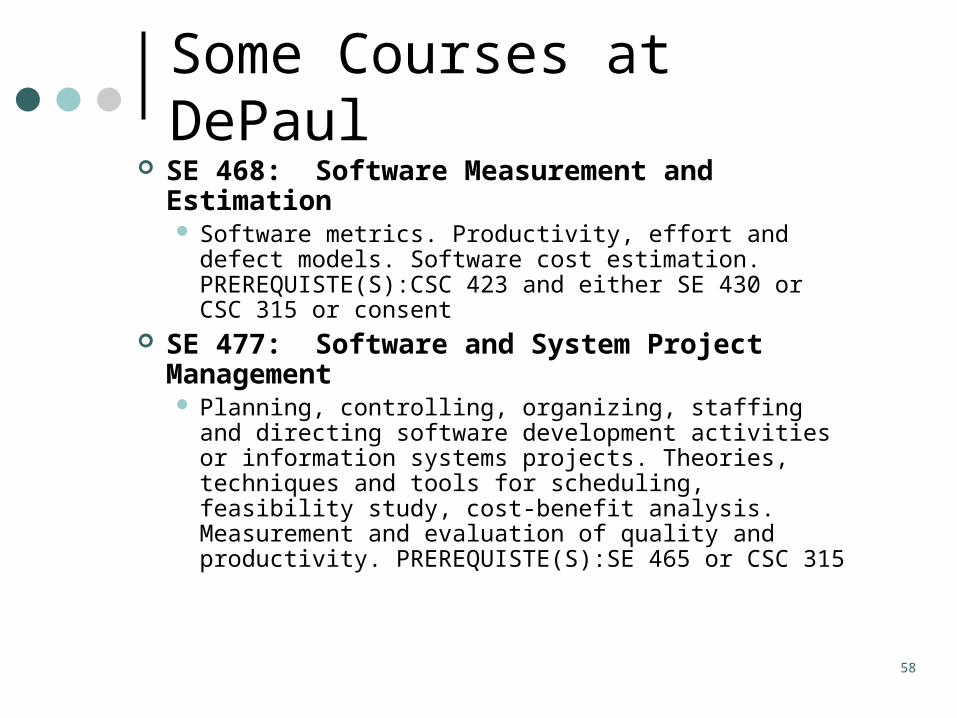
Some Courses at DePaul SE 468: Software Measurement and
Estimation Software metrics. Productivity, effort and defect models.
Software cost estimation. PREREQUISTE(S):CSC 423 and either SE 430 or CSC 315 or consent
SE 477: Software and System Project Management Planning, controlling, organizing, staffing and directing
software development activities or information systems projects. Theories, techniques and tools for scheduling, feasibility study, cost-benefit analysis. Measurement and evaluation of quality and productivity. PREREQUISTE(S):SE 465 or CSC 315
59
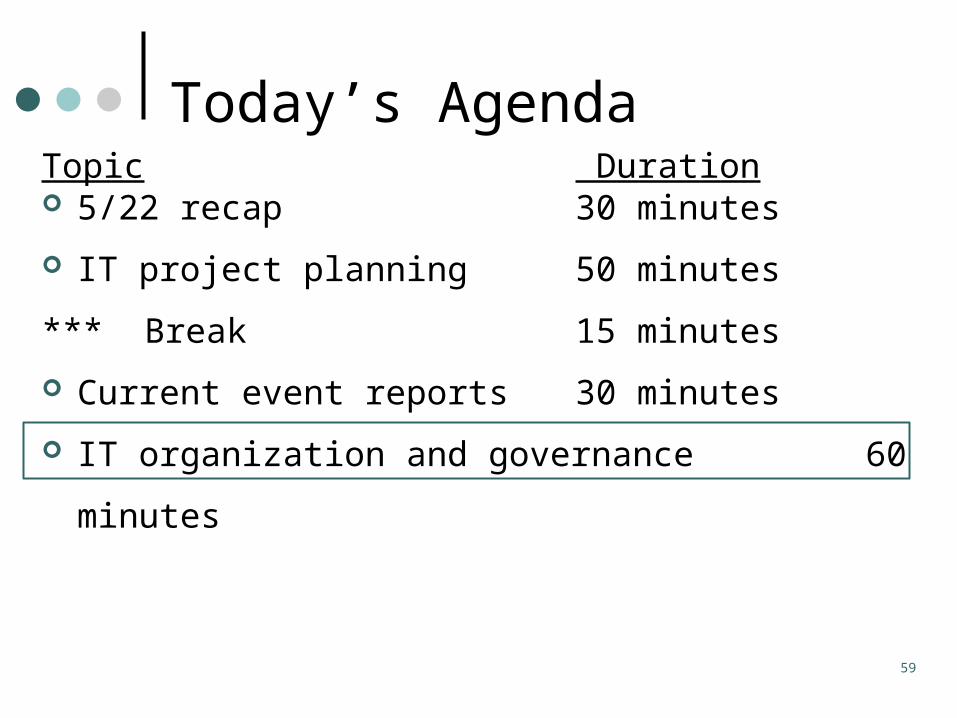
Topic Duration 5/22 recap 30 minutes
IT project planning 50 minutes
*** Break 15 minutes
Current event reports 30 minutes
IT organization and governance 60 minutes
Today’s Agenda
IT Organization
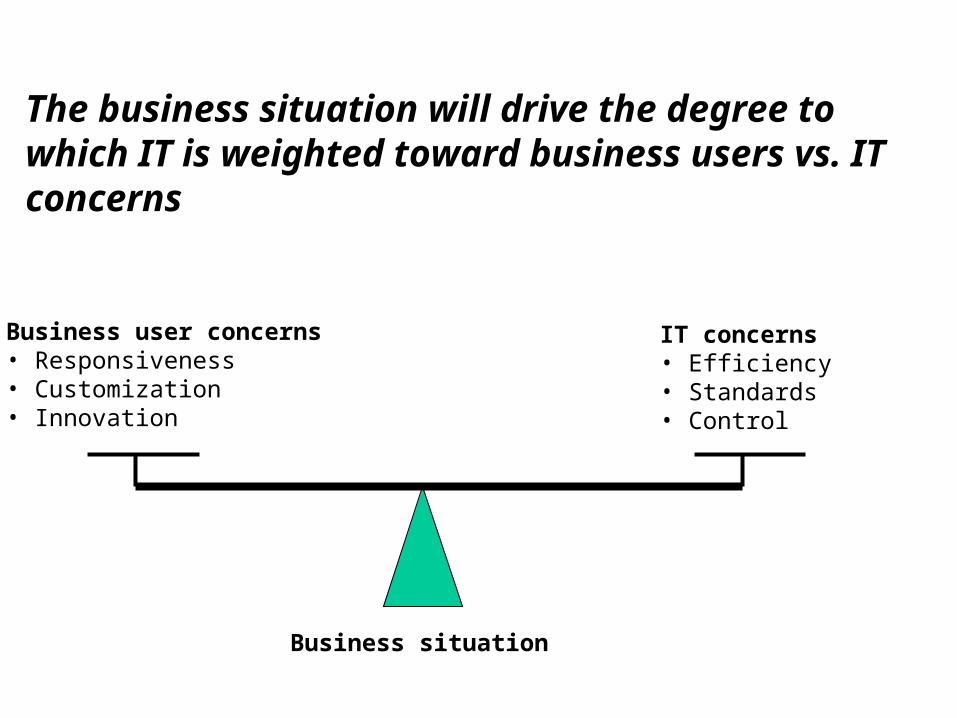
The business situation will drive the degree to which IT is weighted toward business users vs. IT concerns
Business user concerns• Responsiveness• Customization• Innovation
IT concerns• Efficiency • Standards• Control
Business situation
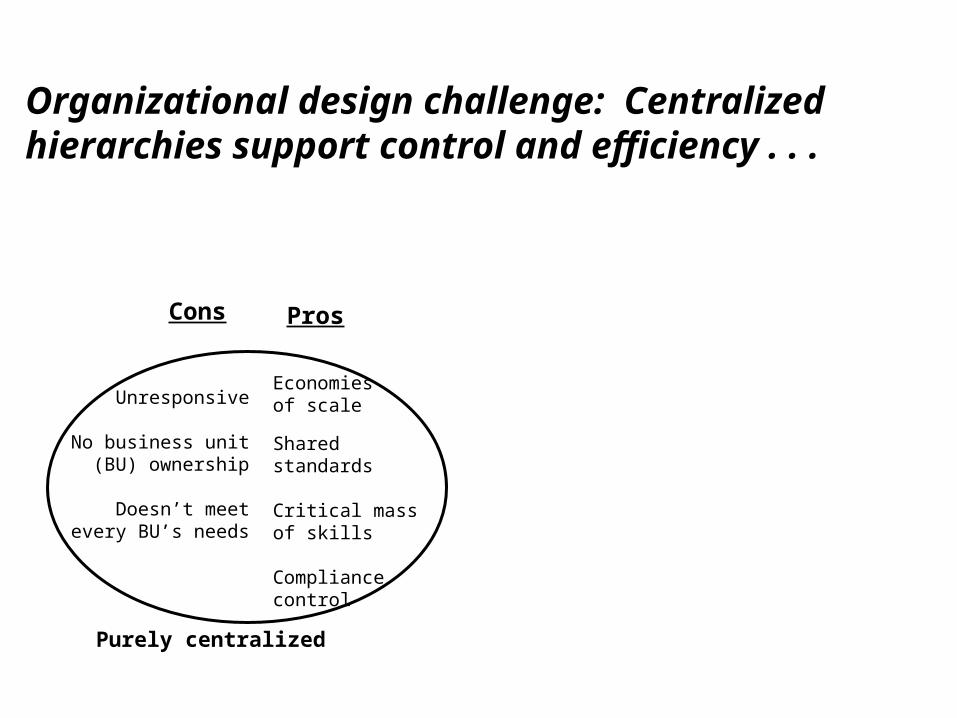
Unresponsive
No business unit (BU) ownership
Doesn’t meet every BU’s needs
Economiesof scale
Sharedstandards
Critical massof skills
Compliancecontrol
Purely centralized
Organizational design challenge: Centralized hierarchies support control and efficiency . . .
Cons Pros
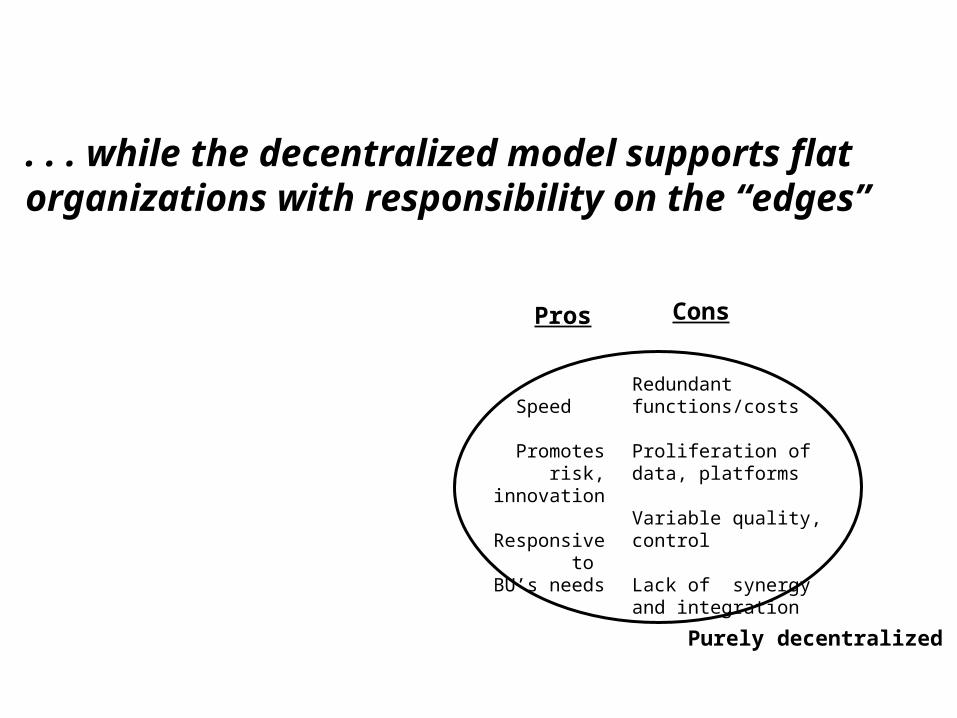
Redundant functions/costs
Proliferation of data, platforms
Variable quality, control
Lack of synergy and integration
Speed
Promotes risk, innovation
Responsive to BU’s needs
Purely decentralized
. . . while the decentralized model supports flat organizations with responsibility on the “edges”
Pros Cons
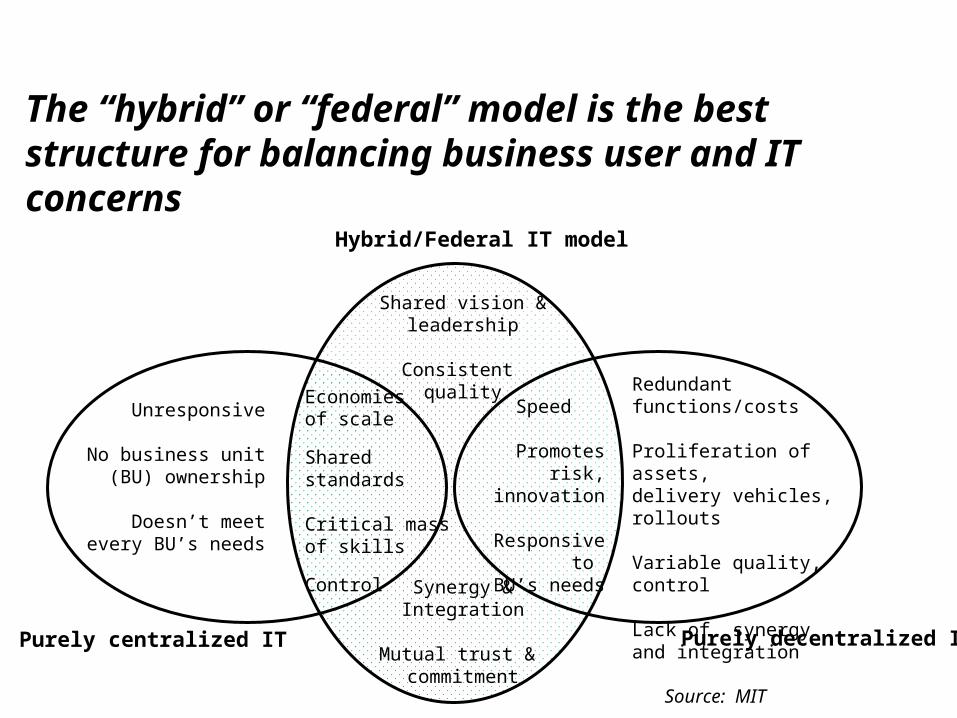
Hybrid/Federal IT model
Unresponsive
No business unit (BU) ownership
Doesn’t meet every BU’s needs
Redundant functions/costs
Proliferation of assets, delivery vehicles, rollouts
Variable quality, control
Lack of synergy and integration
Economiesof scale
Sharedstandards
Critical massof skills
Control
Speed
Promotes risk, innovation
Responsive to BU’s needs
Shared vision &
leadership
Consistent quality
Synergy &Integration
Mutual trust & commitment
Purely centralized IT Purely decentralized IT
The “hybrid” or “federal” model is the best structure for balancing business user and IT concerns
Source: MIT
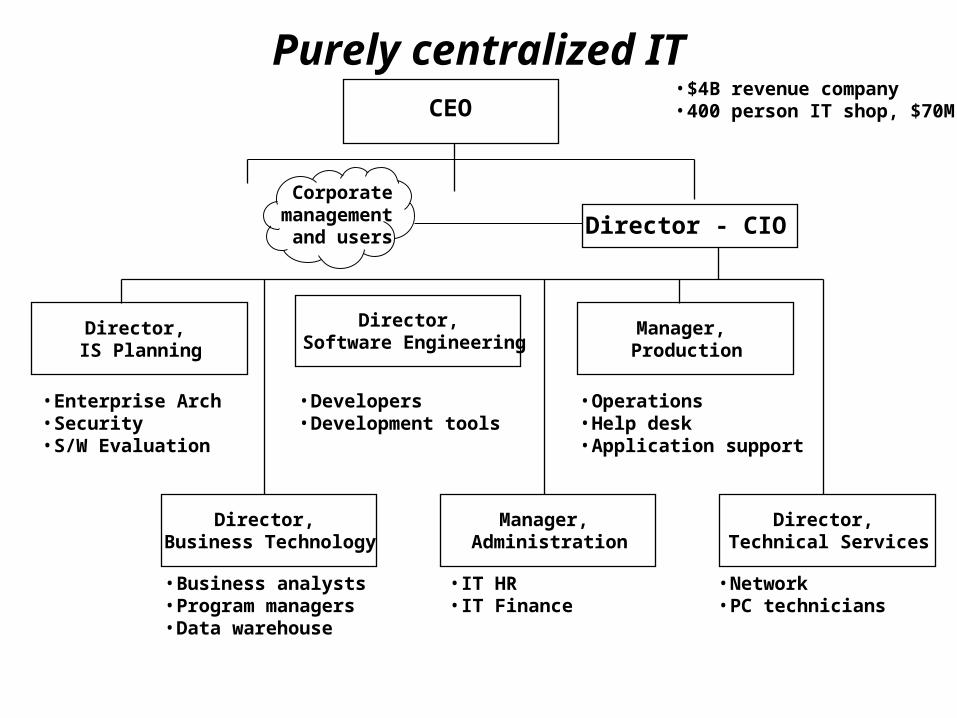
Director - CIO
Director, IS Planning
Director, Software Engineering
Manager, Production
Director, Business Technology
Manager, Administration
Director, Technical Services
• Enterprise Arch• Security• S/W Evaluation
• Business analysts• Program managers• Data warehouse
• Developers• Development tools
• Operations• Help desk• Application support
• Network• PC technicians
• $4B revenue company• 400 person IT shop, $70M
• IT HR• IT Finance
Purely centralized ITCEO
Corporatemanagement
and users
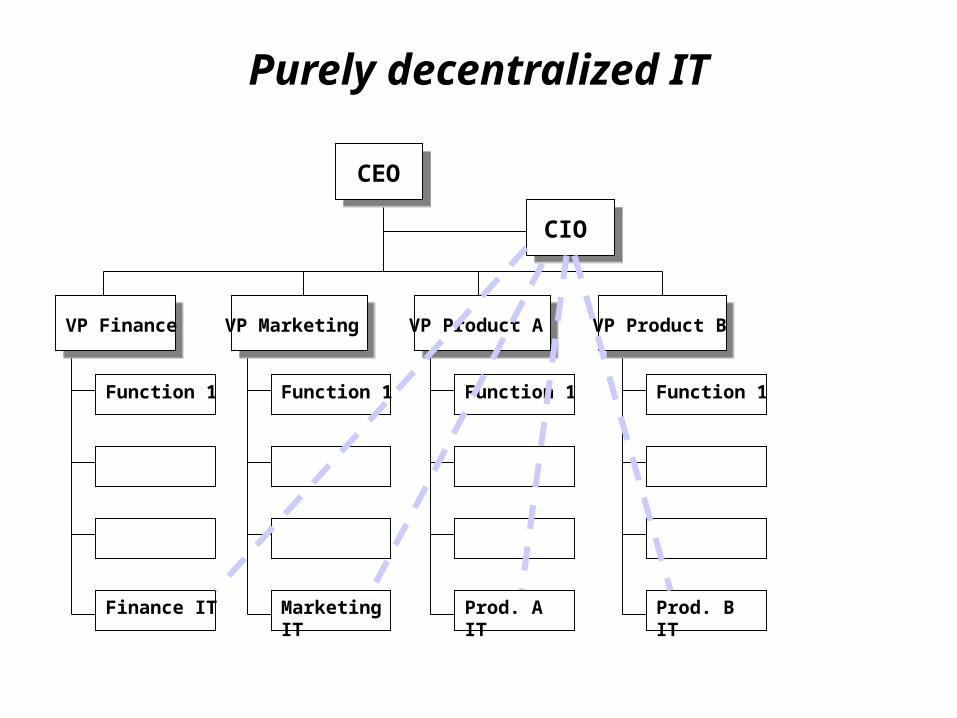
Purely decentralized IT
CEO
CIO
VP Finance VP Marketing VP Product A VP Product B
Function 1
Finance IT
Function 1
Marketing IT
Function 1
Function 1
Prod. B ITProd. A IT
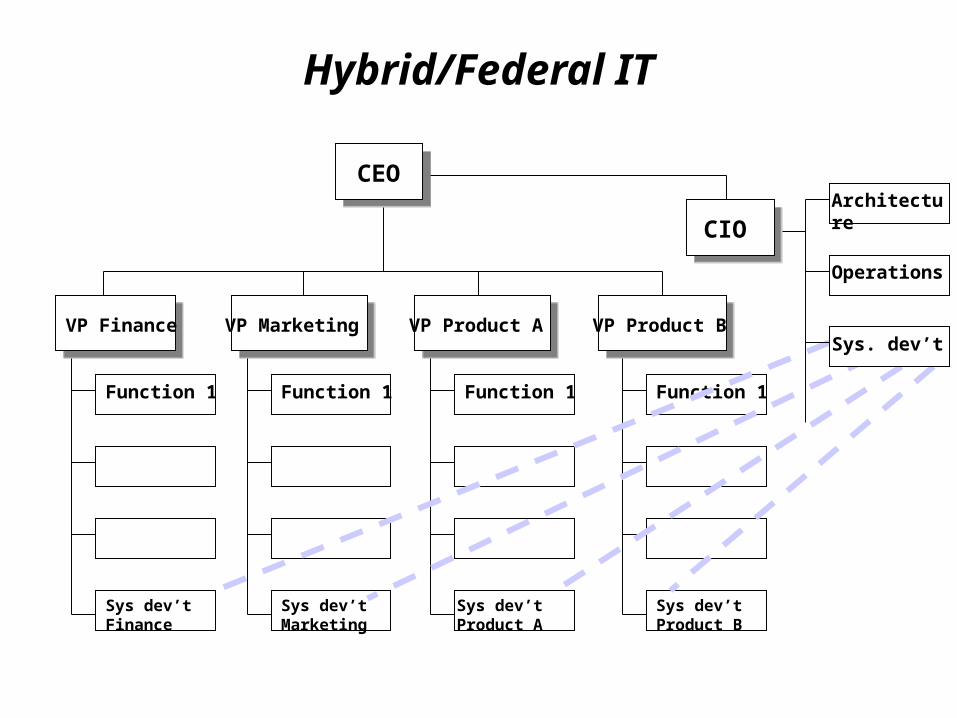
Hybrid/Federal IT
CEO
VP Finance VP Marketing VP Product A VP Product B
Function 1
Sys dev’t Finance
Function 1
Function 1
Function 1
CIOArchitecture
Operations
Sys dev’t Marketing
Sys dev’t Product A
Sys dev’t Product B
Sys. dev’t
68© James W. Nowotarski
IT Outsourcing
• On average, outsourcing accounts for roughly 20% of the IT budget (Source: CIO Insight, March 2006)
• More than 90% of [government officials responding to a survey] deemed outsourcing as important or absolutely critical to their missions of delivering services to citizens
• “Outsourcing is one of the greatest organizational and industry structure shifts of the [20th] century” -- James Brian Quinn, Amos Tuck School, Dartmouth
Information technology (IT) outsourcing is widely accepted by most commercial and government organizations
69© James W. Nowotarski
IT Outsourcing
• Cost reduction.
• Cost predictability.
• Improved performance levels. For example, speed of delivery, customer satisfaction, quality, etc. These are especially relevant for seasonal businesses where volume fluctuates widely.
• Desire to refocus on corporate core competencies.
• Desire to have in-house IT resources focus on strategic systems and/or technology.
Information technology (IT) outsourcing is a multiyear contract/relationship involving the purchase of one or more IT services
Drivers
70© James W. Nowotarski
IT Outsourcing
• Lack of in-house IT resources. This includes personnel resources and computing resources such as hardware capacity.
• Desire to become and stay technologically current.
• Financial factors. Outsourcing typically involves the outsourcing firm making up-front payment to the customer firm for a transfer of people and/or computing assets. This improves the balance sheet and short-term cash flow.
• Desire to overcome internal inertia and resistance to change.
• Increased recognition of the strategic benefits of alliances.
Information technology (IT) outsourcing is a multiyear contract/relationship involving the purchase of one or more IT services.
Drivers (continued)
71© James W. Nowotarski
IT Outsourcing
“[g]et rid of context and focus on core” - Billy McCarter, former CIO of Fireman’s Fund, who reduced IT staff from 1,100 to 600 with much of the work outsourced to offshore workers
A desire to focus on core competencies is frequently the strongest driver to outsource
“[a]llows me and my staff to focus on fun areas . . . be more productive, more visible to the business, understand what the business needs versus worrying about whether one of the servers needs additional RAM” - Daniel Sheehan, CIO at Advo, Inc.
72© James W. Nowotarski
IT Outsourcing
• Total outsourcing. Outsource a large percentage of the IT function. This may be to a single outsourcing firm, or to multiple firms
• Multisourcing. Using a combination of internal and multiple external IT service providers.
• Transitional outsourcing. Using an outsourcing firm for some discrete period of time, after which the activity returns in-house. This is often used for legacy systems that need to be overhauled.
There are many approaches to IT outsourcing
Examples
73© James W. Nowotarski
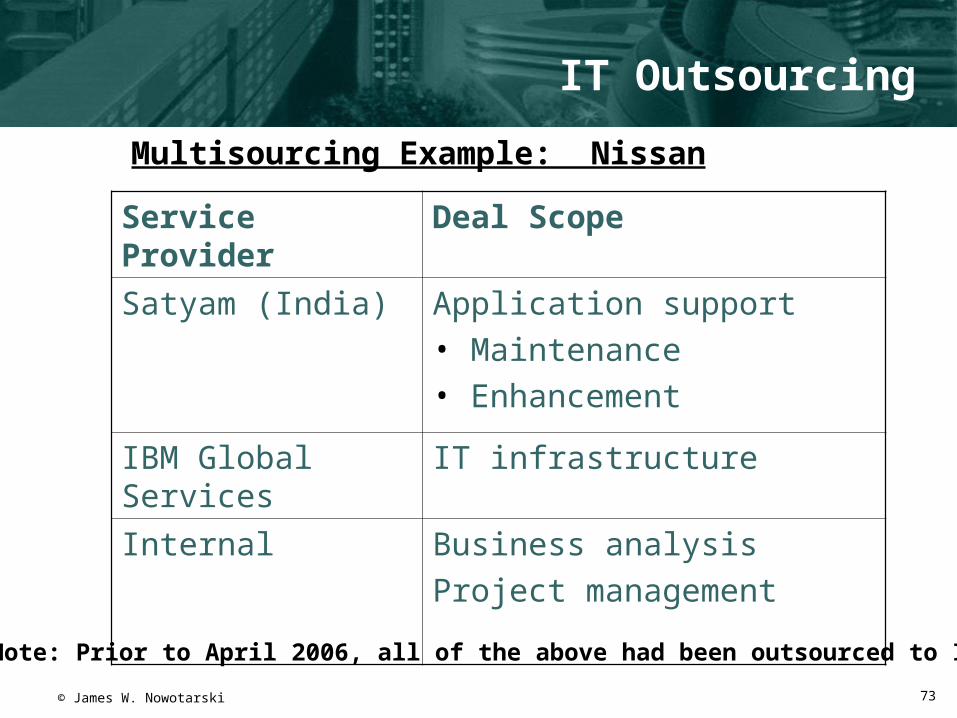
IT Outsourcing
Multisourcing Example: Nissan
Service Provider Deal Scope
Satyam (India) Application support• Maintenance• Enhancement
IBM Global Services IT infrastructure
Internal Business analysis
Project management
Note: Prior to April 2006, all of the above had been outsourced to IBM
74© James W. Nowotarski
IT Offshoring
Offshore - A location/development center in a country remote from the country in which the service or process is consumed or touches the end user or customer
Source: Gartner Group
75
© James W. Nowotarski
IT Offshoring
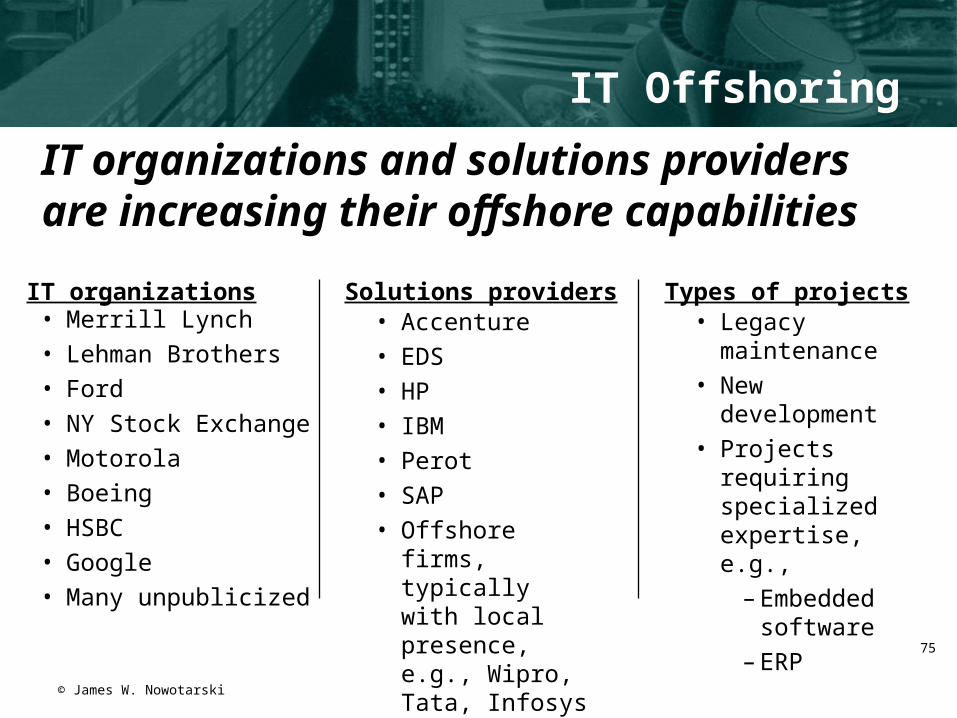
IT organizations and solutions providers are increasing their offshore capabilities
• Merrill Lynch
• Lehman Brothers
• Ford
• NY Stock Exchange
• Motorola
• Boeing
• HSBC
• Many unpublicized
IT organizations• Accenture
• EDS
• HP
• IBM
• Perot
• SAP
• Offshore firms, typically with local presence, e.g., Wipro, Tata, Infosys
Solutions providers• Legacy
maintenance
• New development
• Projects requiring specialized expertise, e.g.,
– Embedded software
– ERP
Types of projects
76© James W. Nowotarski
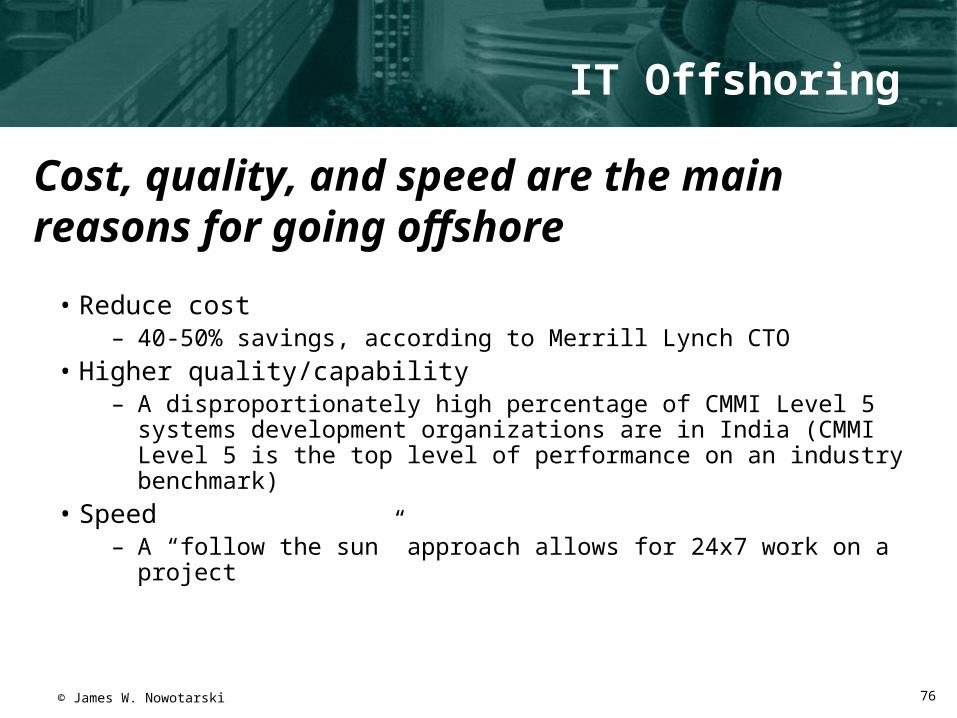
• Reduce cost– 40-50% savings, according to Merrill Lynch CTO
• Higher quality/capability– A disproportionately high percentage of CMMI Level 5 systems
development organizations are in India (CMMI Level 5 is the top level of performance on an industry benchmark)
• Speed– A “follow the sun” approach allows for 24x7 work on a project
Cost, quality, and speed are the main reasons for going offshore
IT Offshoring
77© James W. Nowotarski
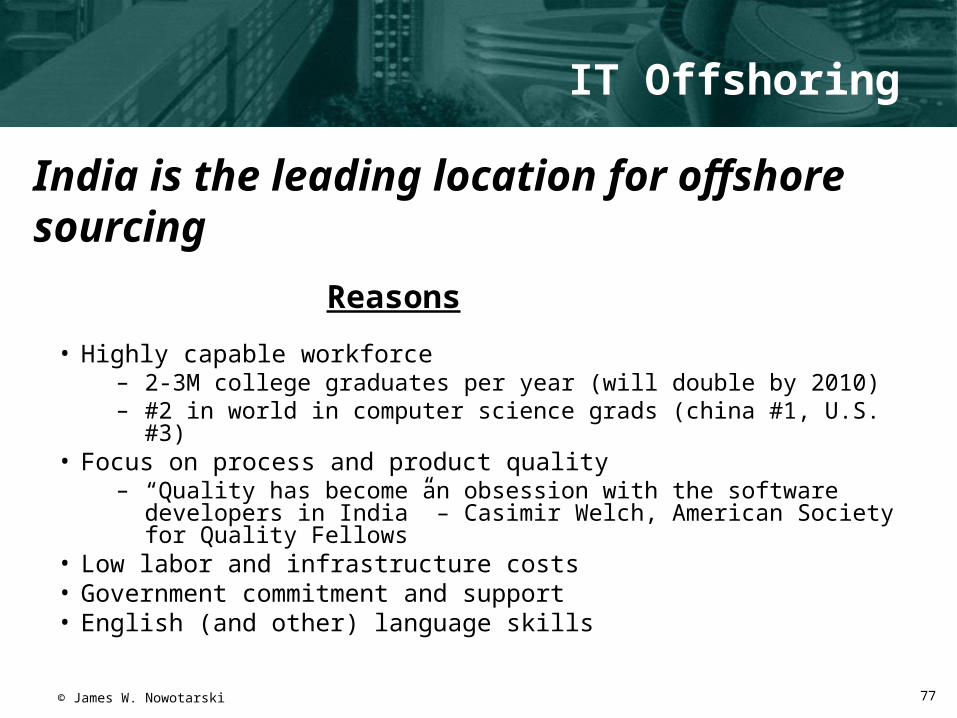
• Highly capable workforce– 2-3M college graduates per year (will double by 2010)– #2 in world in computer science grads (china #1, U.S. #3)
• Focus on process and product quality– “Quality has become an obsession with the software developers in India”
– Casimir Welch, American Society for Quality Fellows• Low labor and infrastructure costs• Government commitment and support• English (and other) language skills
India is the leading location for offshore sourcing
Reasons
IT Offshoring
78© James W. Nowotarski
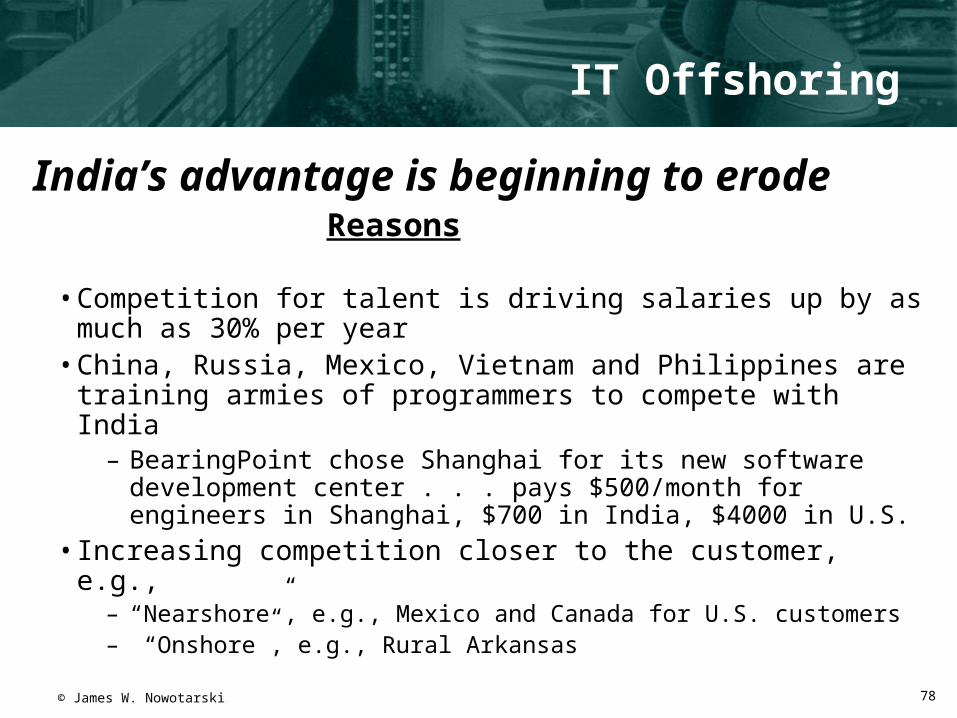
• Competition for talent is driving salaries up by as much as 30% per year
• China, Russia, Mexico, Vietnam and Philippines are training armies of programmers to compete with India
– BearingPoint chose Shanghai for its new software development center . . . pays $500/month for engineers in Shanghai, $700 in India, $4000 in U.S.
• Increasing competition closer to the customer, e.g., – “Nearshore”, e.g., Mexico and Canada for U.S. customers– “Onshore”, e.g., Rural Arkansas
India’s advantage is beginning to erodeReasons
IT Offshoring
IT Governance
80
• The operating model for how the organization makes and enacts decisions about the use of IT
• What is meant by “operating model”?– Organizational units involved– Division of roles, responsibilities, and accountabilities– Processes, standards, policies– Measurements
• What types of decisions are we talking about?– What IT goals and priorities will enable the organization and
maximize benefits– How to obtain and deploy IT resources– How to appropriately mitigate and control risk
IT Governance: Definition
81
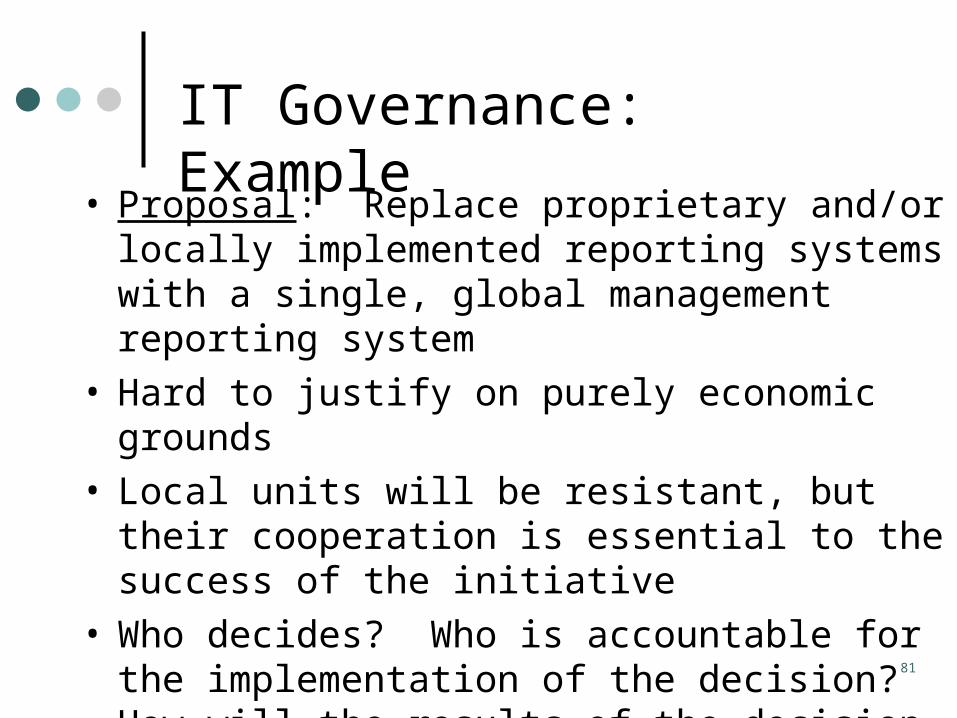
• Proposal: Replace proprietary and/or locally implemented reporting systems with a single, global management reporting system
• Hard to justify on purely economic grounds• Local units will be resistant, but their cooperation
is essential to the success of the initiative• Who decides? Who is accountable for the
implementation of the decision? How will the results of the decision be measured and monitored?
IT Governance: Example
82
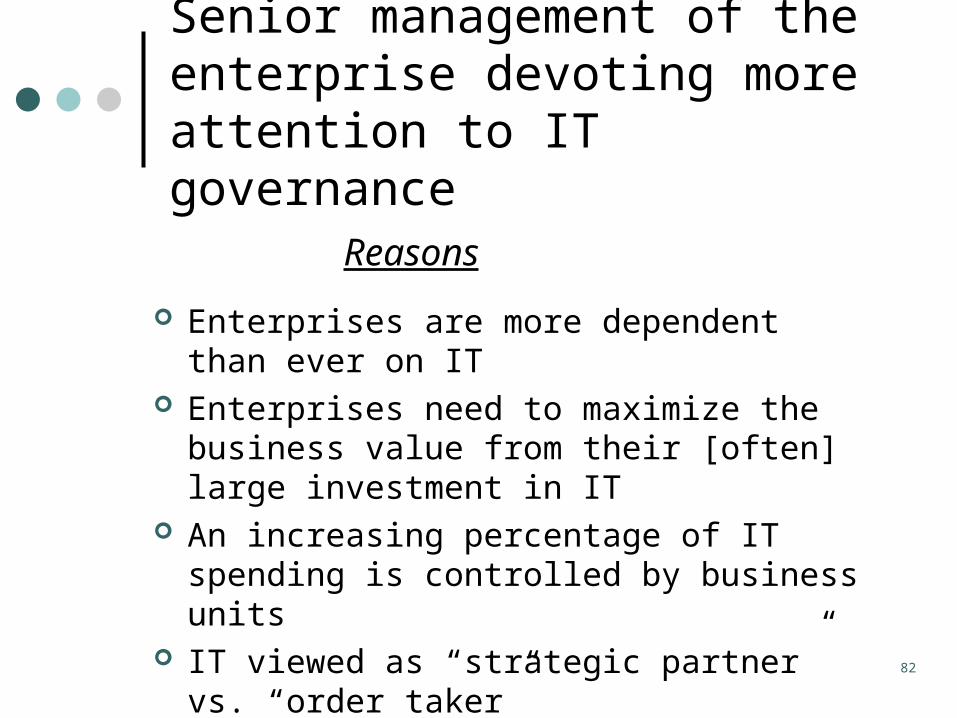
Senior management of the enterprise devoting more attention to IT governance
Enterprises are more dependent than ever on IT
Enterprises need to maximize the business value from their [often] large investment in IT
An increasing percentage of IT spending is controlled by business units
IT viewed as “strategic partner” vs. “order taker”
Reasons
83
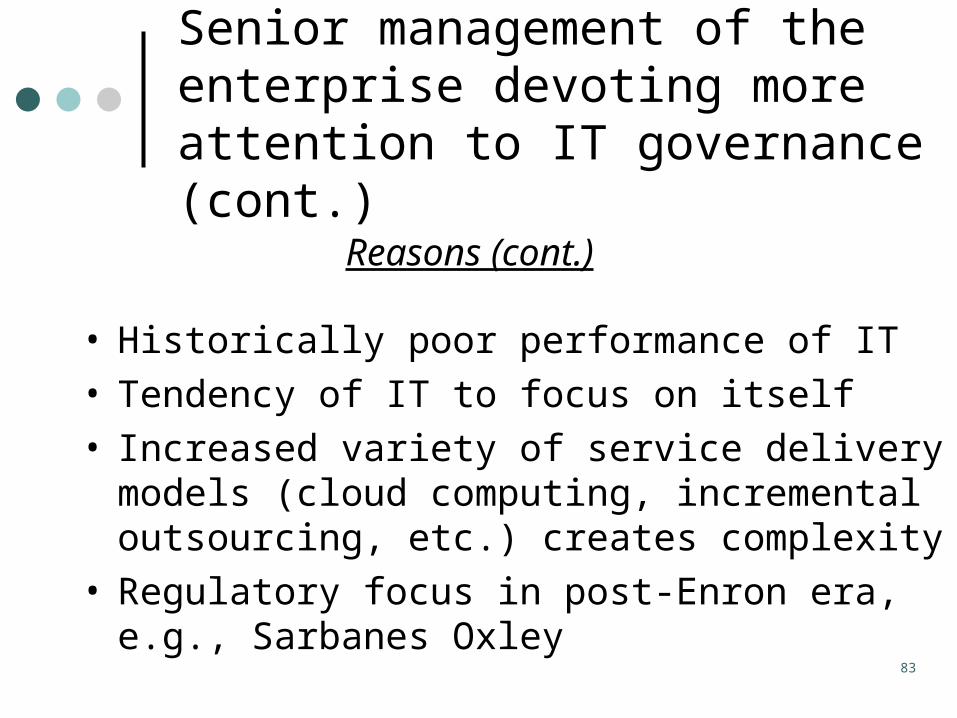
• Historically poor performance of IT• Tendency of IT to focus on itself• Increased variety of service delivery models
(cloud computing, incremental outsourcing, etc.) creates complexity
• Regulatory focus in post-Enron era, e.g., Sarbanes Oxley
Senior management of the enterprise devoting more attention to IT governance (cont.)
Reasons (cont.)
84
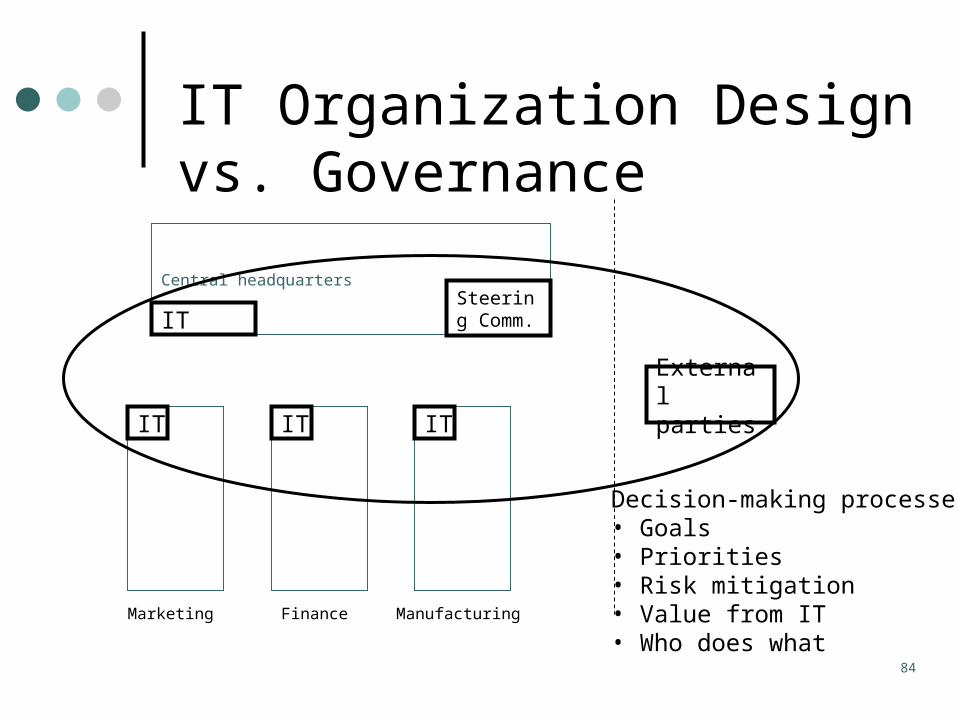
IT Organization Design vs. Governance
Central headquarters
IT
IT
Marketing
IT
Finance
IT
Manufacturing
External parties
Decision-making processes • Goals• Priorities• Risk mitigation• Value from IT• Who does what
Steering Comm.
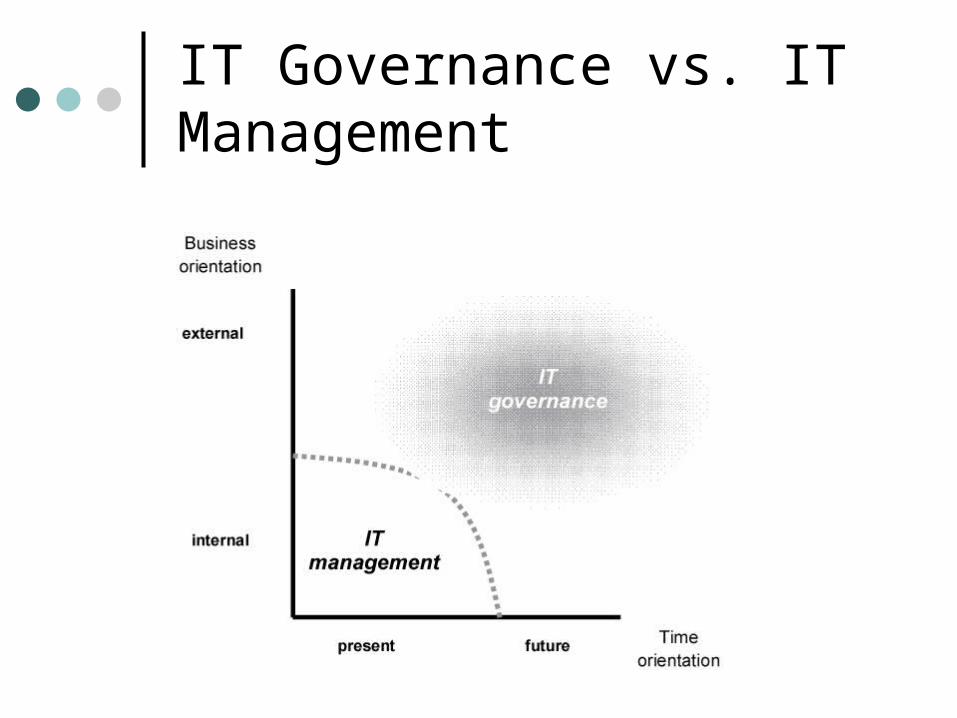
IT Governance vs. IT Management
86
Short reading Complete Assignment 4 DL: Complete discussion on project
management resources (due June 5)
For June 5