Embed Size (px)
Citation preview

Jaguar Land Rover Automotive plc Interim Report
For the three month period ended
30 June 2020
Company registered number: 06477691
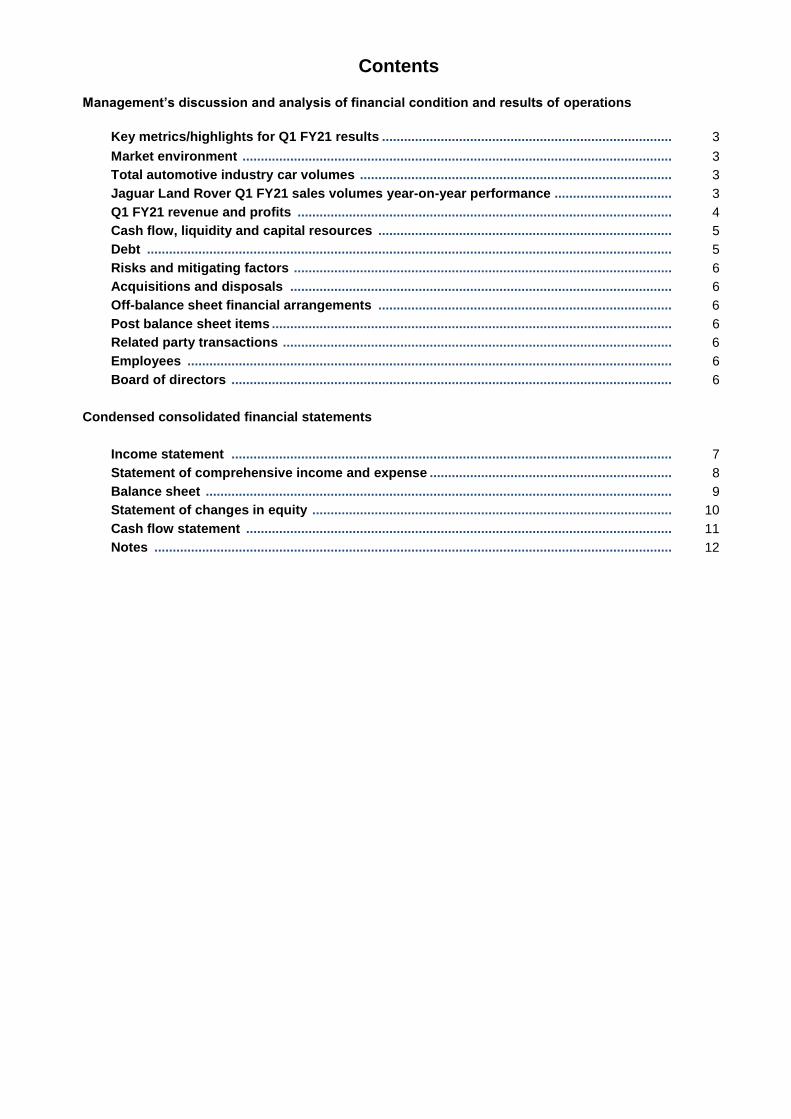
Contents
Management’s discussion and analysis of financial condition and results of operations
Key metrics/highlights for Q1 FY21 results ...............................................................................
3
Market environment ..................................................................................................................... 3
Total automotive industry car volumes ..................................................................................... 3
Jaguar Land Rover Q1 FY21 sales volumes year-on-year performance ................................ 3
Q1 FY21 revenue and profits ...................................................................................................... 4
Cash flow, liquidity and capital resources ................................................................................ 5
Debt ............................................................................................................................................... 5
Risks and mitigating factors ....................................................................................................... 6
Acquisitions and disposals ........................................................................................................ 6
Off-balance sheet financial arrangements ................................................................................ 6
Post balance sheet items ............................................................................................................. 6
Related party transactions .......................................................................................................... 6
Employees .................................................................................................................................... 6
Board of directors ........................................................................................................................ 6
Condensed consolidated financial statements
Income statement ........................................................................................................................ 7
Statement of comprehensive income and expense .................................................................. 8
Balance sheet ............................................................................................................................... 9
Statement of changes in equity .................................................................................................. 10
Cash flow statement .................................................................................................................... 11
Notes ............................................................................................................................................. 12
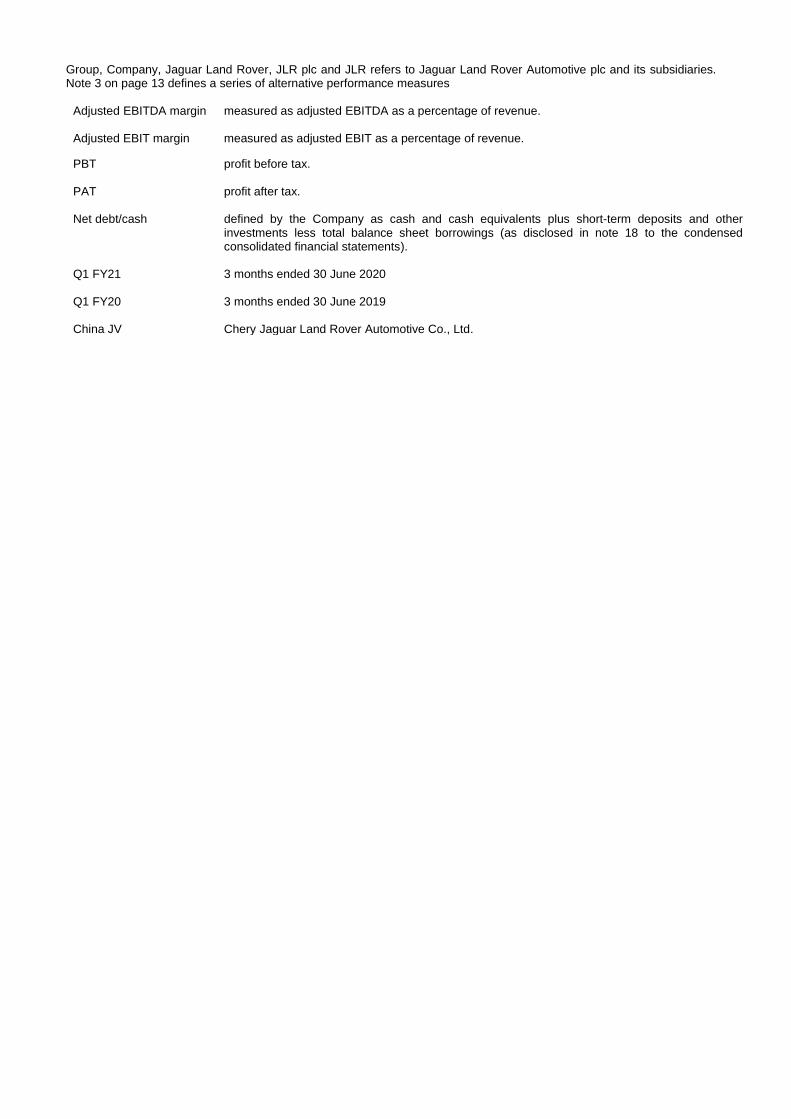
Group, Company, Jaguar Land Rover, JLR plc and JLR refers to Jaguar Land Rover Automotive plc and its subsidiaries. Note 3 on page 13 defines a series of alternative performance measures
Adjusted EBITDA margin measured as adjusted EBITDA as a percentage of revenue.
Adjusted EBIT margin measured as adjusted EBIT as a percentage of revenue.
PBT profit before tax.
PAT profit after tax.
Net debt/cash defined by the Company as cash and cash equivalents plus short-term deposits and other investments less total balance sheet borrowings (as disclosed in note 18 to the condensed consolidated financial statements).
Q1 FY21 3 months ended 30 June 2020
Q1 FY20 3 months ended 30 June 2019
China JV Chery Jaguar Land Rover Automotive Co., Ltd.
3
Management’s discussion and analysis of financial condition and results of operations COVID-19 inevitably impacted the results of Jaguar Land Rover Automotive plc in the first quarter of Fiscal 2020/21 as the temporary plant shutdowns and dealership closures restricted the supply of, and demand for, vehicles.
Key metrics for Q1 FY21 results, compared to Q1 FY20, are as follows:
Retail sales of 74,067 vehicles fell 42.4% year-on-year but improved month-by-month through the quarter with
June down 24.9%; Wholesales of 48.9k units (excluding the China JV), down 53.1%
Revenue of £2.9 billion, down 43.7%
Loss before tax (PBT) £413 million, down only £18 million year-on-year after about £500 million of Project Charge+
cost reductions
Loss after tax (PAT) of £648 million, down £246 million
Adjusted EBITDA of £101 million (3.5% margin), down £112 million (margin 0.7% lower)
Loss before interest and tax (Adjusted EBIT) of £390 million (-13.6% margin), down £112 million (margin 8.1%
lower)
Free cash flow was negative £1.5 billion; primarily reflecting a one-time £1.1 billion of working capital outflow as
a result of the temporary plant shutdowns
Liquidity at 30 June was £4.7b, including £2.75b of cash and short-term investments and £1.9b undrawn credit facility
Market environment
The outbreak of coronavirus has had, and continues to have, a significant impact on global economic performance as governments across the globe enforced social distancing measures to control the spread of the virus
Passenger car industry volumes fell significantly during the quarter across most of our sales regions as strict social distancing measures were enforced, although industry sales in China recovered well soon after the lockdowns were lifted there in the prior quarter
Economic activity has been recovering in recent months following the relaxation of social distancing measures globally, however there remains considerable uncertainty about the extent, speed and regional differences of any recovery and the possibility of a second wave of the pandemic
In addition, geopolitical tensions are rising, particularly relating to trade. Further uncertainty and volatility could arise with the upcoming US presidential election and the transition period for Brexit moving ever closer with little clarity yet on the future trading arrangements between the UK and the European Union
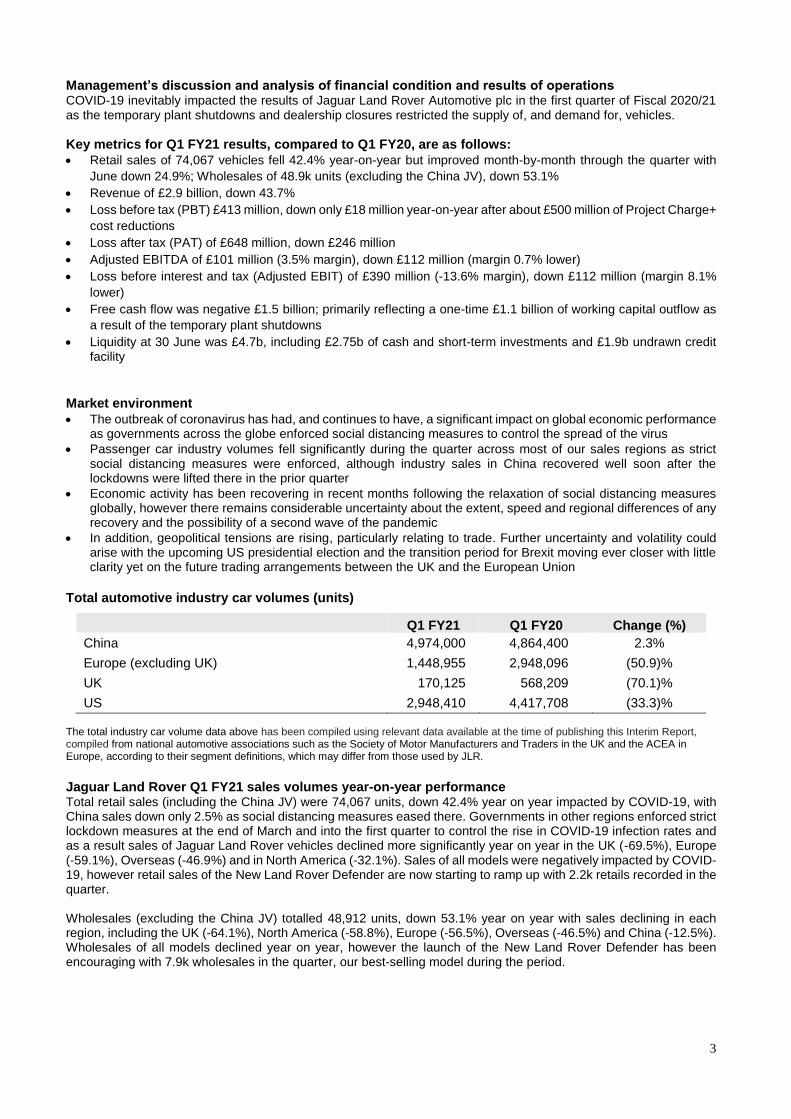
Total automotive industry car volumes (units)
Q1 FY21 Q1 FY20 Change (%)
China 4,974,000 4,864,400 2.3%
Europe (excluding UK) 1,448,955 2,948,096 (50.9)%
UK 170,125 568,209 (70.1)%
US 2,948,410 4,417,708 (33.3)%
The total industry car volume data above has been compiled using relevant data available at the time of publishing this Interim Report, compiled from national automotive associations such as the Society of Motor Manufacturers and Traders in the UK and the ACEA in Europe, according to their segment definitions, which may differ from those used by JLR.
Jaguar Land Rover Q1 FY21 sales volumes year-on-year performance Total retail sales (including the China JV) were 74,067 units, down 42.4% year on year impacted by COVID-19, with China sales down only 2.5% as social distancing measures eased there. Governments in other regions enforced strict lockdown measures at the end of March and into the first quarter to control the rise in COVID-19 infection rates and as a result sales of Jaguar Land Rover vehicles declined more significantly year on year in the UK (-69.5%), Europe (-59.1%), Overseas (-46.9%) and in North America (-32.1%). Sales of all models were negatively impacted by COVID-19, however retail sales of the New Land Rover Defender are now starting to ramp up with 2.2k retails recorded in the quarter. Wholesales (excluding the China JV) totalled 48,912 units, down 53.1% year on year with sales declining in each region, including the UK (-64.1%), North America (-58.8%), Europe (-56.5%), Overseas (-46.5%) and China (-12.5%). Wholesales of all models declined year on year, however the launch of the New Land Rover Defender has been encouraging with 7.9k wholesales in the quarter, our best-selling model during the period.
4
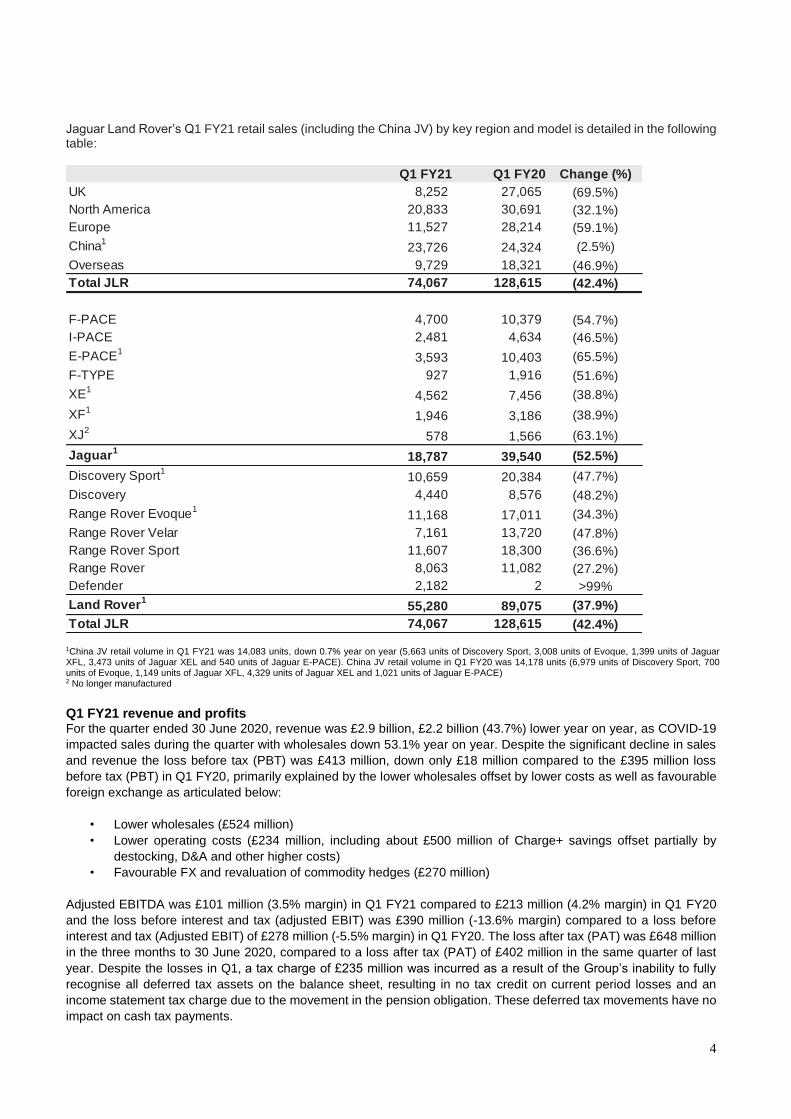
Jaguar Land Rover’s Q1 FY21 retail sales (including the China JV) by key region and model is detailed in the following table:
1China JV retail volume in Q1 FY21 was 14,083 units, down 0.7% year on year (5,663 units of Discovery Sport, 3,008 units of Evoque, 1,399 units of Jaguar XFL, 3,473 units of Jaguar XEL and 540 units of Jaguar E-PACE). China JV retail volume in Q1 FY20 was 14,178 units (6,979 units of Discovery Sport, 700 units of Evoque, 1,149 units of Jaguar XFL, 4,329 units of Jaguar XEL and 1,021 units of Jaguar E-PACE) 2 No longer manufactured
Q1 FY21 revenue and profits For the quarter ended 30 June 2020, revenue was £2.9 billion, £2.2 billion (43.7%) lower year on year, as COVID-19
impacted sales during the quarter with wholesales down 53.1% year on year. Despite the significant decline in sales
and revenue the loss before tax (PBT) was £413 million, down only £18 million compared to the £395 million loss
before tax (PBT) in Q1 FY20, primarily explained by the lower wholesales offset by lower costs as well as favourable
foreign exchange as articulated below:
• Lower wholesales (£524 million)
• Lower operating costs (£234 million, including about £500 million of Charge+ savings offset partially by
destocking, D&A and other higher costs)
• Favourable FX and revaluation of commodity hedges (£270 million)
Adjusted EBITDA was £101 million (3.5% margin) in Q1 FY21 compared to £213 million (4.2% margin) in Q1 FY20
and the loss before interest and tax (adjusted EBIT) was £390 million (-13.6% margin) compared to a loss before
interest and tax (Adjusted EBIT) of £278 million (-5.5% margin) in Q1 FY20. The loss after tax (PAT) was £648 million
in the three months to 30 June 2020, compared to a loss after tax (PAT) of £402 million in the same quarter of last
year. Despite the losses in Q1, a tax charge of £235 million was incurred as a result of the Group’s inability to fully
recognise all deferred tax assets on the balance sheet, resulting in no tax credit on current period losses and an
income statement tax charge due to the movement in the pension obligation. These deferred tax movements have no
impact on cash tax payments.
Q1 FY21 Q1 FY20 Change (%)
UK 8,252 27,065 (69.5%)
North America 20,833 30,691 (32.1%)
Europe 11,527 28,214 (59.1%)
China1
23,726 24,324 (2.5%)
Overseas 9,729 18,321 (46.9%)
Total JLR 74,067 128,615 (42.4%)
F-PACE 4,700 10,379 (54.7%)
I-PACE 2,481 4,634 (46.5%)
E-PACE1
3,593 10,403 (65.5%)
F-TYPE 927 1,916 (51.6%)
XE1
4,562 7,456 (38.8%)
XF1
1,946 3,186 (38.9%)
XJ2
578 1,566 (63.1%)
Jaguar1
18,787 39,540 (52.5%)
Discovery Sport1
10,659 20,384 (47.7%)
Discovery 4,440 8,576 (48.2%)
Range Rover Evoque1
11,168 17,011 (34.3%)
Range Rover Velar 7,161 13,720 (47.8%)
Range Rover Sport 11,607 18,300 (36.6%)
Range Rover 8,063 11,082 (27.2%)
Defender 2,182 2 >99%
Land Rover1
55,280 89,075 (37.9%)
Total JLR 74,067 128,615 (42.4%)
5
Cash flow, liquidity and capital resources In Q1 FY21 free cash flow was negative £1.5 billion after £1.1 billion of working capital outflows as a result of the temporary plant shutdowns as well as £548 million of total investment spending. Of the £548 million total investment spending £441 million was capitalised and £107 million of research and development costs were expensed through the income statement. The Group raised £647 million of new funding in the quarter including a 3 year (subject to annual review) RMB 5 billion (£567 million equivalent) working capital loan facility issued by its wholly owned Chinese subsidiary and a £63 million increase to an existing short-term working capital facility. Total cash and cash equivalents, deposits and investments at 30 June 2020 stood at £2.75 billion (comprising £2.5 billion of cash and cash equivalents and £0.3 billion of short-term deposits and other investments). The cash and financial deposits include an amount of £331 million held in subsidiaries of Jaguar Land Rover outside of the United Kingdom. The cash in some of these jurisdictions is subject to impediments to remitting cash to the UK other than through annual dividends. As at 30 June 2020, the Company also had an undrawn revolving credit facility totalling £1.9 billion, maturing in July 2022, which combined with total cash of £2.75 billion resulted in total available liquidity of £4.7 billion.
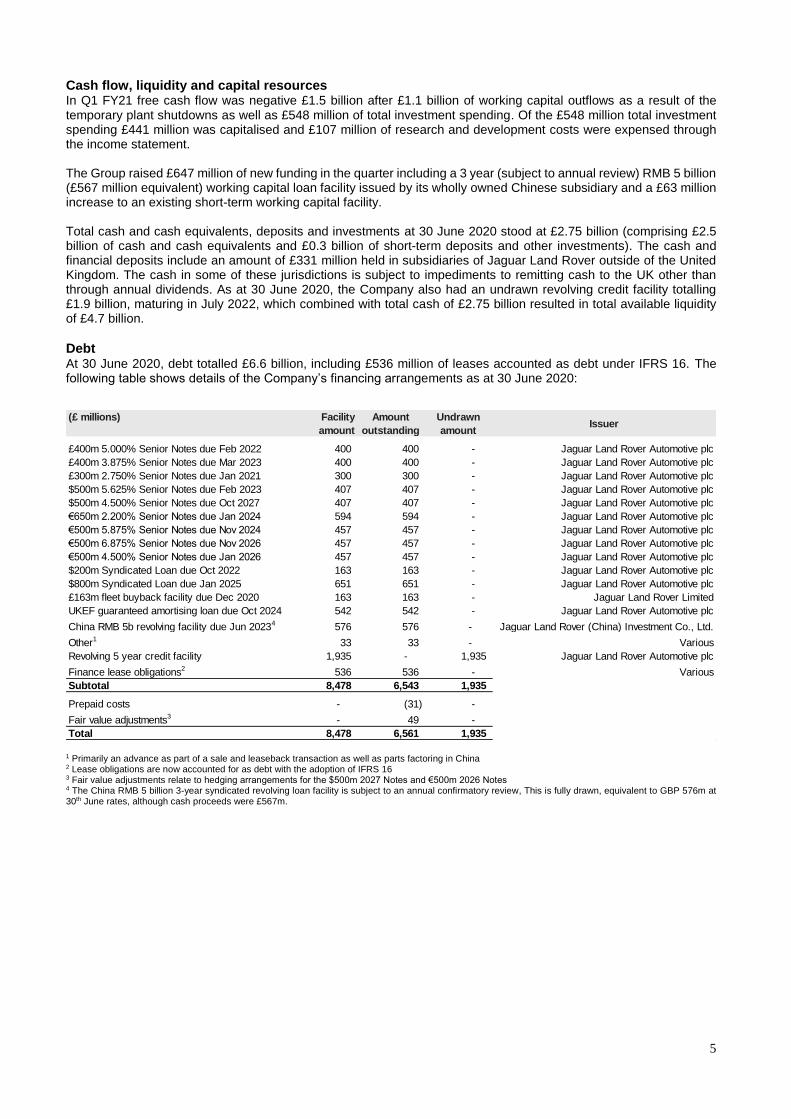
Debt At 30 June 2020, debt totalled £6.6 billion, including £536 million of leases accounted as debt under IFRS 16. The following table shows details of the Company’s financing arrangements as at 30 June 2020:
1 Primarily an advance as part of a sale and leaseback transaction as well as parts factoring in China 2 Lease obligations are now accounted for as debt with the adoption of IFRS 16 3 Fair value adjustments relate to hedging arrangements for the $500m 2027 Notes and €500m 2026 Notes 4 The China RMB 5 billion 3-year syndicated revolving loan facility is subject to an annual confirmatory review, This is fully drawn, equivalent to GBP 576m at 30th June rates, although cash proceeds were £567m.
(£ millions) Facility
amount
Amount
outstanding
Undrawn
amountIssuer
£400m 5.000% Senior Notes due Feb 2022 400 400 - Jaguar Land Rover Automotive plc
£400m 3.875% Senior Notes due Mar 2023 400 400 - Jaguar Land Rover Automotive plc
£300m 2.750% Senior Notes due Jan 2021 300 300 - Jaguar Land Rover Automotive plc
$500m 5.625% Senior Notes due Feb 2023 407 407 - Jaguar Land Rover Automotive plc
$500m 4.500% Senior Notes due Oct 2027 407 407 - Jaguar Land Rover Automotive plc
€650m 2.200% Senior Notes due Jan 2024 594 594 - Jaguar Land Rover Automotive plc
€500m 5.875% Senior Notes due Nov 2024 457 457 - Jaguar Land Rover Automotive plc
€500m 6.875% Senior Notes due Nov 2026 457 457 - Jaguar Land Rover Automotive plc
€500m 4.500% Senior Notes due Jan 2026 457 457 - Jaguar Land Rover Automotive plc
$200m Syndicated Loan due Oct 2022 163 163 - Jaguar Land Rover Automotive plc
$800m Syndicated Loan due Jan 2025 651 651 - Jaguar Land Rover Automotive plc
£163m fleet buyback facility due Dec 2020 163 163 - Jaguar Land Rover Limited
UKEF guaranteed amortising loan due Oct 2024 542 542 - Jaguar Land Rover Automotive plc
China RMB 5b revolving facility due Jun 20234
576 576 - Jaguar Land Rover (China) Investment Co., Ltd.
Other1
33 33 - Various
Revolving 5 year credit facility 1,935 - 1,935 Jaguar Land Rover Automotive plc
Finance lease obligations2
536 536 - Various
Subtotal 8,478 6,543 1,935
Prepaid costs - (31) -
Fair value adjustments3
- 49 -
Total 8,478 6,561 1,935
6
Risks and mitigating factors There are a number of potential risks which could have a material impact on the Group’s performance and could cause actual results to differ materially from expected and/or historical results, including those discussed on pages 19-22 of the Annual Report 2019-20 of the Group (available at https://www.jaguarlandrover.com/annual-report-2020) along with mitigating factors. The principal risks discussed in the Group’s Annual Report 2019-20 are competitive business efficiency, global economic and geopolitical environment (including COVID-19), brand positioning, distribution channels/retailer performance, IT systems and security, environmental regulations and compliance, supply chain disruptions, human capital, rapid technology change and unethical and prohibited business practices.
Acquisitions and disposals
There were no material acquisitions or disposals in Q1 FY21. In the quarter we sold our shares in Lyft for $26.5 million (c. $34 per share, £22 million equivalent) after charges.
Off-balance sheet financial arrangements At 30 June 2020, Jaguar Land Rover Limited (a subsidiary of the Company) had sold £270 million equivalent of receivables under a $700 million invoice discounting facility signed in March 2019.
Post balance sheet items There were no material post balance sheet items in Q1 FY21. Related party transactions Related party transactions for Q1 FY21 are disclosed in note 26 to the condensed consolidated financial statements disclosed on page 29 of this Interim Report. There have been no material changes in the related party transactions described in the latest Annual Report.
Personnel At 30 June 2020, Jaguar Land Rover employed 37,357 people worldwide, including agency personnel, compared to 39,269 at 30 June 2019. On 28 July 2020, the Company announced that Thierry Bolloré has been appointed to the role of Chief Executive Officer of Jaguar Land Rover Automotive plc, effective 10 September 2020, succeeding Professor Sir Ralf Speth who will take up the role of Non-Executive Vice Chairman of Jaguar Land Rover Automotive plc.
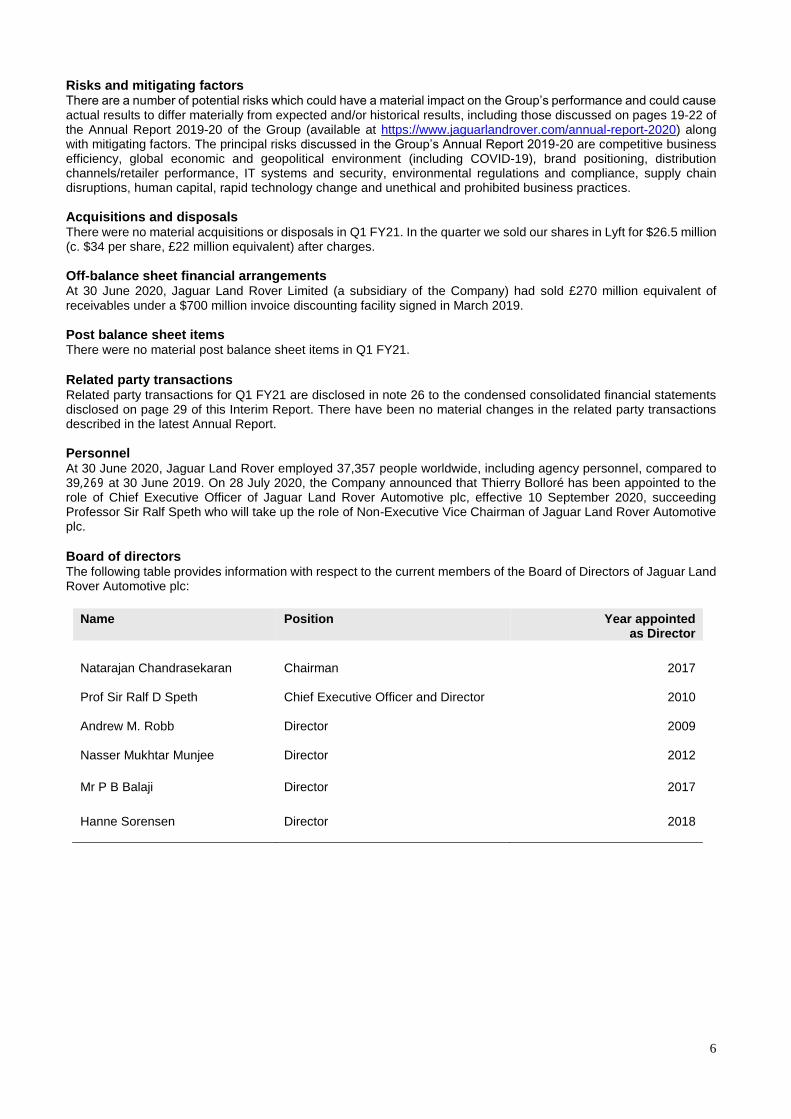
Board of directors The following table provides information with respect to the current members of the Board of Directors of Jaguar Land Rover Automotive plc:
Name
Position
Year appointed as Director
Natarajan Chandrasekaran Prof Sir Ralf D Speth
Chairman Chief Executive Officer and Director
2017
2010 Andrew M. Robb
Director
2009
Nasser Mukhtar Munjee
Director
2012
Mr P B Balaji Director 2017
Hanne Sorensen Director 2018
7
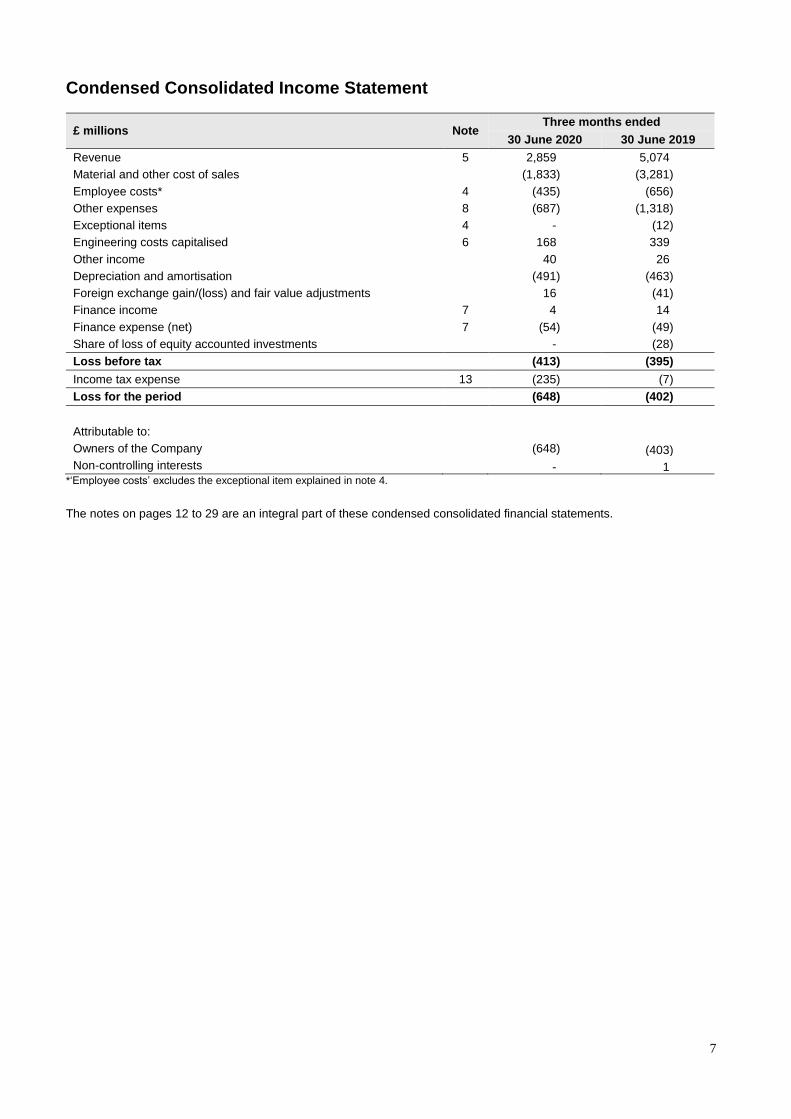
Condensed Consolidated Income Statement
£ millions Note Three months ended
30 June 2020 30 June 2019
Revenue 5 2,859 5,074
Material and other cost of sales (1,833) (3,281)
Employee costs* 4 (435) (656)
Other expenses 8 (687) (1,318)
Exceptional items 4 - (12)
Engineering costs capitalised 6 168 339
Other income 40 26
Depreciation and amortisation (491) (463)
Foreign exchange gain/(loss) and fair value adjustments 16 (41)
Finance income 7 4 14
Finance expense (net) 7 (54) (49)
Share of loss of equity accounted investments - (28)
Loss before tax (413) (395)
Income tax expense 13 (235) (7)
Loss for the period (648) (402)
Attributable to:
Owners of the Company (648) (403)
Non-controlling interests - 1 *‘Employee costs’ excludes the exceptional item explained in note 4. The notes on pages 12 to 29 are an integral part of these condensed consolidated financial statements.
8
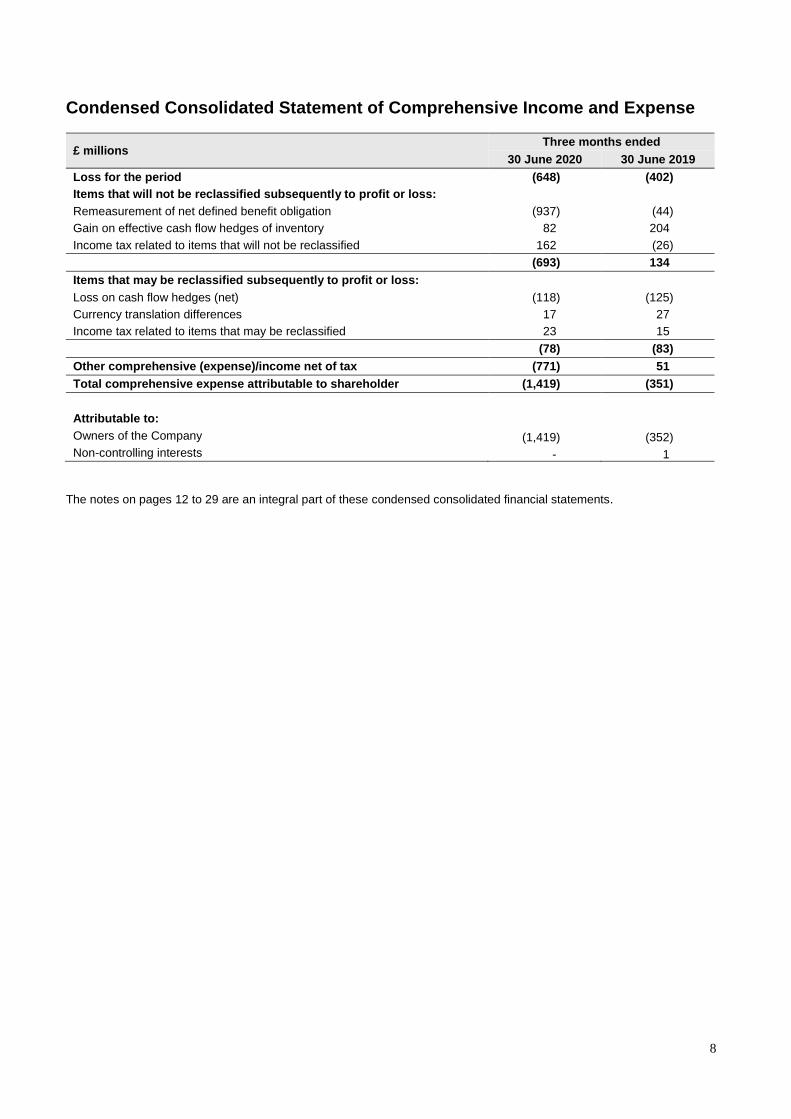
Condensed Consolidated Statement of Comprehensive Income and Expense
£ millions Three months ended
30 June 2020 30 June 2019
Loss for the period (648) (402)
Items that will not be reclassified subsequently to profit or loss:
Remeasurement of net defined benefit obligation (937) (44)
Gain on effective cash flow hedges of inventory 82 204
Income tax related to items that will not be reclassified 162 (26)
(693) 134
Items that may be reclassified subsequently to profit or loss:
Loss on cash flow hedges (net) (118) (125)
Currency translation differences 17 27
Income tax related to items that may be reclassified 23 15
(78) (83)
Other comprehensive (expense)/income net of tax (771) 51
Total comprehensive expense attributable to shareholder (1,419) (351)
Attributable to:
Owners of the Company (1,419) (352)
Non-controlling interests - 1
The notes on pages 12 to 29 are an integral part of these condensed consolidated financial statements.
9
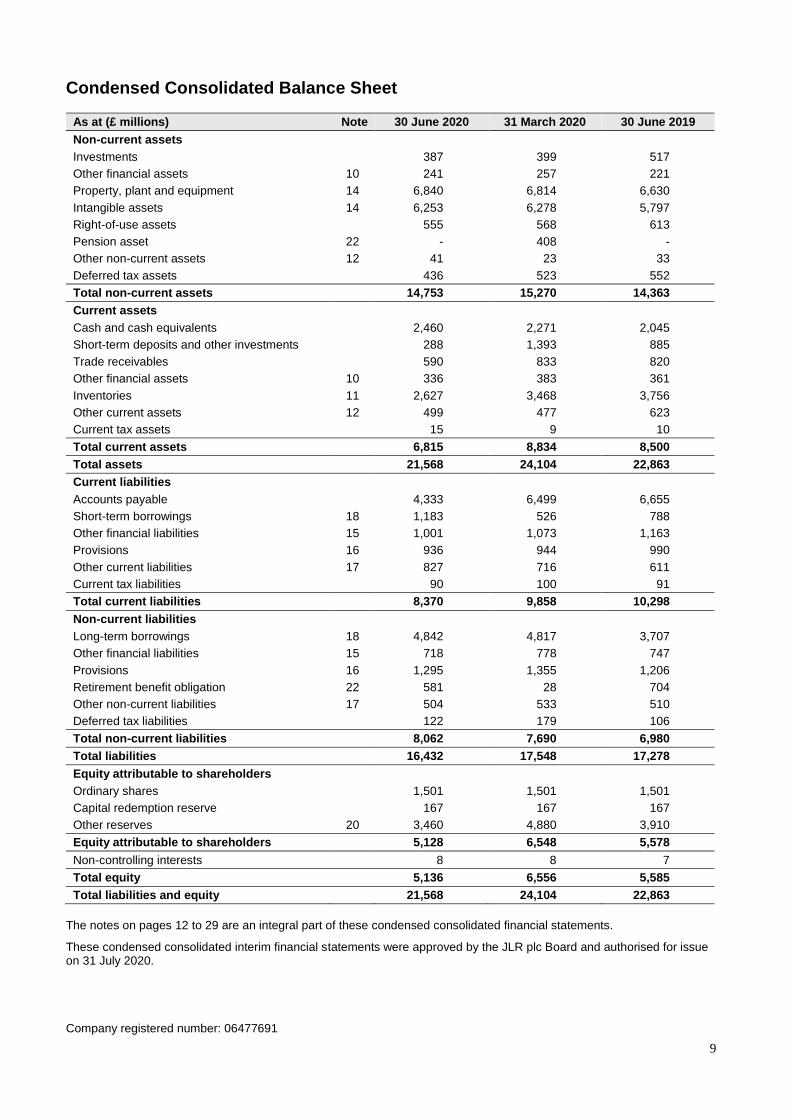
Condensed Consolidated Balance Sheet
As at (£ millions) Note 30 June 2020 31 March 2020 30 June 2019
Non-current assets
Investments 387 399 517
Other financial assets 10 241 257 221
Property, plant and equipment 14 6,840 6,814 6,630
Intangible assets 14 6,253 6,278 5,797
Right-of-use assets 555 568 613
Pension asset 22 - 408 -
Other non-current assets 12 41 23 33
Deferred tax assets 436 523 552
Total non-current assets 14,753 15,270 14,363
Current assets
Cash and cash equivalents 2,460 2,271 2,045
Short-term deposits and other investments 288 1,393 885
Trade receivables 590 833 820
Other financial assets 10 336 383 361
Inventories 11 2,627 3,468 3,756
Other current assets 12 499 477 623
Current tax assets 15 9 10
Total current assets 6,815 8,834 8,500
Total assets 21,568 24,104 22,863
Current liabilities
Accounts payable 4,333 6,499 6,655
Short-term borrowings 18 1,183 526 788
Other financial liabilities 15 1,001 1,073 1,163
Provisions 16 936 944 990
Other current liabilities 17 827 716 611
Current tax liabilities 90 100 91
Total current liabilities 8,370 9,858 10,298
Non-current liabilities
Long-term borrowings 18 4,842 4,817 3,707
Other financial liabilities 15 718 778 747
Provisions 16 1,295 1,355 1,206
Retirement benefit obligation 22 581 28 704
Other non-current liabilities 17 504 533 510
Deferred tax liabilities 122 179 106
Total non-current liabilities 8,062 7,690 6,980
Total liabilities 16,432 17,548 17,278
Equity attributable to shareholders
Ordinary shares 1,501 1,501 1,501
Capital redemption reserve 167 167 167
Other reserves 20 3,460 4,880 3,910
Equity attributable to shareholders 5,128 6,548 5,578
Non-controlling interests 8 8 7
Total equity 5,136 6,556 5,585
Total liabilities and equity 21,568 24,104 22,863
The notes on pages 12 to 29 are an integral part of these condensed consolidated financial statements.
These condensed consolidated interim financial statements were approved by the JLR plc Board and authorised for issue on 31 July 2020.
Company registered number: 06477691
10
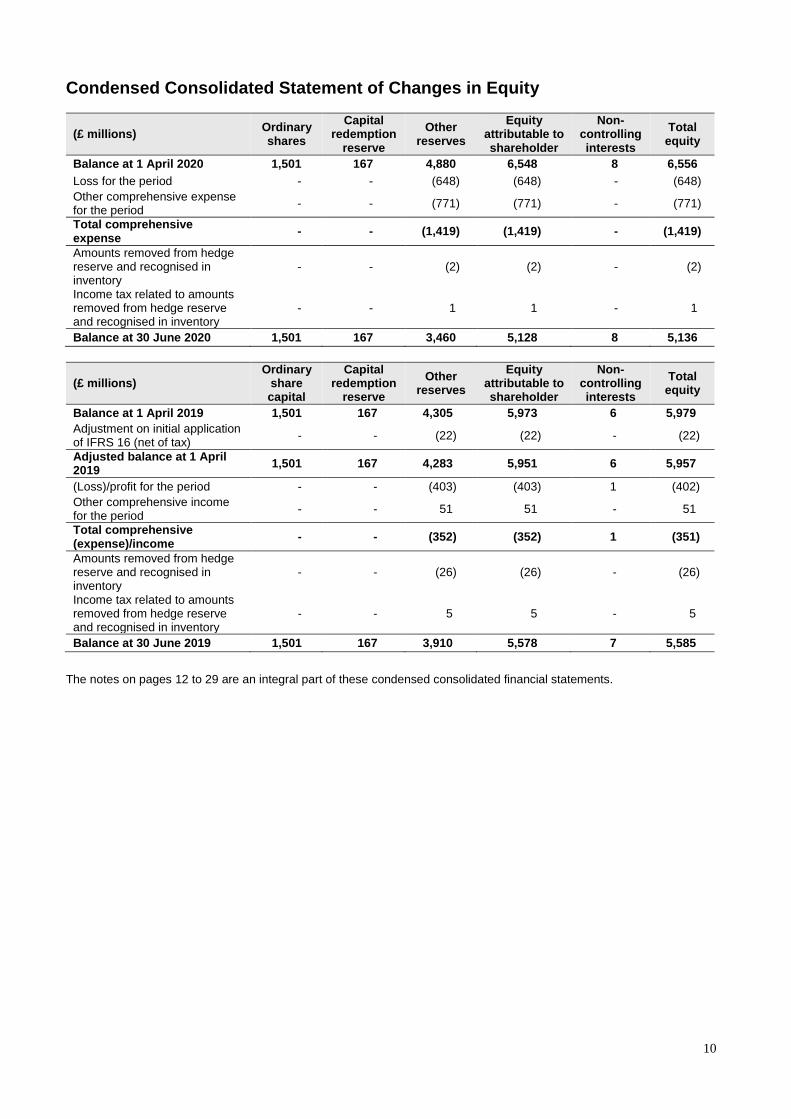
Condensed Consolidated Statement of Changes in Equity
(£ millions) Ordinary shares
Capital redemption
reserve
Other reserves
Equity attributable to shareholder
Non-controlling interests
Total equity
Balance at 1 April 2020 1,501 167 4,880 6,548 8 6,556
Loss for the period - - (648) (648) - (648)
Other comprehensive expense for the period
- - (771) (771) - (771)
Total comprehensive expense
- - (1,419) (1,419) - (1,419)
Amounts removed from hedge reserve and recognised in inventory
- - (2) (2) - (2)
Income tax related to amounts removed from hedge reserve and recognised in inventory
- - 1 1 - 1
Balance at 30 June 2020 1,501 167 3,460 5,128 8 5,136
(£ millions) Ordinary
share capital
Capital redemption
reserve
Other reserves
Equity attributable to shareholder
Non-controlling interests
Total equity
Balance at 1 April 2019 1,501 167 4,305 5,973 6 5,979
Adjustment on initial application of IFRS 16 (net of tax)
- - (22) (22) - (22)
Adjusted balance at 1 April 2019
1,501 167 4,283 5,951 6 5,957
(Loss)/profit for the period - - (403) (403) 1 (402)
Other comprehensive income for the period
- - 51 51 - 51
Total comprehensive (expense)/income
- - (352) (352) 1 (351)
Amounts removed from hedge reserve and recognised in inventory
- - (26) (26) - (26)
Income tax related to amounts removed from hedge reserve and recognised in inventory
- - 5 5 - 5
Balance at 30 June 2019 1,501 167 3,910 5,578 7 5,585
The notes on pages 12 to 29 are an integral part of these condensed consolidated financial statements.
11
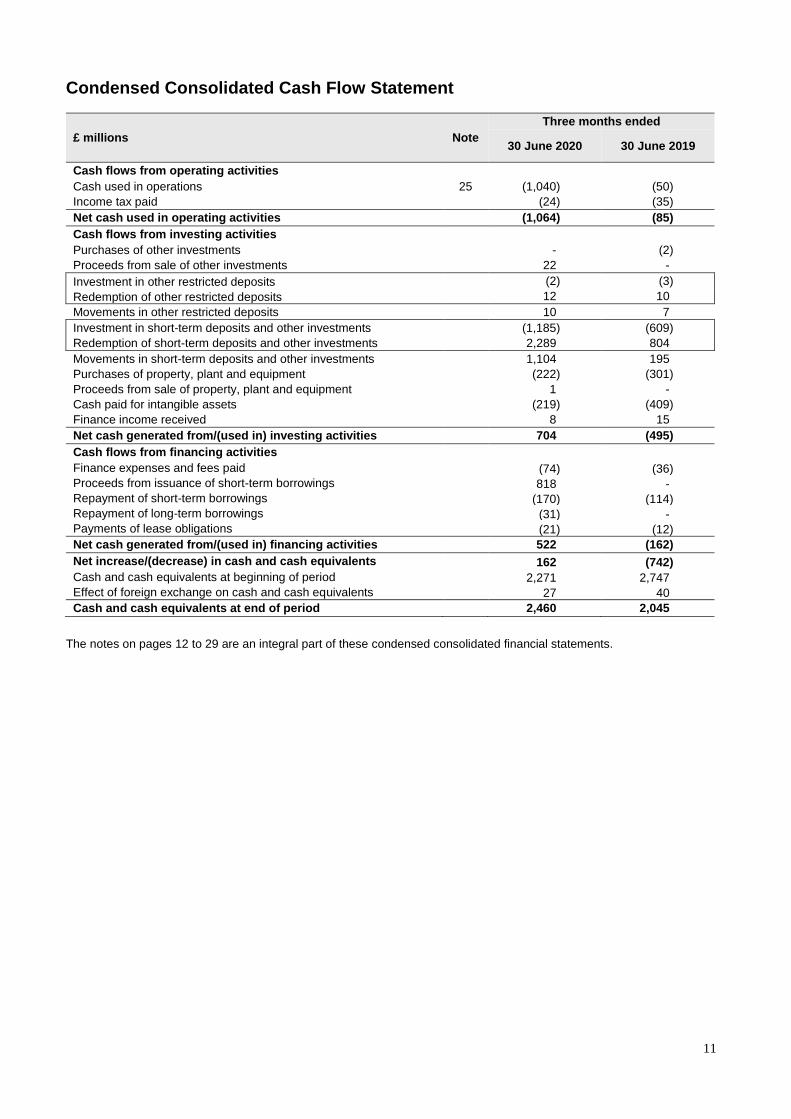
Condensed Consolidated Cash Flow Statement
£ millions Note
Three months ended
30 June 2020 30 June 2019
Cash flows from operating activities
Cash used in operations 25 (1,040) (50)
Income tax paid (24) (35)
Net cash used in operating activities (1,064) (85)
Cash flows from investing activities
Purchases of other investments - (2)
Proceeds from sale of other investments 22 -
Investment in other restricted deposits (2) (3)
Redemption of other restricted deposits 12 10
Movements in other restricted deposits 10 7
Investment in short-term deposits and other investments (1,185) (609)
Redemption of short-term deposits and other investments 2,289 804
Movements in short-term deposits and other investments 1,104 195
Purchases of property, plant and equipment (222) (301)
Proceeds from sale of property, plant and equipment 1 -
Cash paid for intangible assets (219) (409)
Finance income received 8 15
Net cash generated from/(used in) investing activities 704 (495)
Cash flows from financing activities
Finance expenses and fees paid (74) (36)
Proceeds from issuance of short-term borrowings 818 -
Repayment of short-term borrowings (170) (114)
Repayment of long-term borrowings (31) -
Payments of lease obligations (21) (12)
Net cash generated from/(used in) financing activities 522 (162)
Net increase/(decrease) in cash and cash equivalents 162 (742)
Cash and cash equivalents at beginning of period 2,271 2,747
Effect of foreign exchange on cash and cash equivalents 27 40
Cash and cash equivalents at end of period 2,460 2,045
The notes on pages 12 to 29 are an integral part of these condensed consolidated financial statements.
12
Notes (forming part of the condensed consolidated interim financial statements) 1 Accounting policies Basis of preparation
The financial information in these interim financial statements is unaudited and does not constitute statutory accounts as defined in Section 435 of the Companies Act 2006. The condensed consolidated interim financial statements of Jaguar Land Rover Automotive plc have been prepared in accordance with International Accounting Standard 34, ‘Interim Financial Reporting’ under International Financial Reporting Standards (‘IFRS’) as adopted by the European Union ('EU'). The balance sheet and accompanying notes as at 30 June 2019 have been disclosed solely for the information of the users. The condensed consolidated interim financial statements have been prepared on a historical cost basis except for certain financial instruments held at fair value as highlighted in note 19. The condensed consolidated interim financial statements should be read in conjunction with the annual consolidated financial statements for the year ended 31 March 2020, which were prepared in accordance with IFRS as adopted by the EU. The condensed consolidated interim financial statements have been prepared on the going concern basis as set out within the directors’ report of the Group’s Annual Report for the year ended 31 March 2020. The accounting policies applied are consistent with those of the annual consolidated financial statements for the year ended 31 March 2020, as described in those financial statements. Estimates and judgements
The preparation of interim financial statements requires management to make judgements, estimates and assumptions that
affect the application of accounting policies and the reported amounts of assets and liabilities, income and expense. Actual
results may differ from these estimates.
In preparing these condensed interim financial statements, the significant judgements made by management in applying the
Group’s accounting policies and the key sources of estimate uncertainty were the same as those applied to the consolidated
financial statements for the year ended 31 March 2020.
2 Change in accounting policies
There have been no changes in accounting policies applied in the period, and the policies applied are consistent with those of the annual consolidated financial statements for the year ended 31 March 2020.
13
Notes (forming part of the condensed consolidated interim financial statements)
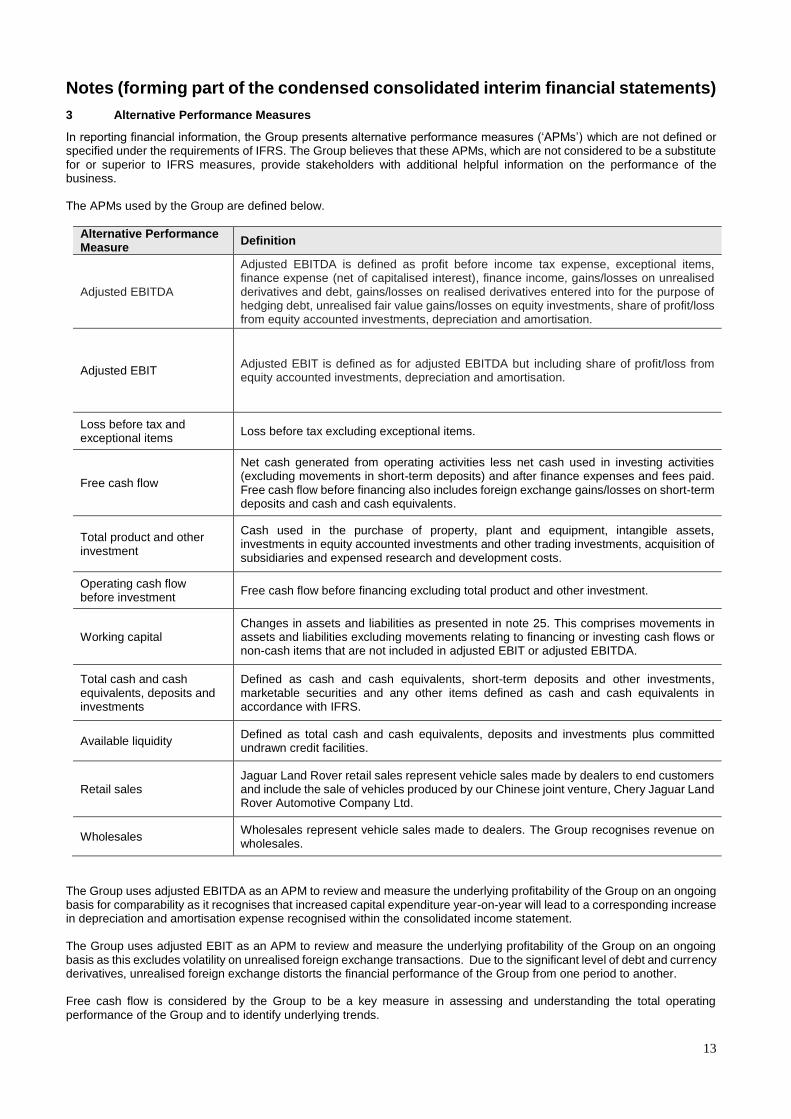
3 Alternative Performance Measures
In reporting financial information, the Group presents alternative performance measures (‘APMs’) which are not defined or specified under the requirements of IFRS. The Group believes that these APMs, which are not considered to be a substitute for or superior to IFRS measures, provide stakeholders with additional helpful information on the performance of the business. The APMs used by the Group are defined below.
Alternative Performance Measure
Definition
Adjusted EBITDA
Adjusted EBITDA is defined as profit before income tax expense, exceptional items, finance expense (net of capitalised interest), finance income, gains/losses on unrealised derivatives and debt, gains/losses on realised derivatives entered into for the purpose of hedging debt, unrealised fair value gains/losses on equity investments, share of profit/loss from equity accounted investments, depreciation and amortisation.
Adjusted EBIT Adjusted EBIT is defined as for adjusted EBITDA but including share of profit/loss from equity accounted investments, depreciation and amortisation.
Loss before tax and exceptional items
Loss before tax excluding exceptional items.
Free cash flow
Net cash generated from operating activities less net cash used in investing activities (excluding movements in short-term deposits) and after finance expenses and fees paid. Free cash flow before financing also includes foreign exchange gains/losses on short-term deposits and cash and cash equivalents.
Total product and other investment
Cash used in the purchase of property, plant and equipment, intangible assets, investments in equity accounted investments and other trading investments, acquisition of subsidiaries and expensed research and development costs.
Operating cash flow before investment
Free cash flow before financing excluding total product and other investment.
Working capital Changes in assets and liabilities as presented in note 25. This comprises movements in assets and liabilities excluding movements relating to financing or investing cash flows or non-cash items that are not included in adjusted EBIT or adjusted EBITDA.
Total cash and cash equivalents, deposits and investments
Defined as cash and cash equivalents, short-term deposits and other investments, marketable securities and any other items defined as cash and cash equivalents in accordance with IFRS.
Available liquidity Defined as total cash and cash equivalents, deposits and investments plus committed undrawn credit facilities.
Retail sales Jaguar Land Rover retail sales represent vehicle sales made by dealers to end customers and include the sale of vehicles produced by our Chinese joint venture, Chery Jaguar Land Rover Automotive Company Ltd.
Wholesales Wholesales represent vehicle sales made to dealers. The Group recognises revenue on wholesales.
The Group uses adjusted EBITDA as an APM to review and measure the underlying profitability of the Group on an ongoing basis for comparability as it recognises that increased capital expenditure year-on-year will lead to a corresponding increase in depreciation and amortisation expense recognised within the consolidated income statement. The Group uses adjusted EBIT as an APM to review and measure the underlying profitability of the Group on an ongoing basis as this excludes volatility on unrealised foreign exchange transactions. Due to the significant level of debt and currency derivatives, unrealised foreign exchange distorts the financial performance of the Group from one period to another.
Free cash flow is considered by the Group to be a key measure in assessing and understanding the total operating performance of the Group and to identify underlying trends.
14
Notes (forming part of the condensed consolidated interim financial statements)
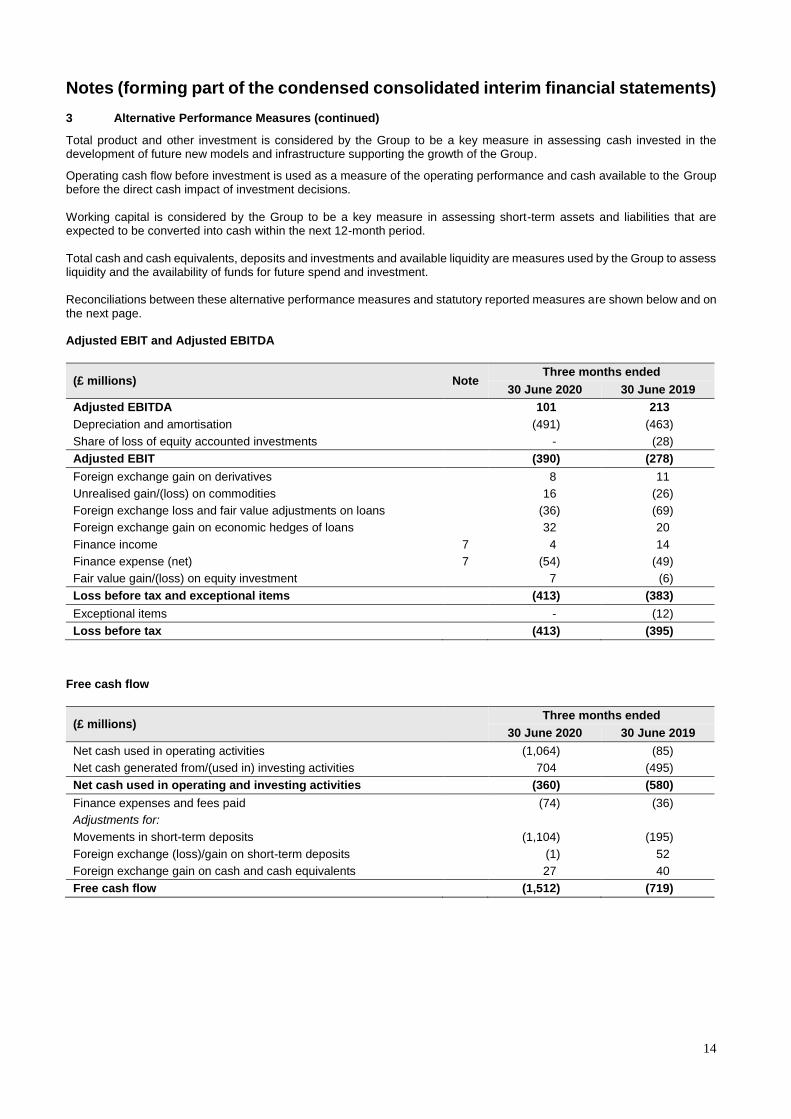
3 Alternative Performance Measures (continued)
Total product and other investment is considered by the Group to be a key measure in assessing cash invested in the development of future new models and infrastructure supporting the growth of the Group.
Operating cash flow before investment is used as a measure of the operating performance and cash available to the Group before the direct cash impact of investment decisions. Working capital is considered by the Group to be a key measure in assessing short-term assets and liabilities that are expected to be converted into cash within the next 12-month period. Total cash and cash equivalents, deposits and investments and available liquidity are measures used by the Group to assess liquidity and the availability of funds for future spend and investment. Reconciliations between these alternative performance measures and statutory reported measures are shown below and on the next page.
Adjusted EBIT and Adjusted EBITDA
(£ millions) Note Three months ended
30 June 2020 30 June 2019
Adjusted EBITDA 101 213
Depreciation and amortisation (491) (463)
Share of loss of equity accounted investments - (28)
Adjusted EBIT (390) (278)
Foreign exchange gain on derivatives 8 11
Unrealised gain/(loss) on commodities 16 (26)
Foreign exchange loss and fair value adjustments on loans (36) (69)
Foreign exchange gain on economic hedges of loans 32 20
Finance income 7 4 14
Finance expense (net) 7 (54) (49)
Fair value gain/(loss) on equity investment 7 (6)
Loss before tax and exceptional items (413) (383)
Exceptional items - (12)
Loss before tax (413) (395)
Free cash flow
(£ millions) Three months ended
30 June 2020 30 June 2019
Net cash used in operating activities (1,064) (85)
Net cash generated from/(used in) investing activities 704 (495)
Net cash used in operating and investing activities (360) (580)
Finance expenses and fees paid (74) (36)
Adjustments for:
Movements in short-term deposits (1,104) (195)
Foreign exchange (loss)/gain on short-term deposits (1) 52
Foreign exchange gain on cash and cash equivalents 27 40
Free cash flow (1,512) (719)
16
Notes (forming part of the condensed consolidated interim financial statements)
3 Alternative Performance Measures (continued)
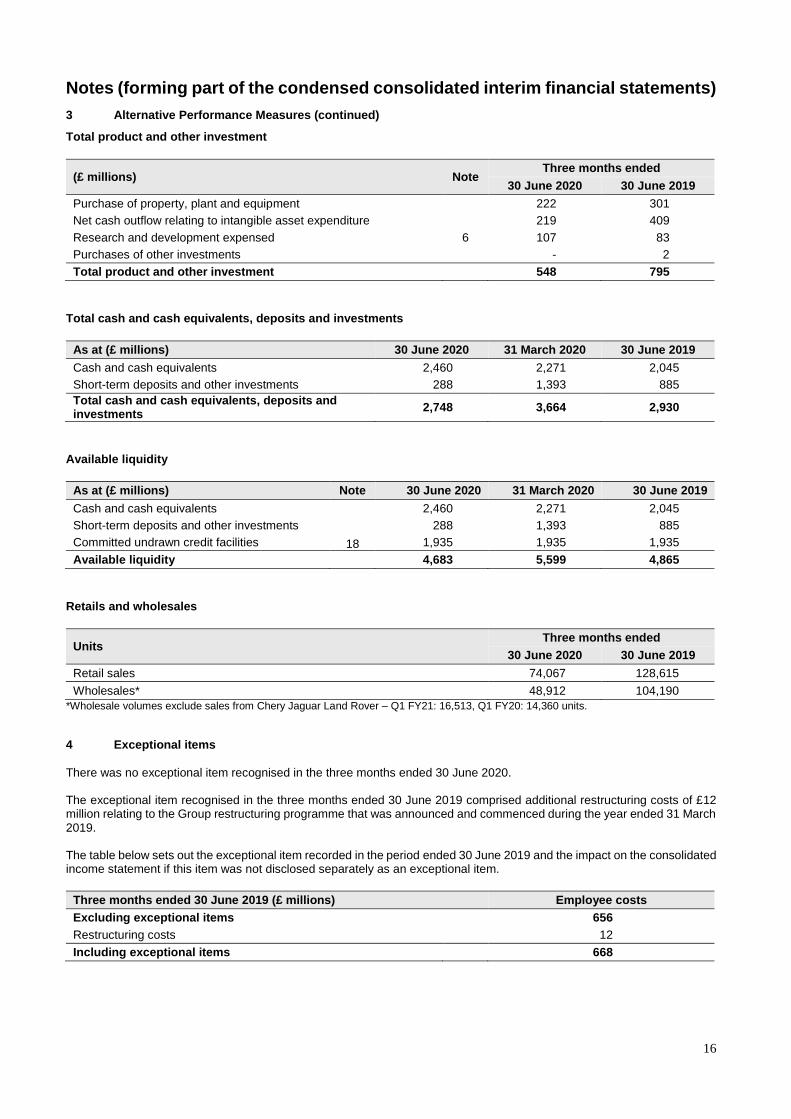
Total product and other investment
(£ millions) Note Three months ended
30 June 2020 30 June 2019
Purchase of property, plant and equipment 222 301
Net cash outflow relating to intangible asset expenditure 219 409
Research and development expensed 6 107 83
Purchases of other investments - 2
Total product and other investment 548 795
Total cash and cash equivalents, deposits and investments
As at (£ millions) 30 June 2020 31 March 2020 30 June 2019
Cash and cash equivalents 2,460 2,271 2,045
Short-term deposits and other investments 288 1,393 885
Total cash and cash equivalents, deposits and investments
2,748 3,664 2,930
Available liquidity
As at (£ millions) Note 30 June 2020 31 March 2020 30 June 2019
Cash and cash equivalents 2,460 2,271 2,045
Short-term deposits and other investments 288 1,393 885
Committed undrawn credit facilities 18 1,935 1,935 1,935
Available liquidity 4,683 5,599 4,865
Retails and wholesales
Units Three months ended
30 June 2020 30 June 2019
Retail sales 74,067 128,615
Wholesales* 48,912 104,190
*Wholesale volumes exclude sales from Chery Jaguar Land Rover – Q1 FY21: 16,513, Q1 FY20: 14,360 units.
4 Exceptional items There was no exceptional item recognised in the three months ended 30 June 2020. The exceptional item recognised in the three months ended 30 June 2019 comprised additional restructuring costs of £12 million relating to the Group restructuring programme that was announced and commenced during the year ended 31 March 2019.
The table below sets out the exceptional item recorded in the period ended 30 June 2019 and the impact on the consolidated income statement if this item was not disclosed separately as an exceptional item.
Three months ended 30 June 2019 (£ millions) Employee costs
Excluding exceptional items 656
Restructuring costs 12
Including exceptional items 668
17
Notes (forming part of the condensed consolidated interim financial statements)
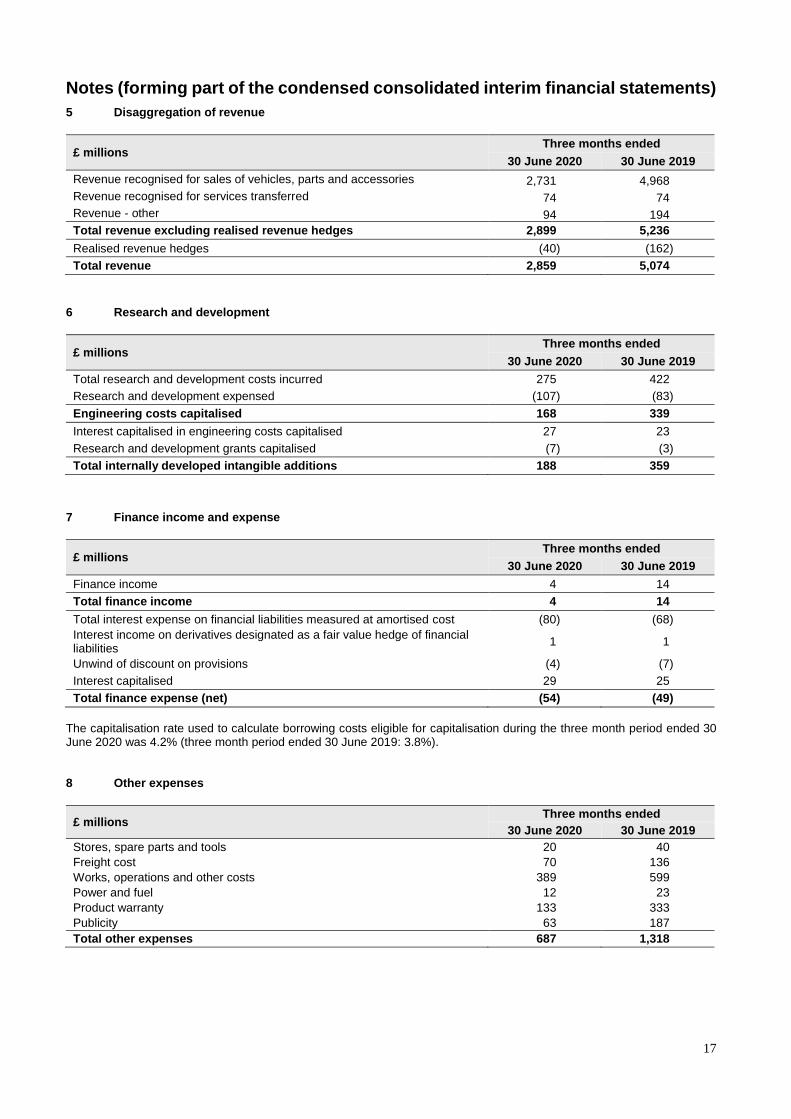
5 Disaggregation of revenue
£ millions Three months ended
30 June 2020 30 June 2019
Revenue recognised for sales of vehicles, parts and accessories 2,731 4,968
Revenue recognised for services transferred 74 74
Revenue - other 94 194
Total revenue excluding realised revenue hedges 2,899 5,236
Realised revenue hedges (40) (162)
Total revenue 2,859 5,074
6 Research and development
£ millions Three months ended
30 June 2020 30 June 2019
Total research and development costs incurred 275 422
Research and development expensed (107) (83)
Engineering costs capitalised 168 339
Interest capitalised in engineering costs capitalised 27 23
Research and development grants capitalised (7) (3)
Total internally developed intangible additions 188 359
7 Finance income and expense
£ millions Three months ended
30 June 2020 30 June 2019
Finance income 4 14
Total finance income 4 14
Total interest expense on financial liabilities measured at amortised cost (80) (68)
Interest income on derivatives designated as a fair value hedge of financial liabilities
1 1
Unwind of discount on provisions (4) (7)
Interest capitalised 29 25
Total finance expense (net) (54) (49)
The capitalisation rate used to calculate borrowing costs eligible for capitalisation during the three month period ended 30 June 2020 was 4.2% (three month period ended 30 June 2019: 3.8%). 8 Other expenses
£ millions Three months ended
30 June 2020 30 June 2019
Stores, spare parts and tools 20 40
Freight cost 70 136
Works, operations and other costs 389 599
Power and fuel 12 23
Product warranty 133 333
Publicity 63 187
Total other expenses 687 1,318
18
Notes (forming part of the condensed consolidated interim financial statements)
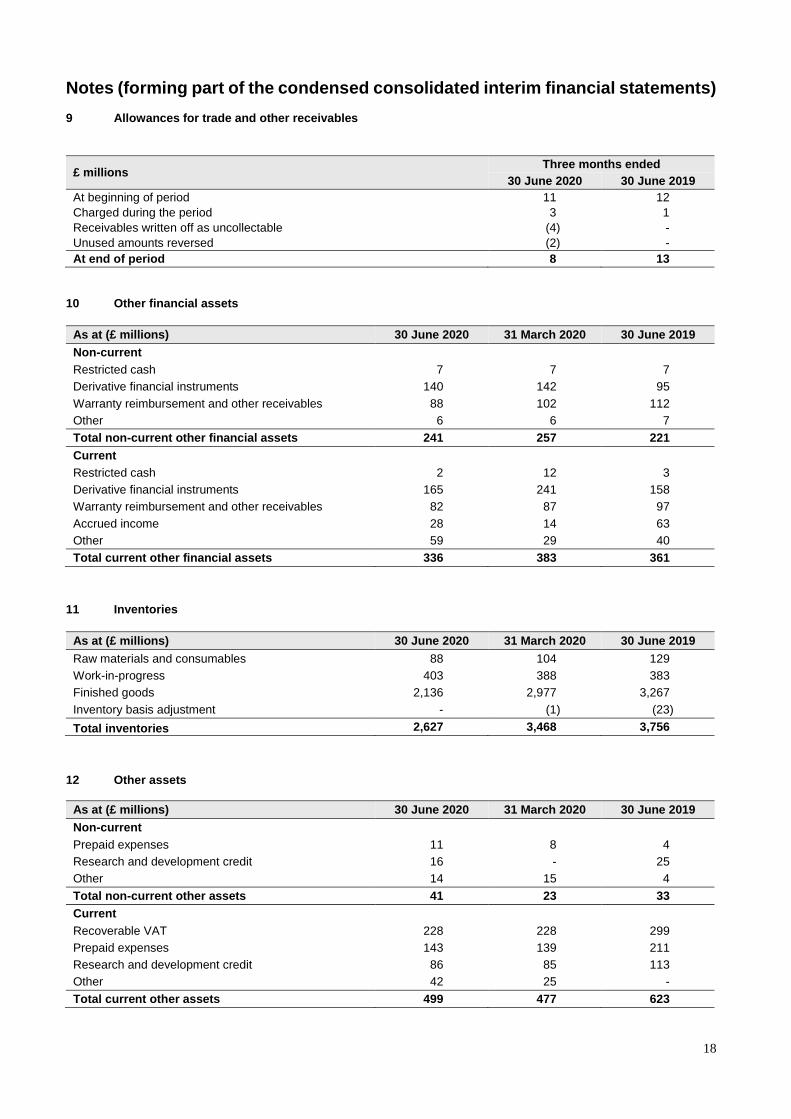
9 Allowances for trade and other receivables
£ millions Three months ended
30 June 2020 30 June 2019
At beginning of period 11 12
Charged during the period 3 1
Receivables written off as uncollectable (4) -
Unused amounts reversed (2) -
At end of period 8 13
10 Other financial assets
As at (£ millions) 30 June 2020 31 March 2020 30 June 2019
Non-current
Restricted cash 7 7 7
Derivative financial instruments 140 142 95
Warranty reimbursement and other receivables 88 102 112
Other 6 6 7
Total non-current other financial assets 241 257 221
Current
Restricted cash 2 12 3
Derivative financial instruments 165 241 158
Warranty reimbursement and other receivables 82 87 97
Accrued income 28 14 63
Other 59 29 40
Total current other financial assets 336 383 361
11 Inventories
As at (£ millions) 30 June 2020 31 March 2020 30 June 2019
Raw materials and consumables 88 104 129
Work-in-progress 403 388 383
Finished goods 2,136 2,977 3,267
Inventory basis adjustment - (1) (23)
Total inventories 2,627 3,468 3,756
12 Other assets
As at (£ millions) 30 June 2020 31 March 2020 30 June 2019
Non-current
Prepaid expenses 11 8 4
Research and development credit 16 - 25
Other 14 15 4
Total non-current other assets 41 23 33
Current
Recoverable VAT 228 228 299
Prepaid expenses 143 139 211
Research and development credit 86 85 113
Other 42 25 -
Total current other assets 499 477 623
19
Notes (forming part of the condensed consolidated interim financial statements)
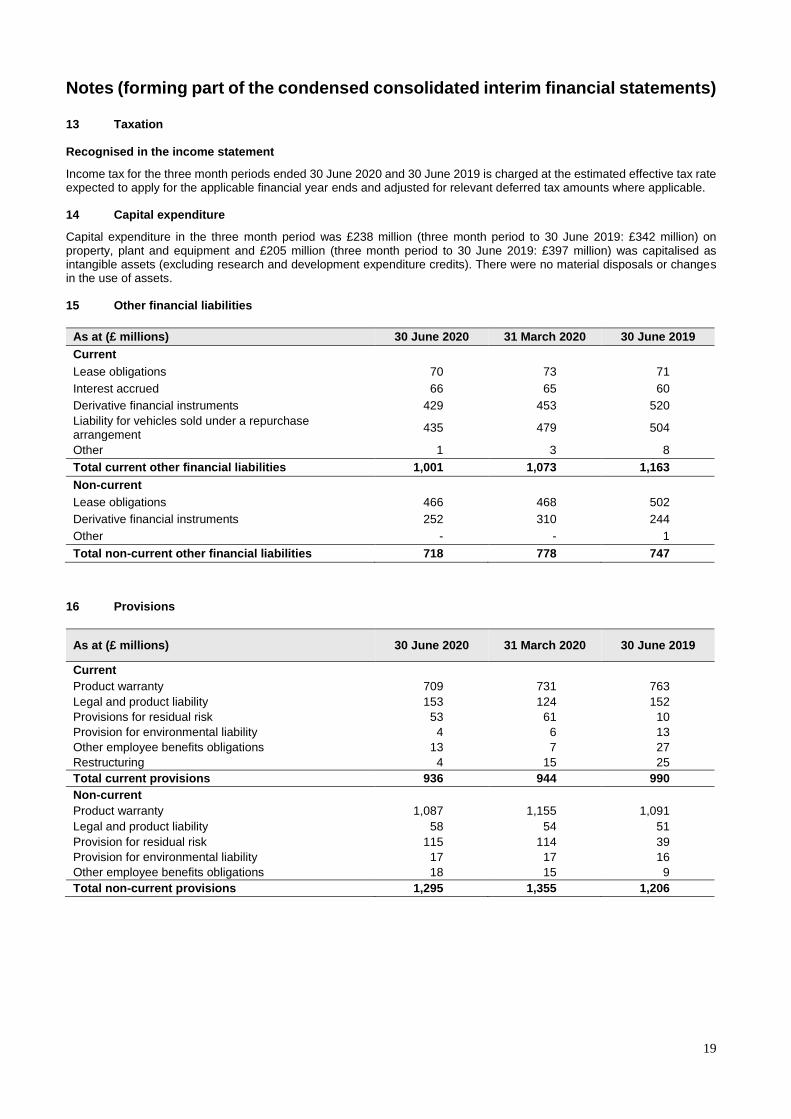
13 Taxation Recognised in the income statement
Income tax for the three month periods ended 30 June 2020 and 30 June 2019 is charged at the estimated effective tax rate expected to apply for the applicable financial year ends and adjusted for relevant deferred tax amounts where applicable. 14 Capital expenditure
Capital expenditure in the three month period was £238 million (three month period to 30 June 2019: £342 million) on property, plant and equipment and £205 million (three month period to 30 June 2019: £397 million) was capitalised as intangible assets (excluding research and development expenditure credits). There were no material disposals or changes in the use of assets. 15 Other financial liabilities
As at (£ millions) 30 June 2020 31 March 2020 30 June 2019
Current Lease obligations 70 73 71
Interest accrued 66 65 60
Derivative financial instruments 429 453 520
Liability for vehicles sold under a repurchase arrangement
435 479 504
Other 1 3 8
Total current other financial liabilities 1,001 1,073 1,163
Non-current
Lease obligations 466 468 502
Derivative financial instruments 252 310 244
Other - - 1
Total non-current other financial liabilities 718 778 747
16 Provisions
As at (£ millions) 30 June 2020 31 March 2020 30 June 2019
Current
Product warranty 709 731 763
Legal and product liability 153 124 152
Provisions for residual risk 53 61 10
Provision for environmental liability 4 6 13
Other employee benefits obligations 13 7 27
Restructuring 4 15 25
Total current provisions 936 944 990
Non-current
Product warranty 1,087 1,155 1,091
Legal and product liability 58 54 51
Provision for residual risk 115 114 39
Provision for environmental liability 17 17 16
Other employee benefits obligations 18 15 9
Total non-current provisions 1,295 1,355 1,206
20
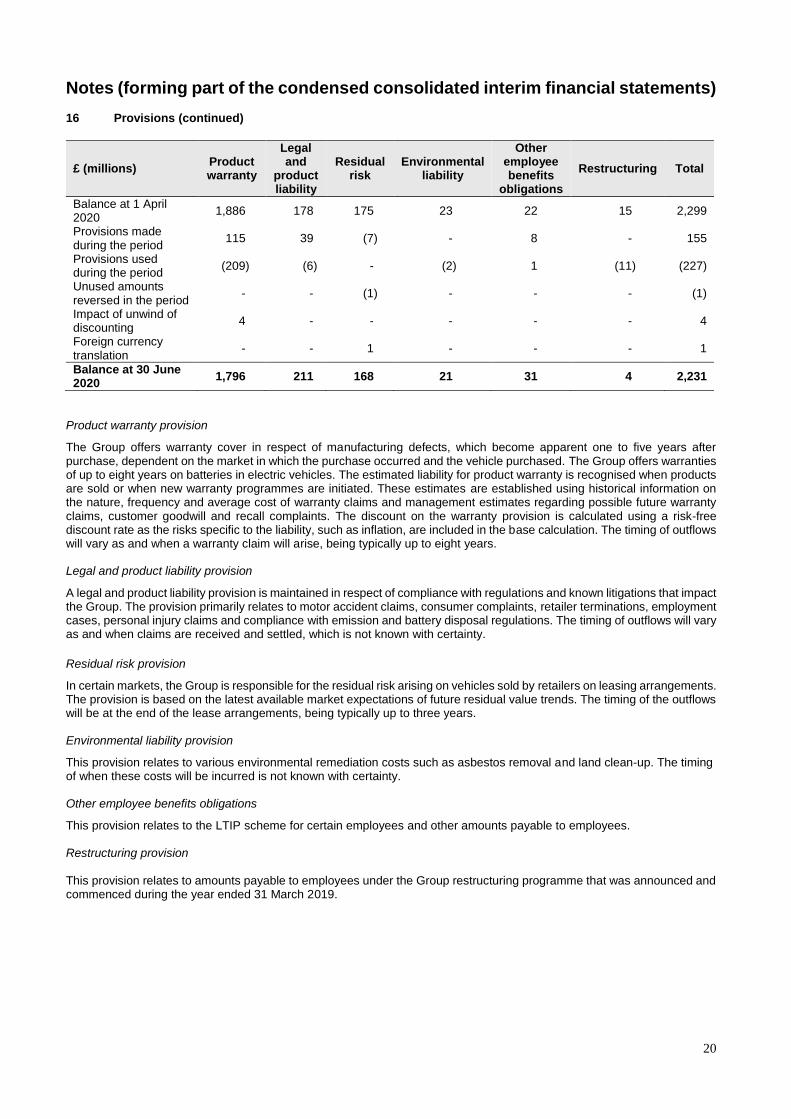
Notes (forming part of the condensed consolidated interim financial statements) 16 Provisions (continued)
£ (millions) Product warranty
Legal and
product liability
Residual risk
Environmental liability
Other employee benefits
obligations
Restructuring Total
Balance at 1 April 2020
1,886 178 175 23 22 15 2,299
Provisions made during the period
115 39 (7) - 8 - 155
Provisions used during the period
(209) (6) - (2) 1 (11) (227)
Unused amounts reversed in the period
- - (1) - - - (1)
Impact of unwind of discounting
4 - - - - - 4
Foreign currency translation
- - 1 - - - 1
Balance at 30 June 2020
1,796 211 168 21 31 4 2,231
Product warranty provision
The Group offers warranty cover in respect of manufacturing defects, which become apparent one to five years after purchase, dependent on the market in which the purchase occurred and the vehicle purchased. The Group offers warranties of up to eight years on batteries in electric vehicles. The estimated liability for product warranty is recognised when products are sold or when new warranty programmes are initiated. These estimates are established using historical information on the nature, frequency and average cost of warranty claims and management estimates regarding possible future warranty claims, customer goodwill and recall complaints. The discount on the warranty provision is calculated using a risk-free discount rate as the risks specific to the liability, such as inflation, are included in the base calculation. The timing of outflows will vary as and when a warranty claim will arise, being typically up to eight years. Legal and product liability provision
A legal and product liability provision is maintained in respect of compliance with regulations and known litigations that impact the Group. The provision primarily relates to motor accident claims, consumer complaints, retailer terminations, employment cases, personal injury claims and compliance with emission and battery disposal regulations. The timing of outflows will vary as and when claims are received and settled, which is not known with certainty.
Residual risk provision
In certain markets, the Group is responsible for the residual risk arising on vehicles sold by retailers on leasing arrangements. The provision is based on the latest available market expectations of future residual value trends. The timing of the outflows will be at the end of the lease arrangements, being typically up to three years. Environmental liability provision
This provision relates to various environmental remediation costs such as asbestos removal and land clean-up. The timing of when these costs will be incurred is not known with certainty. Other employee benefits obligations
This provision relates to the LTIP scheme for certain employees and other amounts payable to employees. Restructuring provision This provision relates to amounts payable to employees under the Group restructuring programme that was announced and commenced during the year ended 31 March 2019.
21
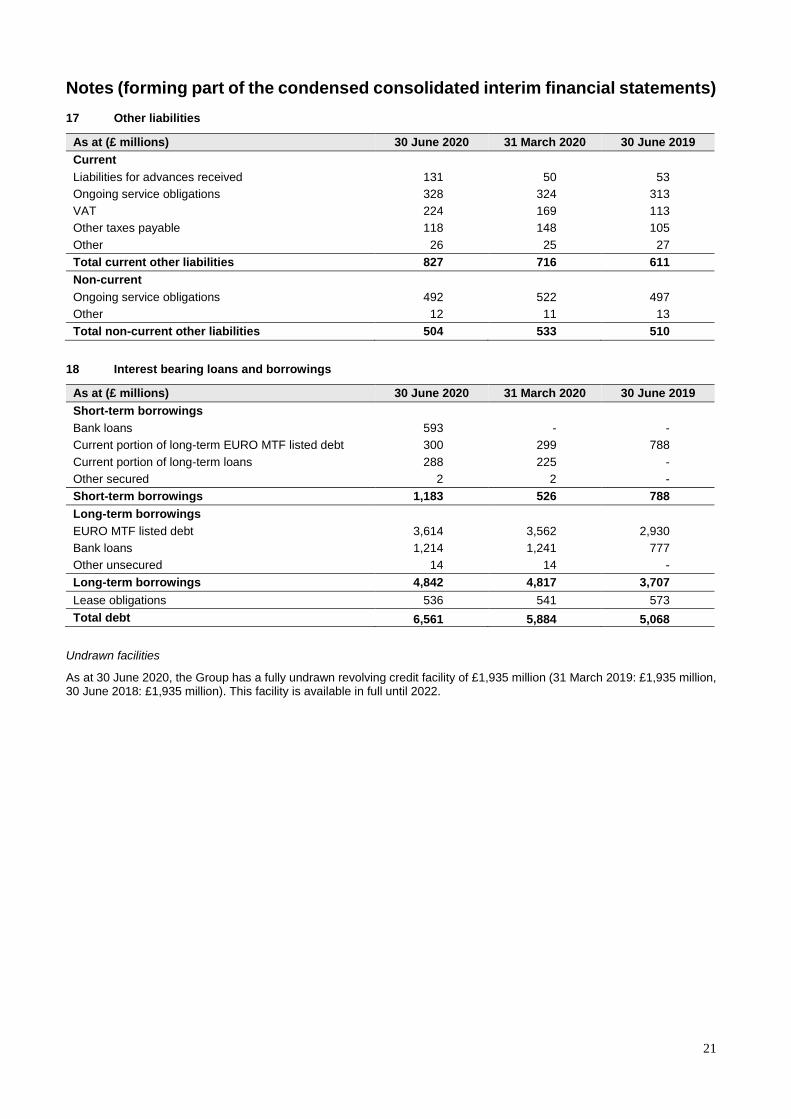
Notes (forming part of the condensed consolidated interim financial statements) 17 Other liabilities
As at (£ millions) 30 June 2020 31 March 2020 30 June 2019
Current Liabilities for advances received 131 50 53
Ongoing service obligations 328 324 313
VAT 224 169 113
Other taxes payable 118 148 105
Other 26 25 27
Total current other liabilities 827 716 611
Non-current
Ongoing service obligations 492 522 497
Other 12 11 13
Total non-current other liabilities 504 533 510
18 Interest bearing loans and borrowings
As at (£ millions) 30 June 2020 31 March 2020 30 June 2019
Short-term borrowings
Bank loans 593 - -
Current portion of long-term EURO MTF listed debt 300 299 788
Current portion of long-term loans 288 225 -
Other secured 2 2 -
Short-term borrowings 1,183 526 788
Long-term borrowings
EURO MTF listed debt 3,614 3,562 2,930
Bank loans 1,214 1,241 777
Other unsecured 14 14 -
Long-term borrowings 4,842 4,817 3,707
Lease obligations 536 541 573
Total debt 6,561 5,884 5,068
Undrawn facilities
As at 30 June 2020, the Group has a fully undrawn revolving credit facility of £1,935 million (31 March 2019: £1,935 million, 30 June 2018: £1,935 million). This facility is available in full until 2022.
22
Notes (forming part of the condensed consolidated interim financial statements)
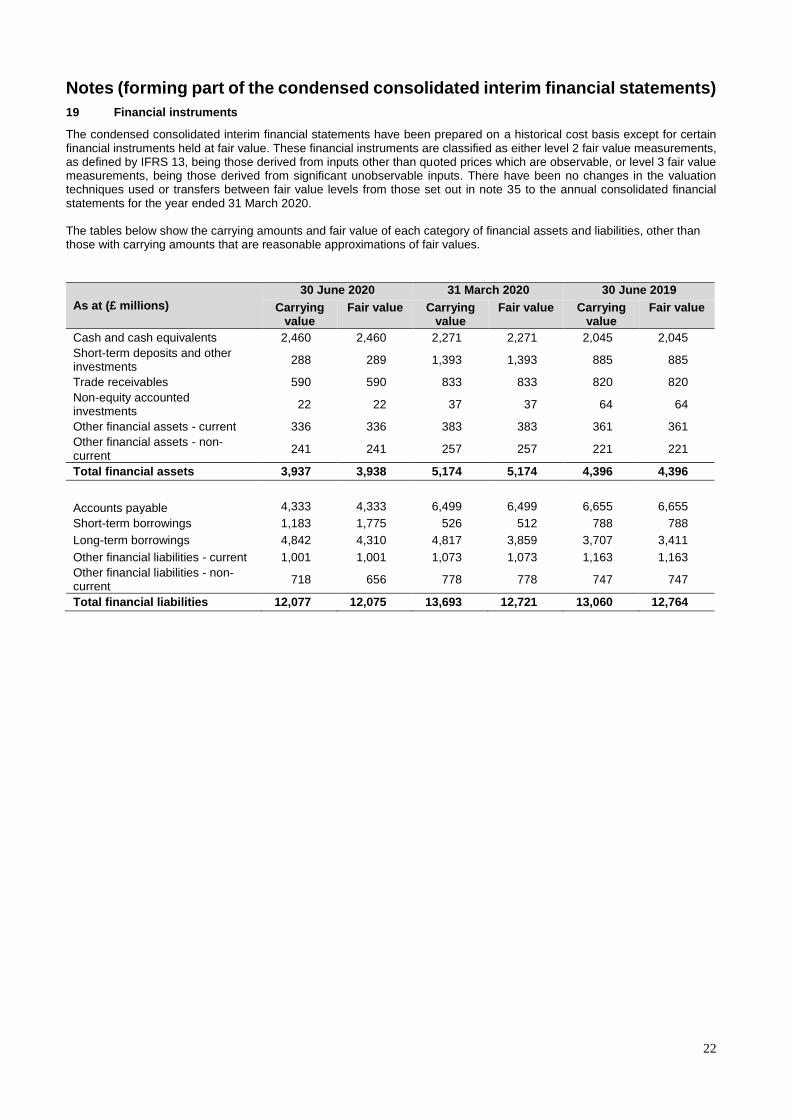
19 Financial instruments
The condensed consolidated interim financial statements have been prepared on a historical cost basis except for certain financial instruments held at fair value. These financial instruments are classified as either level 2 fair value measurements, as defined by IFRS 13, being those derived from inputs other than quoted prices which are observable, or level 3 fair value measurements, being those derived from significant unobservable inputs. There have been no changes in the valuation techniques used or transfers between fair value levels from those set out in note 35 to the annual consolidated financial statements for the year ended 31 March 2020.
The tables below show the carrying amounts and fair value of each category of financial assets and liabilities, other than those with carrying amounts that are reasonable approximations of fair values.
As at (£ millions)
30 June 2020 31 March 2020 30 June 2019
Carrying value
Fair value Carrying value
Fair value Carrying value
Fair value
Cash and cash equivalents 2,460 2,460 2,271 2,271 2,045 2,045
Short-term deposits and other investments
288 289 1,393 1,393 885 885
Trade receivables 590 590 833 833 820 820
Non-equity accounted investments
22 22 37 37 64 64
Other financial assets - current 336 336 383 383 361 361
Other financial assets - non-current
241 241 257 257 221 221
Total financial assets 3,937 3,938 5,174 5,174 4,396 4,396
Accounts payable 4,333 4,333 6,499 6,499 6,655 6,655
Short-term borrowings 1,183 1,775 526 512 788 788
Long-term borrowings 4,842 4,310 4,817 3,859 3,707 3,411
Other financial liabilities - current 1,001 1,001 1,073 1,073 1,163 1,163
Other financial liabilities - non-current
718 656 778 778 747 747
Total financial liabilities 12,077 12,075 13,693 12,721 13,060 12,764
23
Notes (forming part of the condensed consolidated interim financial statements)
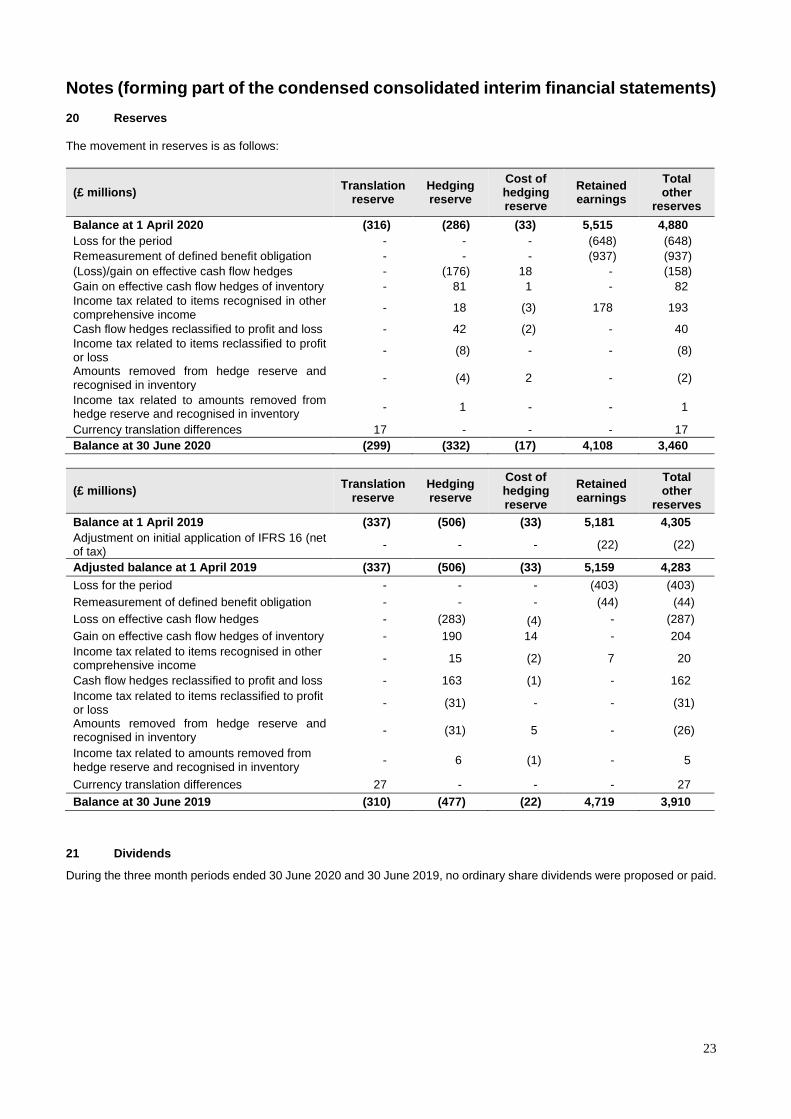
20 Reserves The movement in reserves is as follows:
(£ millions) Translation
reserve Hedging reserve
Cost of hedging reserve
Retained earnings
Total other
reserves
Balance at 1 April 2020 (316) (286) (33) 5,515 4,880
Loss for the period - - - (648) (648)
Remeasurement of defined benefit obligation - - - (937) (937)
(Loss)/gain on effective cash flow hedges - (176) 18 - (158)
Gain on effective cash flow hedges of inventory - 81 1 - 82
Income tax related to items recognised in other comprehensive income
- 18 (3) 178 193
Cash flow hedges reclassified to profit and loss - 42 (2) - 40
Income tax related to items reclassified to profit or loss
- (8) - - (8)
Amounts removed from hedge reserve and recognised in inventory
- (4) 2 - (2)
Income tax related to amounts removed from hedge reserve and recognised in inventory
- 1 - - 1
Currency translation differences 17 - - - 17
Balance at 30 June 2020 (299) (332) (17) 4,108 3,460
(£ millions) Translation
reserve Hedging reserve
Cost of hedging reserve
Retained earnings
Total other
reserves
Balance at 1 April 2019 (337) (506) (33) 5,181 4,305
Adjustment on initial application of IFRS 16 (net of tax)
- - - (22) (22)
Adjusted balance at 1 April 2019 (337) (506) (33) 5,159 4,283
Loss for the period - - - (403) (403)
Remeasurement of defined benefit obligation - - - (44) (44)
Loss on effective cash flow hedges - (283) (4) - (287)
Gain on effective cash flow hedges of inventory - 190 14 - 204
Income tax related to items recognised in other comprehensive income
- 15 (2) 7 20
Cash flow hedges reclassified to profit and loss - 163 (1) - 162
Income tax related to items reclassified to profit or loss
- (31) - - (31)
Amounts removed from hedge reserve and recognised in inventory
- (31) 5 - (26)
Income tax related to amounts removed from hedge reserve and recognised in inventory
- 6 (1) - 5
Currency translation differences 27 - - - 27
Balance at 30 June 2019 (310) (477) (22) 4,719 3,910
21 Dividends
During the three month periods ended 30 June 2020 and 30 June 2019, no ordinary share dividends were proposed or paid.
24
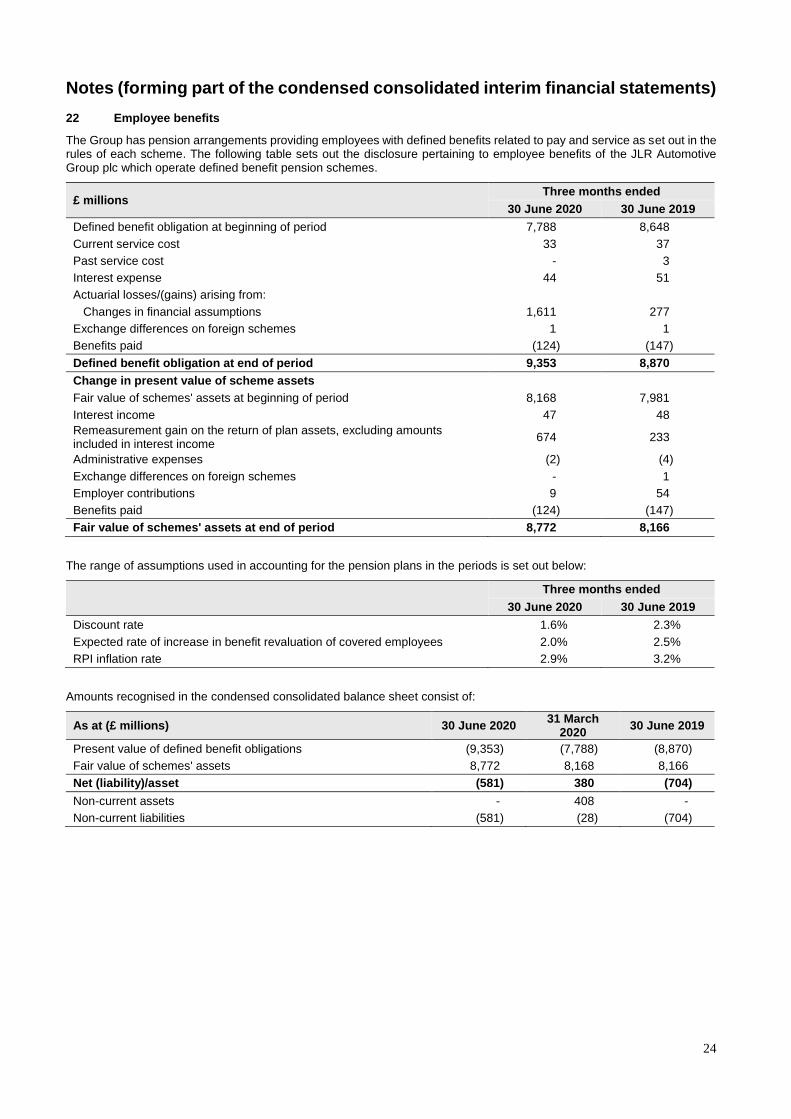
Notes (forming part of the condensed consolidated interim financial statements) 22 Employee benefits
The Group has pension arrangements providing employees with defined benefits related to pay and service as set out in the rules of each scheme. The following table sets out the disclosure pertaining to employee benefits of the JLR Automotive Group plc which operate defined benefit pension schemes.
£ millions Three months ended
30 June 2020 30 June 2019
Defined benefit obligation at beginning of period 7,788 8,648
Current service cost 33 37
Past service cost - 3
Interest expense 44 51
Actuarial losses/(gains) arising from:
Changes in financial assumptions 1,611 277
Exchange differences on foreign schemes 1 1
Benefits paid (124) (147)
Defined benefit obligation at end of period 9,353 8,870
Change in present value of scheme assets
Fair value of schemes' assets at beginning of period 8,168 7,981
Interest income 47 48
Remeasurement gain on the return of plan assets, excluding amounts included in interest income
674 233
Administrative expenses (2) (4)
Exchange differences on foreign schemes - 1
Employer contributions 9 54
Benefits paid (124) (147)
Fair value of schemes' assets at end of period 8,772 8,166
The range of assumptions used in accounting for the pension plans in the periods is set out below:
Three months ended
30 June 2020 30 June 2019
Discount rate 1.6% 2.3%
Expected rate of increase in benefit revaluation of covered employees 2.0% 2.5%
RPI inflation rate 2.9% 3.2%
Amounts recognised in the condensed consolidated balance sheet consist of:
As at (£ millions) 30 June 2020 31 March
2020 30 June 2019
Present value of defined benefit obligations (9,353) (7,788) (8,870)
Fair value of schemes' assets 8,772 8,168 8,166
Net (liability)/asset (581) 380 (704)
Non-current assets - 408 -
Non-current liabilities (581) (28) (704)
25
Notes (forming part of the condensed consolidated interim financial statements) 22 Employee benefits (continued)
For the valuations at 30 June 2020 and 31 March 2020, the mortality assumptions used are the SAPS base table, in particular S2PxA tables and the Light table for members of the Jaguar Executive Pension Plan. For the Jaguar Pension Plan, scaling factors of 111 per cent to 117 per cent have been used for male members and scaling factors of 101 per cent to 112 per cent have been used for female members. For the Land Rover Pension Scheme, scaling factors of 107 per cent to 111 per cent have been used for male members and scaling factors of 101 per cent to 109 per cent have been used for female members. For the Jaguar Executive Pension Plan, an average scaling factor of 94 per cent has been used for male members and a scaling factor of 84 per cent has been used for female members. There is an allowance for future improvements in line with the CMI (2019) projections and an allowance for long-term improvements of 1.25 per cent per annum and a smoothing parameter of 7.5. For the valuations at 30 June 2019, the mortality assumptions used are the SAPS base table, in particular S2PxA tables and the Light table for members of the Jaguar Executive Pension Plan. Scaling factors of 112 per cent to 118 per cent for males and 101 per cent to 112 per cent for females have been used for the Jaguar Pension Plan, 107 per cent to 112 per cent for males and 101 per cent to 109 per cent for females for the Land Rover Pension Scheme, and 94 per cent for males and 84 per cent for females for the Jaguar Executive Pension Plan. There is an allowance for future improvements in line with the CMI (2018) projections and an allowance for long-term improvements of 1.25 per cent per annum. A past service cost of £4 million was recognised in the year ended 31 March 2020, and £3 million was recognised in the three month period ended 30 June 2019 as part of the Group restructuring program that commenced in the year ended 31 March 2019. 23 Commitments and contingencies
In the normal course of business, the Group faces claims and assertions by various parties. The Group assesses such claims and assertions and monitors the legal environment on an ongoing basis, with the assistance of external legal counsel wherever necessary. The Group records a liability for any claims where a potential loss is probable and capable of being estimated and discloses such matters in its financial statements, if material. For potential losses that are considered possible, but not probable, the Group provides disclosure in the consolidated financial statements but does not record a liability unless the loss becomes probable. Such potential losses may be of an uncertain timing and/or amount. The following is a description of claims and contingencies where a potential loss is possible, but not probable. Management believes that none of the contingencies described below, either individually or in aggregate, would have a material adverse effect on the Group’s financial condition, results of operations or cash flows. Litigation and product related matters The Group is involved in legal proceedings, both as plaintiff and as defendant. There are claims and potential claims of £32 million (31 March 2020: £40 million, 30 June 2019: £19 million) against the Group which management has not recognised, as settlement is not considered probable. These claims and potential claims pertain to motor accident claims, consumer complaints, employment and dealership arrangements, replacement of parts of vehicles and/or compensation for deficiency in the services by the Group or its dealers.
The Group has provided for the estimated cost of repair following the passenger safety airbag issue in the United States, China, Canada, Korea, Australia and Japan. The Group recognises that there is a potential risk of further recalls in the future; however, the Group is unable at this point in time to reliably estimate the amount and timing of any potential future costs associated with this warranty issue. Other taxes and duties Contingencies and commitments include tax contingent liabilities of £135 million (31 March 2020: £44 million, 30 June 2019: £46 million). These mainly relate to tax audits and tax litigation claims.
26
Notes (forming part of the condensed consolidated interim financial statements)
23 Commitments and contingencies (continued)
Commitments The Group has entered into various contracts with vendors and contractors for the acquisition of plant and equipment and various civil contracts of capital nature aggregating to £1,333 million (31 March 2020: £1,217 million, 30 June 2019: £1,164 million) and £9 million (31 March 2020: £14 million, 30 June 2019: £24 million) relating to the acquisition of intangible assets. Commitments and contingencies also includes other contingent liabilities of £375 million (31 March 2020: £376 million, 30 June 2019: £393 million) relating to contractual claims and commitments. The timing of any outflow will vary as and when claims are received and settled, which is not known with certainty. The remaining financial commitments, in particular the purchase commitments and guarantees, are of a magnitude typical for the industry. Inventory with a carrying amount of £206 million (31 March 2020: £127 million, 30 June 2019: £nil), trade receivables with a carrying amount of £17 million (31 March 2020: £nil, 30 June 2019: £nil), property, plant and equipment with a carrying amount of £nil (31 March 2020, 30 June 2019: £nil) restricted cash with a carrying amount of £nil (31 March 2020, 30 June 2019: £nil), and other financial assets with a carrying amount of £20 million (31 March 2020, 30 June 2019: £nil) are pledged as collateral/security against the borrowings and commitments. Stipulated within the joint venture agreement for Chery Jaguar Land Rover Automotive Co. Ltd, and subsequently amended by a change to the Articles of Association of Chery Jaguar Land Rover Automotive Co. Ltd. is a commitment for the Group to contribute a total of CNY 5,000 million of capital. Of this amount, CNY 3,475 million has been contributed as at 30 June 2020. The outstanding commitment of CNY 1,525 million translates to £176 million at the 30 June 2020 exchange rate. At 30 June 2019, the outstanding commitment was CNY 2,125 million (£244 million at the 30 June 2019 exchange rate) restated to reflect an additional CNY 1,500 million that was committed during the year ended 31 March 2017. The Group’s share of capital commitments of its joint venture at 30 June 2020 is £55 million (31 March 2020: £69 million, 30 June 2019: £100 million) and contingent liabilities of its joint venture at 30 June 2020 is £nil (31 March 2020: £nil, 30 June 2019: £nil). 24 Capital Management
The Group’s objectives when managing capital are to ensure the going concern operation of all subsidiary companies within the Group and to maintain an efficient capital structure to support ongoing and future operations of the Group and to meet shareholder expectations.
The Group issues debt, primarily in the form of bonds, to meet anticipated funding requirements and maintain sufficient liquidity. The Group also maintains certain undrawn committed credit facilities to provide additional liquidity. These borrowings, together with cash generated from operations, are loaned internally or contributed as equity to certain subsidiaries as required. Surplus cash in subsidiaries is pooled (where practicable) and invested to satisfy security, liquidity and yield requirements.
The capital structure and funding requirements are regularly monitored by the JLR plc Board to ensure sufficient liquidity is maintained by the Group. All debt issuance and capital distributions are approved by the JLR plc Board.
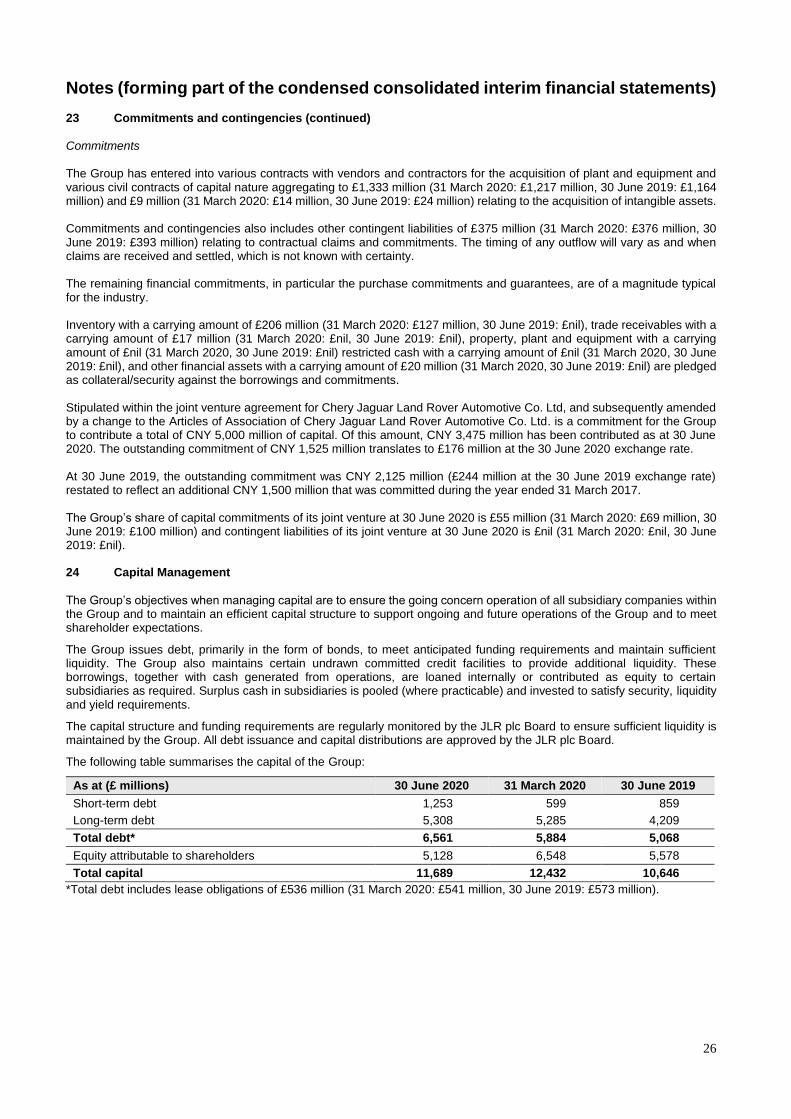
The following table summarises the capital of the Group:
As at (£ millions) 30 June 2020 31 March 2020 30 June 2019
Short-term debt 1,253 599 859
Long-term debt 5,308 5,285 4,209
Total debt* 6,561 5,884 5,068
Equity attributable to shareholders 5,128 6,548 5,578
Total capital 11,689 12,432 10,646
*Total debt includes lease obligations of £536 million (31 March 2020: £541 million, 30 June 2019: £573 million).

27
Notes (forming part of the condensed consolidated interim financial statements) 25 Notes to the consolidated cash flow statement Reconciliation of loss for the period to cash used in operations
£ millions Three months ended
30 June 2020 30 June 2019
Cash flows from operating activities
Loss for the period (648) (402)
Adjustments for:
Depreciation and amortisation 491 463
Profit on disposal of assets (1) -
Foreign exchange loss on loans 36 69
Income tax expense 235 7
Finance expense (net) 54 49
Finance income (4) (14)
Foreign exchange gain on economic hedges of loans (32) (20)
Foreign exchange gain on derivatives (8) (11)
Foreign exchange loss/(gain) on short-term deposits and investments 1 (52)
Foreign exchange gain on cash and cash equivalents (27) (39)
Unrealised (gain)/loss on commodities (16) 26
(Gain)/loss on matured revenue hedges (6) 33
Share of loss of equity accounted investments - 28
Fair value (gain)/loss on equity investments (7) 6
Exceptional items - 12
Other non-cash adjustments 1 (1)
Cash flows from operating activities before changes in assets and liabilities
69 154
Trade receivables 244 544
Other financial assets 12 (39)
Other current assets (24) (57)
Inventories 841 (162)
Other non-current assets 399 (32)
Accounts payable (2,167) (464)
Other current liabilities 113 (54)
Other financial liabilities (42) 26
Other non-current liabilities and retirement benefit obligation (413) (17)
Provisions (72) 51
Cash used in operations (1,040) (50)
28
Notes (forming part of the condensed consolidated interim financial statements)
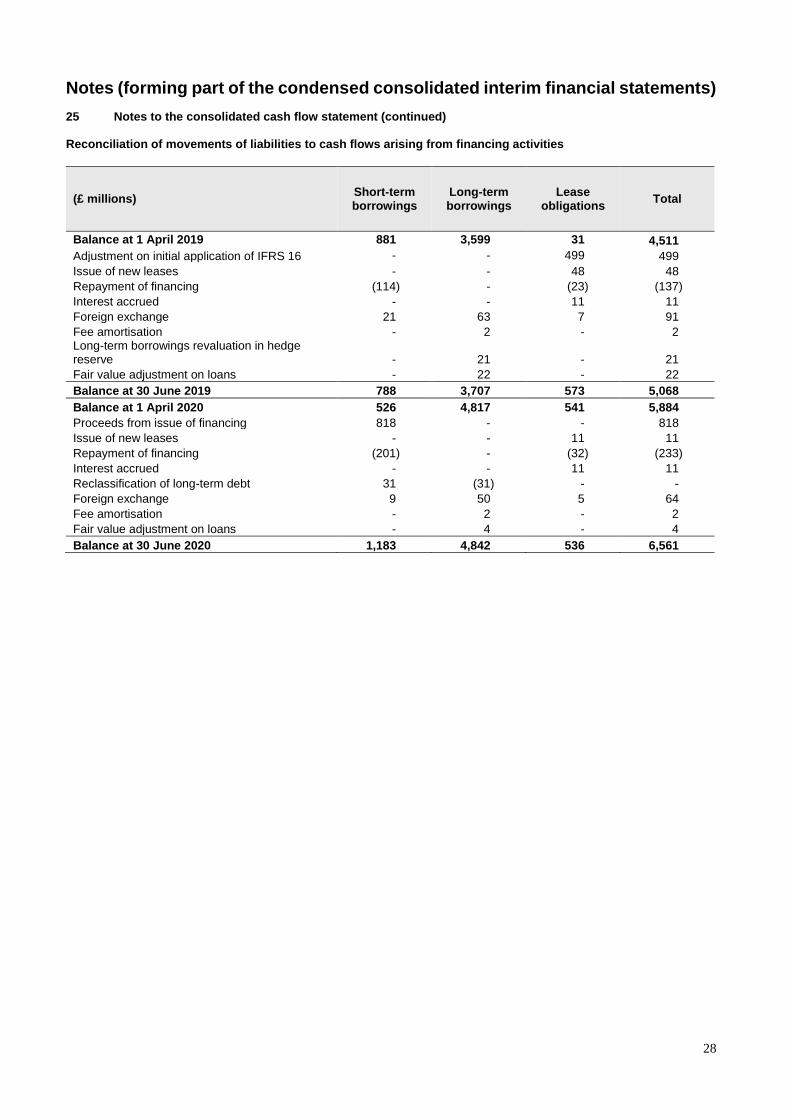
25 Notes to the consolidated cash flow statement (continued) Reconciliation of movements of liabilities to cash flows arising from financing activities
(£ millions) Short-term borrowings
Long-term borrowings
Lease obligations
Total
Balance at 1 April 2019 881 3,599 31 4,511
Adjustment on initial application of IFRS 16 - - 499 499
Issue of new leases - - 48 48
Repayment of financing (114) - (23) (137)
Interest accrued - - 11 11
Foreign exchange 21 63 7 91
Fee amortisation - 2 - 2 Long-term borrowings revaluation in hedge reserve - 21 - 21
Fair value adjustment on loans - 22 - 22
Balance at 30 June 2019 788 3,707 573 5,068
Balance at 1 April 2020 526 4,817 541 5,884
Proceeds from issue of financing 818 - - 818
Issue of new leases - - 11 11
Repayment of financing (201) - (32) (233)
Interest accrued - - 11 11
Reclassification of long-term debt 31 (31) - -
Foreign exchange 9 50 5 64
Fee amortisation - 2 - 2
Fair value adjustment on loans - 4 - 4
Balance at 30 June 2020 1,183 4,842 536 6,561
29
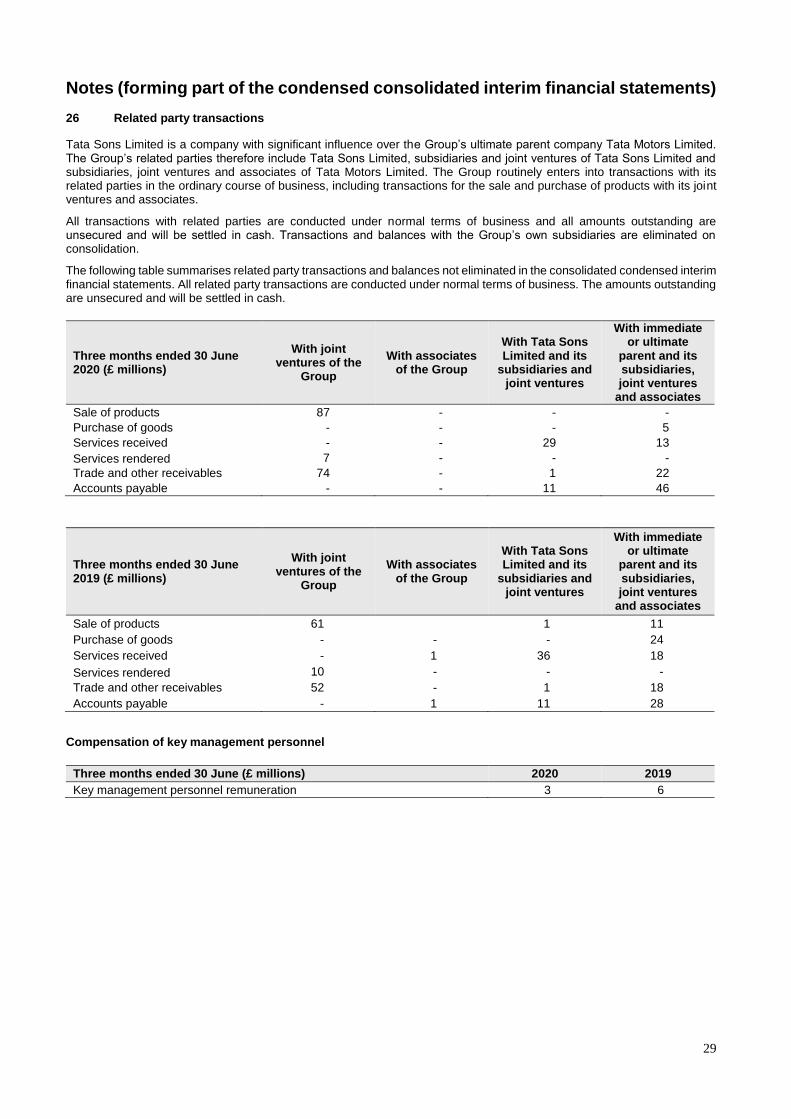
Notes (forming part of the condensed consolidated interim financial statements) 26 Related party transactions
Tata Sons Limited is a company with significant influence over the Group’s ultimate parent company Tata Motors Limited. The Group’s related parties therefore include Tata Sons Limited, subsidiaries and joint ventures of Tata Sons Limited and subsidiaries, joint ventures and associates of Tata Motors Limited. The Group routinely enters into transactions with its related parties in the ordinary course of business, including transactions for the sale and purchase of products with its joint ventures and associates.
All transactions with related parties are conducted under normal terms of business and all amounts outstanding are unsecured and will be settled in cash. Transactions and balances with the Group’s own subsidiaries are eliminated on consolidation.
The following table summarises related party transactions and balances not eliminated in the consolidated condensed interim financial statements. All related party transactions are conducted under normal terms of business. The amounts outstanding are unsecured and will be settled in cash.
Three months ended 30 June 2020 (£ millions)
With joint ventures of the
Group
With associates of the Group
With Tata Sons Limited and its
subsidiaries and joint ventures
With immediate or ultimate
parent and its subsidiaries, joint ventures
and associates
Sale of products 87 - - -
Purchase of goods - - - 5
Services received - - 29 13
Services rendered 7 - - -
Trade and other receivables 74 - 1 22
Accounts payable - - 11 46
Three months ended 30 June 2019 (£ millions)
With joint ventures of the
Group
With associates of the Group
With Tata Sons Limited and its
subsidiaries and joint ventures
With immediate or ultimate
parent and its subsidiaries, joint ventures
and associates
Sale of products 61 1 11
Purchase of goods - - - 24
Services received - 1 36 18
Services rendered 10 - - -
Trade and other receivables 52 - 1 18
Accounts payable - 1 11 28
Compensation of key management personnel
Three months ended 30 June (£ millions) 2020 2019
Key management personnel remuneration 3 6