Embed Size (px)
Citation preview
Glasgow Theses Service http://theses.gla.ac.uk/
Jackson, Colette Elizabeth (2011) Microvolt T-wave alternans in chronic heart failure: a study of prevalence and incremental prognostic value. PhD thesis. http://theses.gla.ac.uk/2940/ Copyright and moral rights for this thesis are retained by the author A copy can be downloaded for personal non-commercial research or study, without prior permission or charge This thesis cannot be reproduced or quoted extensively from without first obtaining permission in writing from the Author The content must not be changed in any way or sold commercially in any format or medium without the formal permission of the Author When referring to this work, full bibliographic details including the author, title, awarding institution and date of the thesis must be given
1
Microvolt T-Wave Alternans in Chronic Heart Failure :
A Study of Prevalence and Incremental Prognostic Value
Colette Elizabeth Jackson
BSc (Hons), MBChB (Comm), MRCP (UK)
Submitted in fulfilment of the requirements for the degree
of
Doctor of Philosophy
BHF Glasgow Cardiovascular Research Centre
Faculty of Medicine
University of Glasgow
© Colette E Jackson October 2011

2
Acknowledgements
I am extremely grateful to Professor John McMurray, Professor Stuart Cobbe and Dr Mark
Petrie for the opportunity to perform this study and for their expert advice, support and
guidance throughout.
I would like to thank my friend Dr Rachel Myles for all the help, encouragement and support
she has given me throughout the study.
I would like to express my sincere thanks to all the patients who participated in this study who
were so generous with their time.
I am grateful for the financial support provided by the Chief Scientist Office of the Scottish
Government Health Directorate, the Glasgow Royal Infirmary Endowment Fund and the
Faculty of Medicine at the University Of Glasgow.
Many people provided assistance with the study and I am privileged to have worked with so
many exceptional colleagues. I would especially like to acknowledge the help of Mr John
Rodgers, Dr Yannis Tsorlalis, Mr Tony Cunningham, Dr Jonathan Dalzell, Dr Paul
Rocchiccioli, Dr Eugene Connolly, Dr Richard Spooner, Professor Ian Ford, Dr Vladimir
Bezlyak, Ms Nicola Greenlaw, Mrs Lorna Gillespie, Ms Magdalena Litwin-Wojciechowska
and the research nurses of the Glasgow Clinical Research Facility.
I dedicate this thesis to my family: my parents John and Linda Hastings, who always
encourage and support my educational ventures; my son Rory, whose arrival provided the
catalyst to finish the thesis and my husband Allan, for his unfailing love, support and patience.
3
Declaration
The work described in this thesis was carried out while I was employed as a Clinical Research
Fellow in the University Division of Cardiovascular and Medical Sciences at the British Heart
Foundation Glasgow Cardiovascular Research Centre, University of Glasgow. Supervision
was provided by Professor John McMurray, Professor Stuart Cobbe and Dr Mark Petrie.
Recruitment of patients from Glasgow Royal Infirmary was undertaken by me. Dr Yannis
Tsorlalis recruited patients from the Western Infirmary, under my supervision (Dr Tsorlalis is
currently performing a separate study of corticosteroids in heart failure using samples from the
patients involved in this study). Patients from the Royal Alexandra Hospital were recruited by
myself and research nurses from the Glasgow Clinical Research Facility.
I conducted all of the follow-up study visits. Echocardiography at the study visit was
performed by me and offline calculations of ejection fraction were performed by Mr Tony
Cunningham. All MTWA tests were carried out by me with assistance from the research
nurses. All automated computer-generated MTWA test results were interpreted by Dr Rachel
Myles. Biochemical and haematological analyses were carried out in the local hospital
laboratories. Measurement of BNP was provided by Dr Richard Spooner. Construction of the
database was performed by me and several database managers at the Robertson Centre for
Biostatistics, University of Glasgow. The more complex statistical analyses were performed
by Dr Vladimir Bezylak and Ms Nicola Greenlaw, under the supervision of Professor Ian Ford.
To date, this work has been presented at various national and international meetings including
Scottish Society of Experimental Medicine (2007); British Society of Heart Failure (2007);
British Society of Cardiology (2008, 2009); European Society of Cardiology Heart Failure
Congress (2007, 2008); and European Society of Cardiology Annual Congress (2008, 2009).
The writing of this thesis was entirely my own work. It has not been previously submitted for
a higher degree.
Colette E Jackson
October 2011
4
Table of Contents
Acknowledgements 2
Declaration 3
Table of Contents 4-13
Index of Tables 14-20
Index of Figures 21-23
Abbreviations 24-27
Summary 28-30
Chapter 1: Introduction 31-65
1.1 Epidemiology and pathophysiology of heart failure 32-39
1.1.1 Definition of heart failure
1.1.2 Global burden of heart failure
1.1.3 Aetiology of heart failure
1.1.4 Diagnosis of heart failure
1.1.5 Heart failure with preserved ejection fraction
1.1.6 Treatment of heart failure
1.1.7 Prognosis in heart failure
5
1.2 Prognostication in heart failure 39-46
1.2.1 Importance of assessing prognosis
1.2.2 Traditional predictors of prognosis in heart failure
1.2.3 The B-type natriuretic peptides
1.2.4 Cardiac troponin
1.2.5 Rationale for improving prognostication
1.2.6 Identifying cause-specific mortality in heart failure
1.3 Microvolt T-wave alternans in heart failure 47-63
1.3.1 Definition and clinical application
1.3.2 Predictive value of microvolt T-wave alternans
1.3.2.1 Known or suspected arrhythmia
1.3.2.2 Myocardial infarction
1.3.2.3 Ischaemic left ventricular systolic dysfunction
1.3.2.4 Left ventricular systolic dysfunction irrespective of aetiology
1.3.2.5 Nonischaemic left ventricular systolic dysfunction
1.3.2.6 Symptomatic heart failure with low left ventricular ejection fraction
1.3.3 Unresolved issues in microvolt T-wave alternans testing
1.3.3.1 Does MTWA have incremental prognostic value?
1.3.3.2 Atrial fibrillation
1.3.3.3 Inability to exercise
1.3.3.4 Medical therapy
6
1.3.3.5 Indeterminate MTWA results
1.3.4 Extrapolation to primary prevention ICD therapy
1.4 Aims of Study 64-65
Chapter 2: Methods 66-90
2.1 Introduction 67
2.2 The hospitalised heart failure cohort 68-76
2.2.1 Patient population and recruitment
2.2.2 Data collection
2.2.3 Biochemical and haematological tests
2.3 Post-discharge heart failure cohort 77-85
2.3.1 Study visit
2.3.2 Data collection
2.3.3 Aetiology of heart failure
2.3.4 Biochemical and haematological tests
2.3.5 Echocardiography
2.3.6 Microvolt T-wave alternans
2.3.6.1 Application of the MTWA test
2.3.6.2 MTWA prevalence study
2.3.6.3 MTWA prognostic study
7
2.4 Database construction 85
2.5 Long-term follow-up 85-86
2.6 Statistical methodology 86-90
2.6.1 Statistical analyses
2.6.2 Power calculation
2.6.3 Defining events and outcomes
Chapter 3: Clinical Characteristics of Hospitalised Cohort 91-133
3.1 Introduction 92
3.2 Results 92-132
3.2.1 Selection of study cohort
3.2.2 Demographics
3.2.3 History of heart failure
3.2.4 Symptoms prior to admission
3.2.5 Medical history
3.2.6 Medications pre-admission
3.2.7 Heart failure medical therapy during first 24 hours of admission
3.2.8 Clinical examination findings on admission
3.2.8.1 Routine physiological measurements
3.2.8.2 Body mass index and waist circumference measurements
8
3.2.8.3 Cardiovascular examination signs
3.2.9 Electrocardiography
3.2.10 Chest X-Ray
3.2.11 Echocardiography
3.2.11.1 Previous echocardiographic findings
3.2.11.2 Current echocardiographic findings
3.2.12 Haematology
3.2.13 Biochemistry
3.2.14 Aetiology of heart failure
3.3 Summary 132-133
Chapter 4: Clinical Characteristics of Hospitalised Cohort Stratified
by Study Visit Attendance 134-177
4.1 Introduction 135
4.2 Comparison of hospital data for study visit attendees and
non-attendees 135-175
4.2.1 Outcome of hospitalised cohort
4.2.2 Demographics
4.2.3 History of heart failure
4.2.4 Heart failure symptoms prior to admission
4.2.5 Medical history
9
4.2.6 Cardiovascular medications pre-admission
4.2.7 Heart failure medical therapy during first 24 hours of admission
4.2.8 Clinical examination findings on admission
4.2.8.1 Routine physiological measurements
4.2.8.2 Body mass index and waist circumference measurements
4.2.8.3 Clinical signs of heart failure
4.2.9 Electrocardiography
4.2.10 Chest X-Ray
4.2.11 Echocardiography
4.2.12 Haematology
4.2.13 Biochemistry
4.3 Summary 176-177
Chapter 5: Clinical Characteristics of Post-Discharge Cohort 178-210
5.1 Introduction 179
5.2 Results 179-207
5.2.1 Composition of post-discharge cohort
5.2.2 Demographics
5.2.3 Symptoms of heart failure
5.2.4 Common medical comorbidity
5.2.5 Medications
10
5.2.6 Clinical examination
5.2.6.1 Routine physiological measurements
5.2.6.2 Body mass index and waist circumference measurements
5.2.6.3 Cardiovascular examination signs
5.2.7 Electrocardiography
5.2.8 Ejection fraction by echocardiography
5.2.9 Haematology
5.2.10 Biochemistry
5.2.11 Aetiology of heart failure
5.2.12 Heart failure with reduced versus preserved ejection fraction
5.3 Discussion 208-210
Chapter 6: Microvolt T-Wave Alternans 211-243
6.1 Introduction 212
6.2 Results 212-240
6.2.1 Eligibility
6.2.2 Clinical characteristics stratified by eligibility
6.2.3 Automated computer-generated report
6.2.4 MTWA Classification
6.2.5 Prevalence study
6.2.6 Functional capacity of study cohort
11
6.2.7 Optimal heart failure therapy
6.2.8 Adjudication of MTWA test results
6.2.9 Comparison with other MTWA clinical studies
6.3 Discussion 240-243
Chapter 7: Clinical Associates of Microvolt T-Wave Alternans 244-283
7.1 Introduction 245
7.2 Results 1: Differences in clinical characteristics according to
MTWA result 245-274
7.2.1 Demographics
7.2.2 Symptoms of heart failure
7.2.3 Common medical comorbidity
7.2.4 Medications
7.2.5 Clinical examination
7.2.5.1 Routine physiological measurements
7.2.5.2 Body mass index measurements
7.2.5.3 Cardiovascular examination signs
7.2.6 Electrocardiography
7.2.7 Exercise parameters
7.2.8 Ejection fraction by echocardiography
7.2.9 Heart failure with reduced versus preserved ejection fraction
12
7.2.10 Haematology
7.2.11 Biochemistry
7.2.12 Aetiology of heart failure
7.3 Results 2: Differences in clinical characteristics - negative and
non-negative MTWA results 275-276
7.4 Results 3: Differences in clinical characteristics for the three
MTWA pairings 277-282
7.4.1 Negative versus positive MTWA
7.4.2 Indeterminate versus positive MTWA
7.4.3 Indeterminate versus negative MTWA
7.5 Discussion 283
Chapter 8: Prognostic Value of Microvolt T-Wave Alternans 284-311
8.1 Introduction 285
8.2 Results 285-307
8.2.1 Overall survival of post-discharge cohort
8.2.2 Survival stratified by MTWA eligibility
8.2.3 Survival stratified by LVEF
8.2.4 Unadjusted outcomes for MTWA result
8.2.5 Comparison of mortality rates to other LVSD and HF MTWA studies
8.2.6 Stepwise multivariable models without MTWA

13
8.2.7 Multivariable models with MTWA
8.3 Discussion 308-311
Chapter 9: Discussion 312-326
9.1 Major findings of the study 313-321
9.2 Strengths 321-322
9.3 Limitations 322-323
9.4 Future research analyses 324-325
9.4 Conclusion 325-326
Appendices 327-369
Appendix I: Screening sheet
Appendix II: Patient information sheet – stage 1
Appendix III: Patient information sheet – stage 2
Appendix IV: Consent forms
Appendix V: Case notes sheet
Appendix VI: Study visit appointment card
Appendix VII: Letter for GP/Consultant
Appendix VIII: Hospital visit case record form
Appendix IX: Study visit case record form
Publications containing work undertaken in this thesis 370
Presentations to Learned Societies 370-372
References 373-386
14
Index of Tables
Chapter 1
1-1 Common causes of heart failure and their common modes of presentation 34
1-2 Other causes of heart failure and their modes of presentation 35
1-3 Established prognostic markers in heart failure 41
1-4 Published observational studies of MTWA exercise testing 54
1-5 Parameters included in MTWA studies multivariable analyses 57
1-6 Distribution of all-cause mortality rates per MTWA result 61
1-7 Adjusted comparisons of mortality per MTWA result in 768 patients with
ischaemic cardiomyopathy 62
Chapter 2
2-1 New York Heart Association (NYHA) classification of heart failure 72
2-2 Killip classification of heart failure 73
2-3 Three stage model for evaluating the incremental prognostic value of MTWA 88
Chapter 3
3-1 Demographics of the hospitalised cohort 97
3-2 Symptoms of heart failure prior to admission 99
3-3 Common cardiovascular conditions present in the hospitalised cohort 103
3-4 Prevalence of major risk factors for cardiovascular disease in the
hospitalised cohort 104
3-5 Frequencies of common non-cardiovascular medical co-morbidities in the
hospitalised cohort 106
3-6 Frequency of heart failure medication prescribing prior to admission to
hospital 107
15
3-7 Frequency of cardiovascular medication use prior to admission to hospital 108
3-8 Frequency of non-cardiovascular medication use prior to admission to
hospital 109
3-9 Heart failure medications administered during the first 24 hours of
hospitalisation 110
3-10 Physiological measurements on admission to hospital 112
3-11 BMI and waist circumference measurements on admission to hospital 114
3-12 Cardiovascular examination findings on admission to hospital 116
3-13 Admission ECG findings and their frequencies within the cohort 118
3-14 Echocardiographic findings for the 761 patients with an echocardiogram
performed prior to enrolment into the study 120
3-15 Current echocardiographic findings for the 727 patients with an
echocardiogram performed after enrolment in the study 122
3-16 Full blood count profile on admission for all patients 123
3-17 Frequencies of biochemical tests performed in the hospitalised cohort 124
3-18 BNP and renal function results on admission for all patients 125
3-19 Liver function tests during hospital admission for 999 patients 127
3-20 Other biochemical tests measured during the hospital admission 129
3-21 Primary aetiology of heart failure for the hospitalised cohort 131
3-22 Potential contributing aetiologies of heart failure in the hospitalised cohort 132
Chapter 4
4-1 Basic demographics of the hospitalised cohort, stratified by whether or not
they subsequently attended the study visit 138
4-2 History of heart failure, stratified by study visit attendance 139
4-3 Heart failure symptom status prior to admission, stratified by study visit
attendance 141
16
4-4 Prevalence of common medical conditions, stratified by study visit
attendance 144
4-5 Prevalence of cardiovascular medication prescribing pre-admission, stratified
by study visit attendance 147
4-6 Heart failure medical therapy during the first 24 hours of admission, stratified
by study visit attendance 149
4-7 Routine physiological measurements on admission to hospital, stratified by
study visit attendance 151
4-8 BMI and waist circumference measurements for men on admission to hospital,
stratified by study visit attendance 154
4-9 BMI and waist circumference measurements for women on admission to
hospital, stratified by study visit attendance 155
4-10 Waist circumference measurements on admission to hospital, stratified by
study visit attendance 156
4-11 Clinical signs of heart failure on admission to hospital, stratified by study
visit attendance 158
4-12 Electrocardiographic parameters on admission to hospital, stratified by study
visit attendance 161
4-13 CXR parameters on admission to hospital, stratified by study visit attendance
163
4-14 Echocardiographic parameters following enrolment, stratified by study visit
attendance 165
4-15 Full blood count parameters on admission to hospital, stratified by study visit
attendance 167
4-16 BNP levels on admission to hospital, stratified by study visit attendance 169
4-17 Troponin I levels on admission for GRI and WIG patients who had troponin I
measured, stratified by study visit attendance 169
4-18 Renal function on admission for all patients, stratified by study visit
attendance 171
17
4-19 Liver function parameters, stratified by study visit attendance 173
4-20 CRP results, stratified by study visit attendance 175
Chapter 5
5-1 Demographics of the post-discharge cohort 180
5-2 Current heart failure symptoms 181
5-3 Prevalences of common medical conditions 182
5-4 Frequency of heart failure medication prescribing in the post-discharge cohort
at the study visit, overall and stratified according to LVEF 184
5-5 Frequency of cardiovascular medication prescribing in the post-discharge
cohort at the study visit 185
5-6 Frequency of prescribing of common non-cardiovascular medications in the
post-discharge cohort 186
5-7 Physiological findings in the post-discharge cohort, recorded at the study
visit 188
5-8 BMI and waist circumference measurements at the study visit 189
5-9 Cardiovascular examination findings at the study visit 191
5-10 ECG parameters at the study visit 193
5-11 Full blood count profile for the post-discharge cohort at the study visit 195
5-12 BNP and troponin I results for the post-discharge cohort at the study visit 196
5-13 Renal function results for the post-discharge cohort at the study visit 198
5-14 LFT results for the post-discharge cohort at the study visit 200
5-15 Other biochemical tests recorded at the study visit for the post-discharge
cohort 201
5-16 Primary aetiology of heart failure for the post-discharge cohort 202
5-17 Contributing aetiologies of heart failure in the post-discharge cohort 203
5-18 Demographics, medical history and current medications, stratified by LVEF 206
18
5-19 Clinical examination, ECG and blood parameters, stratified by LVEF 207
Chapter 6
6-1 Demographics, history of heart failure and current heart failure symptoms for
the post-discharge cohort, stratified by MTWA eligibility 218
6-2 Medical comorbidity and medications for the post-discharge cohort, stratified
by MTWA eligibility 220
6-3 Clinical examination, ECG and blood parameters stratified by MTWA
eligibility 222
6-4 Exercise parameters and reasons for terminating exercise for 330 patients 235
Chapter 7
7-1 Demographics stratified by MTWA result 246
7-2 Current heart failure symptoms stratified by MTWA result 248
7-3 Common medical comorbidities stratified by MTWA result 250
7-4 Frequency of heart failure medication prescribing stratified by MTWA result 253
7-5 Frequency of cardiovascular medication prescribing stratified by MTWA
result 254
7-6 Frequency of prescribing of common non-cardiovascular medications
stratified by MTWA result 255
7-7 Physiological findings stratified by MTWA result 257
7-8 BMI measurements stratified by MTWA result 258
7-9 Cardiovascular examination findings stratified by MTWA result 259
7-10 Electrocardiographic parameters stratified by MTWA result 261
7-11 Exercise parameters stratified by MTWA result 262
7-12 Full blood count parameters stratified by MTWA result 266
7-13 BNP and troponin I results stratified by MTWA result 268
19
7-14 Renal function results stratified by MTWA result 269
7-15 Liver function test results stratified by MTWA result 270
7-16 Other biochemical test results stratified by MTWA result 271
7-17 Contributing aetiologies of heart failure stratified by MTWA result 274
7-18 Clinical variables stratified by negative and non-negative MTWA
classification 276
7-19 Logistic regression analysis for negative versus positive MTWA results 278
7-20 Logistic regression analysis for indeterminate versus positive MTWA results 280
7-21 Logistic regression analysis for indeterminate versus negative MTWA results 282
Chapter 8
8-1 Overall survival for 648 patients in the post-discharge cohort 285
8-2 Mortality outcomes for the post-discharge cohort, stratified by eligibility for
MTWA testing 286
8-3 Overall unadjusted survival for 648 patients in the post-discharge cohort,
stratified by MTWA eligibility 287
8-4 Overall unadjusted survival for 648 patients in the post-discharge cohort,
stratified by LVEF 287
8-5 Unadjusted mortality outcomes stratified by MTWA result 291
8-6 Unadjusted survival rates for patients with negative, positive and
indeterminate MTWA results 292
8-7 Unadjusted mortality outcomes stratified by negative and non-negative
MTWA result 294
8-8 Survival rates for patients with negative and non-negative MTWA results 294
8-9 Mortality outcomes stratified by type of indeterminate MTWA result 296
8-10 Distribution of all-cause mortality and sudden cardiac death in LVSD and
HF MTWA studies 298
20
8-11 Approximate mortality rates per 100-patient years of follow-up for
studies in Table-10 299
8-12 Univariate and multivariable analysis for stage 1 variables 301
8-13 Univariate and multivariable analysis for stage 2 variables 303
8-14 Univariate and multivariable analysis for stage 3 variables 304
8-15 Multivariable analysis for variables from stages 1, 2 and 3 305
8-16 Univariate analysis for MTWA 306
8-17 Multivariable analysis for final model with MTWA 307
21
Index of Figures
Chapter 2
2.1 Outline of the study design 67
2.2 HearTWaveTM system (Cambridge Heart) 81
2.3 Proprietary ECG electrodes 81
2.4 MTWA testing in the BHF Glasgow Cardiovascular Research Centre 82
2.5 Spectral method of measuring T-wave alternans 83
Chapter 3
3.1 Overview of all the patients screened from the three hospitals and final
composition of the recruited study cohort 94
3.2 Recruitment into the study; overall and per hospital 95
3.3 Breakdown of the major reasons for exclusion from recruitment into the
study, per hospital 96
3.4 Healthcare professionals involved in the management of patients with a
diagnosis of HF prior to recruitment into the study 98
3.5 Coronary angiography results for the hospitalised cohort 105
3.6 Radiological findings on the admission CXR for the hospitalised cohort 119
3.7 Distribution of LV systolic function for the 727 patients with an
echocardiogram performed after enrolment in the study 122
3.8 Distribution of BNP levels for all enrolled patients 126
3.9 Distribution of eGFR on admission for all enrolled patients 126
Chapter 4
4.1 Overview of the 1003 patients recruited into the study and the breakdown of
reasons for failure to attend the study visit 136
22
Chapter 5
5.1 Distribution of LVEF at the study visit for 622 patients with calculable EF by
Simpson’s biplane methods 194
5.2 Distribution of BNP levels at the study visit 197
5.3 Distribution of eGFR for the post-discharge cohort 198
5.4 HF-PEF versus HF-REF for the post-discharge cohort 204
Chapter 6
6.1 Potential eligibility for MTWA testing in the hospitalised cohort 213
6.2 Eligibility for MTWA testing in 648 patients attending the study visit 215
6.3 Reasons for discontinuing exercise for 26 patients who attempted exercise
but were unable to exercise for 2 minutes 216
6.4 Reasons for not attempting exercise in 17 patients 216
6.5 Example of a MTWA test report 224
6.6 The automated MTWA test report for a study patient with a positive result 227
6.7 The automated MTWA test report for a study patient with a negative result 228
6.8 MTWA test results for 330 patients of the post-discharge cohort 230
6.9 MTWA tests for the post-discharge cohort; non-negative versus negative 230
6.10 Classification of reasons for an indeterminate MTWA test result in the
post-discharge cohort 232
6.11 Classification of reasons for an indeterminate MTWA test result;
highlighting the two reasons for an insufficient heart rate 233
6.12 Rate of prescribing of optimal heart failure therapy for patients
undergoing MTWA exercise tests 237
6.13 Comparison of Glasgow MTWA study to other major clinical MTWA studies
to date – positive, negative and indeterminate results 239
23
6.14 Comparison of Glasgow MTWA study to other major clinical MTWA studies
to date – non-negative and negative results 240
Chapter 7
7.1 LVEF stratified by MTWA result 263
7.2 Proportions of patients with HF-REF and HF-PEF, stratified by MTWA
result 264
7.3 Primary aetiologies of heart failure stratified by MTWA result 273
Chapter 8
8.1 Kaplan-Meier survival curves for HF-PEF and HF-REF 288
8.2 Kaplan-Meier survival curves for all-cause mortality for negative,
positive and indeterminate MTWA results 289
8.3 Kaplan-Meier survival curves for sudden cardiac death or resuscitated
cardiac arrest for negative, positive and indeterminate MTWA results 290
8.4 Kaplan-Meier survival curves for cardiovascular death (excluding sudden)
for negative, positive and indeterminate MTWA results 290
8.5 Kaplan-Meier survival curves for negative and non-negative MTWA results 293
24
Abbreviations
ABCD Alternans Before Cardioverter Defibrillator
ACE Angiotensin-converting enzyme
ACS Acute coronary syndrome
AF Atrial fibrillation
ALPHA Microvolt T-wave Alternans in Patients with Heart Failure
ALT Alanine transaminase
ANOVA Analysis of variance
AR Aortic regurgitation
ARB Angiotensin-receptor blocker
AS Aortic stenosis
AST Aspartate transaminase
AV Atrioventricular
β-blocker Beta-blocker
BHF British Heart Foundation
BMI Body mass index
BNP B-type natriuretic peptide
BPM Beats per minute
CABG Coronary artery bypass graft
CARISMA Cardiac Arrhythmias and Risk Stratification After Acute Myocardial
Infarction
CHARM Candesartan in Heart failure: Assessment of Reduction in Mortality and
morbidity
CI Confidence interval
COPD Chronic obstructive pulmonary disease
25
CRP C-reactive protein
CRT Cardiac resynchronisation therapy
CRT-D Cardiac resynchronisation therapy with defibrillator
CRT-P Cardiac resynchronisation therapy with pacemaker only
CVA Cerebrovascular accident
CXR Chest X-ray
DBP Diastolic blood pressure
ECG Electrocardiogram
EDTA Ethylene diamine tetra acetic acid
EGFR Estimated glomerular filtration rate
EF Ejection fraction
EPS Electrophysiological study
ESC European Society of Cardiology
FBC Full blood count
GGT Gamma glutamyl transpeptidase
HBA1c Glycosylated haemoglobin
HDL High density lipoprotein
HF Heart failure
HF-PEF Heart failure with preserved ejection fraction
HR Hazard ratio
HF-REF Heart failure with reduced ejection fraction
ICD Implantable cardioverter-defibrillator
ICD-10 International classification of diseases (version 10) coding system
IQR Inter-quartile range
ISD Information services division
JVP Jugular venous pressure
26
LBBB Left bundle branch block
LV Left ventricle/ventricular
LVEF Left ventricular ejection fraction
LFT Liver function tests
LVH Left ventricular hypertrophy
LVSD Left ventricular systolic dysfunction
MADIT Multicenter Automatic Defibrillator Implantation Trial
MASTER Microvolt T-Wave AlternanS Testing for Risk Stratification of Post MI
Patients
MDRD Modification of Diet in Renal Disease
MET Metabolic equivalent value
MR Mitral regurgitation
MS Mitral stenosis
MTWA Microvolt T-wave alternans
MI Myocardial infarction
NHS National Health Service
NICE National Institute for Health and Clinical Excellence
NPV Negative predictive value
NSAID Non-steroidal anti-inflammatory drug
NT-proBNP N-terminal-proBNP
NYHA New York Heart Association
PCI Percutaneous coronary intervention
PND Paroxysmal nocturnal dyspnoea
QTc QT interval corrected for heart rate
RBBB Right bundle branch block
RDW Red cell distribution width
27
RR Relative risk
SBP Systolic blood pressure
SCD Sudden cardiac death
SCD-HeFT Sudden cardiac death in Heart Failure Trial
SD Standard deviation
SIGN Scottish Intercollegiate Guidelines Network
SpO2 Saturation of oxygen
SPSS Statistical package for the social sciences
SSS Sick sinus syndrome
SVT Supraventricular tachycardia
T4 Thyroxine
TIA Transient ischaemic attack
TFT Thyroid function test
TR Tricuspid regurgitation
TSH Thyroid stimulating hormone
U&E Urea and electrolytes
UK United Kingdom
VO2 Oxygen consumption
VF Ventricular fibrillation
VT Ventricular tachycardia
VTE Ventricular tachyarrhythmic events
WBC White blood cell
WHO World Health Organization
28
Summary
Heart failure (HF) is a major health concern internationally and associated with considerable
mortality and morbidity. Patients with HF are at risk of sudden cardiac death (SCD). Most
SCD is caused by ventricular tachyarrhythmic events (VTE) that can be treated with an
implantable cardioverter-defibrillator (ICD). Identifying patients at risk of VTE remains a
clinical challenge.
Microvolt T-wave alternans (MTWA) examines beat-to-beat fluctuations in the morphology of
the electrocardiographic T-wave. The presence of significant alternans is thought to reflect
dynamic instability of repolarisation and be mechanistically linked to VTE. MTWA testing
can be performed clinically using a commercially available system. Patients must be in sinus
rhythm and the heart rate is increased up to a maximum of 110 beats per minute by using sub
maximal treadmill exercise. Observational studies in highly selected populations have
suggested that MTWA testing may be used as a non-invasive tool for identifying patients at
risk of VTE who, by implication, may benefit from primary prevention ICD therapy. However,
to date, no study has investigated the use of MTWA testing in a real-life population of patients
with HF.
The main aims of this study were to evaluate the applicability of MTWA testing in an
unselected cohort of patients recently hospitalised with decompensated HF and determine the
prevalence and incremental prognostic value of this test.
Of 2361 patients with suspected decompensated HF screened for inclusion in the study, 1003
were recruited. Of those recruited, 648 patients attended the study visit for MTWA testing one
month following hospital discharge. The most common reason for failing to attend the study
visit was refusal to participate; other reasons were deteriorating health and death before the
study visit appointment.
29
The mean age of those returning for MTWA testing was 71 years (SD 11) and 58% were male.
Of 648 patients who completed the study visit, 330 (51%) were eligible for MTWA testing.
Almost half were ineligible for MTWA testing due to atrial fibrillation (AF), pacemaker-
dependency or physical inability to undertake the treadmill test. AF accounted for three-
quarters of those who were ineligible in this study, i.e. 38% of all patients. Although only a
small proportion of patients (7%) overall were ineligible because of physical inability to
attempt the sub-maximal treadmill test, this is an underestimate of this problem as many
patients simply did not attend for the test because of poor health.
Many of the characteristics of the ineligible patients in this study suggested they had a poor
prognosis, including the highest log (BNP) concentration. BNP is also an independent
predictor of sudden cardiac death, suggesting that the patients at the highest arrhythmic risk
may in fact not be eligible for MTWA testing. These findings suggest the utility of the MTWA
test as a means of detecting those at highest risk of sudden death is likely to be limited as
many such patients are ineligible for the test. Patients ineligible for MTWA testing were older
than patients eligible for testing and a higher proportion had a history of pre-admission heart
failure. Ineligible patients also had more evidence of persisting or advanced heart failure, with
a higher proportion having NYHA functional class III or IV symptoms and a greater frequency
of peripheral oedema. Those ineligible for MTWA testing also had a greater prevalence of
renal dysfunction, liver enzyme abnormalities, hyperuricaemia and lymphopenia.
The clinical data collected at the study visit was analysed according to whether patients had
HF with preserved ejection fraction (HF-PEF) or reduced ejection fraction (HF-REF). The
majority of clinical characteristics were similar between the two groups although there were
some notable differences. Patients with HF-PEF were older, more likely to be female, more
likely to have hypertension and less likely to have had a myocardial infarction (MI), in
comparison to those with HF-REF. These findings are consistent with previous studies of HF-
PEF. Prescribing of HF pharmacological therapies was greater amongst patients with HF-REF.
Patients with HF-REF had median BNP concentrations almost twice that of those with HF-
PEF, both on admission to hospital and at the study visit.
30
Of 330 patients who underwent MTWA treadmill testing, 100 (30%) were positive, 78 (24%)
were negative and 152 (46%) were indeterminate (unable to be classified as positive or
negative). The majority of indeterminate tests (75%) occurred because of failure to achieve the
target heart rate due to chronotropic incompetence, secondary to beta-blocker therapy, or
physical limitations. There were more abnormal clinical characteristics associated with an
indeterminate result, than a positive or negative result. Patients with an indeterminate result
were older and more likely to have a history of HF, diabetes, AF, anaemia and renal
dysfunction, as well as a higher log (BNP). Patients with positive and indeterminate MTWA
tests were quite different, in terms of clinical characteristics, questioning the contemporary
way of classifying these results as ‘non-negative’.
The mean follow-up was 18 months (SD 8.1) and 131 deaths occurred during this period.
There were proportionately more deaths amongst the patients ineligible for MTWA testing
than those eligible. There was no significant difference in mortality rates between patients
with HF-PEF and HF-REF. There was no significant difference in crude all-cause mortality
rates between the three MTWA groups. Unexpectedly, patients with negative and
indeterminate results had proportionately similar mortality rates whilst those with positive
results had proportionately fewest events overall. MTWA was analysed in the accepted way of
‘non-negative’ (positive and indeterminate) and negative, but this did not alter the results.
Indeed, the very different mortality for those patients with positive and indeterminate results
challenges the use of this ‘non-negative’ classification.
MTWA had no incremental prognostic value when added to a multivariable model containing
the strongest predictors of mortality in this study. The independent predictors of all-cause
mortality following stepwise multivariable modelling were; lower body mass index, New
York Heart Association class III-IV, previous myocardial infarction, elevated BNP
concentration and elevated troponin levels.
In summary, MTWA treadmill-testing was not widely applicable in typical patients with HF
and failed to predict mortality risk. At present MTWA cannot be endorsed as a tool for
improving risk stratification in HF.

31
CHAPTER ONE
INTRODUCTION
32
1.1 Epidemiology and pathophysiology of heart failure
1.1.1 Definition of heart failure
Heart failure (HF) is the clinical syndrome that occurs when the ventricle fails to properly fill
with or eject blood. It commonly presents with symptoms of breathlessness and fatigue and
clinical signs of fluid retention. Depending on the timing of symptoms and signs, HF may
present in one of three ways; acute ‘de novo’ HF, chronic HF or acute decompensation of
chronic HF. Acute ‘de novo’ HF may present as acute pulmonary oedema or cardiogenic
shock, often in the context of an acute coronary syndrome.
1.1.2 Global burden of heart failure
HF is a significant public health problem internationally. In Europe the overall prevalence is
2-3% (1). The prevalence of HF correlates with age and increases exponentially, rising to 10-
20% for septuagenarians. Younger patients with HF are more likely to be men with reduced
systolic function secondary to myocardial infarction, predominantly because coronary heart
disease occurs earlier in men. On the other hand, elderly patients with HF are more likely to be
women with HF with preserved systolic function, secondary to established hypertension (2).
Overall the prevalence of HF is rising, particularly in developed countries as life expectancy
improves. Thus the burden this health problem has on society is increasing. The incidence of
HF is also age-related. In the United Kingdom (UK), a population-based study found that the
majority of new diagnoses of HF occur in the elderly with an incidence rate of 0.2 cases per
1000 population per year for 45-55 year olds, rising to 11.6 in those 85 years and over (3). In
this study the incidence was greater in males and the median age at presentation was 76 years.
The financial burden of HF is huge and growing. The cause of this is multifactorial and
includes the increasing prevalence of HF, an ageing population, a rising rate of hospital
admissions for HF and the availability of expensive therapies that are revolutionising
treatment of this condition. The implications for healthcare systems are substantial. Between
33
1-2% of the National Health Service (NHS) budget is spent on HF (4), whilst in the United
States a recent estimate for annual expenditure for HF was 27.9 billion dollars (5). In the UK,
HF accounts for around 5% of all hospital admissions (3) and readmission rates are high,
almost one-third of patients hospitalised with HF may be readmitted within one year of
discharge (6). Unsurprisingly, hospitalisation costs account for the majority of the budget
spent on HF.
1.1.3 Aetiology of heart failure
HF may result from a broad spectrum of structural or functional cardiac and non-cardiac
disorders and is often the end-stage of many forms of cardiovascular disease. The common
causes of HF and their clinical presentations are outlined in Table 1-1. Causes of HF can be
categorised into disorders of the pericardium, myocardium, endocardium or great vessels.
Myocardial disorders are the most common causes of HF and are often classified according to
ejection fraction (EF), namely HF with reduced ejection fraction (HF-REF) or HF with
preserved ejection fraction (HF-PEF). HF-PEF is discussed in more detail below (section
1.1.5). HF-REF is also commonly classed as ischaemic or non-ischaemic HF. Common causes
of non-ischaemic HF-REF include hypertension, valvular heart disease, arrhythmias, alcohol
and dilated cardiomyopathy. The cardiomyopathies are a collection of myocardial diseases
that are often, but not exclusively, familial in which the diagnosis can only be made after the
exclusion of other causes of heart failure. The different types of cardiomyopathy are
hypertrophic, dilated, restrictive, arrhythmogenic right ventricular and unclassified (7).
Hypertension is also a common cause of HF-PEF. Other causes of HF-PEF include
hypertrophic, restrictive and infiltrative cardiomyopathies. HF-PEF often occurs in association
with atrial fibrillation (AF). Other causes of HF are presented in Table 1-2.
Aetiology and risk factors for HF exhibit geographical variation. Coronary heart disease is
undoubtedly the most common cause of HF in developed countries, accounting for
approximately 70% of cases (8). Hypertension is the next commonest cause in Western
countries, followed by valvular heart disease (particularly degenerative) and cardiomyopathies.
Arrhythmias and alcohol are also frequent precursors of HF in developed countries. In
34
Africans and African Americans, hypertension is a common cause of HF (9), whilst in South
America Chagas disease is often implicated (10). In developing countries, rheumatic valvular
heart disease and nutritional deficiencies are more common causes of HF (11).
Coronary heart disease has not always been the commonest cause of HF in Western societies.
Hypertension was the most common cause in the original Framingham study (12). However
the proportion of cases of HF caused by hypertension has decreased over the follow-up period,
whilst those attributed to coronary heart disease have risen. The reasons for the changing
aetiology of HF are likely multifactorial and include improvements in survival after a
myocardial infarction (13) as well as increasing accessibility to techniques for diagnosing
coronary heart disease. Hypertension may be responsible for fewer cases of HF owing to
pharmacological advances in antihypertensive therapy preventing the longer term
complications such as HF (14).
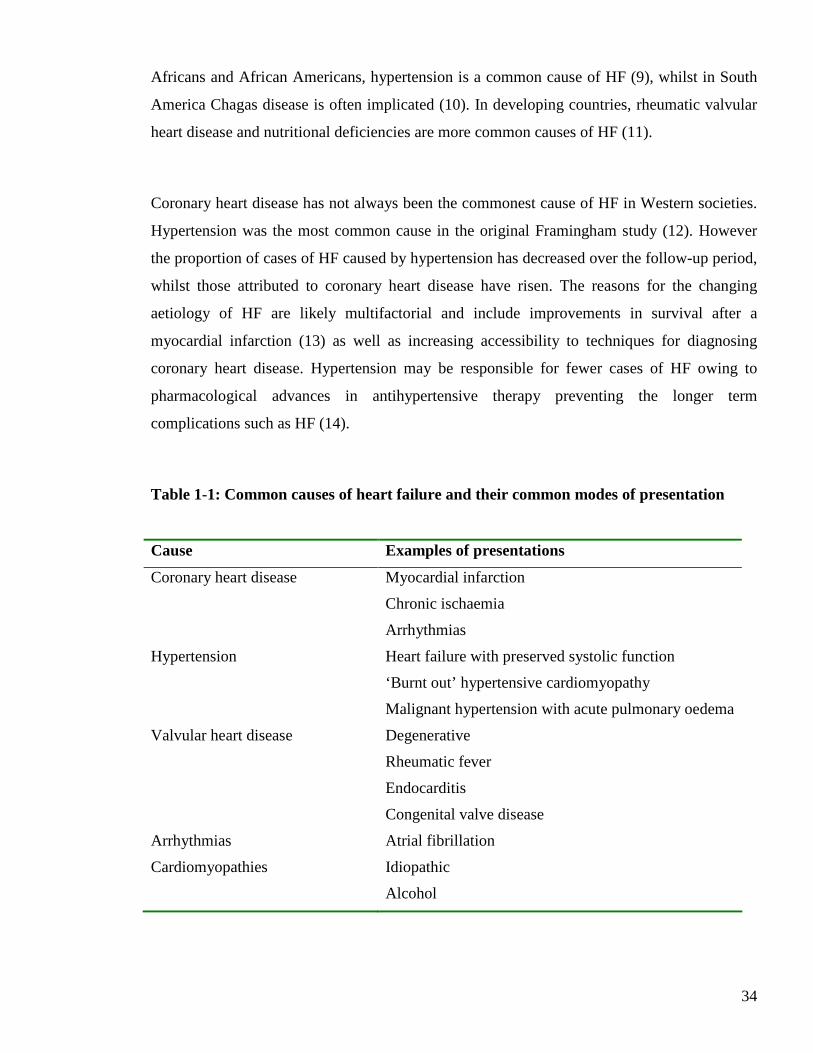
Table 1-1: Common causes of heart failure and their common modes of presentation
Cause Examples of presentations
Coronary heart disease Myocardial infarction
Chronic ischaemia
Arrhythmias
Hypertension Heart failure with preserved systolic function
‘Burnt out’ hypertensive cardiomyopathy
Malignant hypertension with acute pulmonary oedema
Valvular heart disease Degenerative
Rheumatic fever
Endocarditis
Congenital valve disease
Arrhythmias Atrial fibrillation
Cardiomyopathies Idiopathic
Alcohol
35
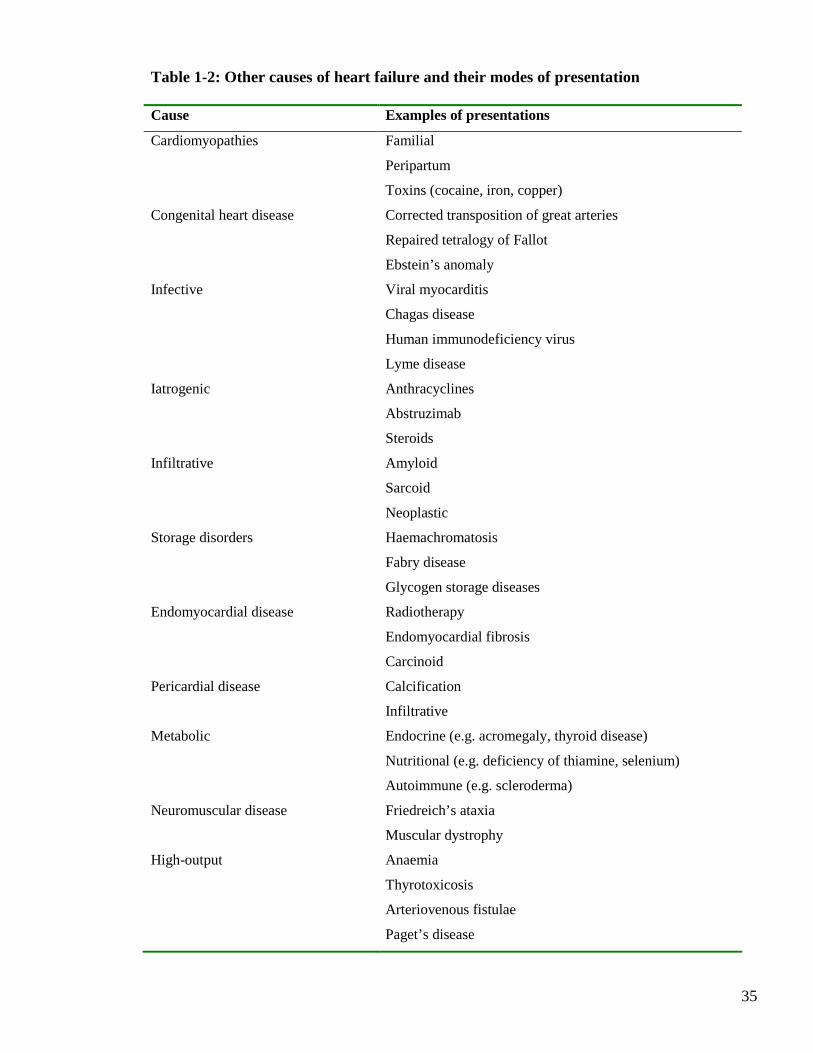
Table 1-2: Other causes of heart failure and their modes of presentation Cause Examples of presentations
Cardiomyopathies Familial
Peripartum
Toxins (cocaine, iron, copper)
Congenital heart disease Corrected transposition of great arteries
Repaired tetralogy of Fallot
Ebstein’s anomaly
Infective Viral myocarditis
Chagas disease
Human immunodeficiency virus
Lyme disease
Iatrogenic Anthracyclines
Abstruzimab
Steroids
Infiltrative Amyloid
Sarcoid
Neoplastic
Storage disorders Haemachromatosis
Fabry disease
Glycogen storage diseases
Endomyocardial disease Radiotherapy
Endomyocardial fibrosis
Carcinoid
Pericardial disease Calcification
Infiltrative
Metabolic Endocrine (e.g. acromegaly, thyroid disease)
Nutritional (e.g. deficiency of thiamine, selenium)
Autoimmune (e.g. scleroderma)
Neuromuscular disease Friedreich’s ataxia
Muscular dystrophy
High-output Anaemia
Thyrotoxicosis
Arteriovenous fistulae
Paget’s disease
36
1.1.4 Diagnosis of heart failure
The Heart Failure Association of the European Society of Cardiology (ESC) specify that three
diagnostic criteria must be met in order to make the diagnosis of HF (1). Firstly, the patient
must experience symptoms characteristic of this condition. These include breathlessness,
fatigue and ankle swelling. Secondly the patient should have clinical signs indicative of HF,
including amongst others; tachypnoea, tachycardia, raised jugular venous pressure, pulmonary
crepitations, pleural effusions and peripheral oedema. Finally, there must be objective
evidence of structural or functional cardiac disease. This may be verified by evidence of
cardiomegaly, a third heart sound, echocardiographic abnormalities or a raised natriuretic
peptide level.
1.1.5 Heart failure with preserved ejection fraction
Myocardial disorders account for the vast majority of cases of HF, caused by either systolic or
diastolic dysfunction. Systolic dysfunction leads to a low left ventricular ejection fraction
(LVEF). Diastolic dysfunction impairs left ventricular (LV) distensibility, filling and
relaxation, irrespective of LVEF. Yet, patients with HF are often subdivided according to their
EF; HF-REF or HF-PEF. One possible explanation for this is because of the difficulties
measuring diastolic dysfunction. HF-PEF diagnosed solely by LVEF may encompass patients
without diastolic dysfunction. Indeed, the major clinical trials of pharmacological therapy in
HF-PEF enrolled patients solely on the basis of an echocardiographically assessed LVEF (15-
17). HF-REF may also include patients with diastolic dysfunction. Unlike HF-REF, HF-PEF
remains a diagnosis of exclusion. Non-cardiac causes of signs and symptoms of HF must be
excluded before HF-PEF can be accurately diagnosed.
The LVEF cut-off criterion for HF-PEF varies in different guidelines and studies. A recent
ESC consensus statement includes more than just LVEF in the diagnostic criteria of HF-PEF
(18). In addition to the presence of signs or symptoms of HF and normal or mild LVSD, these
guidelines recommend that there should be evidence of diastolic dysfunction, obtained
invasively or non-invasively. Normal or mild LVSD is defined as LVEF > 50% (18).
37
HF-PEF and HF-REF may be considered as two ends of a spectrum. Both lead to reductions in
exercise tolerance and activation of neurohormonal systems with different myocardial
remodelling processes. HF-PEF is recognised as a precursor to HF-REF in several causes of
HF, for example hypertension and the cardiomyopathies. Epidemiological studies have
revealed that as many as 50% of HF patients with acute decompensation have HF-PEF (19-23).
HF-PEF is the principal cause of HF in the elderly and in women (23;24). Although previously
considered to have a more favourable prognosis than HF-REF, HF-PEF is now considered to
be associated with significant mortality risk. The mortality rates of HF-PEF vary between
clinical studies. This variation may be explained by the heterogeneity of the populations
studied and the diagnostic criteria used for HF-PEF. Recent large population studies have
reported one year mortality rates of 22% and 29% in patients with HF-PEF (19;23),
comparable to one year mortality rates of 21% observed in a recent local study (25). Yet,
despite the poor prognosis associated with this condition, treatment of HF-PEF remains
challenging and largely symptomatic based. This is in stark contrast to HF-REF, for which a
large evidence-base exists.
1.1.6 Treatment of heart failure
The treatment of HF-REF consists of pharmacological, device and surgical therapy. Advances
in pharmacological therapy over the last three decades have significantly improved the
prognosis for many patients with HF-REF. The first step of managing HF-REF should involve
initiating diuretic therapy and an angiotensin-converting enzyme (ACE) inhibitor. There is a
large evidence-base for the use of ACE inhibitors in HF-REF for improving both mortality and
morbidity (26;27). For patients hospitalised with decompensated HF, an ACE inhibitor should
be initiated prior to discharge from hospital. Patients intolerant of ACE inhibitors may be
prescribed an angiotensin-receptor blocker (ARB) (28). All patients with HF-REF should also
be treated with a beta-blocker, unless contraindicated. There is significant evidence of
improved mortality and morbidity with the use of beta-blockers in addition to ACE inhibitor
therapy (29-31). Patients hospitalised with decompensated HF may be commenced on beta-
blocker therapy prior to discharge, once they are stable and euvolaemic (31). Following ACE
inhibitor and beta-blocker therapy, patients with HF-REF and persistent symptoms should be
started on an aldosterone antagonist (32;33).

38
The introduction of device therapy, in the form of the implantable cardioverter defibrillator
(ICD) and, more recently, cardiac synchronisation therapy (CRT), has revolutionised the
treatment of HF-REF. ICDs have been demonstrated to reduce the risk of sudden cardiac death
in patients with HF-REF. The majority of evidence for this comes from trials involving
patients with coronary heart disease (34-36) although there is evidence of survival benefit in
patients with non-ischaemic HF-REF (37). CRT with pacemaker function (CRT-P) should be
considered for patients with moderate-severe HF (New York Heart Association [NYHA] III-
IV) with left ventricular ejection fraction (LVEF) ≤ 35% and QRS duration ≥ 120ms that
remain symptomatic despite optimal medical therapy (38). Patients who fulfil criteria for
CRT-P and who have a life expectancy exceeding 1 year should be considered for CRT-D (39).
Patients with mild HF (NYHA I-II, LVEF ≤ 30% and QRS duration ≥ 130ms) (40) and those
with mild-moderate HF (NYHA II-III, LVEF ≤ 30% and QRS duration ≥ 120ms) (41) should
also now be considered for CRT-D.
Surgical treatment for advanced HF-REF is available in the form of cardiac transplantation,
ventricular assist devices and artificial hearts. These are therapies of limited resource, for
financial and availability reasons, and therefore must be targeted to those at highest risk of
dying and greatest potential for benefit. Patients with HF, LVEF ≤ 35% and coronary artery
disease amenable to coronary artery bypass grafting (CABG) may be considered for CABG,
although a recent trial showed no difference in all-cause mortality compared with medical
therapy alone (42).
The evidence-base for the treatment of HF-PEF is less clear. Diuretics are used for
symptomatic control and fluid balance. There is evidence that ARBs reduce hospital
admissions in patients with HF and preserved systolic function (15). However there is no
evidence of mortality benefit with modulation of the renin angiotensin system (15-17). Results
are awaited for the effect of aldosterone antagonist therapy in HF-PEF (43).
39
1.1.7 Prognosis in heart failure
Although advances in the modalities of treatment have greatly improved the prognosis for
patients with HF, the outlook for many remains poor. The mortality rate is high and
comparable with rates seen in many common cancers (44). Around 50% of patients with heart
failure will be dead at 4 years (1). The morbidity and mortality associated with hospitalisation
for HF is dire; 40% of patients will be readmitted or dead within 1 year (1). The mortality rate
for new cases of HF admitted to hospital is highest within the first few weeks with a 30 day
mortality rate approximately 10-20% (2).
1.2 Prognostication in heart failure
1.2.1 Importance of assessing prognosis
Determining whether a patient with HF is at high risk of mortality is important for several
reasons. Optimal tolerated doses of evidence-based medical therapies are indicated regardless
of risk status. However, other therapies for which there are limited resources, such as ICDs,
CRT and cardiac transplantation should be targeted to those at highest risk of dying and
greatest chance of benefit. Those at particularly high risk of dying can be considered for
appropriate end-of life care. Benefits can also come from identifying those at low risk of
dying. Patients at lower risk could be reassured that invasive therapies (e.g. ICDs or
transplantation) are unlikely to be in their interests.
Accurate assessments of prognosis can also confer economic benefits. This is particularly
important given the financial burden associated with HF. The majority of this expenditure is
incurred in the provision of inpatient care. Identifying low risk patients in hospital may allow
appropriate early discharge, thus improving hospital efficiency and targeting intensive
monitoring and longer hospital stays to high risk patients. Furthermore, identifying patients at
high risk of admission or readmission to hospital might allow targeted interventions to lower
hospitalisation rates.
40
A universal approach to defining prognosis in HF is complicated for several reasons. HF is a
clinical syndrome with a range of aetiologies and mechanisms and is associated with both
reduced and preserved LV systolic function. Patients with HF often have co-morbidities which
also influence prognosis. For these reasons, many individual predictors of morbidity and
mortality do not have independent predictive power when incorporated into multivariable
models. Moreover, patients with HF face competing risks of progressive pump failure and
sudden cardiac death (SCD). Thus predicting prognosis for patients with HF is extremely
challenging.
Yet despite the recognised importance of prognostication in HF, accurate determination of
individual risk within this large and heterogeneous population is a major challenge. It has
recently been demonstrated that physicians often fail to accurately predict mortality for
patients with advanced HF (45).
1.2.2 Traditional predictors of prognosis in heart failure
Many individual markers have been associated with an increased risk of mortality and
morbidity in HF. These include a spectrum of demographic data, past medical history,
physical examination findings, comorbidity, aetiology of HF, electrocardiographic parameters,
echocardiographic variables, exercise-related parameters, laboratory blood results and
haemodynamic variables. Some of these markers, for example the natriuretic peptides, have
been identified to be independently predictive in comprehensive multivariable analyses
undertaken in large cohorts of HF patients. However, many markers have limited prognostic
ability having been identified in small cohorts after only univariate or limited multivariable
analyses. Few markers have been evaluated in the prediction of cause-specific death. The
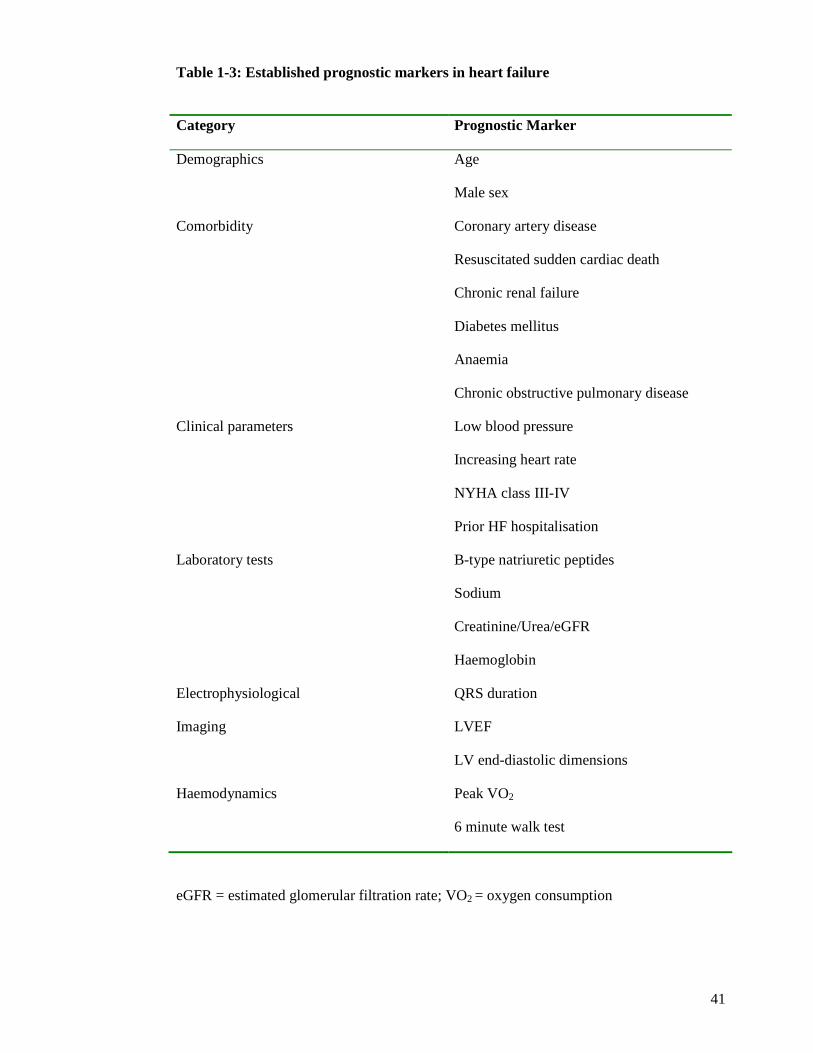
established prognostic markers in HF are displayed in Table 1-3.
The use of individual risk markers in isolation has limited prognostic utility. The absence or
presence of a single risk marker does not necessarily convey a good or bad prognosis. Multiple
individual risk markers may be present in any given patient. Combining these to predict an
individual’s prognosis is a challenge that has not yet been adequately met.
41
Table 1-3: Established prognostic markers in heart failure
Category Prognostic Marker
Demographics Age
Male sex
Comorbidity Coronary artery disease
Resuscitated sudden cardiac death
Chronic renal failure
Diabetes mellitus
Anaemia
Chronic obstructive pulmonary disease
Clinical parameters Low blood pressure
Increasing heart rate
NYHA class III-IV
Prior HF hospitalisation
Laboratory tests B-type natriuretic peptides
Sodium
Creatinine/Urea/eGFR
Haemoglobin
Electrophysiological QRS duration
Imaging LVEF
LV end-diastolic dimensions
Haemodynamics Peak VO2
6 minute walk test
eGFR = estimated glomerular filtration rate; VO2 = oxygen consumption
42
1.2.3 The B-type natriuretic peptides
The natriuretic peptides consist of a group of 4 hormones (A, B, C and D). The principal
role of these hormones is to regulate sodium and water homeostasis via natriuresis, diuresis
and vasodilatation. The B-type natriuretic peptides (BNPs) have been most widely studied
in HF and their name derives from the site of origin of their discovery - porcine brain (46).
However it has since become apparent that the major secretory source of these
neurohormones in humans is the left ventricle (LV). ProBNP is the precursor from which
the biologically active BNP and inactive N-terminal-proBNP (NT-proBNP) are derived.
ProBNP is produced predominantly by ventricular myocytes, and to a lesser extent in the
atria, and synthesis increases in response to stretch and dilatation of the LV. The biological
half-life of BNP is approximately 20 minutes whilst NT-proBNP, partially excreted by the
kidneys, has a half-life of between 1-2 hours. In addition to natriuresis, diuresis and
vasodilatation, the physiological actions of BNP also include inhibition of the sympathetic
and renin-angiotensin-aldosterone systems and reduction in myocardial fibrosis and
vascular smooth muscle proliferation.
Over the last 5-10 years, BNP and NT-proBNP have increasingly been used in HF for
diagnostic and prognostic purposes. One of the strengths of this test as a diagnostic tool is
its high negative predictive value (47). Clinical use of this biomarker has been endorsed by
the ESC guidelines for HF and features in the diagnostic pathway. These guidelines state
that a diagnosis of chronic HF is unlikely in untreated patients with normal BNP or NT-
proBNP levels (1).
In recent years, BNP has become established as a powerful predictor of prognosis in
chronic HF, independent of many other markers of risk. Independent prognostic power for
mortality has been demonstrated across the HF spectrum encompassing asymptomatic
LVSD (48), mild to moderate severity (49;50) and advanced HF (51). It has also been
demonstrated that patients with BNP levels that decrease significantly have a more
favourable prognosis. On the other hand, elevated BNP levels that fail to fall or rise over
serial measurements confer highest mortality risk (52). Studies evaluating the link between
BNP and prognosis have largely concentrated on all-cause mortality or cardiac mortality,
incorporating both modes of death in HF; pump failure and SCD. However, one study has
established BNP to be the only independent predictor of SCD in chronic HF in a
43
multivariable analysis including systolic blood pressure (SBP), LVEF, NYHA, coronary
heart disease, diabetes, heart rate and HF medications (53).
BNP and NT-proBNP have also been demonstrated to be beneficial in the diagnosis of
acute HF. These biomarkers have high negative predictive values for patients presenting to
Accident and Emergency departments with breathlessness (54-56). The diagnostic
accuracy of BNP has incremental benefit, after multivariable adjustment for standard
clinical variables, in the identification of patients with acute HF (55). Akin to its role in
chronic HF, BNP has also been shown to be a powerful determinant of prognosis in acute
HF (57). BNP levels that rise during an admission with acute HF are predictive of an
increased risk of both mortality and readmission with decompensated HF (58). Moreover,
one study found a high pre-discharge BNP to be the only significant variable for predicting
risk of death or readmission with HF. This followed multivariable adjustment including
clinical variables, echocardiographic parameters and percentage change in BNP levels
during admission (59).
BNP and NT-proBNP are simple, non-invasive biomarkers with powerful prognostic
utility in HF, independent of many established predictors of risk. The BNPs should be
incorporated into the management of all patients with HF to guide prognostication.
1.2.4 Cardiac troponin
Cardiac troponins are emerging as potentially powerful biomarkers for prognostication in
HF. Troponin is a complex of three integrated proteins (troponin C, troponin I and troponin
T), integral to muscle contraction and relaxation and under the regulation of intracellular
calcium concentration (60). Cardiac troponin I and troponin T are cardiac specific, levels
are not raised following noncardiac injury or disease. Cardiac troponin has become
established as the gold standard biomarker for the diagnosis of acute myocardial infarction
(61). Acute myocardial ischaemia and necrosis destroys the myocyte structure, resulting in
large elevations of the troponin proteins in the bloodstream. Modern troponin assays are
able to detect small elevations in cardiac troponin, representative of minor myocardial
injury in acute coronary syndromes. These biomarkers provide prognostic information and
44
are used in the risk stratification process for patients with an acute coronary syndrome (62-
64).
Troponin elevation reflects myocardial damage but is not indicative of a specific
pathological process. Elevated levels of troponin are detectable in the absence of
myocardial ischaemia in a wide range of clinical conditions, including HF. The majority of
cardiac troponin is located within the complex involved in the contractile process with the
remainder existing in the cytoplasm. The mechanisms of nonischaemic troponin elevations
are unclear but are probably related to disruption of the cell membrane and release of
cytoplasmic troponin, leading to small rises of troponin concentration in the bloodstream.
Possible mechanisms in HF include; ongoing myocyte necrosis in ischaemic LVSD (65),
cellular stretch in dilated cardiomyopathy (66-68), ventricular remodelling (69) and
chronic activation of the neuroendocrine and inflammatory pathways (70).
Several studies over the last decade have identified an elevated troponin in 10-50% of
patients with chronic HF (71-73). Troponin elevation in patients with stable HF may reflect
pathophysiological mechanisms such as continual ‘cytosolic leakage’. Elevation of this
biomarker has been linked with adverse clinical outcomes, including mortality,
hospitalisation with HF and cardiac transplantation (71-75). A multimarker approach with
BNP and other established biomarkers has recently been shown to improve risk
stratification in two modest-sized studies of patients with advanced HF (71;75). Only one
study published to date has included troponin in a prognostic risk score for chronic HF (76).
This large study stratified patients into risk categories using ten non-invasive variables,
including troponin and NT-proBNP. A high score corresponded with a four-fold risk of the
primary outcome of cardiac mortality. This risk tool is yet to be validated in an external
cohort to determine its applicability to a general HF population.
More recently, troponin elevation has been identified in patients with acute decompensated
HF. Unsurprisingly, these studies have found high proportions of patients to have raised
troponin levels in the decompensated state (69;70;77-82). Elevation of troponin has also
been linked to adverse clinical events in these studies. Although many of these studies
have evaluated the incremental prognostic value of an elevated troponin, albeit some in
limited multivariable analyses, the incorporation of troponin into a prognostic risk tool is
currently lacking for acute HF.
45
Troponin elevation is common in chronic and acute HF, the prognostic significance of
which is emerging. Many studies to date have evaluated the impact of a raised troponin in
univariate or limited multivariable analyses. More recent analyses have shown an
incremental prognostic value for troponin over the natriuretic peptides. No studies have
evaluated the significance of elevated troponin in prediction of cause-specific death in HF.
The combination of troponin with other established biomarkers in the form of a prognostic
scoring tool may improve risk stratification in HF.
1.2.5 Rationale for improving prognostication
There remains a real need for improving prognostication in order to improve the
management of patients with heart failure. This is essential in an era in which complex
therapies are improving outcomes but are limited by resources and financial restraints.
Accurate targeting of these therapies is required to optimise their use. An accurate means
of predicting an individual’s risk will facilitate the efficient allocation of therapies and
provide physicians with an objective assessment of their patient’s prognosis. The latter
may enable medical staff to have more honest and informative discussions with their
patients regarding prognosis. In a wider sense, improving risk assessment in HF may
further knowledge of the pathophysiology of this condition. Identification of novel
biomarkers and determining the combinations of variables which identify those at greatest
risk are likely to provide avenues for further research and new targets for potential
therapeutic intervention.
1.2.6 Identifying cause-specific mortality in heart failure
Many established and novel biomarkers are predictive of an increased risk of all-cause
mortality. Few biomarkers have demonstrated a capability to determine cause-specific
mortality. This is particularly relevant in HF where many deaths may be attributed to SCD
caused by ventricular tachyarrhythmic events (VTE) and better selection of candidates for
primary prevention ICD devices is warranted. Many guidelines advocate the use of LVEF
to select candidates who would most benefit from device implantation (1;83;84), as this
was what gated the clinical trials inclusion criteria. However, in the largest randomised
controlled trial evaluating primary prevention ICD therapy in patients with reduced LVEF
46
HF, 79% of patients in the ICD arm did not use their device (37). Moreover the absolute
risk reduction in the group randomised to ICD therapy was modest at 7.2% over 5 years
follow-up. Although this landmark study clearly demonstrated the mortality benefit
associated with reducing SCD in HF, it also highlighted the limitation of LVEF in isolation
for identifying those at risk of SCD.
Other non-invasive tests have been scrutinised as potential biomarkers for predicting the
risk of SCD in HF. These include electrocardiographic parameters, markers of autonomic
dysfunction, imaging modalities and serum biomarkers.
A prolonged QRS duration is associated with a poor prognosis in patients with HF and is
currently part of the selection criteria for implantation of CRT devices (83;84). However,
patients with HF and a normal QRS duration remain at high risk of SCD (37;85). This
highlights the difficulty of using QRS duration as a tool for predicting risk and ICD
requirement. The presence of nonsustained arrhythmias does not predict risk of SCD in HF
(86). Markers of ventricular repolarisation, such as QT dispersion, QT dynamics (ratio of
QT to RR interval) and QT interval rate dependence have been linked to increased risk of
arrhythmias. Many of these markers have been predictive for all-cause mortality rather
than SCD or have been predictive for SCD after limited multivariable analyses and in
patients on sub-optimal medical therapy (87). Other electrophysiological markers, such as
signal-averaged electrocardiogram (ECG), are also limited predictors of SCD due to their
low sensitivity (88). Markers of autonomic dysfunction, such as baroreflex sensitivity and
heart rate variability, have limited clinical utility due to their low sensitivity (88). The
clinical utility of BNP as an independent predictor of SCD in chronic HF has already been
discussed in section 1.2.3. Markers of collagen turnover, such as procollagen type 1
aminoterminal peptide (PINP) and PIIINP have been demonstrated to be elevated in HF
and may have a role in predicting SCD (89). The role of nuclear imaging with single-
photon emission computed tomography (SPECT) is expanding in HF and may be used to
risk stratify patients for SCD in the future (90).
Microvolt T-wave alternans (MTWA) has recently been proposed as a potential tool for
identifying patients at risk of sudden cardiac death and assisting in the selection of patients
for primary prevention ICD therapy.
47
1.3 Microvolt T-wave alternans in heart failure
1.3.1 Definition and clinical application
T-wave alternans describes beat-to-beat fluctuations in the morphology of the
electrocardiographic T-wave. Experimentally, it has been suggested that T-wave alternans
is caused by cellular repolarisation alternans, which can cause dynamic instability in
cardiac repolarisation and has been mechanistically linked to a predisposition to ventricular
arrhythmias (91). Repolarisation alternans is thought to be due to action potential duration
alternans and abnormal intracellular calcium handling (92). Repolarisation alternans
normally develops in a concordant way with all myocytes alternating in phase. The
presence of repolarisation alternans may cause arrhythmias if discordant repolarisation
alternans develops. In early clinical studies, MTWA during atrial pacing was associated
with ventricular arrhythmia (93). MTWA testing is now performed clinically using a
commercially available system (CH2000 or HearTwave II, Cambridge Heart, Bedford,
Mass). MTWA testing is undertaken using proprietary low-noise ECG electrodes. Patients
must be in sinus rhythm and the heart rate is increased up to a maximum of 110 beats per
minute (bpm) by using sub maximal treadmill exercise. A series of beats recorded at a
stable heart rate are lined up and the amplitude of each T-wave at the same time with
respect to the QRS complex is plotted. These data then undergo spectral analysis using fast
Fourier transformation, a computer mathematical process that transforms a waveform into
the components of its frequency spectrum. This determines the magnitude, at the microvolt
level, of T-wave fluctuations occurring on alternate beats. If sufficient alternans is
sustained at heart rates <110 bpm, the test is classified as positive. Absence of alternans
activity at 110 bpm constitutes a negative test. Alternans is a heart rate dependent
phenomenon and the presence of alternans at heart rates >110 bpm is considered normal. A
test that satisfies neither set of criteria is classified as indeterminate. An indeterminate test
may occur when analysis is not possible due to artifact, ectopic beats, nonsustained
alternans or inability to raise the heart rate to 110 bpm. The latter may occur either due to
chronotropic incompetence or if the patient is physically incapable of exercising long
enough to raise their heart rate. The computer system generates a report and an automatic
classification of the MTWA results. MTWA tests are reported as positive, negative or
indeterminate. Patients in AF are ineligible for MTWA testing by the spectral method as
unequal R-R intervals confound the frequency analysis. MTWA can also be determined
48
with time-domain methods, which are applicable to AF and Holter data. This method has
been evaluated during pacing (94), in patients undergoing routine exercise tolerance testing
(95) and in post myocardial infarction studies (96;97), but at present no prospective data
are available regarding the prognostic value of Holter-based MTWA testing in patients
with HF.
1.3.2 Predictive value of microvolt T-wave alternans
The published studies that have assessed the predictive value of MTWA testing during
exercise are summarised in Table 1-4.
1.3.2.1 Known or suspected arrhythmia
In a population of 313 patients referred for cardiac electrophysiological study (EPS), a
positive MTWA test predicted the primary endpoint of VTE (VTE: SCD, ventricular
fibrillation [VF], sustained ventricular tachycardia [VT] or appropriate ICD therapy) better
than EPS (relative risk [RR] 10.9 vs.7.1) (98). However, this was a heterogeneous
population; some patients were referred for EPS because of prior cardiac arrest, while
others were undergoing assessment of supraventricular tachycardia.
1.3.2.2 Myocardial infarction
Three studies have investigated the prognostic utility of MTWA following myocardial
infarction (MI) regardless of LVEF. Only one has suggested that MTWA may predict SCD.
This study enrolled 850 consecutive patients who underwent MTWA testing after MI
(mean 2.7 months post-MI). A positive MTWA test predicted SCD or resuscitated VF,
although the event rate was only 3% in this population (99). The proportion of patients
prescribed a beta-blocker was low (30%). Two other studies have suggested that MTWA is
not prognostically useful in this population. In one, 140 consecutive patients were
investigated in the first 30 days following MI. Only three endpoints, death or VTE,
occurred over 15 months of follow-up (100). A positive MTWA test did not predict events
in this low-risk population. The second study examined the predictive value of MTWA for
49
all-cause mortality in patients early after MI (mean 8 days post-MI) (101). Of 323
consecutive patients, only 56 (17%) had a positive MTWA result. None of the 26 deaths
occurred in this group. Notably, these patients were receiving optimal medical therapy,
including a beta-blocker in 97%, at the time of MTWA testing.
In a cohort of 1041 patients with preserved LVEF after MI (mean 48 days post-MI), a
positive MTWA test did predict VTE, although the number of endpoints was extremely
low over a long period of follow-up (18 over 34 months) (102).
Two small studies have enrolled patients meeting Multicenter Automatic Defibrillator
Implantation Trial (MADIT)-II entry criteria (previous MI, LVEF ≤ 30% and no history of
ventricular arrhythmia) from other cohorts. In 129 such patients, none of the twelve who
experienced SCD or resuscitated VF had a negative MTWA result (103). In a subgroup
analysis of a larger study, 177 patients meeting MADIT-II criteria were studied. MTWA
tests were classified as abnormal (positive or indeterminate) in 68% and normal (negative)
in 32% (85). The hazard ratio (HR) associated with an abnormal test was 4.8 (95%
Confidence Interval [CI]: 1.1-20.7), but this was only adjusted for QRS duration, and
therefore does not reflect incremental prognostic value.
Results from two larger studies were published after my study commenced. The Microvolt
T-Wave AlternanS Testing for Risk Stratification of Post MI Patients (MASTER) study
(104) study examined MTWA in 575 MADIT-II-indicated ICD-treated patients. MTWA
tests were classified as non-negative (positive 51% and indeterminate 12%) and negative
(37%). After multivariable adjustment (including age, LVEF, beta-blocker medications,
QRS duration and NYHA class), a non-negative MTWA result did not predict VTE. The
Cardiac Arrhythmias and Risk Stratification After Acute Myocardial Infarction
(CARISMA) study (105) examined MTWA in 312 patients. Patients were tested six weeks
post-MI, all had LVEF ≤ 40% and all received an implantable ECG loop-recorder. In
addition to MTWA testing, heart rate variability measures, signal-averaged ECG and
electrophysiological studies were also performed. MTWA was not predictive of the
primary endpoint of VF/VT, all-cause mortality or cardiac death. The strongest predictors
of the primary endpoint were measures of heart rate variability. MTWA does not appear to
have clinical benefit early after MI in patients with LVSD.
50
The evidence for the use of MTWA in the risk stratification of patients post-MI is not
robust. The negative predictive value (NPV) may be high in selected patients, but the
results are conflicting in more representative cohorts.
1.3.2.3 Ischaemic left ventricular systolic dysfunction
Three studies have examined the prognostic value of MTWA in patients with ischaemic
LVSD. The first performed MTWA testing in 144 non-consecutive patients referred for
EPS (106). The cohort was separated into primary (n = 88) and secondary (n = 56)
prevention subgroups and 111 patients received an ICD, because of a prior history or
induction of sustained ventricular arrhythmia. A positive MTWA test did not predict the
primary endpoint, death or VTE, in the primary prevention subgroup.
The second study evaluated 768 consecutive patients with coronary heart disease and
LVSD (107). The authors analysed positive and indeterminate tests together and separately,
addressed cause-specific death as a secondary endpoint, and performed a more extensive
multivariable analysis than previous studies. However, the follow-up was relatively short
(mean 18±10 months) and the event rate (n=99) was low for this type of population,
limiting the power of the study. A non-negative MTWA test independently predicted all-
cause mortality (HR 2.24; 95% CI, 1.34 to 3.75) and arrhythmic mortality (HR 2.29; 95%
CI, 1.0 to 5.24) in the whole population. However, when positive and indeterminate results
were analysed separately, positive results failed to predict arrhythmic mortality, whereas
indeterminate results predicted both all-cause and arrhythmic death. Therefore,
indeterminate rather than positive tests accounted for the majority of the predictive value
for arrhythmia in this study, which contradicts the proposition that MTWA identifies a
specific proarrhythmic substrate.
The Alternans Before Cardioverter Defibrillator (ABCD) study published results as my
study was closing (108). This interventional study recruited 566 patients with ischaemic
LVSD and nonsustained VT and compared the ability of MTWA and EPS to predict VTE.
The 1-year event rate was lowest (2.3%) when both tests were negative and highest (11.1%)
when both were positive. The event rate was intermediate and similar when only 1 test was
positive (MTWA positive, 6.5%; EPS positive, 7.8%). However, the 1-year event rate was
51
highest when MTWA was indeterminate and EPS was positive (14.8%). Use of an ICD
(shock or pacing) accounted for the majority of end points (85%). However, ICD
implantation was not compulsory if both tests were normal, and so patients in this group
(n=99) may have been less likely to reach an end point. Moreover, because ICD therapies
occur more frequently than SCD in patients without ICDs, a significant proportion of the
end points in this study may have been attributable to non clinical arrhythmias.
1.3.2.4 Left ventricular systolic dysfunction irrespective of aetiology
One study recruited 549 patients with LVSD and no history of sustained ventricular
arrhythmia, including patients with both ischaemic (n = 267) and non-ischaemic (n = 282)
cardiomyopathy (109). The primary endpoint was a composite of death and VTE. Over 20
months, there were 2 deaths and 2 ICD discharges in the normal (negative) MTWA group
(n = 189) compared with 38 deaths and 9 ICD discharges in the abnormal (positive or
indeterminate) MTWA group (n = 360). The proportion with an ICD in each group was the
same. After multivariable adjustment, an abnormal MTWA test was associated with an
increased risk of VTE.
Results were published from an electrophysiological MTWA study shortly after my study
began. This study investigated the predictive value of MTWA in patients with both
ischaemic and nonischaemic cardiomyopathy, referred for EPS for evaluation of non-
sustained VT and/or syncope (110). MTWA was performed during atrial pacing at the time
of EPS. Over 38 months, the primary endpoint of arrhythmia-free survival (defined as
freedom from death or sustained ventricular arrhythmias) was higher in MTWA negative
patients (88%) than MTWA non-negative patients (66%). However, the two-year event
rate for death or sustained ventricular arrhythmias was 19% among the MTWA negative
patients. This suggests MTWA alone may be insufficient for identifying a low-risk
population who, by implication, do not need ICD implantation.
1.3.2.5 Nonischaemic left ventricular systolic dysfunction
Three studies have examined the prognostic utility of MTWA in non-ischaemic
cardiomyopathy. The first study performed MTWA testing in 104 patients and found that a
52
positive MTWA test was independently associated with VTE (111). However, this study
has many limitations. The actual number of endpoints was very small (n=12), as was the
sample size, limiting the multivariable analysis. Many screened patients were ineligible
because of AF, but no information was given regarding the number or characteristics of the
patients screened. No patient was prescribed an ACE inhibitor or beta-blocker prior to
entry into the study and thus MTWA testing was carried out on sub-optimal medical
therapy. The mean NYHA functional class was less than II and more than half of the
patients were not prescribed a diuretic, suggesting the majority had asymptomatic LVSD,
not symptomatic heart failure. The second recruited 137 patients and compared MTWA
with other arrhythmic markers (112). A positive MTWA test was the only independent
predictor of VTE after a mean of 14 months follow-up. This study again has many
limitations. The multivariable model did not include age or LVEF. The cohort included
patients with an ICD (27%), mostly for prior sustained ventricular arrhythmia, and 11 of 18
endpoints occurred in those patients. This restricts extrapolation of these results to a
primary prevention population. The third and largest study (n = 263) excluded patients
with prior VF/VT and had a longer duration of follow-up (52 months) (113). In this study a
positive MTWA test was not associated with the occurrence of VTE. In this study an
indeterminate test was associated with the primary outcome on univariate analysis.
The available evidence suggests that MTWA is not a reliable indicator of arrhythmia in
patients with non-ischaemic LVSD. There appears to be little to recommend a strategy of
using MTWA in this population to determine which patients should or should not have an
ICD.
1.3.2.6 Symptomatic heart failure with low left ventricular ejection fraction
The evidence for the prognostic utility of MTWA in LVSD cannot simply be extrapolated
to patients with symptomatic chronic HF, which is a clinically distinct entity. When my
study began, only three small studies (n=73, n=46, n=107) had assessed the predictive
value of MTWA testing in patients with HF-REF (114-116). On initial review these studies
suggest that MTWA predicts clinical outcome in this population. However, they do have
several limitations beyond their size.
53
The first study selected 73 patients with NYHA II chronic HF after excluding those with
LVEF ≤ 20% “because of high risk of death”. An additional 17 patients with indeterminate
results were excluded, leaving a small and highly selected group in which a positive
MTWA test was associated with an increased risk of VTE over 17 months (114). In
another study, of 46 patients with NYHA II-III chronic HF, MTWA predicted cardiac
death (n=7) but not SCD (n=1) (115). In the third study, of 107 patients with chronic HF,
none of the 13 end points occurred in MTWA-negative patients and MTWA was the only
independent predictor of VTE (116). However, this multivariable analysis included only 7
arrhythmia markers.
These studies are small, appear to be highly selected, and lack proper multivariable
adjustment. Their limited relevance to real-life populations with chronic HF is exemplified
by the mean ages of the patients enrolled (64 years, 59 years, and 56 years, respectively).
The average age of unselected HF populations is 75 years (117). This evidence certainly
does not support the routine use of MTWA testing to risk stratify patients with chronic HF.
Results were published from two larger studies of MTWA in chronic HF after my study
began. The Microvolt T-Wave Alternans in Patients with Heart Failure (ALPHA) study
recruited 446 patients with non-ischaemic cardiomyopathy (LVEF ≤ 40%) and stable
NYHA II-III chronic HF on optimal medical therapy (118). A non-negative MTWA test
was associated with an increased risk of cardiac death or VTE over 18 - 24 months.
However, these patients were older, more symptomatic, and had lower mean LVEF,
imbalances that highlight the need for careful multivariable adjustment in such studies. In
the Sudden Cardiac Death in Heart Failure Trial (SCD-HeFT) T-wave alternans sub-study,
MTWA testing was performed in 490 patients with LVEF ≤ 35% and NYHA II-III chronic
HF (119). In this study 41% of tests were indeterminate and over 35 months there was no
difference in the rate of VTE between MTWA groups for patients who received either ICD
or placebo. These studies are larger than those published to date and their contradictory
results means that doubt remains regarding the value of MTWA for predicting arrhythmic
risk in chronic HF.
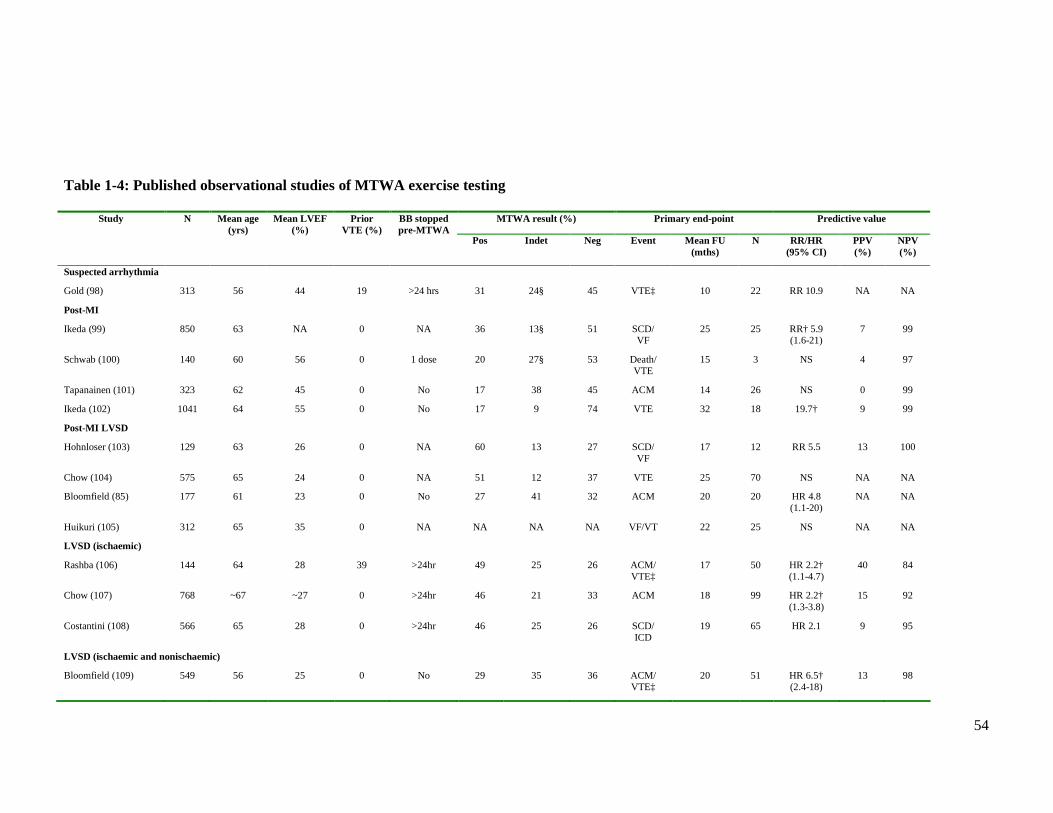
54
Table 1-4: Published observational studies of MTWA exercise testing
MTWA result (%) Primary end-point Predictive value Study N Mean age (yrs)
Mean LVEF (%)
Prior VTE (%)
BB stopped pre-MTWA
Pos Indet Neg Event Mean FU (mths)
N RR/HR (95% CI)
PPV (%)
NPV (%)
Suspected arrhythmia
Gold (98) 313 56 44 19 >24 hrs 31 24§ 45 VTE‡ 10 22 RR 10.9 NA NA
Post-MI
Ikeda (99) 850 63 NA 0 NA 36 13§ 51 SCD/ VF
25 25 RR† 5.9 (1.6-21)
7 99
Schwab (100) 140 60 56 0 1 dose 20 27§ 53 Death/ VTE
15 3 NS 4 97
Tapanainen (101) 323 62 45 0 No 17 38 45 ACM 14 26 NS 0 99
Ikeda (102) 1041 64 55 0 No 17 9 74 VTE 32 18 19.7† 9 99
Post-MI LVSD
Hohnloser (103) 129 63 26 0 NA 60 13 27 SCD/ VF
17 12 RR 5.5 13 100
Chow (104) 575 65 24 0 NA 51 12 37 VTE 25 70 NS NA NA
Bloomfield (85) 177 61 23 0 No 27 41 32 ACM 20 20 HR 4.8 (1.1-20)
NA NA
Huikuri (105) 312 65 35 0 NA NA NA NA VF/VT 22 25 NS NA NA
LVSD (ischaemic)
Rashba (106) 144 64 28 39 >24hr 49 25 26 ACM/ VTE‡
17 50 HR 2.2† (1.1-4.7)
40 84
Chow (107) 768 ~67 ~27 0 >24hr 46 21 33 ACM 18 99 HR 2.2† (1.3-3.8)
15 92
Costantini (108) 566 65 28 0 >24hr 46 25 26 SCD/ ICD
19 65 HR 2.1 9 95
LVSD (ischaemic and nonischaemic)
Bloomfield (109) 549 56 25 0 No 29 35 36 ACM/ VTE‡
20 51 HR 6.5† (2.4-18)
13 98
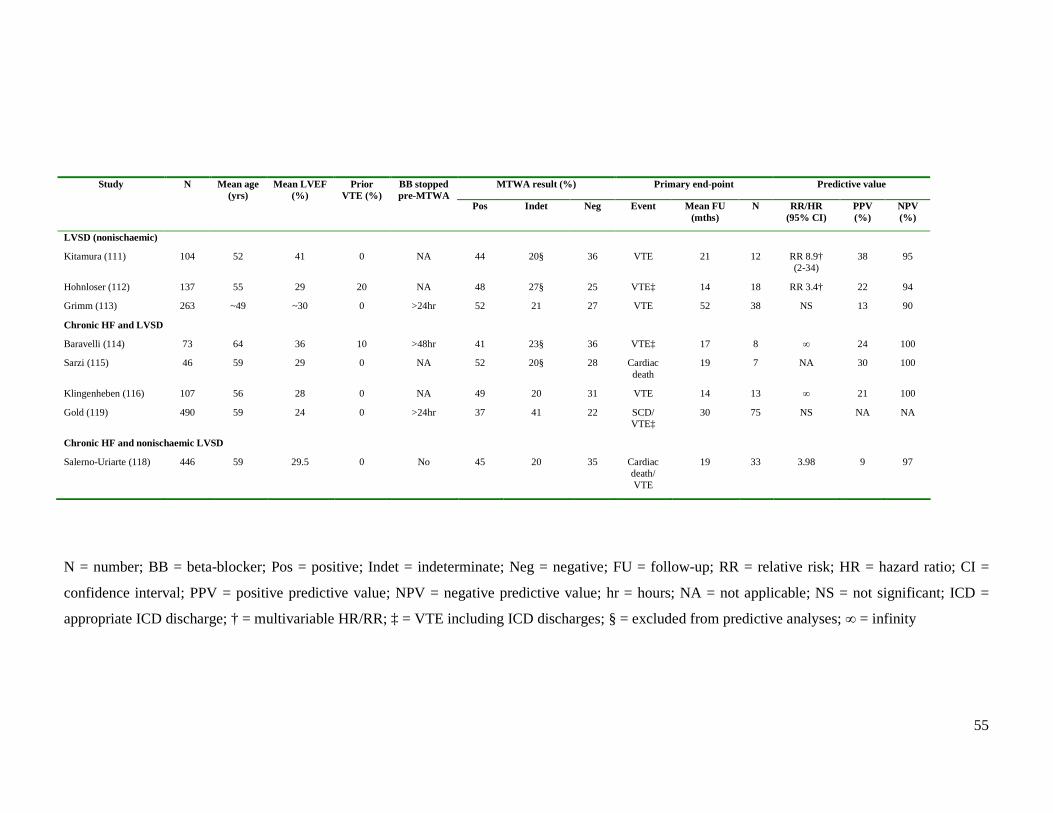
55
MTWA result (%) Primary end-point Predictive value Study N Mean age (yrs)
Mean LVEF (%)
Prior VTE (%)
BB stopped pre-MTWA
Pos Indet Neg Event Mean FU (mths)
N RR/HR (95% CI)
PPV (%)
NPV (%)
LVSD (nonischaemic)
Kitamura (111) 104 52 41 0 NA 44 20§ 36 VTE 21 12 RR 8.9† (2-34)
38 95
Hohnloser (112) 137 55 29 20 NA 48 27§ 25 VTE‡ 14 18 RR 3.4† 22 94
Grimm (113) 263 ~49 ~30 0 >24hr 52 21 27 VTE 52 38 NS 13 90
Chronic HF and LVSD
Baravelli (114) 73 64 36 10 >48hr 41 23§ 36 VTE‡ 17 8 ∞ 24 100
Sarzi (115) 46 59 29 0 NA 52 20§ 28 Cardiac death
19 7 NA 30 100
Klingenheben (116) 107 56 28 0 NA 49 20 31 VTE 14 13 ∞ 21 100
Gold (119) 490 59 24 0 >24hr 37 41 22 SCD/ VTE‡
30 75 NS NA NA
Chronic HF and nonischaemic LVSD
Salerno-Uriarte (118) 446 59 29.5 0 No 45 20 35 Cardiac death/ VTE
19 33 3.98 9 97
N = number; BB = beta-blocker; Pos = positive; Indet = indeterminate; Neg = negative; FU = follow-up; RR = relative risk; HR = hazard ratio; CI =
confidence interval; PPV = positive predictive value; NPV = negative predictive value; hr = hours; NA = not applicable; NS = not significant; ICD =
appropriate ICD discharge; † = multivariable HR/RR; ‡ = VTE including ICD discharges; § = excluded from predictive analyses; ∞ = infinity
56
1.3.3 Unresolved issues in Microvolt T-wave alternans testing
1.3.3.1 Does MTWA have incremental prognostic value?
There are, at present, few data regarding the true incremental prognostic value of MTWA
testing, due to the lack of detailed multivariable analysis undertaken in the studies to date.
The parameters that have been included in these limited multivariable analyses are
displayed in Table 1-5. A number of powerful predictors of outcome in chronic HF have
been identified including BNP, as outlined in section 1.2.3. BNP has also been found to be
an independent predictor of SCD (53). The prognostic value of MTWA testing has not
been compared with that of BNP. It is certainly conceivable that a low BNP could confer
as good a prognosis as a negative MTWA test. If this were the case, then the cost and small
risk to the patient associated with MTWA testing would be unjustified. Although BNP may
be considered unsuitable for risk stratification because concentrations may vary over short
periods of time, there is no evidence regarding the reproducibility of MTWA results over
timescales greater than a few hours (120). MTWA testing should be investigated as an
independent predictor of outcome over and above already established indicators in chronic
HF.
1.3.3.2 Atrial fibrillation
MTWA exercise testing cannot be performed in patients with AF. Only 2 studies have
reported the proportion of screened patients ineligible due to AF [23% (113) and 22%
(118)]. In the MADIT-II study 9% of patients had AF (36), and in populations with chronic
HF approximately 25-30% have concurrent AF (121). If sufficient evidence was obtained
to allow MTWA to be used to identify appropriate candidates for ICD therapy in
populations with sinus rhythm, alternative strategies will have to be found for the large
population ineligible for testing. Other methods of MTWA analysis, which may be
applicable to patients with AF, are available, but there are as yet no published data
regarding their prognostic value.
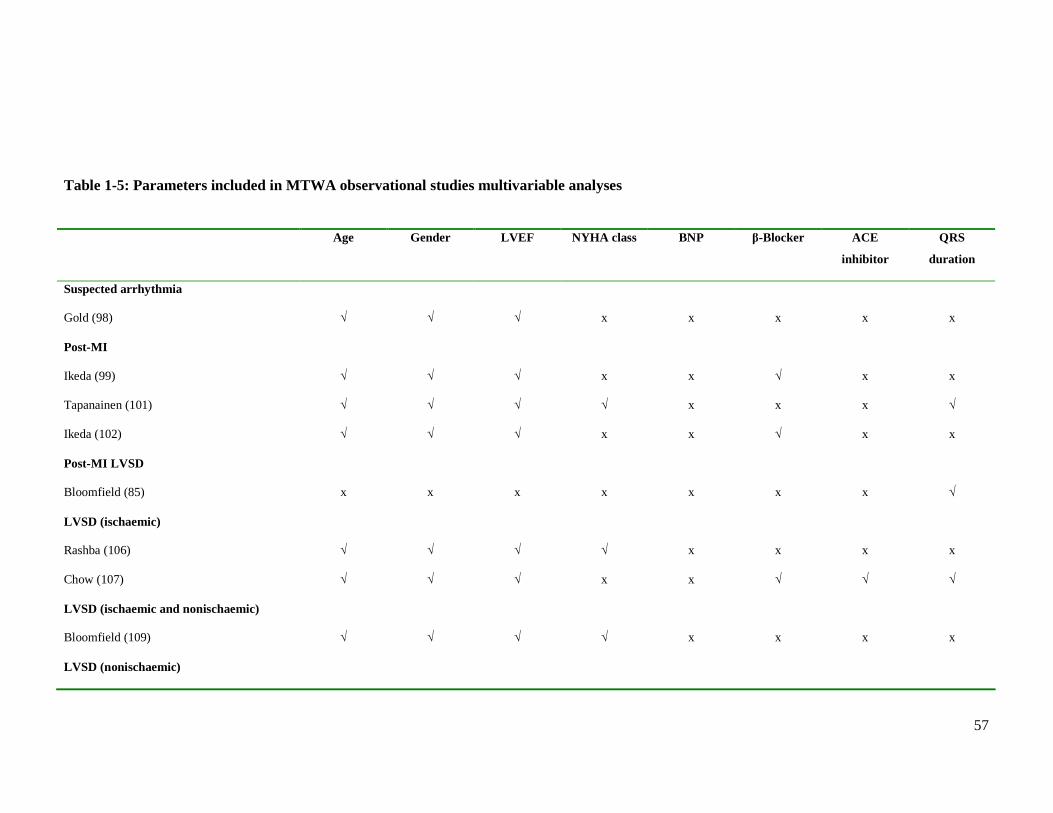
57
Table 1-5: Parameters included in MTWA observational studies multivariable analyses Age Gender LVEF NYHA class BNP β-Blocker ACE
inhibitor
QRS
duration
Suspected arrhythmia
Gold (98) √ √ √ x x x x x
Post-MI
Ikeda (99) √ √ √ x x √ x x
Tapanainen (101) √ √ √ √ x x x √
Ikeda (102) √ √ √ x x √ x x
Post-MI LVSD
Bloomfield (85) x x x x x x x √
LVSD (ischaemic)
Rashba (106) √ √ √ √ x x x x
Chow (107) √ √ √ x x √ √ √
LVSD (ischaemic and nonischaemic)
Bloomfield (109) √ √ √ √ x x x x
LVSD (nonischaemic)
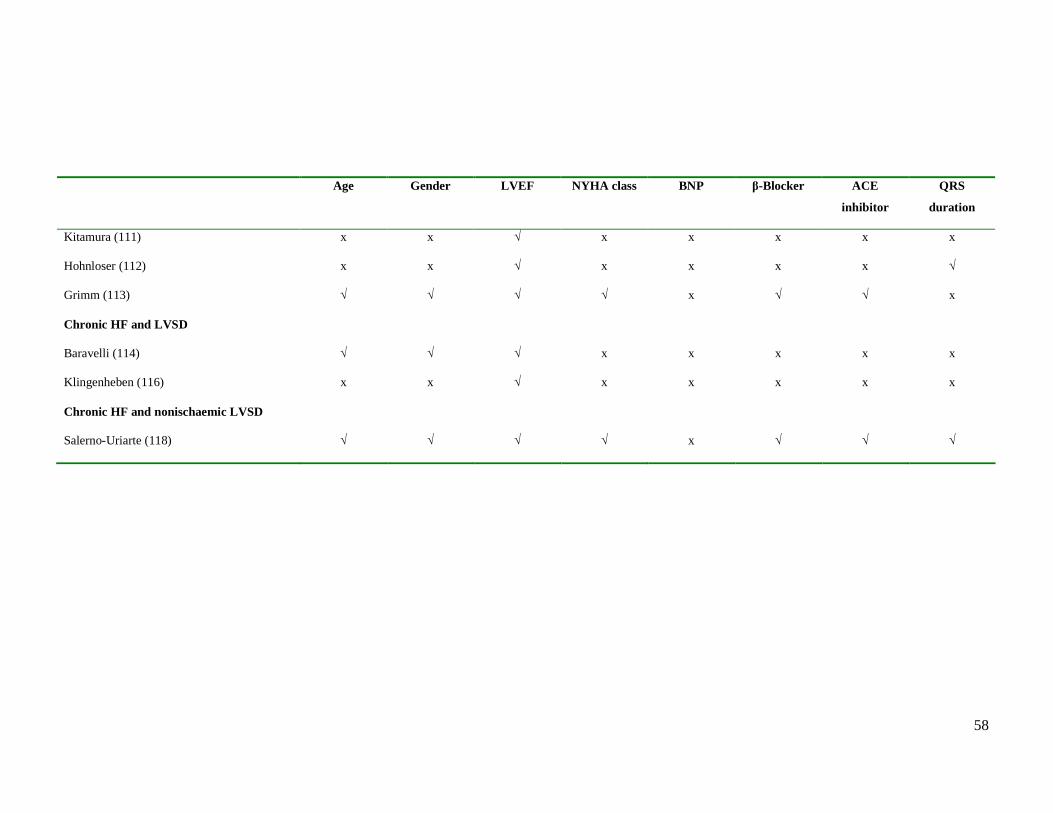
58
Age Gender LVEF NYHA class BNP β-Blocker ACE
inhibitor
QRS
duration
Kitamura (111) x x √ x x x x x
Hohnloser (112) x x √ x x x x √
Grimm (113) √ √ √ √ x √ √ x
Chronic HF and LVSD
Baravelli (114) √ √ √ x x x x x
Klingenheben (116) x x √ x x x x x
Chronic HF and nonischaemic LVSD
Salerno-Uriarte (118) √ √ √ √ x √ √ √
59
1.3.3.3 Inability to exercise
One post-MI study reported that 15% of 379 consecutive patients in sinus rhythm could not
exercise due to co-morbidity or physical frailty (101). Although a positive MTWA test did
not predict all-cause mortality, inability to perform the exercise test was found to be an
independent predictor of death (RR 5.62; 95% CI, 1.76 to 15.99). Implementation of a risk
stratification tool which requires exercise is likely to be problematic in populations such as
chronic HF and LVSD, where the incidence of frailty and co-morbidity is high.
1.3.3.4 Medical therapy
Pharmacological therapy can reduce SCD. Yet optimal medical therapy was mandatory
inclusion criteria in only one of the studies described. Less than half of patients were
prescribed a beta-blocker in one post-MI study (99) and two chronic HF studies (115;116).
Most studies have discontinued beta-blockers for at least 24 hours, to facilitate elevation in
heart rate and reduce indeterminate tests. This practice is not suitable for many HF patients,
but whether beta-blocker continuation would then prevent a significant portion of patients
achieving the heart rate required for a valid test is uncertain but clearly important. Aside
from the impact on heart rate, there is also evidence that acute beta-blockade reduces the
magnitude of MTWA, potentially converting a positive to a negative test (122). Omission
of beta-blockers may not only reduce the number of indeterminate tests but may also
increase the number of positive tests. I believe that MTWA testing is only clinically
valuable, if shown to be independently predictive of outcome in patients on optimal
tolerated medical therapy, including a beta-blocker.
1.3.3.5 Indeterminate MTWA results
MTWA tests are classified as indeterminate in the following circumstances: if there is
significant noise or ventricular ectopy; if alternans is unsustained; or if the patient is able to
exercise but cannot attain a heart rate of 110bpm for one minute. In early studies,
indeterminate MTWA tests were believed to be of no significance to arrhythmic events and
were excluded from predictive analyses. However, in a study of 177 patients post-MI,
indeterminate MTWA tests accounted for the majority of non-negative tests. The authors
60
grouped indeterminate and positive tests together as abnormal (85), which has now become
common practice in MTWA studies. Table 1-6 shows outcomes in MTWA positive and
indeterminate groups from studies which have examined all-cause mortality. For each
study, mortality was higher in the MTWA indeterminate group than in the MTWA positive
group. Clearly, an indeterminate test result indicates a poor prognosis, but the nature of
this risk is unclear. Only one study, in patients with ischaemic LVSD, enrolled a
sufficiently large cohort to examine cause-specific mortality (Table 1-7). Indeterminate
tests accounted for 159 of 514 non-negative MTWA tests and an indeterminate test
predicted both arrhythmic and non-arrhythmic death, whereas a positive test only predicted
all-cause mortality (107). Moreover, in another study, the rate of major arrhythmic events
was higher in the indeterminate group (24%) than either the MTWA positive (13%) or
negative (10%) groups (113).
This suggests that an indeterminate test may actually predict both non-arrhythmic and
arrhythmic risk. While this may seem counter-intuitive, it is possible that patients with
unsustained alternans or ectopy on exercise are prone to ventricular arrhythmia. Recent
analyses of indeterminate tests concluded that such patients were at high risk, distinct from
the tests categorised as indeterminate due to noise, artifact or a sharp rise in heart rate
(123;124). This suggests that the classification of MTWA tests may require re-evaluation
and the prognostic value of MTWA may be improved by reclassification of indeterminate
tests.
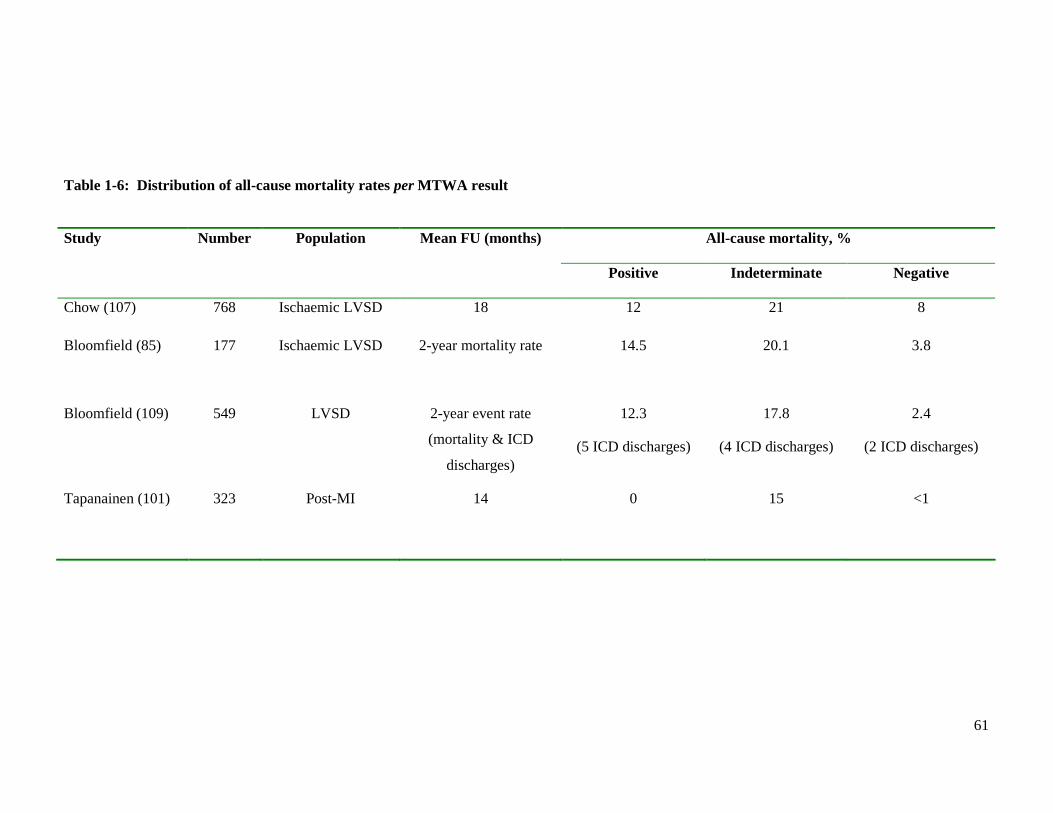
61
Table 1-6: Distribution of all-cause mortality rates per MTWA result
All-cause mortality, % Study Number Population Mean FU (months)
Positive Indeterminate Negative
Chow (107) 768 Ischaemic LVSD 18 12 21 8
Bloomfield (85) 177 Ischaemic LVSD 2-year mortality rate 14.5 20.1 3.8
Bloomfield (109) 549 LVSD 2-year event rate
(mortality & ICD
discharges)
12.3
(5 ICD discharges)
17.8
(4 ICD discharges)
2.4
(2 ICD discharges)
Tapanainen (101) 323 Post-MI 14 0 15 <1
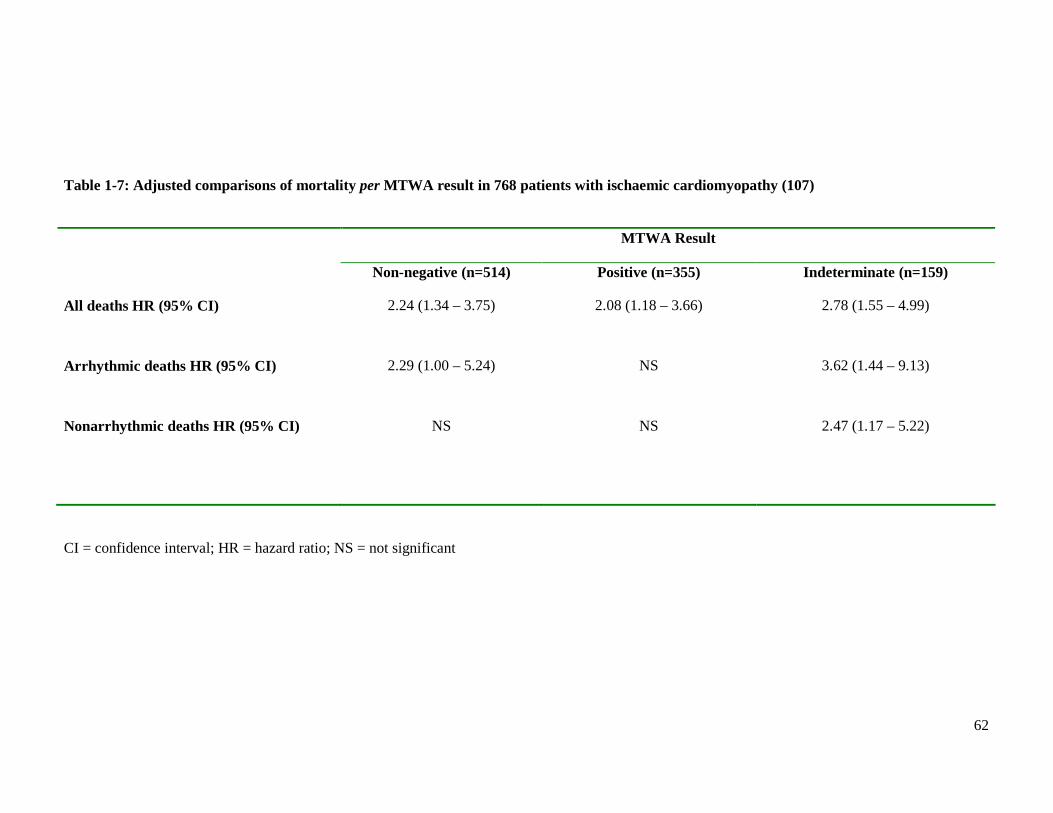
62
Table 1-7: Adjusted comparisons of mortality per MTWA result in 768 patients with ischaemic cardiomyopathy (107)
MTWA Result
Non-negative (n=514) Positive (n=355) Indeterminate (n=159)
All deaths HR (95% CI) 2.24 (1.34 – 3.75) 2.08 (1.18 – 3.66) 2.78 (1.55 – 4.99)
Arrhythmic deaths HR (95% CI) 2.29 (1.00 – 5.24) NS 3.62 (1.44 – 9.13)
Nonarrhythmic deaths HR (95% CI) NS NS 2.47 (1.17 – 5.22)
CI = confidence interval; HR = hazard ratio; NS = not significant
63
1.3.4 Extrapolation to primary prevention ICD therapy
There has been much speculation that MTWA could improve risk stratification for the primary
prevention of SCD, including patients with HF. It has been argued that the current evidence
regarding the favourable prognosis conferred by a negative test is sufficient to justify using
MTWA to identify a subgroup of primary prevention ICD candidates who would not benefit
(85;125). This could reduce the number of primary prevention implants and thereby reduce the
cost of therapy.
However, the current evidence is lacking in many respects. Most of the studies are limited by
small sample size or by low event rates, which reduces power, and there is a lack of detailed
multivariable analysis. We cannot, at present, extrapolate the prevalence data for a negative
test to unselected populations, because the proportion of patients who would be ineligible for
testing because of AF, demand ventricular pacing or an inability to exercise is unknown. In
addition, a high NPV has only been demonstrated over relatively short time scales, and
because the arrhythmic substrate changes over time it is likely that serial MTWA testing
would be required. This is difficult to address when little is known regarding reproducibility of
this test. The corollary of not implanting in MTWA negative patients would be to implant in
all non-negative patients, including those with indeterminate tests. Given the lack of proven
incremental prognostic value of MTWA and the conflicting results in some studies, there are
serious doubts regarding the benefit of this strategy.
64
1.4 Aims of this study
MTWA has been proposed as a novel method of predicting risk of sudden cardiac death and
recommended as a solution to the conundrum of decision making for ICD implantation. Yet as
outlined above, there are many gaps in the literature surrounding MTWA and HF. The clinical
utility of MTWA testing in HF remains to be fully evaluated. The proportion of patients
eligible for MTWA testing in a representative HF population is unknown, but clearly has
major implications for the widespread use of MTWA testing. The tolerability of the exercise
protocol and the prevalence of determinate MTWA results have not been assessed
prospectively in such a population. In particular, the prevalence of abnormal MTWA results in
patients with HF and preserved LVEF is not known. Little is known about the clinical
characteristics associated with a specific MTWA result. The incremental predictive value of
MTWA over LVEF in an unselected HF population has yet to be conclusively demonstrated.
The incremental value of MTWA over other prognostic markers such as BNP has not been
assessed in any type of HF. In particular, patients with HF-PEF have not been studied. It is
necessary to have this information before considering implementing MTWA as a routine
clinical tool.
This study intends to provide a comprehensive evaluation of the use of MTWA in patients
with HF and evaluate if this test will improve risk stratification for these patients. The
hypotheses of the study of MTWA are twofold.
Firstly, in an unselected population of patients recently hospitalised for HF, the presence of an
abnormal MTWA test (positive or indeterminate) provides prognostic information over and
above that obtained from clinical data, LVEF or natriuretic peptide levels in the prediction of
all-cause mortality, SCD and cardiovascular death.
Secondly, not withstanding the first hypothesis, the inability or ineligibility to perform an
MTWA test will identify a group of patients at highest risk of all-cause mortality, SCD and
cardiovascular death.
65
This aims of this study are:
1. Define eligibility for MTWA testing in a cohort of patients with stable HF.
2. Determine the prevalence of positive, negative and indeterminate results in a
representative, well-defined population of patients with HF on optimal medical therapy,
accounting for aetiology and LVEF.
3. Determine the tolerability of the exercise protocol in patients with HF.
4. Describe the clinical characteristics associated with a specific MTWA result.
5. Examine the predictive value of MTWA testing for all-cause mortality, SCD and
cardiovascular mortality in HF.
6. Clarify the incremental prognostic utility of MTWA by evaluating MTWA alongside
established predictors of mortality, including BNP, and more novel biomarkers, such
as cardiac troponin.
7. Describe the characteristics and outcomes of those ineligible for MTWA testing.
Ultimately this study endeavours to determine if MTWA testing has a role in the risk
stratification of patients with HF.

66
CHAPTER TWO
METHODS
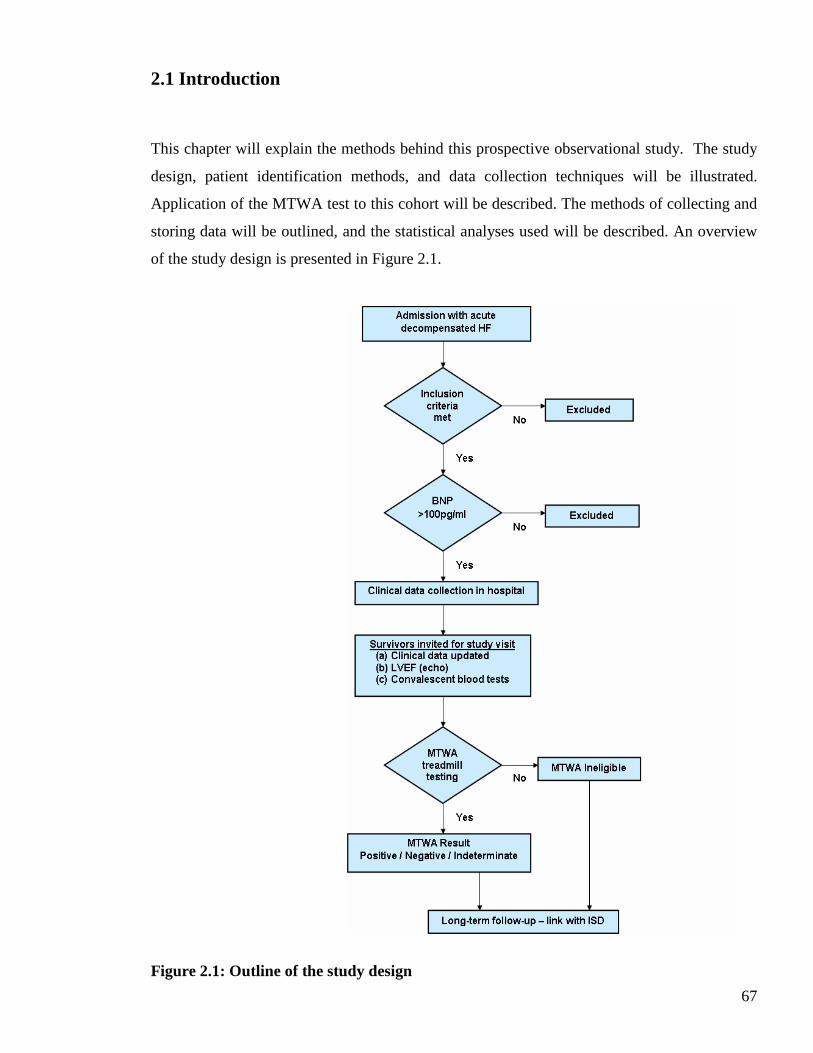
67
2.1 Introduction
This chapter will explain the methods behind this prospective observational study. The study
design, patient identification methods, and data collection techniques will be illustrated.
Application of the MTWA test to this cohort will be described. The methods of collecting and
storing data will be outlined, and the statistical analyses used will be described. An overview
of the study design is presented in Figure 2.1.
Figure 2.1: Outline of the study design
68
2.2 The hospitalised heart failure cohort
2.2.1 Patient population and recruitment
All patients were recruited from the Royal and Western Infirmaries in Glasgow, and the Royal
Alexandra Hospital in Paisley. The Royal Infirmary in Glasgow is a city hospital covering a
catchment area of over 250,000 for the north and east of Glasgow. The Western Infirmary
covers north-west Glasgow, with a catchment area of approximately 250,000. The Royal
Alexandra Hospital is a district general hospital with a large catchment area, approximately
200,000 from Renfrewshire and also serving areas as far away as Oban and Argyll.
Patients recruited into this study were admitted to these hospitals by self referral to the
Accident and Emergency Department or referral from their General Practitioner. All patients
recruited were admitted to the Medical Receiving Units, Coronary Care Units or directly to
general medical wards. Near-consecutive admissions were screened daily in both Glasgow
hospitals between 1st December 2006 and 10th January 2009, and in the Royal Alexandra
Hospital in Paisley from 22nd April 2008 to 10th January 2009. Recruitment of patients from
the third site, the Royal Alexandra Hospital, began after it became apparent that a significant
proportion of enrolled patients failed to return for the follow-up study visit and that additional
recruitment was needed to achieve an adequate number of patients attending the follow-up
visit.
Identifying potential study patients
All admissions to the three hospitals were screened for evidence of decompensated HF
(appendix I, page 326). This involved reviewing the case records for all new admissions for
documentation of the following:
• Symptoms and clinical signs of HF
• Radiological evidence suggestive of HF
• Clinical response to intravenous diuretics
69
Symptoms of HF included shortness of breath and peripheral oedema. Clinical signs of HF
included a raised jugular venous pressure (JVP), lung crepitations and pitting peripheral
oedema. Radiological evidence of HF included cardiomegaly (defined as a cardiothoracic ratio
>0.5) and signs of pulmonary oedema. The latter comprised vascular redistribution (upper lobe
venous diversion), raised pulmonary pressure (Kerley B lines), pulmonary venous congestion
(interstitial or alveolar oedema) and pleural effusions. A clinical response to intravenous
diuretics was defined as an improvement in the signs of HF (documented in the case notes) or
a symptomatic improvement (reported by the patient).
Inclusion criteria
Patients were invited to participate in the study if they met all of the following criteria:
• Primary reason for admission to hospital was decompensated HF
• Symptoms and signs of HF plus radiological evidence of HF or clinical response to
intravenous diuretics
• No exclusion criteria (see below)
Exclusion criteria
Patients were not approached for participation if they met any of the following exclusion
criteria:
• Cognitive impairment
• Serious concurrent systemic disease resulting in reduced life expectancy (such as
advanced malignancy)
• Acute coronary syndromes complicated by pulmonary oedema
• Geographical or social factors making participation or follow-up impractical
Recruitment into the study involved a two stage consent process (see below). Written
information was provided for both stages (appendices II, page 327, and III, page 329).
Patients who agreed to participate in the study provided written informed consent for both
70
stages (appendix IV, page 334). Copies of the consent form were given to the patient and filed
in their medical case records. The study was approved by the Local Research Ethics
Committee.
Consent - Stage One
Stage one involved providing informed consent to blood sampling to measure plasma BNP
concentration. Information for medical staff explaining the BNP test was placed in the
patient’s case notes (appendix V, page 336). The BNP test result was available within 24
hours. All patients were informed the following day of their result. Those with a BNP level
within the normal reference range, below the ESC guidelines “rule-out” threshold for HF
(<100pg/ml) (1), were not recruited into stage two. No further participation in the study was
asked of these patients. Patients providing consent at this stage also gave permission to be
“flagged” for follow-up with Information Services Division (ISD) of NHS Scotland, allowing
identification of deaths and readmissions to hospital.
Thus, all patients enrolled in the study fulfilled the three ESC diagnostic criteria for HF (1).
All enrolled patients had both symptoms and signs of HF, the first and second criteria of these
guidelines. The third criteria requires evidence of structural or functional cardiac disease,
namely; evidence of cardiomegaly, a third heart sound, echocardiographic abnormalities or a
raised natriuretic peptide level. Thus, an elevated BNP concentration satisfied the third criteria
of these guidelines.
Consent – Stage Two
This involved obtaining consent from patients with an elevated BNP concentration to
participate in the follow-up study visit. The study visit was scheduled for approximately 4-6
weeks after the patients were discharged from hospital. Details of the study visit were
provided verbally and by written means. A letter explaining the study was issued to every
participant’s general practitioner and filed in the patient’s case notes (appendix VI, page 337).
71
An appointment card was issued to each patient prior to their discharge from hospital,
detailing the date and location of the study visit (appendix VII, page 339).
2.2.2 Data collection
Every patient recruited into the study had an extensive amount of clinical data collected during
their hospital admission. This was contained in a case record form (appendix VIII, pages 340-
355). Each patient was allocated a unique and anonymous study identification number.
Completing the case record form involved a forty-five minute consultation with each patient
during their hospital admission. Data were obtained by a thorough review of the patient’s
medical case notes as well as a clinical assessment of each patient. The latter comprised taking
a detailed account of their medical history and examining their cardiovascular system. Other
methods of obtaining data included searching hospital database systems for echocardiography,
coronary angiography and radiological reports.
The types of data recorded were chosen for several reasons. A precise record of the past
medical history and results of any previous angiography allowed accurate determination of the
aetiology of HF. Data used in recently validated models of mortality prediction in HF (126)
were collected, both from hospitalisation and study visit, to evaluate the incremental
prognostic value of MTWA to these models.
Data were recorded under the following headings; demographics, clinical HF assessment, past
medical history and family medical history. Medications prescribed pre-admission and heart
failure medical therapy administered during the first 24 hours of admission were noted. ECG
results, chest X-ray (CXR) findings and echocardiogram analysis pre- and during admission
were also recorded. Finally, results from blood tests carried out on admission to hospital were
noted.
Demographic data included date of birth, gender and race. Dates of admission, recruitment and
discharge, or death in hospital, were recorded.
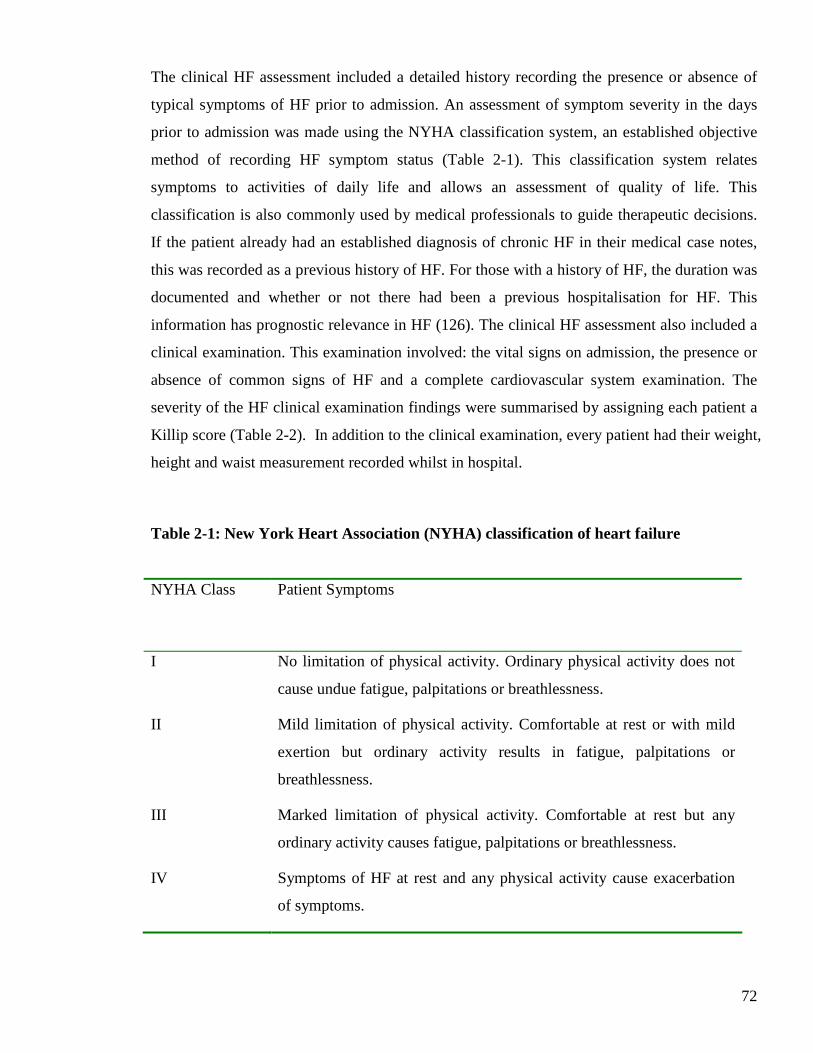
72
The clinical HF assessment included a detailed history recording the presence or absence of
typical symptoms of HF prior to admission. An assessment of symptom severity in the days
prior to admission was made using the NYHA classification system, an established objective
method of recording HF symptom status (Table 2-1). This classification system relates
symptoms to activities of daily life and allows an assessment of quality of life. This
classification is also commonly used by medical professionals to guide therapeutic decisions.
If the patient already had an established diagnosis of chronic HF in their medical case notes,
this was recorded as a previous history of HF. For those with a history of HF, the duration was
documented and whether or not there had been a previous hospitalisation for HF. This
information has prognostic relevance in HF (126). The clinical HF assessment also included a
clinical examination. This examination involved: the vital signs on admission, the presence or
absence of common signs of HF and a complete cardiovascular system examination. The
severity of the HF clinical examination findings were summarised by assigning each patient a
Killip score (Table 2-2). In addition to the clinical examination, every patient had their weight,
height and waist measurement recorded whilst in hospital.
Table 2-1: New York Heart Association (NYHA) classification of heart failure
NYHA Class
Patient Symptoms
I No limitation of physical activity. Ordinary physical activity does not
cause undue fatigue, palpitations or breathlessness.
II Mild limitation of physical activity. Comfortable at rest or with mild
exertion but ordinary activity results in fatigue, palpitations or
breathlessness.
III Marked limitation of physical activity. Comfortable at rest but any
ordinary activity causes fatigue, palpitations or breathlessness.
IV Symptoms of HF at rest and any physical activity cause exacerbation
of symptoms.
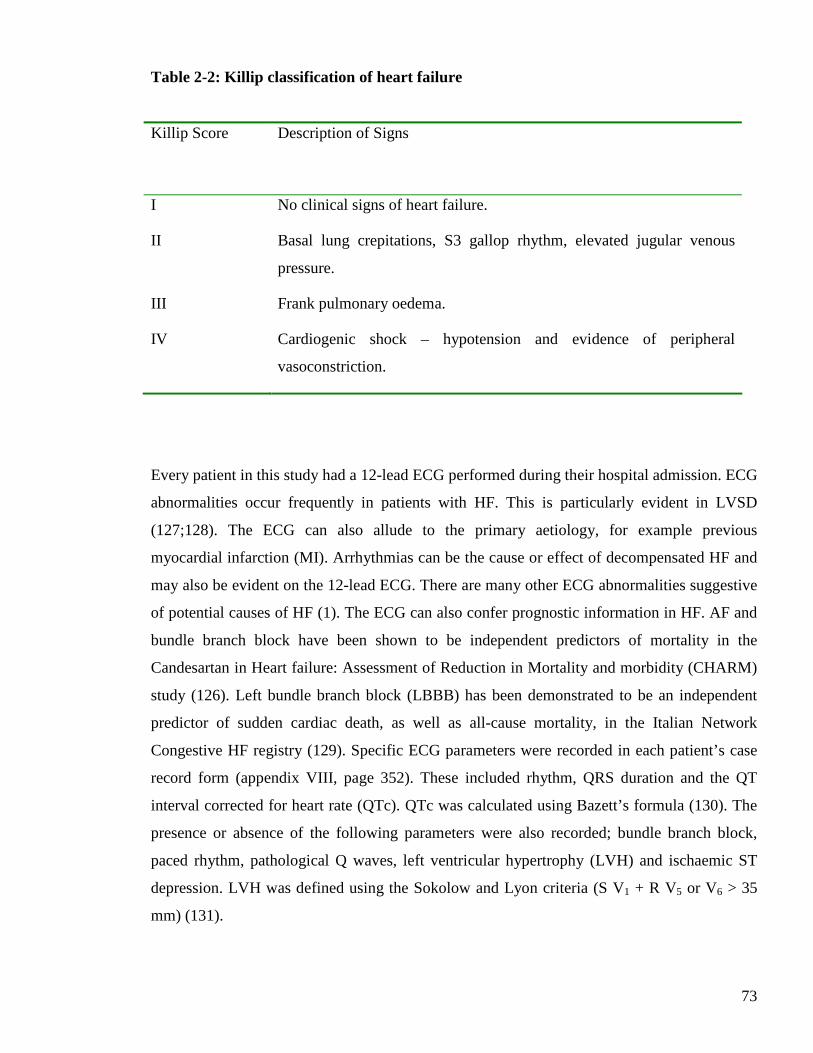
73
Table 2-2: Killip classification of heart failure
Killip Score
Description of Signs
I No clinical signs of heart failure.
II Basal lung crepitations, S3 gallop rhythm, elevated jugular venous
pressure.
III Frank pulmonary oedema.
IV Cardiogenic shock – hypotension and evidence of peripheral
vasoconstriction.
Every patient in this study had a 12-lead ECG performed during their hospital admission. ECG
abnormalities occur frequently in patients with HF. This is particularly evident in LVSD
(127;128). The ECG can also allude to the primary aetiology, for example previous
myocardial infarction (MI). Arrhythmias can be the cause or effect of decompensated HF and
may also be evident on the 12-lead ECG. There are many other ECG abnormalities suggestive
of potential causes of HF (1). The ECG can also confer prognostic information in HF. AF and
bundle branch block have been shown to be independent predictors of mortality in the
Candesartan in Heart failure: Assessment of Reduction in Mortality and morbidity (CHARM)
study (126). Left bundle branch block (LBBB) has been demonstrated to be an independent
predictor of sudden cardiac death, as well as all-cause mortality, in the Italian Network
Congestive HF registry (129). Specific ECG parameters were recorded in each patient’s case
record form (appendix VIII, page 352). These included rhythm, QRS duration and the QT
interval corrected for heart rate (QTc). QTc was calculated using Bazett’s formula (130). The
presence or absence of the following parameters were also recorded; bundle branch block,
paced rhythm, pathological Q waves, left ventricular hypertrophy (LVH) and ischaemic ST
depression. LVH was defined using the Sokolow and Lyon criteria (S V1 + R V5 or V6 > 35
mm) (131).
74
The CXR frequently assists in the diagnosis of acute HF, although a normal CXR does not
exclude this diagnosis. The majority of patients enrolled in this study had a CXR performed on
admission to hospital. The presence of radiological signs suggestive of HF, as detailed in the
ESC HF guidelines (1), were recorded in the case record form (appendix VIII, page 352).
These radiological signs were outlined earlier in Section 2.2.1. Cardiomegaly has prognostic
significance in HF and has been shown to be predictive of all-cause mortality (126), as well as
sudden death (132).
Echocardiography is an established investigation in patients with suspected HF. It enables a
non-invasive assessment of pericardial, myocardial and valvular function. LV systolic function,
as measured by ejection fraction, is an independent predictor of mortality in patients with HF
(126). Many patients in the study had an echocardiogram performed prior to enrolment in this
study. Data from this was recorded in the case record form (appendix VIII, page 353). If
multiple echocardiograms had previously been performed, data from the most recent one was
recorded. If an echocardiogram was performed during the index hospital admission then these
data were also recorded in the case record form. Often patients were discharged from hospital
with an appointment for an early outpatient echocardiogram; in these instances the data from
these scans were also obtained. Specific information from the echocardiogram report was
recorded. The LV internal dimension in diastole was recorded and whether or not the ventricle
was dilated. The presence or absence of LVSD and LVH was noted. LVSD was recorded as
documented on the report; mild, mild to moderate, moderate, moderate to severe or severe.
This classification system is a subjective measure of dysfunction. Unfortunately LVEF is not
routinely calculated. The presence of absence of valvular heart disease was recorded. The
valve type and lesion (stenosis or incompetence) was recorded as well as the severity, using
the same classification system as that of LVSD.
2.2.3 Biochemical and haematological tests
Blood sampling is informative in heart failure. It provides prognostic information and can
assist with determining the aetiology of HF and reason for decompensation. Many routine
laboratory investigations are recommended in the evaluation of patients with HF (1).
75
All patients had the following blood tests taken during hospitalisation; BNP, urea and
electrolytes (U&E), liver function tests (LFT) and full blood count (FBC). The majority of
patients had troponin I measured. The results of the following blood tests were also recorded
in the case record form if they were carried out during the hospital admission; thyroid function
(TFT), glycosylated haemoglobin (HBA1c), urate, phosphate, C-reactive protein (CRP),
glucose and lipid profile. All routine biochemical and haematological tests were performed at
the time of admission and analysed in the hospital biochemistry and haematology laboratories
within four hours of venesection.
Plasma BNP was an essential test in this study, an elevated level being mandatory for
recruitment to stage two of the study. Blood sampling for BNP was performed within 24 hours
of admission to hospital. Blood samples were collected in potassium ethylene diamine tetra
acetic acid (EDTA) tubes and sent to the department of biochemistry at Gartnavel General
Hospital in Glasgow for testing. Results were available on the same day of sampling. Plasma
BNP was measured using the Architect Assay (Abbott Laboratories, Abbott Park, IL, USA).
The Architect Assay has a range 0-5000 pg/ml. BNP values exceeding 5000pg/ml are recorded
as >5000pg/ml. The cut-off for BNP in this study was 100 pg/ml and patients with values
<100pg/ml were not recruited into stage two. This level was determined by consideration of
several factors. Firstly, work carried out previously on a local healthy population identified the
95th percentile at 67.6pg/ml for those aged 70 years and over (133). Abbott Laboratories
evaluated their assay in non-hospitalised patients with renal disease, diabetes mellitus, chronic
obstructive pulmonary disease and hypertension. In non-HF patients over 75 years old, mean
and median values were 31pg/ml and 67pg/ml, respectively. Furthermore, 83.3% of these
patients had results <100pg/ml. A previous study of the utility of BNP in diagnosing HF in the
emergency setting also used 100pg/ml as the cut-off level (55). This yielded a diagnostic
accuracy of 83%, with 90% sensitivity and 76% specificity, for differentiating HF from other
causes of breathlessness. Finally, according to ESC guidelines, a diagnosis of HF is unlikely
for patients presenting to hospital with breathlessness and a BNP level <100pg/ml (1).
Cardiac troponin is commonly measured in patients admitted to hospital with decompensated
HF. This was of particular interest in our study to evaluate the prognostic significance of this
novel biomarker in HF. In the Royal and Western Infirmaries troponin I is measured using the
76
Architect assay (Abbott Laboratories, Abbott Park, IL, USA). This assay reports negative
results as <0.04ng/ml, the level that achieves 10% coefficient of variance. Elevated troponin I
results are reported as ≥ 0.04ng/ml. In the Royal Alexandra Hospital troponin T is measured
using the Roche assay (Roche Diagnostics, Basel, Switzerland). This assay reports negative
results as <0.05ng/ml the level that achieves 10% coefficient of variance. Elevated troponin T
results are reported as ≥ 0.05ng/ml.
All patients had U&E measured on admission. Serum creatinine concentration alone is a poor
indicator of renal function (134). Thus, renal function was assessed by estimation of the
glomerular filtration rate (eGFR) using the Modification of Diet in Renal Disease (MDRD)
equations (135). The MDRD equations have been validated in patients with severe chronic HF
(136). The four-variable MDRD equation was calculated for all patients. This formula
calculates eGFR as follows:
eGFR (ml/min/1.73m2) = 32788 x (Serum Creatinine in µmol/l)-1.154 x (Age)-0.203 x [1.210 if
Black] x [0.742 if Female]
Renal function, represented by eGFR concentration, was then classified using the National
Kidney Foundation classification (137). This guideline classifies renal function as normal if
the eGFR is ≥ 90 ml/min/1.73m2. Mild renal impairment is eGFR 60 - < 90 ml/min/1.73m2.
Moderate and severe renal impairment are defined as eGFR of ≥ 30 – 59 ml/min/1.73m2 and <
30 ml/min/1.73m2, respectively.
All patients had a FBC measured on admission. This haematological test includes several
parameters that are useful in HF. These are haemoglobin, white blood cell (WBC) count,
lymphocytes and red cell distribution width (RDW). Anaemia may be a cause or a
consequence of HF and has prognostic importance regardless of systolic function (138). In this
study, anaemia was defined according to the World Health Organization (WHO) criteria (139).
These criteria define anaemia as a haemoglobin < 12g/dl in women and < 13g/dl in men. A
raised total WBC count may indicate infection as a cause of decompensated HF.
Lymphopenia is common in HF (138). Red cell distribution width is a novel prognostic
marker in patients with chronic HF (140).
77
2.3 The post-discharge heart failure cohort
2.3.1 Study visit
All enrolled patients were invited to attend the British Heart Foundation (BHF) Glasgow
Cardiovascular Research Centre to complete the follow-up study visit. This visit was arranged
approximately 4-6 weeks after the patients were discharged from hospital. All surviving
patients were telephoned one week prior to their allocated appointment to confirm attendance
for study visit and organise taxi transport to the BHF Glasgow Cardiovascular Research
Centre. The local online patient record database was checked prior to telephoning patients to
ensure they were still alive. The study visits took place between 17th January 2007 and 12th
March 2009.
2.3.2 Data collection
Every patient had a second case record form completed for their study visit using the same
unique, anonymous study identification number allocated during their hospital admission
(appendix IX, pages 356-368). Data collected in hospital were updated and recorded. This
included current HF symptom status and current medications. New medical conditions were
noted. Further admissions to hospital with HF, since enrolment in this study, were documented.
Routine physiological measurements, body composition measurements and a cardiovascular
system examination were performed for all patients. A 12-lead ECG was recorded and the
same parameters described in section 2.2.2 were noted. The aetiology of HF was detailed for
every patient. Biochemical and haematological blood tests results, LVEF by echocardiography
and MTWA results, were also recorded in the case record form (appendix IX). The reasons
patients failed to attend the study visit were noted. These were recorded as; refusal to attend,
unable to attend due to deteriorating health, or deceased. If the patient was deceased, the date
of the death was obtained from the local online patient record database.
78
2.3.3 Aetiology of heart failure
The primary aetiology of HF was recorded for all enrolled patients. Contributing aetiologies
were also noted. The primary aetiology was defined as “ischaemic” if there was evidence of
prior myocardial infarction, coronary revascularisation or angiographically significant
coronary artery disease. Significant coronary artery disease was defined as >50% stenosis in at
least one major epicardial coronary artery branch. “Non-ischaemic” aetiology was assumed
only when significant coronary artery disease had been excluded by angiography. Patients
who did not fit into either group were deemed to have “unknown” aetiology. Patients with
non-ischaemic aetiology of HF were categorised into one of the following categories;
idiopathic dilated cardiomyopathy, hypertension, alcohol or valvular heart disease. Valvular
heart disease was only considered causative if at least moderate in severity. Patients with a
non-ischaemic cause who did not fit into one of the aforementioned categories were classified
as ‘other’ and the specific cause recorded. Assigning the aetiology of HF was performed at the
time of the study visit, rather than during the hospital visit. This allowed use of information
from investigations performed after recruitment, and improved the chances of determining the
primary aetiology. For example, investigations like coronary angiography may have been
performed late in the hospital admission or following discharge from hospital. Results of
angiograms were obtained by interrogation of the local angiography database.
Other aetiologies potentially contributing to HF were also recorded for all patients. These
largely fell into the following categories; valvular heart disease, diabetes mellitus, atrial
fibrillation, hypertension and alcohol. Valvular heart disease was only considered a potential
contributor if the severity was at least moderate. The valve(s) involved were also recorded.
Atrial fibrillation was only considered a contributing aetiology if persistent or permanent. The
aetiology of HF was also recorded for patients who did not complete the study visit.
2.3.4 Biochemical and haematological tests
Several biochemical and haematological tests were performed at the study visit. The blood
tests were selected either because they are already established biomarkers in HF or to
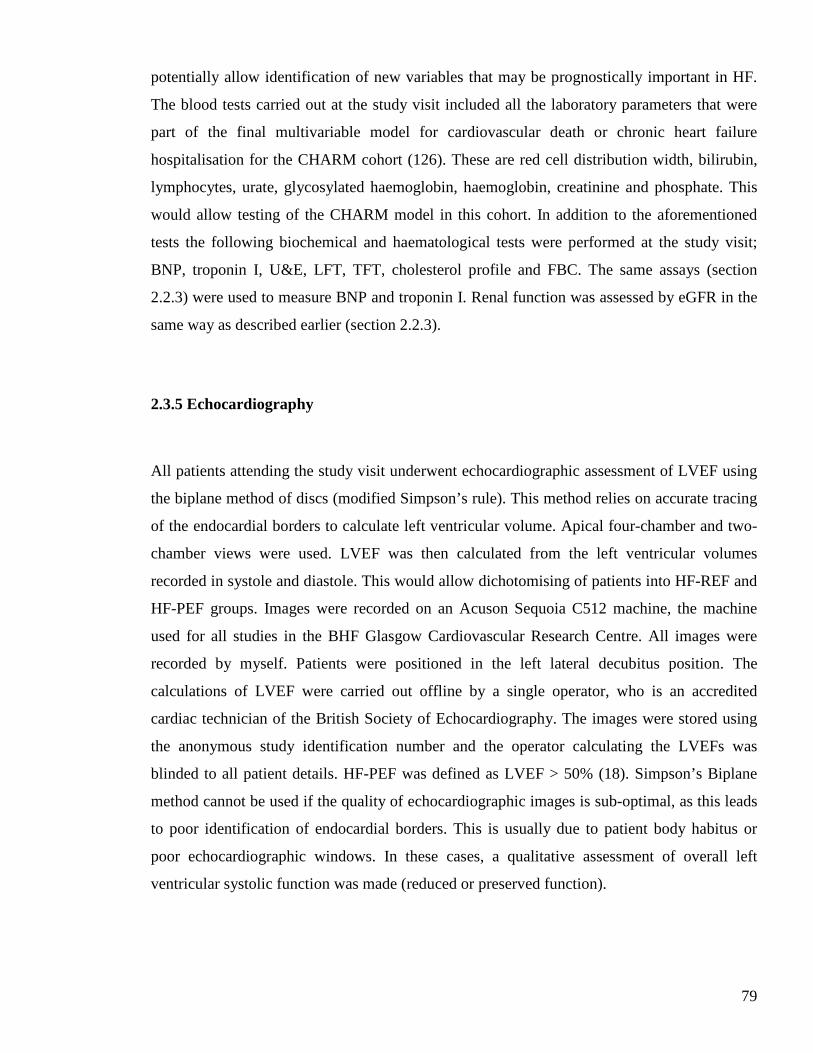
79
potentially allow identification of new variables that may be prognostically important in HF.
The blood tests carried out at the study visit included all the laboratory parameters that were
part of the final multivariable model for cardiovascular death or chronic heart failure
hospitalisation for the CHARM cohort (126). These are red cell distribution width, bilirubin,
lymphocytes, urate, glycosylated haemoglobin, haemoglobin, creatinine and phosphate. This
would allow testing of the CHARM model in this cohort. In addition to the aforementioned
tests the following biochemical and haematological tests were performed at the study visit;
BNP, troponin I, U&E, LFT, TFT, cholesterol profile and FBC. The same assays (section
2.2.3) were used to measure BNP and troponin I. Renal function was assessed by eGFR in the
same way as described earlier (section 2.2.3).
2.3.5 Echocardiography
All patients attending the study visit underwent echocardiographic assessment of LVEF using
the biplane method of discs (modified Simpson’s rule). This method relies on accurate tracing
of the endocardial borders to calculate left ventricular volume. Apical four-chamber and two-
chamber views were used. LVEF was then calculated from the left ventricular volumes
recorded in systole and diastole. This would allow dichotomising of patients into HF-REF and
HF-PEF groups. Images were recorded on an Acuson Sequoia C512 machine, the machine
used for all studies in the BHF Glasgow Cardiovascular Research Centre. All images were
recorded by myself. Patients were positioned in the left lateral decubitus position. The
calculations of LVEF were carried out offline by a single operator, who is an accredited
cardiac technician of the British Society of Echocardiography. The images were stored using
the anonymous study identification number and the operator calculating the LVEFs was
blinded to all patient details. HF-PEF was defined as LVEF > 50% (18). Simpson’s Biplane
method cannot be used if the quality of echocardiographic images is sub-optimal, as this leads
to poor identification of endocardial borders. This is usually due to patient body habitus or
poor echocardiographic windows. In these cases, a qualitative assessment of overall left
ventricular systolic function was made (reduced or preserved function).
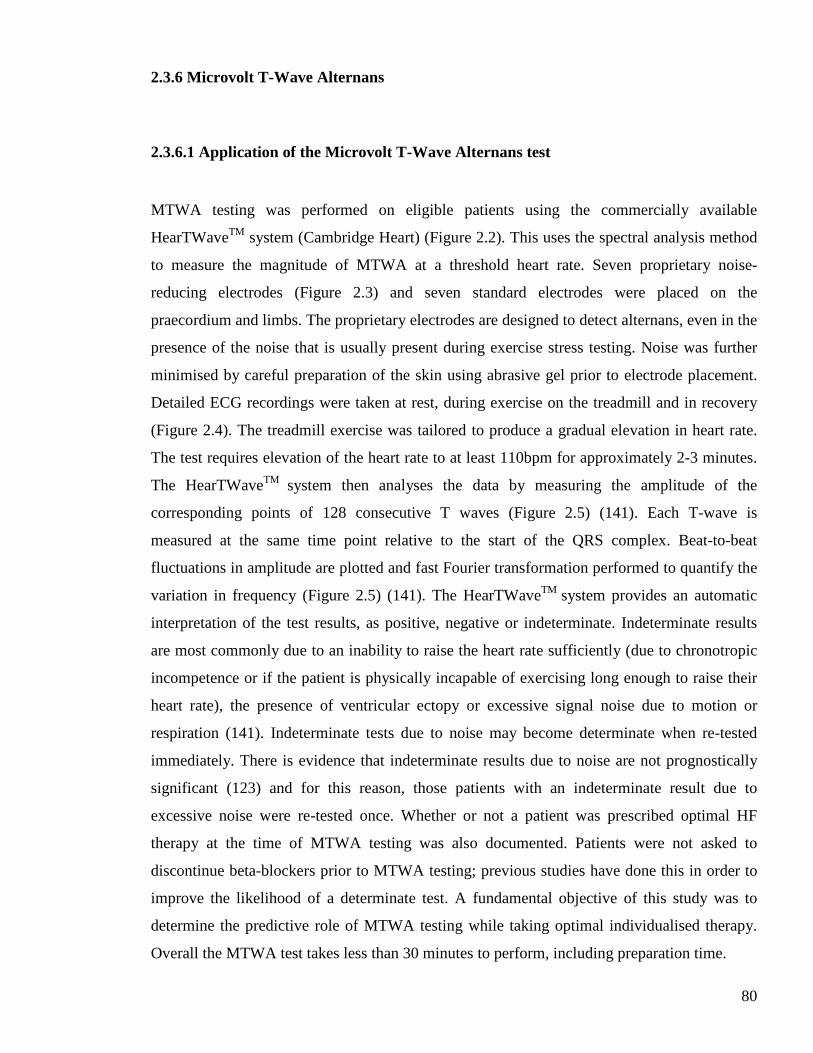
80
2.3.6 Microvolt T-Wave Alternans
2.3.6.1 Application of the Microvolt T-Wave Alternans test
MTWA testing was performed on eligible patients using the commercially available
HearTWaveTM system (Cambridge Heart) (Figure 2.2). This uses the spectral analysis method
to measure the magnitude of MTWA at a threshold heart rate. Seven proprietary noise-
reducing electrodes (Figure 2.3) and seven standard electrodes were placed on the
praecordium and limbs. The proprietary electrodes are designed to detect alternans, even in the
presence of the noise that is usually present during exercise stress testing. Noise was further
minimised by careful preparation of the skin using abrasive gel prior to electrode placement.
Detailed ECG recordings were taken at rest, during exercise on the treadmill and in recovery
(Figure 2.4). The treadmill exercise was tailored to produce a gradual elevation in heart rate.
The test requires elevation of the heart rate to at least 110bpm for approximately 2-3 minutes.
The HearTWaveTM system then analyses the data by measuring the amplitude of the
corresponding points of 128 consecutive T waves (Figure 2.5) (141). Each T-wave is
measured at the same time point relative to the start of the QRS complex. Beat-to-beat
fluctuations in amplitude are plotted and fast Fourier transformation performed to quantify the
variation in frequency (Figure 2.5) (141). The HearTWaveTM system provides an automatic
interpretation of the test results, as positive, negative or indeterminate. Indeterminate results
are most commonly due to an inability to raise the heart rate sufficiently (due to chronotropic
incompetence or if the patient is physically incapable of exercising long enough to raise their
heart rate), the presence of ventricular ectopy or excessive signal noise due to motion or
respiration (141). Indeterminate tests due to noise may become determinate when re-tested
immediately. There is evidence that indeterminate results due to noise are not prognostically
significant (123) and for this reason, those patients with an indeterminate result due to
excessive noise were re-tested once. Whether or not a patient was prescribed optimal HF
therapy at the time of MTWA testing was also documented. Patients were not asked to
discontinue beta-blockers prior to MTWA testing; previous studies have done this in order to
improve the likelihood of a determinate test. A fundamental objective of this study was to
determine the predictive role of MTWA testing while taking optimal individualised therapy.
Overall the MTWA test takes less than 30 minutes to perform, including preparation time.
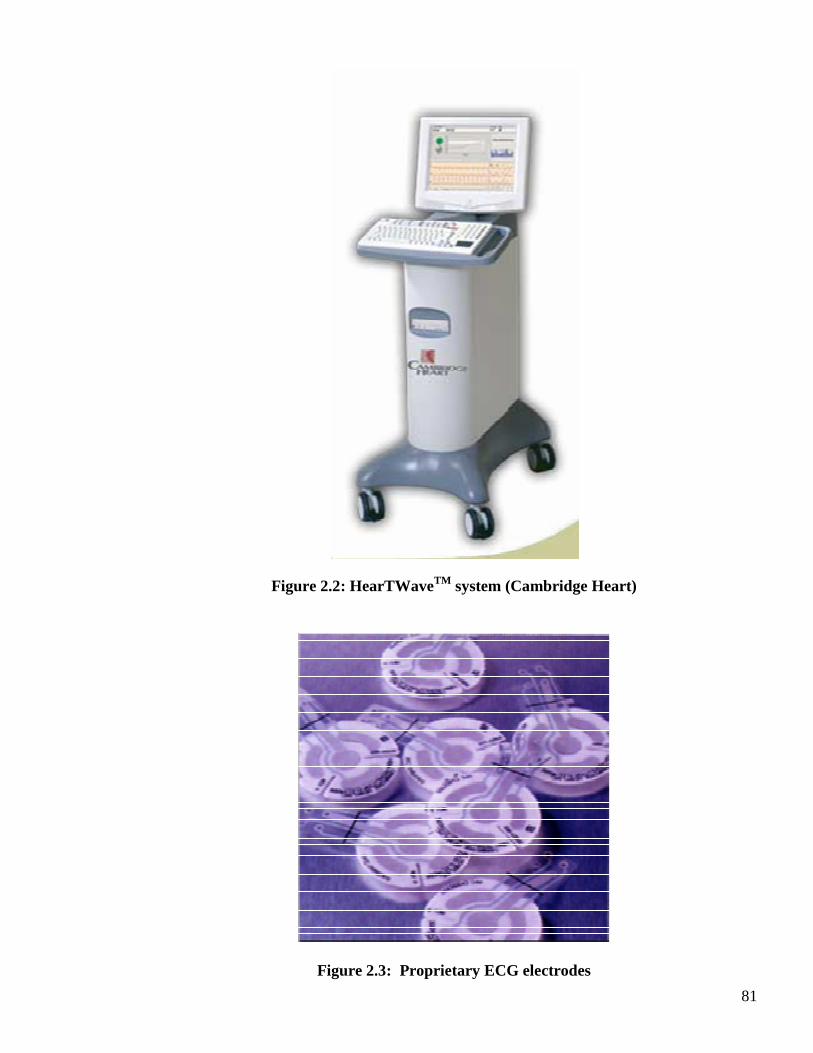
81
Figure 2.2: HearTWaveTM system (Cambridge Heart)
Figure 2.3: Proprietary ECG electrodes
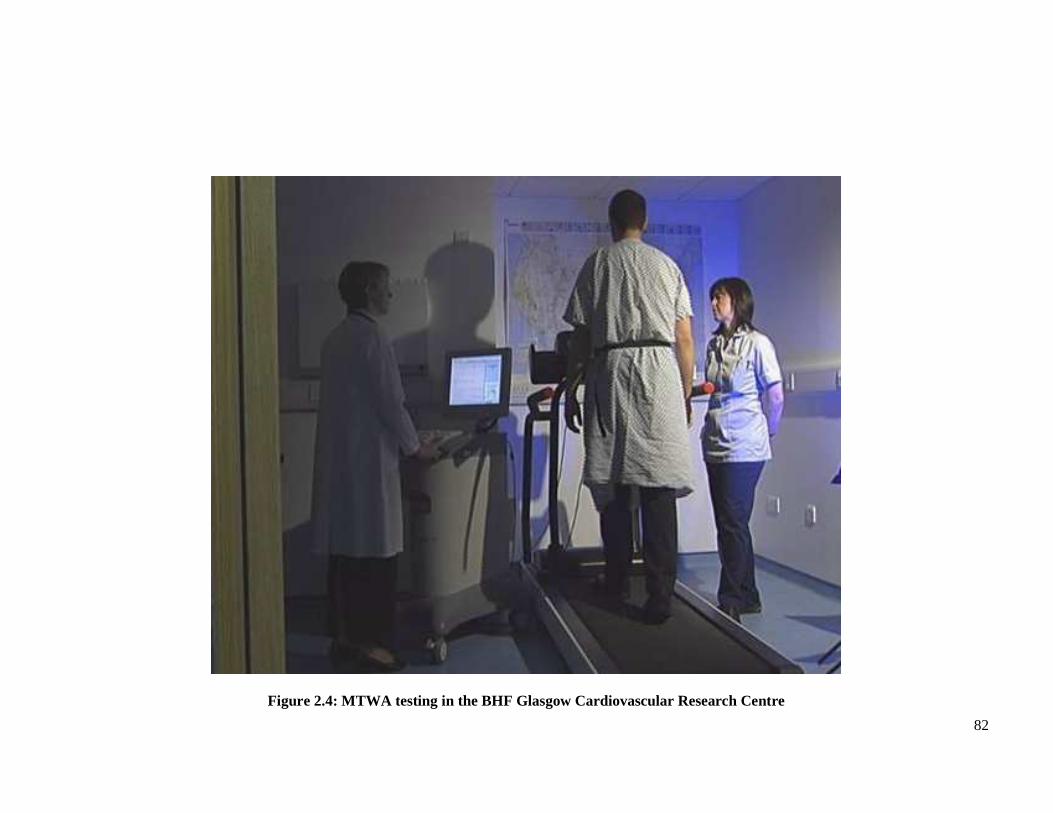
82
Figure 2.4: MTWA testing in the BHF Glasgow Cardiovascular Research Centre
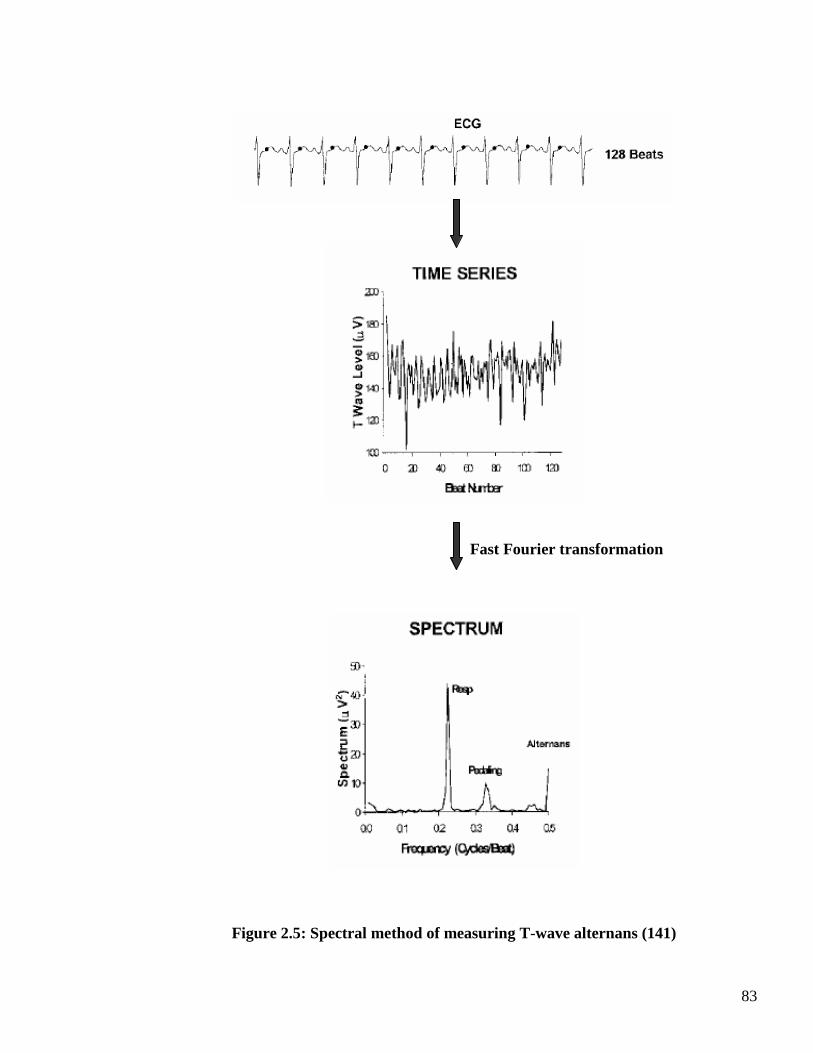
83
Fast Fourier transformation
Figure 2.5: Spectral method of measuring T-wave alternans (141)
84
2.3.6.2 Microvolt T-Wave Alternans Prevalence Study
Eligibility for MTWA testing was recorded for all patients attending the study visit. Reasons
for ineligibility were documented (AF, demand ventricular pacing or inability to exercise).
Differences in clinical characteristics according to eligibility for MTWA testing were analysed.
Potential eligibility for MTWA treadmill testing was recorded for patients who did not attend
and was derived from clinical data collected during the hospital admission. This was to enable
an assessment of whether or not the patients attending the study visit were representative of an
unselected cohort of patients with HF.
The results of MTWA testing and the prevalence of positive, negative and indeterminate
results in our study population were recorded. The reasons for an indeterminate test were
outlined. The functional capacity of the patients was recorded. This included a description of
the reason for terminating exercise, duration of exercise and metabolic equivalent values
(METs) expended. This would allow an evaluation of the practicality of MTWA testing in
patients with HF. For patients unable to exercise, MTWA testing at rest was described.
All automated computer-generated MTWA test results were reviewed by myself and
subsequently interpreted by a single clinician (Dr Rachel Myles) experienced in reviewing
MTWA reports. The clinician was blinded to both the patient details and the automated
computer-generated result. This would enable an assessment of the correlation between the
automatic result and a clinician’s interpretation.
Differences in the clinical characteristics between the three MTWA groups were analysed to
determine the clinical associates of a particular MTWA result. Particular attention was paid to
LVEF, aetiology of HF (ischaemic or non-ischaemic), QRS duration, BNP levels, as well as
many clinical and demographic variables.
85
2.3.6.3 Microvolt T-Wave Alternans Prognostic Study
The prognostic value of MTWA testing was examined after a period of follow-up (section 2.5).
The statistical analysis of the prognostic study is described later (section 2.6). The incremental
prognostic value of MTWA over established predictors of outcome in HF was determined.
These included LVEF, BNP, clinical variables and biochemical and haematological indices.
These analyses were carried out in all patients completing MTWA testing.
2.4 Database Construction
All paper copies of the hospital and study visit case record forms were kept in a locked filing
system at the BHF Glasgow Cardiovascular Research Centre. An electronic database was
created in the Robertson Centre for Biostatistics at the University of Glasgow to store these
data. Data were manually entered into the electronic database and verified by two independent
database managers working in the Robertson Centre. No patient identifying material was
entered into the electronic database; patients were anonymised and identified by their unique
study identification number. All data were subject to manual and prespecified electronic data
validation checks which resulted in the production of a large number of queries. All queries
were rectified and data appropriately amended in the central database. This robust system
ensured quality control of the data processed.
2.5 Long-Term Follow Up
All enrolled patients consented to be “flagged” with the Information Services Division (ISD)
of the Scottish Health Service. This allowed mortality follow-up data to be obtained. Patient
identifying information was sent to ISD for all patients once recruitment was complete. ISD
linked the study database to information on in-hospital and out-of hospital deaths, held by the
General Register Office for Scotland. The database was also linked to the Scottish Morbidity
Register which provides details of dates and causes of hospital readmission. Data on cause,
86
location and date of death were obtained. ISD classifies causes of death using the WHO
International Classification of Diseases (ICD-10) coding system.
The final follow-up visit was 12th March 2009. Linkage data were requested in January 2010.
Data provided by ISD has a lag time of approximately six months. Thus, survival time was
calculated from the date of attendance at the study visit until death or censoring at 31st July
2009.
2.6 Statistical methodology
2.6.1 Statistical Analyses
Statistical Package for the Social Sciences (SPSS) (version 18) software was used for basic
statistical analyses. S-Plus (version 8.1) was used for analysis of variance (ANOVA),
Student’s t-test, χ2 test logistic regression and mortality analyses.
Inter-group comparisons were made for continuous variables using ANOVA F-test (for
comparisons involving more than 2 groups) and Student’s t-test (for 2 group comparisons),
and for categorical variables using χ2 test. Logistic regression analysis was used to identify
predictors of each MTWA result. A probability value of p<0.1 was used for selecting variables
for the logistic regression analyses. A probability value of p<0.05 was considered significant
for all other analyses. All continuous variables were transformed as appropriate to normalize
their distributions.
Survival time was calculated from the date of attendance at the study visit until death or
censoring at 31st July 2009. Kaplan-Meier survival curves were constructed to illustrate
survival of the patients according to MTWA result. Curves were compared using the log rank
test. The incremental prognostic value of MTWA testing was evaluated using Cox
proportional hazard models. A three stage prognostic model (Table 2-3) was used with
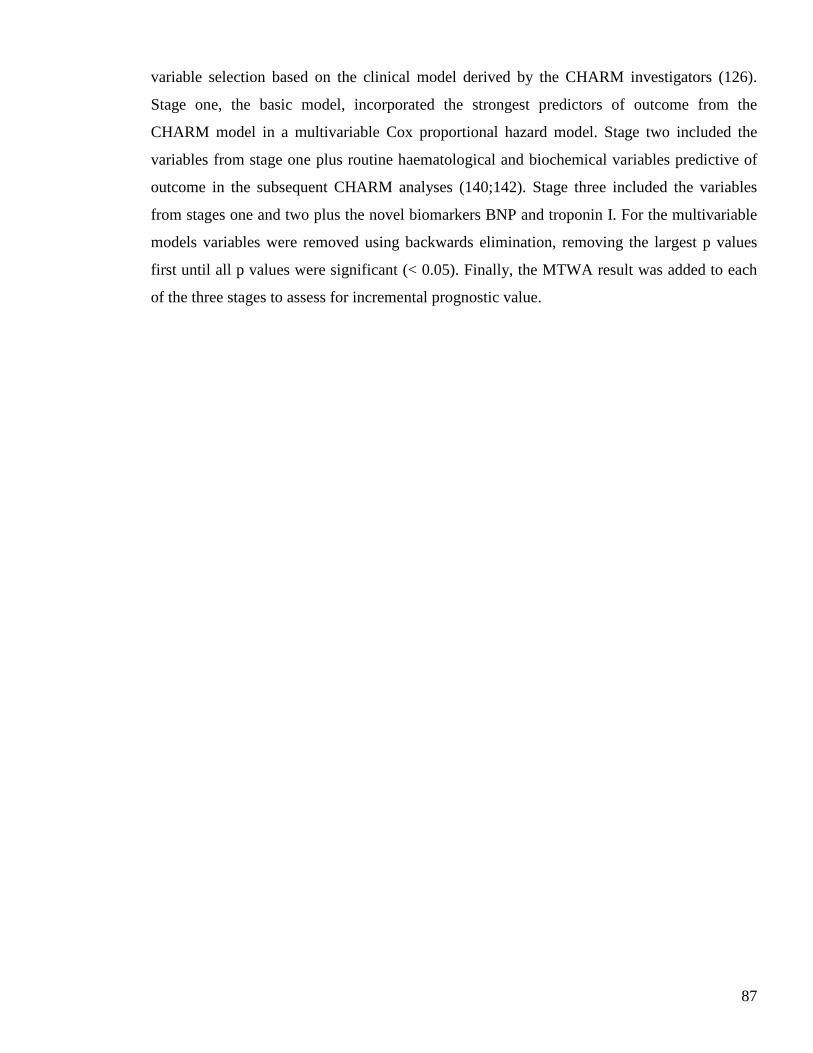
87
variable selection based on the clinical model derived by the CHARM investigators (126).
Stage one, the basic model, incorporated the strongest predictors of outcome from the
CHARM model in a multivariable Cox proportional hazard model. Stage two included the
variables from stage one plus routine haematological and biochemical variables predictive of
outcome in the subsequent CHARM analyses (140;142). Stage three included the variables
from stages one and two plus the novel biomarkers BNP and troponin I. For the multivariable
models variables were removed using backwards elimination, removing the largest p values
first until all p values were significant (< 0.05). Finally, the MTWA result was added to each
of the three stages to assess for incremental prognostic value.
88
Table 2-3: Three stage model for evaluating the incremental prognostic value of MTWA
Stage Variables
1 Age
Ejection fraction
Diabetes – insulin treated
BMI (kg/m2)
Sex (Female)
NYHA class III and IV
Bundle branch block
Cardiomegaly
SBP
Diagnosis of chronic HF over 2 years ago
Previous myocardial infarction
Dependent oedema
Heart rate
AF
2 eGFR
RDW
Bilirubin
Haemoglobin
Lymphocytes
Urate
Phosphate
Glycosylated haemoglobin
3 BNP
Troponin I
BMI = body mass index; RDW = red cell distribution width
89
2.6.2 Power Calculation
It was assumed that if 600 subjects were recalled for MTWA testing then 400 would actually
undergo evaluation, after excluding those ineligible for testing. Based on recent studies
(107;109), it was assumed that these would split one third MTWA negative and two thirds
MTWA non-negative (positive or indeterminate). Power calculations were based on the all-
cause mortality data estimating the hazard ratio of MTWA (non-negative / negative) with
adjustment for other prognostic factors. Assuming crude 1 year mortality rates of 21% in the
preserved ejection fraction group and 32% in the reduced ejection fraction group, as observed
in a recent study in Glasgow (25), the study would have 84% power at the 5% level of
significance to detect a MTWA non-negative/ MTWA negative hazard ratio of 1.78.
2.6.3 Defining events and outcomes
The primary outcome measure of this study was all-cause mortality. Secondary outcome
measures of interest were (i) SCD or resuscitated cardiac arrest, and (ii) cardiovascular death
(excluding sudden). All outcome data were obtained from linkage data provided by ISD.
Causes of death were classified according to the ICD-10 classification as documented on the
death certificates. Causes of death were not adjudicated. Although the secondary outcome
measures were of interest in this study, it was recognised at study conception that, due to the
limitations of the ISD data, only all-cause mortality would be a robust and definitive outcome.
All-cause mortality was defined as death from any cause. Cardiac transplantation was also
censored as death. Much has been written on the problems of defining and identifying SCD,
particularly in patients with HF (143;144). Not all sudden deaths are arrhythmic, and not all
arrhythmic deaths are sudden. The majority of SCD occurs outside hospital, and is commonly
certified as acute myocardial infarction. A small proportion of patients undergo a resuscitation
attempt by the ambulance service, while others may suffer sudden and unexpected death
during their hospital admission. Some classification systems, such as that proposed by Hinkle
and Thaler (145), require detailed information to be obtained from relatives or medical
attendants on the exact sequence of events immediately prior to death. Such an approach was
90
beyond the scope of this study. A recent clinical trial in patients with acute HF defined SCD as
death occurring unexpectedly in a previously stable patient and including any of the following
deaths: (i) witnessed and instantaneous without new or worsening symptoms and also in the
absence of progressive circulatory failure lasting for 1 hour or more, (ii) witnessed within 1
hour of the onset of new or worsening symptoms unless a cause other than cardiac is obvious,
(iii) death witnessed and attributed to an identified arrhythmia, (iv) death during an attempted
resuscitation for cardiac arrest or death within 24 hours of resuscitation, or without gaining
consciousness, from cardiac arrest in the absence of pre-existing circulatory failure or other
causes of death, and (v) unwitnessed death in the absence of pre-existing progressive
circulatory failure or other causes of death, only where the stability of the patient in the week
prior to death was known (146). Clinical trials are supported by endpoint adjudication
committees who are provided with detailed information regarding deaths, allowing the clinical
expertise of the committee to appropriately adjudicate the cause of deaths. Some MTWA
studies have included SCD as a clinical endpoint (103;104;111-115;119). These studies have
defined SCD as death within an hour of symptom onset or during sleep without another
identifiable cause.
The detailed information and infrastructure required for adjudicating sudden cardiac death, as
outlined above, was not available for this study. Thus, a pragmatic definition of SCD for this
study was adopted as being: (i) death occurring outside hospital and certified as due to acute
MI, (ii) death certified as cardiac arrest (ICD-10 code I46) or (iii) death certified as VF (ICD-
10 code I490) or VT (ICD-10 code I472).
The secondary outcome ‘SCD or resuscitated cardiac arrest’ therefore included successful in-
and out-of-hospital resuscitations of cardiac arrest (ICD-10 code I460), in addition to SCD as
defined above. Information regarding appropriate ICD discharges for documented ventricular
arrhythmia is not provided by ICD-10 codes and was therefore unavailable and not included in
outcome measures for this study. Cardiovascular death (excluding sudden) was defined as
death from any cardiovascular disease (ICD-10 codes I00-I99) and not meeting the criteria for
sudden cardiac death, as outlined above. The latter was included to evaluate if MTWA was
predictive of general cardiovascular mortality, rather than arrhythmic mortality.

91
CHAPTER THREE
CLINICAL CHARACTERISTICS
OF
HOSPITALISED COHORT
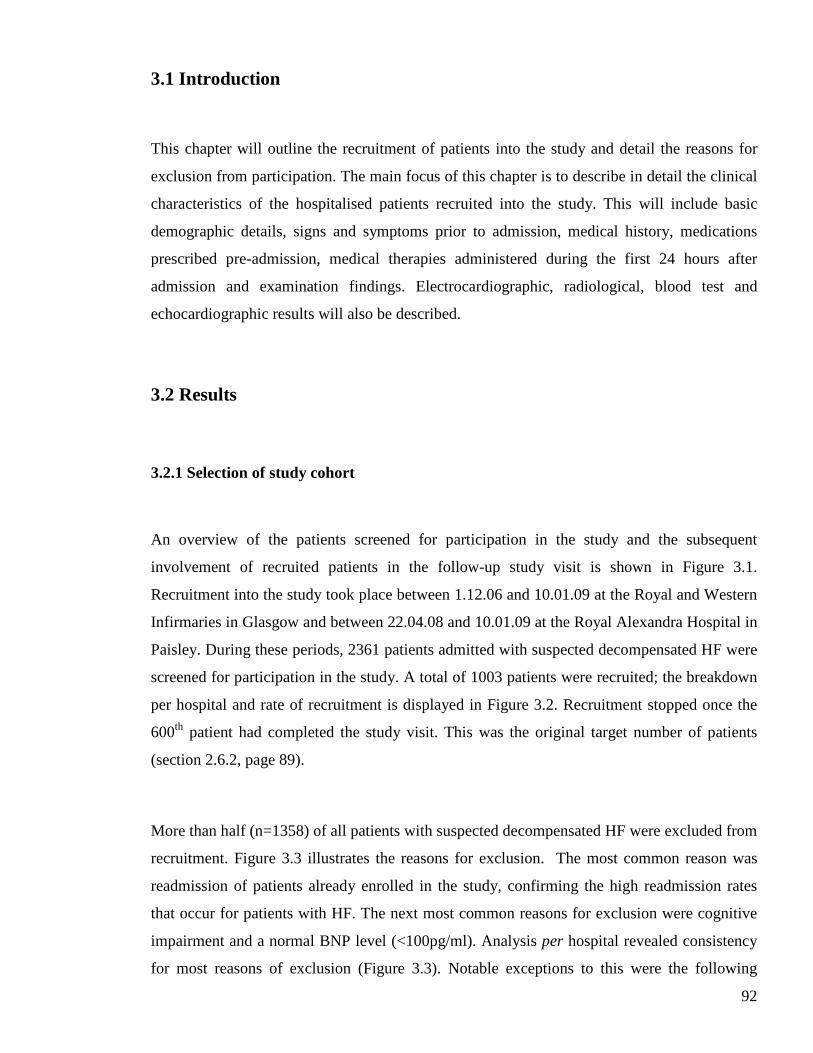
92
3.1 Introduction
This chapter will outline the recruitment of patients into the study and detail the reasons for
exclusion from participation. The main focus of this chapter is to describe in detail the clinical
characteristics of the hospitalised patients recruited into the study. This will include basic
demographic details, signs and symptoms prior to admission, medical history, medications
prescribed pre-admission, medical therapies administered during the first 24 hours after
admission and examination findings. Electrocardiographic, radiological, blood test and
echocardiographic results will also be described.
3.2 Results
3.2.1 Selection of study cohort
An overview of the patients screened for participation in the study and the subsequent
involvement of recruited patients in the follow-up study visit is shown in Figure 3.1.
Recruitment into the study took place between 1.12.06 and 10.01.09 at the Royal and Western
Infirmaries in Glasgow and between 22.04.08 and 10.01.09 at the Royal Alexandra Hospital in
Paisley. During these periods, 2361 patients admitted with suspected decompensated HF were
screened for participation in the study. A total of 1003 patients were recruited; the breakdown
per hospital and rate of recruitment is displayed in Figure 3.2. Recruitment stopped once the
600th patient had completed the study visit. This was the original target number of patients
(section 2.6.2, page 89).
More than half (n=1358) of all patients with suspected decompensated HF were excluded from
recruitment. Figure 3.3 illustrates the reasons for exclusion. The most common reason was
readmission of patients already enrolled in the study, confirming the high readmission rates
that occur for patients with HF. The next most common reasons for exclusion were cognitive
impairment and a normal BNP level (<100pg/ml). Analysis per hospital revealed consistency
for most reasons of exclusion (Figure 3.3). Notable exceptions to this were the following
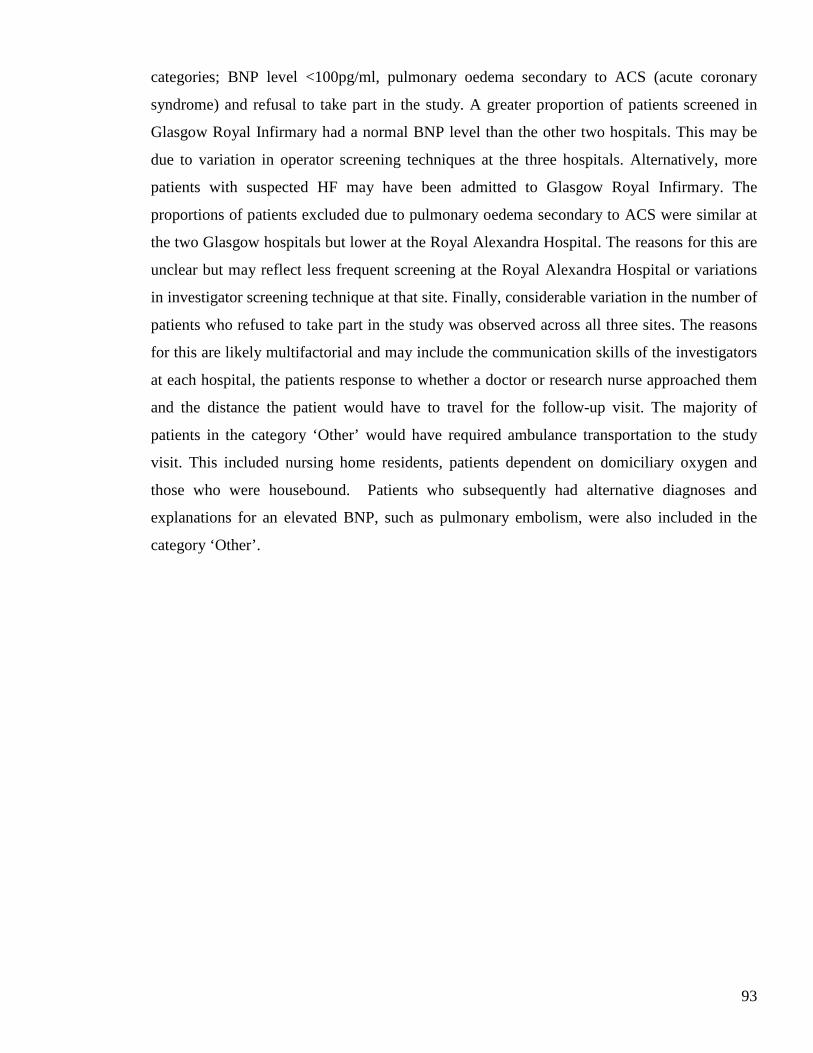
93
categories; BNP level <100pg/ml, pulmonary oedema secondary to ACS (acute coronary
syndrome) and refusal to take part in the study. A greater proportion of patients screened in
Glasgow Royal Infirmary had a normal BNP level than the other two hospitals. This may be
due to variation in operator screening techniques at the three hospitals. Alternatively, more
patients with suspected HF may have been admitted to Glasgow Royal Infirmary. The
proportions of patients excluded due to pulmonary oedema secondary to ACS were similar at
the two Glasgow hospitals but lower at the Royal Alexandra Hospital. The reasons for this are
unclear but may reflect less frequent screening at the Royal Alexandra Hospital or variations
in investigator screening technique at that site. Finally, considerable variation in the number of
patients who refused to take part in the study was observed across all three sites. The reasons
for this are likely multifactorial and may include the communication skills of the investigators
at each hospital, the patients response to whether a doctor or research nurse approached them
and the distance the patient would have to travel for the follow-up visit. The majority of
patients in the category ‘Other’ would have required ambulance transportation to the study
visit. This included nursing home residents, patients dependent on domiciliary oxygen and
those who were housebound. Patients who subsequently had alternative diagnoses and
explanations for an elevated BNP, such as pulmonary embolism, were also included in the
category ‘Other’.
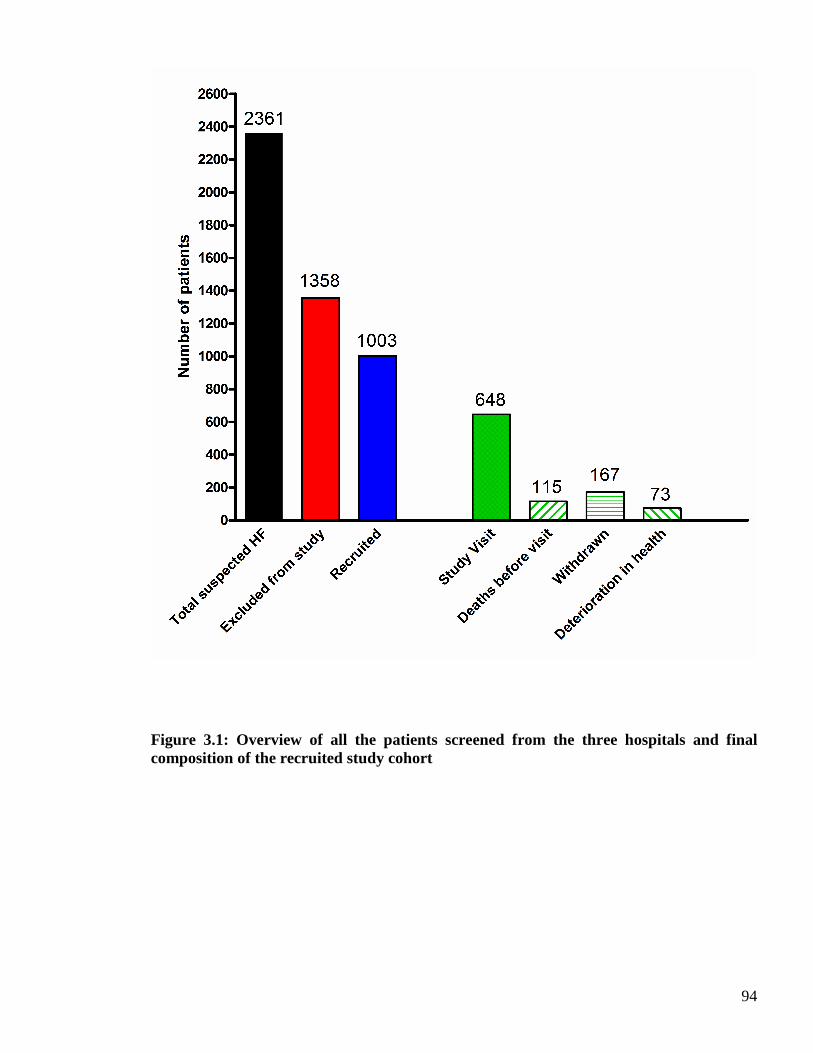
94
Figure 3.1: Overview of all the patients screened from the three hospitals and final composition of the recruited study cohort
95
Figure 3.2: Recruitment into the study; overall and per hospital. This figure details the rate of recruitment at each of the 3 hospitals, from 1st December 2006 for Royal and Western Infirmaries in Glasgow (GRI and WIG, respectively) and from the 22nd April 2008 from the Royal Alexandra Hospital (RAH). Recruitment finished on 10th January 2009.
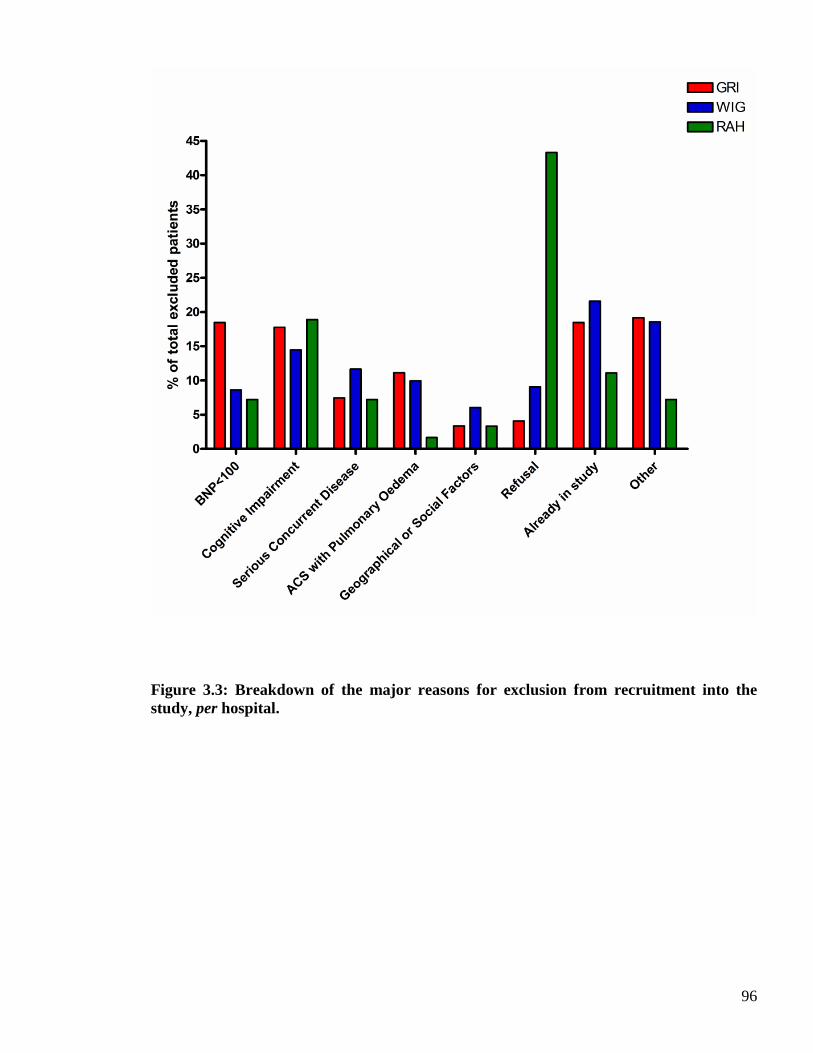
96
Figure 3.3: Breakdown of the major reasons for exclusion from recruitment into the study, per hospital.
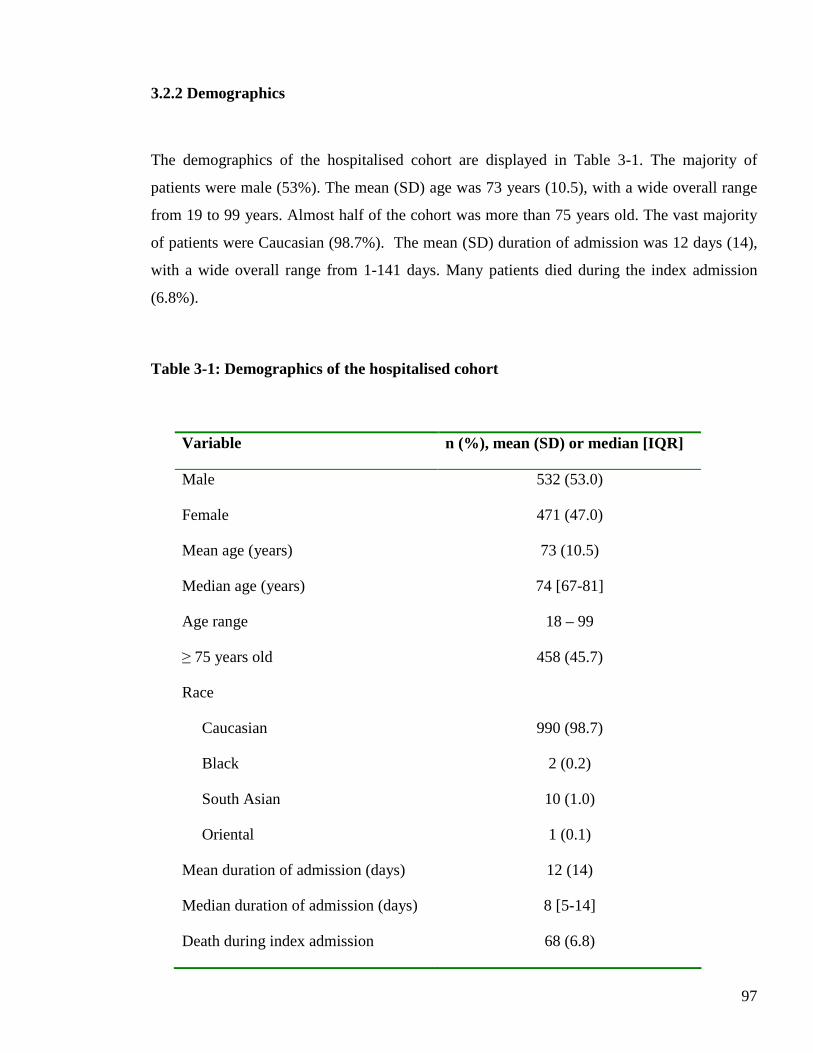
97
3.2.2 Demographics
The demographics of the hospitalised cohort are displayed in Table 3-1. The majority of
patients were male (53%). The mean (SD) age was 73 years (10.5), with a wide overall range
from 19 to 99 years. Almost half of the cohort was more than 75 years old. The vast majority
of patients were Caucasian (98.7%). The mean (SD) duration of admission was 12 days (14),
with a wide overall range from 1-141 days. Many patients died during the index admission
(6.8%).
Table 3-1: Demographics of the hospitalised cohort
Variable n (%), mean (SD) or median [IQR]
Male 532 (53.0)
Female 471 (47.0)
Mean age (years) 73 (10.5)
Median age (years) 74 [67-81]
Age range 18 – 99
≥ 75 years old 458 (45.7)
Race
Caucasian
Black
South Asian
Oriental
990 (98.7)
2 (0.2)
10 (1.0)
1 (0.1)
Mean duration of admission (days) 12 (14)
Median duration of admission (days) 8 [5-14]
Death during index admission 68 (6.8)
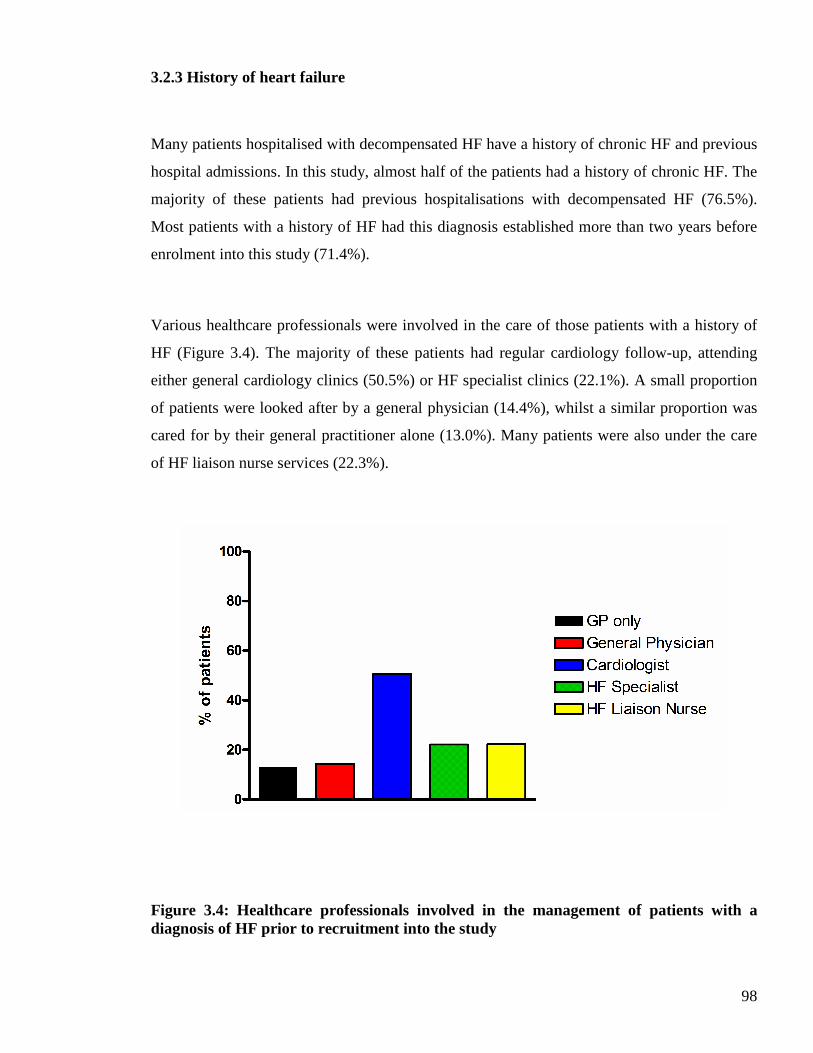
98
3.2.3 History of heart failure
Many patients hospitalised with decompensated HF have a history of chronic HF and previous
hospital admissions. In this study, almost half of the patients had a history of chronic HF. The
majority of these patients had previous hospitalisations with decompensated HF (76.5%).
Most patients with a history of HF had this diagnosis established more than two years before
enrolment into this study (71.4%).
Various healthcare professionals were involved in the care of those patients with a history of
HF (Figure 3.4). The majority of these patients had regular cardiology follow-up, attending
either general cardiology clinics (50.5%) or HF specialist clinics (22.1%). A small proportion
of patients were looked after by a general physician (14.4%), whilst a similar proportion was
cared for by their general practitioner alone (13.0%). Many patients were also under the care
of HF liaison nurse services (22.3%).
Figure 3.4: Healthcare professionals involved in the management of patients with a diagnosis of HF prior to recruitment into the study
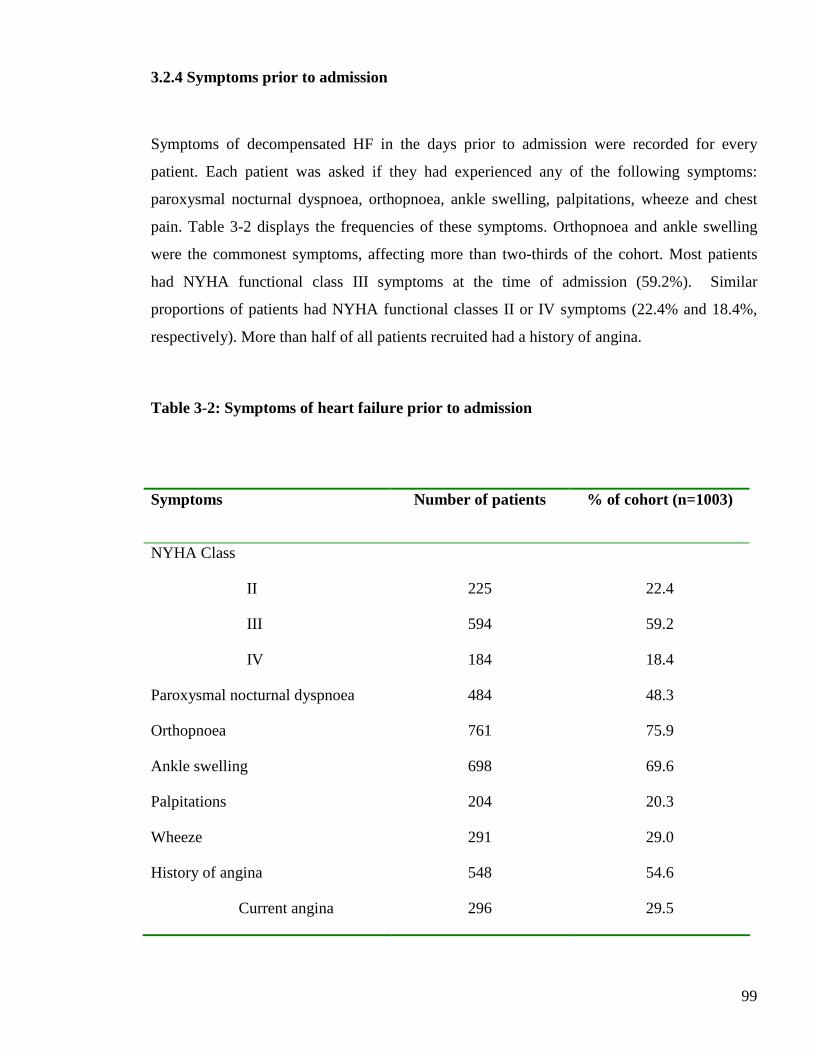
99
3.2.4 Symptoms prior to admission
Symptoms of decompensated HF in the days prior to admission were recorded for every
patient. Each patient was asked if they had experienced any of the following symptoms:
paroxysmal nocturnal dyspnoea, orthopnoea, ankle swelling, palpitations, wheeze and chest
pain. Table 3-2 displays the frequencies of these symptoms. Orthopnoea and ankle swelling
were the commonest symptoms, affecting more than two-thirds of the cohort. Most patients
had NYHA functional class III symptoms at the time of admission (59.2%). Similar
proportions of patients had NYHA functional classes II or IV symptoms (22.4% and 18.4%,
respectively). More than half of all patients recruited had a history of angina.
Table 3-2: Symptoms of heart failure prior to admission
Symptoms Number of patients % of cohort (n=1003)
NYHA Class
II
III
IV
225
594
184
22.4
59.2
18.4
Paroxysmal nocturnal dyspnoea 484 48.3
Orthopnoea 761 75.9
Ankle swelling 698 69.6
Palpitations 204 20.3
Wheeze 291 29.0
History of angina
Current angina
548
296
54.6
29.5
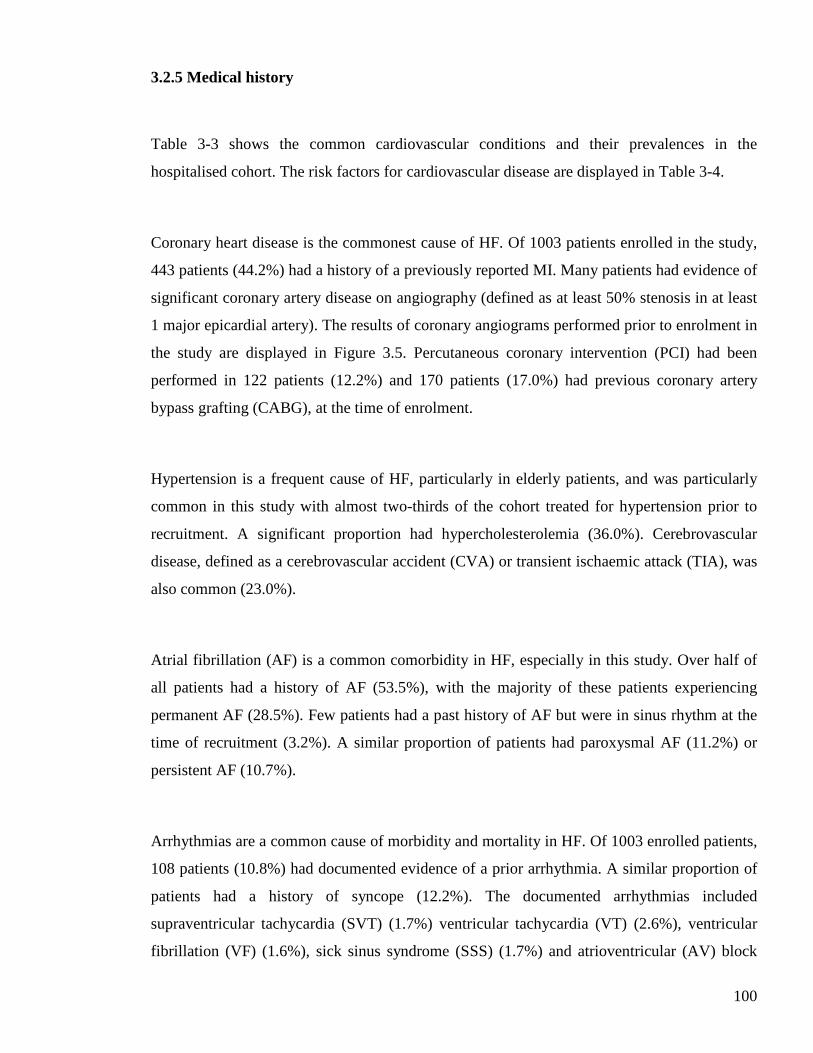
100
3.2.5 Medical history
Table 3-3 shows the common cardiovascular conditions and their prevalences in the
hospitalised cohort. The risk factors for cardiovascular disease are displayed in Table 3-4.
Coronary heart disease is the commonest cause of HF. Of 1003 patients enrolled in the study,
443 patients (44.2%) had a history of a previously reported MI. Many patients had evidence of
significant coronary artery disease on angiography (defined as at least 50% stenosis in at least
1 major epicardial artery). The results of coronary angiograms performed prior to enrolment in
the study are displayed in Figure 3.5. Percutaneous coronary intervention (PCI) had been
performed in 122 patients (12.2%) and 170 patients (17.0%) had previous coronary artery
bypass grafting (CABG), at the time of enrolment.
Hypertension is a frequent cause of HF, particularly in elderly patients, and was particularly
common in this study with almost two-thirds of the cohort treated for hypertension prior to
recruitment. A significant proportion had hypercholesterolemia (36.0%). Cerebrovascular
disease, defined as a cerebrovascular accident (CVA) or transient ischaemic attack (TIA), was
also common (23.0%).
Atrial fibrillation (AF) is a common comorbidity in HF, especially in this study. Over half of
all patients had a history of AF (53.5%), with the majority of these patients experiencing
permanent AF (28.5%). Few patients had a past history of AF but were in sinus rhythm at the
time of recruitment (3.2%). A similar proportion of patients had paroxysmal AF (11.2%) or
persistent AF (10.7%).
Arrhythmias are a common cause of morbidity and mortality in HF. Of 1003 enrolled patients,
108 patients (10.8%) had documented evidence of a prior arrhythmia. A similar proportion of
patients had a history of syncope (12.2%). The documented arrhythmias included
supraventricular tachycardia (SVT) (1.7%) ventricular tachycardia (VT) (2.6%), ventricular
fibrillation (VF) (1.6%), sick sinus syndrome (SSS) (1.7%) and atrioventricular (AV) block
101
(3.2%). Of the small number of patients with a documented history of VT, the majority was
nonsustained VT (73.1%). Of the patients with a history of AV block; the majority had either
second or third degree (40.6% and 43.8%, respectively). The low prevalence of first-degree
AV block may simply reflect this arrhythmia not being recorded in the medical case-notes.
Only 5 patients (0.5%) had a primary prevention ICD and 8 patients (0.8%) a secondary
prevention ICD. Conventional pacemakers were more common (6.1%), but few patients had
cardiac resynchronisation therapy with a defibrillator device (CRT-D) (0.5%). No patients had
cardiac resynchronisation therapy without a defibrillator device (CRT-P) at the time of
enrolment into the study.
Many patients had a history of valvular heart disease (44.3%). A subset of these patients had a
history of rheumatic valvular heart disease (7.2%) or a valve replacement prior to enrolment
into the study (8.0%).
Diabetes mellitus is an established risk factor for coronary heart disease and has recently
emerged as a risk factor for HF. Almost one third of the cohort had a history of diabetes
mellitus (31.2%). This was managed in the following ways; dietary modification alone (5.8%),
oral hypoglycaemic therapy (14.4%), insulin (8.0%), and oral hypoglycaemic and insulin
combination therapy (3.1%).
Alcohol is another important risk factor for HF and the majority of patients in this study
acknowledged alcohol consumption prior to admission (62.0%). Of these patients, few
admitted to alcohol intake in excess of the recommended safe limits (7.0%). A similar
proportion of patients admitted to a previous history of alcohol excess (9.6%) and almost half
of the cohort consumed alcohol within the recommended limits (45.5%). Few patients
admitted to a past history of alcohol excess but drank within recommended limits at the time
of admission (1.1%).
102
Over two-thirds of the cohort reported a history of cigarette smoking, the majority being ex-
smokers. Of the ex-smokers, most had stopped smoking more than 12 months before
recruitment into the study. Approximately one fifth of the cohort were cigarette smokers prior
to admission.
A family history of cardiac disease was recorded for every patient enrolled in the study. The
majority had no family history (61.0%). Around one third of the cohort described details of a
family history of coronary heart disease, with few patients aware of family members with a
diagnosis of a cardiomyopathy (0.7%). A small proportion could give an account of family
members having a history of cardiac disease but did not know the specific diagnoses (5.1%).
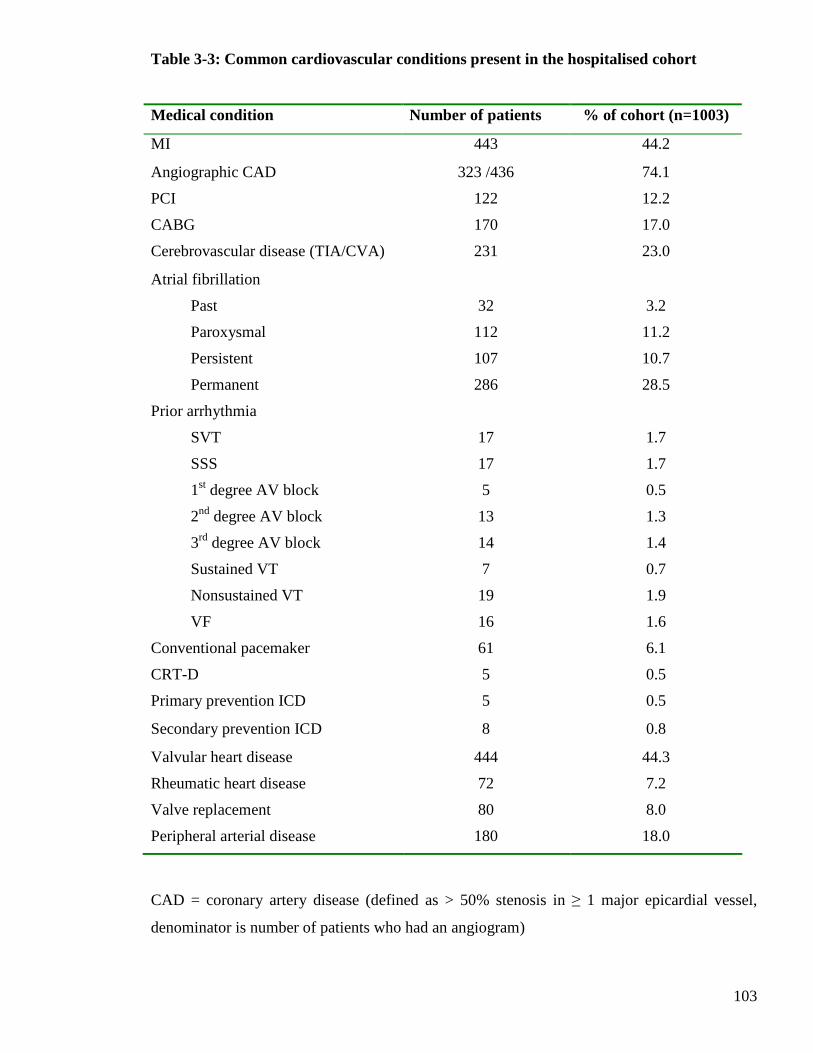
103
Medical condition Number of patients % of cohort (n=1003)
MI 443 44.2
Angiographic CAD 323 /436 74.1
PCI 122 12.2
CABG 170 17.0
Cerebrovascular disease (TIA/CVA) 231 23.0
Atrial fibrillation
Past
Paroxysmal
Persistent
Permanent
32
112
107
286
3.2
11.2
10.7
28.5
Prior arrhythmia
SVT
SSS
1st degree AV block
2nd degree AV block
3rd degree AV block
Sustained VT
Nonsustained VT
VF
17
17
5
13
14
7
19
16
1.7
1.7
0.5
1.3
1.4
0.7
1.9
1.6
Conventional pacemaker 61 6.1
CRT-D 5 0.5
Primary prevention ICD 5 0.5
Secondary prevention ICD 8 0.8
Valvular heart disease 444 44.3
Rheumatic heart disease 72 7.2
Valve replacement 80 8.0
Peripheral arterial disease 180 18.0
CAD = coronary artery disease (defined as > 50% stenosis in ≥ 1 major epicardial vessel,
denominator is number of patients who had an angiogram)
Table 3-3: Common cardiovascular conditions present in the hospitalised cohort
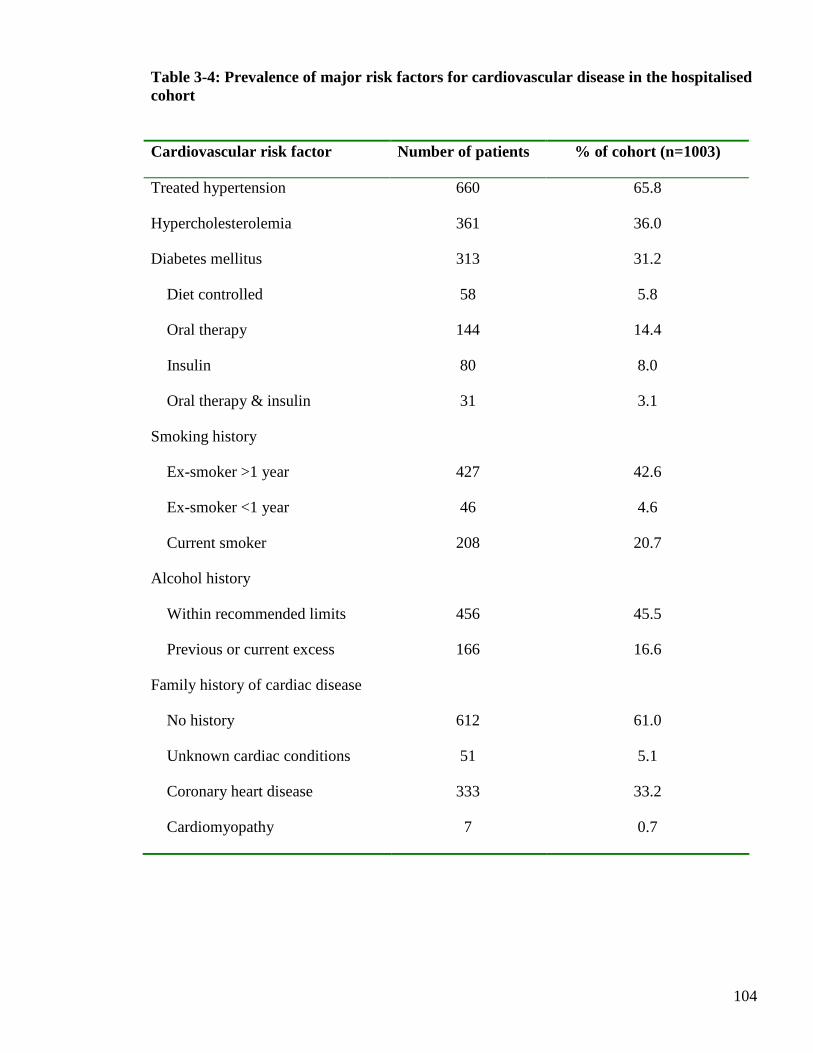
104
Table 3-4: Prevalence of major risk factors for cardiovascular disease in the hospitalised cohort
Cardiovascular risk factor Number of patients % of cohort (n=1003)
Treated hypertension 660 65.8
Hypercholesterolemia 361 36.0
Diabetes mellitus
Diet controlled
Oral therapy
Insulin
Oral therapy & insulin
313
58
144
80
31
31.2
5.8
14.4
8.0
3.1
Smoking history
Ex-smoker >1 year
Ex-smoker <1 year
Current smoker
427
46
208
42.6
4.6
20.7
Alcohol history
Within recommended limits
Previous or current excess
456
166
45.5
16.6
Family history of cardiac disease
No history
Unknown cardiac conditions
Coronary heart disease
Cardiomyopathy
612
51
333
7
61.0
5.1
33.2
0.7
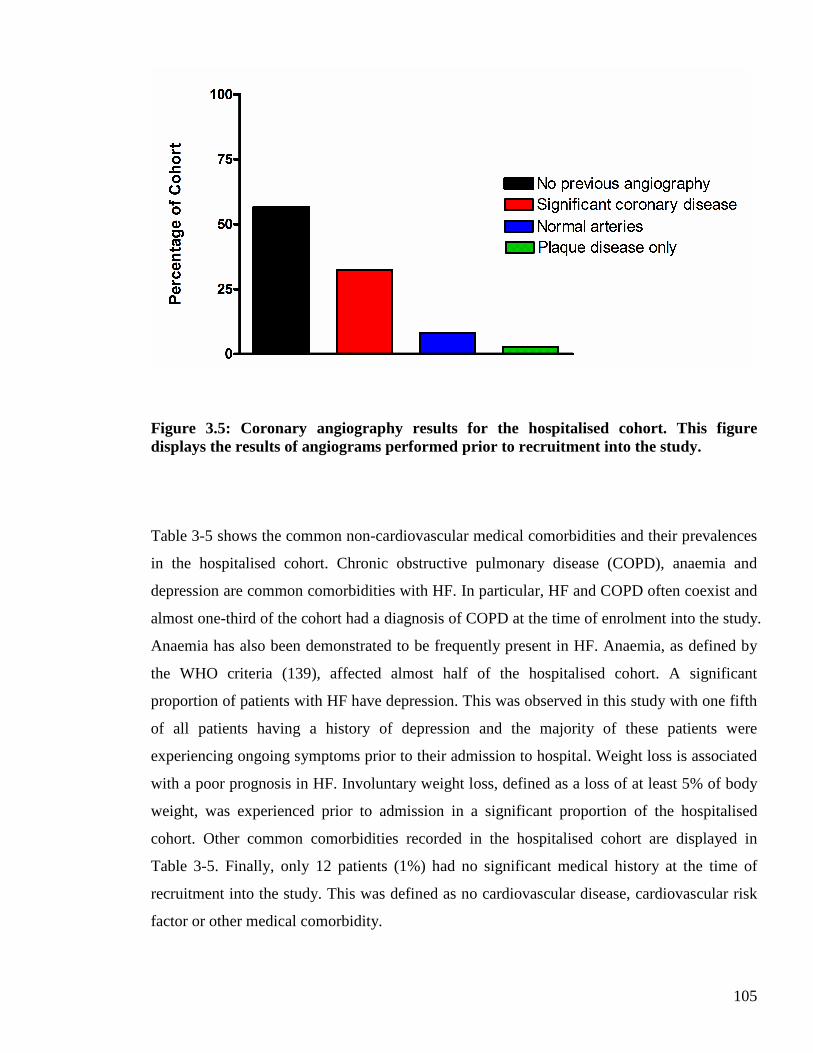
105
Figure 3.5: Coronary angiography results for the hospitalised cohort. This figure displays the results of angiograms performed prior to recruitment into the study.
Table 3-5 shows the common non-cardiovascular medical comorbidities and their prevalences
in the hospitalised cohort. Chronic obstructive pulmonary disease (COPD), anaemia and
depression are common comorbidities with HF. In particular, HF and COPD often coexist and
almost one-third of the cohort had a diagnosis of COPD at the time of enrolment into the study.
Anaemia has also been demonstrated to be frequently present in HF. Anaemia, as defined by
the WHO criteria (139), affected almost half of the hospitalised cohort. A significant
proportion of patients with HF have depression. This was observed in this study with one fifth
of all patients having a history of depression and the majority of these patients were
experiencing ongoing symptoms prior to their admission to hospital. Weight loss is associated
with a poor prognosis in HF. Involuntary weight loss, defined as a loss of at least 5% of body
weight, was experienced prior to admission in a significant proportion of the hospitalised
cohort. Other common comorbidities recorded in the hospitalised cohort are displayed in
Table 3-5. Finally, only 12 patients (1%) had no significant medical history at the time of
recruitment into the study. This was defined as no cardiovascular disease, cardiovascular risk
factor or other medical comorbidity.
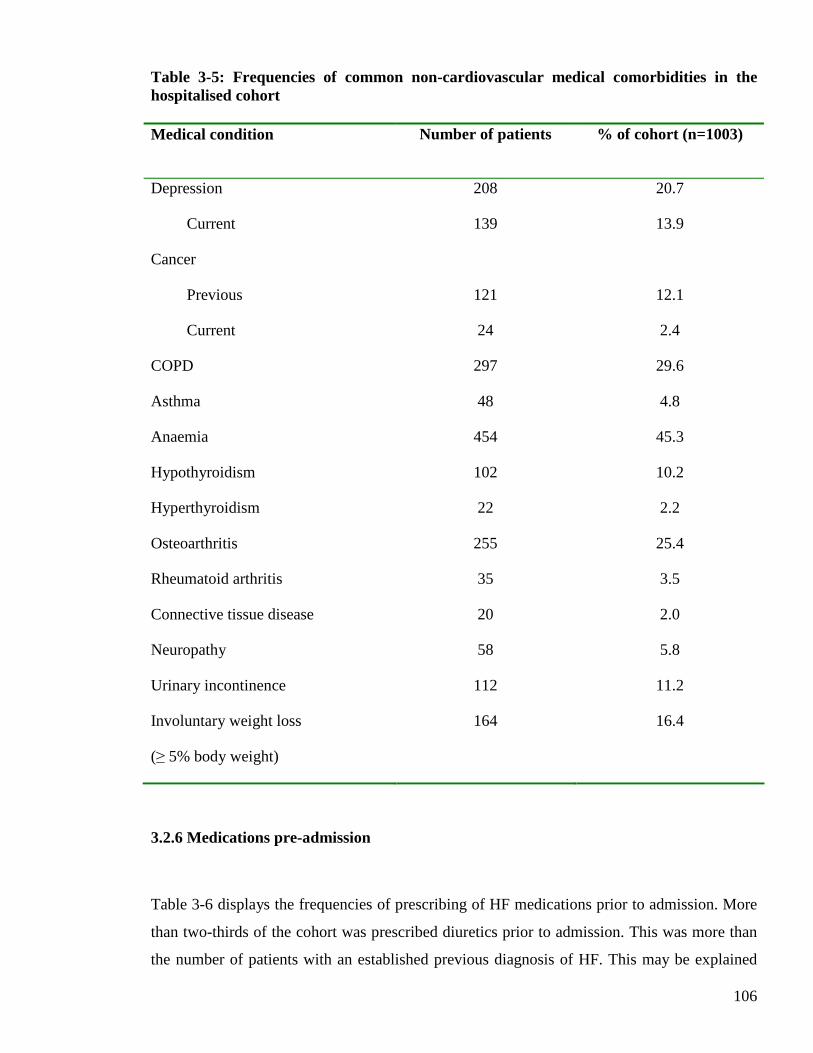
106
Table 3-5: Frequencies of common non-cardiovascular medical comorbidities in the hospitalised cohort Medical condition Number of patients % of cohort (n=1003)
Depression
Current
208
139
20.7
13.9
Cancer
Previous
Current
121
24
12.1
2.4
COPD 297 29.6
Asthma 48 4.8
Anaemia 454 45.3
Hypothyroidism 102 10.2
Hyperthyroidism 22 2.2
Osteoarthritis 255 25.4
Rheumatoid arthritis 35 3.5
Connective tissue disease 20 2.0
Neuropathy 58 5.8
Urinary incontinence 112 11.2
Involuntary weight loss
(≥ 5% body weight)
164 16.4
3.2.6 Medications pre-admission
Table 3-6 displays the frequencies of prescribing of HF medications prior to admission. More
than two-thirds of the cohort was prescribed diuretics prior to admission. This was more than
the number of patients with an established previous diagnosis of HF. This may be explained
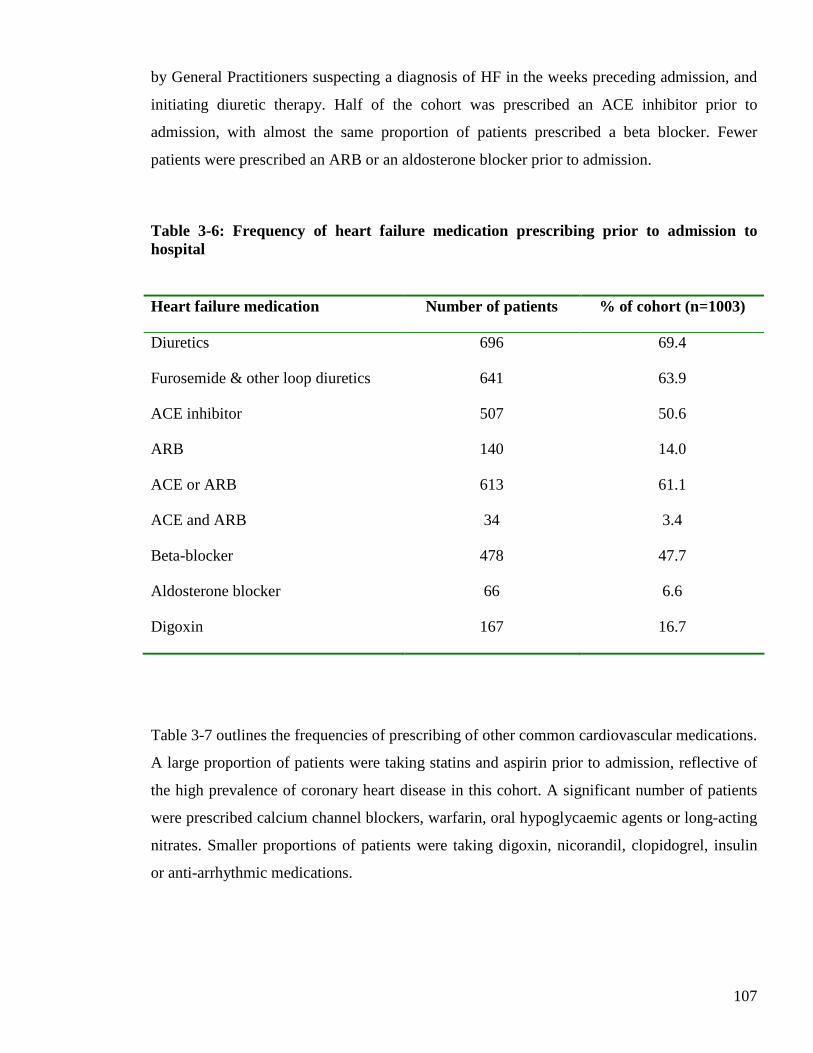
107
by General Practitioners suspecting a diagnosis of HF in the weeks preceding admission, and
initiating diuretic therapy. Half of the cohort was prescribed an ACE inhibitor prior to
admission, with almost the same proportion of patients prescribed a beta blocker. Fewer
patients were prescribed an ARB or an aldosterone blocker prior to admission.
Table 3-6: Frequency of heart failure medication prescribing prior to admission to hospital Heart failure medication Number of patients % of cohort (n=1003)
Diuretics 696 69.4
Furosemide & other loop diuretics 641 63.9
ACE inhibitor 507 50.6
ARB 140 14.0
ACE or ARB 613 61.1
ACE and ARB 34 3.4
Beta-blocker 478 47.7
Aldosterone blocker 66 6.6
Digoxin 167 16.7
Table 3-7 outlines the frequencies of prescribing of other common cardiovascular medications.
A large proportion of patients were taking statins and aspirin prior to admission, reflective of
the high prevalence of coronary heart disease in this cohort. A significant number of patients
were prescribed calcium channel blockers, warfarin, oral hypoglycaemic agents or long-acting
nitrates. Smaller proportions of patients were taking digoxin, nicorandil, clopidogrel, insulin
or anti-arrhythmic medications.
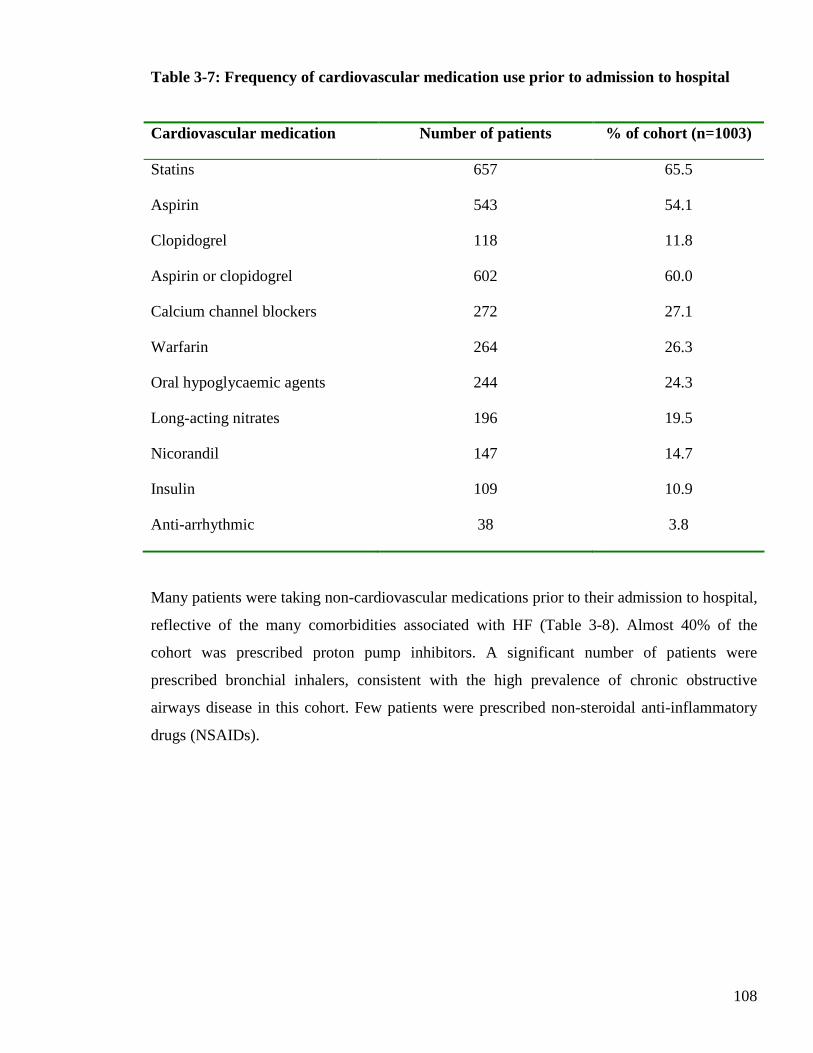
108
Table 3-7: Frequency of cardiovascular medication use prior to admission to hospital
Cardiovascular medication Number of patients % of cohort (n=1003)
Statins 657 65.5
Aspirin 543 54.1
Clopidogrel 118 11.8
Aspirin or clopidogrel 602 60.0
Calcium channel blockers 272 27.1
Warfarin 264 26.3
Oral hypoglycaemic agents 244 24.3
Long-acting nitrates 196 19.5
Nicorandil 147 14.7
Insulin 109 10.9
Anti-arrhythmic 38 3.8
Many patients were taking non-cardiovascular medications prior to their admission to hospital,
reflective of the many comorbidities associated with HF (Table 3-8). Almost 40% of the
cohort was prescribed proton pump inhibitors. A significant number of patients were
prescribed bronchial inhalers, consistent with the high prevalence of chronic obstructive
airways disease in this cohort. Few patients were prescribed non-steroidal anti-inflammatory
drugs (NSAIDs).
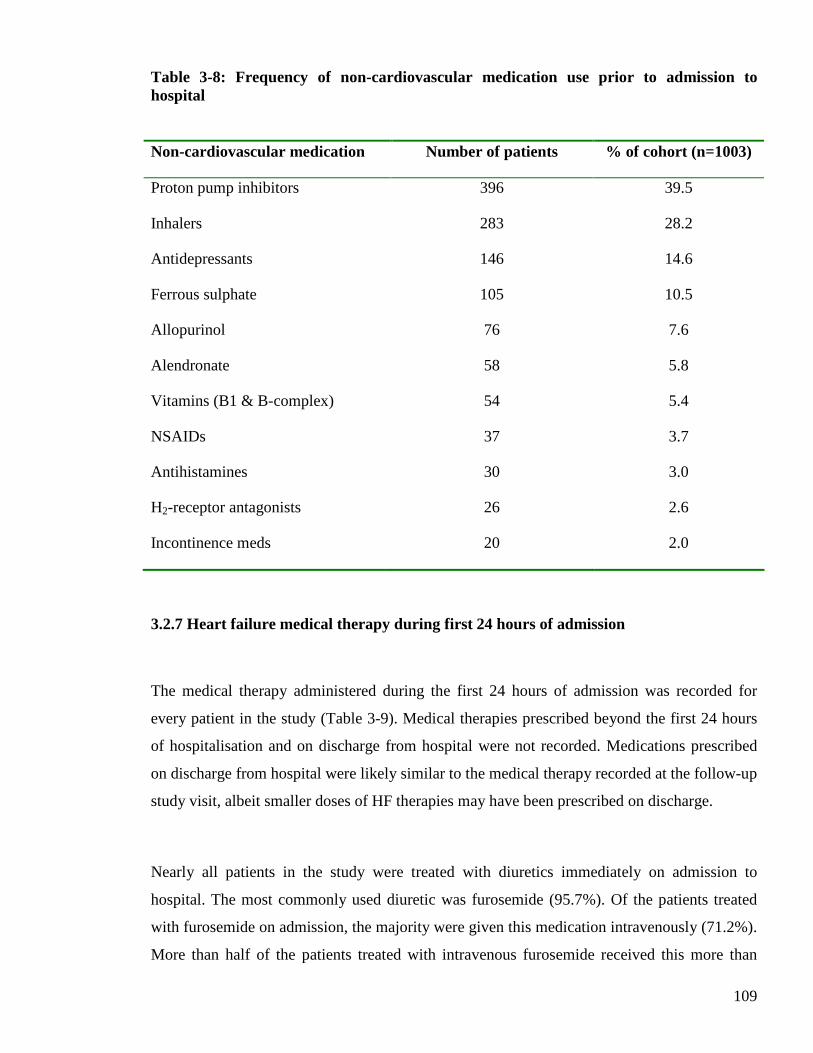
109
Table 3-8: Frequency of non-cardiovascular medication use prior to admission to hospital
Non-cardiovascular medication Number of patients % of cohort (n=1003)
Proton pump inhibitors 396 39.5
Inhalers 283 28.2
Antidepressants 146 14.6
Ferrous sulphate 105 10.5
Allopurinol 76 7.6
Alendronate 58 5.8
Vitamins (B1 & B-complex) 54 5.4
NSAIDs 37 3.7
Antihistamines 30 3.0
H2-receptor antagonists 26 2.6
Incontinence meds 20 2.0
3.2.7 Heart failure medical therapy during first 24 hours of admission
The medical therapy administered during the first 24 hours of admission was recorded for
every patient in the study (Table 3-9). Medical therapies prescribed beyond the first 24 hours
of hospitalisation and on discharge from hospital were not recorded. Medications prescribed
on discharge from hospital were likely similar to the medical therapy recorded at the follow-up
study visit, albeit smaller doses of HF therapies may have been prescribed on discharge.
Nearly all patients in the study were treated with diuretics immediately on admission to
hospital. The most commonly used diuretic was furosemide (95.7%). Of the patients treated
with furosemide on admission, the majority were given this medication intravenously (71.2%).
More than half of the patients treated with intravenous furosemide received this more than
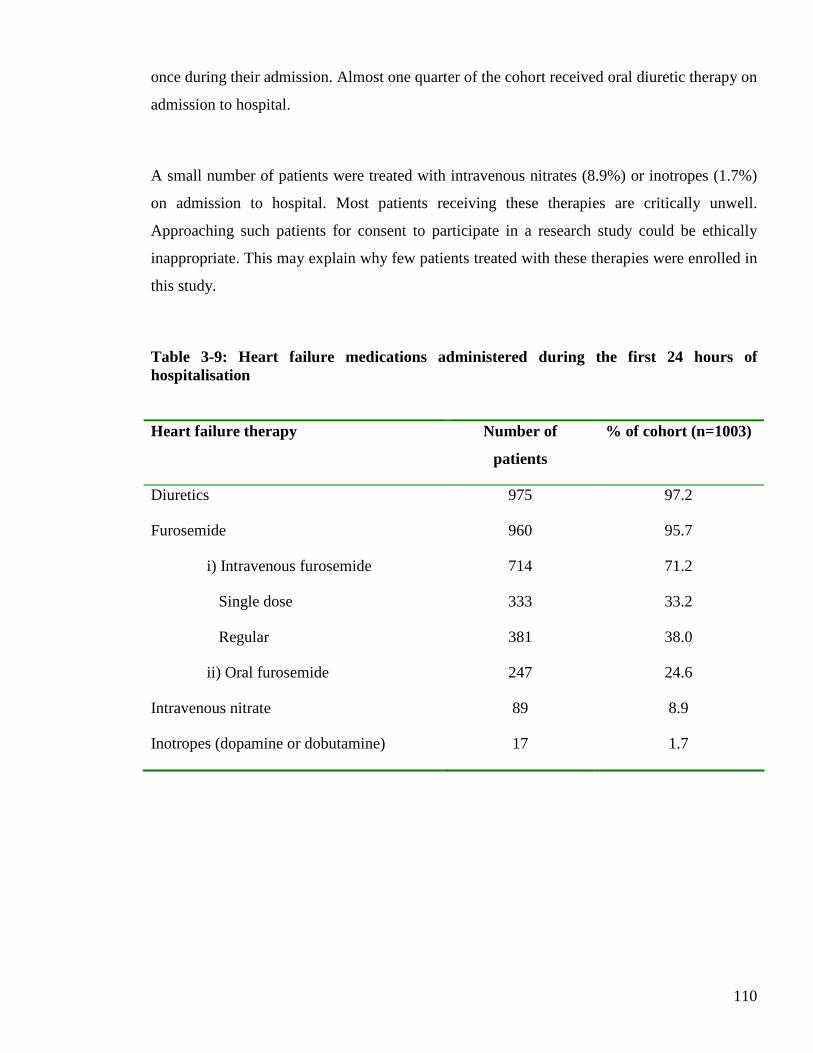
110
once during their admission. Almost one quarter of the cohort received oral diuretic therapy on
admission to hospital.
A small number of patients were treated with intravenous nitrates (8.9%) or inotropes (1.7%)
on admission to hospital. Most patients receiving these therapies are critically unwell.
Approaching such patients for consent to participate in a research study could be ethically
inappropriate. This may explain why few patients treated with these therapies were enrolled in
this study.
Table 3-9: Heart failure medications administered during the first 24 hours of hospitalisation
Heart failure therapy Number of
patients
% of cohort (n=1003)
Diuretics 975 97.2
Furosemide 960 95.7
i) Intravenous furosemide
Single dose
Regular
714
333
381
71.2
33.2
38.0
ii) Oral furosemide 247 24.6
Intravenous nitrate 89 8.9
Inotropes (dopamine or dobutamine) 17 1.7
111
3.2.8 Clinical examination findings on admission
3.2.8.1 Routine physiological measurements
Routine physiological measurements were recorded for all patients enrolled in the study
(Table 3-10). The first recording on arrival to hospital was used. The mean pulse rate was 90
bpm, with approximately one-third of patients having a tachycardia on admission (defined as
pulse >100 bpm). Of those patients with a tachycardia on admission, almost half were in AF
on their admission ECG. The majority of patients had a pulse between 60-100 bpm on arrival
to hospital, with few patients having a bradycardia (defined as pulse <60 bpm). The mean
(standard deviation [SD]) blood pressure was 136/76 mmHg (27.3/18.0), with an elevated
pulse pressure of 60mmHg. Many patients had a systolic blood pressure (SBP) greater than
140 mmHg (41.8%), with a significant proportion of these patients having stage 2
hypertension (defined as SBP ≥ 160 mmHg) on admission (16.4%). Few patients had systolic
hypotension (defined as SBP <90 mmHg) on admission. Over one fifth of patients presented
with diastolic hypertension (defined as diastolic blood pressure [DBP] ≥ 90 mmHg). A similar
proportion of patients presented with diastolic hypotension (defined as DBP <60 mmHg). The
mean temperature was 36.5°C with the majority of patients having a temperature within the
normal range (defined as 36.1-37.8°C). The mean respiratory rate was slightly elevated and
most patients were tachypnoeic (defined as respiratory rate ≥ 20 breaths per minute) on
admission to hospital (66.2%). The median oxygen saturation (SpO2) on admission to hospital
was 96%. Almost one third of all patients had SpO2 recordings less than 95% on admission to
hospital.
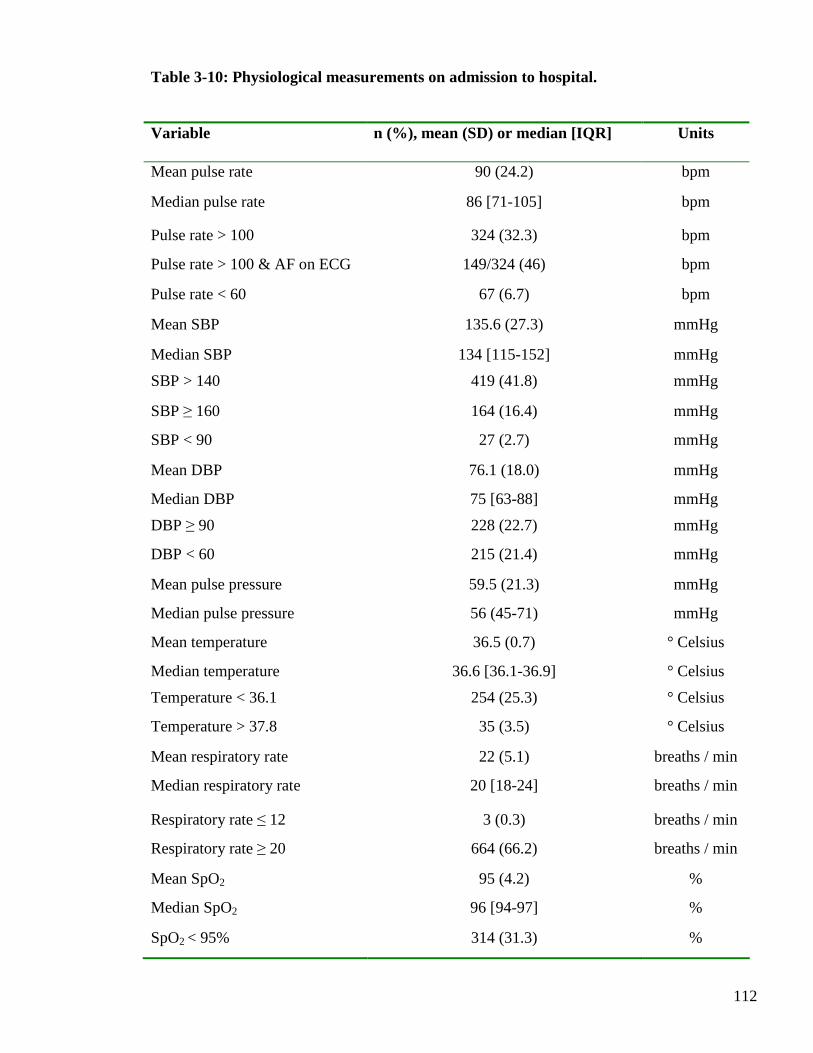
112
Table 3-10: Physiological measurements on admission to hospital.
Variable n (%), mean (SD) or median [IQR] Units
Mean pulse rate 90 (24.2) bpm
Median pulse rate 86 [71-105] bpm
Pulse rate > 100 324 (32.3) bpm
Pulse rate > 100 & AF on ECG 149/324 (46) bpm
Pulse rate < 60 67 (6.7) bpm
Mean SBP 135.6 (27.3) mmHg
Median SBP 134 [115-152] mmHg
SBP > 140 419 (41.8) mmHg
SBP ≥ 160 164 (16.4) mmHg
SBP < 90 27 (2.7) mmHg
Mean DBP 76.1 (18.0) mmHg
Median DBP 75 [63-88] mmHg
DBP ≥ 90 228 (22.7) mmHg
DBP < 60 215 (21.4) mmHg
Mean pulse pressure 59.5 (21.3) mmHg
Median pulse pressure 56 (45-71) mmHg
Mean temperature 36.5 (0.7) ° Celsius
Median temperature 36.6 [36.1-36.9] ° Celsius
Temperature < 36.1 254 (25.3) ° Celsius
Temperature > 37.8 35 (3.5) ° Celsius
Mean respiratory rate 22 (5.1) breaths / min
Median respiratory rate 20 [18-24] breaths / min
Respiratory rate ≤ 12 3 (0.3) breaths / min
Respiratory rate ≥ 20 664 (66.2) breaths / min
Mean SpO2 95 (4.2) %
Median SpO2 96 [94-97] %
SpO2 < 95% 314 (31.3) %
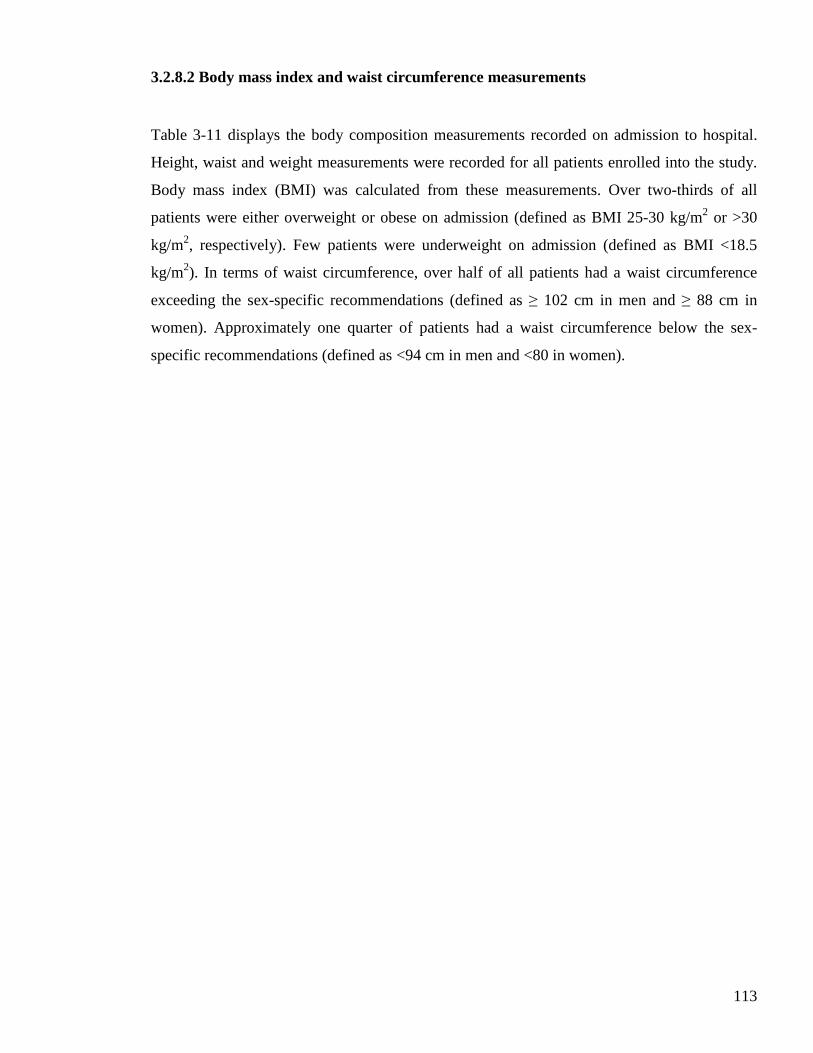
113
3.2.8.2 Body mass index and waist circumference measurements
Table 3-11 displays the body composition measurements recorded on admission to hospital.
Height, waist and weight measurements were recorded for all patients enrolled into the study.
Body mass index (BMI) was calculated from these measurements. Over two-thirds of all
patients were either overweight or obese on admission (defined as BMI 25-30 kg/m2 or >30
kg/m2, respectively). Few patients were underweight on admission (defined as BMI <18.5
kg/m2). In terms of waist circumference, over half of all patients had a waist circumference
exceeding the sex-specific recommendations (defined as ≥ 102 cm in men and ≥ 88 cm in
women). Approximately one quarter of patients had a waist circumference below the sex-
specific recommendations (defined as <94 cm in men and <80 in women).
114
Measurement n (%), mean (SD) or median [IQR] Units
Mean height 163.5 (10.4) cm
Median height 163.0 [156-171] cm
Mean height (men) 170.2 (8.1) cm
Mean height (women) 155.9 (7.2) cm
Mean weight 77.7 (20.4) kg
Median weight 75.0 [63-89] kg
Mean weight (men) 84.4 (20) kg
Mean weight (women) 70.2 (18.3) kg
Mean BMI 29.0 (6.9) kg/m2
Median BMI 27.8 [24.1-32.8] kg/m2
Mean BMI (men) 29.1 (6.5) kg/m2
Mean BMI (women) 28.9 (7.3) kg/m2
BMI calculation missing 10 (1.0) -
BMI < 18.5 (underweight) 23 (2.3) kg/m2
BMI 18.5–24.9 (normal weight) 285 (28.7) kg/m2
BMI 25–30 (overweight) 307 (30.9) kg/m2
BMI >30 (obese) 378 (38.1) kg/m2
Mean waist 98.7 (17.1) cm
Median waist 97.0 [87-109] cm
Waist measurement missing 31 (3.1) -
Waist < 94 males; < 80 females 240 (24.7) cm
Waist 94–102 males; 80–88 females 195 (20.1) cm
Waist ≥ 102 males; ≥ 88 females 537 (55.2) cm
Table 3-11: BMI and waist circumference measurements on admission to hospital
115
3.2.8.3 Cardiovascular examination signs
A full cardiovascular examination was performed for all patients enrolled into the study (Table
3-12). The cardiovascular signs on examination were consistent with expected findings for
patients with decompensated HF. The majority of patients had a raised jugular venous pressure
(JVP), pulmonary crackles and peripheral oedema. Almost one quarter of patients had a
palpable displaced apex beat. Nearly all patients were in Killip class II or III. The small
number of patients in Killip class IV likely reflects the high mortality associated with this
clinical state, and the unsuitability of approaching such unstable patients for inclusion in a
research study. The small number of patients with a third heart sound is unexpected for a
cohort of patients with decompensated HF. One explanation may be the variation in an
individual’s ability to detect and record this clinical sign. Furthermore, this sign may have
been no longer present by the time of enrolment if the patient had already received HF
treatment. More than one-third of all patients recruited had a detectable murmur recorded,
consistent with the notable prevalence of valvular heart disease.
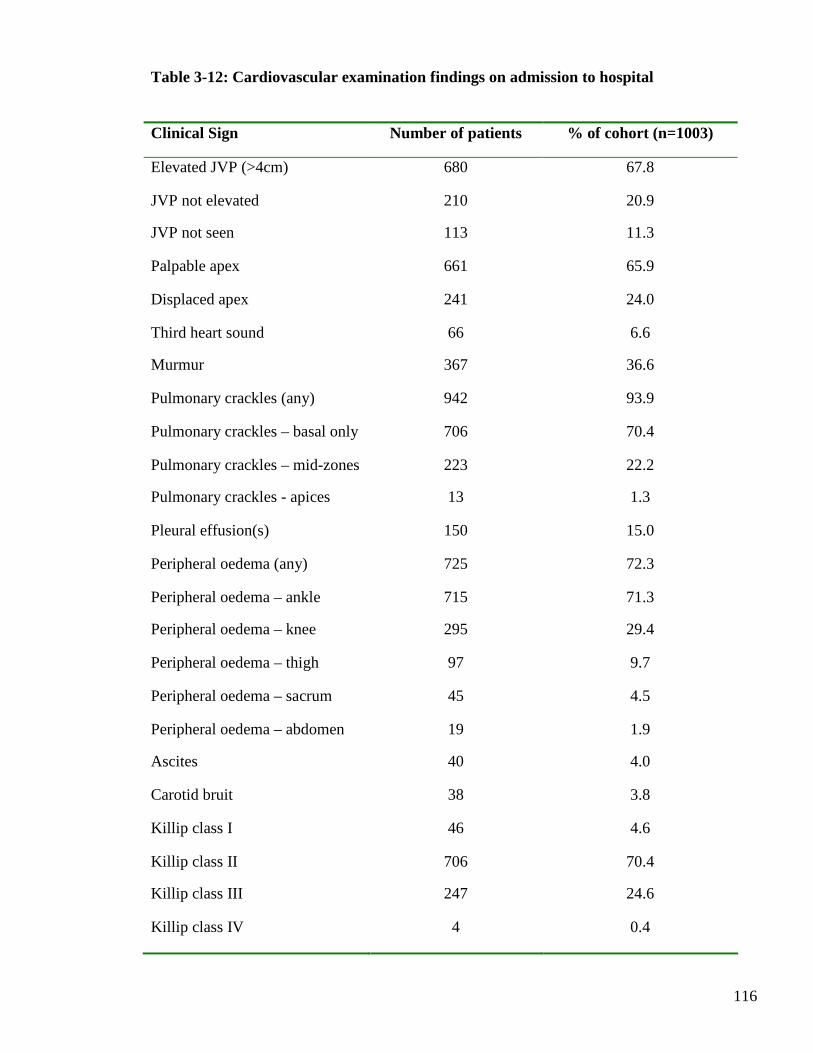
116
Table 3-12: Cardiovascular examination findings on admission to hospital
Clinical Sign Number of patients % of cohort (n=1003)
Elevated JVP (>4cm) 680 67.8
JVP not elevated 210 20.9
JVP not seen 113 11.3
Palpable apex 661 65.9
Displaced apex 241 24.0
Third heart sound 66 6.6
Murmur 367 36.6
Pulmonary crackles (any) 942 93.9
Pulmonary crackles – basal only 706 70.4
Pulmonary crackles – mid-zones 223 22.2
Pulmonary crackles - apices 13 1.3
Pleural effusion(s) 150 15.0
Peripheral oedema (any) 725 72.3
Peripheral oedema – ankle 715 71.3
Peripheral oedema – knee 295 29.4
Peripheral oedema – thigh 97 9.7
Peripheral oedema – sacrum 45 4.5
Peripheral oedema – abdomen 19 1.9
Ascites 40 4.0
Carotid bruit 38 3.8
Killip class I 46 4.6
Killip class II 706 70.4
Killip class III 247 24.6
Killip class IV 4 0.4
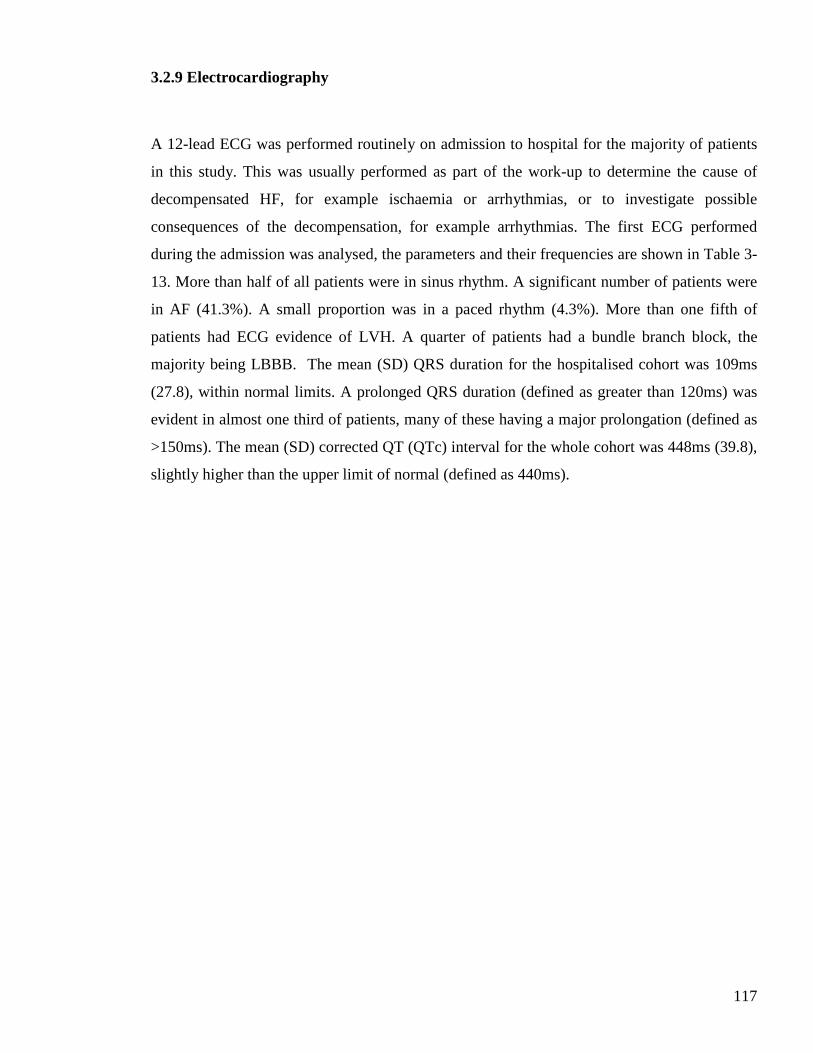
117
3.2.9 Electrocardiography
A 12-lead ECG was performed routinely on admission to hospital for the majority of patients
in this study. This was usually performed as part of the work-up to determine the cause of
decompensated HF, for example ischaemia or arrhythmias, or to investigate possible
consequences of the decompensation, for example arrhythmias. The first ECG performed
during the admission was analysed, the parameters and their frequencies are shown in Table 3-
13. More than half of all patients were in sinus rhythm. A significant number of patients were
in AF (41.3%). A small proportion was in a paced rhythm (4.3%). More than one fifth of
patients had ECG evidence of LVH. A quarter of patients had a bundle branch block, the
majority being LBBB. The mean (SD) QRS duration for the hospitalised cohort was 109ms
(27.8), within normal limits. A prolonged QRS duration (defined as greater than 120ms) was
evident in almost one third of patients, many of these having a major prolongation (defined as
>150ms). The mean (SD) corrected QT (QTc) interval for the whole cohort was 448ms (39.8),
slightly higher than the upper limit of normal (defined as 440ms).
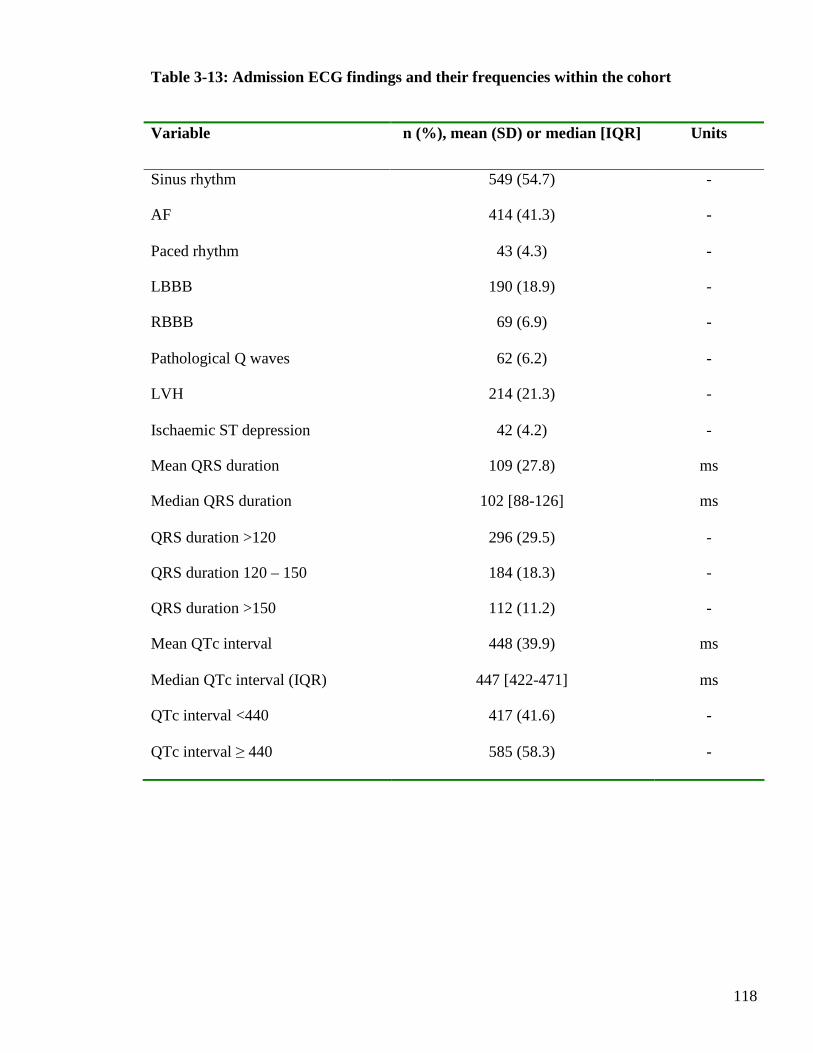
118
Table 3-13: Admission ECG findings and their frequencies within the cohort
Variable n (%), mean (SD) or median [IQR] Units
Sinus rhythm 549 (54.7) -
AF 414 (41.3) -
Paced rhythm 43 (4.3) -
LBBB 190 (18.9) -
RBBB 69 (6.9) -
Pathological Q waves 62 (6.2) -
LVH 214 (21.3) -
Ischaemic ST depression 42 (4.2) -
Mean QRS duration 109 (27.8) ms
Median QRS duration 102 [88-126] ms
QRS duration >120 296 (29.5) -
QRS duration 120 – 150 184 (18.3) -
QRS duration >150 112 (11.2) -
Mean QTc interval 448 (39.9) ms
Median QTc interval (IQR) 447 [422-471] ms
QTc interval <440 417 (41.6) -
QTc interval ≥ 440 585 (58.3) -
119
3.2.10 Chest X-Ray
Of 1003 patients in the study, 1000 patients had a CXR performed on admission to hospital.
The findings are displayed in Figure 3.6. The majority of patients had radiological evidence of
cardiomegaly (70.5%). Similar proportions of patients had signs of pulmonary oedema
reported on CXR, namely upper lobe venous diversion (68.5%) and alveolar oedema (73.8%).
Over half of patients (54.2%) had evidence of pulmonary congestion in the form of interstitial
oedema. Pleural effusions were also a common radiological finding, reported in a third of the
cohort.
Figure 3.6: Radiological findings on the admission CXR for the hospitalised cohort
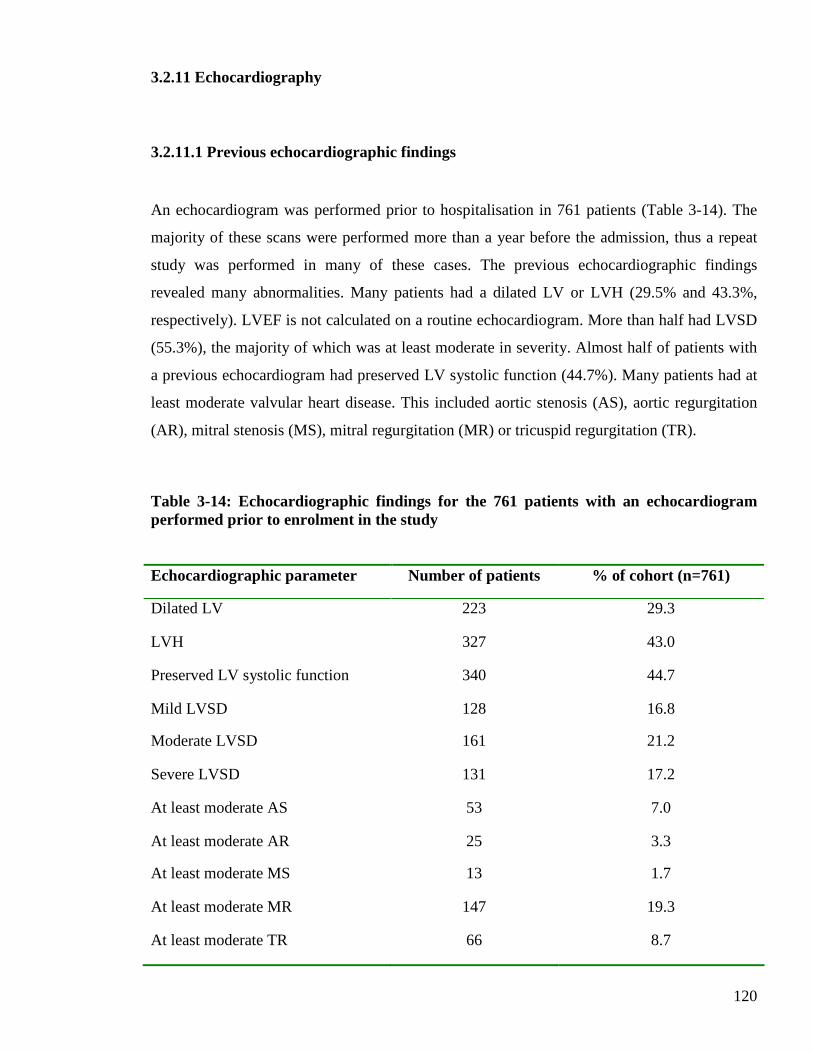
120
3.2.11 Echocardiography
3.2.11.1 Previous echocardiographic findings
An echocardiogram was performed prior to hospitalisation in 761 patients (Table 3-14). The
majority of these scans were performed more than a year before the admission, thus a repeat
study was performed in many of these cases. The previous echocardiographic findings
revealed many abnormalities. Many patients had a dilated LV or LVH (29.5% and 43.3%,
respectively). LVEF is not calculated on a routine echocardiogram. More than half had LVSD
(55.3%), the majority of which was at least moderate in severity. Almost half of patients with
a previous echocardiogram had preserved LV systolic function (44.7%). Many patients had at
least moderate valvular heart disease. This included aortic stenosis (AS), aortic regurgitation
(AR), mitral stenosis (MS), mitral regurgitation (MR) or tricuspid regurgitation (TR).
Table 3-14: Echocardiographic findings for the 761 patients with an echocardiogram performed prior to enrolment in the study
Echocardiographic parameter Number of patients % of cohort (n=761)
Dilated LV 223 29.3
LVH 327 43.0
Preserved LV systolic function 340 44.7
Mild LVSD 128 16.8
Moderate LVSD 161 21.2
Severe LVSD 131 17.2
At least moderate AS 53 7.0
At least moderate AR 25 3.3
At least moderate MS 13 1.7
At least moderate MR 147 19.3
At least moderate TR 66 8.7
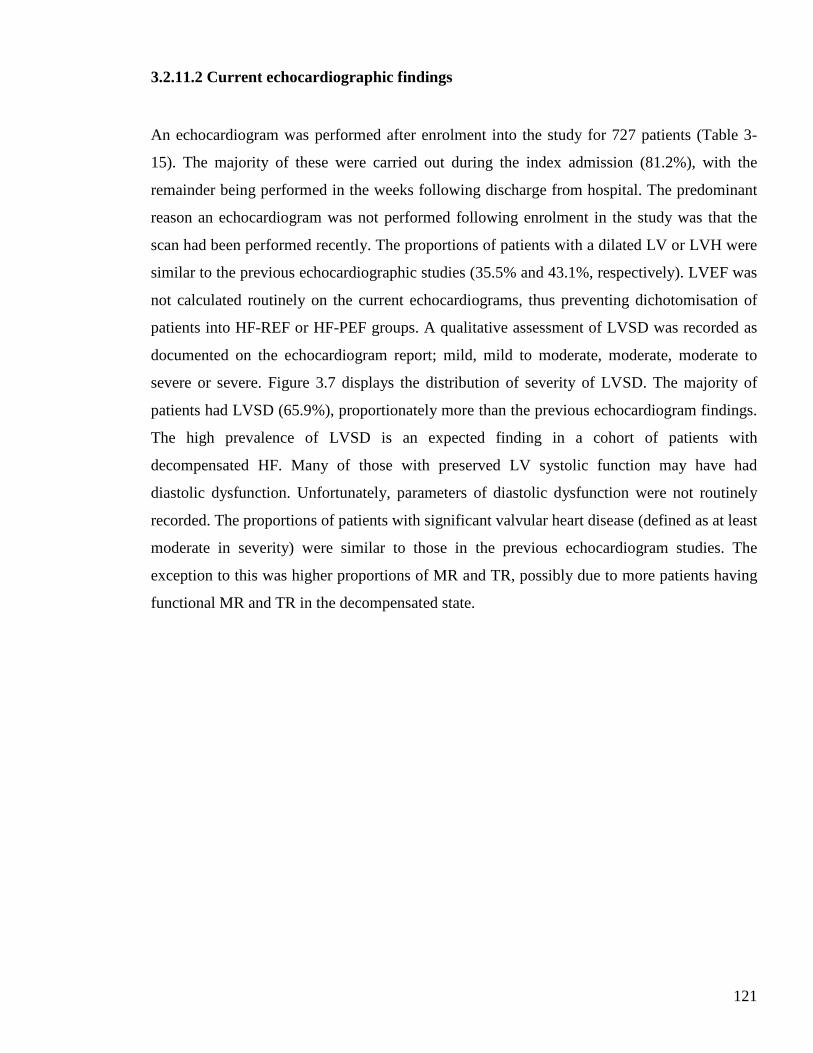
121
3.2.11.2 Current echocardiographic findings
An echocardiogram was performed after enrolment into the study for 727 patients (Table 3-
15). The majority of these were carried out during the index admission (81.2%), with the
remainder being performed in the weeks following discharge from hospital. The predominant
reason an echocardiogram was not performed following enrolment in the study was that the
scan had been performed recently. The proportions of patients with a dilated LV or LVH were
similar to the previous echocardiographic studies (35.5% and 43.1%, respectively). LVEF was
not calculated routinely on the current echocardiograms, thus preventing dichotomisation of
patients into HF-REF or HF-PEF groups. A qualitative assessment of LVSD was recorded as
documented on the echocardiogram report; mild, mild to moderate, moderate, moderate to
severe or severe. Figure 3.7 displays the distribution of severity of LVSD. The majority of
patients had LVSD (65.9%), proportionately more than the previous echocardiogram findings.
The high prevalence of LVSD is an expected finding in a cohort of patients with
decompensated HF. Many of those with preserved LV systolic function may have had
diastolic dysfunction. Unfortunately, parameters of diastolic dysfunction were not routinely
recorded. The proportions of patients with significant valvular heart disease (defined as at least
moderate in severity) were similar to those in the previous echocardiogram studies. The
exception to this was higher proportions of MR and TR, possibly due to more patients having
functional MR and TR in the decompensated state.
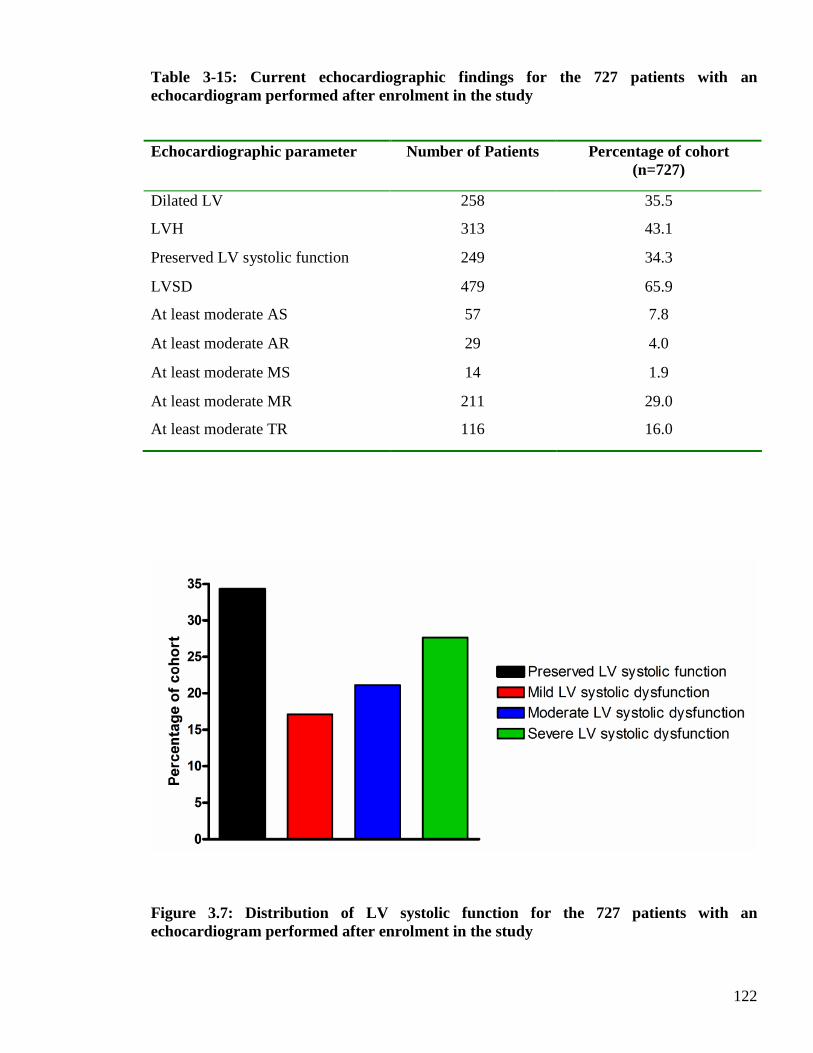
122
Table 3-15: Current echocardiographic findings for the 727 patients with an echocardiogram performed after enrolment in the study
Echocardiographic parameter Number of Patients Percentage of cohort (n=727)
Dilated LV 258 35.5
LVH 313 43.1
Preserved LV systolic function 249 34.3
LVSD 479 65.9
At least moderate AS 57 7.8
At least moderate AR 29 4.0
At least moderate MS 14 1.9
At least moderate MR 211 29.0
At least moderate TR 116 16.0
Figure 3.7: Distribution of LV systolic function for the 727 patients with an echocardiogram performed after enrolment in the study
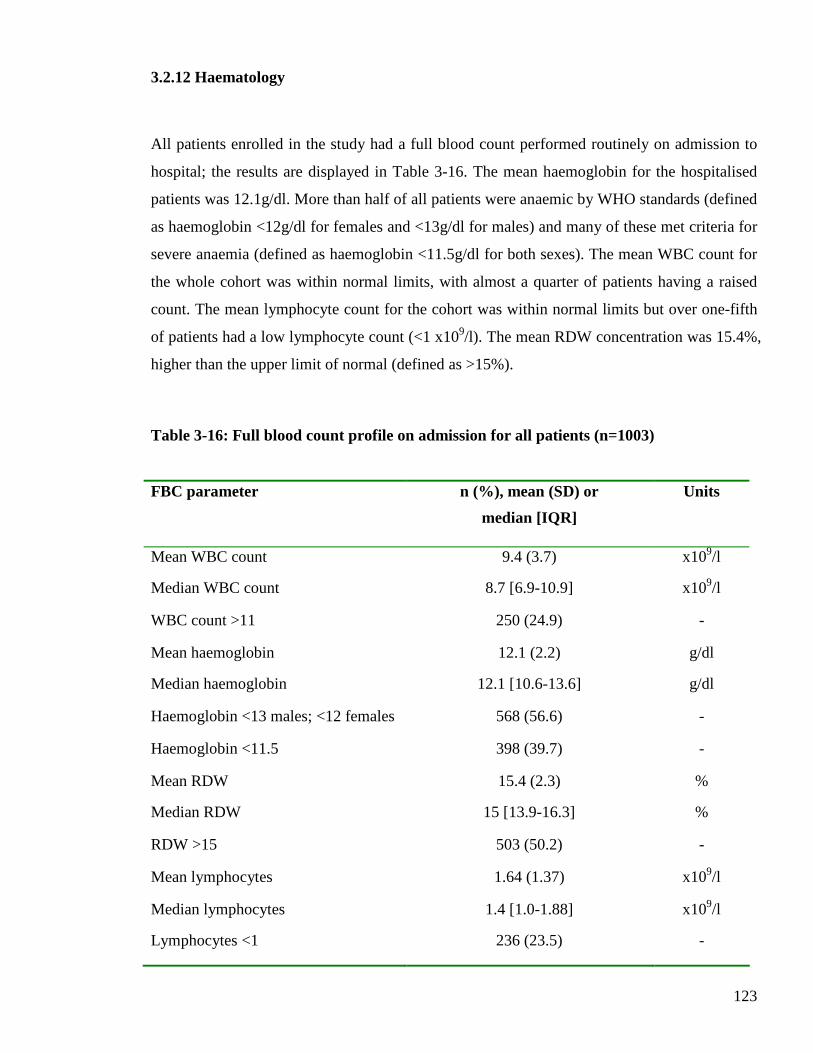
123
3.2.12 Haematology
All patients enrolled in the study had a full blood count performed routinely on admission to
hospital; the results are displayed in Table 3-16. The mean haemoglobin for the hospitalised
patients was 12.1g/dl. More than half of all patients were anaemic by WHO standards (defined
as haemoglobin <12g/dl for females and <13g/dl for males) and many of these met criteria for
severe anaemia (defined as haemoglobin <11.5g/dl for both sexes). The mean WBC count for
the whole cohort was within normal limits, with almost a quarter of patients having a raised
count. The mean lymphocyte count for the cohort was within normal limits but over one-fifth
of patients had a low lymphocyte count (<1 x10⁹/l). The mean RDW concentration was 15.4%,
higher than the upper limit of normal (defined as >15%).
Table 3-16: Full blood count profile on admission for all patients (n=1003)
FBC parameter n (%), mean (SD) or
median [IQR]
Units
Mean WBC count 9.4 (3.7) x109/l
Median WBC count 8.7 [6.9-10.9] x109/l
WBC count >11 250 (24.9) -
Mean haemoglobin 12.1 (2.2) g/dl
Median haemoglobin 12.1 [10.6-13.6] g/dl
Haemoglobin <13 males; <12 females 568 (56.6) -
Haemoglobin <11.5 398 (39.7) -
Mean RDW 15.4 (2.3) %
Median RDW 15 [13.9-16.3] %
RDW >15 503 (50.2) -
Mean lymphocytes 1.64 (1.37) x109/l
Median lymphocytes 1.4 [1.0-1.88] x109/l
Lymphocytes <1 236 (23.5) -
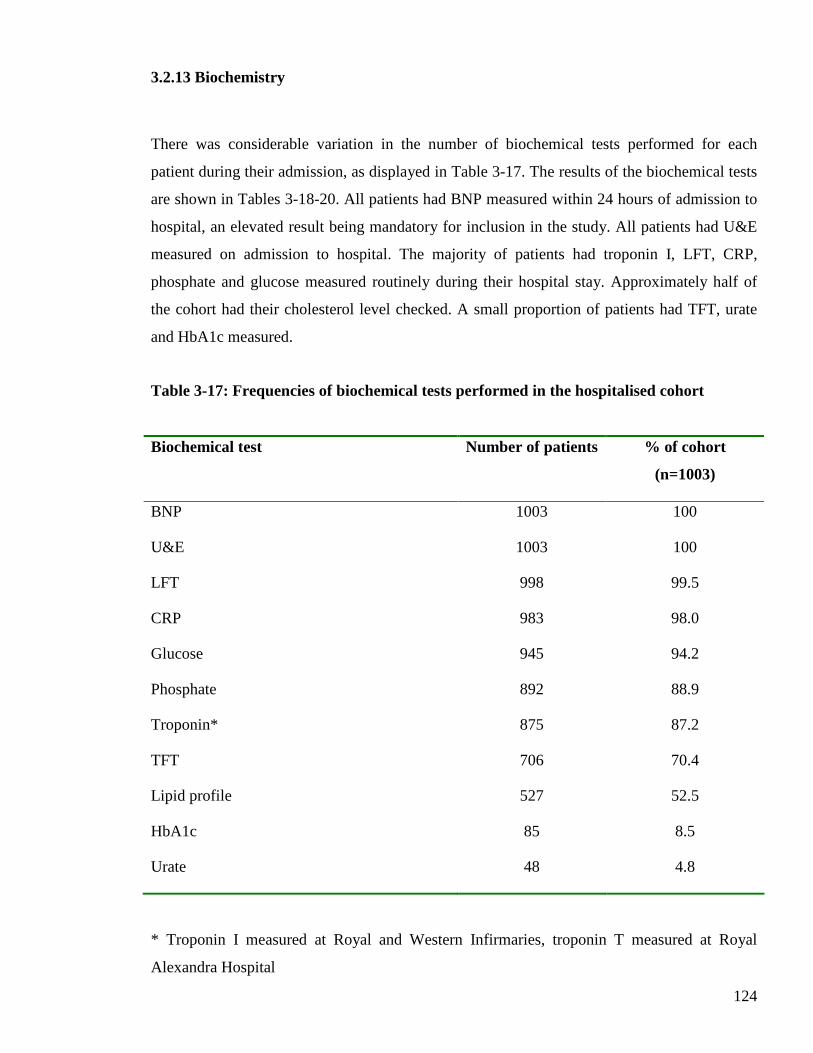
124
3.2.13 Biochemistry
There was considerable variation in the number of biochemical tests performed for each
patient during their admission, as displayed in Table 3-17. The results of the biochemical tests
are shown in Tables 3-18-20. All patients had BNP measured within 24 hours of admission to
hospital, an elevated result being mandatory for inclusion in the study. All patients had U&E
measured on admission to hospital. The majority of patients had troponin I, LFT, CRP,
phosphate and glucose measured routinely during their hospital stay. Approximately half of
the cohort had their cholesterol level checked. A small proportion of patients had TFT, urate
and HbA1c measured.
Table 3-17: Frequencies of biochemical tests performed in the hospitalised cohort
Biochemical test Number of patients % of cohort
(n=1003)
BNP 1003 100
U&E 1003 100
LFT 998 99.5
CRP 983 98.0
Glucose 945 94.2
Phosphate 892 88.9
Troponin* 875 87.2
TFT 706 70.4
Lipid profile 527 52.5
HbA1c 85 8.5
Urate 48 4.8
* Troponin I measured at Royal and Western Infirmaries, troponin T measured at Royal
Alexandra Hospital
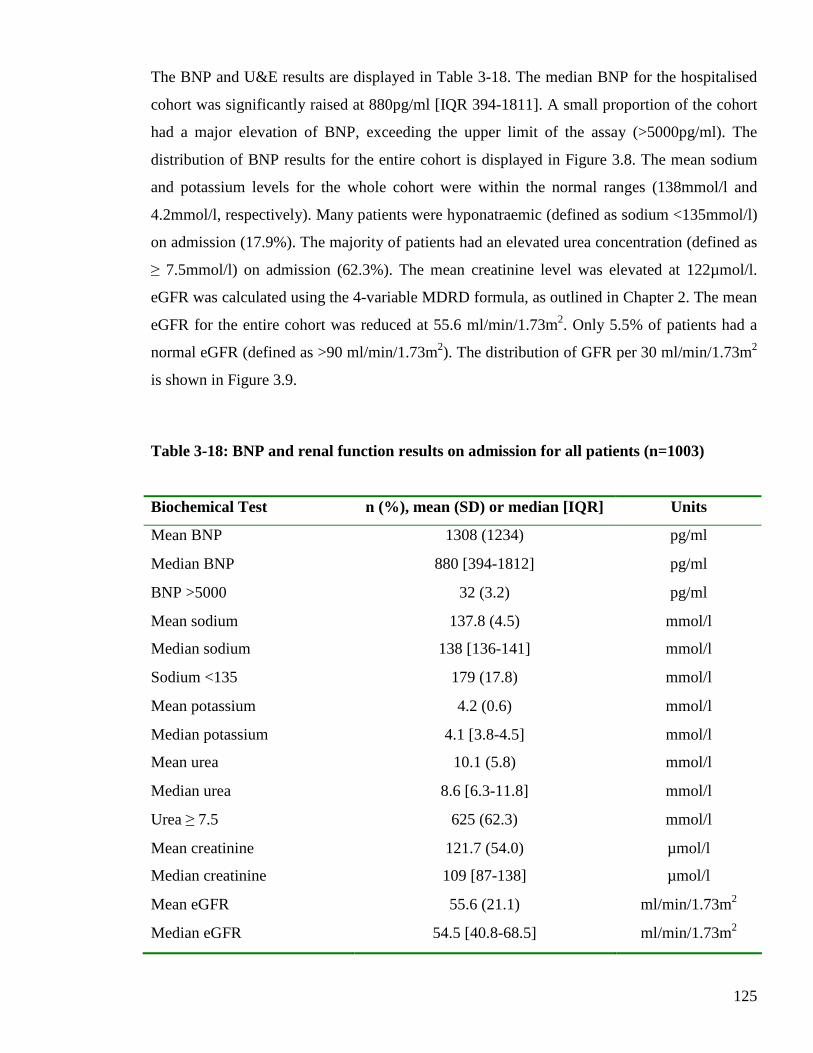
125
The BNP and U&E results are displayed in Table 3-18. The median BNP for the hospitalised
cohort was significantly raised at 880pg/ml [IQR 394-1811]. A small proportion of the cohort
had a major elevation of BNP, exceeding the upper limit of the assay (>5000pg/ml). The
distribution of BNP results for the entire cohort is displayed in Figure 3.8. The mean sodium
and potassium levels for the whole cohort were within the normal ranges (138mmol/l and
4.2mmol/l, respectively). Many patients were hyponatraemic (defined as sodium <135mmol/l)
on admission (17.9%). The majority of patients had an elevated urea concentration (defined as
≥ 7.5mmol/l) on admission (62.3%). The mean creatinine level was elevated at 122µmol/l.
eGFR was calculated using the 4-variable MDRD formula, as outlined in Chapter 2. The mean
eGFR for the entire cohort was reduced at 55.6 ml/min/1.73m2. Only 5.5% of patients had a
normal eGFR (defined as >90 ml/min/1.73m2). The distribution of GFR per 30 ml/min/1.73m2
is shown in Figure 3.9.
Table 3-18: BNP and renal function results on admission for all patients (n=1003)
Biochemical Test n (%), mean (SD) or median [IQR] Units
Mean BNP 1308 (1234) pg/ml
Median BNP 880 [394-1812] pg/ml
BNP >5000 32 (3.2) pg/ml
Mean sodium 137.8 (4.5) mmol/l
Median sodium 138 [136-141] mmol/l
Sodium <135 179 (17.8) mmol/l
Mean potassium 4.2 (0.6) mmol/l
Median potassium 4.1 [3.8-4.5] mmol/l
Mean urea 10.1 (5.8) mmol/l
Median urea 8.6 [6.3-11.8] mmol/l
Urea ≥ 7.5 625 (62.3) mmol/l
Mean creatinine 121.7 (54.0) µmol/l
Median creatinine 109 [87-138] µmol/l
Mean eGFR 55.6 (21.1) ml/min/1.73m2
Median eGFR 54.5 [40.8-68.5] ml/min/1.73m2
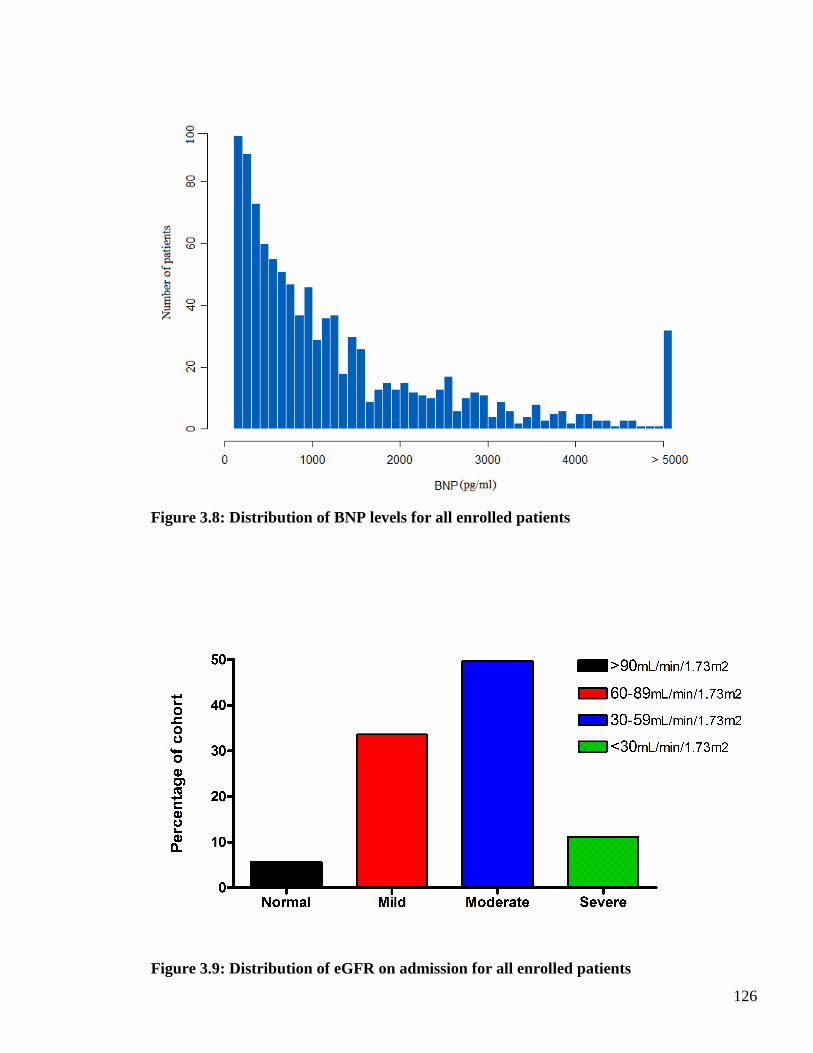
126
Figure 3.8: Distribution of BNP levels for all enrolled patients
Figure 3.9: Distribution of eGFR on admission for all enrolled patients
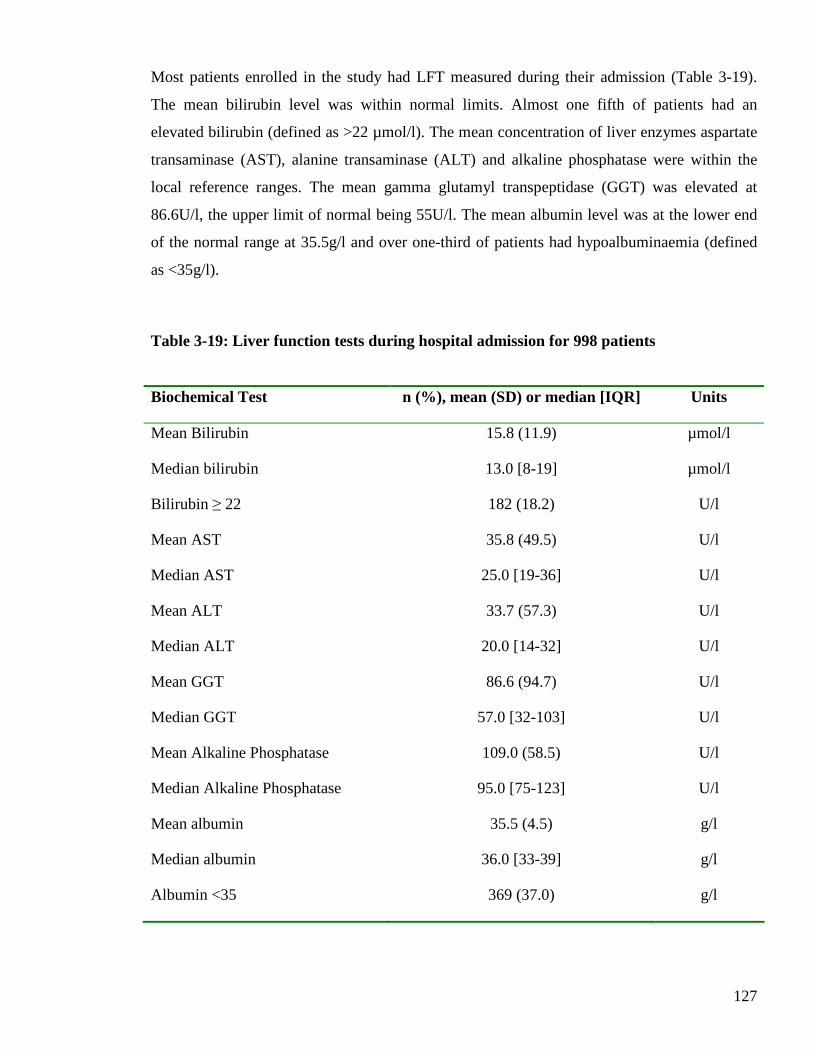
127
Most patients enrolled in the study had LFT measured during their admission (Table 3-19).
The mean bilirubin level was within normal limits. Almost one fifth of patients had an
elevated bilirubin (defined as >22 µmol/l). The mean concentration of liver enzymes aspartate
transaminase (AST), alanine transaminase (ALT) and alkaline phosphatase were within the
local reference ranges. The mean gamma glutamyl transpeptidase (GGT) was elevated at
86.6U/l, the upper limit of normal being 55U/l. The mean albumin level was at the lower end
of the normal range at 35.5g/l and over one-third of patients had hypoalbuminaemia (defined
as <35g/l).
Table 3-19: Liver function tests during hospital admission for 998 patients
Biochemical Test n (%), mean (SD) or median [IQR] Units
Mean Bilirubin 15.8 (11.9) µmol/l
Median bilirubin 13.0 [8-19] µmol/l
Bilirubin ≥ 22 182 (18.2) U/l
Mean AST 35.8 (49.5) U/l
Median AST 25.0 [19-36] U/l
Mean ALT 33.7 (57.3) U/l
Median ALT 20.0 [14-32] U/l
Mean GGT 86.6 (94.7) U/l
Median GGT 57.0 [32-103] U/l
Mean Alkaline Phosphatase 109.0 (58.5) U/l
Median Alkaline Phosphatase 95.0 [75-123] U/l
Mean albumin 35.5 (4.5) g/l
Median albumin 36.0 [33-39] g/l
Albumin <35 369 (37.0) g/l
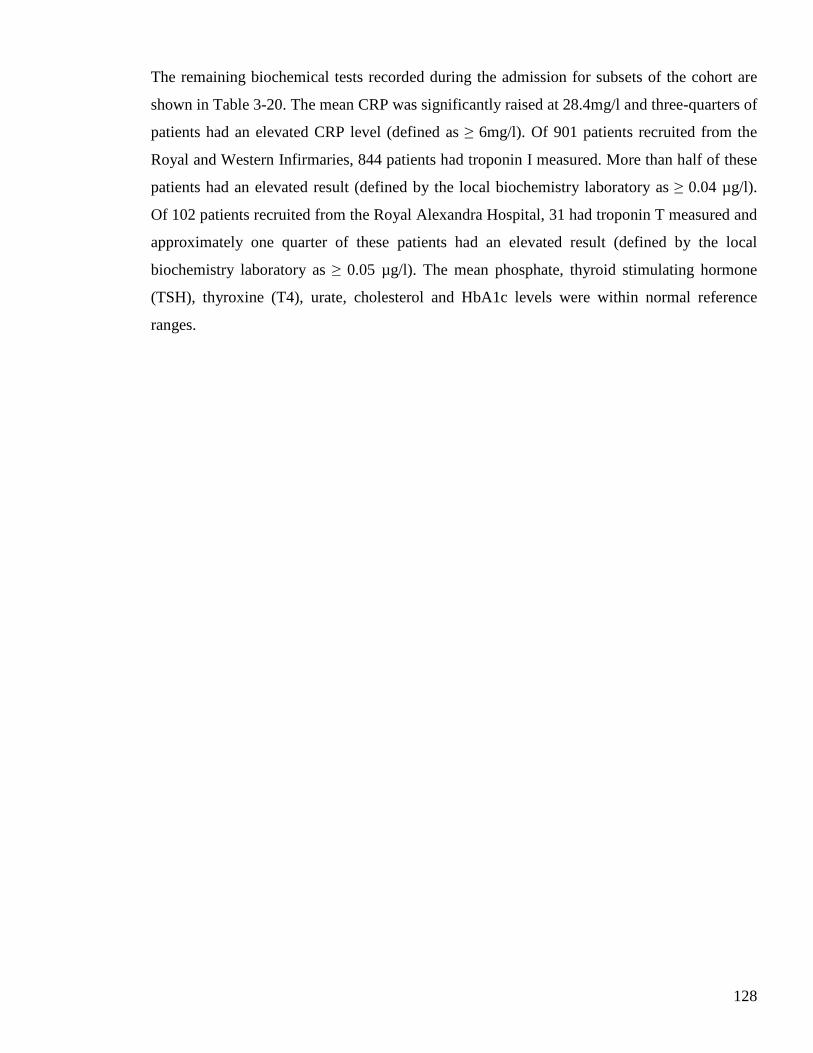
128
The remaining biochemical tests recorded during the admission for subsets of the cohort are
shown in Table 3-20. The mean CRP was significantly raised at 28.4mg/l and three-quarters of
patients had an elevated CRP level (defined as ≥ 6mg/l). Of 901 patients recruited from the
Royal and Western Infirmaries, 844 patients had troponin I measured. More than half of these
patients had an elevated result (defined by the local biochemistry laboratory as ≥ 0.04 µg/l).
Of 102 patients recruited from the Royal Alexandra Hospital, 31 had troponin T measured and
approximately one quarter of these patients had an elevated result (defined by the local
biochemistry laboratory as ≥ 0.05 µg/l). The mean phosphate, thyroid stimulating hormone
(TSH), thyroxine (T4), urate, cholesterol and HbA1c levels were within normal reference
ranges.
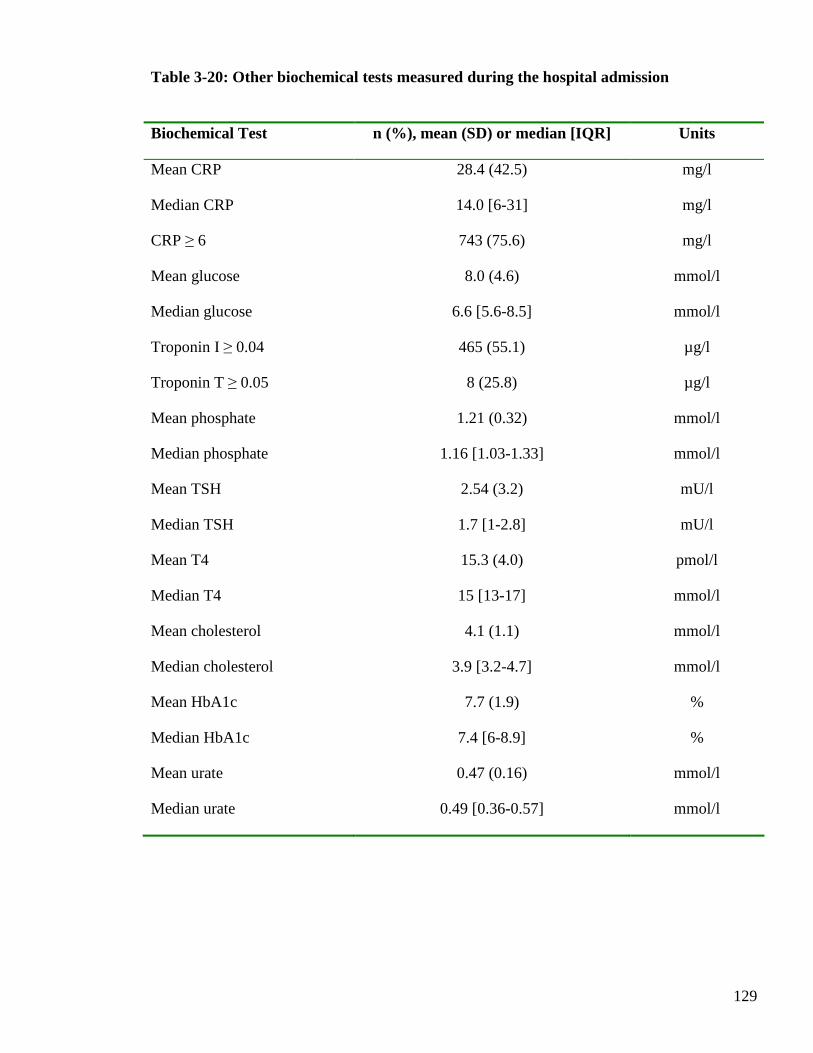
129
Table 3-20: Other biochemical tests measured during the hospital admission
Biochemical Test n (%), mean (SD) or median [IQR] Units
Mean CRP 28.4 (42.5) mg/l
Median CRP 14.0 [6-31] mg/l
CRP ≥ 6 743 (75.6) mg/l
Mean glucose 8.0 (4.6) mmol/l
Median glucose 6.6 [5.6-8.5] mmol/l
Troponin I ≥ 0.04 465 (55.1) µg/l
Troponin T ≥ 0.05 8 (25.8) µg/l
Mean phosphate 1.21 (0.32) mmol/l
Median phosphate 1.16 [1.03-1.33] mmol/l
Mean TSH 2.54 (3.2) mU/l
Median TSH 1.7 [1-2.8] mU/l
Mean T4 15.3 (4.0) pmol/l
Median T4 15 [13-17] mmol/l
Mean cholesterol 4.1 (1.1) mmol/l
Median cholesterol 3.9 [3.2-4.7] mmol/l
Mean HbA1c 7.7 (1.9) %
Median HbA1c 7.4 [6-8.9] %
Mean urate 0.47 (0.16) mmol/l
Median urate 0.49 [0.36-0.57] mmol/l
130
3.2.14 Aetiology of heart failure
The primary aetiologies of heart failure for the entire hospitalised cohort are displayed in
Table 3-21. Coronary heart disease was the primary aetiology for the majority of patients.
Over 40% of the entire cohort had documented evidence of a prior MI. Approximately one-
third of patients had angiographic evidence of coronary heart disease (defined as >50%
stenosis in at least one major epicardial vessel). Over a third of patients had an ‘unknown’
primary aetiology of HF. These were patients with no previous MI or angiogram performed by
the time of aetiology assessment. The non-ischaemic primary causes of HF are also displayed
in Table 3-21. A non-ischaemic primary aetiology was only assigned when ischaemia had
been excluded (no previous MI and coronary angiography demonstrating no significant
stenoses) and no other clear causes of HF were present. The majority of non-ischaemic causes
were valvular heart disease. As outlined in the methods, valvular heart disease was only
considered causative if it was at least moderate in severity. The cardiomyopathies were the
primary cause of HF for a small number of patients (see Table 3-21). Few patients had
hypertension and alcohol as the primary reason for their HF. It is likely that more patients had
hypertension, alcohol or valvular heart disease as the primary cause of HF. However if these
patients had not had coronary angiography, to exclude ischaemia as the cause, then the
primary aetiology was classified ‘unknown’. In these instances all potential causes were
recorded as ‘contributing aetiologies’, as detailed in the following paragraph.
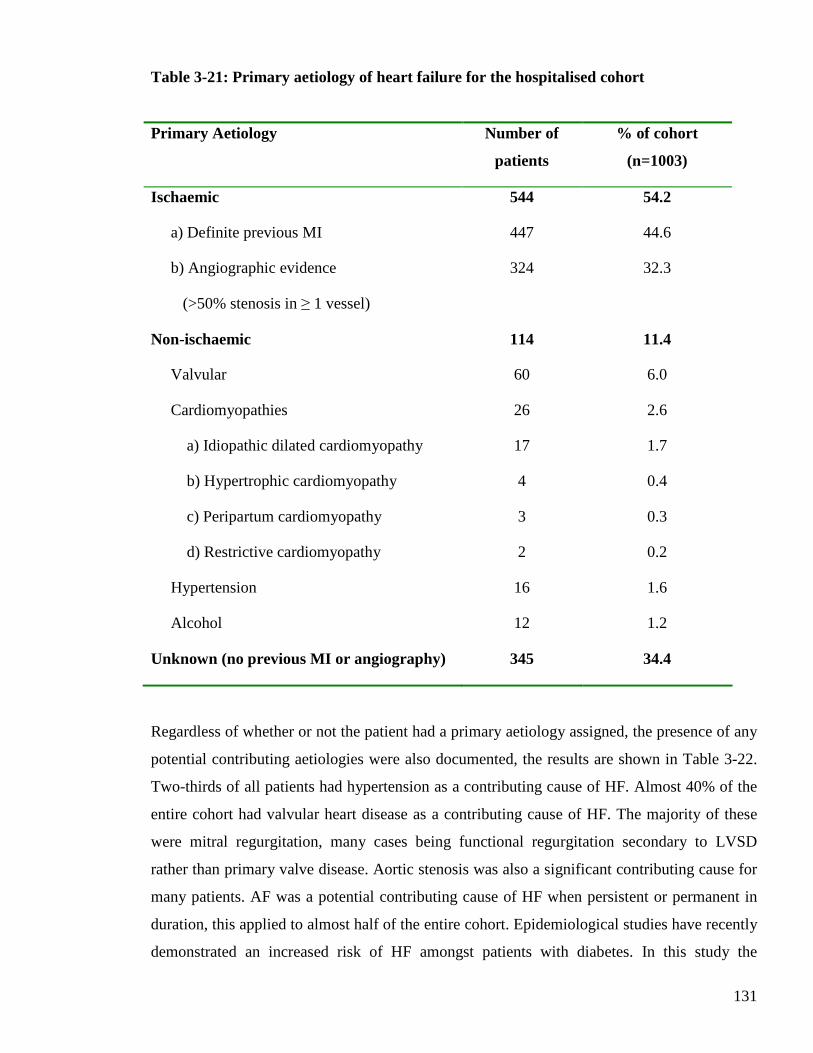
131
Table 3-21: Primary aetiology of heart failure for the hospitalised cohort
Primary Aetiology Number of
patients
% of cohort
(n=1003)
Ischaemic
a) Definite previous MI
b) Angiographic evidence
(>50% stenosis in ≥ 1 vessel)
544
447
324
54.2
44.6
32.3
Non-ischaemic 114 11.4
Valvular 60 6.0
Cardiomyopathies
a) Idiopathic dilated cardiomyopathy
b) Hypertrophic cardiomyopathy
c) Peripartum cardiomyopathy
d) Restrictive cardiomyopathy
26
17
4
3
2
2.6
1.7
0.4
0.3
0.2
Hypertension 16 1.6
Alcohol 12 1.2
Unknown (no previous MI or angiography) 345 34.4
Regardless of whether or not the patient had a primary aetiology assigned, the presence of any
potential contributing aetiologies were also documented, the results are shown in Table 3-22.
Two-thirds of all patients had hypertension as a contributing cause of HF. Almost 40% of the
entire cohort had valvular heart disease as a contributing cause of HF. The majority of these
were mitral regurgitation, many cases being functional regurgitation secondary to LVSD
rather than primary valve disease. Aortic stenosis was also a significant contributing cause for
many patients. AF was a potential contributing cause of HF when persistent or permanent in
duration, this applied to almost half of the entire cohort. Epidemiological studies have recently
demonstrated an increased risk of HF amongst patients with diabetes. In this study the
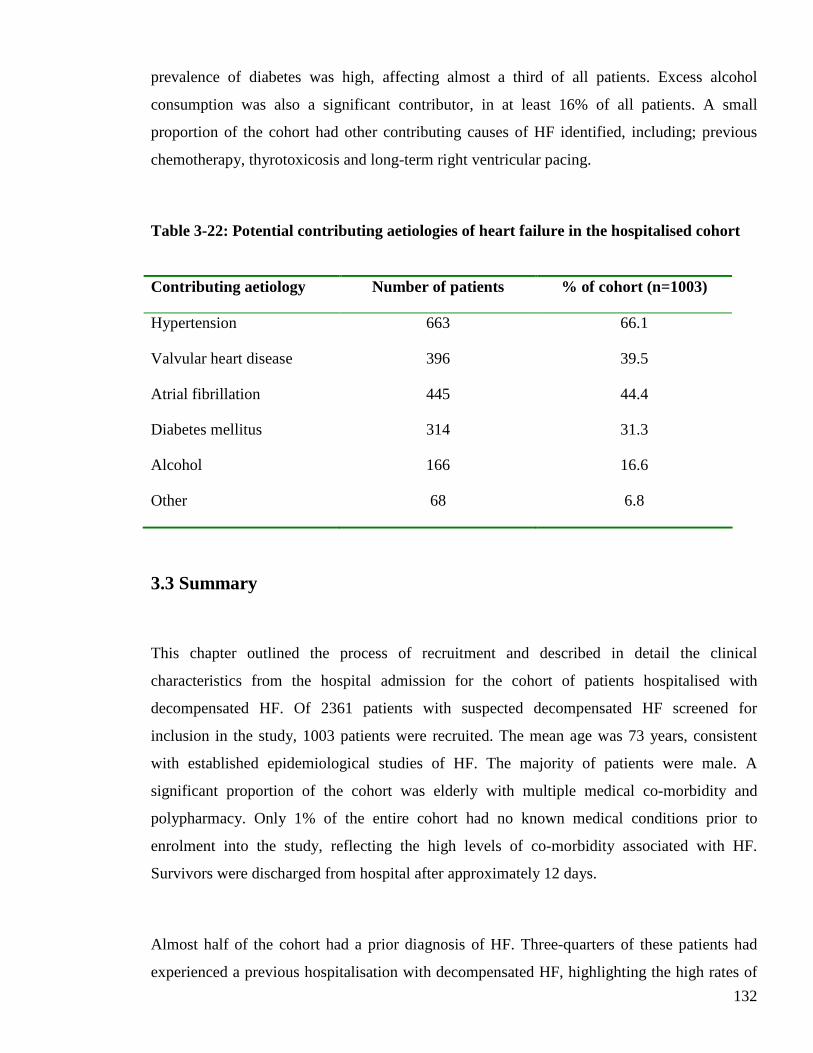
132
prevalence of diabetes was high, affecting almost a third of all patients. Excess alcohol
consumption was also a significant contributor, in at least 16% of all patients. A small
proportion of the cohort had other contributing causes of HF identified, including; previous
chemotherapy, thyrotoxicosis and long-term right ventricular pacing.
Table 3-22: Potential contributing aetiologies of heart failure in the hospitalised cohort
Contributing aetiology Number of patients % of cohort (n=1003)
Hypertension 663 66.1
Valvular heart disease 396 39.5
Atrial fibrillation 445 44.4
Diabetes mellitus 314 31.3
Alcohol 166 16.6
Other 68 6.8
3.3 Summary
This chapter outlined the process of recruitment and described in detail the clinical
characteristics from the hospital admission for the cohort of patients hospitalised with
decompensated HF. Of 2361 patients with suspected decompensated HF screened for
inclusion in the study, 1003 patients were recruited. The mean age was 73 years, consistent
with established epidemiological studies of HF. The majority of patients were male. A
significant proportion of the cohort was elderly with multiple medical co-morbidity and
polypharmacy. Only 1% of the entire cohort had no known medical conditions prior to
enrolment into the study, reflecting the high levels of co-morbidity associated with HF.
Survivors were discharged from hospital after approximately 12 days.
Almost half of the cohort had a prior diagnosis of HF. Three-quarters of these patients had
experienced a previous hospitalisation with decompensated HF, highlighting the high rates of
133
hospitalisation associated with this condition. The primary aetiology of HF was ischaemia for
the majority of patients, but over one-third had an unknown primary aetiology. The majority
of patients were already taking oral diuretics prior to admission. Many were already prescribed
HF disease-modifying therapies. Nearly all of the patients recruited into the study received
diuretic therapy on admission to hospital, approximately three-quarters of the cohort received
this therapy intravenously. Less than 3% of all patients in the study were not treated with
diuretic therapy on admission to hospital, most likely reflecting younger patients presenting
with progressive pump failure rather than fluid overload. Most physiological measurements
were stable on admission, indicative of the inability of more unstable patients to be
approached to consent to participate in the study. The majority of patients had a raised JVP,
lung crepitations, peripheral oedema and were in Killip class II.
There were a significant number of patients in AF on admission to hospital and many had left
bundle branch block on their ECG. The presence of radiological signs of pulmonary oedema
was common on the admission CXR. Most patients had an echocardiogram performed
following enrolment into the study. This revealed LVSD for the majority of cases. Routine
blood sampling on admission to hospital revealed many biochemical and haematological
abnormalities in this cohort. All patients had an elevated BNP, an essential component of the
study inclusion criteria, and the median was significantly elevated. More than half of all
patients were anaemic by WHO criteria, almost two-thirds had an elevated serum urea
concentration and >90% had a reduction in their GFR. More than half of all patients with
troponin I measured on admission to hospital had an elevated result.
In summary the hospitalised cohort was made up of 1003 patients, the majority of whom were
elderly with multiple medical co-morbidity and LVSD.

134
CHAPTER FOUR
CLINICAL CHARACTERISTICS OF
HOSPITALISED COHORT STRATIFIED BY
STUDY VISIT ATTENDANCE
135
4.1 Introduction
This chapter will compare the clinical characteristics of the hospital cohort of patients
according to whether or not they attended the post-discharge study visit. The data described
will be similar to the previous chapter but stratified by subsequent attendance at the study visit
or not. Non-attendance will be subdivided into the reasons for failure to complete the study
visit. The data described will comprise basic demographic details, symptoms prior to
admission, medical history, medications pre-admission and during the first 24 hours of
admission, and examination findings on admission. Electrocardiographic, radiological, blood
test and echocardiographic results will also be stratified by attendance at the study visit. The
main aim of this chapter will be to ascertain whether or not there were any major clinical
differences in the cohort of patients who returned to complete the study visit compared to
those who did not attend. Ultimately, these comparisons will allow an objective assessment of
whether or not the patients returning for the study visit were truly representative of the entire
cohort.
4.2 Comparison of hospital data for study visit attendees and non-attendees
4.2.1 Outcome of hospitalised cohort
Of 1003 patients enrolled in the study, 648 patients (64.6%) completed the study visit. The
reasons why the remaining patients failed to attend are outlined in Figure 4.1. The most
common reason for failure to attend the study visit was refusal to participate, 167 patients
(16.7%) withdrew from the study for this reason following discharge from hospital. 115
patients (11.5%) died prior to the study visit appointment. More than half of these deaths, 68
deaths (59.1%), occurred during the index admission. The remaining 47 deaths (40.9% of
deaths) occurred after discharge from hospital and before the study visit. Finally, 73 patients
(7.3%) were unable to attend the study visit appointment because of deterioration in their
health.
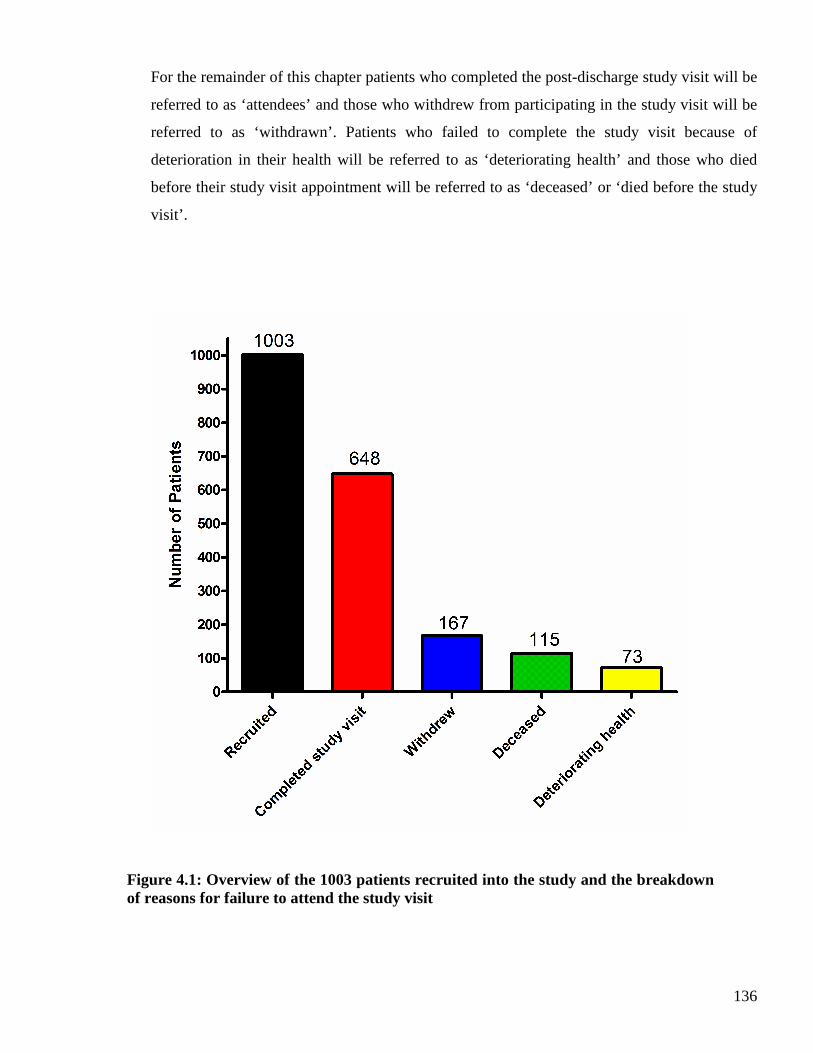
136
For the remainder of this chapter patients who completed the post-discharge study visit will be
referred to as ‘attendees’ and those who withdrew from participating in the study visit will be
referred to as ‘withdrawn’. Patients who failed to complete the study visit because of
deterioration in their health will be referred to as ‘deteriorating health’ and those who died
before their study visit appointment will be referred to as ‘deceased’ or ‘died before the study
visit’.
Figure 4.1: Overview of the 1003 patients recruited into the study and the breakdown of reasons for failure to attend the study visit
137
4.2.2 Demographics
Table 4-1 shows the demographics of the hospitalised cohort, stratified by whether or not they
subsequently attended the study visit. Attendees had proportionately more male patients than
the other three groups, whilst patients who died before the study visit had more female patients
than the other three groups (p=0.00015).
Patients attending the study visit were younger than the other three groups (p<0.0001), with
fewest patients over 75 years of age (p<0.0001). Patients with deteriorating health had the
highest mean age, with almost three-quarters of this group over 75 years of age.
The average length of hospitalisation was significantly longer for patients with deteriorating
health and those who died before their study visit appointment (p<0.0001).
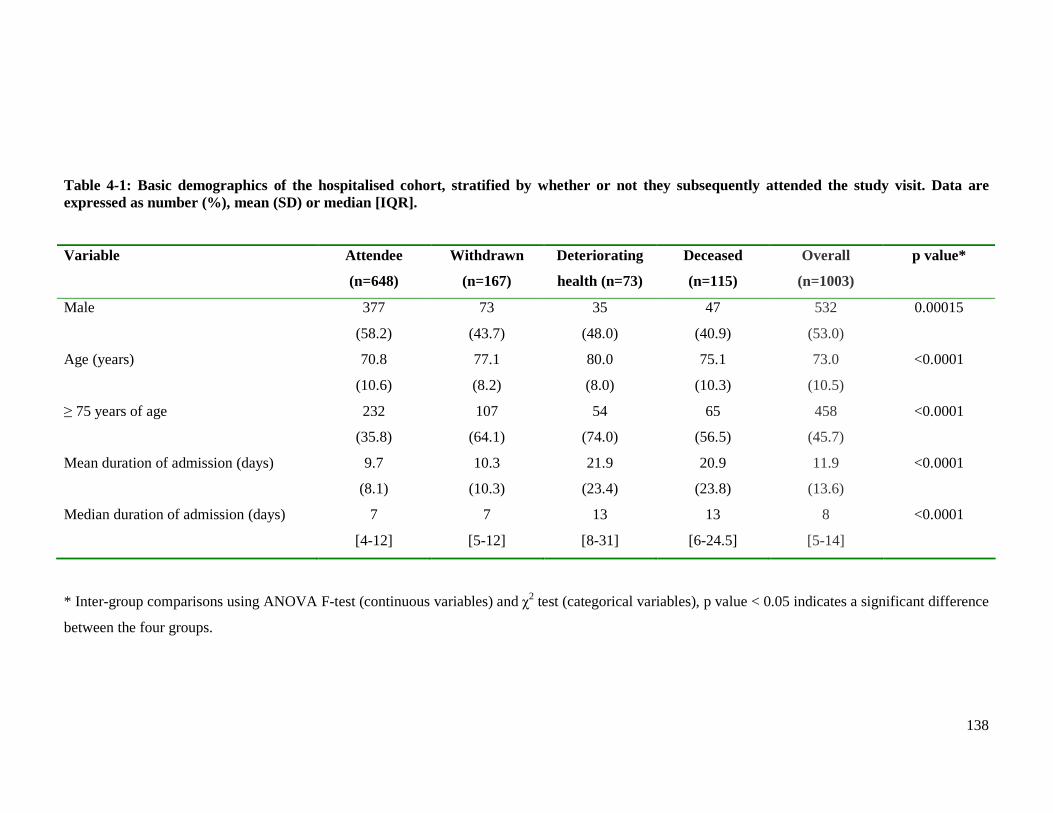
138
Table 4-1: Basic demographics of the hospitalised cohort, stratified by whether or not they subsequently attended the study visit. Data are expressed as number (%), mean (SD) or median [IQR].
Variable Attendee
(n=648)
Withdrawn
(n=167)
Deteriorating
health (n=73)
Deceased
(n=115)
Overall
(n=1003)
p value*
Male
377
(58.2)
73
(43.7)
35
(48.0)
47
(40.9)
532
(53.0)
0.00015
Age (years) 70.8
(10.6)
77.1
(8.2)
80.0
(8.0)
75.1
(10.3)
73.0
(10.5)
<0.0001
≥ 75 years of age 232
(35.8)
107
(64.1)
54
(74.0)
65
(56.5)
458
(45.7)
<0.0001
Mean duration of admission (days) 9.7
(8.1)
10.3
(10.3)
21.9
(23.4)
20.9
(23.8)
11.9
(13.6)
<0.0001
Median duration of admission (days) 7
[4-12]
7
[5-12]
13
[8-31]
13
[6-24.5]
8
[5-14]
<0.0001
* Inter-group comparisons using ANOVA F-test (continuous variables) and χ2 test (categorical variables), p value < 0.05 indicates a significant difference
between the four groups.
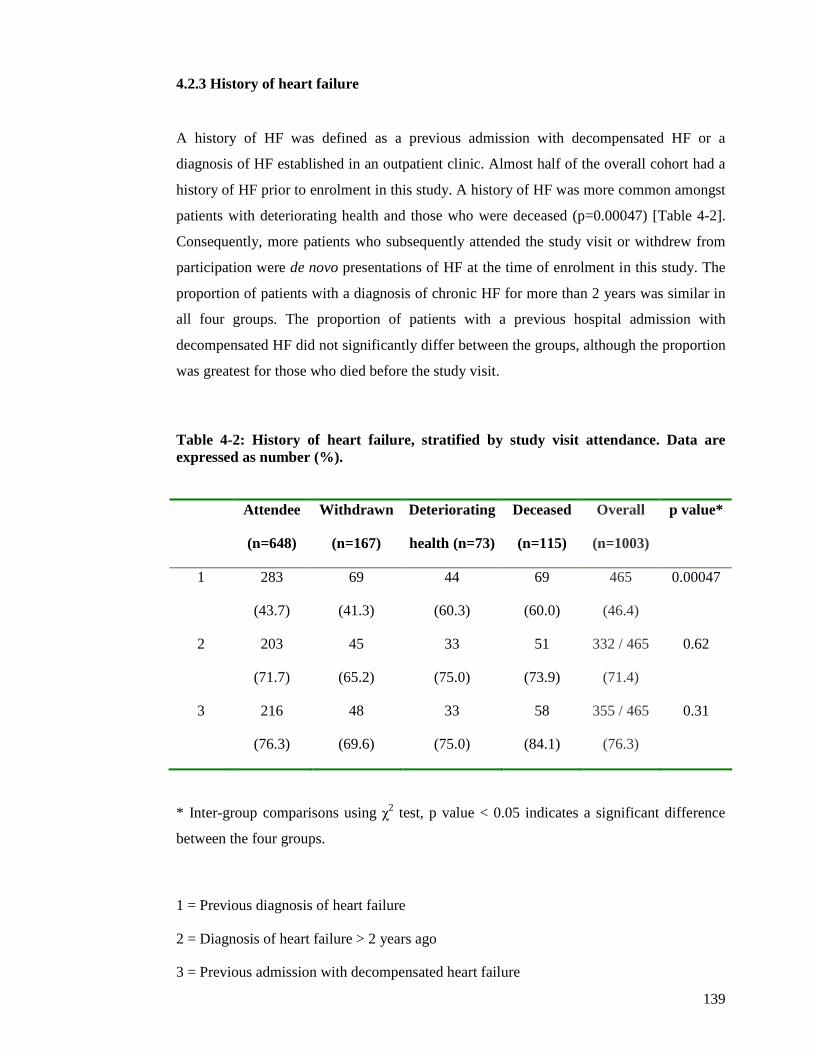
139
4.2.3 History of heart failure
A history of HF was defined as a previous admission with decompensated HF or a
diagnosis of HF established in an outpatient clinic. Almost half of the overall cohort had a
history of HF prior to enrolment in this study. A history of HF was more common amongst
patients with deteriorating health and those who were deceased (p=0.00047) [Table 4-2].
Consequently, more patients who subsequently attended the study visit or withdrew from
participation were de novo presentations of HF at the time of enrolment in this study. The
proportion of patients with a diagnosis of chronic HF for more than 2 years was similar in
all four groups. The proportion of patients with a previous hospital admission with
decompensated HF did not significantly differ between the groups, although the proportion
was greatest for those who died before the study visit.
Attendee
(n=648)
Withdrawn
(n=167)
Deteriorating
health (n=73)
Deceased
(n=115)
Overall
(n=1003)
p value*
1 283
(43.7)
69
(41.3)
44
(60.3)
69
(60.0)
465
(46.4)
0.00047
2 203
(71.7)
45
(65.2)
33
(75.0)
51
(73.9)
332 / 465
(71.4)
0.62
3 216
(76.3)
48
(69.6)
33
(75.0)
58
(84.1)
355 / 465
(76.3)
0.31
* Inter-group comparisons using χ2 test, p value < 0.05 indicates a significant difference
between the four groups.
1 = Previous diagnosis of heart failure
2 = Diagnosis of heart failure > 2 years ago
3 = Previous admission with decompensated heart failure
Table 4-2: History of heart failure, stratified by study visit attendance. Data are expressed as number (%).
140
4.2.4 Heart failure symptoms prior to admission
The presence of HF symptoms prior to hospitalisation varied between the four groups, as
displayed in Table 4-3.
Severity of HF symptoms, as defined by the NYHA classes, differed between the groups
(p=0.00067). Those who attended the study visit or withdrew from participation had more
patients with milder HF symptoms (NYHA class II) than the other two groups. The
prevalence of moderate HF symptoms (NYHA class III) was similar amongst all four
groups. Those who died prior to the study visit had the greatest proportion of patients with
severe HF symptoms (NYHA class IV).
Patients who died before the study visit were more likely to experience paroxysmal
nocturnal dyspnoea (PND) (p=0.022).
Ankle swelling affected the majority of all patients, although was more common amongst
patients with deteriorating health and those who died before the study visit (p<0.0001).
There was no significant difference between the four groups in the prevalence of the
following symptoms; orthopnoea, palpitations, wheeze and angina.
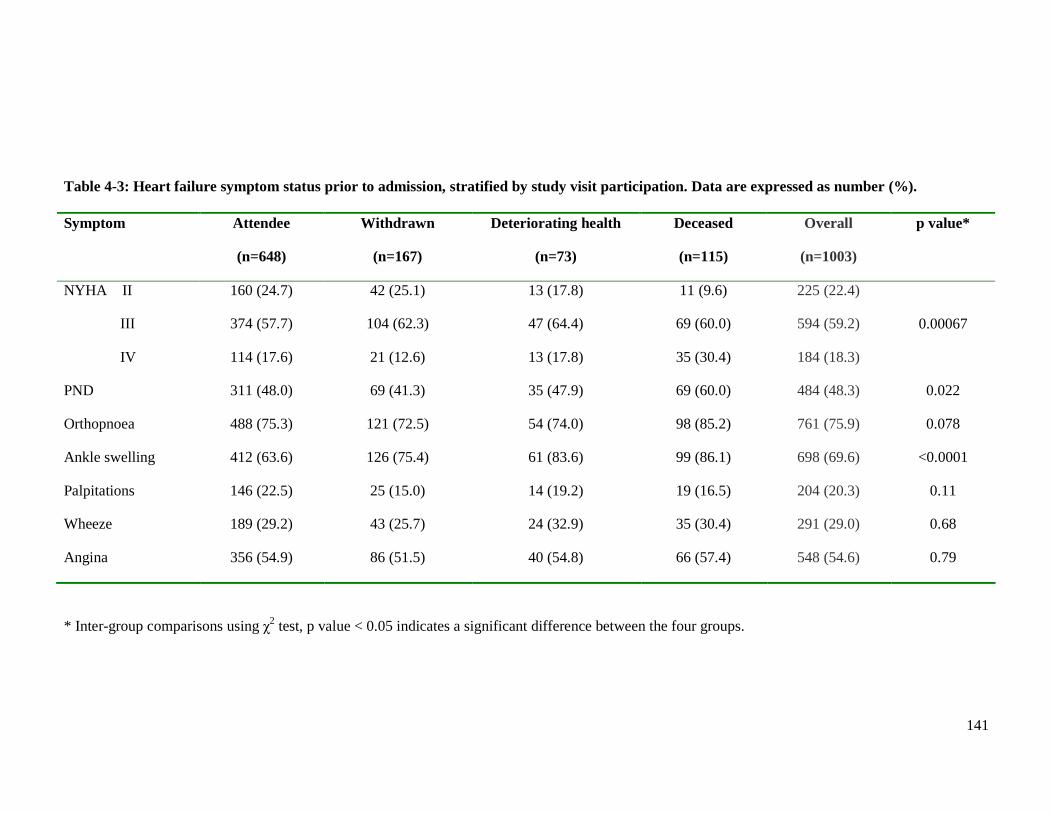
141
Symptom Attendee
(n=648)
Withdrawn
(n=167)
Deteriorating health
(n=73)
Deceased
(n=115)
Overall
(n=1003)
p value*
NYHA II
III
IV
160 (24.7)
374 (57.7)
114 (17.6)
42 (25.1)
104 (62.3)
21 (12.6)
13 (17.8)
47 (64.4)
13 (17.8)
11 (9.6)
69 (60.0)
35 (30.4)
225 (22.4)
594 (59.2)
184 (18.3)
0.00067
PND 311 (48.0) 69 (41.3) 35 (47.9) 69 (60.0) 484 (48.3) 0.022
Orthopnoea 488 (75.3) 121 (72.5) 54 (74.0) 98 (85.2) 761 (75.9) 0.078
Ankle swelling 412 (63.6) 126 (75.4) 61 (83.6) 99 (86.1) 698 (69.6) <0.0001
Palpitations 146 (22.5) 25 (15.0) 14 (19.2) 19 (16.5) 204 (20.3) 0.11
Wheeze 189 (29.2) 43 (25.7) 24 (32.9) 35 (30.4) 291 (29.0) 0.68
Angina 356 (54.9) 86 (51.5) 40 (54.8) 66 (57.4) 548 (54.6) 0.79
* Inter-group comparisons using χ2 test, p value < 0.05 indicates a significant difference between the four groups.
Table 4-3: Heart failure symptom status prior to admission, stratified by study visit participation. Data are expressed as number (%).
142
4.2.5 Medical history
The prevalences of common medical comorbidities varied between the groups (Table 4-4).
A history of a previously reported MI was similar in all four groups, affecting a large
proportion of all patients. On the other hand, the prevalence of major angiographic
coronary heart disease differed between the groups (p=0.012). This was defined as
previous angiographic evidence of at least 50% stenosis in at least 1 major epicardial
vessel. Angiographic coronary heart disease was more prevalent amongst patients who
withdrew and those with deteriorating health. A higher proportion of attendees had
undergone PCI compared to the non-attendees, a difference of borderline statistical
significance (p=0.057).
AF was proportionately more common amongst patients who withdrew from the study visit
or had deteriorating health (p=0.045). Surprisingly, the lowest prevalence of AF was
amongst the patients who died before the study visit.
Patients with deteriorating health or death before the study visit were more likely to have
experienced major weight loss in the 6 months prior to enrolment in the study (p=0.019).
A history of cancer was more common in those with deteriorating health than the other
three groups (p=0.0034). Surprisingly, there were similar proportions of this comorbidity
amongst attendees and patients who died before the study visit.
Peripheral arterial disease was most common amongst patients who died before the study
visit and least common amongst attendees (p=0.041). One possible explanation for the
higher prevalence of this condition amongst patients who withdrew or cited deteriorating
health as the reason for non-attendance may be the MTWA treadmill test. Patients
experiencing pain from walking due to peripheral arterial disease may have been more
inclined to withdraw from participation in the study visit.
Hypothyroidism was most common amongst patients with deteriorating health and least
common amongst attendees, although this was of borderline statistical significance
143
(p=0.051). Those who subsequently died or withdrew from the study visit had similar
proportions of patients affected by this condition.
Osteoarthritis was more common in patients with deteriorating health, affecting over 40%
of this group (p=0.0062). Although fewer patients in the other three groups suffered from
osteoarthritis, it was still common and affected around a quarter of these patients. Physical
disabilities may have been a reason why many patients withdrew from participation
because of difficulties travelling to the study visit or anxiety regarding the treadmill test.
Patients who did not complete the study visit due to deteriorating health or death were
more likely to be anaemic (p<0.0001). However this comorbidity was common in the
overall cohort and many patients in all four groups met the WHO criteria for the diagnosis
of anaemia.
Urinary incontinence was more prevalent amongst patients who failed to complete the
study visit, irrespective of cause (p=0.0016). Those unable to attend due to declining health
were most likely to suffer from this comorbidity.
There was no difference between the groups in the prevalence of the following medical
conditions; hypertension, cerebrovascular disease (as defined by prior TIA or CVA), prior
arrhythmia, diabetes mellitus, depression, COPD, asthma, hyperthyroidism and rheumatoid
arthritis.
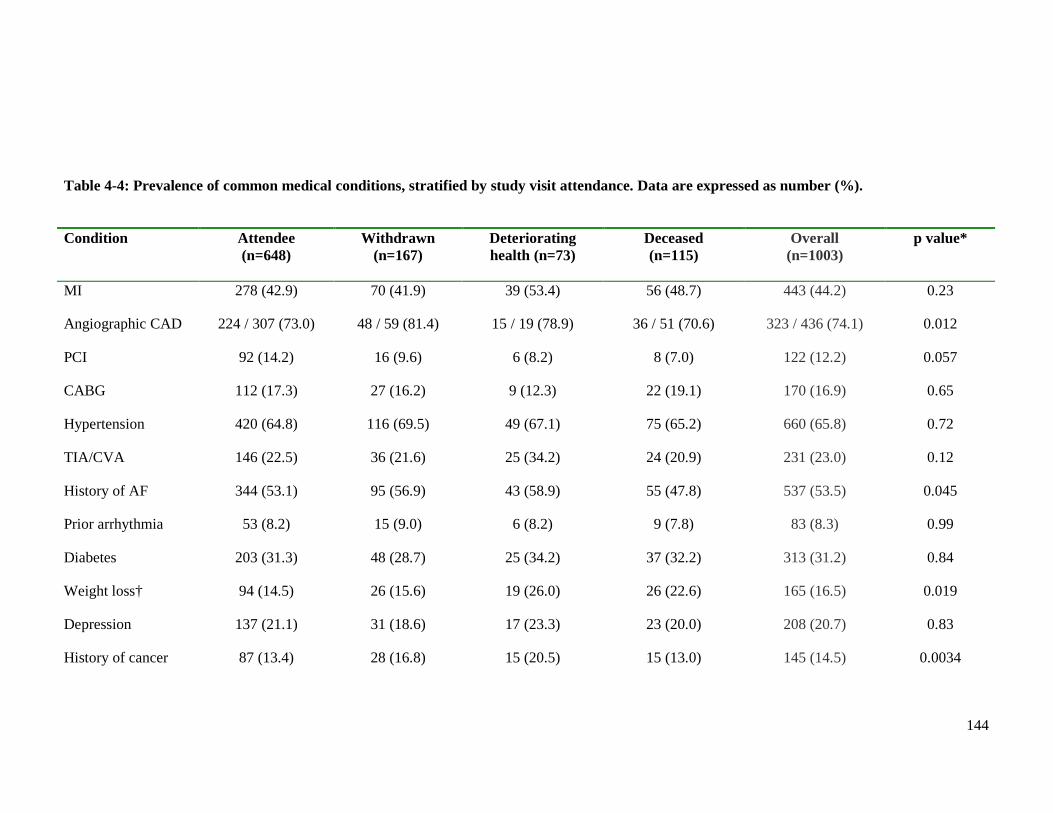
144
Condition Attendee (n=648)
Withdrawn (n=167)
Deteriorating health (n=73)
Deceased (n=115)
Overall (n=1003)
p value*
MI 278 (42.9) 70 (41.9) 39 (53.4) 56 (48.7) 443 (44.2) 0.23
Angiographic CAD 224 / 307 (73.0) 48 / 59 (81.4) 15 / 19 (78.9) 36 / 51 (70.6) 323 / 436 (74.1) 0.012
PCI 92 (14.2) 16 (9.6) 6 (8.2) 8 (7.0) 122 (12.2) 0.057
CABG 112 (17.3) 27 (16.2) 9 (12.3) 22 (19.1) 170 (16.9) 0.65
Hypertension 420 (64.8) 116 (69.5) 49 (67.1) 75 (65.2) 660 (65.8) 0.72
TIA/CVA 146 (22.5) 36 (21.6) 25 (34.2) 24 (20.9) 231 (23.0) 0.12
History of AF 344 (53.1) 95 (56.9) 43 (58.9) 55 (47.8) 537 (53.5) 0.045
Prior arrhythmia 53 (8.2) 15 (9.0) 6 (8.2) 9 (7.8) 83 (8.3) 0.99
Diabetes 203 (31.3) 48 (28.7) 25 (34.2) 37 (32.2) 313 (31.2) 0.84
Weight loss† 94 (14.5) 26 (15.6) 19 (26.0) 26 (22.6) 165 (16.5) 0.019
Depression 137 (21.1) 31 (18.6) 17 (23.3) 23 (20.0) 208 (20.7) 0.83
History of cancer 87 (13.4) 28 (16.8) 15 (20.5) 15 (13.0) 145 (14.5) 0.0034
Table 4-4: Prevalence of common medical conditions, stratified by study visit attendance. Data are expressed as number (%).
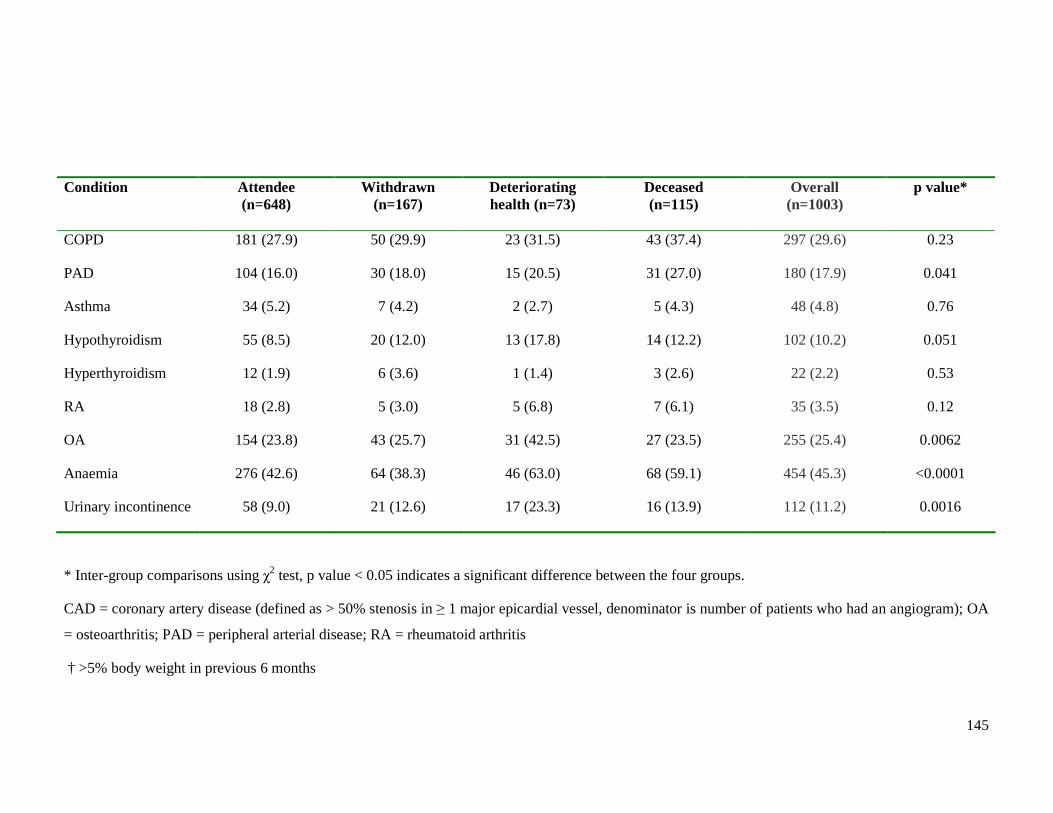
145
Condition Attendee (n=648)
Withdrawn (n=167)
Deteriorating health (n=73)
Deceased (n=115)
Overall (n=1003)
p value*
COPD 181 (27.9) 50 (29.9) 23 (31.5) 43 (37.4) 297 (29.6) 0.23
PAD 104 (16.0) 30 (18.0) 15 (20.5) 31 (27.0) 180 (17.9) 0.041
Asthma 34 (5.2) 7 (4.2) 2 (2.7) 5 (4.3) 48 (4.8) 0.76
Hypothyroidism 55 (8.5) 20 (12.0) 13 (17.8) 14 (12.2) 102 (10.2) 0.051
Hyperthyroidism 12 (1.9) 6 (3.6) 1 (1.4) 3 (2.6) 22 (2.2) 0.53
RA 18 (2.8) 5 (3.0) 5 (6.8) 7 (6.1) 35 (3.5) 0.12
OA 154 (23.8) 43 (25.7) 31 (42.5) 27 (23.5) 255 (25.4) 0.0062
Anaemia 276 (42.6) 64 (38.3) 46 (63.0) 68 (59.1) 454 (45.3) <0.0001
Urinary incontinence 58 (9.0) 21 (12.6) 17 (23.3) 16 (13.9) 112 (11.2) 0.0016
* Inter-group comparisons using χ2 test, p value < 0.05 indicates a significant difference between the four groups.
CAD = coronary artery disease (defined as > 50% stenosis in ≥ 1 major epicardial vessel, denominator is number of patients who had an angiogram); OA
= osteoarthritis; PAD = peripheral arterial disease; RA = rheumatoid arthritis
† >5% body weight in previous 6 months
146
4.2.6 Cardiovascular medications pre-admission
The pre-admission use of certain cardiovascular medications varied between the four
groups (Table 4-5). The majority of these differences were in HF medications. The
majority of patients in all groups were prescribed a diuretic. However, patients with
deteriorating health and those who died before the study visit were most likely to be taking
diuretics prior to the index admission (p=0.027).
Patients attending the study visit were more likely to be prescribed beta-blockers before
hospitalisation (p=0.0018). Patients who died before the study visit and those with
deteriorating health had fewest patients on this drug. The use of ACE inhibitors was
similar in all 4 groups.
In comparison to ACE inhibitors and beta-blockers, the overall number of patients
prescribed ARBs pre-admission was small. Only 14% of the entire cohort was prescribed
ARBs before the index admission. Patients who withdrew from the study visit were most
likely to be prescribed ARBs whilst those with deteriorating health or death had fewest
patients prescribed this drug (p=0.025). The overall prescribing of aldosterone antagonists
prior to admission was also small. However, the use of this medication was most common
amongst those who died before the study visit (p=0.029).
Although there was no statistically significant difference between the groups in the
proportion of patients prescribed aspirin, there was a trend towards more prescribing
amongst the group who died before the study visit (p=0.057). Two-thirds of deceased
patients were prescribed aspirin compared to approximately half of patients in the other
three groups. Statin prescribing was more common amongst attendees and least common
amongst patients who did not attend the study visit due to deteriorating health (p=0.043).
The use of the following medications was similar in all four groups; digoxin, clopidogrel,
warfarin, nicorandil, calcium channel blockers, anti-arrhythmic therapies, long-acting
nitrates and non-statin lipid lowering agents.
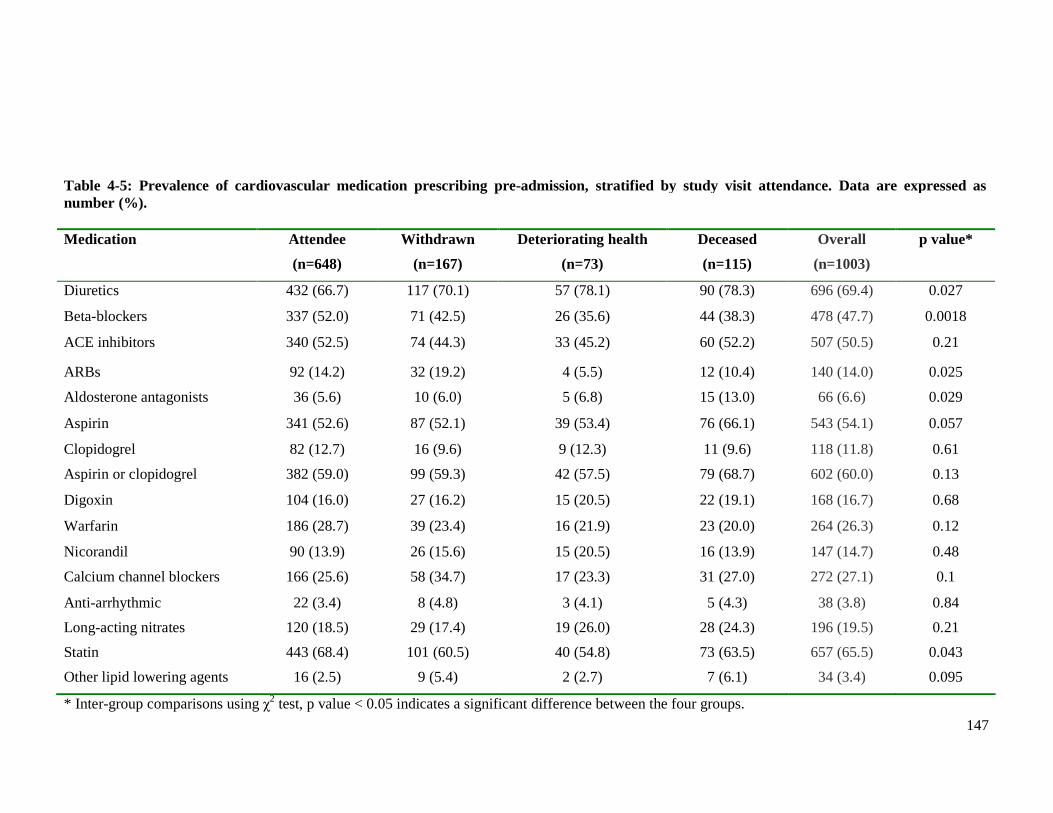
147
Medication Attendee
(n=648)
Withdrawn
(n=167)
Deteriorating health
(n=73)
Deceased
(n=115)
Overall
(n=1003)
p value*
Diuretics 432 (66.7) 117 (70.1) 57 (78.1) 90 (78.3) 696 (69.4) 0.027
Beta-blockers 337 (52.0) 71 (42.5) 26 (35.6) 44 (38.3) 478 (47.7) 0.0018
ACE inhibitors 340 (52.5) 74 (44.3) 33 (45.2) 60 (52.2) 507 (50.5) 0.21
ARBs 92 (14.2) 32 (19.2) 4 (5.5) 12 (10.4) 140 (14.0) 0.025
Aldosterone antagonists 36 (5.6) 10 (6.0) 5 (6.8) 15 (13.0) 66 (6.6) 0.029
Aspirin 341 (52.6) 87 (52.1) 39 (53.4) 76 (66.1) 543 (54.1) 0.057
Clopidogrel 82 (12.7) 16 (9.6) 9 (12.3) 11 (9.6) 118 (11.8) 0.61
Aspirin or clopidogrel 382 (59.0) 99 (59.3) 42 (57.5) 79 (68.7) 602 (60.0) 0.13
Digoxin 104 (16.0) 27 (16.2) 15 (20.5) 22 (19.1) 168 (16.7) 0.68
Warfarin 186 (28.7) 39 (23.4) 16 (21.9) 23 (20.0) 264 (26.3) 0.12
Nicorandil 90 (13.9) 26 (15.6) 15 (20.5) 16 (13.9) 147 (14.7) 0.48
Calcium channel blockers 166 (25.6) 58 (34.7) 17 (23.3) 31 (27.0) 272 (27.1) 0.1
Anti-arrhythmic 22 (3.4) 8 (4.8) 3 (4.1) 5 (4.3) 38 (3.8) 0.84
Long-acting nitrates 120 (18.5) 29 (17.4) 19 (26.0) 28 (24.3) 196 (19.5) 0.21
Statin 443 (68.4) 101 (60.5) 40 (54.8) 73 (63.5) 657 (65.5) 0.043
Other lipid lowering agents 16 (2.5) 9 (5.4) 2 (2.7) 7 (6.1) 34 (3.4) 0.095
* Inter-group comparisons using χ2 test, p value < 0.05 indicates a significant difference between the four groups.
Table 4-5: Prevalence of cardiovascular medication prescribing pre-admission, stratified by study visit attendance. Data are expressed as number (%).
148
4.2.7 Heart failure medical therapy during first 24 hours of admission
The pharmacological treatment of HF during the first 24 hours of admission is shown in
Table 4-6. More than 95% of the overall cohort was prescribed furosemide on admission.
The use of furosemide and loop diuretics was similar in all four groups.
The use of intravenous nitrate therapy during the first 24 hours of admission differed
between the groups of patients. Those who died before the study visit were most likely to
be treated with intravenous nitrate therapy, more than double the prescribing rate of the
other three groups (p=0.0055).
Few patients were prescribed inotrope therapy (dobutamine or dopamine). However the
use of this therapy was more common amongst those who died before the study visit
(p<0.0001).
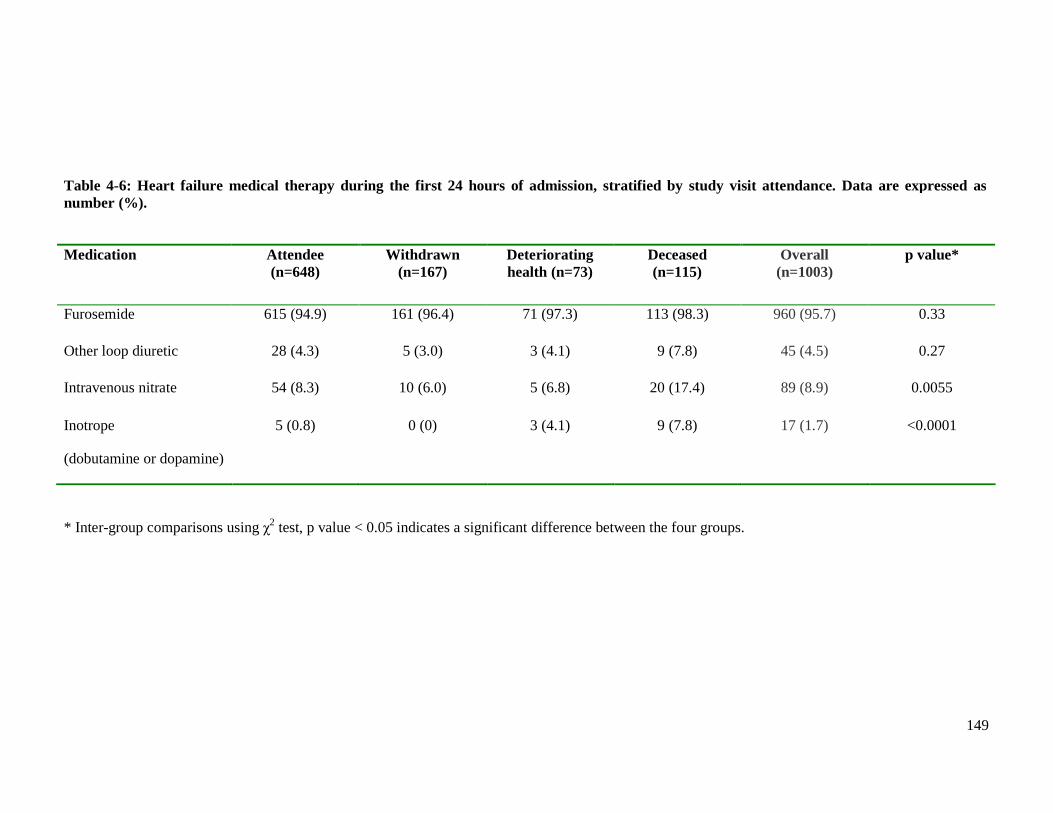
149
* Inter-group comparisons using χ2 test, p value < 0.05 indicates a significant difference between the four groups.
Table 4-6: Heart failure medical therapy during the first 24 hours of admission, stratified by study visit attendance. Data are expressed as number (%).
Medication Attendee (n=648)
Withdrawn (n=167)
Deteriorating health (n=73)
Deceased (n=115)
Overall (n=1003)
p value*
Furosemide 615 (94.9) 161 (96.4) 71 (97.3) 113 (98.3) 960 (95.7) 0.33
Other loop diuretic 28 (4.3) 5 (3.0) 3 (4.1) 9 (7.8) 45 (4.5) 0.27
Intravenous nitrate 54 (8.3) 10 (6.0) 5 (6.8) 20 (17.4) 89 (8.9) 0.0055
Inotrope
(dobutamine or dopamine)
5 (0.8) 0 (0) 3 (4.1) 9 (7.8) 17 (1.7) <0.0001
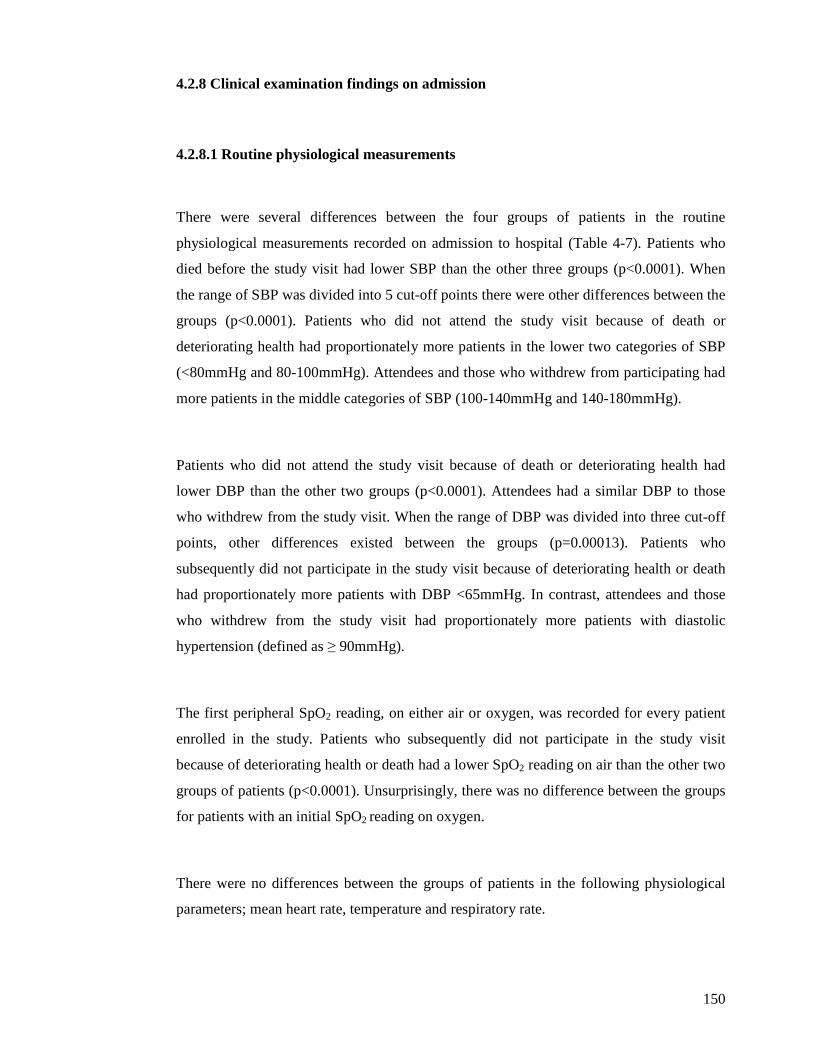
150
4.2.8 Clinical examination findings on admission
4.2.8.1 Routine physiological measurements
There were several differences between the four groups of patients in the routine
physiological measurements recorded on admission to hospital (Table 4-7). Patients who
died before the study visit had lower SBP than the other three groups (p<0.0001). When
the range of SBP was divided into 5 cut-off points there were other differences between the
groups (p<0.0001). Patients who did not attend the study visit because of death or
deteriorating health had proportionately more patients in the lower two categories of SBP
(<80mmHg and 80-100mmHg). Attendees and those who withdrew from participating had
more patients in the middle categories of SBP (100-140mmHg and 140-180mmHg).
Patients who did not attend the study visit because of death or deteriorating health had
lower DBP than the other two groups (p<0.0001). Attendees had a similar DBP to those
who withdrew from the study visit. When the range of DBP was divided into three cut-off
points, other differences existed between the groups (p=0.00013). Patients who
subsequently did not participate in the study visit because of deteriorating health or death
had proportionately more patients with DBP <65mmHg. In contrast, attendees and those
who withdrew from the study visit had proportionately more patients with diastolic
hypertension (defined as ≥ 90mmHg).
The first peripheral SpO2 reading, on either air or oxygen, was recorded for every patient
enrolled in the study. Patients who subsequently did not participate in the study visit
because of deteriorating health or death had a lower SpO2 reading on air than the other two
groups of patients (p<0.0001). Unsurprisingly, there was no difference between the groups
for patients with an initial SpO2 reading on oxygen.
There were no differences between the groups of patients in the following physiological
parameters; mean heart rate, temperature and respiratory rate.
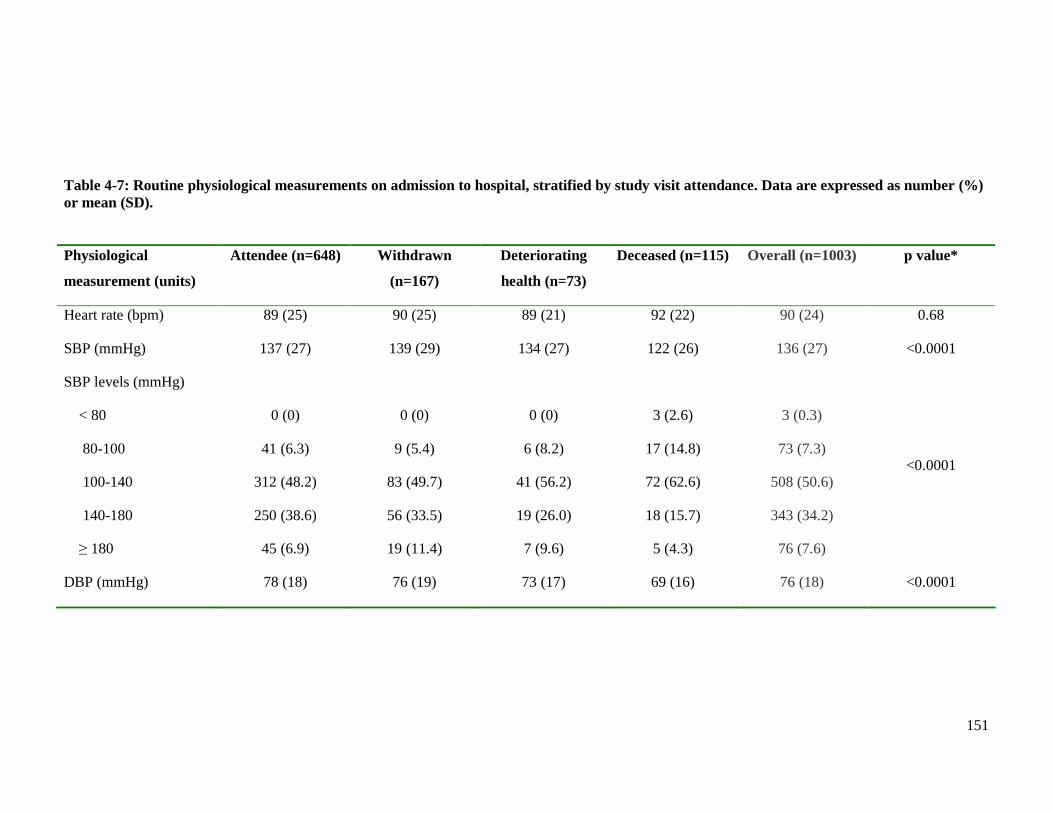
151
Table 4-7: Routine physiological measurements on admission to hospital, stratified by study visit attendance. Data are expressed as number (%) or mean (SD).
Physiological
measurement (units)
Attendee (n=648) Withdrawn
(n=167)
Deteriorating
health (n=73)
Deceased (n=115) Overall (n=1003) p value*
Heart rate (bpm) 89 (25) 90 (25) 89 (21) 92 (22) 90 (24) 0.68
SBP (mmHg) 137 (27) 139 (29) 134 (27) 122 (26) 136 (27) <0.0001
SBP levels (mmHg)
< 80
80-100
100-140
140-180
≥ 180
0 (0)
41 (6.3)
312 (48.2)
250 (38.6)
45 (6.9)
0 (0)
9 (5.4)
83 (49.7)
56 (33.5)
19 (11.4)
0 (0)
6 (8.2)
41 (56.2)
19 (26.0)
7 (9.6)
3 (2.6)
17 (14.8)
72 (62.6)
18 (15.7)
5 (4.3)
3 (0.3)
73 (7.3)
508 (50.6)
343 (34.2)
76 (7.6)
<0.0001
DBP (mmHg) 78 (18) 76 (19) 73 (17) 69 (16) 76 (18) <0.0001
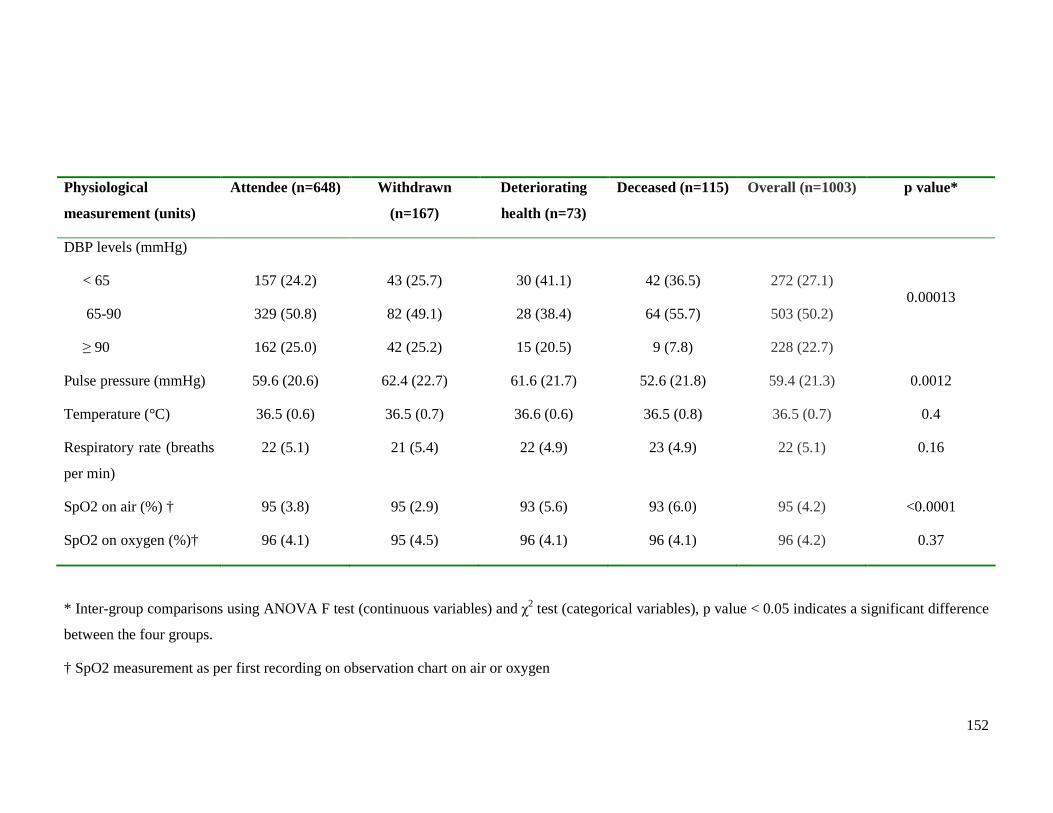
152
Physiological
measurement (units)
Attendee (n=648) Withdrawn
(n=167)
Deteriorating
health (n=73)
Deceased (n=115) Overall (n=1003) p value*
DBP levels (mmHg)
< 65
65-90
≥ 90
157 (24.2)
329 (50.8)
162 (25.0)
43 (25.7)
82 (49.1)
42 (25.2)
30 (41.1)
28 (38.4)
15 (20.5)
42 (36.5)
64 (55.7)
9 (7.8)
272 (27.1)
503 (50.2)
228 (22.7)
0.00013
Pulse pressure (mmHg) 59.6 (20.6) 62.4 (22.7) 61.6 (21.7) 52.6 (21.8) 59.4 (21.3) 0.0012
Temperature (°C) 36.5 (0.6) 36.5 (0.7) 36.6 (0.6) 36.5 (0.8) 36.5 (0.7) 0.4
Respiratory rate (breaths
per min)
22 (5.1) 21 (5.4) 22 (4.9) 23 (4.9) 22 (5.1) 0.16
SpO2 on air (%) † 95 (3.8) 95 (2.9) 93 (5.6) 93 (6.0) 95 (4.2) <0.0001
SpO2 on oxygen (%)† 96 (4.1) 95 (4.5) 96 (4.1) 96 (4.1) 96 (4.2) 0.37
* Inter-group comparisons using ANOVA F test (continuous variables) and χ2 test (categorical variables), p value < 0.05 indicates a significant difference
between the four groups.
† SpO2 measurement as per first recording on observation chart on air or oxygen
153
4.2.8.2 Body mass index and waist circumference measurements
BMI and waist circumference measurements recorded on admission to hospital differed
between the four groups (Tables 4-8 to 4-10). For the male patients, attendees and those
who withdrew from the study visit were taller than the patients in the other two groups
(p=0.0036). Attendees and patients who withdrew from the study visit were also heavier
than the other two groups (p=0.0017). A similar trend was seen amongst the female
patients, although the difference was not statistically significant for weight.
Consequently the BMI differed between the four groups, with male attendees having a
larger BMI than men in the other three groups (p=0.0029). There was no significant
difference between the four groups in the mean BMI for the female patients. Interestingly
the mean BMI for all four groups, regardless of sex, was in the pre-obese range. BMI
levels were analysed in the categories that are used clinically; underweight (<18.5), ideal
weight (18.5-25), pre-obese / overweight (>25-30) and obese (≥ 30). The proportions of
patients in each of the BMI categories differed. Those who died before the study visit had
more underweight patients than the other three groups, particularly amongst the female
patients. Attendees had most obese patients whilst those who died before the study visit
had the fewest.
Attendees had the largest waist circumference of all four groups, over 7cm greater than the
mean circumference of patients who died before the study visit (p<0.0001). Waist
circumference was analysed in the sex-specific categories that are used clinically; low
waist circumference (<94cm for men and <80cm for women), normal waist circumference
(94-102cm for men and 80-88cm for women) and high waist circumference (>102cm for
men and >88cm for women). The proportions in each of the categories differed between
the four groups (p=0.0056). Attendees had most patients with high waist circumference
and fewest patients with low waist circumference. Patients who withdrew from the study
visit or died before the study visit had the greatest proportion of patients with low waist
circumference.
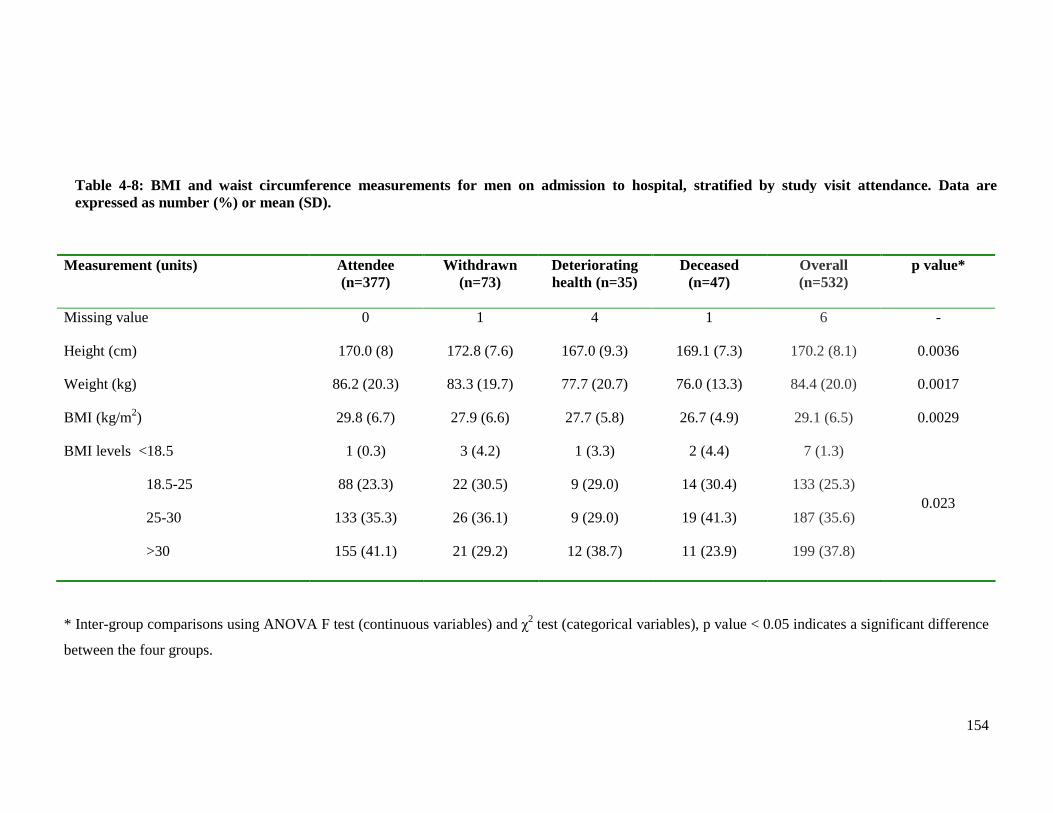
154
Measurement (units) Attendee (n=377)
Withdrawn (n=73)
Deteriorating health (n=35)
Deceased (n=47)
Overall (n=532)
p value*
Missing value 0 1 4 1 6 -
Height (cm) 170.0 (8) 172.8 (7.6) 167.0 (9.3) 169.1 (7.3) 170.2 (8.1) 0.0036
Weight (kg) 86.2 (20.3) 83.3 (19.7) 77.7 (20.7) 76.0 (13.3) 84.4 (20.0) 0.0017
BMI (kg/m2) 29.8 (6.7) 27.9 (6.6) 27.7 (5.8) 26.7 (4.9) 29.1 (6.5) 0.0029
BMI levels <18.5
18.5-25
25-30
>30
1 (0.3)
88 (23.3)
133 (35.3)
155 (41.1)
3 (4.2)
22 (30.5)
26 (36.1)
21 (29.2)
1 (3.3)
9 (29.0)
9 (29.0)
12 (38.7)
2 (4.4)
14 (30.4)
19 (41.3)
11 (23.9)
7 (1.3)
133 (25.3)
187 (35.6)
199 (37.8)
0.023
* Inter-group comparisons using ANOVA F test (continuous variables) and χ2 test (categorical variables), p value < 0.05 indicates a significant difference
between the four groups.
Table 4-8: BMI and waist circumference measurements for men on admission to hospital, stratified by study visit attendance. Data are expressed as number (%) or mean (SD).
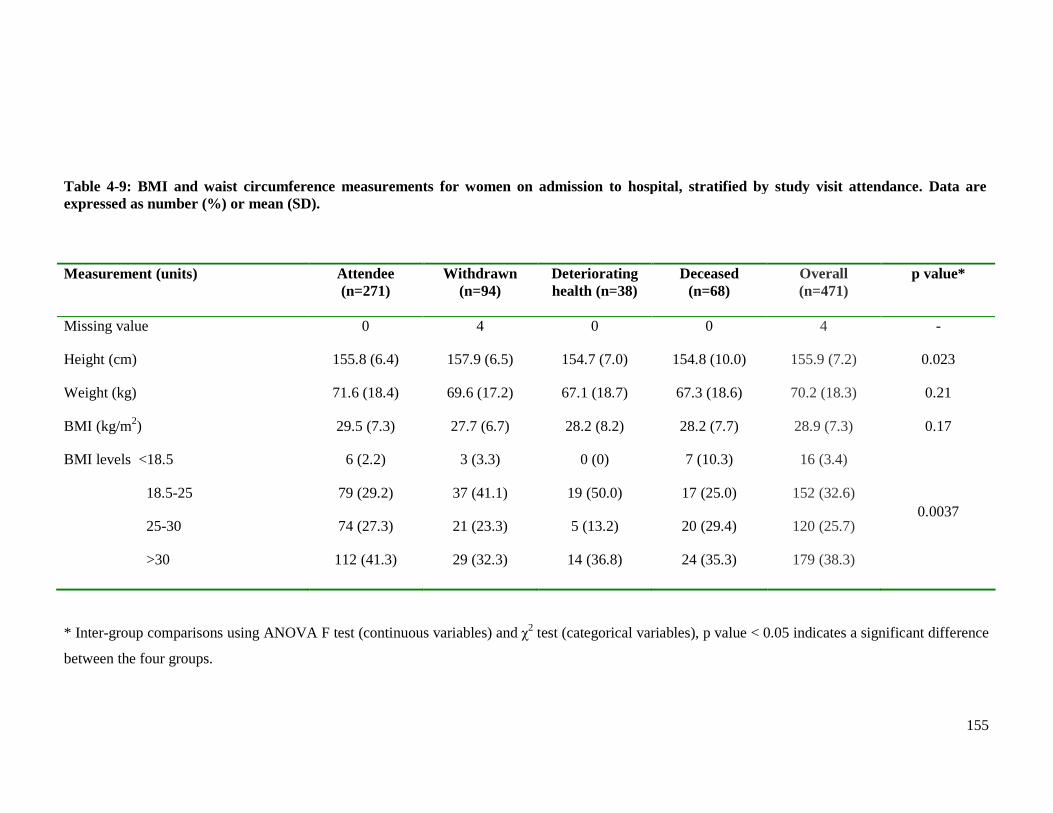
155
Measurement (units) Attendee
(n=271) Withdrawn
(n=94) Deteriorating health (n=38)
Deceased (n=68)
Overall (n=471)
p value*
Missing value 0 4 0 0 4 -
Height (cm) 155.8 (6.4) 157.9 (6.5) 154.7 (7.0) 154.8 (10.0) 155.9 (7.2) 0.023
Weight (kg) 71.6 (18.4) 69.6 (17.2) 67.1 (18.7) 67.3 (18.6) 70.2 (18.3) 0.21
BMI (kg/m2) 29.5 (7.3) 27.7 (6.7) 28.2 (8.2) 28.2 (7.7) 28.9 (7.3) 0.17
BMI levels <18.5
18.5-25
25-30
>30
6 (2.2)
79 (29.2)
74 (27.3)
112 (41.3)
3 (3.3)
37 (41.1)
21 (23.3)
29 (32.3)
0 (0)
19 (50.0)
5 (13.2)
14 (36.8)
7 (10.3)
17 (25.0)
20 (29.4)
24 (35.3)
16 (3.4)
152 (32.6)
120 (25.7)
179 (38.3)
0.0037
* Inter-group comparisons using ANOVA F test (continuous variables) and χ2 test (categorical variables), p value < 0.05 indicates a significant difference
between the four groups.
Table 4-9: BMI and waist circumference measurements for women on admission to hospital, stratified by study visit attendance. Data are expressed as number (%) or mean (SD).
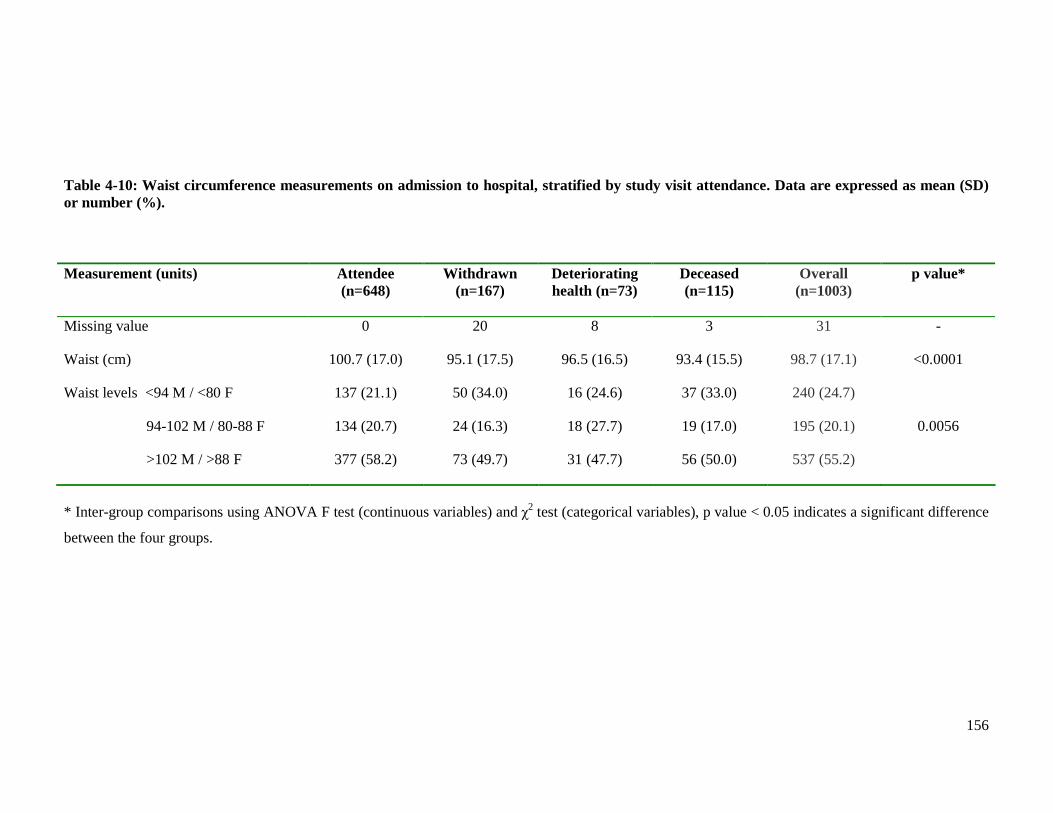
156
Table 4-10: Waist circumference measurements on admission to hospital, stratified by study visit attendance. Data are expressed as mean (SD) or number (%). Measurement (units) Attendee
(n=648) Withdrawn
(n=167) Deteriorating health (n=73)
Deceased (n=115)
Overall (n=1003)
p value*
Missing value 0 20 8 3 31 -
Waist (cm) 100.7 (17.0) 95.1 (17.5) 96.5 (16.5) 93.4 (15.5) 98.7 (17.1) <0.0001
Waist levels <94 M / <80 F
94-102 M / 80-88 F
>102 M / >88 F
137 (21.1)
134 (20.7)
377 (58.2)
50 (34.0)
24 (16.3)
73 (49.7)
16 (24.6)
18 (27.7)
31 (47.7)
37 (33.0)
19 (17.0)
56 (50.0)
240 (24.7)
195 (20.1)
537 (55.2)
0.0056
* Inter-group comparisons using ANOVA F test (continuous variables) and χ2 test (categorical variables), p value < 0.05 indicates a significant difference
between the four groups.
157
4.2.8.3 Clinical signs of heart failure
There were several differences between the four groups of patients in the signs of HF
recorded on admission to hospital. The results are displayed in Table 4-11.
Few patients had an audible third heart sound. However, the prevalence of this clinical sign
was more common amongst patients who died before the study visit than the other three
groups (p=0.037). The level of pulmonary oedema differed between the groups (p=0.0019).
Few patients in all four groups had no crackles auscultated. The absence of pulmonary
crackles was more common amongst attendees and patients who withdrew from the study
visit. These groups also had more patients with only basal crackles whilst those unable to
participate in the study visit due to deteriorating health or death had more patients with
crackles extending to the mid-zones and apices. The presence of a pleural effusion
(unilateral or bilateral) showed a similar pattern to pulmonary crackles, although the
prevalence was much less in all four groups and the difference less striking (p=0.042).
Peripheral oedema was a common clinical sign, affecting the majority of patients in all
groups. However, there were differences between the four groups in the proportions of
patients with peripheral oedema (p=<0.0001). Patients who died before the study visit or
had deteriorating health had more patients with peripheral oedema, than the other two
groups. The level of peripheral oedema also differed between the groups. Those unable to
complete the study visit due to death or deteriorating health had proportionately more
patients with oedema at all levels (ankle, knee, thigh, sacrum and abdomen), than the other
two groups.
Few patients in the overall cohort had ascites. There was no significant difference between
the groups in the presence of this clinical sign, although it was proportionately more
common amongst those who died before the study visit.
The majority of patients in all four groups were in Killip class II. The proportions in each
of the four Killip classes differed between the groups (p<0.0001). Patients who died before
the study visit were more likely to be in class III and IV, than the other three groups.
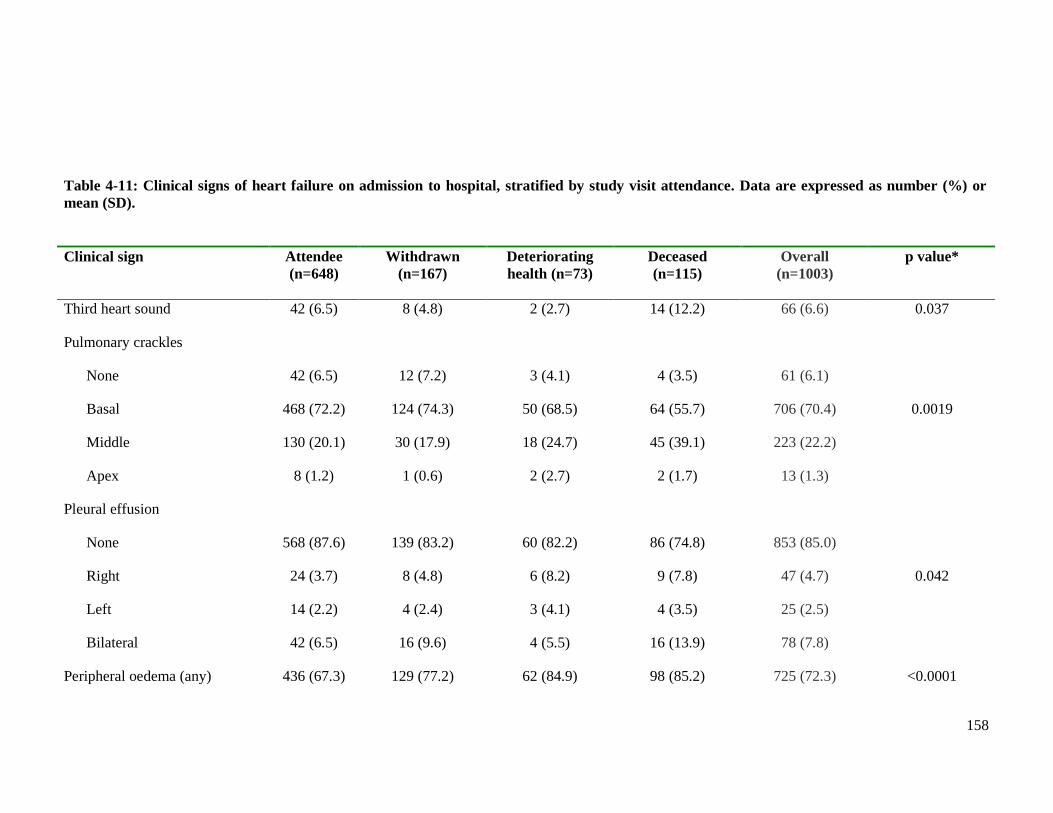
158
Clinical sign Attendee
(n=648) Withdrawn
(n=167) Deteriorating health (n=73)
Deceased (n=115)
Overall (n=1003)
p value*
Third heart sound 42 (6.5) 8 (4.8) 2 (2.7) 14 (12.2) 66 (6.6) 0.037
Pulmonary crackles
None
Basal
Middle
Apex
42 (6.5)
468 (72.2)
130 (20.1)
8 (1.2)
12 (7.2)
124 (74.3)
30 (17.9)
1 (0.6)
3 (4.1)
50 (68.5)
18 (24.7)
2 (2.7)
4 (3.5)
64 (55.7)
45 (39.1)
2 (1.7)
61 (6.1)
706 (70.4)
223 (22.2)
13 (1.3)
0.0019
Pleural effusion
None
Right
Left
Bilateral
568 (87.6)
24 (3.7)
14 (2.2)
42 (6.5)
139 (83.2)
8 (4.8)
4 (2.4)
16 (9.6)
60 (82.2)
6 (8.2)
3 (4.1)
4 (5.5)
86 (74.8)
9 (7.8)
4 (3.5)
16 (13.9)
853 (85.0)
47 (4.7)
25 (2.5)
78 (7.8)
0.042
Peripheral oedema (any) 436 (67.3) 129 (77.2) 62 (84.9) 98 (85.2) 725 (72.3) <0.0001
Table 4-11: Clinical signs of heart failure on admission to hospital, stratified by study visit attendance. Data are expressed as number (%) or mean (SD).
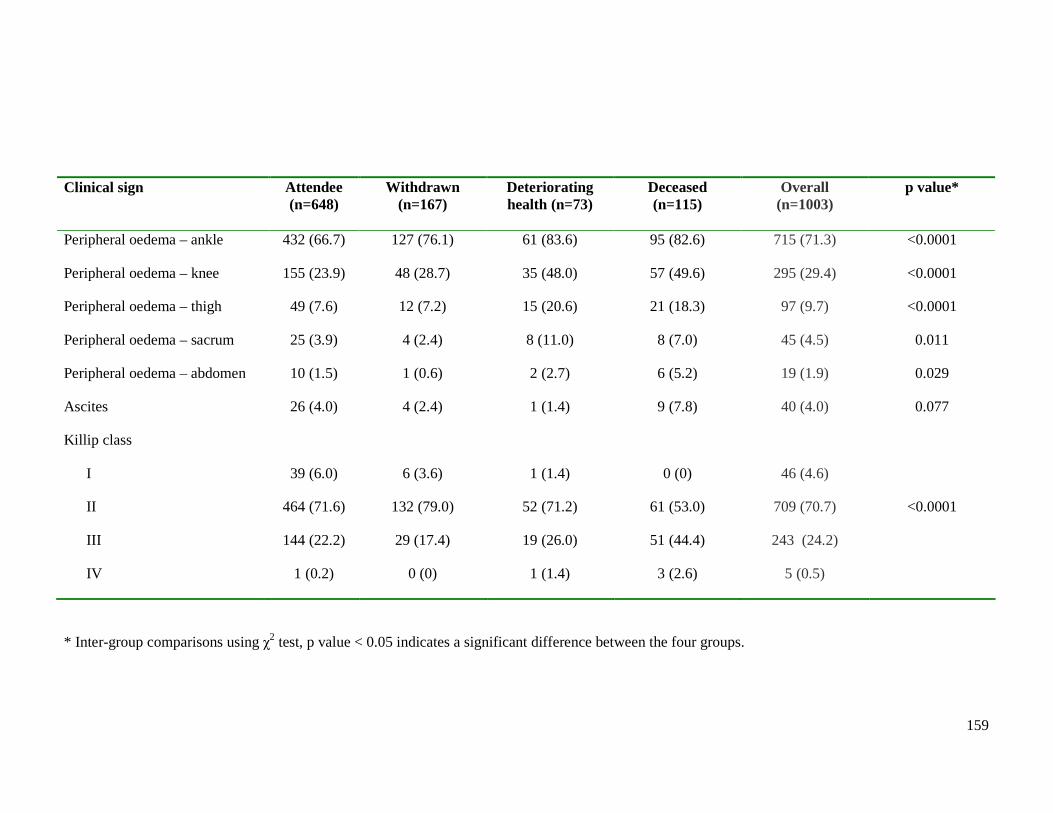
159
Clinical sign Attendee (n=648)
Withdrawn (n=167)
Deteriorating health (n=73)
Deceased (n=115)
Overall (n=1003)
p value*
Peripheral oedema – ankle 432 (66.7) 127 (76.1) 61 (83.6) 95 (82.6) 715 (71.3) <0.0001
Peripheral oedema – knee 155 (23.9) 48 (28.7) 35 (48.0) 57 (49.6) 295 (29.4) <0.0001
Peripheral oedema – thigh 49 (7.6) 12 (7.2) 15 (20.6) 21 (18.3) 97 (9.7) <0.0001
Peripheral oedema – sacrum 25 (3.9) 4 (2.4) 8 (11.0) 8 (7.0) 45 (4.5) 0.011
Peripheral oedema – abdomen 10 (1.5) 1 (0.6) 2 (2.7) 6 (5.2) 19 (1.9) 0.029
Ascites 26 (4.0) 4 (2.4) 1 (1.4) 9 (7.8) 40 (4.0) 0.077
Killip class
I
II
III
IV
39 (6.0)
464 (71.6)
144 (22.2)
1 (0.2)
6 (3.6)
132 (79.0)
29 (17.4)
0 (0)
1 (1.4)
52 (71.2)
19 (26.0)
1 (1.4)
0 (0)
61 (53.0)
51 (44.4)
3 (2.6)
46 (4.6)
709 (70.7)
243 (24.2)
5 (0.5)
<0.0001
* Inter-group comparisons using χ2 test, p value < 0.05 indicates a significant difference between the four groups.
160
4.2.9 Electrocardiography
There were few differences between the four groups of patients in the electrocardiographic
(ECG) parameters recorded on admission to hospital, as displayed in Table 4-12. The
parameters that differed between the groups were; sinus rhythm, LBBB and prolonged
QRS. There were no differences between the four groups for the following parameters; AF,
paced rhythm, LVH, ischaemic ST depression, mean QRS duration, mean QTc interval and
proportion with prolonged QTc.
Patients who died before the study visit and attendees were more likely to be in sinus
rhythm than the other two groups (p=0.009). Less than half of patients who did not
complete the study visit because of deteriorating health or withdrawal from participation
were in sinus rhythm on admission.
LBBB was present on almost a fifth of the admission ECGs of all patients enrolled in the
study. This ECG abnormality was more common amongst patients who died before the
study visit (p=0.012). Patients who attended the study visit or were unable to because of
deteriorating health had similar percentages of LBBB. Those who withdrew from
participating in the study visit had fewest patients with this ECG abnormality.
The prevalence of a prolonged QRS differed between the four groups (p=0.024). The
prevalence of a QRS duration 120-150ms amongst the four groups exhibited a similar
pattern to that of LBBB. However a more prolonged QRS duration (>150ms) was more
common amongst those with deteriorating health than the other three groups. Attendees
and patients who died before the study visit had similar proportions with a QRS duration
>150ms whilst those that withdrew from participation had fewest patients with this ECG
abnormality.
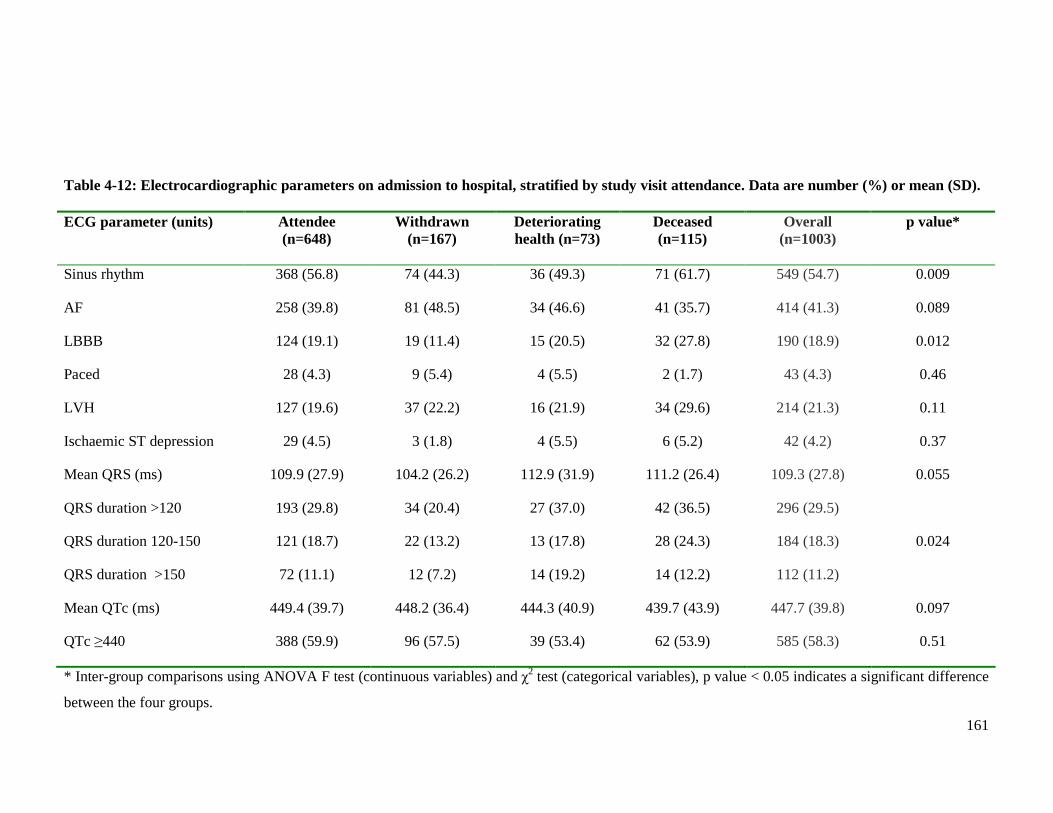
161
Table 4-12: Electrocardiographic parameters on admission to hospital, stratified by study visit attendance. Data are number (%) or mean (SD). ECG parameter (units) Attendee
(n=648) Withdrawn
(n=167) Deteriorating health (n=73)
Deceased (n=115)
Overall (n=1003)
p value*
Sinus rhythm 368 (56.8) 74 (44.3) 36 (49.3) 71 (61.7) 549 (54.7) 0.009
AF 258 (39.8) 81 (48.5) 34 (46.6) 41 (35.7) 414 (41.3) 0.089
LBBB 124 (19.1) 19 (11.4) 15 (20.5) 32 (27.8) 190 (18.9) 0.012
Paced 28 (4.3) 9 (5.4) 4 (5.5) 2 (1.7) 43 (4.3) 0.46
LVH 127 (19.6) 37 (22.2) 16 (21.9) 34 (29.6) 214 (21.3) 0.11
Ischaemic ST depression 29 (4.5) 3 (1.8) 4 (5.5) 6 (5.2) 42 (4.2) 0.37
Mean QRS (ms) 109.9 (27.9) 104.2 (26.2) 112.9 (31.9) 111.2 (26.4) 109.3 (27.8) 0.055
QRS duration >120
QRS duration 120-150
QRS duration >150
193 (29.8)
121 (18.7)
72 (11.1)
34 (20.4)
22 (13.2)
12 (7.2)
27 (37.0)
13 (17.8)
14 (19.2)
42 (36.5)
28 (24.3)
14 (12.2)
296 (29.5)
184 (18.3)
112 (11.2)
0.024
Mean QTc (ms) 449.4 (39.7) 448.2 (36.4) 444.3 (40.9) 439.7 (43.9) 447.7 (39.8) 0.097
QTc ≥440 388 (59.9) 96 (57.5) 39 (53.4) 62 (53.9) 585 (58.3) 0.51
* Inter-group comparisons using ANOVA F test (continuous variables) and χ2 test (categorical variables), p value < 0.05 indicates a significant difference
between the four groups.
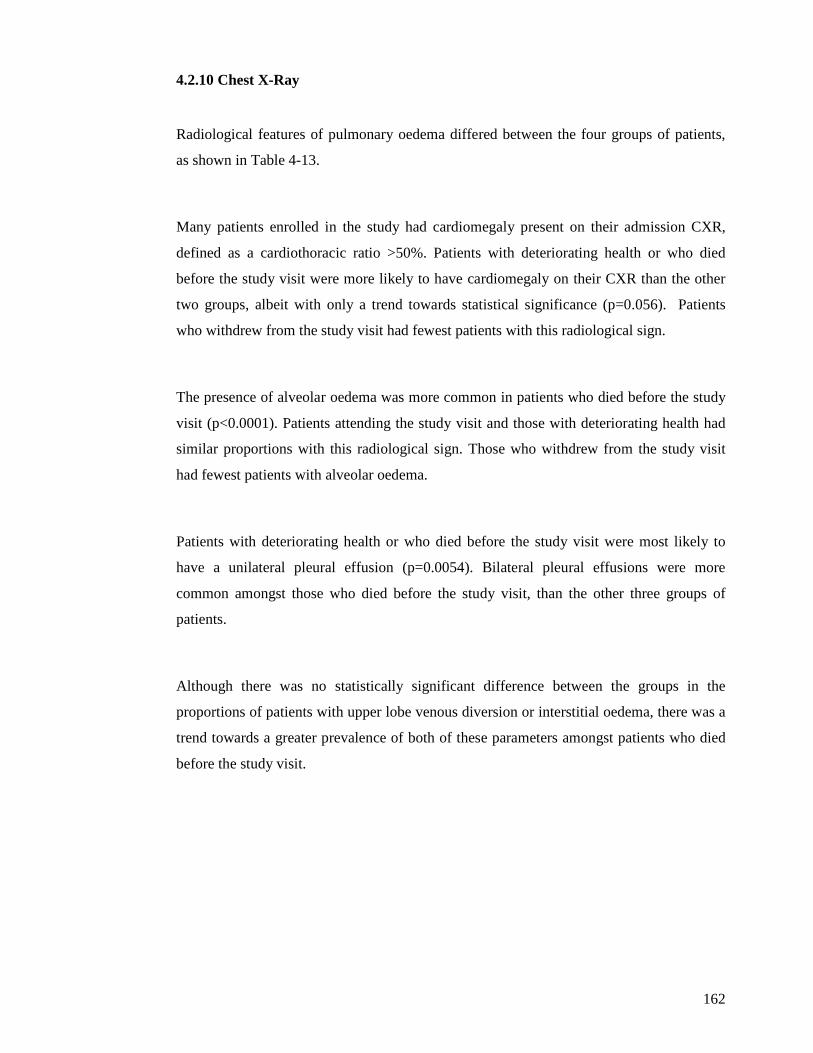
162
4.2.10 Chest X-Ray
Radiological features of pulmonary oedema differed between the four groups of patients,
as shown in Table 4-13.
Many patients enrolled in the study had cardiomegaly present on their admission CXR,
defined as a cardiothoracic ratio >50%. Patients with deteriorating health or who died
before the study visit were more likely to have cardiomegaly on their CXR than the other
two groups, albeit with only a trend towards statistical significance (p=0.056). Patients
who withdrew from the study visit had fewest patients with this radiological sign.
The presence of alveolar oedema was more common in patients who died before the study
visit (p<0.0001). Patients attending the study visit and those with deteriorating health had
similar proportions with this radiological sign. Those who withdrew from the study visit
had fewest patients with alveolar oedema.
Patients with deteriorating health or who died before the study visit were most likely to
have a unilateral pleural effusion (p=0.0054). Bilateral pleural effusions were more
common amongst those who died before the study visit, than the other three groups of
patients.
Although there was no statistically significant difference between the groups in the
proportions of patients with upper lobe venous diversion or interstitial oedema, there was a
trend towards a greater prevalence of both of these parameters amongst patients who died
before the study visit.
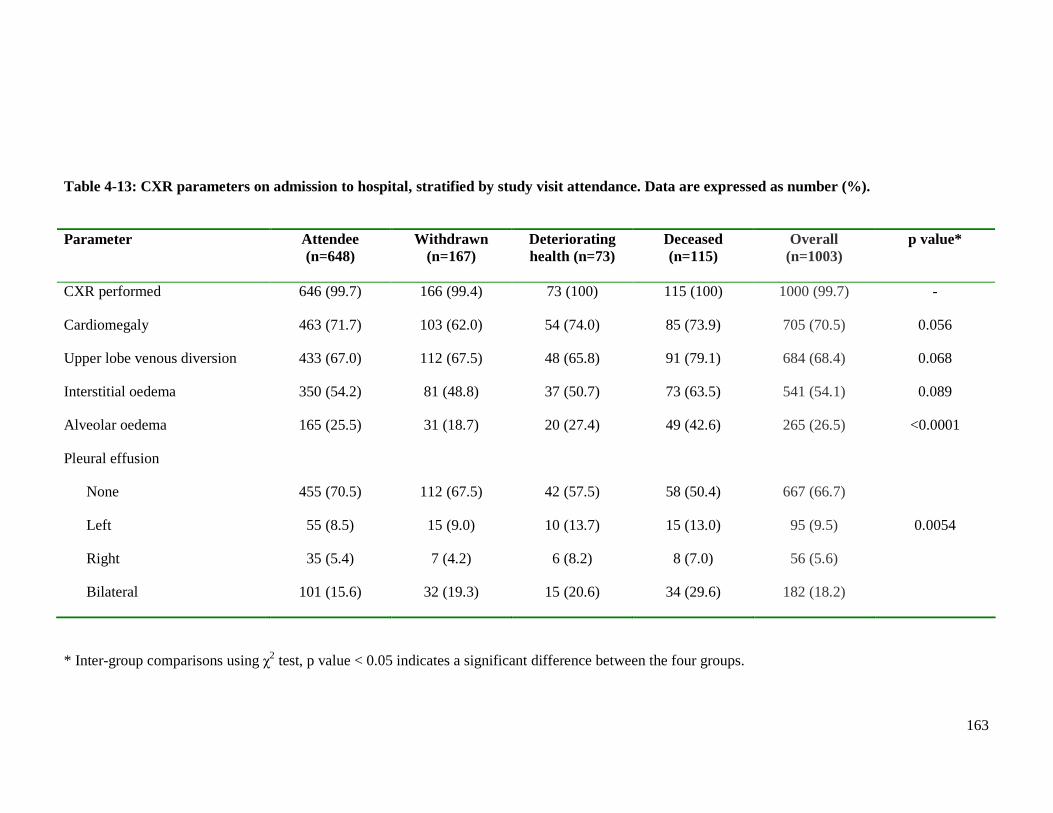
163
Parameter Attendee (n=648)
Withdrawn (n=167)
Deteriorating health (n=73)
Deceased (n=115)
Overall (n=1003)
p value*
CXR performed 646 (99.7) 166 (99.4) 73 (100) 115 (100) 1000 (99.7) -
Cardiomegaly 463 (71.7) 103 (62.0) 54 (74.0) 85 (73.9) 705 (70.5) 0.056
Upper lobe venous diversion 433 (67.0) 112 (67.5) 48 (65.8) 91 (79.1) 684 (68.4) 0.068
Interstitial oedema 350 (54.2) 81 (48.8) 37 (50.7) 73 (63.5) 541 (54.1) 0.089
Alveolar oedema 165 (25.5) 31 (18.7) 20 (27.4) 49 (42.6) 265 (26.5) <0.0001
Pleural effusion
None
Left
Right
Bilateral
455 (70.5)
55 (8.5)
35 (5.4)
101 (15.6)
112 (67.5)
15 (9.0)
7 (4.2)
32 (19.3)
42 (57.5)
10 (13.7)
6 (8.2)
15 (20.6)
58 (50.4)
15 (13.0)
8 (7.0)
34 (29.6)
667 (66.7)
95 (9.5)
56 (5.6)
182 (18.2)
0.0054
* Inter-group comparisons using χ2 test, p value < 0.05 indicates a significant difference between the four groups.
Table 4-13: CXR parameters on admission to hospital, stratified by study visit attendance. Data are expressed as number (%).
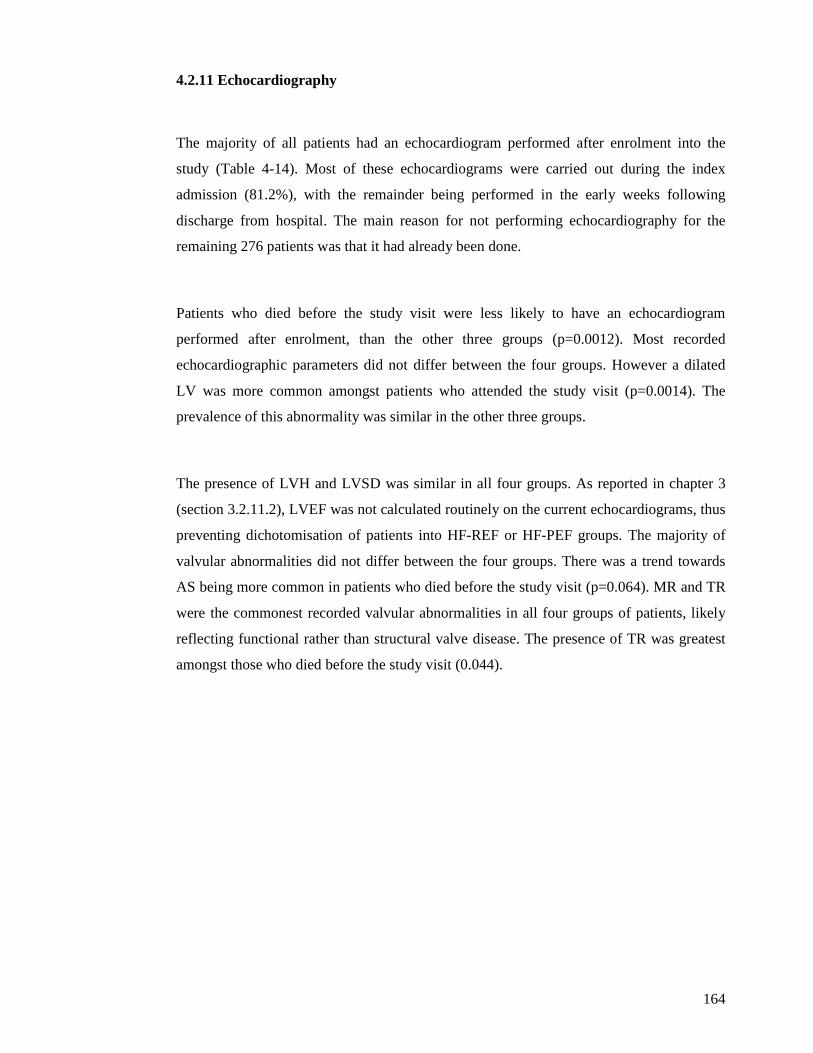
164
4.2.11 Echocardiography
The majority of all patients had an echocardiogram performed after enrolment into the
study (Table 4-14). Most of these echocardiograms were carried out during the index
admission (81.2%), with the remainder being performed in the early weeks following
discharge from hospital. The main reason for not performing echocardiography for the
remaining 276 patients was that it had already been done.
Patients who died before the study visit were less likely to have an echocardiogram
performed after enrolment, than the other three groups (p=0.0012). Most recorded
echocardiographic parameters did not differ between the four groups. However a dilated
LV was more common amongst patients who attended the study visit (p=0.0014). The
prevalence of this abnormality was similar in the other three groups.
The presence of LVH and LVSD was similar in all four groups. As reported in chapter 3
(section 3.2.11.2), LVEF was not calculated routinely on the current echocardiograms, thus
preventing dichotomisation of patients into HF-REF or HF-PEF groups. The majority of
valvular abnormalities did not differ between the four groups. There was a trend towards
AS being more common in patients who died before the study visit (p=0.064). MR and TR
were the commonest recorded valvular abnormalities in all four groups of patients, likely
reflecting functional rather than structural valve disease. The presence of TR was greatest
amongst those who died before the study visit (0.044).
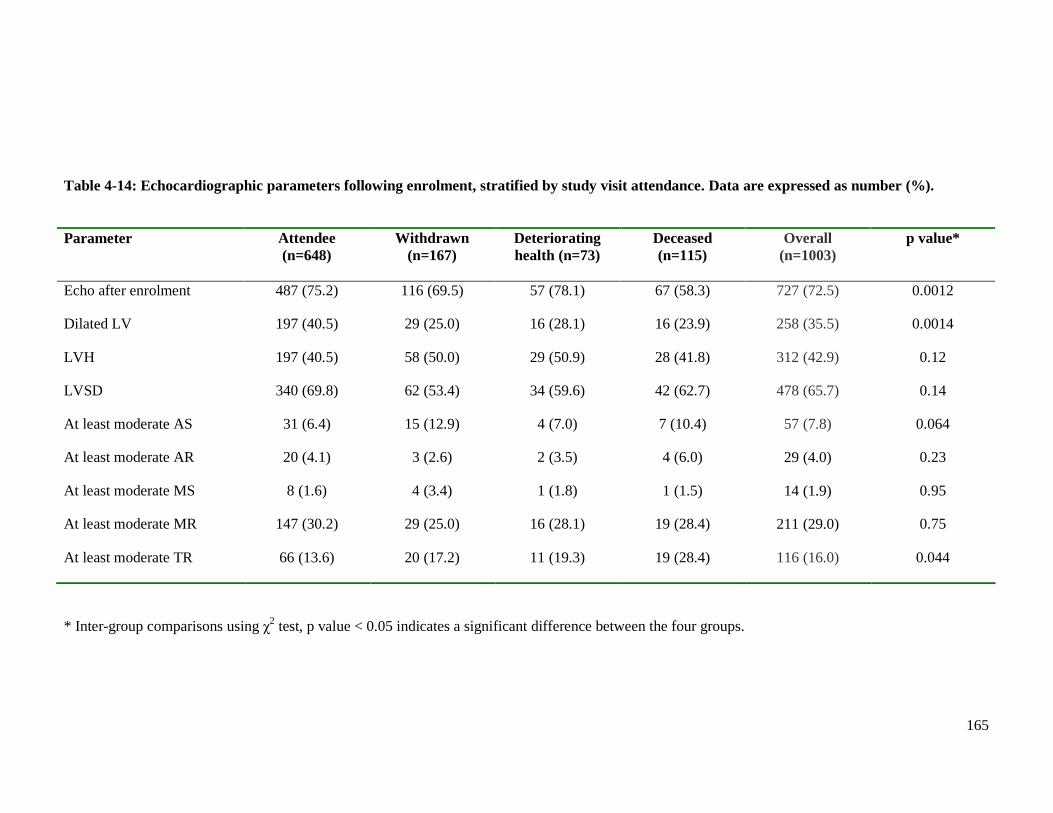
165
Parameter Attendee (n=648)
Withdrawn (n=167)
Deteriorating health (n=73)
Deceased (n=115)
Overall (n=1003)
p value*
Echo after enrolment 487 (75.2) 116 (69.5) 57 (78.1) 67 (58.3) 727 (72.5) 0.0012
Dilated LV 197 (40.5) 29 (25.0) 16 (28.1) 16 (23.9) 258 (35.5) 0.0014
LVH 197 (40.5) 58 (50.0) 29 (50.9) 28 (41.8) 312 (42.9) 0.12
LVSD 340 (69.8) 62 (53.4) 34 (59.6) 42 (62.7) 478 (65.7) 0.14
At least moderate AS 31 (6.4) 15 (12.9) 4 (7.0) 7 (10.4) 57 (7.8) 0.064
At least moderate AR 20 (4.1) 3 (2.6) 2 (3.5) 4 (6.0) 29 (4.0) 0.23
At least moderate MS 8 (1.6) 4 (3.4) 1 (1.8) 1 (1.5) 14 (1.9) 0.95
At least moderate MR 147 (30.2) 29 (25.0) 16 (28.1) 19 (28.4) 211 (29.0) 0.75
At least moderate TR 66 (13.6) 20 (17.2) 11 (19.3) 19 (28.4) 116 (16.0) 0.044
* Inter-group comparisons using χ2 test, p value < 0.05 indicates a significant difference between the four groups.
Table 4-14: Echocardiographic parameters following enrolment, stratified by study visit attendance. Data are expressed as number (%).
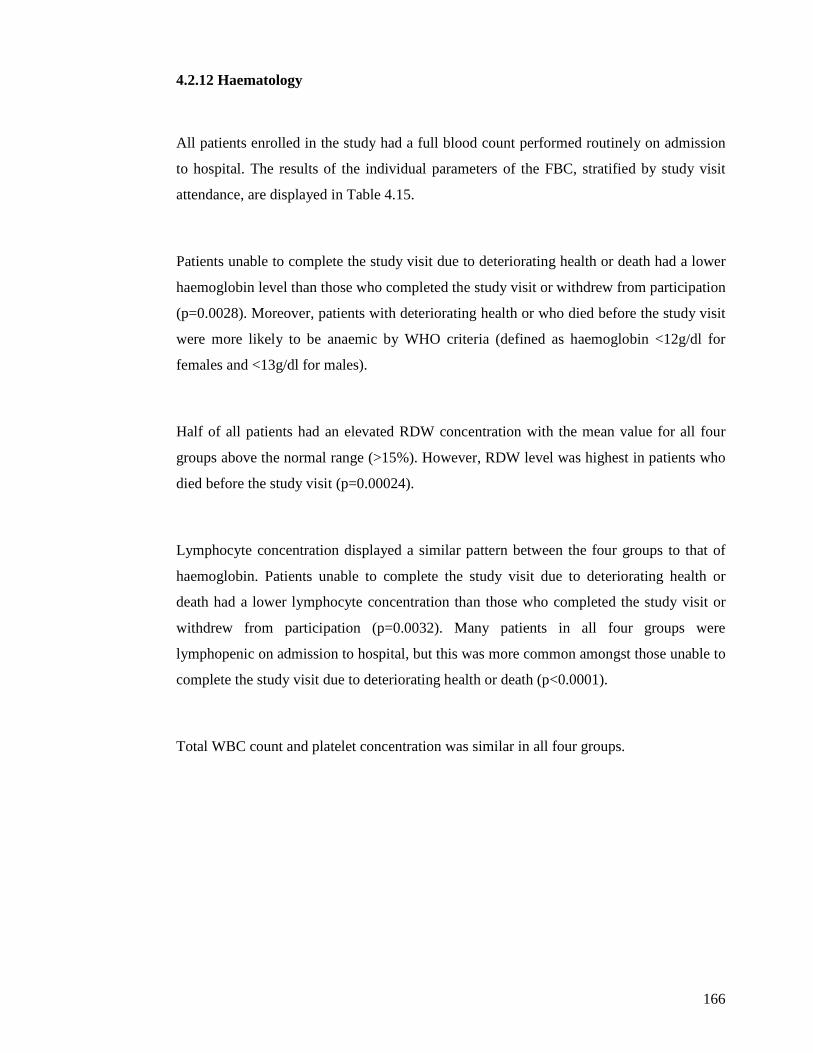
166
4.2.12 Haematology
All patients enrolled in the study had a full blood count performed routinely on admission
to hospital. The results of the individual parameters of the FBC, stratified by study visit
attendance, are displayed in Table 4.15.
Patients unable to complete the study visit due to deteriorating health or death had a lower
haemoglobin level than those who completed the study visit or withdrew from participation
(p=0.0028). Moreover, patients with deteriorating health or who died before the study visit
were more likely to be anaemic by WHO criteria (defined as haemoglobin <12g/dl for
females and <13g/dl for males).
Half of all patients had an elevated RDW concentration with the mean value for all four
groups above the normal range (>15%). However, RDW level was highest in patients who
died before the study visit (p=0.00024).
Lymphocyte concentration displayed a similar pattern between the four groups to that of
haemoglobin. Patients unable to complete the study visit due to deteriorating health or
death had a lower lymphocyte concentration than those who completed the study visit or
withdrew from participation (p=0.0032). Many patients in all four groups were
lymphopenic on admission to hospital, but this was more common amongst those unable to
complete the study visit due to deteriorating health or death (p<0.0001).
Total WBC count and platelet concentration was similar in all four groups.
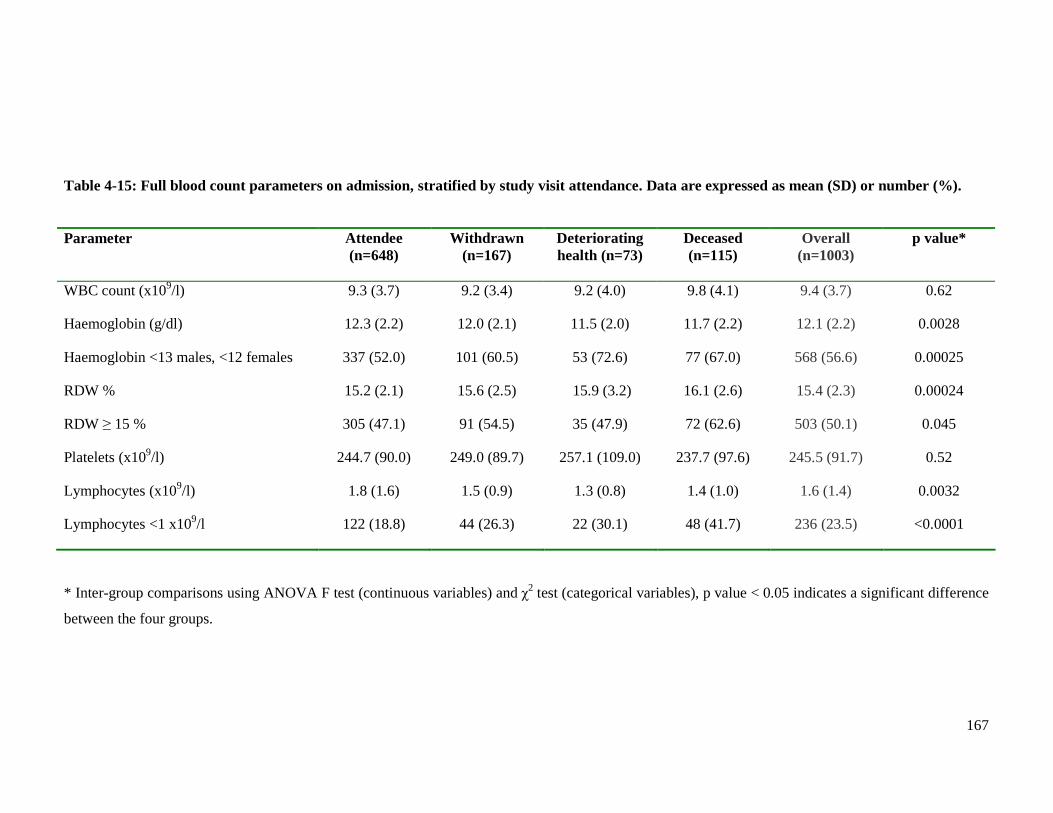
167
Parameter Attendee (n=648)
Withdrawn (n=167)
Deteriorating health (n=73)
Deceased (n=115)
Overall (n=1003)
p value*
WBC count (x109/l) 9.3 (3.7) 9.2 (3.4) 9.2 (4.0) 9.8 (4.1) 9.4 (3.7) 0.62
Haemoglobin (g/dl) 12.3 (2.2) 12.0 (2.1) 11.5 (2.0) 11.7 (2.2) 12.1 (2.2) 0.0028
Haemoglobin <13 males, <12 females 337 (52.0) 101 (60.5) 53 (72.6) 77 (67.0) 568 (56.6) 0.00025
RDW % 15.2 (2.1) 15.6 (2.5) 15.9 (3.2) 16.1 (2.6) 15.4 (2.3) 0.00024
RDW ≥ 15 % 305 (47.1) 91 (54.5) 35 (47.9) 72 (62.6) 503 (50.1) 0.045
Platelets (x109/l) 244.7 (90.0) 249.0 (89.7) 257.1 (109.0) 237.7 (97.6) 245.5 (91.7) 0.52
Lymphocytes (x109/l) 1.8 (1.6) 1.5 (0.9) 1.3 (0.8) 1.4 (1.0) 1.6 (1.4) 0.0032
Lymphocytes <1 x10⁹/l 122 (18.8) 44 (26.3) 22 (30.1) 48 (41.7) 236 (23.5) <0.0001
* Inter-group comparisons using ANOVA F test (continuous variables) and χ2 test (categorical variables), p value < 0.05 indicates a significant difference
between the four groups.
Table 4-15: Full blood count parameters on admission, stratified by study visit attendance. Data are expressed as mean (SD) or number (%).
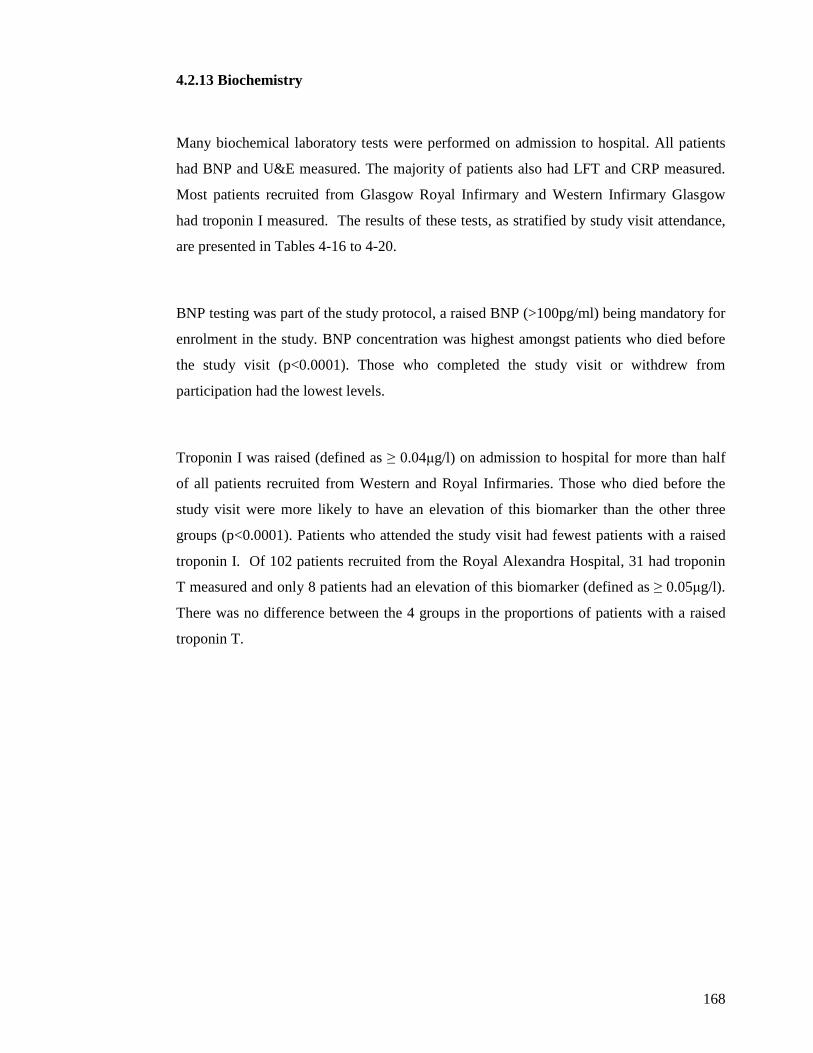
168
4.2.13 Biochemistry
Many biochemical laboratory tests were performed on admission to hospital. All patients
had BNP and U&E measured. The majority of patients also had LFT and CRP measured.
Most patients recruited from Glasgow Royal Infirmary and Western Infirmary Glasgow
had troponin I measured. The results of these tests, as stratified by study visit attendance,
are presented in Tables 4-16 to 4-20.
BNP testing was part of the study protocol, a raised BNP (>100pg/ml) being mandatory for
enrolment in the study. BNP concentration was highest amongst patients who died before
the study visit (p<0.0001). Those who completed the study visit or withdrew from
participation had the lowest levels.
Troponin I was raised (defined as ≥ 0.04µg/l) on admission to hospital for more than half
of all patients recruited from Western and Royal Infirmaries. Those who died before the
study visit were more likely to have an elevation of this biomarker than the other three
groups (p<0.0001). Patients who attended the study visit had fewest patients with a raised
troponin I. Of 102 patients recruited from the Royal Alexandra Hospital, 31 had troponin
T measured and only 8 patients had an elevation of this biomarker (defined as ≥ 0.05µg/l).
There was no difference between the 4 groups in the proportions of patients with a raised
troponin T.
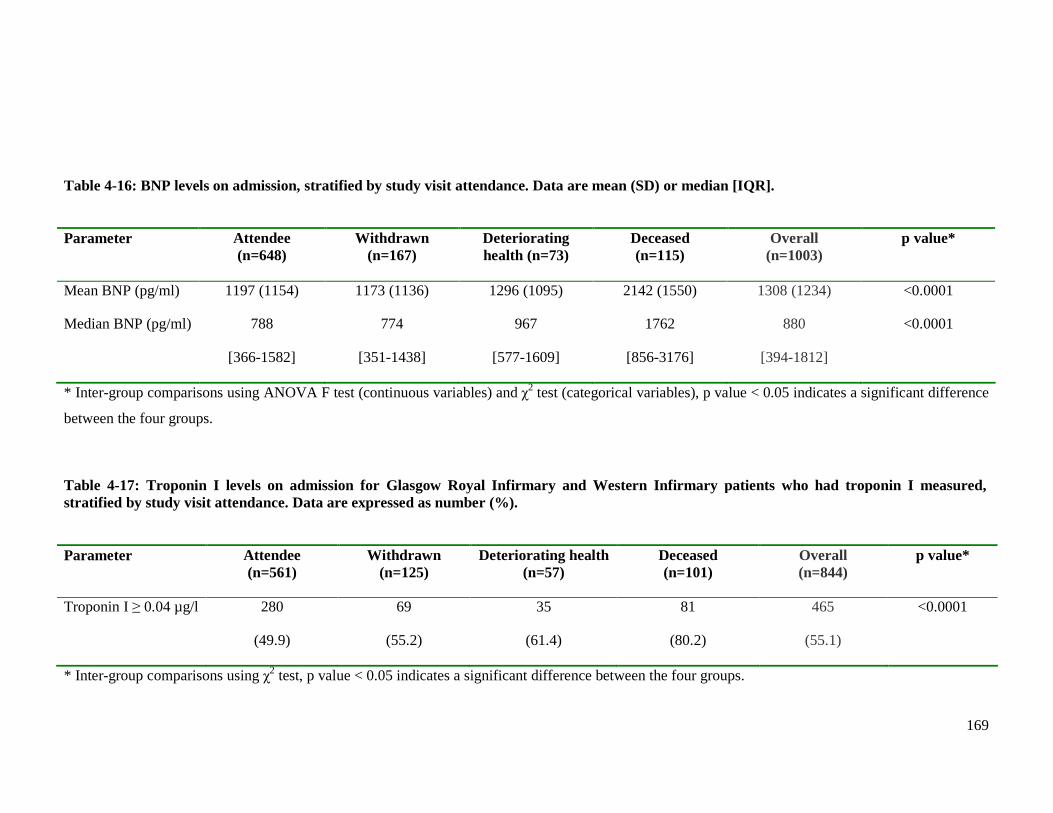
169
Parameter Attendee (n=648)
Withdrawn (n=167)
Deteriorating health (n=73)
Deceased (n=115)
Overall (n=1003)
p value*
Mean BNP (pg/ml) 1197 (1154) 1173 (1136) 1296 (1095) 2142 (1550) 1308 (1234) <0.0001
Median BNP (pg/ml) 788
[366-1582]
774
[351-1438]
967
[577-1609]
1762
[856-3176]
880
[394-1812]
<0.0001
* Inter-group comparisons using ANOVA F test (continuous variables) and χ2 test (categorical variables), p value < 0.05 indicates a significant difference
between the four groups.
Parameter Attendee (n=561)
Withdrawn (n=125)
Deteriorating health (n=57)
Deceased (n=101)
Overall (n=844)
p value*
Troponin I ≥ 0.04 µg/l 280
(49.9)
69
(55.2)
35
(61.4)
81
(80.2)
465
(55.1)
<0.0001
* Inter-group comparisons using χ2 test, p value < 0.05 indicates a significant difference between the four groups.
Table 4-16: BNP levels on admission, stratified by study visit attendance. Data are mean (SD) or median [IQR].
Table 4-17: Troponin I levels on admission for Glasgow Royal Infirmary and Western Infirmary patients who had troponin I measured, stratified by study visit attendance. Data are expressed as number (%).
170
U&E were measured on admission for all patients enrolled in the study. Nearly all the
parameters differed between the four groups of patients (Table 4-18). Patients who died
before the study visit or had deteriorating health had lower sodium concentrations than the
other two groups (p<0.0001). Hyponatraemia (defined as sodium <135mmol/l) was more
common amongst those who died before the study visit, than the other three groups
(p=0.0019). Patients attending the study visit had fewest patients with this biochemical
abnormality, almost half the prevalence of those who died before the study visit.
The majority of patients in each of the four groups had an elevated urea concentration.
Patients who died before the study visit had higher concentrations than the other three
groups (p<0.0001). Patients with deteriorating health and those who died before the study
visit had proportionately more patients with an elevation above the normal range (defined
as >7.5mmol/l) [p<0.0001].
Creatinine concentration also differed between the four groups. Consistent with the
findings regarding serum urea, the highest concentrations of creatinine were amongst those
who failed to complete the study visit due to deteriorating health or death (p=0.00035).
eGFR was calculated for all patients using the four-variable MDRD formula, as outlined in
Chapter 2. This formula uses age, sex, race and creatinine to calculate the eGFR and
provides a more accurate assessment of renal function than urea or creatinine alone.
Consistent with the results of urea and creatinine concentrations, eGFR was lower in those
who died before the study visit or had deteriorating health than the other two groups
(p<0.0001). Although the majority of patients in all four groups had renal dysfunction
(defined as eGFR <60ml/min/1.73m2), this was more common in patients who died before
the study visit or had deteriorating health. Severe renal dysfunction (defined as eGFR
<30ml/min/1.73m2) was more common amongst those who died before the study visit
(p<0.0001).
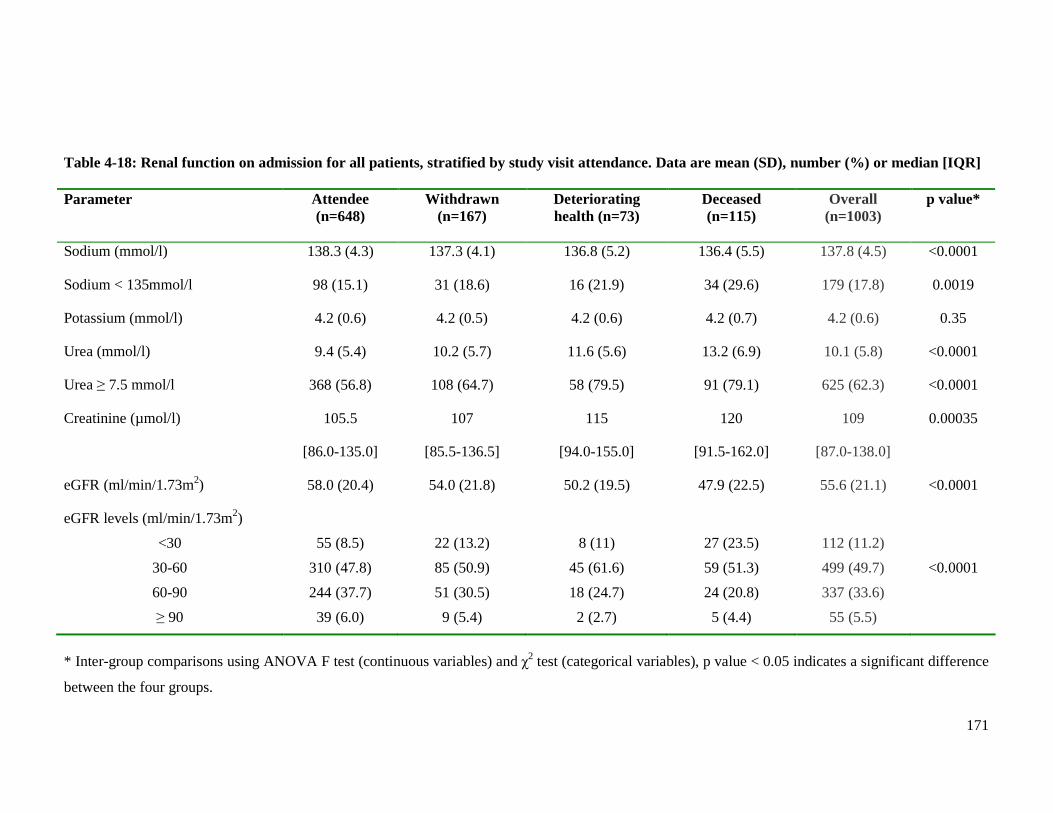
171
Parameter Attendee (n=648)
Withdrawn (n=167)
Deteriorating health (n=73)
Deceased (n=115)
Overall (n=1003)
p value*
Sodium (mmol/l) 138.3 (4.3) 137.3 (4.1) 136.8 (5.2) 136.4 (5.5) 137.8 (4.5) <0.0001
Sodium < 135mmol/l 98 (15.1) 31 (18.6) 16 (21.9) 34 (29.6) 179 (17.8) 0.0019
Potassium (mmol/l) 4.2 (0.6) 4.2 (0.5) 4.2 (0.6) 4.2 (0.7) 4.2 (0.6) 0.35
Urea (mmol/l) 9.4 (5.4) 10.2 (5.7) 11.6 (5.6) 13.2 (6.9) 10.1 (5.8) <0.0001
Urea ≥ 7.5 mmol/l 368 (56.8) 108 (64.7) 58 (79.5) 91 (79.1) 625 (62.3) <0.0001
Creatinine (µmol/l) 105.5
[86.0-135.0]
107
[85.5-136.5]
115
[94.0-155.0]
120
[91.5-162.0]
109
[87.0-138.0]
0.00035
eGFR (ml/min/1.73m2) 58.0 (20.4) 54.0 (21.8) 50.2 (19.5) 47.9 (22.5) 55.6 (21.1) <0.0001
eGFR levels (ml/min/1.73m2)
<30
30-60
60-90
≥ 90
55 (8.5)
310 (47.8)
244 (37.7)
39 (6.0)
22 (13.2)
85 (50.9)
51 (30.5)
9 (5.4)
8 (11)
45 (61.6)
18 (24.7)
2 (2.7)
27 (23.5)
59 (51.3)
24 (20.8)
5 (4.4)
112 (11.2)
499 (49.7)
337 (33.6)
55 (5.5)
<0.0001
* Inter-group comparisons using ANOVA F test (continuous variables) and χ2 test (categorical variables), p value < 0.05 indicates a significant difference
between the four groups.
Table 4-18: Renal function on admission for all patients, stratified by study visit attendance. Data are mean (SD), number (%) or median [IQR]
172
LFT were measured on admission for the majority of patients enrolled in the study. The
results, stratified by study visit attendance, are displayed in Table 4-19.
The proportion of patients with an elevated bilirubin concentration result (defined as
>22µmol/l) differed between the four groups (p=0.036). Those who died before the study
visit had more patients with a raised bilirubin concentration. Those with deteriorating
health had, perhaps surprisingly, fewest patients with an elevated bilirubin with similar
proportions for those who completed the study visit or withdrew from participation.
Patients with deteriorating health had higher levels of alkaline phosphatase than the other
three groups (p=0.00024). Patients attending the study visit had the lowest levels of this
liver test.
Albumin concentration was lowest amongst patients who died before the study visit than
the other three groups (p<0.0001). Patients who withdrew from participating in the study
visit had the highest levels of this biomarker. Those who died before the study visit had
more patients with hypoalbuminaemia (defined as albumin <35g/l), whilst attendees and
patients who withdrew from participating in the study visit had fewest patients with this
abnormality (P<0.0001).
AST, ALT and GGT concentrations were similar in all four groups.
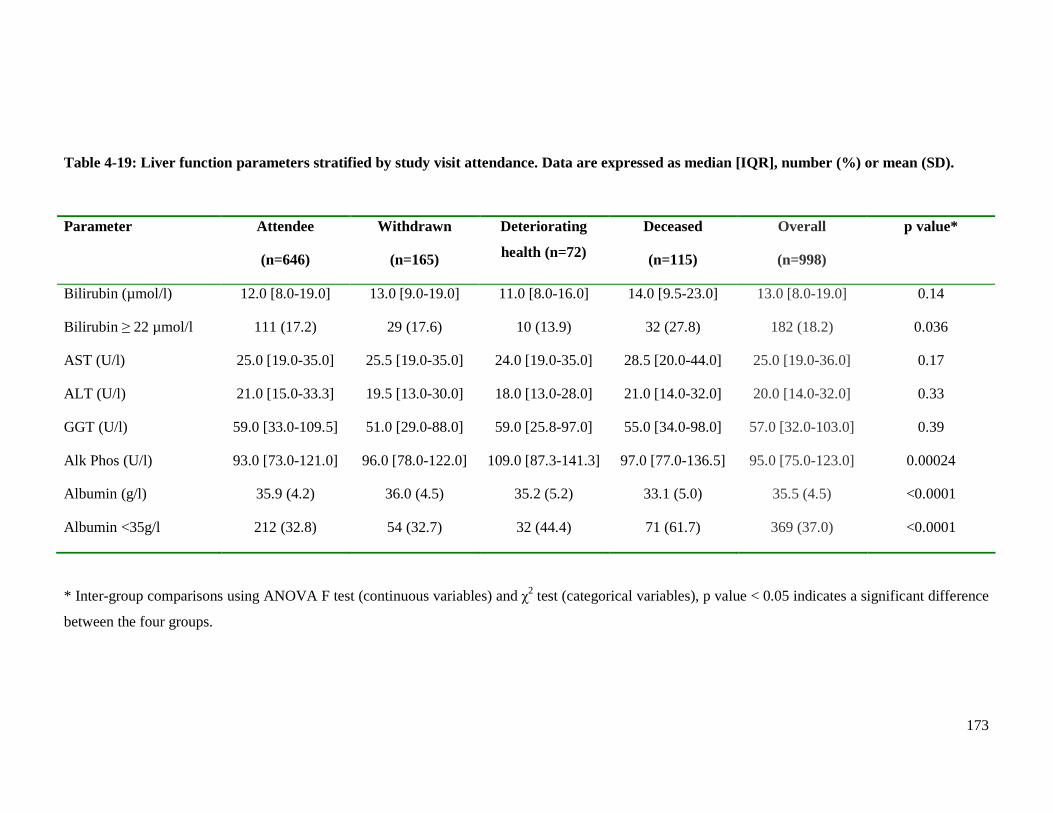
173
* Inter-group comparisons using ANOVA F test (continuous variables) and χ2 test (categorical variables), p value < 0.05 indicates a significant difference
between the four groups.
Table 4-19: Liver function parameters stratified by study visit attendance. Data are expressed as median [IQR], number (%) or mean (SD).
Parameter Attendee
(n=646)
Withdrawn
(n=165)
Deteriorating
health (n=72)
Deceased
(n=115)
Overall
(n=998)
p value*
Bilirubin (µmol/l) 12.0 [8.0-19.0] 13.0 [9.0-19.0] 11.0 [8.0-16.0] 14.0 [9.5-23.0] 13.0 [8.0-19.0] 0.14
Bilirubin ≥ 22 µmol/l 111 (17.2) 29 (17.6) 10 (13.9) 32 (27.8) 182 (18.2) 0.036
AST (U/l) 25.0 [19.0-35.0] 25.5 [19.0-35.0] 24.0 [19.0-35.0] 28.5 [20.0-44.0] 25.0 [19.0-36.0] 0.17
ALT (U/l) 21.0 [15.0-33.3] 19.5 [13.0-30.0] 18.0 [13.0-28.0] 21.0 [14.0-32.0] 20.0 [14.0-32.0] 0.33
GGT (U/l) 59.0 [33.0-109.5] 51.0 [29.0-88.0] 59.0 [25.8-97.0] 55.0 [34.0-98.0] 57.0 [32.0-103.0] 0.39
Alk Phos (U/l) 93.0 [73.0-121.0] 96.0 [78.0-122.0] 109.0 [87.3-141.3] 97.0 [77.0-136.5] 95.0 [75.0-123.0] 0.00024
Albumin (g/l) 35.9 (4.2) 36.0 (4.5) 35.2 (5.2) 33.1 (5.0) 35.5 (4.5) <0.0001
Albumin <35g/l 212 (32.8) 54 (32.7) 32 (44.4) 71 (61.7) 369 (37.0) <0.0001

174
The majority of all enrolled patients had CRP measured on admission to hospital, the
results of which are shown in Table 4-20. Patients who died before the study visit or had
deteriorating health had higher CRP levels than the other two groups (p=0.00027). The
majority of patients in all four groups had a CRP level elevated above the normal reference
range (defined as >6mg/l). There was a trend towards a greater proportion of patients with
an elevated CRP in the group who died before the study visit, although the difference was
not statistically significant (p=0.057).
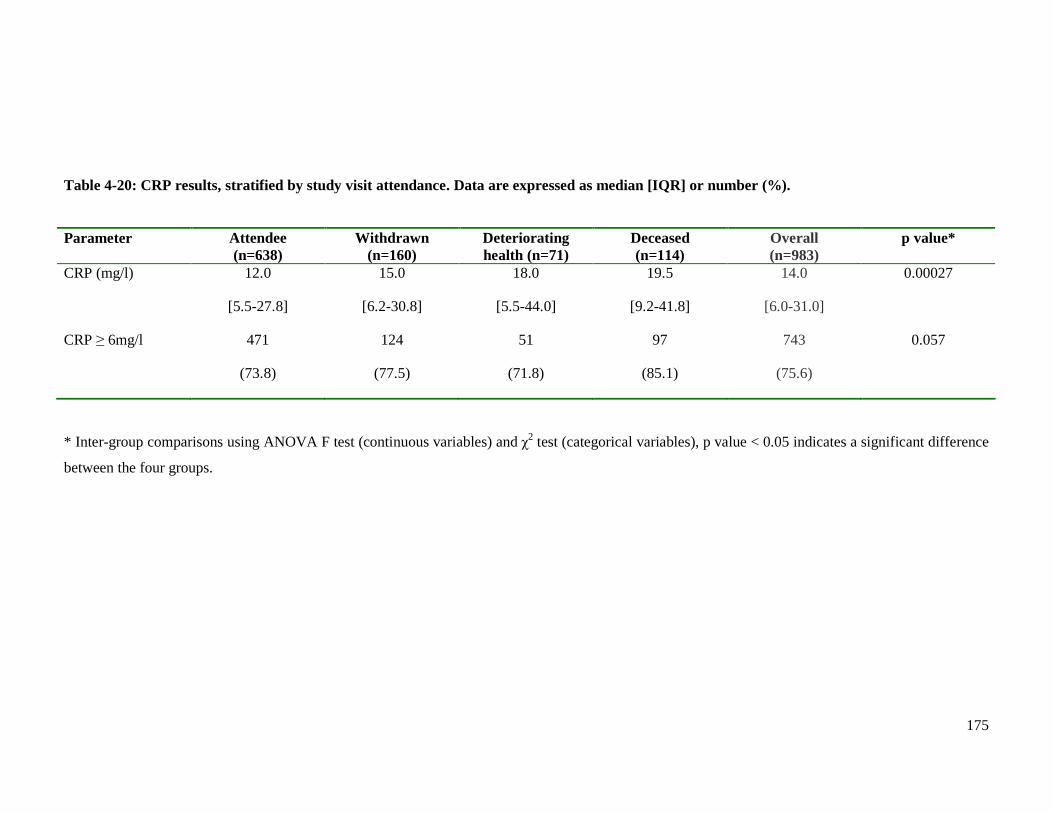
175
Parameter Attendee (n=638)
Withdrawn (n=160)
Deteriorating health (n=71)
Deceased (n=114)
Overall (n=983)
p value*
CRP (mg/l) 12.0
[5.5-27.8]
15.0
[6.2-30.8]
18.0
[5.5-44.0]
19.5
[9.2-41.8]
14.0
[6.0-31.0]
0.00027
CRP ≥ 6mg/l 471
(73.8)
124
(77.5)
51
(71.8)
97
(85.1)
743
(75.6)
0.057
* Inter-group comparisons using ANOVA F test (continuous variables) and χ2 test (categorical variables), p value < 0.05 indicates a significant difference
between the four groups.
Table 4-20: CRP results, stratified by study visit attendance. Data are expressed as median [IQR] or number (%).
176
4.3 Summary
Chapter 4 has compared the clinical characteristics of the patients in hospital according to
whether or not they subsequently completed the study visit. Many differences in the clinical
characteristics between these four groups of patients have been described. The attendees were
more likely to be younger and male. Both attendees and those who withdrew from the study
visit contained patients with milder symptoms, in terms of NYHA class, and significantly
shorter durations of hospitalisation. The groups of patients who died or had deteriorating
health preventing subsequent attendance at the study visit had more patients with a previous
diagnosis of HF.
There was a high prevalence of medical comorbidity amongst patients in all groups, regardless
of subsequent attendance at the study visit. The majority of common medical conditions did
not differ in prevalence between the four groups. Peripheral arterial disease and weight loss
were more common amongst those who died before the study visit or had deteriorating health.
There was a high prevalence of anaemia in all four groups but this was significantly higher
amongst those who died before the study visit or had deteriorating health. This is reflective of
anaemia being a predictor of poor prognosis in HF. A history of cancer was more prevalent
amongst patients with deteriorating health, perhaps a reason for subsequent non-attendance at
the study visit. Certain physically disabling conditions, such as peripheral arterial disease,
osteoarthritis and urinary incontinence, were also more prevalent in non-attendees. This may
be reflective of the burden of attending an additional clinic and the apprehension of attempting
the MTWA treadmill test. The prescribing of certain HF medications prior to hospitalisation
differed between the groups. More patients who did not attend the study visit due to
deteriorating health or death were prescribed diuretics, most likely explained by the higher
prevalence of a previous diagnosis of HF amongst these groups. More patients who
subsequently attended the study visit were prescribed beta-blockers prior to their admission;
this may reflect the prognostic benefit of these therapies. The use of intravenous nitrates or
inotrope therapy on admission was greatest amongst patients who died before the study visit,
an expected finding given that patients necessitating these medications are usually critically
unwell.
177
Patients who did not attend the study visit because of deteriorating health or death had more
adverse clinical signs on admission to hospital. These signs included systolic and diastolic
hypotension, and lower peripheral oxygen saturations. Men who did not attend the study visit
because of deteriorating health or death had a lower average weight than those who attended
or withdrew from the study visit. Men and women who died before the study visit had the
largest proportion of patients in the underweight category whilst those who attended the study
visit had the highest proportion of patients in the obese category, evidence of the reverse
epidemiology paradox in HF. Clinical signs of fluid overload on admission were also greater
amongst those with subsequent deteriorating health or death preventing study visit attendance.
There were differences between the four groups in the routine clinical investigations
performed on admission to hospital. Patients who subsequently died had the highest
proportion of LBBB present on the admission ECG, consistent with this parameter being a
marker of poor prognosis. Those with deteriorating health or death had the highest prevalence
of some radiological features of HF, including cardiomegaly and pleural effusions. Perhaps
surprisingly, the proportion of patients with a dilated LV on current echocardiogram was
greatest amongst the group of attendees. There were no other differences in echocardiographic
parameters between the four groups, including LVSD. There were several differences between
the four groups in haematological and biochemical parameters recorded on admission to
hospital. Many of these parameters are established markers of adverse outcome in HF,
abnormalities of which were proportionately more common in the groups who failed to attend
the study visit due to deteriorating health or death. These parameters included haemoglobin,
RDW, lymphocytes, BNP, troponin, sodium, urea, creatinine, eGFR, albumin and CRP. The
majority of these parameters were also abnormal amongst patients in the groups who attended
or withdrew from participating, but to a lesser extent than the other two groups.
In summary, patients attending the study visit were similar, in terms of clinical characteristics
during hospitalisation, to the group of patients who withdrew from participating in the study
visit. Both of these groups contained patients with proportionately fewer markers of an
adverse prognosis in heart failure, than the patients in the groups who failed to complete the
study visit due to deteriorating health or death.

178
CHAPTER FIVE
CLINICAL CHARACTERISTICS
OF
POST-DISCHARGE COHORT
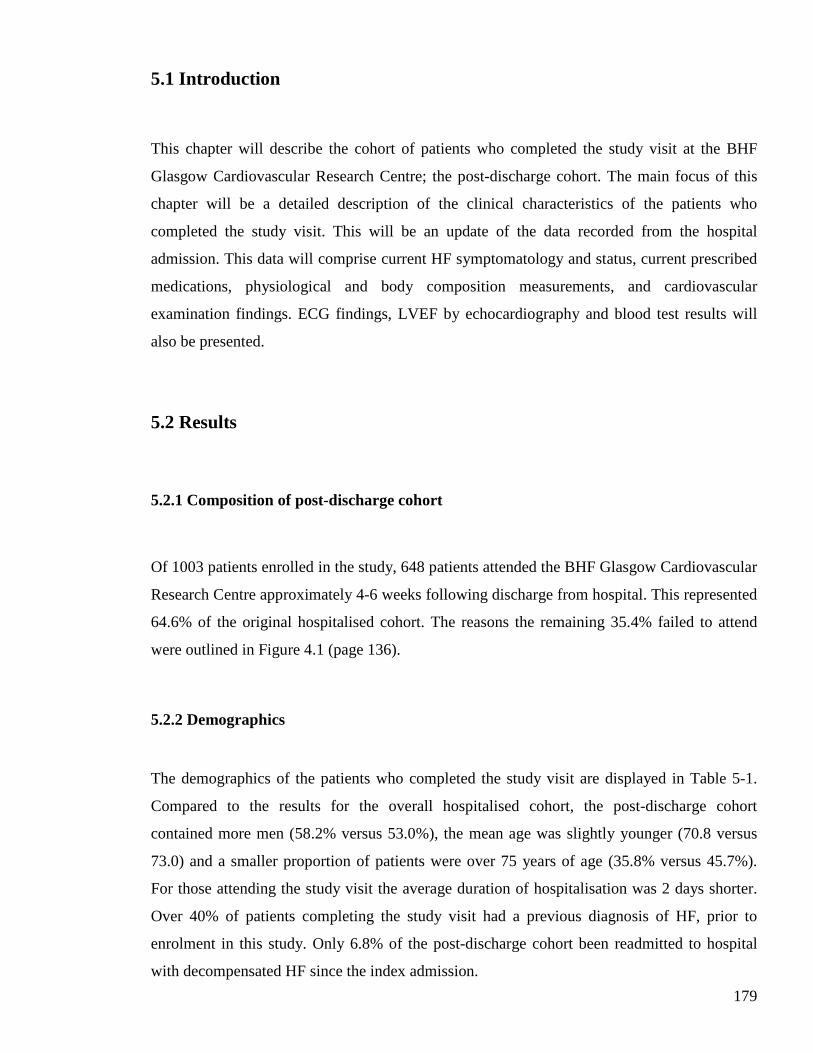
179
5.1 Introduction
This chapter will describe the cohort of patients who completed the study visit at the BHF
Glasgow Cardiovascular Research Centre; the post-discharge cohort. The main focus of this
chapter will be a detailed description of the clinical characteristics of the patients who
completed the study visit. This will be an update of the data recorded from the hospital
admission. This data will comprise current HF symptomatology and status, current prescribed
medications, physiological and body composition measurements, and cardiovascular
examination findings. ECG findings, LVEF by echocardiography and blood test results will
also be presented.
5.2 Results
5.2.1 Composition of post-discharge cohort
Of 1003 patients enrolled in the study, 648 patients attended the BHF Glasgow Cardiovascular
Research Centre approximately 4-6 weeks following discharge from hospital. This represented
64.6% of the original hospitalised cohort. The reasons the remaining 35.4% failed to attend
were outlined in Figure 4.1 (page 136).
5.2.2 Demographics
The demographics of the patients who completed the study visit are displayed in Table 5-1.
Compared to the results for the overall hospitalised cohort, the post-discharge cohort
contained more men (58.2% versus 53.0%), the mean age was slightly younger (70.8 versus
73.0) and a smaller proportion of patients were over 75 years of age (35.8% versus 45.7%).
For those attending the study visit the average duration of hospitalisation was 2 days shorter.
Over 40% of patients completing the study visit had a previous diagnosis of HF, prior to
enrolment in this study. Only 6.8% of the post-discharge cohort been readmitted to hospital
with decompensated HF since the index admission.
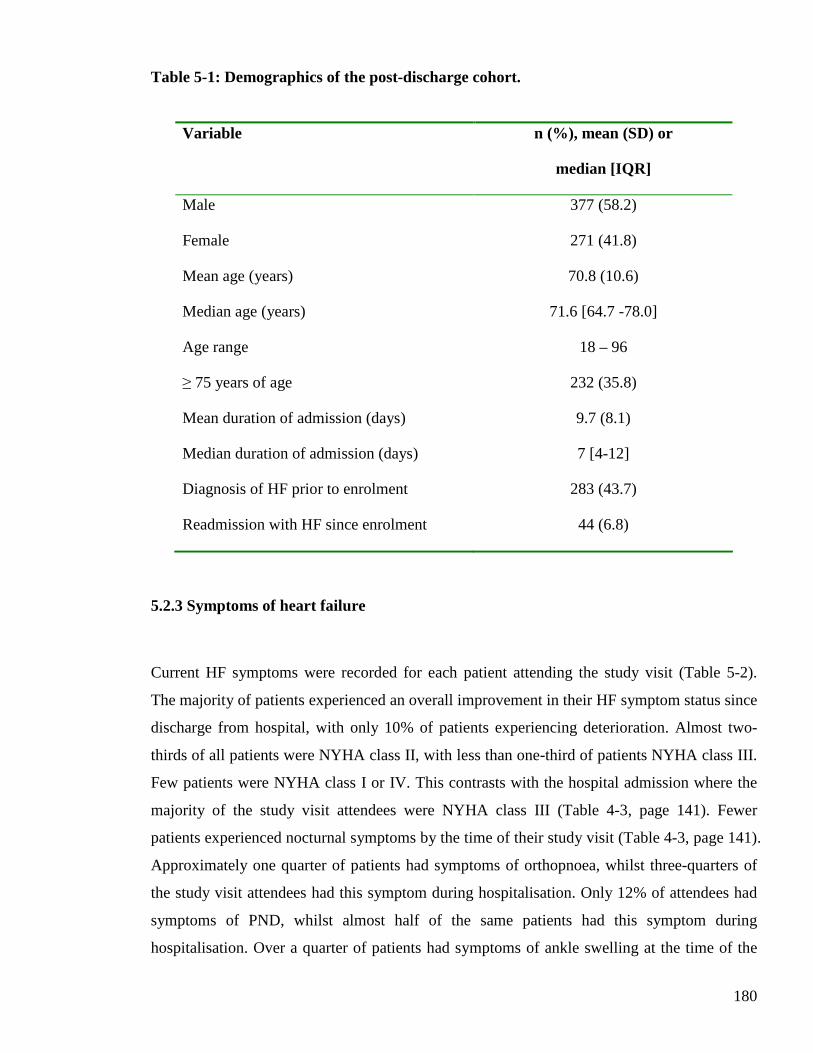
180
Table 5-1: Demographics of the post-discharge cohort.
Variable n (%), mean (SD) or
median [IQR]
Male 377 (58.2)
Female 271 (41.8)
Mean age (years) 70.8 (10.6)
Median age (years) 71.6 [64.7 -78.0]
Age range 18 – 96
≥ 75 years of age 232 (35.8)
Mean duration of admission (days) 9.7 (8.1)
Median duration of admission (days) 7 [4-12]
Diagnosis of HF prior to enrolment 283 (43.7)
Readmission with HF since enrolment 44 (6.8)
5.2.3 Symptoms of heart failure
Current HF symptoms were recorded for each patient attending the study visit (Table 5-2).
The majority of patients experienced an overall improvement in their HF symptom status since
discharge from hospital, with only 10% of patients experiencing deterioration. Almost two-
thirds of all patients were NYHA class II, with less than one-third of patients NYHA class III.
Few patients were NYHA class I or IV. This contrasts with the hospital admission where the
majority of the study visit attendees were NYHA class III (Table 4-3, page 141). Fewer
patients experienced nocturnal symptoms by the time of their study visit (Table 4-3, page 141).
Approximately one quarter of patients had symptoms of orthopnoea, whilst three-quarters of
the study visit attendees had this symptom during hospitalisation. Only 12% of attendees had
symptoms of PND, whilst almost half of the same patients had this symptom during
hospitalisation. Over a quarter of patients had symptoms of ankle swelling at the time of the
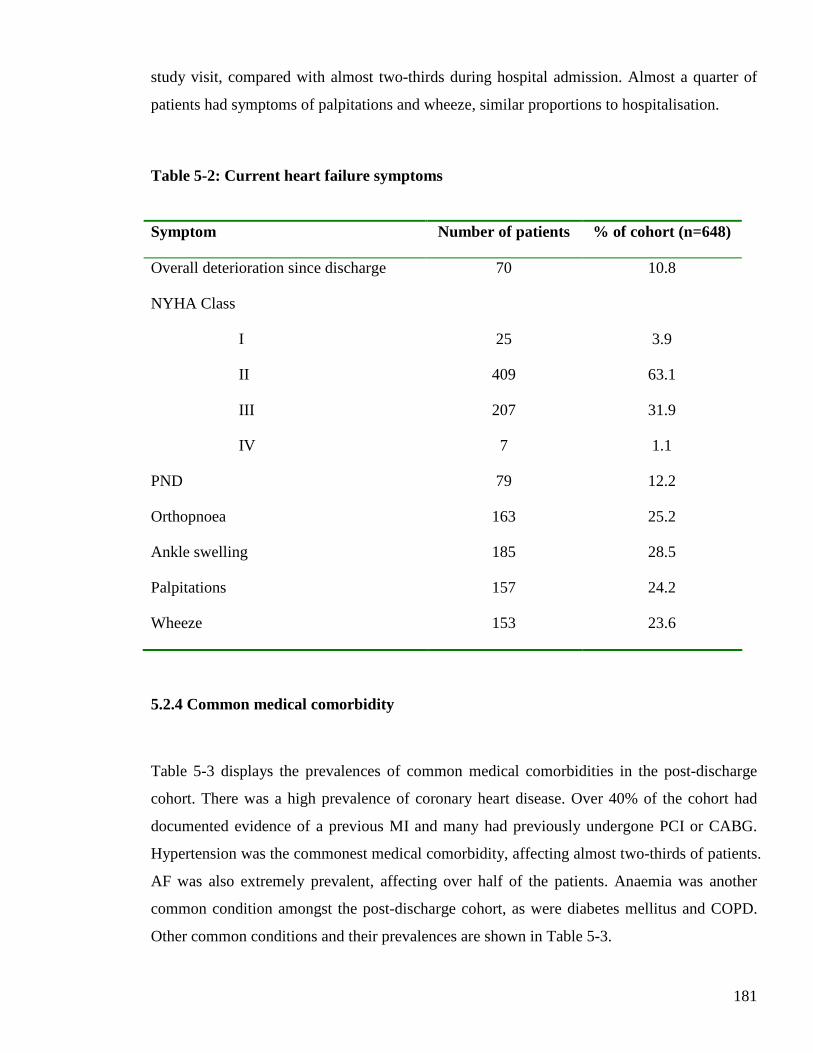
181
study visit, compared with almost two-thirds during hospital admission. Almost a quarter of
patients had symptoms of palpitations and wheeze, similar proportions to hospitalisation.
Table 5-2: Current heart failure symptoms
Symptom Number of patients % of cohort (n=648)
Overall deterioration since discharge 70 10.8
NYHA Class
I
II
III
IV
25
409
207
7
3.9
63.1
31.9
1.1
PND 79 12.2
Orthopnoea 163 25.2
Ankle swelling 185 28.5
Palpitations 157 24.2
Wheeze 153 23.6
5.2.4 Common medical comorbidity
Table 5-3 displays the prevalences of common medical comorbidities in the post-discharge
cohort. There was a high prevalence of coronary heart disease. Over 40% of the cohort had
documented evidence of a previous MI and many had previously undergone PCI or CABG.
Hypertension was the commonest medical comorbidity, affecting almost two-thirds of patients.
AF was also extremely prevalent, affecting over half of the patients. Anaemia was another
common condition amongst the post-discharge cohort, as were diabetes mellitus and COPD.
Other common conditions and their prevalences are shown in Table 5-3.
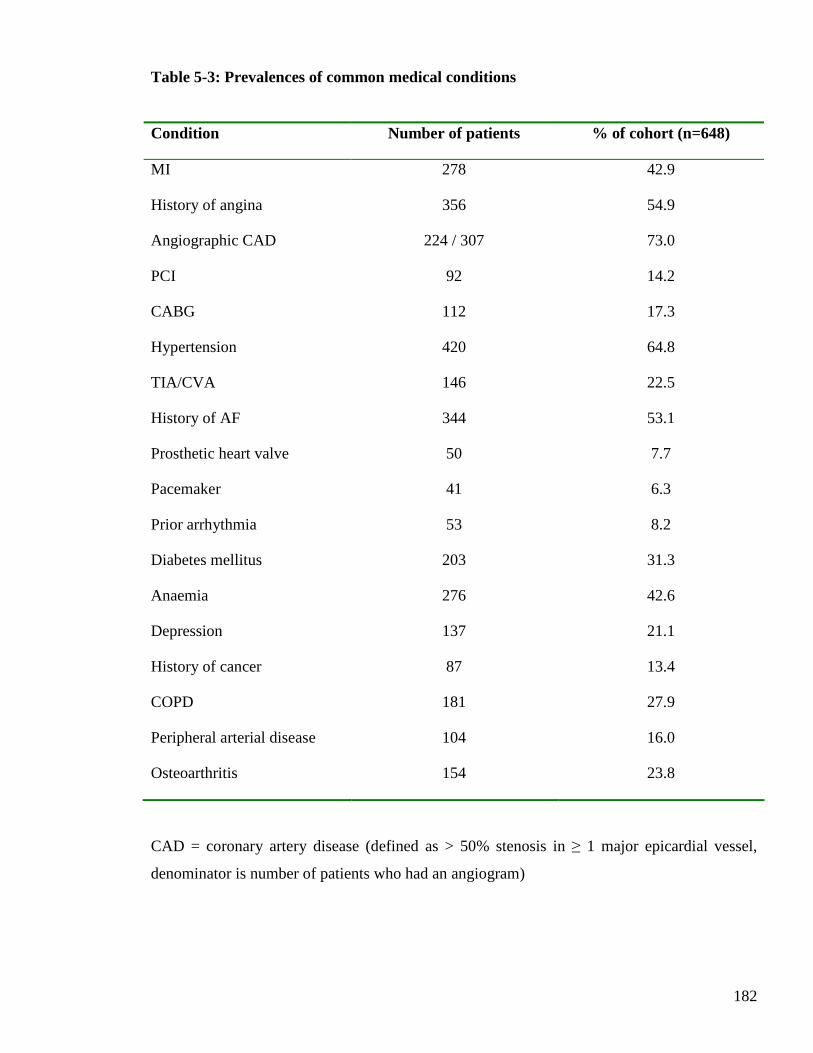
182
Table 5-3: Prevalences of common medical conditions
Condition Number of patients % of cohort (n=648)
MI 278 42.9
History of angina 356 54.9
Angiographic CAD 224 / 307 73.0
PCI 92 14.2
CABG 112 17.3
Hypertension 420 64.8
TIA/CVA 146 22.5
History of AF 344 53.1
Prosthetic heart valve 50 7.7
Pacemaker 41 6.3
Prior arrhythmia 53 8.2
Diabetes mellitus 203 31.3
Anaemia 276 42.6
Depression 137 21.1
History of cancer 87 13.4
COPD 181 27.9
Peripheral arterial disease 104 16.0
Osteoarthritis 154 23.8
CAD = coronary artery disease (defined as > 50% stenosis in ≥ 1 major epicardial vessel,
denominator is number of patients who had an angiogram)
183
5.2.5 Medications
Table 5-4 displays the frequencies of HF medication prescribing for patients attending the
study visit. The data are presented for the overall post-discharge cohort and dichotomised by
LVEF. This is because the evidence base for HF treatment is largely confined to HF-REF. The
significant differences in clinical characteristics, including medications, between the patients
with HF-REF and HF-PEF are described later in this chapter (section 5.2.12).
Almost all patients were prescribed diuretic therapy at the time of study visit, the
overwhelming majority being furosemide or an alternative loop diuretic. More than 70% of
patients with HF-REF were prescribed an ACE inhibitor, with almost 20% having this therapy
initiated since recruitment into the study. Over two-thirds of the post-discharge cohort with
HF-REF was prescribed a beta-blocker, with 17.5% having this therapy initiated since
recruitment into the study. ARB prescribing was less common, with few patients in the post-
discharge cohort having these drugs prescribed since recruitment. Similar proportions were
prescribed an aldosterone receptor blocker, the majority of which was initiated since
recruitment into the study. Of those with HF-REF, 60% were prescribed the combination of
either an ACE inhibitor or an ARB and a beta-blocker. Various combinations of the other HF
disease-modifying therapies (ACE inhibitor, beta-blocker, ARB and aldosterone blocker) were
prescribed in small proportions of the post-discharge cohort (Table 5-4). Proportionately more
patients with HF-PEF were prescribed digoxin, than patients with HF-REF.
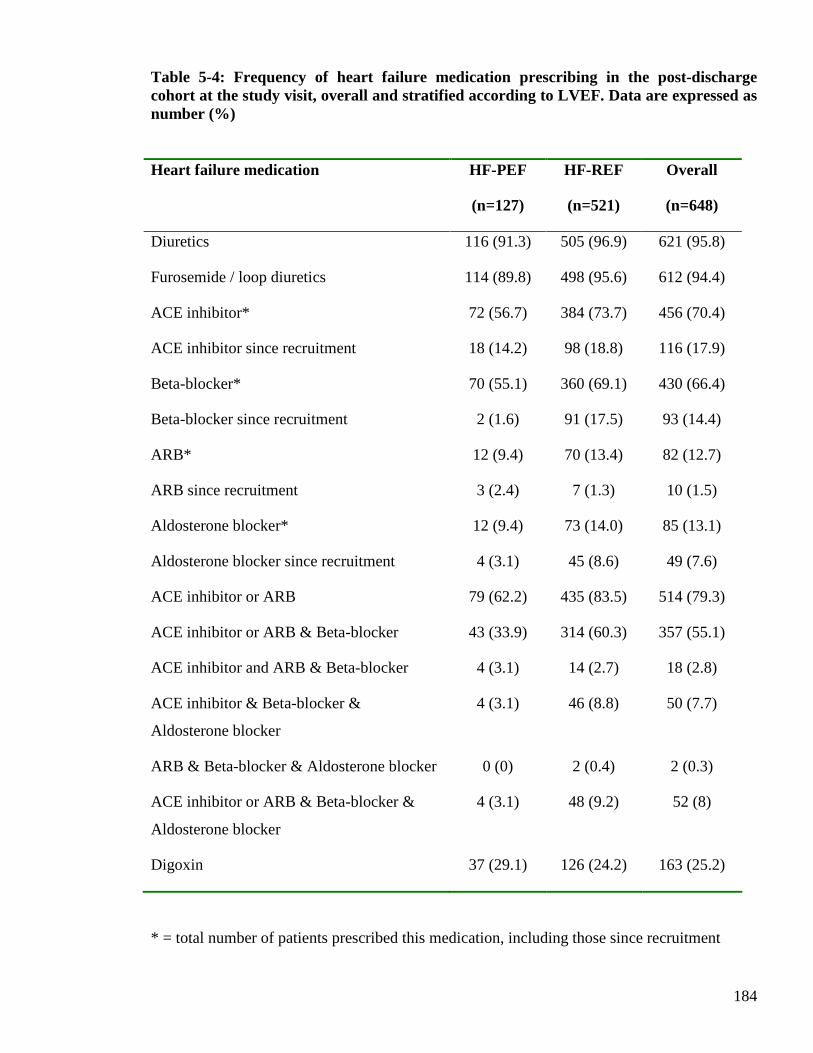
184
Table 5-4: Frequency of heart failure medication prescribing in the post-discharge cohort at the study visit, overall and stratified according to LVEF. Data are expressed as number (%)
Heart failure medication HF-PEF
(n=127)
HF-REF
(n=521)
Overall
(n=648)
Diuretics 116 (91.3) 505 (96.9) 621 (95.8)
Furosemide / loop diuretics 114 (89.8) 498 (95.6) 612 (94.4)
ACE inhibitor* 72 (56.7) 384 (73.7) 456 (70.4)
ACE inhibitor since recruitment 18 (14.2) 98 (18.8) 116 (17.9)
Beta-blocker* 70 (55.1) 360 (69.1) 430 (66.4)
Beta-blocker since recruitment 2 (1.6) 91 (17.5) 93 (14.4)
ARB* 12 (9.4) 70 (13.4) 82 (12.7)
ARB since recruitment 3 (2.4) 7 (1.3) 10 (1.5)
Aldosterone blocker* 12 (9.4) 73 (14.0) 85 (13.1)
Aldosterone blocker since recruitment 4 (3.1) 45 (8.6) 49 (7.6)
ACE inhibitor or ARB 79 (62.2) 435 (83.5) 514 (79.3)
ACE inhibitor or ARB & Beta-blocker 43 (33.9) 314 (60.3) 357 (55.1)
ACE inhibitor and ARB & Beta-blocker 4 (3.1) 14 (2.7) 18 (2.8)
ACE inhibitor & Beta-blocker &
Aldosterone blocker
4 (3.1) 46 (8.8) 50 (7.7)
ARB & Beta-blocker & Aldosterone blocker 0 (0) 2 (0.4) 2 (0.3)
ACE inhibitor or ARB & Beta-blocker &
Aldosterone blocker
4 (3.1) 48 (9.2) 52 (8)
Digoxin 37 (29.1) 126 (24.2) 163 (25.2)
* = total number of patients prescribed this medication, including those since recruitment
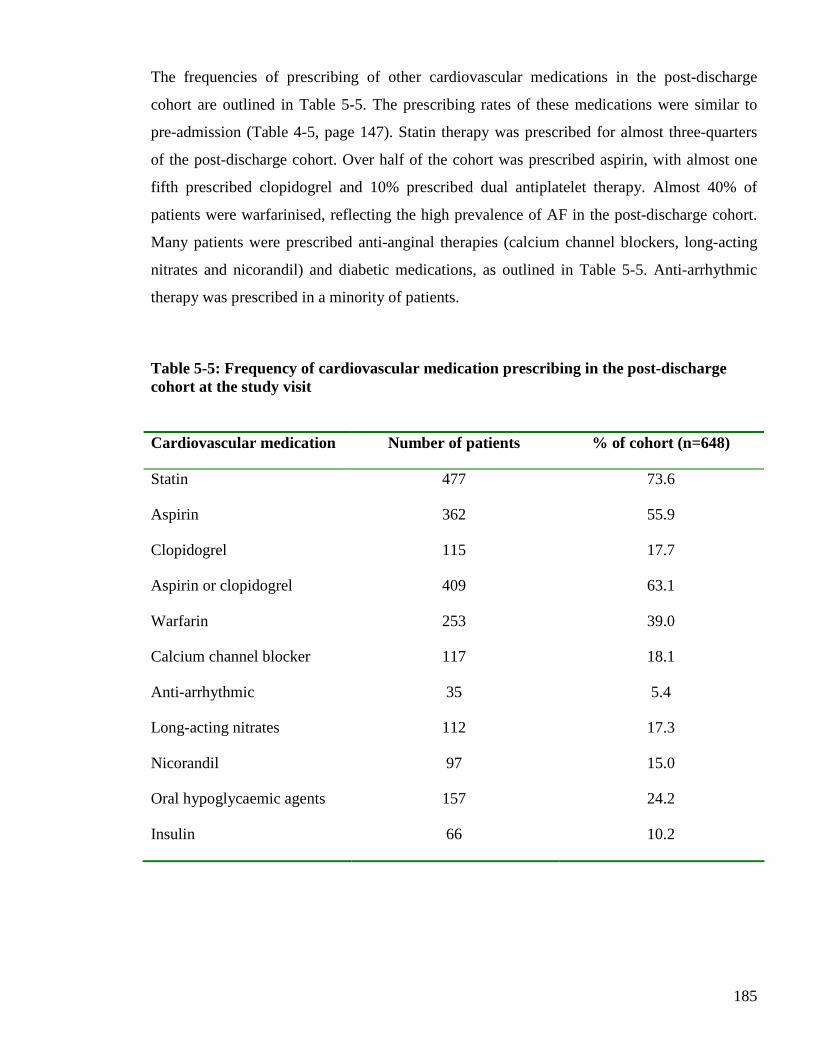
185
The frequencies of prescribing of other cardiovascular medications in the post-discharge
cohort are outlined in Table 5-5. The prescribing rates of these medications were similar to
pre-admission (Table 4-5, page 147). Statin therapy was prescribed for almost three-quarters
of the post-discharge cohort. Over half of the cohort was prescribed aspirin, with almost one
fifth prescribed clopidogrel and 10% prescribed dual antiplatelet therapy. Almost 40% of
patients were warfarinised, reflecting the high prevalence of AF in the post-discharge cohort.
Many patients were prescribed anti-anginal therapies (calcium channel blockers, long-acting
nitrates and nicorandil) and diabetic medications, as outlined in Table 5-5. Anti-arrhythmic
therapy was prescribed in a minority of patients.
Table 5-5: Frequency of cardiovascular medication prescribing in the post-discharge cohort at the study visit
Cardiovascular medication Number of patients % of cohort (n=648)
Statin 477 73.6
Aspirin 362 55.9
Clopidogrel 115 17.7
Aspirin or clopidogrel 409 63.1
Warfarin 253 39.0
Calcium channel blocker 117 18.1
Anti-arrhythmic 35 5.4
Long-acting nitrates 112 17.3
Nicorandil 97 15.0
Oral hypoglycaemic agents 157 24.2
Insulin 66 10.2
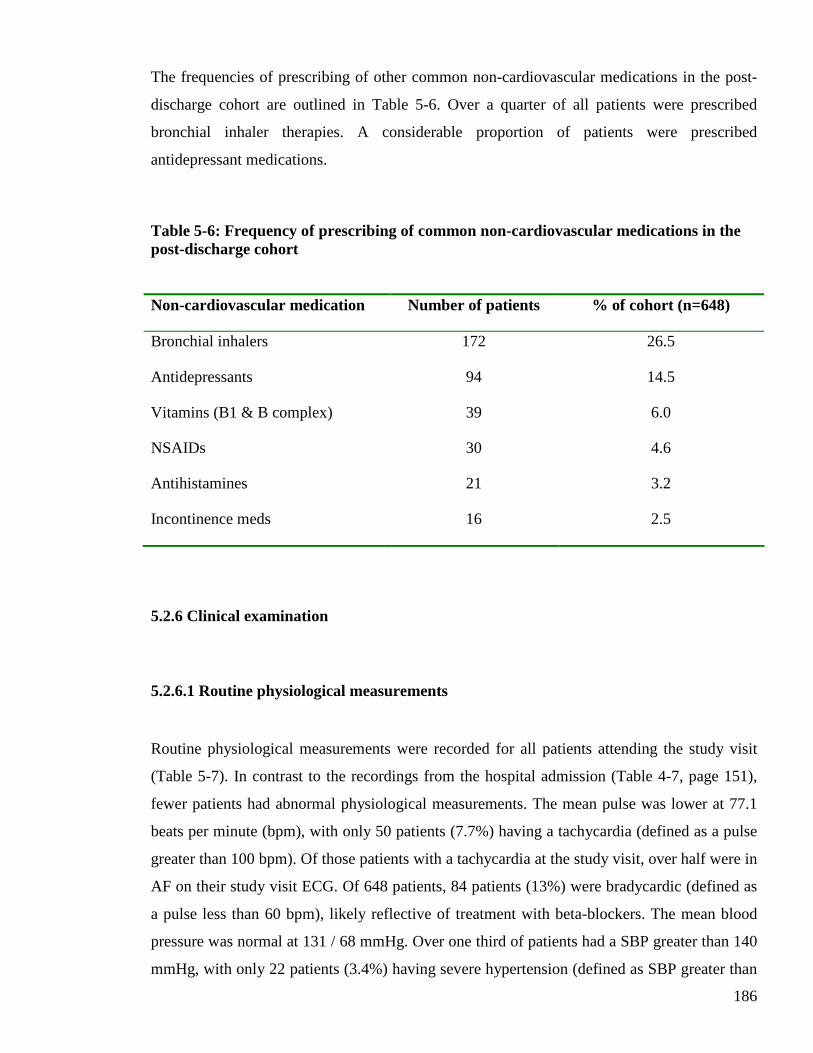
186
The frequencies of prescribing of other common non-cardiovascular medications in the post-
discharge cohort are outlined in Table 5-6. Over a quarter of all patients were prescribed
bronchial inhaler therapies. A considerable proportion of patients were prescribed
antidepressant medications.
Table 5-6: Frequency of prescribing of common non-cardiovascular medications in the post-discharge cohort
Non-cardiovascular medication Number of patients % of cohort (n=648)
Bronchial inhalers 172 26.5
Antidepressants 94 14.5
Vitamins (B1 & B complex) 39 6.0
NSAIDs 30 4.6
Antihistamines 21 3.2
Incontinence meds 16 2.5
5.2.6 Clinical examination
5.2.6.1 Routine physiological measurements
Routine physiological measurements were recorded for all patients attending the study visit
(Table 5-7). In contrast to the recordings from the hospital admission (Table 4-7, page 151),
fewer patients had abnormal physiological measurements. The mean pulse was lower at 77.1
beats per minute (bpm), with only 50 patients (7.7%) having a tachycardia (defined as a pulse
greater than 100 bpm). Of those patients with a tachycardia at the study visit, over half were in
AF on their study visit ECG. Of 648 patients, 84 patients (13%) were bradycardic (defined as
a pulse less than 60 bpm), likely reflective of treatment with beta-blockers. The mean blood
pressure was normal at 131 / 68 mmHg. Over one third of patients had a SBP greater than 140
mmHg, with only 22 patients (3.4%) having severe hypertension (defined as SBP greater than
187
180 mmHg). During hospitalisation, 45 study visit attendees (6.9%) had severe hypertension
(Table 4-7, page 151). Only 43 patients (6.6%) had systolic hypotension (defined as SBP less
than 90 mmHg) at the study visit. Only 34 patients (5.2%) met criteria for diastolic
hypertension (defined as DBP greater than 90 mmHg), in contrast to a quarter of the same
patients during hospitalisation (Table 4-7, page 154). A significant proportion of the cohort
(42.6%) had diastolic hypotension (defined as DBP less than 60 mmHg). The mean
temperature, respiratory rate and SpO2 were normal.
5.2.6.2 Body mass index and waist circumference measurements
Height, waist and weight measurements were recorded for all patients attending the study visit.
BMI was calculated from these measurements. The results are displayed in Table 5-8. Over
three-quarters of the post-discharge cohort lost weight from the hospital admission (Table 4-8,
page 154) to the study visit. These declines in weight are most likely due to successful diuresis
and establishing euvolaemic status after the decompensated episode in hospital. Despite this,
most of the post-discharge patients were still overweight with an average BMI of 28.7 kg/m2.
Over two-thirds of all patients were either overweight or obese (defined as BMI 25-30 kg/m2
or >30 kg/m2, respectively). Less than one-third of the post-discharge cohort was normal
weight (defined as BMI 18.5-24.9 kg/m2). Only 16 patients (2.5%) were underweight (defined
as BMI < 18.5 kg/m2). Over half of patients had a waist circumference exceeding the sex-
specific recommendations (defined as 94–102 cm in men and 80–88 cm in women). More than
one-quarter of patients had a waist circumference below the sex-specific recommendations
(defined as < 94 cm in men and < 80 in women).
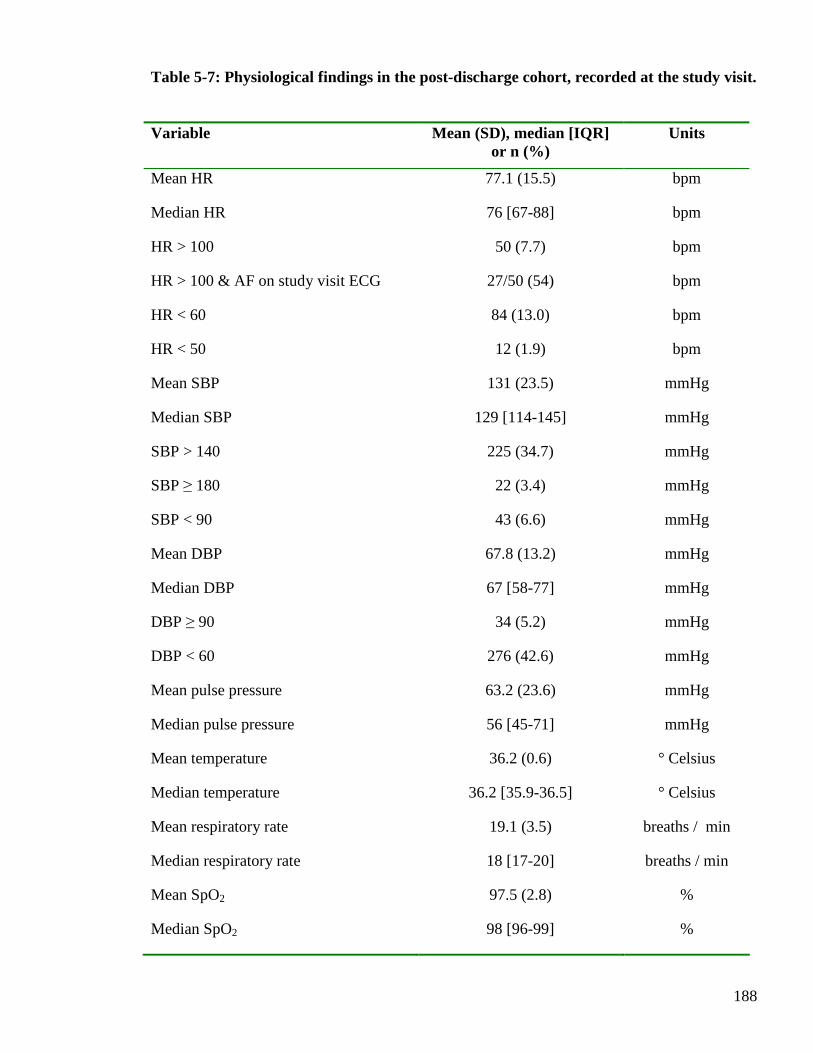
188
Table 5-7: Physiological findings in the post-discharge cohort, recorded at the study visit.
Variable Mean (SD), median [IQR] or n (%)
Units
Mean HR 77.1 (15.5) bpm
Median HR 76 [67-88] bpm
HR > 100 50 (7.7) bpm
HR > 100 & AF on study visit ECG 27/50 (54) bpm
HR < 60 84 (13.0) bpm
HR < 50 12 (1.9) bpm
Mean SBP 131 (23.5) mmHg
Median SBP 129 [114-145] mmHg
SBP > 140 225 (34.7) mmHg
SBP ≥ 180 22 (3.4) mmHg
SBP < 90 43 (6.6) mmHg
Mean DBP 67.8 (13.2) mmHg
Median DBP 67 [58-77] mmHg
DBP ≥ 90 34 (5.2) mmHg
DBP < 60 276 (42.6) mmHg
Mean pulse pressure 63.2 (23.6) mmHg
Median pulse pressure 56 [45-71] mmHg
Mean temperature 36.2 (0.6) ° Celsius
Median temperature 36.2 [35.9-36.5] ° Celsius
Mean respiratory rate 19.1 (3.5) breaths / min
Median respiratory rate 18 [17-20] breaths / min
Mean SpO2 97.5 (2.8) %
Median SpO2 98 [96-99] %
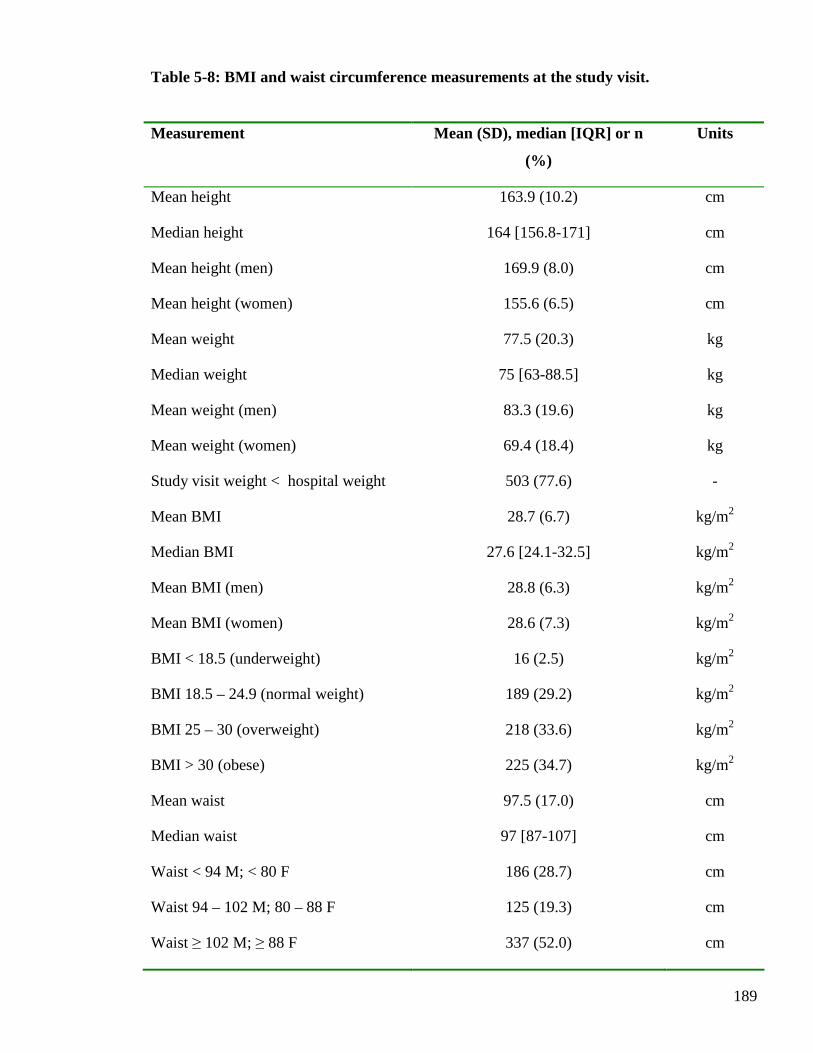
189
Table 5-8: BMI and waist circumference measurements at the study visit.
Measurement Mean (SD), median [IQR] or n
(%)
Units
Mean height 163.9 (10.2) cm
Median height 164 [156.8-171] cm
Mean height (men) 169.9 (8.0) cm
Mean height (women) 155.6 (6.5) cm
Mean weight 77.5 (20.3) kg
Median weight 75 [63-88.5] kg
Mean weight (men) 83.3 (19.6) kg
Mean weight (women) 69.4 (18.4) kg
Study visit weight < hospital weight 503 (77.6) -
Mean BMI 28.7 (6.7) kg/m2
Median BMI 27.6 [24.1-32.5] kg/m2
Mean BMI (men) 28.8 (6.3) kg/m2
Mean BMI (women) 28.6 (7.3) kg/m2
BMI < 18.5 (underweight) 16 (2.5) kg/m2
BMI 18.5 – 24.9 (normal weight) 189 (29.2) kg/m2
BMI 25 – 30 (overweight) 218 (33.6) kg/m2
BMI > 30 (obese) 225 (34.7) kg/m2
Mean waist 97.5 (17.0) cm
Median waist 97 [87-107] cm
Waist < 94 M; < 80 F 186 (28.7) cm
Waist 94 – 102 M; 80 – 88 F 125 (19.3) cm
Waist ≥ 102 M; ≥ 88 F 337 (52.0) cm
190
5.2.6.3 Cardiovascular examination signs
A full cardiovascular examination was performed for all patients attending the study visit
(Table 5-9). Few patients had a raised JVP, an expected finding in a cohort of patients with
stable HF. Three quarters of patients had palpable apices and over a third of these were
displaced. Detection of a third heart sound was less common at the study visit than during the
hospital admission for the post-discharge cohort (Table 4-11, page 158), also an expected
finding in a cohort of patients with stable HF. Only a quarter of the post-discharge cohort had
pulmonary crackles on examination, the vast majority of which were confined to the lung
bases. More than 90% of the post-discharge cohort had at least basal pulmonary crackles on
admission to hospital (Table 4-11, page 158). Few patients had clinical signs of a pleural
effusion (uni- or bilateral) at the study visit. Over a third of the post-discharge cohort had
ankle oedema, with few patients having oedema extending beyond the ankles. A significant
proportion of the post-discharge cohort had complete resolution of peripheral oedema, by the
time of their study visit. Few patients had clinical evidence of ascites at the study visit.
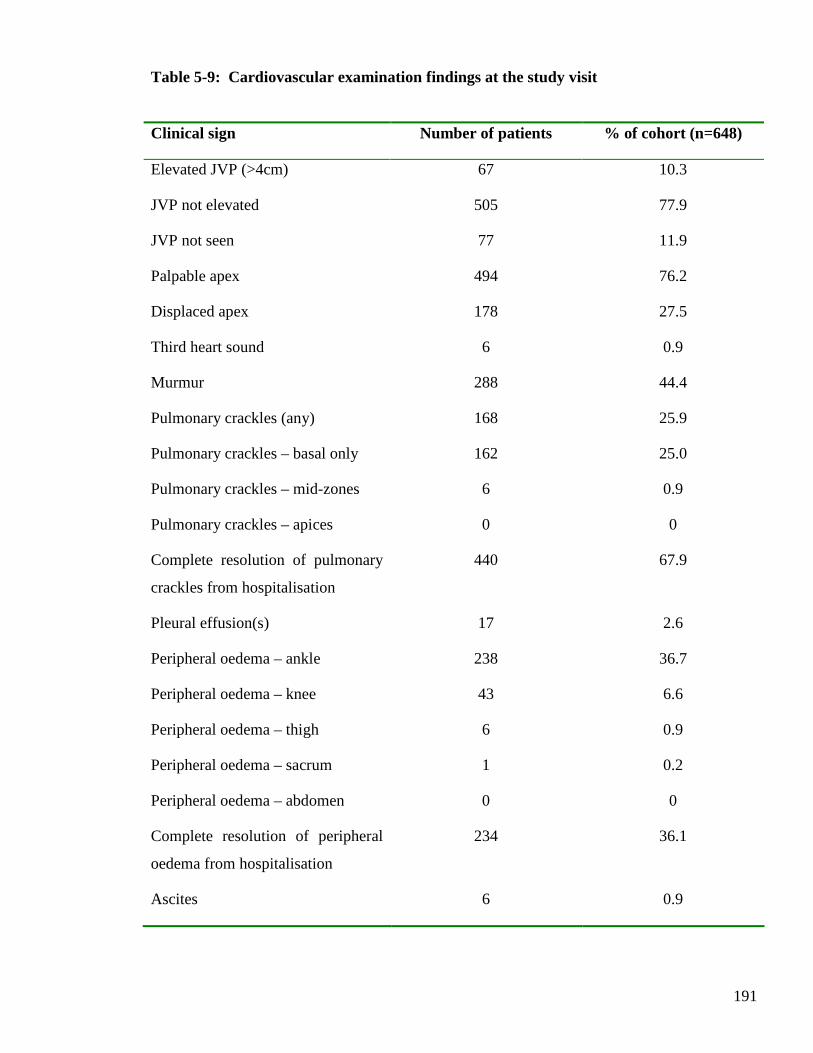
191
Table 5-9: Cardiovascular examination findings at the study visit
Clinical sign Number of patients % of cohort (n=648)
Elevated JVP (>4cm) 67 10.3
JVP not elevated 505 77.9
JVP not seen 77 11.9
Palpable apex 494 76.2
Displaced apex 178 27.5
Third heart sound 6 0.9
Murmur 288 44.4
Pulmonary crackles (any) 168 25.9
Pulmonary crackles – basal only 162 25.0
Pulmonary crackles – mid-zones 6 0.9
Pulmonary crackles – apices 0 0
Complete resolution of pulmonary
crackles from hospitalisation
440 67.9
Pleural effusion(s) 17 2.6
Peripheral oedema – ankle 238 36.7
Peripheral oedema – knee 43 6.6
Peripheral oedema – thigh 6 0.9
Peripheral oedema – sacrum 1 0.2
Peripheral oedema – abdomen 0 0
Complete resolution of peripheral
oedema from hospitalisation
234 36.1
Ascites 6 0.9
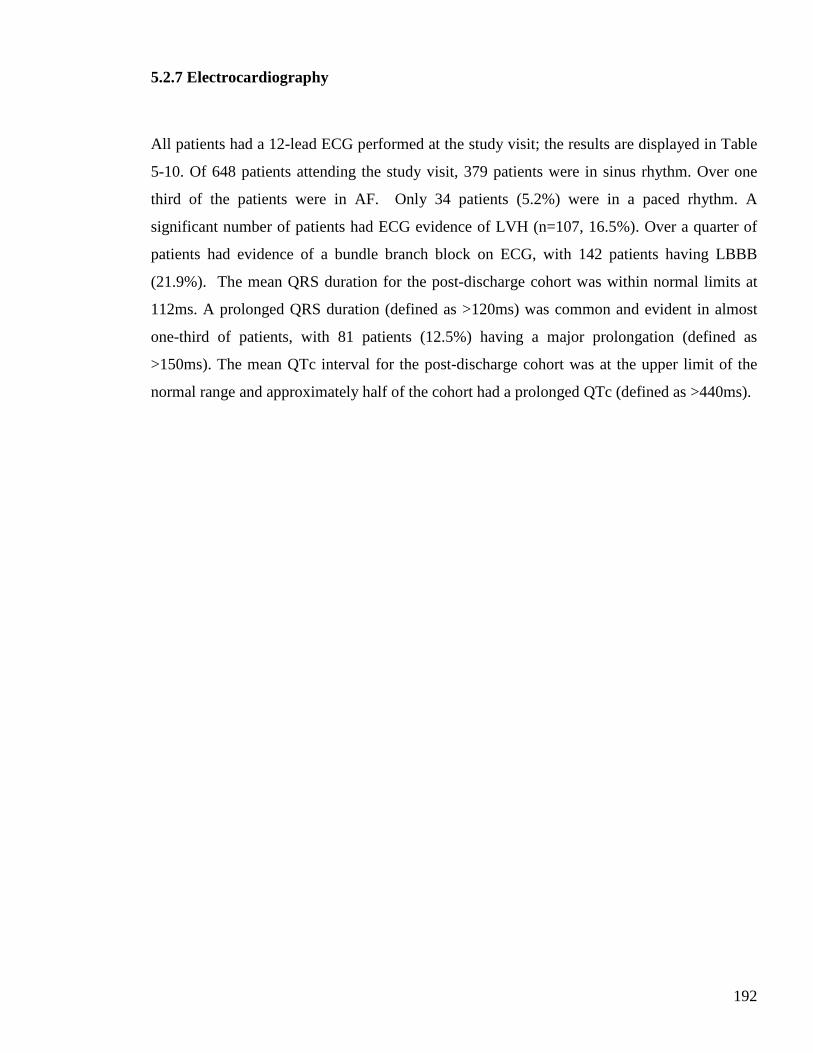
192
5.2.7 Electrocardiography
All patients had a 12-lead ECG performed at the study visit; the results are displayed in Table
5-10. Of 648 patients attending the study visit, 379 patients were in sinus rhythm. Over one
third of the patients were in AF. Only 34 patients (5.2%) were in a paced rhythm. A
significant number of patients had ECG evidence of LVH (n=107, 16.5%). Over a quarter of
patients had evidence of a bundle branch block on ECG, with 142 patients having LBBB
(21.9%). The mean QRS duration for the post-discharge cohort was within normal limits at
112ms. A prolonged QRS duration (defined as >120ms) was common and evident in almost
one-third of patients, with 81 patients (12.5%) having a major prolongation (defined as
>150ms). The mean QTc interval for the post-discharge cohort was at the upper limit of the
normal range and approximately half of the cohort had a prolonged QTc (defined as >440ms).
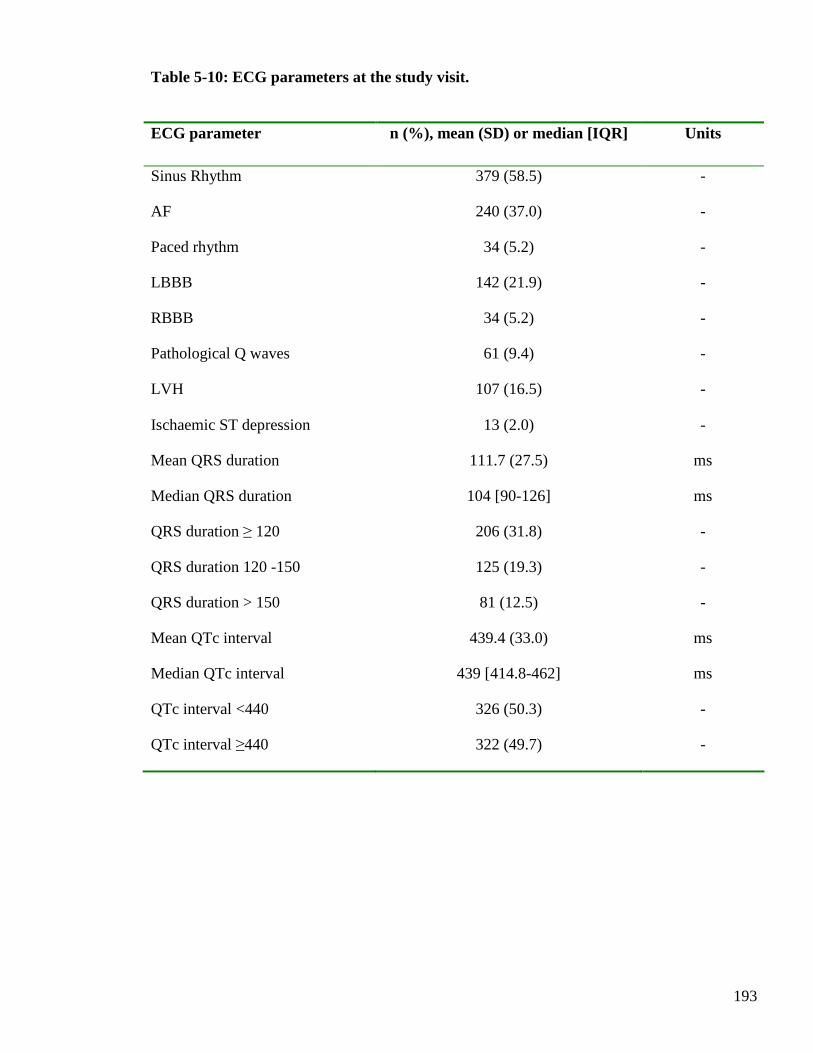
193
Table 5-10: ECG parameters at the study visit.
ECG parameter n (%), mean (SD) or median [IQR] Units
Sinus Rhythm 379 (58.5) -
AF 240 (37.0) -
Paced rhythm 34 (5.2) -
LBBB 142 (21.9) -
RBBB 34 (5.2) -
Pathological Q waves 61 (9.4) -
LVH 107 (16.5) -
Ischaemic ST depression 13 (2.0) -
Mean QRS duration 111.7 (27.5) ms
Median QRS duration 104 [90-126] ms
QRS duration ≥ 120 206 (31.8) -
QRS duration 120 -150 125 (19.3) -
QRS duration > 150 81 (12.5) -
Mean QTc interval 439.4 (33.0) ms
Median QTc interval 439 [414.8-462] ms
QTc interval <440 326 (50.3) -
QTc interval ≥440 322 (49.7) -
194
5.2.8 Ejection fraction by echocardiography
All patients had a focused echocardiogram performed at the study visit to calculate LVEF. Of
648 patients attending the study visit, 622 patients (96.0%) had echocardiographic images of
satisfactory quality to enable LVEF to be calculated using Simpson’s biplane method. The
mean (SD) LVEF was 40.2% (12.2). The median [IQR] LVEF was also 40% [32-48]. The
minimum LVEF was 11% and the maximum 70%. The distribution of LVEF is shown in
Figure 5-1. One fifth of the post-discharge cohort had severe LVSD (defined as LVEF <30%).
Approximately one fifth had preserved left ventricular systolic function (defined as LVEF ≥
50%). For the 26 patients whose echocardiographic images were inadequate to calculate an
ejection fraction by Simpson’s method, an estimate of whether left ventricular systolic
function was reduced or preserved was made. Of these patients with an incalculable LVEF by
Simpson’s method, 18 patients were estimated to have reduced left ventricular systolic
function.
Figure 5-1: Distribution of LVEF at the study visit for 622 patients with calculable EF by Simpson’s biplane method
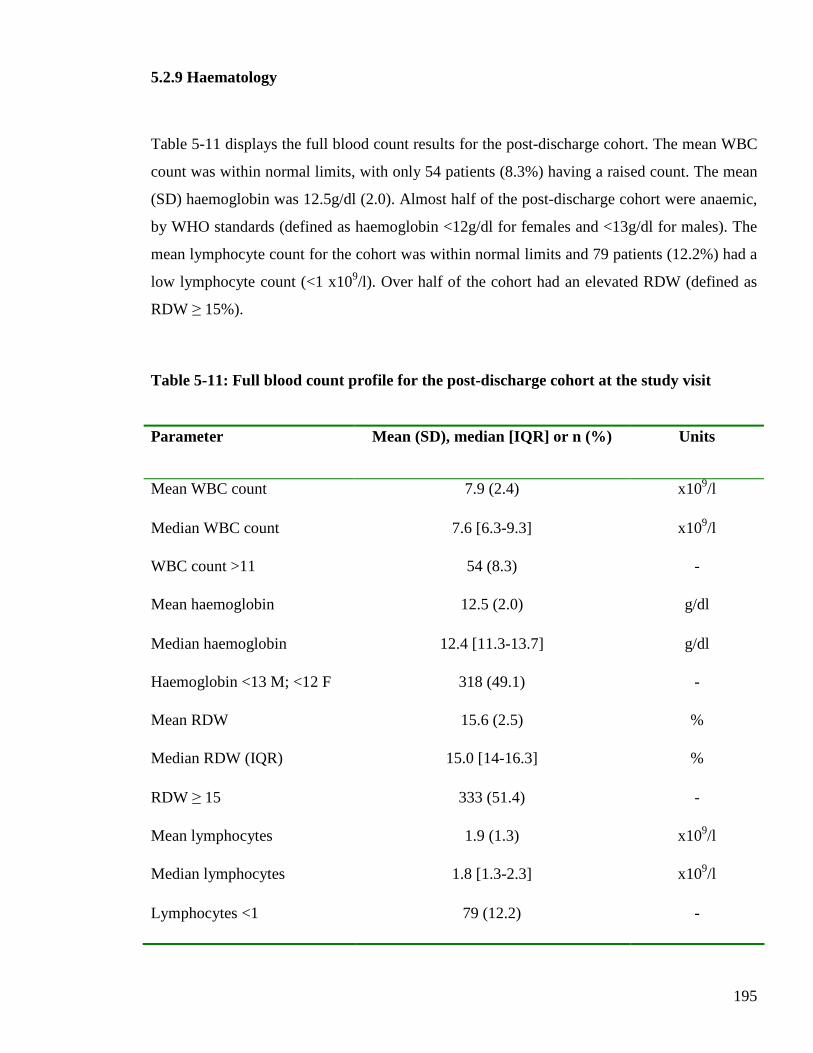
195
5.2.9 Haematology
Table 5-11 displays the full blood count results for the post-discharge cohort. The mean WBC
count was within normal limits, with only 54 patients (8.3%) having a raised count. The mean
(SD) haemoglobin was 12.5g/dl (2.0). Almost half of the post-discharge cohort were anaemic,
by WHO standards (defined as haemoglobin <12g/dl for females and <13g/dl for males). The
mean lymphocyte count for the cohort was within normal limits and 79 patients (12.2%) had a
low lymphocyte count (<1 x10⁹/l). Over half of the cohort had an elevated RDW (defined as
RDW ≥ 15%).
Table 5-11: Full blood count profile for the post-discharge cohort at the study visit
Parameter Mean (SD), median [IQR] or n (%) Units
Mean WBC count 7.9 (2.4) x109/l
Median WBC count 7.6 [6.3-9.3] x109/l
WBC count >11 54 (8.3) -
Mean haemoglobin 12.5 (2.0) g/dl
Median haemoglobin 12.4 [11.3-13.7] g/dl
Haemoglobin <13 M; <12 F 318 (49.1) -
Mean RDW 15.6 (2.5) %
Median RDW (IQR) 15.0 [14-16.3] %
RDW ≥ 15 333 (51.4) -
Mean lymphocytes 1.9 (1.3) x109/l
Median lymphocytes 1.8 [1.3-2.3] x109/l
Lymphocytes <1 79 (12.2) -
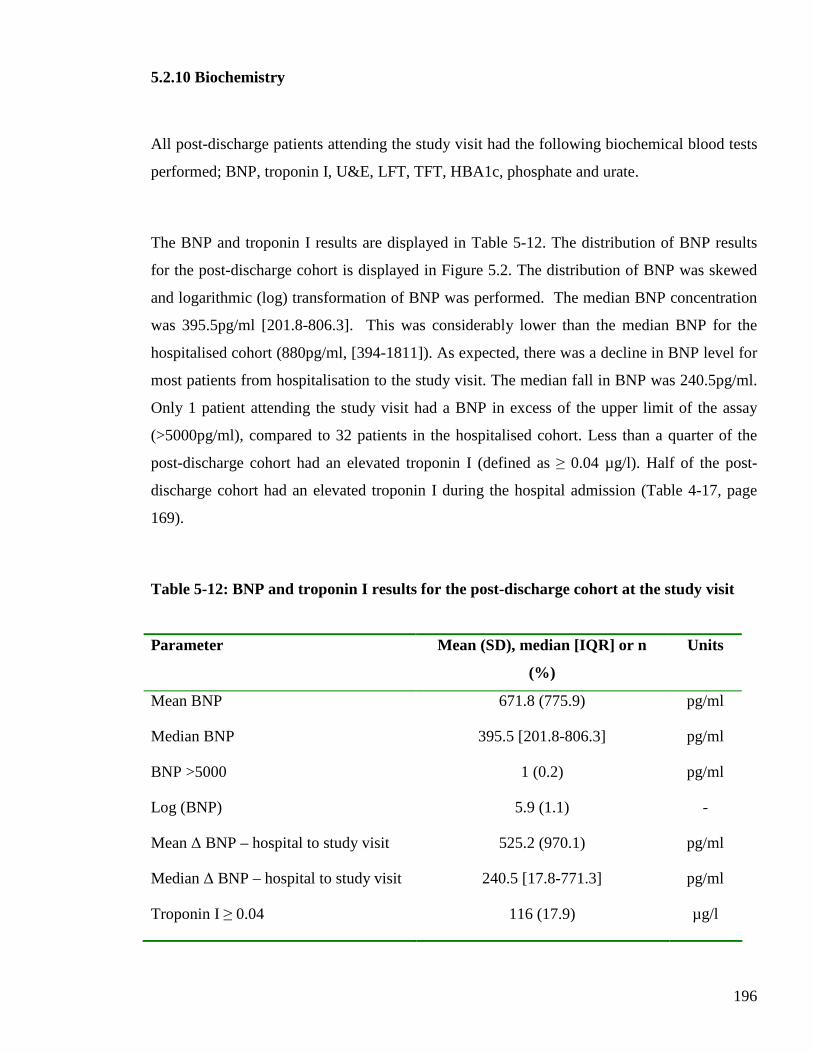
196
5.2.10 Biochemistry
All post-discharge patients attending the study visit had the following biochemical blood tests
performed; BNP, troponin I, U&E, LFT, TFT, HBA1c, phosphate and urate.
The BNP and troponin I results are displayed in Table 5-12. The distribution of BNP results
for the post-discharge cohort is displayed in Figure 5.2. The distribution of BNP was skewed
and logarithmic (log) transformation of BNP was performed. The median BNP concentration
was 395.5pg/ml [201.8-806.3]. This was considerably lower than the median BNP for the
hospitalised cohort (880pg/ml, [394-1811]). As expected, there was a decline in BNP level for
most patients from hospitalisation to the study visit. The median fall in BNP was 240.5pg/ml.
Only 1 patient attending the study visit had a BNP in excess of the upper limit of the assay
(>5000pg/ml), compared to 32 patients in the hospitalised cohort. Less than a quarter of the
post-discharge cohort had an elevated troponin I (defined as ≥ 0.04 µg/l). Half of the post-
discharge cohort had an elevated troponin I during the hospital admission (Table 4-17, page
169).
Table 5-12: BNP and troponin I results for the post-discharge cohort at the study visit
Parameter Mean (SD), median [IQR] or n
(%)
Units
Mean BNP 671.8 (775.9) pg/ml
Median BNP 395.5 [201.8-806.3] pg/ml
BNP >5000 1 (0.2) pg/ml
Log (BNP) 5.9 (1.1) -
Mean ∆ BNP – hospital to study visit 525.2 (970.1) pg/ml
Median ∆ BNP – hospital to study visit 240.5 [17.8-771.3] pg/ml
Troponin I ≥ 0.04 116 (17.9) µg/l
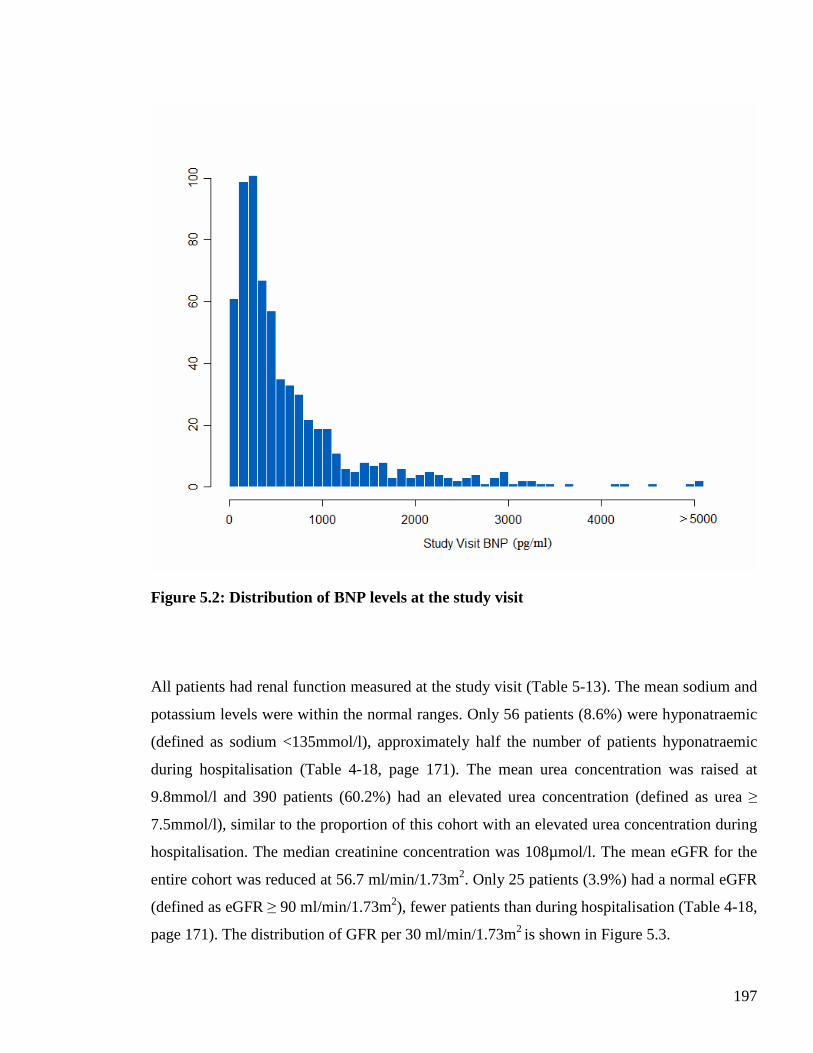
197
Figure 5.2: Distribution of BNP levels at the study visit
All patients had renal function measured at the study visit (Table 5-13). The mean sodium and
potassium levels were within the normal ranges. Only 56 patients (8.6%) were hyponatraemic
(defined as sodium <135mmol/l), approximately half the number of patients hyponatraemic
during hospitalisation (Table 4-18, page 171). The mean urea concentration was raised at
9.8mmol/l and 390 patients (60.2%) had an elevated urea concentration (defined as urea ≥
7.5mmol/l), similar to the proportion of this cohort with an elevated urea concentration during
hospitalisation. The median creatinine concentration was 108µmol/l. The mean eGFR for the
entire cohort was reduced at 56.7 ml/min/1.73m2. Only 25 patients (3.9%) had a normal eGFR
(defined as eGFR ≥ 90 ml/min/1.73m2), fewer patients than during hospitalisation (Table 4-18,
page 171). The distribution of GFR per 30 ml/min/1.73m2 is shown in Figure 5.3.
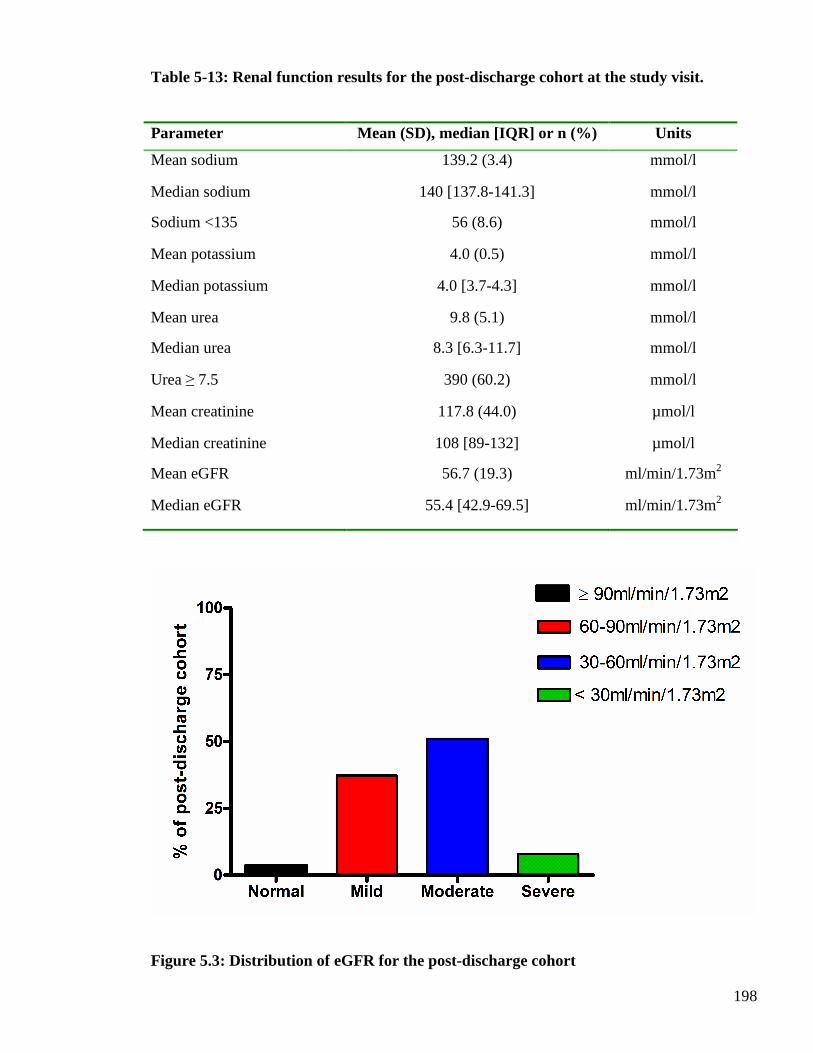
198
Table 5-13: Renal function results for the post-discharge cohort at the study visit.
Parameter Mean (SD), median [IQR] or n (%) Units
Mean sodium 139.2 (3.4) mmol/l
Median sodium 140 [137.8-141.3] mmol/l
Sodium <135 56 (8.6) mmol/l
Mean potassium 4.0 (0.5) mmol/l
Median potassium 4.0 [3.7-4.3] mmol/l
Mean urea 9.8 (5.1) mmol/l
Median urea 8.3 [6.3-11.7] mmol/l
Urea ≥ 7.5 390 (60.2) mmol/l
Mean creatinine 117.8 (44.0) µmol/l
Median creatinine 108 [89-132] µmol/l
Mean eGFR 56.7 (19.3) ml/min/1.73m2
Median eGFR 55.4 [42.9-69.5] ml/min/1.73m2
Figure 5.3: Distribution of eGFR for the post-discharge cohort
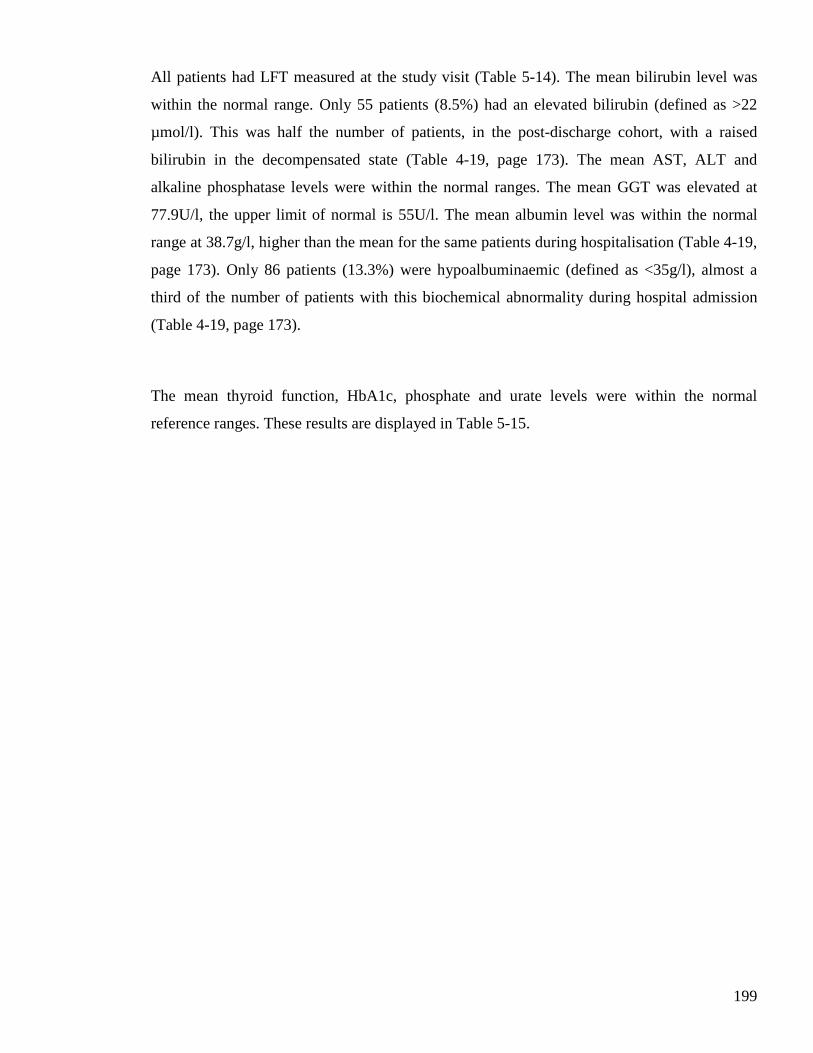
199
All patients had LFT measured at the study visit (Table 5-14). The mean bilirubin level was
within the normal range. Only 55 patients (8.5%) had an elevated bilirubin (defined as >22
µmol/l). This was half the number of patients, in the post-discharge cohort, with a raised
bilirubin in the decompensated state (Table 4-19, page 173). The mean AST, ALT and
alkaline phosphatase levels were within the normal ranges. The mean GGT was elevated at
77.9U/l, the upper limit of normal is 55U/l. The mean albumin level was within the normal
range at 38.7g/l, higher than the mean for the same patients during hospitalisation (Table 4-19,
page 173). Only 86 patients (13.3%) were hypoalbuminaemic (defined as <35g/l), almost a
third of the number of patients with this biochemical abnormality during hospital admission
(Table 4-19, page 173).
The mean thyroid function, HbA1c, phosphate and urate levels were within the normal
reference ranges. These results are displayed in Table 5-15.
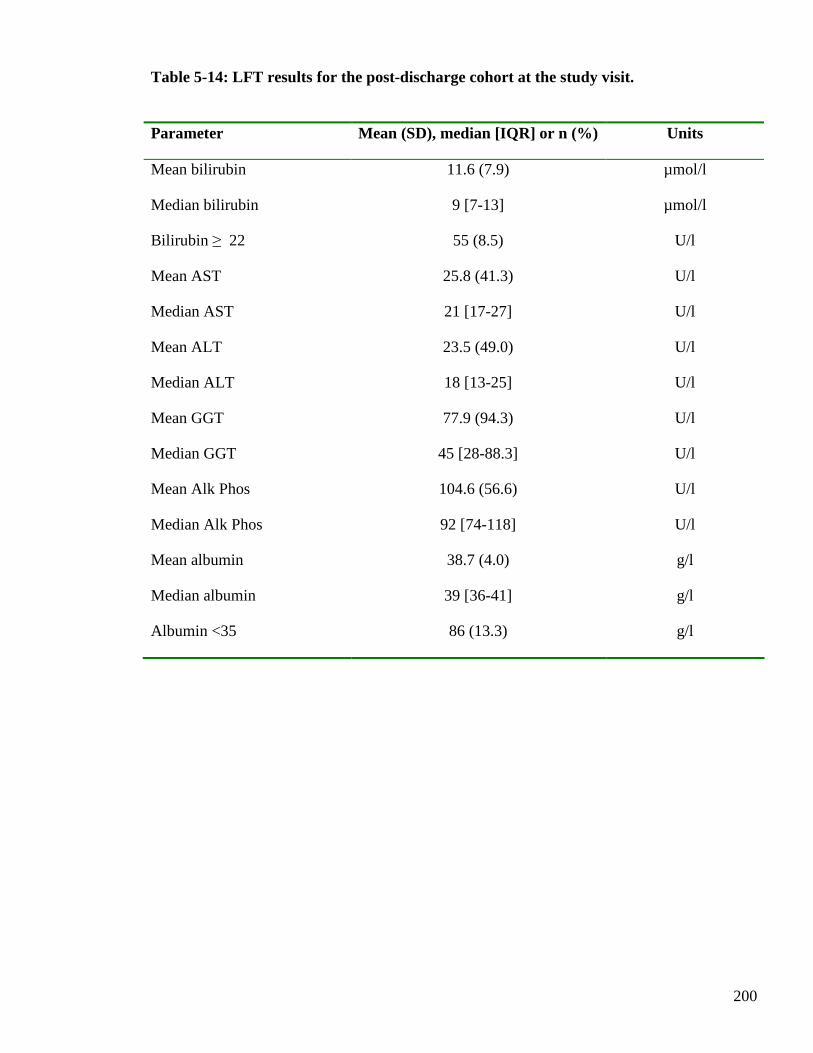
200
Table 5-14: LFT results for the post-discharge cohort at the study visit.
Parameter Mean (SD), median [IQR] or n (%) Units
Mean bilirubin 11.6 (7.9) µmol/l
Median bilirubin 9 [7-13] µmol/l
Bilirubin ≥ 22 55 (8.5) U/l
Mean AST 25.8 (41.3) U/l
Median AST 21 [17-27] U/l
Mean ALT 23.5 (49.0) U/l
Median ALT 18 [13-25] U/l
Mean GGT 77.9 (94.3) U/l
Median GGT 45 [28-88.3] U/l
Mean Alk Phos 104.6 (56.6) U/l
Median Alk Phos 92 [74-118] U/l
Mean albumin 38.7 (4.0) g/l
Median albumin 39 [36-41] g/l
Albumin <35 86 (13.3) g/l
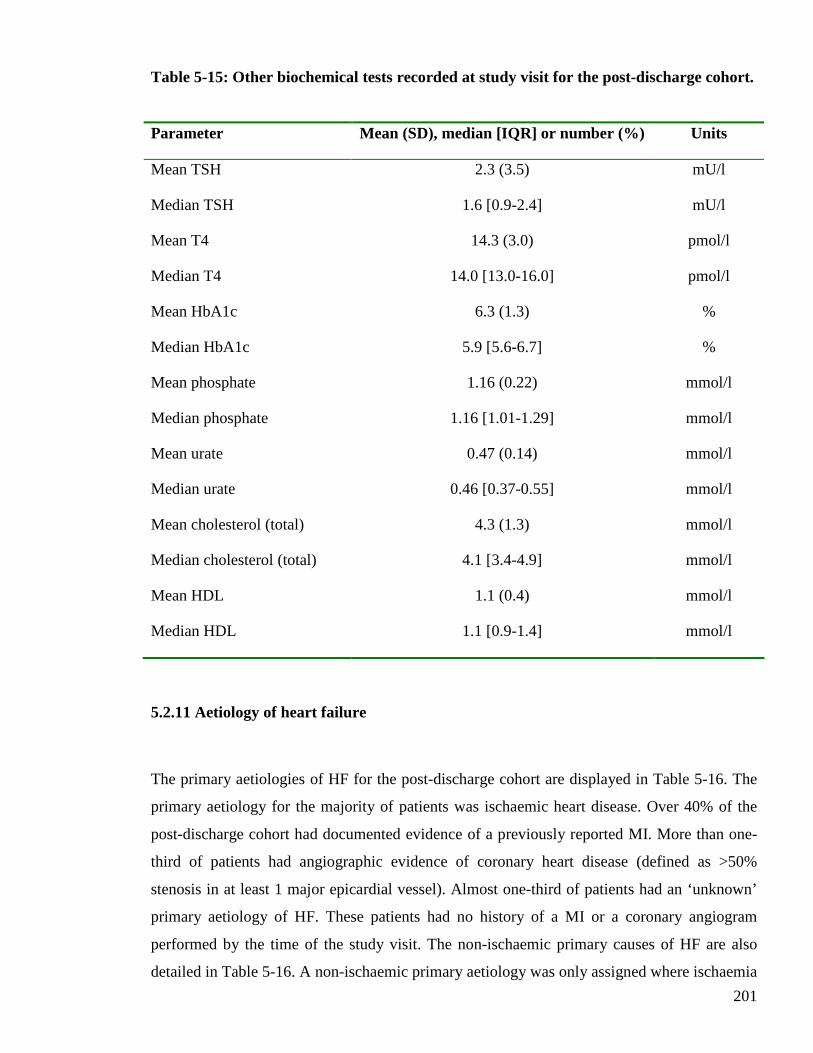
201
Table 5-15: Other biochemical tests recorded at study visit for the post-discharge cohort.
Parameter Mean (SD), median [IQR] or number (%) Units
Mean TSH 2.3 (3.5) mU/l
Median TSH 1.6 [0.9-2.4] mU/l
Mean T4 14.3 (3.0) pmol/l
Median T4 14.0 [13.0-16.0] pmol/l
Mean HbA1c 6.3 (1.3) %
Median HbA1c 5.9 [5.6-6.7] %
Mean phosphate 1.16 (0.22) mmol/l
Median phosphate 1.16 [1.01-1.29] mmol/l
Mean urate 0.47 (0.14) mmol/l
Median urate 0.46 [0.37-0.55] mmol/l
Mean cholesterol (total) 4.3 (1.3) mmol/l
Median cholesterol (total) 4.1 [3.4-4.9] mmol/l
Mean HDL 1.1 (0.4) mmol/l
Median HDL 1.1 [0.9-1.4] mmol/l
5.2.11 Aetiology of heart failure
The primary aetiologies of HF for the post-discharge cohort are displayed in Table 5-16. The
primary aetiology for the majority of patients was ischaemic heart disease. Over 40% of the
post-discharge cohort had documented evidence of a previously reported MI. More than one-
third of patients had angiographic evidence of coronary heart disease (defined as >50%
stenosis in at least 1 major epicardial vessel). Almost one-third of patients had an ‘unknown’
primary aetiology of HF. These patients had no history of a MI or a coronary angiogram
performed by the time of the study visit. The non-ischaemic primary causes of HF are also
detailed in Table 5-16. A non-ischaemic primary aetiology was only assigned where ischaemia
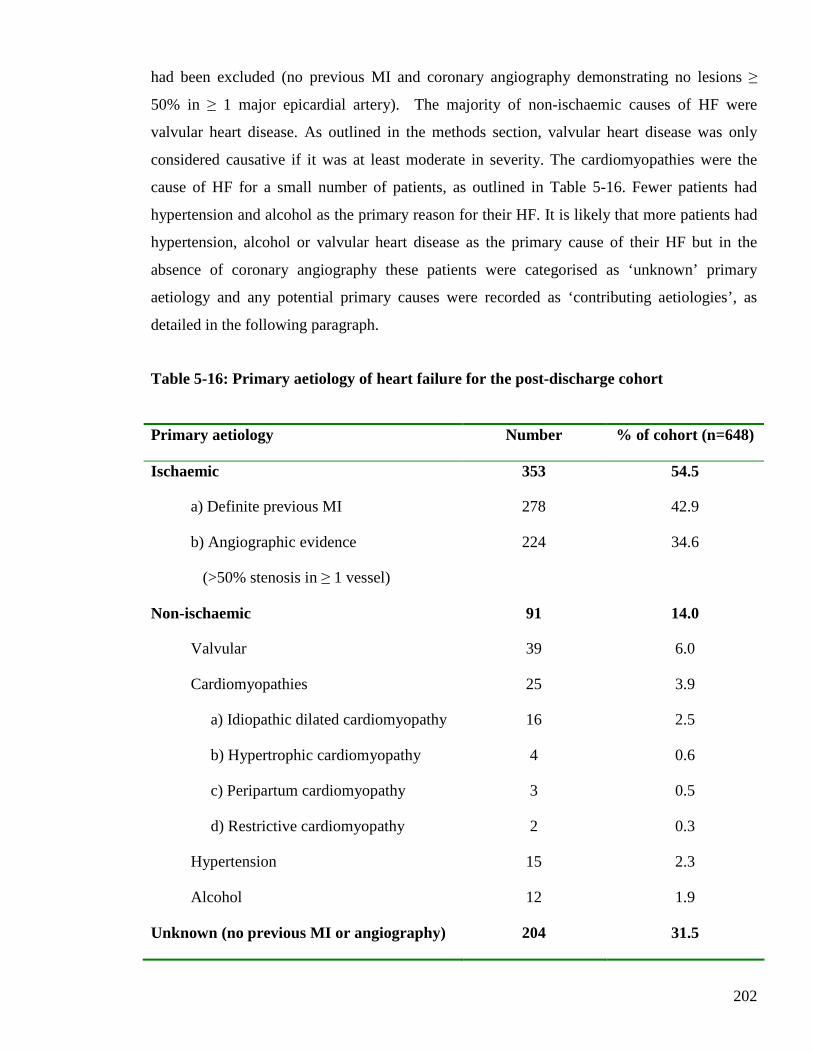
202
had been excluded (no previous MI and coronary angiography demonstrating no lesions ≥
50% in ≥ 1 major epicardial artery). The majority of non-ischaemic causes of HF were
valvular heart disease. As outlined in the methods section, valvular heart disease was only
considered causative if it was at least moderate in severity. The cardiomyopathies were the
cause of HF for a small number of patients, as outlined in Table 5-16. Fewer patients had
hypertension and alcohol as the primary reason for their HF. It is likely that more patients had
hypertension, alcohol or valvular heart disease as the primary cause of their HF but in the
absence of coronary angiography these patients were categorised as ‘unknown’ primary
aetiology and any potential primary causes were recorded as ‘contributing aetiologies’, as
detailed in the following paragraph.
Table 5-16: Primary aetiology of heart failure for the post-discharge cohort
Primary aetiology Number % of cohort (n=648)
Ischaemic
a) Definite previous MI
b) Angiographic evidence
(>50% stenosis in ≥ 1 vessel)
353
278
224
54.5
42.9
34.6
Non-ischaemic 91 14.0
Valvular 39 6.0
Cardiomyopathies
a) Idiopathic dilated cardiomyopathy
b) Hypertrophic cardiomyopathy
c) Peripartum cardiomyopathy
d) Restrictive cardiomyopathy
25
16
4
3
2
3.9
2.5
0.6
0.5
0.3
Hypertension 15 2.3
Alcohol 12 1.9
Unknown (no previous MI or angiography) 204 31.5
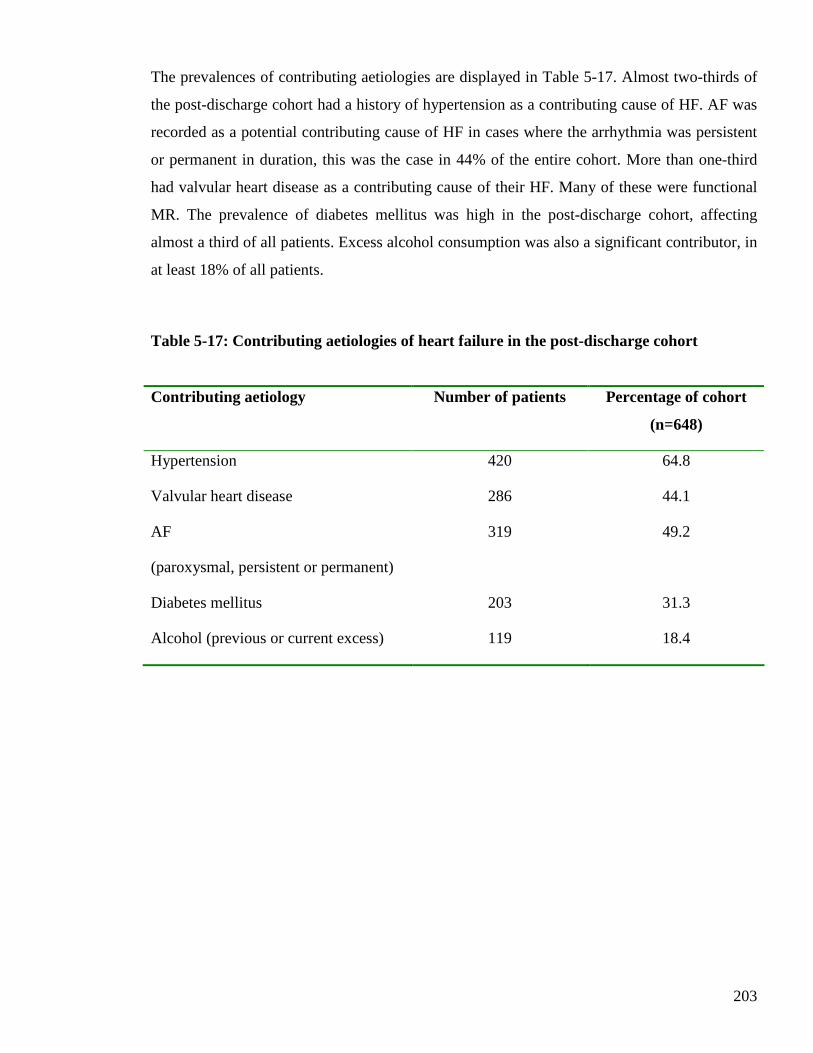
203
The prevalences of contributing aetiologies are displayed in Table 5-17. Almost two-thirds of
the post-discharge cohort had a history of hypertension as a contributing cause of HF. AF was
recorded as a potential contributing cause of HF in cases where the arrhythmia was persistent
or permanent in duration, this was the case in 44% of the entire cohort. More than one-third
had valvular heart disease as a contributing cause of their HF. Many of these were functional
MR. The prevalence of diabetes mellitus was high in the post-discharge cohort, affecting
almost a third of all patients. Excess alcohol consumption was also a significant contributor, in
at least 18% of all patients.
Table 5-17: Contributing aetiologies of heart failure in the post-discharge cohort
Contributing aetiology Number of patients Percentage of cohort
(n=648)
Hypertension 420 64.8
Valvular heart disease 286 44.1
AF
(paroxysmal, persistent or permanent)
319 49.2
Diabetes mellitus 203 31.3
Alcohol (previous or current excess) 119 18.4
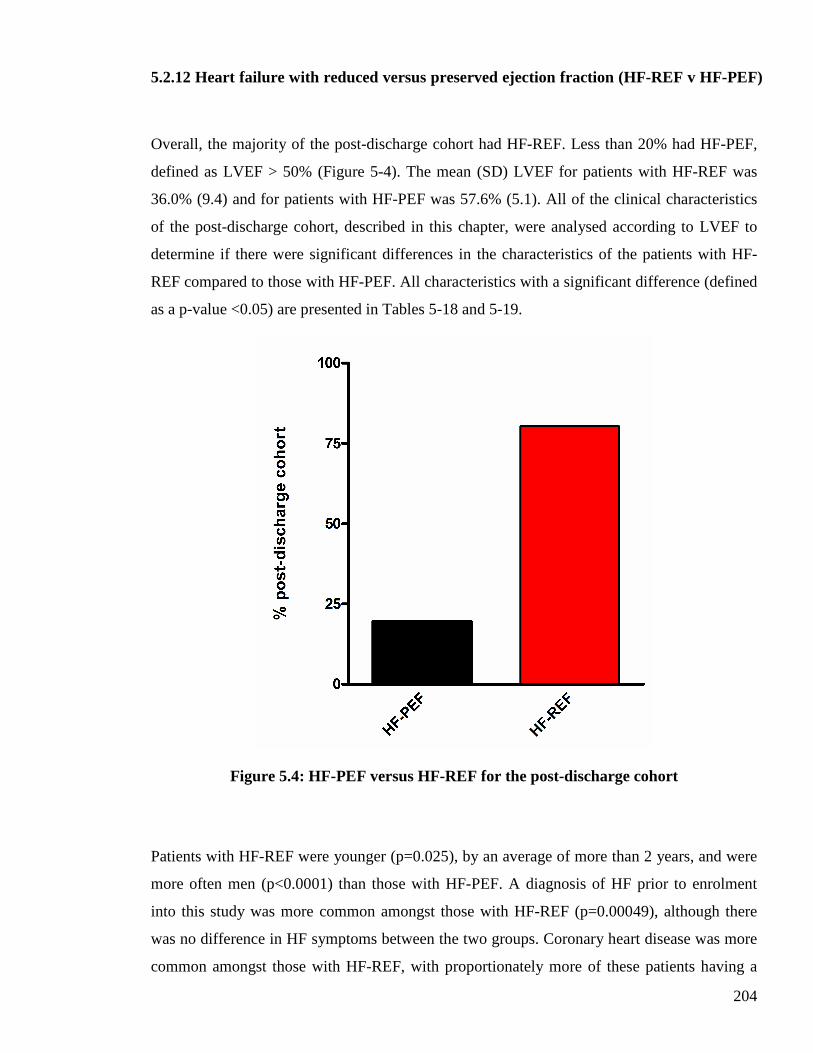
204
5.2.12 Heart failure with reduced versus preserved ejection fraction (HF-REF v HF-PEF)
Overall, the majority of the post-discharge cohort had HF-REF. Less than 20% had HF-PEF,
defined as LVEF > 50% (Figure 5-4). The mean (SD) LVEF for patients with HF-REF was
36.0% (9.4) and for patients with HF-PEF was 57.6% (5.1). All of the clinical characteristics
of the post-discharge cohort, described in this chapter, were analysed according to LVEF to
determine if there were significant differences in the characteristics of the patients with HF-
REF compared to those with HF-PEF. All characteristics with a significant difference (defined
as a p-value <0.05) are presented in Tables 5-18 and 5-19.
Figure 5.4: HF-PEF versus HF-REF for the post-discharge cohort
Patients with HF-REF were younger (p=0.025), by an average of more than 2 years, and were
more often men (p<0.0001) than those with HF-PEF. A diagnosis of HF prior to enrolment
into this study was more common amongst those with HF-REF (p=0.00049), although there
was no difference in HF symptoms between the two groups. Coronary heart disease was more
common amongst those with HF-REF, with proportionately more of these patients having a
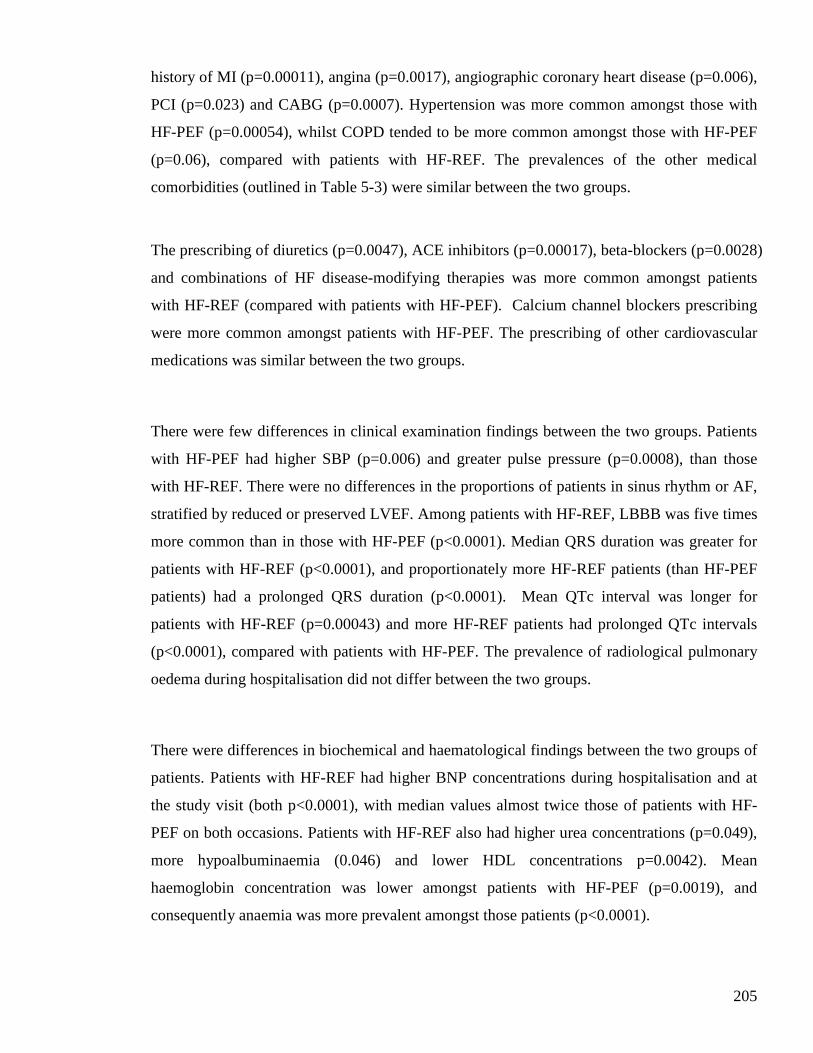
205
history of MI (p=0.00011), angina (p=0.0017), angiographic coronary heart disease (p=0.006),
PCI (p=0.023) and CABG (p=0.0007). Hypertension was more common amongst those with
HF-PEF (p=0.00054), whilst COPD tended to be more common amongst those with HF-PEF
(p=0.06), compared with patients with HF-REF. The prevalences of the other medical
comorbidities (outlined in Table 5-3) were similar between the two groups.
The prescribing of diuretics (p=0.0047), ACE inhibitors (p=0.00017), beta-blockers (p=0.0028)
and combinations of HF disease-modifying therapies was more common amongst patients
with HF-REF (compared with patients with HF-PEF). Calcium channel blockers prescribing
were more common amongst patients with HF-PEF. The prescribing of other cardiovascular
medications was similar between the two groups.
There were few differences in clinical examination findings between the two groups. Patients
with HF-PEF had higher SBP (p=0.006) and greater pulse pressure (p=0.0008), than those
with HF-REF. There were no differences in the proportions of patients in sinus rhythm or AF,
stratified by reduced or preserved LVEF. Among patients with HF-REF, LBBB was five times
more common than in those with HF-PEF (p<0.0001). Median QRS duration was greater for
patients with HF-REF (p<0.0001), and proportionately more HF-REF patients (than HF-PEF
patients) had a prolonged QRS duration (p<0.0001). Mean QTc interval was longer for
patients with HF-REF (p=0.00043) and more HF-REF patients had prolonged QTc intervals
(p<0.0001), compared with patients with HF-PEF. The prevalence of radiological pulmonary
oedema during hospitalisation did not differ between the two groups.
There were differences in biochemical and haematological findings between the two groups of
patients. Patients with HF-REF had higher BNP concentrations during hospitalisation and at
the study visit (both p<0.0001), with median values almost twice those of patients with HF-
PEF on both occasions. Patients with HF-REF also had higher urea concentrations (p=0.049),
more hypoalbuminaemia (0.046) and lower HDL concentrations p=0.0042). Mean
haemoglobin concentration was lower amongst patients with HF-PEF (p=0.0019), and
consequently anaemia was more prevalent amongst those patients (p<0.0001).
206
Table 5-18: Demographics, medical history and current medications, stratified by LVEF (significant results only). Data are expressed as number (%) or mean (SD). Variable HF-PEF
(n=127)
HF-REF
(n=521)
Overall
(n=648)
p
value*
Male 50 (39.4) 327 (62.8) 377 (58.2) <0.0001
Age 72.7 (9.2) 70.3 (10.9) 70.8 (10.6) 0.025
Previous diagnosis HF 38 (29.9) 245 (47) 283 (43.7) 0.00049
MI 38 (29.9) 255 (48.9) 293 (45.2) 0.00011
History of angina 54 (42.5) 302 (58) 356 (54.9) 0.0017
Angiographic CAD 26/44 (59) 199/262 (76) 225/307 (73) 0.006
PCI 10 (7.9) 82 (15.7) 92 (14.2) 0.023
CABG 9 (7.1) 103 (19.8) 112 (17.3) 0.0007
Hypertension 99 (78) 321 (61.6) 420 (64.8) 0.00054
Diuretics 116 (91.3) 505 (96.9) 621 (95.8) 0.0047
ACE inhibitors 72 (56.7) 384 (73.7) 456 (70.4) 0.00017
Beta-blockers 70 (55.1) 360 (69.1) 430 (66.4) 0.0028
ACE inhibitor or ARB 79 (62.2) 435 (83.5) 514 (79.3) <0.0001
ACE inhibitor or ARB & Beta-
blocker
43 (33.9) 314 (60.3) 357 (55.1) <0.0001
ACE inhibitor or ARB & Beta-
blocker & Aldosterone blocker
4 (3.1) 48 (9.2) 52 (8) 0.038
Calcium channel blockers 37 (29.1) 80 (15.4) 117 (18.1) 0.00029
* Inter-group comparisons using Student’s t-test (continuous variables) and χ2 test (categorical
variables), p value <0.05 indicates a significant difference between the two groups.
CAD = coronary artery disease (defined as > 50% stenosis in ≥ 1 major epicardial vessel,
denominator is number of patients who had an angiogram)
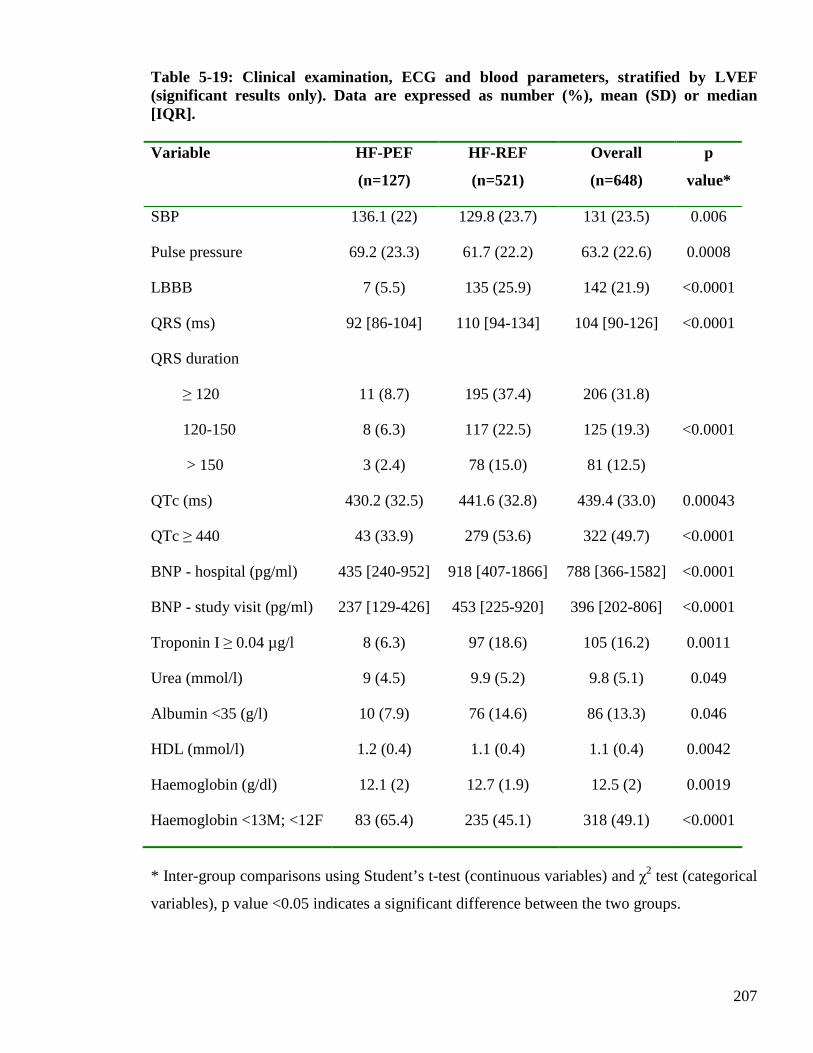
207
Table 5-19: Clinical examination, ECG and blood parameters, stratified by LVEF (significant results only). Data are expressed as number (%), mean (SD) or median [IQR]. Variable HF-PEF
(n=127)
HF-REF
(n=521)
Overall
(n=648)
p
value*
SBP 136.1 (22) 129.8 (23.7) 131 (23.5) 0.006
Pulse pressure 69.2 (23.3) 61.7 (22.2) 63.2 (22.6) 0.0008
LBBB 7 (5.5) 135 (25.9) 142 (21.9) <0.0001
QRS (ms) 92 [86-104] 110 [94-134] 104 [90-126] <0.0001
QRS duration
≥ 120
120-150
> 150
11 (8.7)
8 (6.3)
3 (2.4)
195 (37.4)
117 (22.5)
78 (15.0)
206 (31.8)
125 (19.3)
81 (12.5)
<0.0001
QTc (ms) 430.2 (32.5) 441.6 (32.8) 439.4 (33.0) 0.00043
QTc ≥ 440 43 (33.9) 279 (53.6) 322 (49.7) <0.0001
BNP - hospital (pg/ml) 435 [240-952] 918 [407-1866] 788 [366-1582] <0.0001
BNP - study visit (pg/ml) 237 [129-426] 453 [225-920] 396 [202-806] <0.0001
Troponin I ≥ 0.04 µg/l 8 (6.3) 97 (18.6) 105 (16.2) 0.0011
Urea (mmol/l) 9 (4.5) 9.9 (5.2) 9.8 (5.1) 0.049
Albumin <35 (g/l) 10 (7.9) 76 (14.6) 86 (13.3) 0.046
HDL (mmol/l) 1.2 (0.4) 1.1 (0.4) 1.1 (0.4) 0.0042
Haemoglobin (g/dl) 12.1 (2) 12.7 (1.9) 12.5 (2) 0.0019
Haemoglobin <13M; <12F 83 (65.4) 235 (45.1) 318 (49.1) <0.0001
* Inter-group comparisons using Student’s t-test (continuous variables) and χ2 test (categorical
variables), p value <0.05 indicates a significant difference between the two groups.
208
5.3 Discussion
Chapter 5 has described the clinical data obtained from the study visit for the post-discharge
cohort. The study visit occurred approximately 4-6 weeks after hospitalisation. The post-
discharge cohort comprised 648 patients of the original 1003 patients enrolled during
hospitalisation. A significant proportion of the original cohort was deceased by 4-6 weeks,
consistent with the high early mortality rate following hospitalisation for HF (147).
The post-discharge cohort was, expectedly, a cohort of patients with stable HF. The majority
of these patients were NYHA class II, having been NYHA class III at the time of hospital
admission. The majority of patients experienced a reduction in weight from the hospital
admission to study visit attendance, consistent with achieving euvolaemic status following
their admission with decompensated HF. There was also an expected reduction in the numbers
of patients with signs of fluid overload by the time of the study visit. The significance of
worsening signs and symptoms of HF following an admission for HF and subsequent
rehospitalisation and mortality has recently been recognised (148).
The frequency of diuretic prescribing was high amongst the post-discharge cohort (> 95%),
with modest prescribing of HF disease-modifying therapies (70% prescribed an ACE inhibitor;
66% prescribed a beta-blocker).
A large proportion of the post-discharge cohort was in AF at the time of the study visit (37%),
consistent with the prevalence of 10-50% reported by clinical studies of AF in LVSD (149)
and the recognition of AF as a common finding in patients with heart failure and preserved
systolic function (150). Over a quarter of the post-discharge cohort had evidence of bundle
branch block on the ECG performed at the study visit. The prevalence of this finding is similar
to other chronic HF cohorts containing patients with both reduced and preserved systolic
function (151). Many patients had electrocardiographic evidence of LVH, this prevalence is
also similar to other chronic HF cohorts containing patients with both reduced and preserved
systolic function (152).
209
The mean LVEF for the post-discharge cohort was 40%, consistent with the mean LVEF
reported by other chronic HF cohorts containing patients with both reduced and preserved
systolic function (121). Approximately one-fifth of the post-discharge cohort had preserved
systolic function, defined as LVEF ≥ 50% (18).
There was an improvement in most of the haematological and biochemical parameters
measured in the post-discharge cohort, compared to measurements performed whilst in
hospital. There was a significant reduction in BNP levels for the majority of the post-discharge
cohort and a sizeable reduction in the proportion of the cohort with an elevated troponin
concentration. The prognostic importance of persistent troponin elevation in both chronic HF
and during admission for acute decompensated HF has been recently demonstrated (153;154).
Fewer patients were hyponatraemic, hyperbilirubinaemic or hypoalbuminaemic, than during
the hospital admission. The post-discharge cohort had similar proportions of patients with an
elevated urea concentration and reduced eGFR, compared to the hospitalised cohort. Indeed,
fewer patients had normal eGFR at the time of the study visit than on admission to hospital.
Almost half of the post-discharge cohort was anaemic, similar to the prevalence of anaemia
during the hospital admission.
Ischaemic heart disease was the primary aetiology of HF for the majority of the post-discharge
cohort, consistent with this being the commonest cause of HF in Western countries. However,
almost one-third of patients had an ‘unknown’ primary aetiology of heart failure.
When the clinical data of the post-discharge cohort were analysed according to whether the
patients had HF-REF or HF-PEF, the majority of clinical characteristics were similar between
the two groups. This is consistent with previous reports that patients with HF-PEF cannot be
distinguished from those with HF-REF on the basis of symptoms and signs, CXR or ECG
findings (19). However, there were some notable differences between the two groups. Patients
with HF-PEF were older, more likely to be female, more likely to have hypertension and less
likely to have had a MI, in comparison to those with HF-REF. These findings are consistent
with previous studies of HF-PEF (22;24;155). Prescribing of recommended pharmacological
treatments for HF was greater amongst patients with HF-REF, an unsurprising result given the
210
evidence-base for the use of these medications exists only for patients with HF-REF and no
treatment is of proven benefit in HF-PEF. Prescribing of calcium channel blockers was more
common amongst those with HF-PEF, perhaps reflecting the use of these agents as
antihypertensive treatment. Apart from SBP and pulse pressure, there were no differences in
clinical examination findings between the two groups. There were also no differences in the
proportions in sinus rhythm or AF between the two groups. QRS duration and QTc interval
were longer amongst patients with HF-REF. The majority of biochemical and haematological
tests performed did not differ according to LVEF. However, the differences in BNP
concentrations between the two groups, on admission to hospital and at the study visit, were
striking. Patients with HF-REF had median BNP concentrations almost twice that of those
with HF-PEF. Previous studies in patients with decompensated HF have demonstrated similar
findings (156). Anaemia was more common amongst those with HF-PEF, consistent with
previous reports (23).
In summary, many of the symptoms, signs and blood tests of the post-discharge cohort showed
an expected improvement compared to data recorded during hospitalisation with
decompensated HF. The post-discharge cohort still exhibited many abnormal clinical
characteristics, many of which are consistent with prior findings published in chronic HF
cohorts, and the majority of patients had HF-REF.

211
CHAPTER SIX
MICROVOLT T-WAVE ALTERNANS
212
6.1 Introduction
This chapter will describe the results of MTWA testing in the post-discharge cohort. The
eligibility for MTWA testing will be described and the reasons for ineligibility outlined. The
potential eligibility in the entire hospitalised cohort will also be outlined. This will
demonstrate whether or not the post-discharge cohort was similar, in terms of eligibility for
MTWA testing, to that of an unselected cohort of patients with HF. The clinical characteristics
of the post-discharge cohort, described in chapter 5, will be stratified by eligibility for MTWA
testing. This will determine if there were any significant differences in the clinical
characteristics of the patients eligible for MTWA testing compared to those ineligible. The
results of MTWA testing and the prevalence of positive, negative and indeterminate results
will be described, including an outline of the reasons for an indeterminate test. The functional
capacity of the patients will also be displayed including the reasons for terminating exercise,
average duration of exercise and metabolic equivalent values (METs). This will allow an
evaluation of the practicality of this test in HF patients. For patients unable to exercise,
MTWA testing at rest will be described.
6.2 Results
6.2.1 Eligibility
The spectral analysis method of MTWA testing is not suitable for all patients. It is mandatory
that patients are in sinus rhythm, and able to perform sub maximal treadmill exercise in order
to raise their heart rates to 110 beats per minute. Patients are ineligible for MTWA testing if
they are in AF, continuously ventricular pacing (and therefore unable to produce a
chronotropic response), or unable to perform sub maximal exercise on a treadmill. The reasons
for the latter may be multifactorial and include physical incapabilities as well as medical
contraindications, for example severe symptomatic aortic stenosis. Figure 6.1 illustrates the
potential eligibility for MTWA testing in the hospitalised cohort. This includes the non-
attendees, as well as the post-discharge cohort. For the former, eligibility is based on clinical
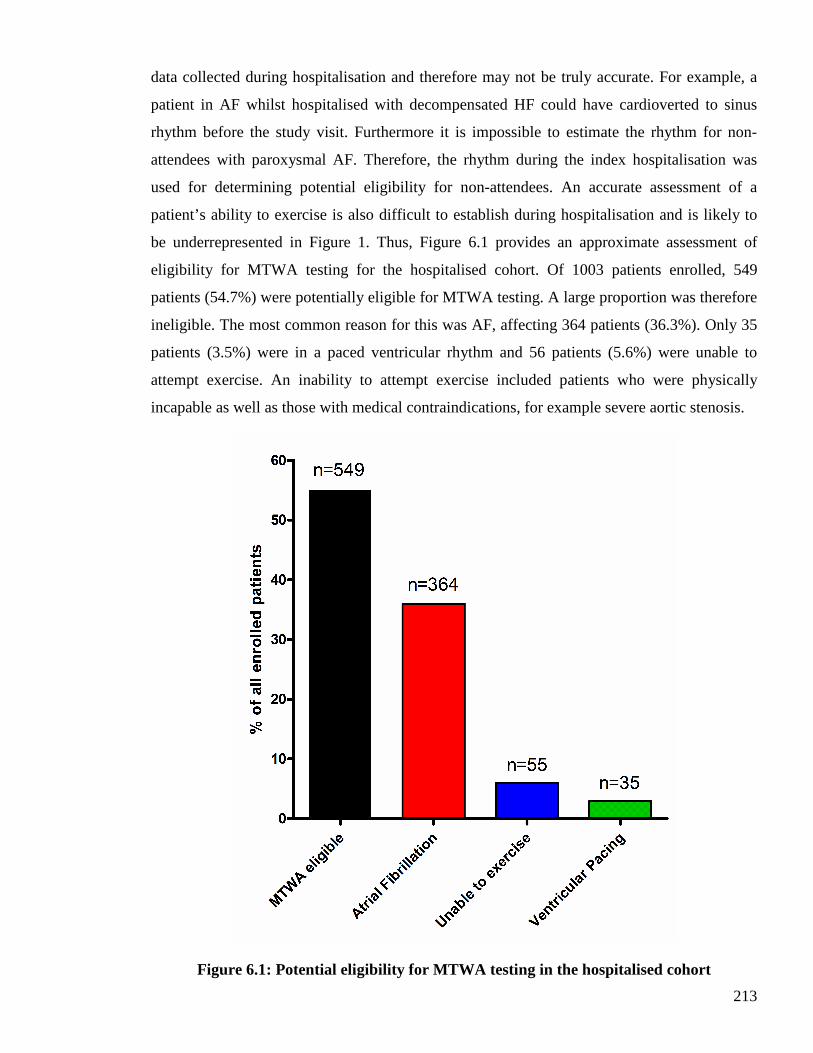
213
data collected during hospitalisation and therefore may not be truly accurate. For example, a
patient in AF whilst hospitalised with decompensated HF could have cardioverted to sinus
rhythm before the study visit. Furthermore it is impossible to estimate the rhythm for non-
attendees with paroxysmal AF. Therefore, the rhythm during the index hospitalisation was
used for determining potential eligibility for non-attendees. An accurate assessment of a
patient’s ability to exercise is also difficult to establish during hospitalisation and is likely to
be underrepresented in Figure 1. Thus, Figure 6.1 provides an approximate assessment of
eligibility for MTWA testing for the hospitalised cohort. Of 1003 patients enrolled, 549
patients (54.7%) were potentially eligible for MTWA testing. A large proportion was therefore
ineligible. The most common reason for this was AF, affecting 364 patients (36.3%). Only 35
patients (3.5%) were in a paced ventricular rhythm and 56 patients (5.6%) were unable to
attempt exercise. An inability to attempt exercise included patients who were physically
incapable as well as those with medical contraindications, for example severe aortic stenosis.
Figure 6.1: Potential eligibility for MTWA testing in the hospitalised cohort
214
Eligibility for MTWA exercise testing at the study visit is displayed in Figure 6.2. Just over
half of the attendees were eligible for MTWA exercise testing (50.9%). The proportion of
patients eligible for MTWA testing was similar to the potential eligibility in the hospitalised
cohort (50.9% versus 54.7%, respectively). The most common reason for ineligibility was AF,
accounting for 242 patients (37.3%) attending the study visit. The remaining patients were
ineligible for MTWA testing because of continuous ventricular pacing (5.1%) and inability to
exercise (6.6%). The latter included patients who could not satisfactorily exercise on the
treadmill as well as patients with a contra-indication to performing exercise, such as severe
aortic stenosis. Satisfactory exercise was defined as an ability to walk on the treadmill for at
least two minutes. Of all patients taking the MTWA test, 43 patients (6.6%) were unable to
exercise, the majority of whom attempted exercise (n=26). Figure 6.3 displays the breakdown
of reasons for being unable to exercise for two minutes. The reasons why exercise was not
attempted in the remaining 17 patients are displayed in Figure 6.4. MTWA testing was
performed at rest in all patients unable to exercise to assess if alternans activity was present at
rest. In these cases, only a positive MTWA result could be included in the subsequent analyses
– a negative result would not be possible without raising the heart rate to 110 beats per minute
and these results could not be classified as indeterminate.
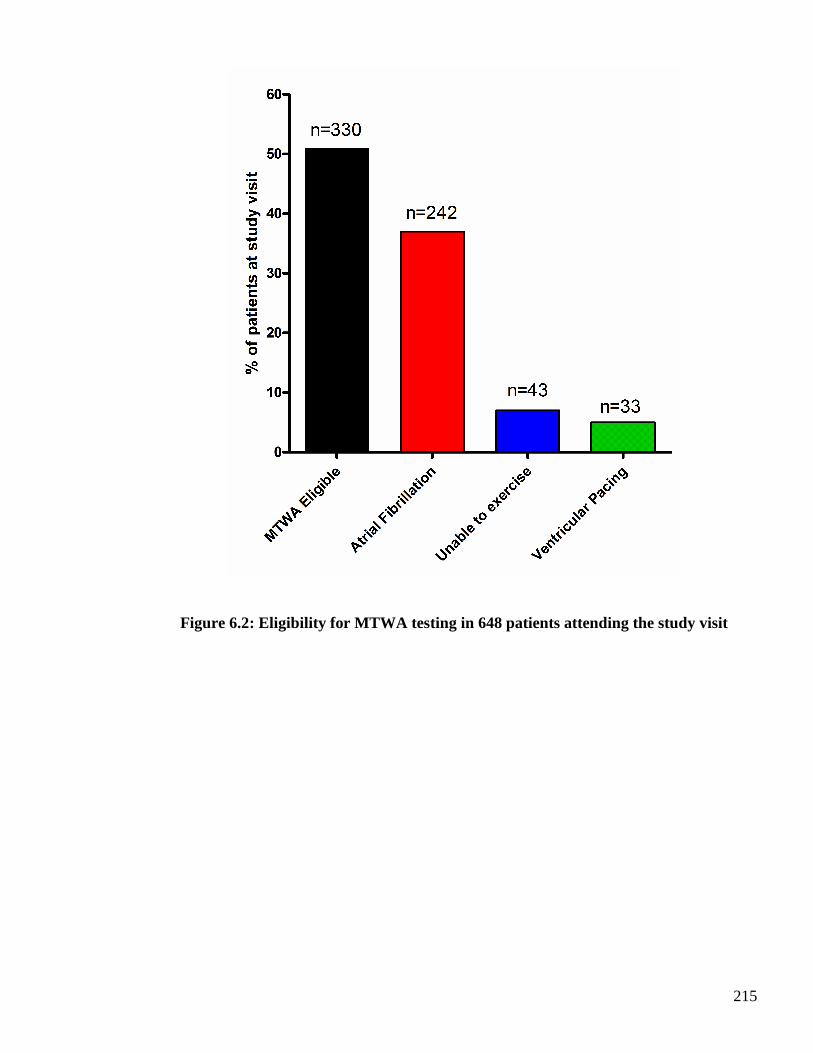
215
Figure 6.2: Eligibility for MTWA testing in 648 pat ients attending the study visit
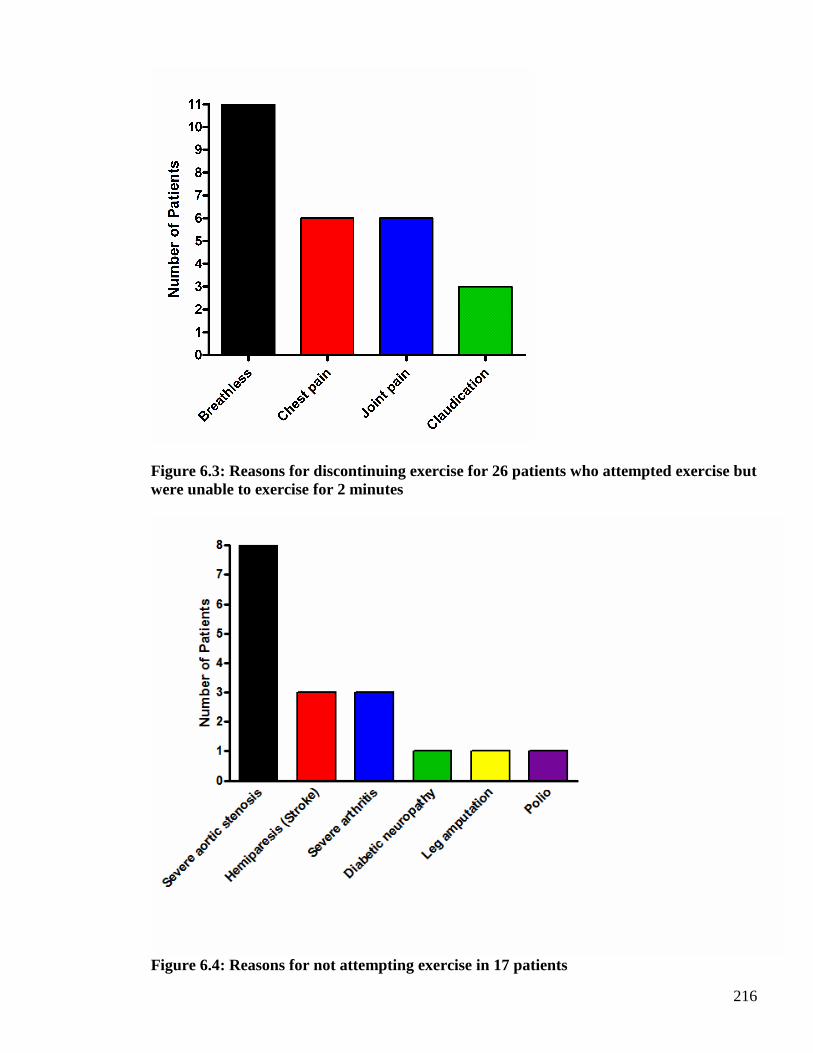
216
Figure 6.3: Reasons for discontinuing exercise for 26 patients who attempted exercise but were unable to exercise for 2 minutes
Figure 6.4: Reasons for not attempting exercise in 17 patients
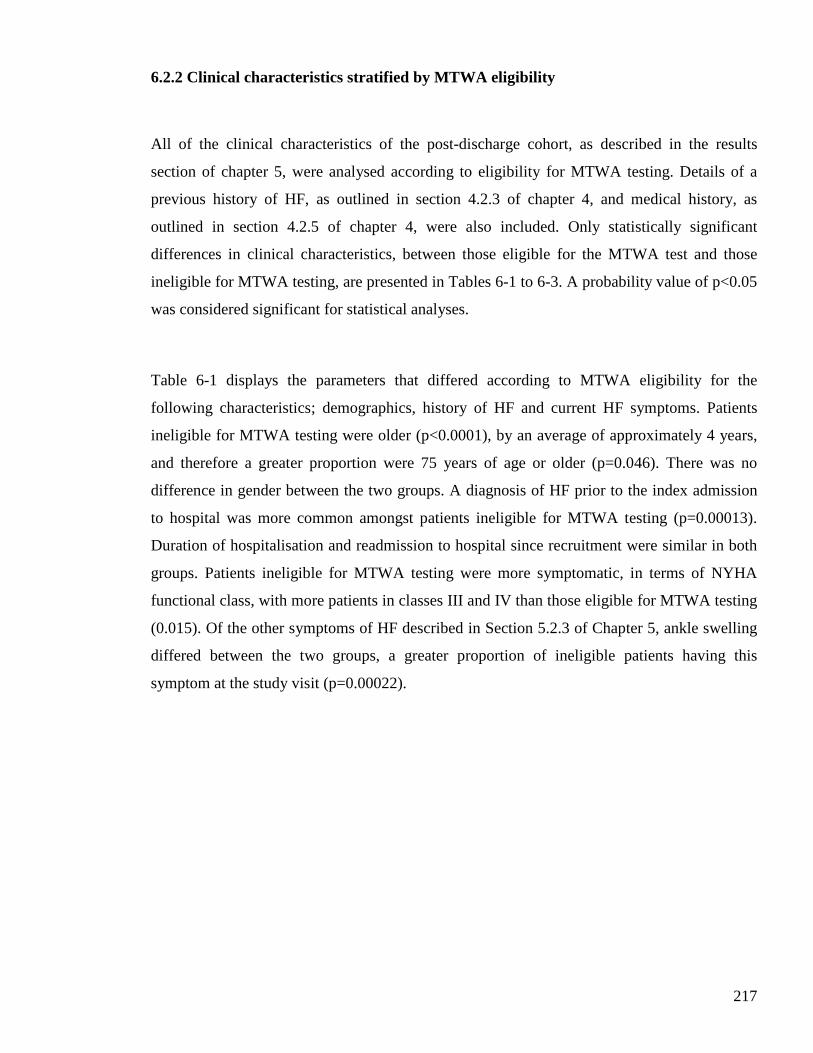
217
6.2.2 Clinical characteristics stratified by MTWA eligibility
All of the clinical characteristics of the post-discharge cohort, as described in the results
section of chapter 5, were analysed according to eligibility for MTWA testing. Details of a
previous history of HF, as outlined in section 4.2.3 of chapter 4, and medical history, as
outlined in section 4.2.5 of chapter 4, were also included. Only statistically significant
differences in clinical characteristics, between those eligible for the MTWA test and those
ineligible for MTWA testing, are presented in Tables 6-1 to 6-3. A probability value of p<0.05
was considered significant for statistical analyses.
Table 6-1 displays the parameters that differed according to MTWA eligibility for the
following characteristics; demographics, history of HF and current HF symptoms. Patients
ineligible for MTWA testing were older (p<0.0001), by an average of approximately 4 years,
and therefore a greater proportion were 75 years of age or older (p=0.046). There was no
difference in gender between the two groups. A diagnosis of HF prior to the index admission
to hospital was more common amongst patients ineligible for MTWA testing (p=0.00013).
Duration of hospitalisation and readmission to hospital since recruitment were similar in both
groups. Patients ineligible for MTWA testing were more symptomatic, in terms of NYHA
functional class, with more patients in classes III and IV than those eligible for MTWA testing
(0.015). Of the other symptoms of HF described in Section 5.2.3 of Chapter 5, ankle swelling
differed between the two groups, a greater proportion of ineligible patients having this
symptom at the study visit (p=0.00022).
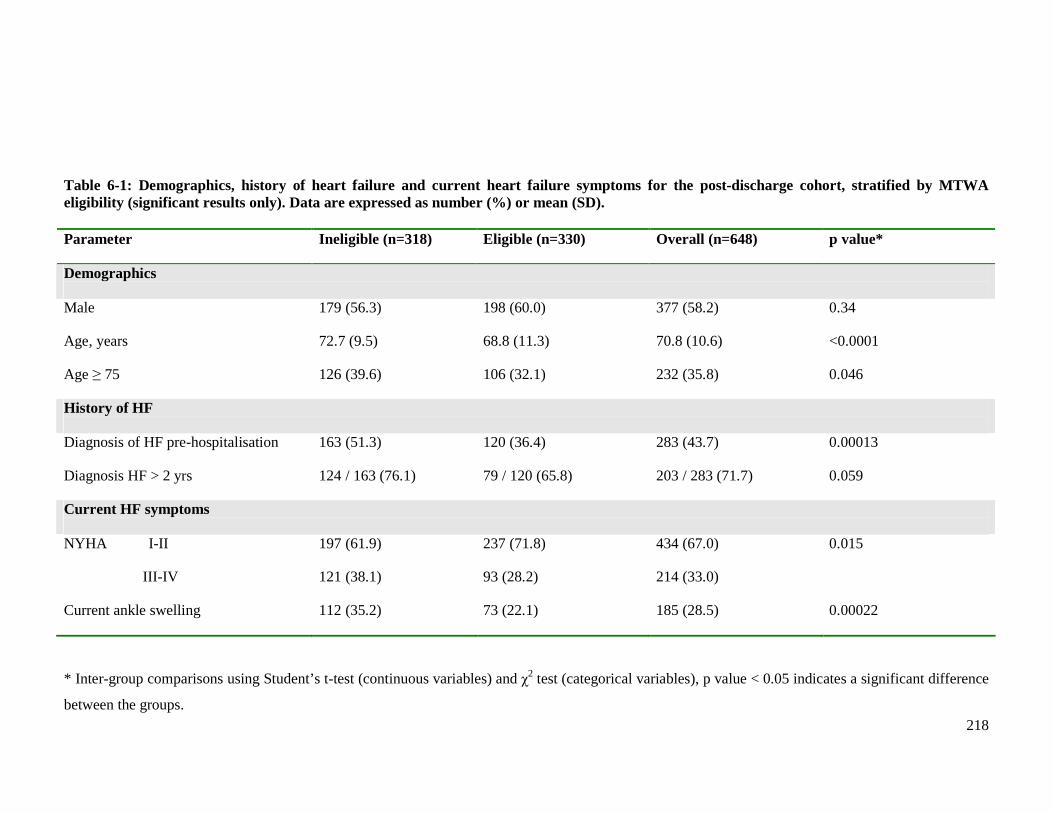
218
Table 6-1: Demographics, history of heart failure and current heart failure symptoms for the post-discharge cohort, stratified by MTWA eligibility (significant results only). Data are expressed as number (%) or mean (SD). Parameter Ineligible (n=318) Eligible (n=330) Overall (n=648) p value*
Demographics Male 179 (56.3) 198 (60.0) 377 (58.2) 0.34
Age, years 72.7 (9.5) 68.8 (11.3) 70.8 (10.6) <0.0001
Age ≥ 75 126 (39.6) 106 (32.1) 232 (35.8) 0.046
History of HF Diagnosis of HF pre-hospitalisation 163 (51.3) 120 (36.4) 283 (43.7) 0.00013
Diagnosis HF > 2 yrs 124 / 163 (76.1) 79 / 120 (65.8) 203 / 283 (71.7) 0.059
Current HF symptoms NYHA I-II
III-IV
197 (61.9)
121 (38.1)
237 (71.8)
93 (28.2)
434 (67.0)
214 (33.0)
0.015
Current ankle swelling 112 (35.2) 73 (22.1) 185 (28.5) 0.00022
* Inter-group comparisons using Student’s t-test (continuous variables) and χ2 test (categorical variables), p value < 0.05 indicates a significant difference
between the groups.
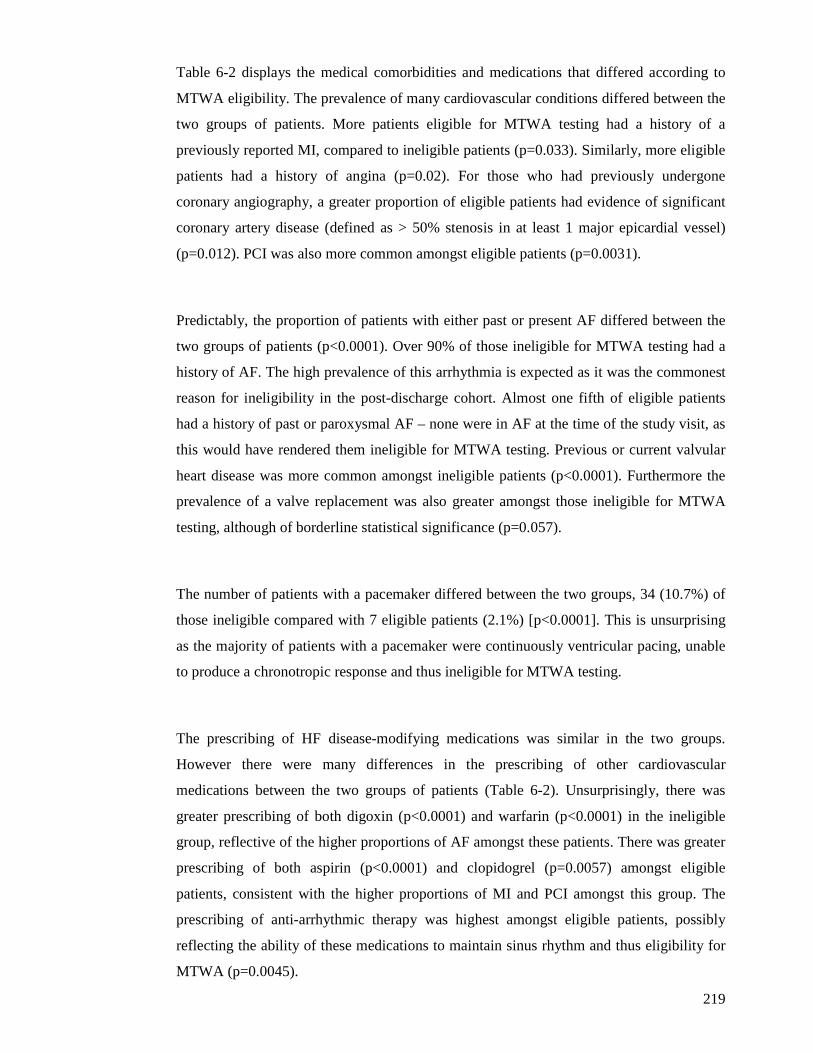
219
Table 6-2 displays the medical comorbidities and medications that differed according to
MTWA eligibility. The prevalence of many cardiovascular conditions differed between the
two groups of patients. More patients eligible for MTWA testing had a history of a
previously reported MI, compared to ineligible patients (p=0.033). Similarly, more eligible
patients had a history of angina (p=0.02). For those who had previously undergone
coronary angiography, a greater proportion of eligible patients had evidence of significant
coronary artery disease (defined as > 50% stenosis in at least 1 major epicardial vessel)
(p=0.012). PCI was also more common amongst eligible patients (p=0.0031).
Predictably, the proportion of patients with either past or present AF differed between the
two groups of patients (p<0.0001). Over 90% of those ineligible for MTWA testing had a
history of AF. The high prevalence of this arrhythmia is expected as it was the commonest
reason for ineligibility in the post-discharge cohort. Almost one fifth of eligible patients
had a history of past or paroxysmal AF – none were in AF at the time of the study visit, as
this would have rendered them ineligible for MTWA testing. Previous or current valvular
heart disease was more common amongst ineligible patients (p<0.0001). Furthermore the
prevalence of a valve replacement was also greater amongst those ineligible for MTWA
testing, although of borderline statistical significance (p=0.057).
The number of patients with a pacemaker differed between the two groups, 34 (10.7%) of
those ineligible compared with 7 eligible patients (2.1%) [p<0.0001]. This is unsurprising
as the majority of patients with a pacemaker were continuously ventricular pacing, unable
to produce a chronotropic response and thus ineligible for MTWA testing.
The prescribing of HF disease-modifying medications was similar in the two groups.
However there were many differences in the prescribing of other cardiovascular
medications between the two groups of patients (Table 6-2). Unsurprisingly, there was
greater prescribing of both digoxin (p<0.0001) and warfarin (p<0.0001) in the ineligible
group, reflective of the higher proportions of AF amongst these patients. There was greater
prescribing of both aspirin (p<0.0001) and clopidogrel (p=0.0057) amongst eligible
patients, consistent with the higher proportions of MI and PCI amongst this group. The
prescribing of anti-arrhythmic therapy was highest amongst eligible patients, possibly
reflecting the ability of these medications to maintain sinus rhythm and thus eligibility for
MTWA (p=0.0045).
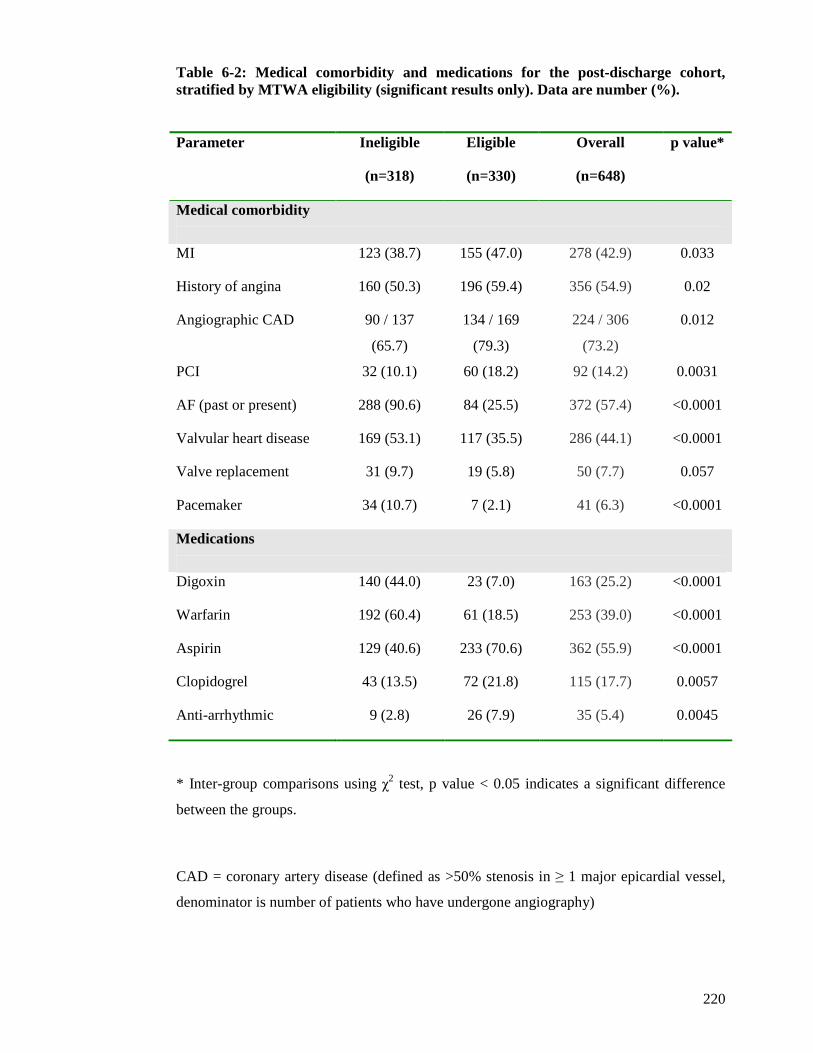
220
Table 6-2: Medical comorbidity and medications for the post-discharge cohort, stratified by MTWA eligibility (significant results only). Data are number (%).
Parameter Ineligible
(n=318)
Eligible
(n=330)
Overall
(n=648)
p value*
Medical comorbidity
MI 123 (38.7) 155 (47.0) 278 (42.9) 0.033
History of angina 160 (50.3) 196 (59.4) 356 (54.9) 0.02
Angiographic CAD 90 / 137
(65.7)
134 / 169
(79.3)
224 / 306
(73.2)
0.012
PCI 32 (10.1) 60 (18.2) 92 (14.2) 0.0031
AF (past or present) 288 (90.6) 84 (25.5) 372 (57.4) <0.0001
Valvular heart disease 169 (53.1) 117 (35.5) 286 (44.1) <0.0001
Valve replacement 31 (9.7) 19 (5.8) 50 (7.7) 0.057
Pacemaker 34 (10.7) 7 (2.1) 41 (6.3) <0.0001
Medications
Digoxin 140 (44.0) 23 (7.0) 163 (25.2) <0.0001
Warfarin 192 (60.4) 61 (18.5) 253 (39.0) <0.0001
Aspirin 129 (40.6) 233 (70.6) 362 (55.9) <0.0001
Clopidogrel 43 (13.5) 72 (21.8) 115 (17.7) 0.0057
Anti-arrhythmic 9 (2.8) 26 (7.9) 35 (5.4) 0.0045
* Inter-group comparisons using χ2 test, p value < 0.05 indicates a significant difference
between the groups.
CAD = coronary artery disease (defined as >50% stenosis in ≥ 1 major epicardial vessel,
denominator is number of patients who have undergone angiography)
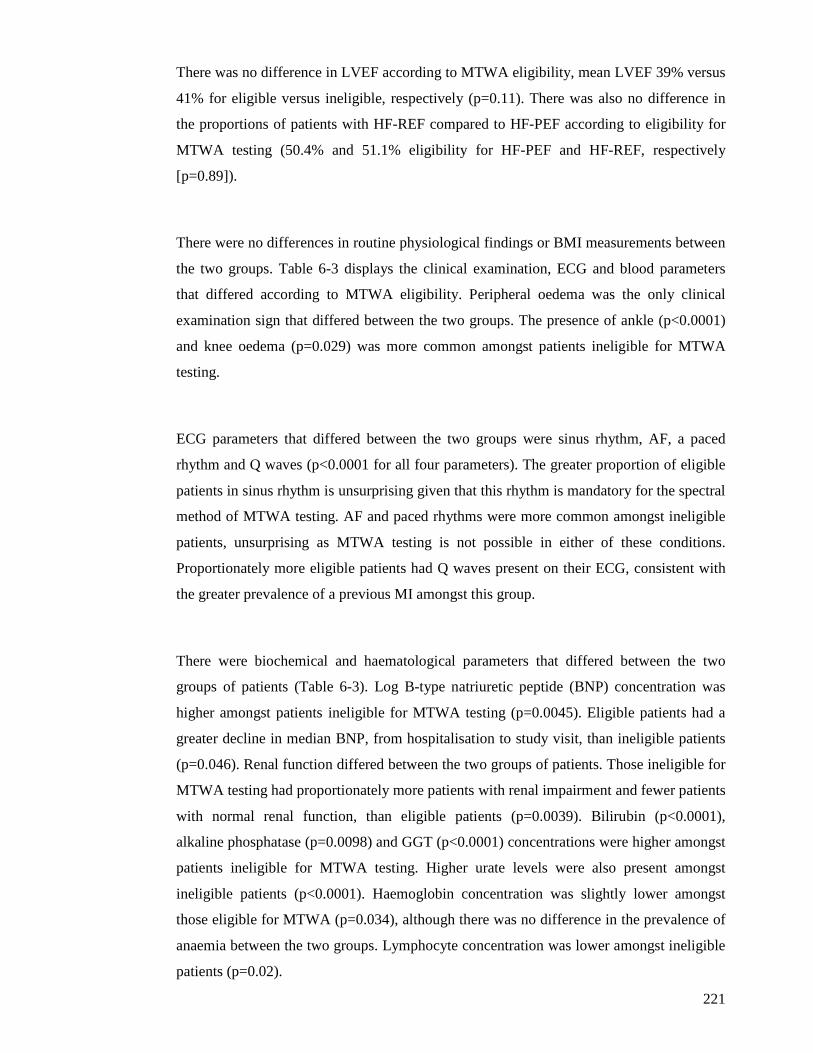
221
There was no difference in LVEF according to MTWA eligibility, mean LVEF 39% versus
41% for eligible versus ineligible, respectively (p=0.11). There was also no difference in
the proportions of patients with HF-REF compared to HF-PEF according to eligibility for
MTWA testing (50.4% and 51.1% eligibility for HF-PEF and HF-REF, respectively
[p=0.89]).
There were no differences in routine physiological findings or BMI measurements between
the two groups. Table 6-3 displays the clinical examination, ECG and blood parameters
that differed according to MTWA eligibility. Peripheral oedema was the only clinical
examination sign that differed between the two groups. The presence of ankle (p<0.0001)
and knee oedema (p=0.029) was more common amongst patients ineligible for MTWA
testing.
ECG parameters that differed between the two groups were sinus rhythm, AF, a paced
rhythm and Q waves (p<0.0001 for all four parameters). The greater proportion of eligible
patients in sinus rhythm is unsurprising given that this rhythm is mandatory for the spectral
method of MTWA testing. AF and paced rhythms were more common amongst ineligible
patients, unsurprising as MTWA testing is not possible in either of these conditions.
Proportionately more eligible patients had Q waves present on their ECG, consistent with
the greater prevalence of a previous MI amongst this group.
There were biochemical and haematological parameters that differed between the two
groups of patients (Table 6-3). Log B-type natriuretic peptide (BNP) concentration was
higher amongst patients ineligible for MTWA testing (p=0.0045). Eligible patients had a
greater decline in median BNP, from hospitalisation to study visit, than ineligible patients
(p=0.046). Renal function differed between the two groups of patients. Those ineligible for
MTWA testing had proportionately more patients with renal impairment and fewer patients
with normal renal function, than eligible patients (p=0.0039). Bilirubin (p<0.0001),
alkaline phosphatase (p=0.0098) and GGT (p<0.0001) concentrations were higher amongst
patients ineligible for MTWA testing. Higher urate levels were also present amongst
ineligible patients (p<0.0001). Haemoglobin concentration was slightly lower amongst
those eligible for MTWA (p=0.034), although there was no difference in the prevalence of
anaemia between the two groups. Lymphocyte concentration was lower amongst ineligible
patients (p=0.02).
222
Table 6-3: Clinical examination, ECG and blood parameters stratified by MTWA eligibility (significant results). Data are number (%), mean (SD) or median [IQR].
* Inter-group comparisons using Student’s t-test (continuous variables) and χ2 test
(categorical variables), p value < 0.05 indicates a significant difference between the groups.
Parameter Ineligible
(n=318)
Eligible
(n=330)
Overall
(n=648)
p value*
Clinical examination
Peripheral oedema – ankle 146 (45.9) 92 (27.9) 238 (36.7) <0.0001
Peripheral oedema – knee 28 (8.8) 15 (4.5) 43 (6.6) 0.029
ECG
Sinus rhythm 43 (13.5) 328 (99.4) 371 (57.3) <0.0001
AF 242 (76.1) 0 (0.0) 242 (37.3) <0.0001
Paced rhythm 33 (10.4) 2 (0.6) 35 (5.4) <0.0001
Q waves 14 (4.4) 47 (14.2) 61 (9.4) <0.0001
Blood tests
Log (BNP) 6.1 (1.0) 5.9 (1.1) 6.0 (1.1) 0.0045
∆ BNP (hosp – study visit)
(pg/ml)
208
[12.0-704.0]
301
[32.5-858.5]
240.5
[17.8-771.3]
0.046
eGFR (ml/min/1.73m2) 54.6 (18.6) 58.7 (19.8) 56.7 (19.3) 0.007
eGFR <30
30-60
60-90
≥90
27 (8.5)
183 (57.6)
100 (31.4)
8 (2.5)
24 (7.3)
149 (45.1)
140 (42.4)
17 (5.2)
51 (7.9)
332 (51.2)
240 (37.0)
25 (3.9)
0.0039
Bilirubin (µmol/l) 13.1 (8.7) 10.1 (6.8) 11.6 (7.9) <0.0001
GGT (U/l) 57 [32-110] 39 [25-66] 45 [28-88] <0.0001
Alk Phos (U/l) 94 [75-121] 91 [73-112] 92 [74-118] 0.0098
Urate (mmol/l) 0.49 (0.1) 0.44 (0.1) 0.47 (0.1) <0.0001
Haemoglobin (g/dl) 12.7 (2.1) 12.4 (1.9) 12.5 (2.0) 0.034
Lymphocytes (x109/l) 1.8 (0.8) 2.0 (1.6) 1.9 (1.3) 0.02
223
6.2.3 Automated computer-generated report
A computer generated report is automatically produced following the completion of each
MTWA test. An example is shown in Figure 6.5. Each report contains the following; a
graph of heart rate trend, artefacts that may be potentially obscuring true alternans (for
example ectopic activity or noise), measurement of alternans activity in individual vector
and praecordial leads, artefacts that may be potentially creating false alternans and the
alternans classification (positive, negative or indeterminate). Each report contains two
pages, the first displaying data for the four vector leads (VM, X, Y and Z) and the second
displaying data for praecordial leads V1-6.
The heart rate trend contains two lines; an uneven line that corresponds to the
instantaneous heart rate, or ‘real time’ heart rate, and a smooth line that corresponds to the
‘epic’ heart rate present over time. The instantaneous heart rate provides information about
sudden variations in heart rate or the occurrence of ectopic beats. The ‘epic’ heart rate is
the average heart rate in each of the epics and is produced by using an enhanced ECG
noise reduction algorithm. Each epic consists of 128 consecutive beats selected for analysis.
The beats are aligned and each T wave in the epic is analysed at the same relative point in
time. All alternans parameters are measured against the epic, or smoothed, heart rate.
Ectopic beats and noise are the two main artefacts that can obscure the presence of true
physiological alternans. If the number of ectopic beats, displayed in the report as ‘bad
beats’, in each epic exceeds the threshold of 15% then the detection of true alternans
cannot be performed and the trend will be shaded grey in the corresponding areas. Figure
6.5 shows almost undetectable levels of ectopic beats. The noise trend represents the noise
level in the VM vector lead, a measure of overall noise in the system. Like ectopic beats,
the presence of excessive noise can prevent the detection of true physiological alternans. If
the noise level exceeds the threshold of 1.8 microvolts then the detection of true alternans
cannot be performed and the trend will be shaded grey in the corresponding areas. The
noise level in Figure 6.5 is <1 microvolt and within acceptable limits.
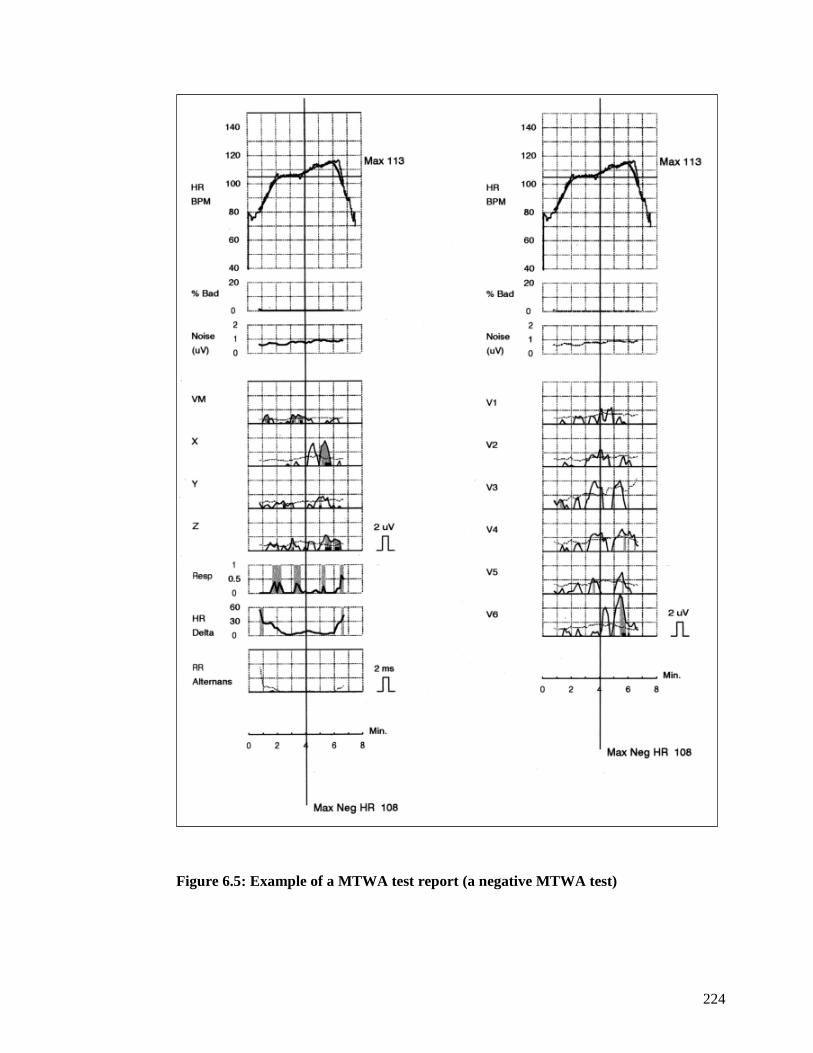
224
Figure 6.5: Example of a MTWA test report (a negative MTWA test)
225
Each alternans trend on the report displays alternans voltage, alternans noise and alternans
ratio. This information is illustrated in Figure 6.5. For each of the ten leads, the timing of
alternans activity is charted along the bottom of the report. Each square on the Y axis
represents 2 microvolts of alternans. The solid line outlining the grey shaded areas signifies
the alternans voltage and the dotted line represents the alternans noise. The shaded grey
area indicates the presence of statistically significant alternans, present for brief periods in
leads X, Z and V6 in Figure 6.5. The thicker black horizontal line below the shaded grey
areas represents artefact-free periods and signifies intervals where no artefacts are present
that could potentially cause alternans.
The main artefacts that can potentially create false alternans are displayed in three rows
along the bottom of the first page of the report, below the vector leads. These artefacts are;
respiration, heart rate delta and RR alternans. Trends of these artefacts are shaded in grey,
highlighting if acceptable levels have been exceeded. Premature ventricular beats can also
cause false alternans but these are usually short-lived and would not meet criteria for
sustained alternans.
Finally, at the bottom of both pages of the MTWA report is the automated interpretation of
whether or not sustained alternans is present and a clinical classification of the alternans
result (positive, negative or indeterminate). The report also suggests how a determinate test
may be achieved on retesting, if the result is indeterminate. Previous clinical studies have
suggested that immediately repeating indeterminate MTWA tests due to noise reduces the
rate of indeterminate tests by at least 50% (123).
6.2.4 MTWA Classification
Significant alternans is present when the following criteria are met; the voltage of alternans
is equal to or exceeds 1.9 microvolts, alternans activity is present in any of the vector leads
or a praecordial lead and an adjacent lead, and the alternans is sustained. The latter occurs
when alternans is consistently present above a patient-specific onset heart rate, the duration
of alternans is at least one minute and there is a period of artefact-free data. A positive test
occurs when sustained alternans occurs at rest or at an onset heart rate ≤ 110 bpm. Criteria
for a negative test are met when there is no sustained alternans and the maximum negative
226
heart rate is ≥ 105 bpm. Sustained alternans at an onset heart rate of > 110 bpm but with a
maximum negative heart rate > 105 bpm is also classified as a negative result. An
indeterminate test is one where the test does not fulfil either positive or negative test
criteria, due to physiological (for example insufficient heart rate, ectopic activity or noise)
or user reasons (for example poor skin preparation prior to application of the proprietary
electrodes). Nonsustained alternans activity would also be classified as an indeterminate
result.
An example of a positive MTWA test for a patient in this study is shown in Figure 6.6.
This test fulfils the criteria for a positive result. Alternans activity is present at the start of
exercise with an onset heart rate of 96 bpm and the voltage of alternans often exceeds the
required 1.9 microvolts. When the heart rate drops below 96 bpm, alternans activity is not
always present but does always occur above the onset heart rate of 96 bpm. Alternans
activity is always present in at least one vector or praecordial lead and adjacent praecordial
lead. There are many periods of artefact-free data, represented by the solid black horizontal
line below each shaded grey area, and the duration of alternans is greater than one minute.
Thus, this MTWA test is positive. Of note, there are few ectopic beats present in this test.
Noise levels are often high but do not exceed levels that prevent interpretation of this test.
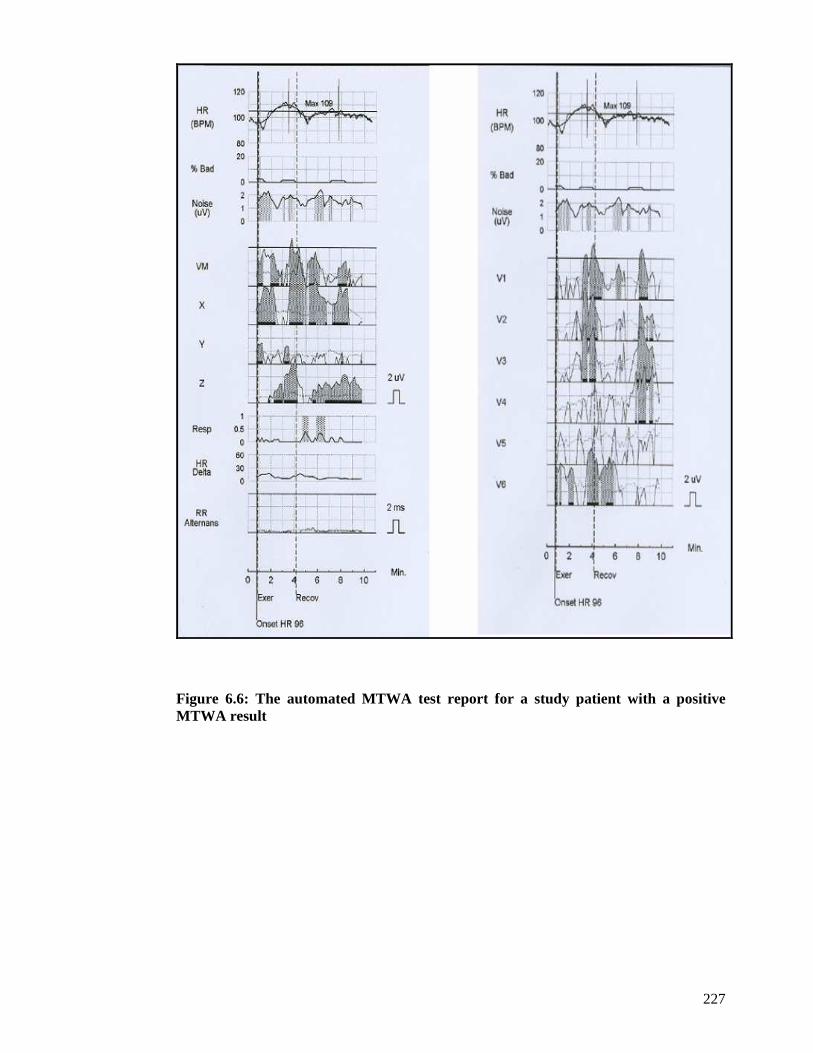
227
Figure 6.6: The automated MTWA test report for a study patient with a positive MTWA result
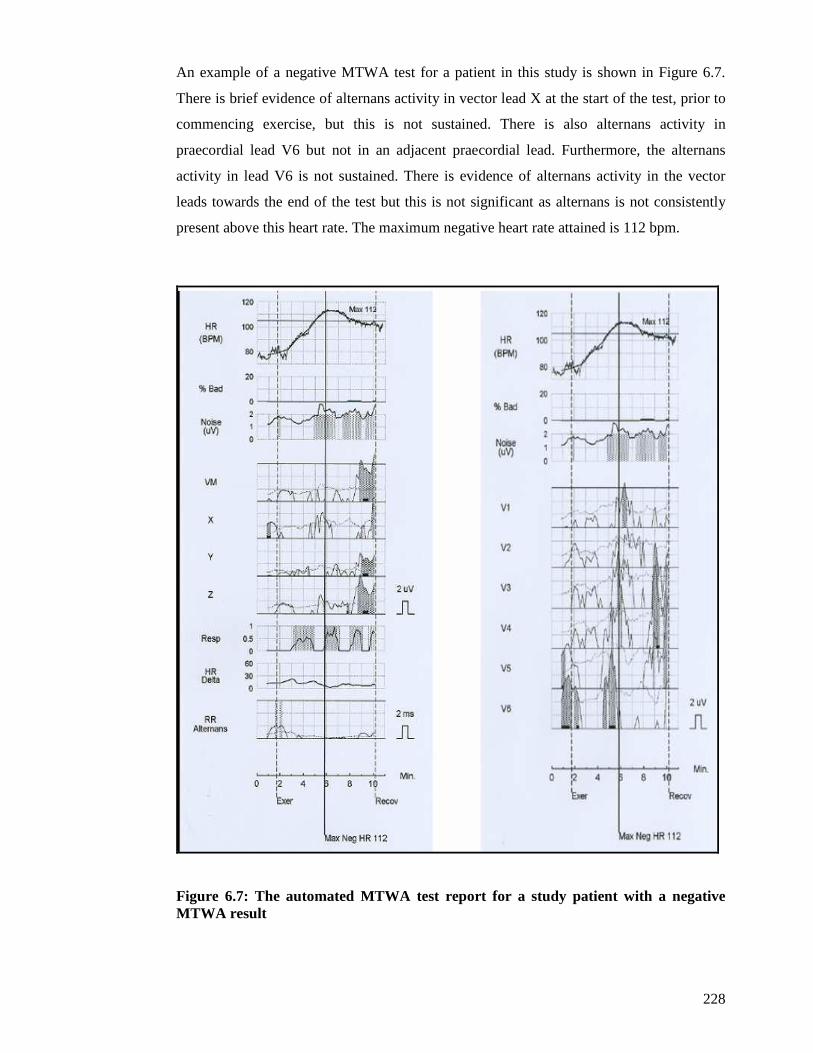
228
An example of a negative MTWA test for a patient in this study is shown in Figure 6.7.
There is brief evidence of alternans activity in vector lead X at the start of the test, prior to
commencing exercise, but this is not sustained. There is also alternans activity in
praecordial lead V6 but not in an adjacent praecordial lead. Furthermore, the alternans
activity in lead V6 is not sustained. There is evidence of alternans activity in the vector
leads towards the end of the test but this is not significant as alternans is not consistently
present above this heart rate. The maximum negative heart rate attained is 112 bpm.
Figure 6.7: The automated MTWA test report for a study patient with a negative MTWA result
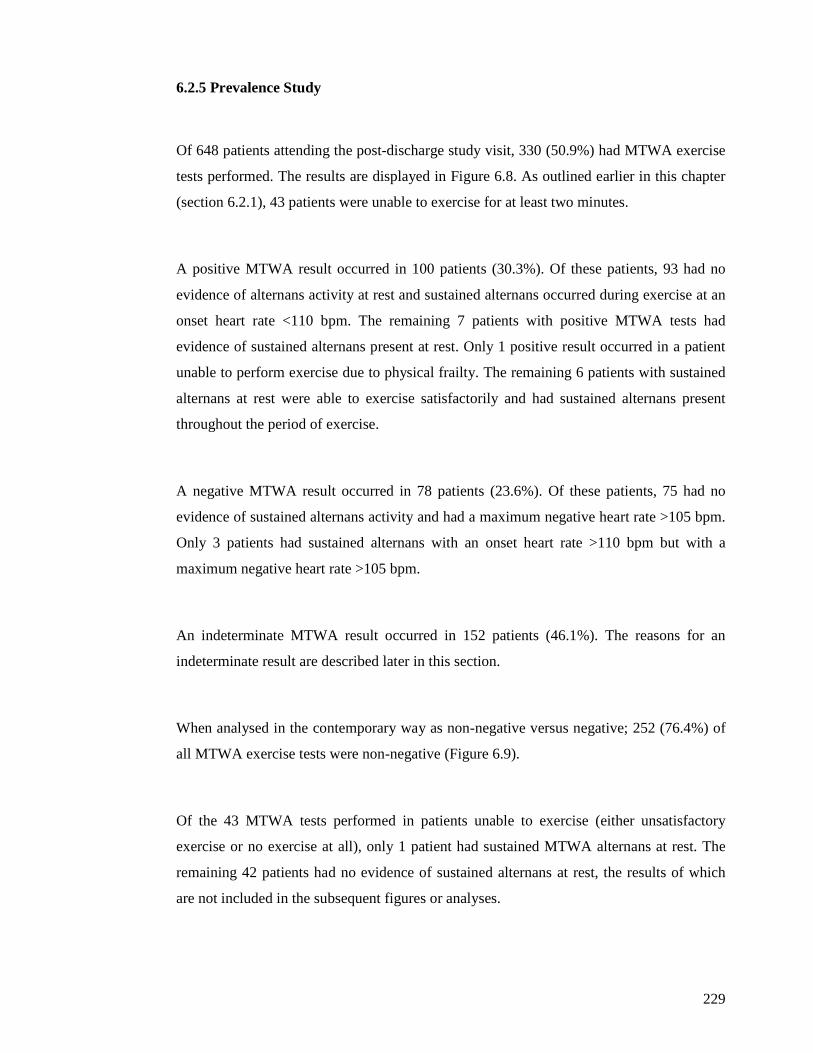
229
6.2.5 Prevalence Study
Of 648 patients attending the post-discharge study visit, 330 (50.9%) had MTWA exercise
tests performed. The results are displayed in Figure 6.8. As outlined earlier in this chapter
(section 6.2.1), 43 patients were unable to exercise for at least two minutes.
A positive MTWA result occurred in 100 patients (30.3%). Of these patients, 93 had no
evidence of alternans activity at rest and sustained alternans occurred during exercise at an
onset heart rate <110 bpm. The remaining 7 patients with positive MTWA tests had
evidence of sustained alternans present at rest. Only 1 positive result occurred in a patient
unable to perform exercise due to physical frailty. The remaining 6 patients with sustained
alternans at rest were able to exercise satisfactorily and had sustained alternans present
throughout the period of exercise.
A negative MTWA result occurred in 78 patients (23.6%). Of these patients, 75 had no
evidence of sustained alternans activity and had a maximum negative heart rate >105 bpm.
Only 3 patients had sustained alternans with an onset heart rate >110 bpm but with a
maximum negative heart rate >105 bpm.
An indeterminate MTWA result occurred in 152 patients (46.1%). The reasons for an
indeterminate result are described later in this section.
When analysed in the contemporary way as non-negative versus negative; 252 (76.4%) of
all MTWA exercise tests were non-negative (Figure 6.9).
Of the 43 MTWA tests performed in patients unable to exercise (either unsatisfactory
exercise or no exercise at all), only 1 patient had sustained MTWA alternans at rest. The
remaining 42 patients had no evidence of sustained alternans at rest, the results of which
are not included in the subsequent figures or analyses.
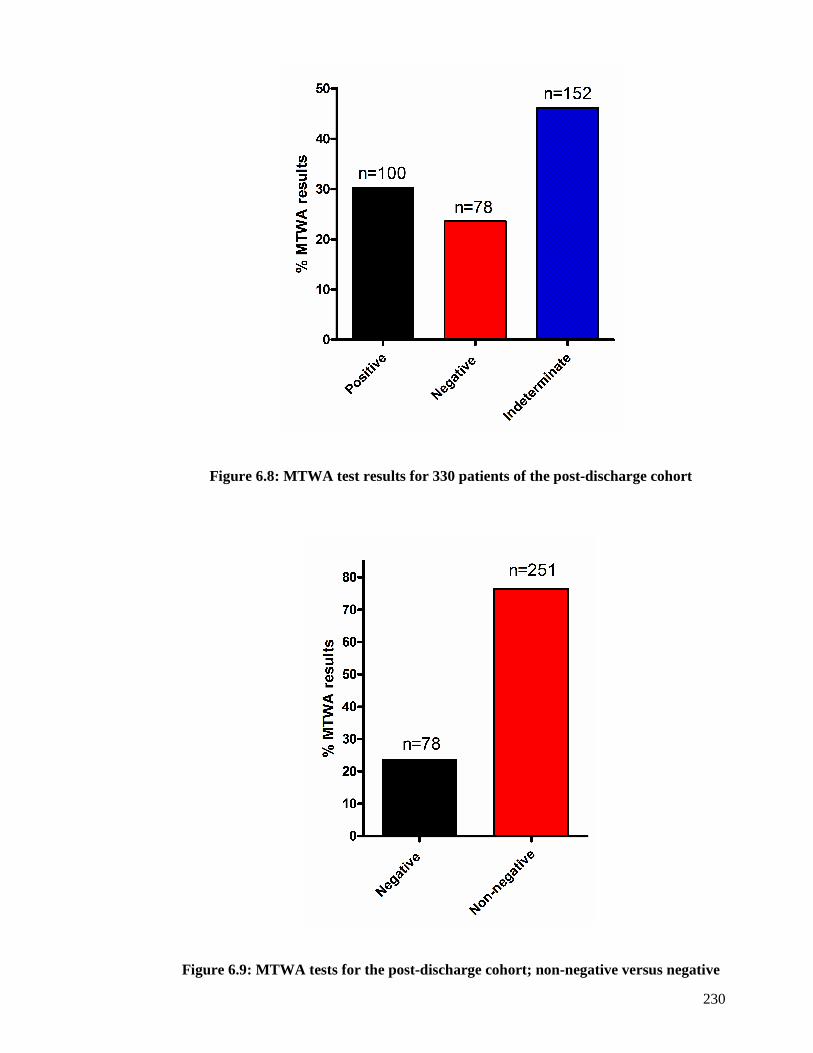
230
Figure 6.8: MTWA test results for 330 patients of the post-discharge cohort
Figure 6.9: MTWA tests for the post-discharge cohort; non-negative versus negative
231
Almost half of all MTWA exercise test results were indeterminate. The reasons for an
indeterminate MTWA test are displayed in Figure 6.10. The majority of these tests were
indeterminate because of a failure to achieve the required heart rate of 110bpm (75% of all
indeterminate tests). There were two principal reasons patients had an insufficient heart
rate. Firstly, some patients had a low resting heart rate, due to being on maximal dose of
beta-blocker therapy. These patients were often physically able to exercise for a sufficient
period of time, exceeding 10 minutes in many cases, but unable to elevate their heart rate
and it was clear that prolonging exercise would not achieve the desired heart rate of 110
bpm (represented as ‘chronotropic incompetence’ in Figure 6.11). The other reason for an
insufficient heart rate was exercise intolerance preventing attainment of a heart rate of
110bpm (represented as ‘physical limitations’ in Figure 6.11). The remaining MTWA tests
were indeterminate due to the presence of one of the following; ectopic activity (16.4%),
noise (5.9%), non-sustained alternans (2%) or a rapid rise in heart rate (0.7%).
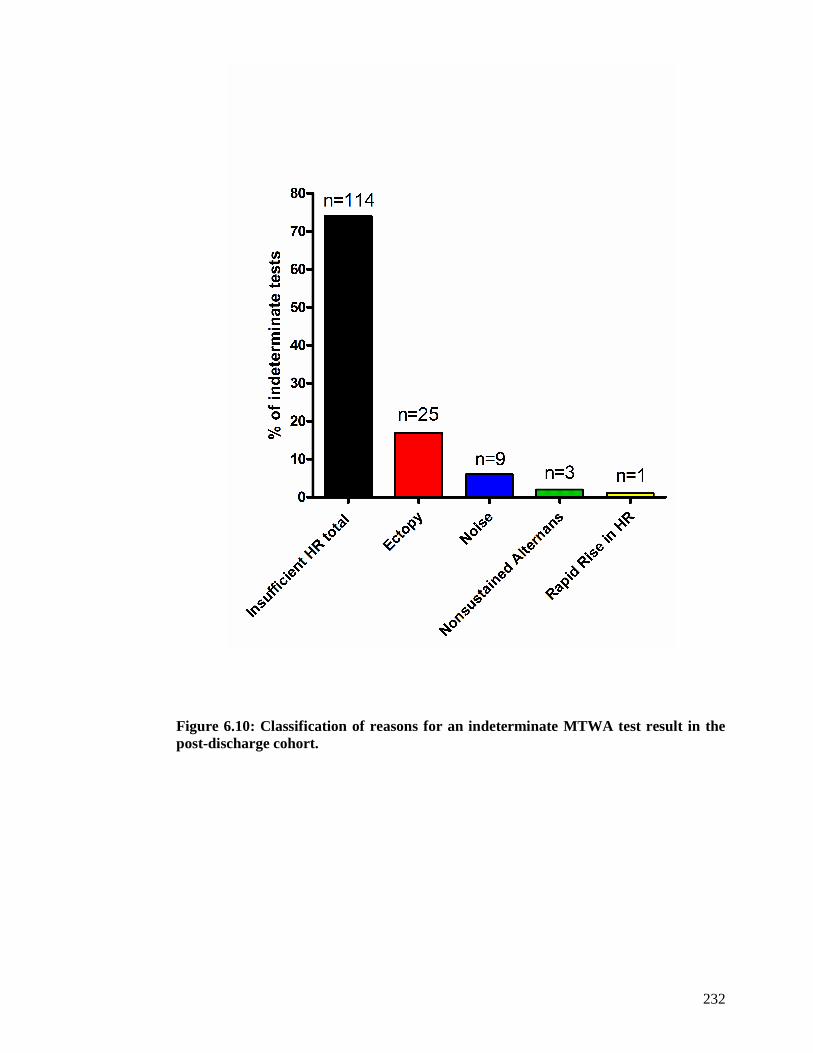
232
Figure 6.10: Classification of reasons for an indeterminate MTWA test result in the post-discharge cohort.
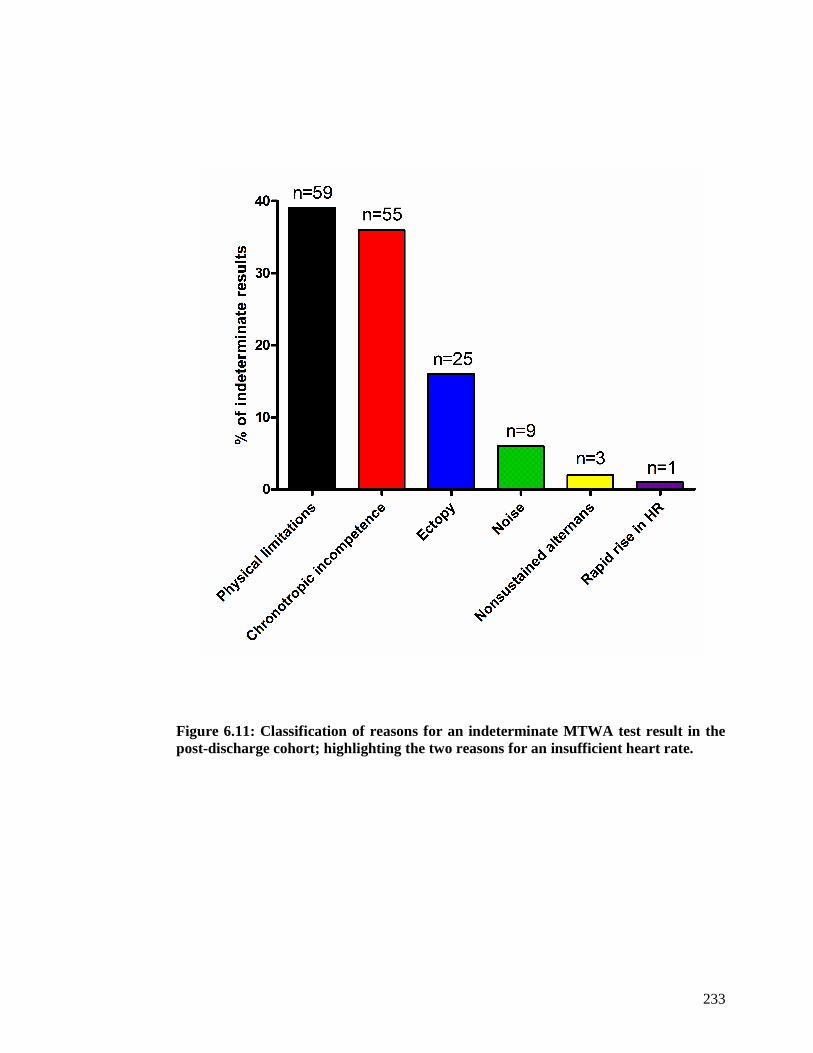
233
Figure 6.11: Classification of reasons for an indeterminate MTWA test result in the post-discharge cohort; highlighting the two reasons for an insufficient heart rate.
234
6.2.6 Functional capacity of study cohort
Assessing the cohort’s ability to complete the MTWA treadmill test was important for the
evaluation of the suitability of this test for a cohort of patients with HF.
Table 6-4 displays details of the exercise performed by those who managed MTWA
exercise testing for at least 2 minutes. The mean duration of exercise was 6.7 minutes and
patients achieved, on average, almost 70% of their predicted heart rate. The expenditure of
energy for each patient was calculated in metabolic equivalents of task (METs). Exercise
capacity is often reported in METs. MET capacity is the body’s ability to expend energy
compared to what it expends at rest. One MET is equivalent to the body’s metabolism at
rest. MET capacity is used as a prognostic indicator in patients with coronary artery
disease, an exercise capacity of at least 10 METs being associated with a good prognosis.
The mean METs for the patients who performed MTWA exercise testing in this study was
2.5.
There were several reasons why patients discontinued exercise (Table 6-4). The most
common reason was achievement of a peak heart rate. This encompassed patients who
reached the target heart rate for completing the MTWA test (110 bpm) and also those who
attained a maximum heart rate (below 110 bpm) that failed to rise with further exercise.
The latter consisted largely of patients on maximal dose beta-blockers who were unable to
elevate their heart rate to 110 bpm despite prolonged exercise with increases in both the
speed and gradient of the treadmill machine. However, the majority of patients
discontinued exercise because of various physical limitations (Table 6-4).

235
Table 6-4: Exercise parameters and reasons for terminating exercise for 330 patients
Exercise parameter Mean (SD) or n (%)
Duration of exercise (mins) 6.7 (3.9)
% predicted heart rate 69.5 (10.8)
Max exercise (METS) 2.5 (1.2)
Reason exercise stopped
Peak HR achieved
Fatigue
Breathless
Joint / muscle pain
Claudication
Pre-syncope
Chest pain
138 (41.8)
85 (25.8)
55 (16.7)
34 (10.3)
13 (3.9)
3 (0.9)
2 (0.6)
236
6.2.7 Optimal heart failure therapy
An assessment of whether or not patients were prescribed optimal HF therapy was made
for all patients undergoing a MTWA test (Figure 6.12). Optimal therapy for patients with
reduced left ventricular systolic function was defined as being prescribed the target dose of
at least two HF disease modifying agents, including a beta-blocker. The target dose was the
dosage used in the pivotal HF clinical trials. A past history of intolerance to specific HF
medications or being prescribed a sub-optimal dose, because of intolerance to higher doses,
was also classed as optimal medical therapy. In many cases it was unclear whether patients
were not prescribed optimal HF therapy because of previous intolerance or because of
failure to prescribe – these cases were recorded as ‘unknown’. Overall, 138 patients
(41.8%) completing MTWA exercise testing were prescribed optimal HF therapy. The
prescribing was sub-optimal in 93 patients (28.2%), and in 99 patients (30.8%) it was
unknown whether or not they were being optimally managed. Patients with indeterminate
MTWA test results were more likely to be on optimal medical therapy, than the other two
groups (p<0.0001). The corollary of this was also true; those with indeterminate MTWA
tests were less likely to be prescribed sub-optimal HF therapies than the other two groups.
The difference between the three groups in the proportions of patients with unknown
optimal HF therapy regimes was less striking.
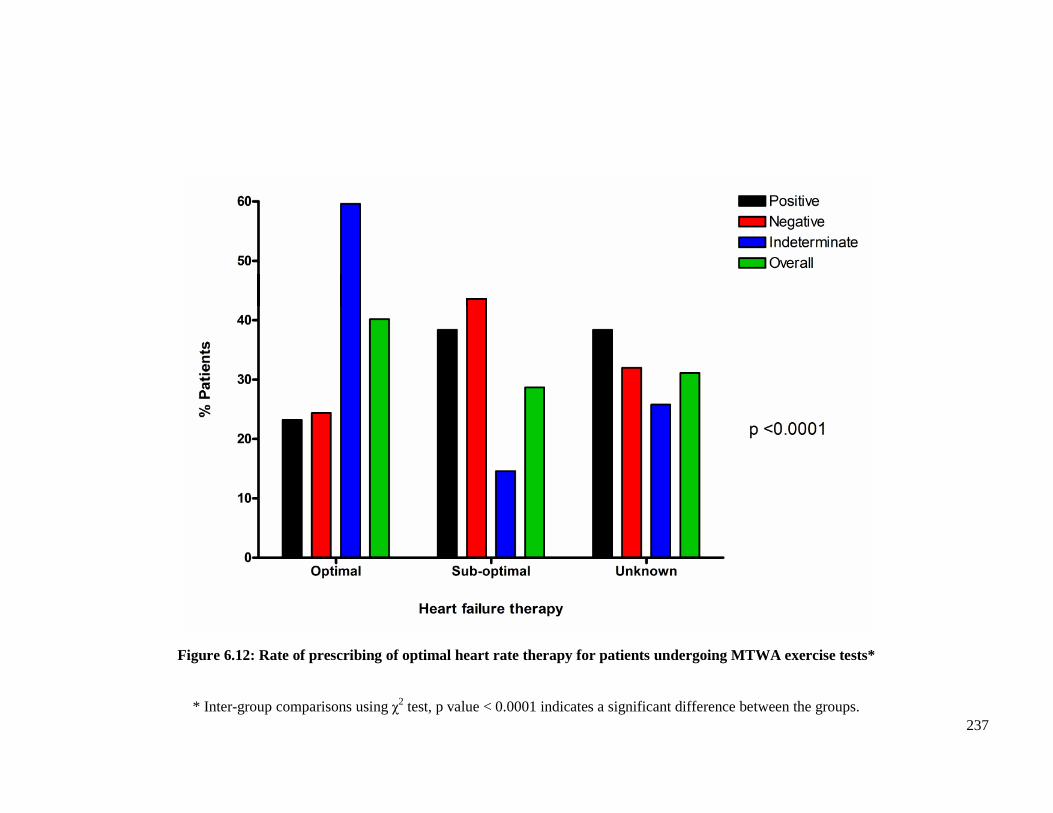
237
Figure 6.12: Rate of prescribing of optimal heart rate therapy for patients undergoing MTWA exercise tests*
* Inter-group comparisons using χ2 test, p value < 0.0001 indicates a significant difference between the groups.
238
6.2.8 Adjudication of MTWA test results
All automated computer-generated MTWA test results were interpreted by a single clinician
(Dr Rachel Myles) experienced in reviewing MTWA reports. The clinician was blinded to
both the patient details and the automated computer-generated result. Of 373 MTWA tests
(330 on exercise and 43 at rest), 358 automated results matched the interpreted results (96%).
For the 15 cases where a discrepancy existed between the clinician’s interpretation and the
computer-generated result, the clinician’s analysis was used for the results. All 15
discrepancies were from exercise MTWA tests. Of the 43 MTWA tests at rest, one test was
reported positive by both the clinician and the computer. The remaining 42 tests at rest were
reported as ‘MTWA not present at rest’ by both reporting modes.
6.2.9 Comparison with other MTWA clinical studies
The results of MTWA exercise testing for this study were compared to the major LVSD and
HF MTWA clinical studies that have been performed to date. Two comparisons were
performed; firstly the proportions of positive, negative and indeterminate results, (Figure 6.13),
and then the proportion of non-negative to negative results (Figure 6.14). In both figures, my
study is referred to as ‘Glasgow MTWA’.
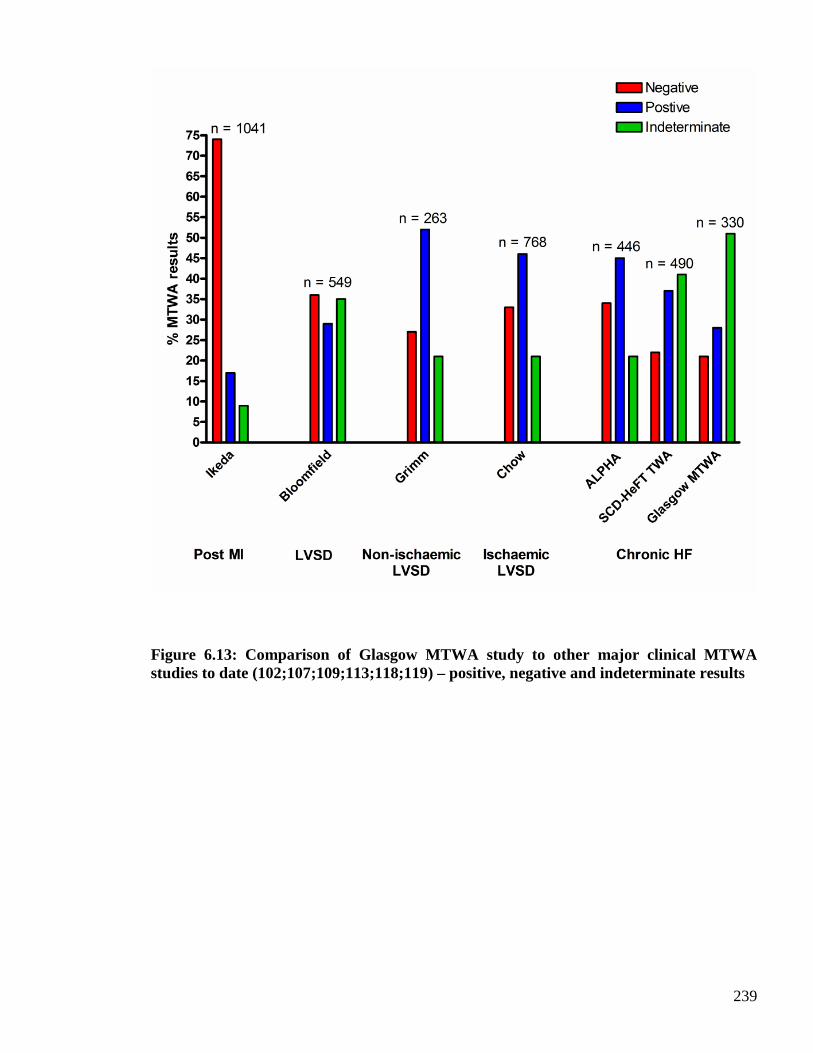
239
Figure 6.13: Comparison of Glasgow MTWA study to other major clinical MTWA studies to date (102;107;109;113;118;119) – positive, negative and indeterminate results
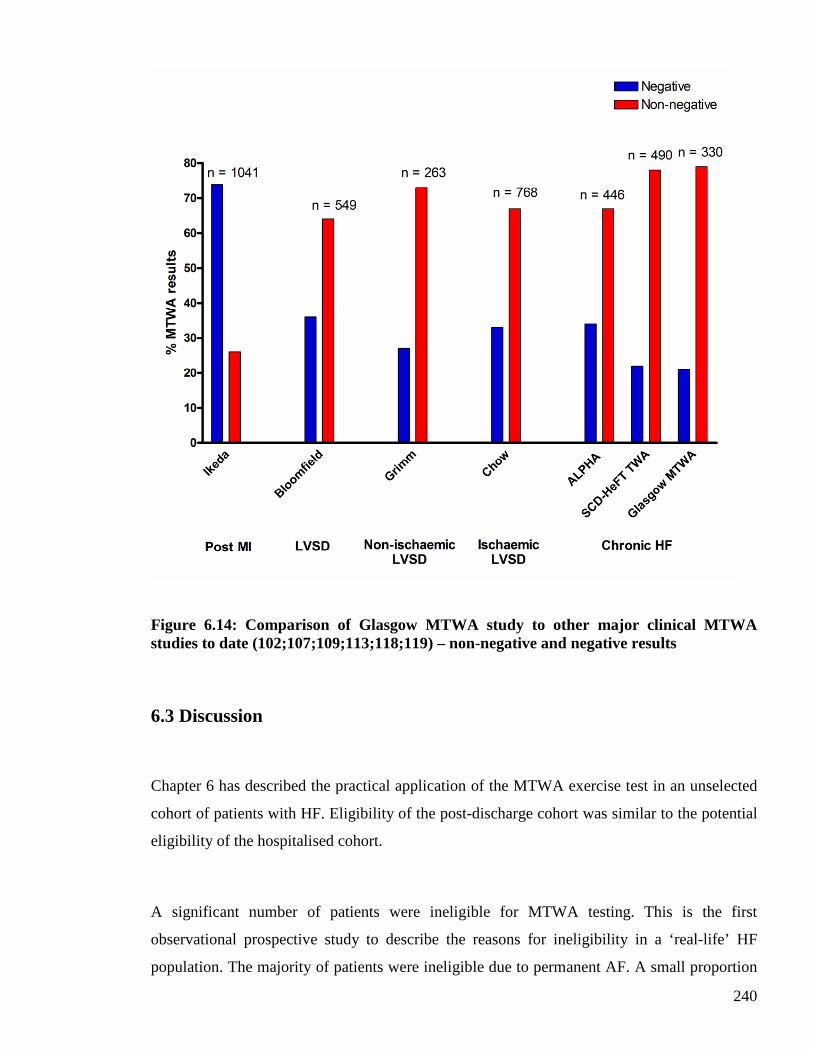
240
Figure 6.14: Comparison of Glasgow MTWA study to other major clinical MTWA studies to date (102;107;109;113;118;119) – non-negative and negative results
6.3 Discussion
Chapter 6 has described the practical application of the MTWA exercise test in an unselected
cohort of patients with HF. Eligibility of the post-discharge cohort was similar to the potential
eligibility of the hospitalised cohort.
A significant number of patients were ineligible for MTWA testing. This is the first
observational prospective study to describe the reasons for ineligibility in a ‘real-life’ HF
population. The majority of patients were ineligible due to permanent AF. A small proportion
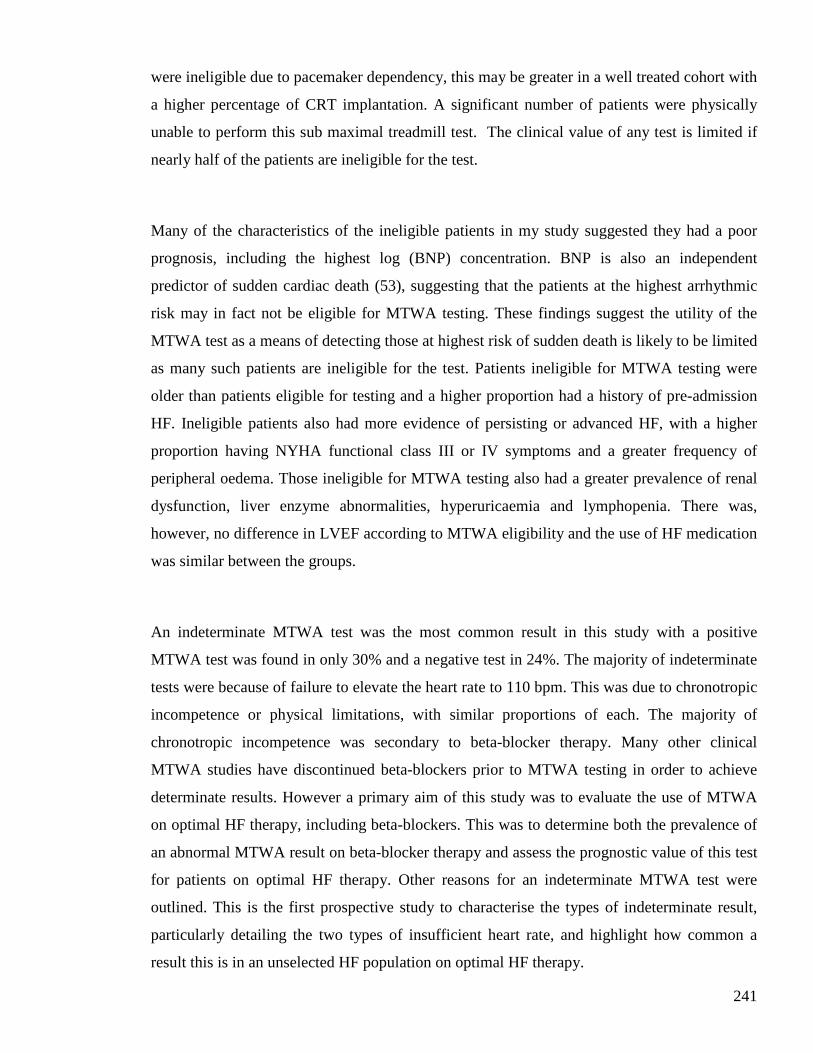
241
were ineligible due to pacemaker dependency, this may be greater in a well treated cohort with
a higher percentage of CRT implantation. A significant number of patients were physically
unable to perform this sub maximal treadmill test. The clinical value of any test is limited if
nearly half of the patients are ineligible for the test.
Many of the characteristics of the ineligible patients in my study suggested they had a poor
prognosis, including the highest log (BNP) concentration. BNP is also an independent
predictor of sudden cardiac death (53), suggesting that the patients at the highest arrhythmic
risk may in fact not be eligible for MTWA testing. These findings suggest the utility of the
MTWA test as a means of detecting those at highest risk of sudden death is likely to be limited
as many such patients are ineligible for the test. Patients ineligible for MTWA testing were
older than patients eligible for testing and a higher proportion had a history of pre-admission
HF. Ineligible patients also had more evidence of persisting or advanced HF, with a higher
proportion having NYHA functional class III or IV symptoms and a greater frequency of
peripheral oedema. Those ineligible for MTWA testing also had a greater prevalence of renal
dysfunction, liver enzyme abnormalities, hyperuricaemia and lymphopenia. There was,
however, no difference in LVEF according to MTWA eligibility and the use of HF medication
was similar between the groups.
An indeterminate MTWA test was the most common result in this study with a positive
MTWA test was found in only 30% and a negative test in 24%. The majority of indeterminate
tests were because of failure to elevate the heart rate to 110 bpm. This was due to chronotropic
incompetence or physical limitations, with similar proportions of each. The majority of
chronotropic incompetence was secondary to beta-blocker therapy. Many other clinical
MTWA studies have discontinued beta-blockers prior to MTWA testing in order to achieve
determinate results. However a primary aim of this study was to evaluate the use of MTWA
on optimal HF therapy, including beta-blockers. This was to determine both the prevalence of
an abnormal MTWA result on beta-blocker therapy and assess the prognostic value of this test
for patients on optimal HF therapy. Other reasons for an indeterminate MTWA test were
outlined. This is the first prospective study to characterise the types of indeterminate result,
particularly detailing the two types of insufficient heart rate, and highlight how common a
result this is in an unselected HF population on optimal HF therapy.
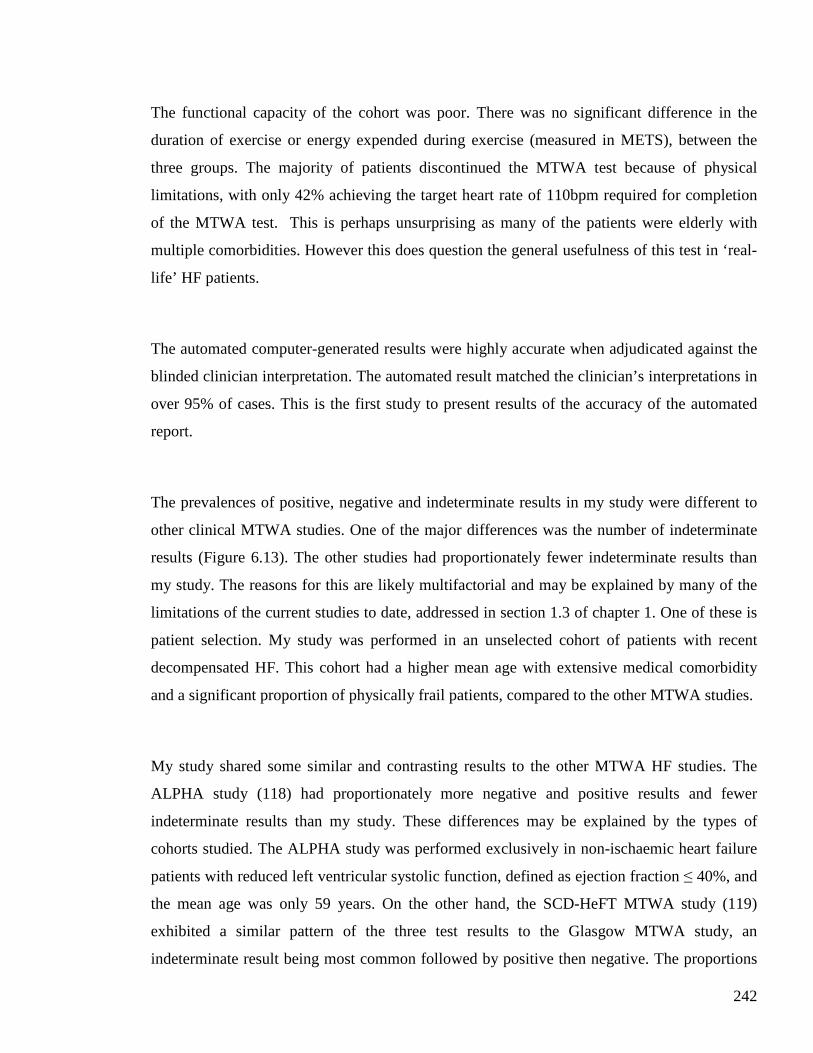
242
The functional capacity of the cohort was poor. There was no significant difference in the
duration of exercise or energy expended during exercise (measured in METS), between the
three groups. The majority of patients discontinued the MTWA test because of physical
limitations, with only 42% achieving the target heart rate of 110bpm required for completion
of the MTWA test. This is perhaps unsurprising as many of the patients were elderly with
multiple comorbidities. However this does question the general usefulness of this test in ‘real-
life’ HF patients.
The automated computer-generated results were highly accurate when adjudicated against the
blinded clinician interpretation. The automated result matched the clinician’s interpretations in
over 95% of cases. This is the first study to present results of the accuracy of the automated
report.
The prevalences of positive, negative and indeterminate results in my study were different to
other clinical MTWA studies. One of the major differences was the number of indeterminate
results (Figure 6.13). The other studies had proportionately fewer indeterminate results than
my study. The reasons for this are likely multifactorial and may be explained by many of the
limitations of the current studies to date, addressed in section 1.3 of chapter 1. One of these is
patient selection. My study was performed in an unselected cohort of patients with recent
decompensated HF. This cohort had a higher mean age with extensive medical comorbidity
and a significant proportion of physically frail patients, compared to the other MTWA studies.
My study shared some similar and contrasting results to the other MTWA HF studies. The
ALPHA study (118) had proportionately more negative and positive results and fewer
indeterminate results than my study. These differences may be explained by the types of
cohorts studied. The ALPHA study was performed exclusively in non-ischaemic heart failure
patients with reduced left ventricular systolic function, defined as ejection fraction ≤ 40%, and
the mean age was only 59 years. On the other hand, the SCD-HeFT MTWA study (119)
exhibited a similar pattern of the three test results to the Glasgow MTWA study, an
indeterminate result being most common followed by positive then negative. The proportions
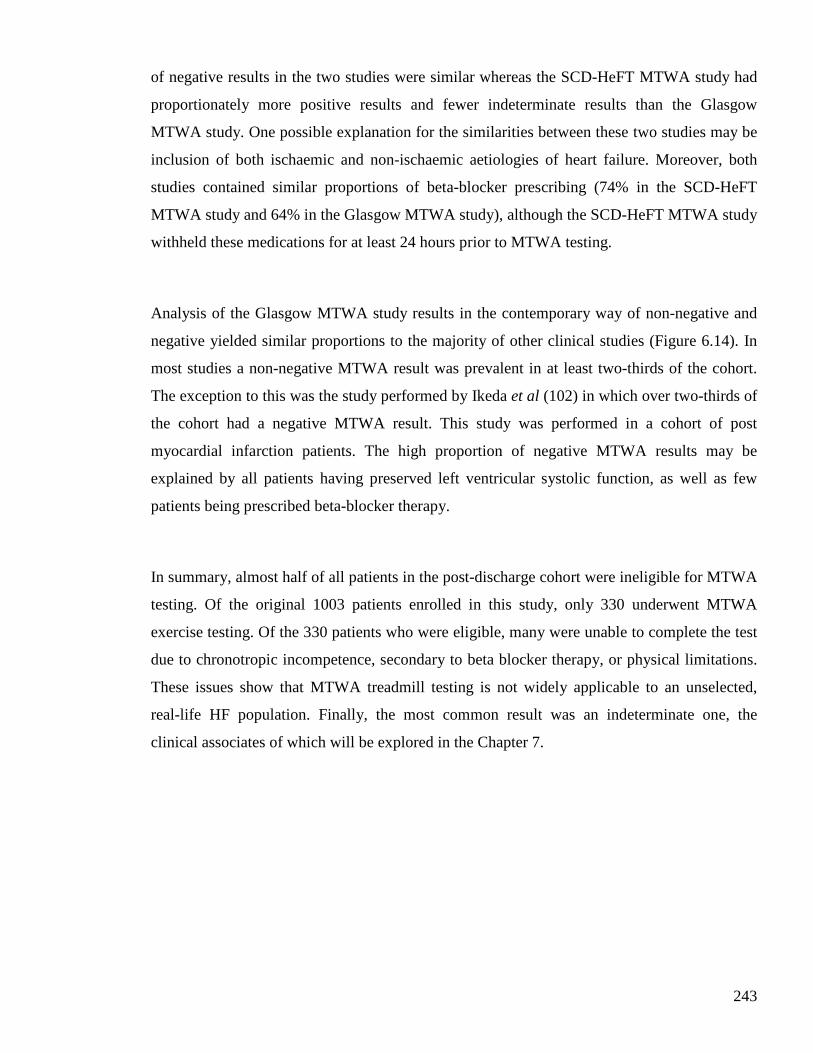
243
of negative results in the two studies were similar whereas the SCD-HeFT MTWA study had
proportionately more positive results and fewer indeterminate results than the Glasgow
MTWA study. One possible explanation for the similarities between these two studies may be
inclusion of both ischaemic and non-ischaemic aetiologies of heart failure. Moreover, both
studies contained similar proportions of beta-blocker prescribing (74% in the SCD-HeFT
MTWA study and 64% in the Glasgow MTWA study), although the SCD-HeFT MTWA study
withheld these medications for at least 24 hours prior to MTWA testing.
Analysis of the Glasgow MTWA study results in the contemporary way of non-negative and
negative yielded similar proportions to the majority of other clinical studies (Figure 6.14). In
most studies a non-negative MTWA result was prevalent in at least two-thirds of the cohort.
The exception to this was the study performed by Ikeda et al (102) in which over two-thirds of
the cohort had a negative MTWA result. This study was performed in a cohort of post
myocardial infarction patients. The high proportion of negative MTWA results may be
explained by all patients having preserved left ventricular systolic function, as well as few
patients being prescribed beta-blocker therapy.
In summary, almost half of all patients in the post-discharge cohort were ineligible for MTWA
testing. Of the original 1003 patients enrolled in this study, only 330 underwent MTWA
exercise testing. Of the 330 patients who were eligible, many were unable to complete the test
due to chronotropic incompetence, secondary to beta blocker therapy, or physical limitations.
These issues show that MTWA treadmill testing is not widely applicable to an unselected,
real-life HF population. Finally, the most common result was an indeterminate one, the
clinical associates of which will be explored in the Chapter 7.

244
CHAPTER SEVEN
CLINICAL ASSOCIATES OF
MICROVOLT T-WAVE ALTERNANS
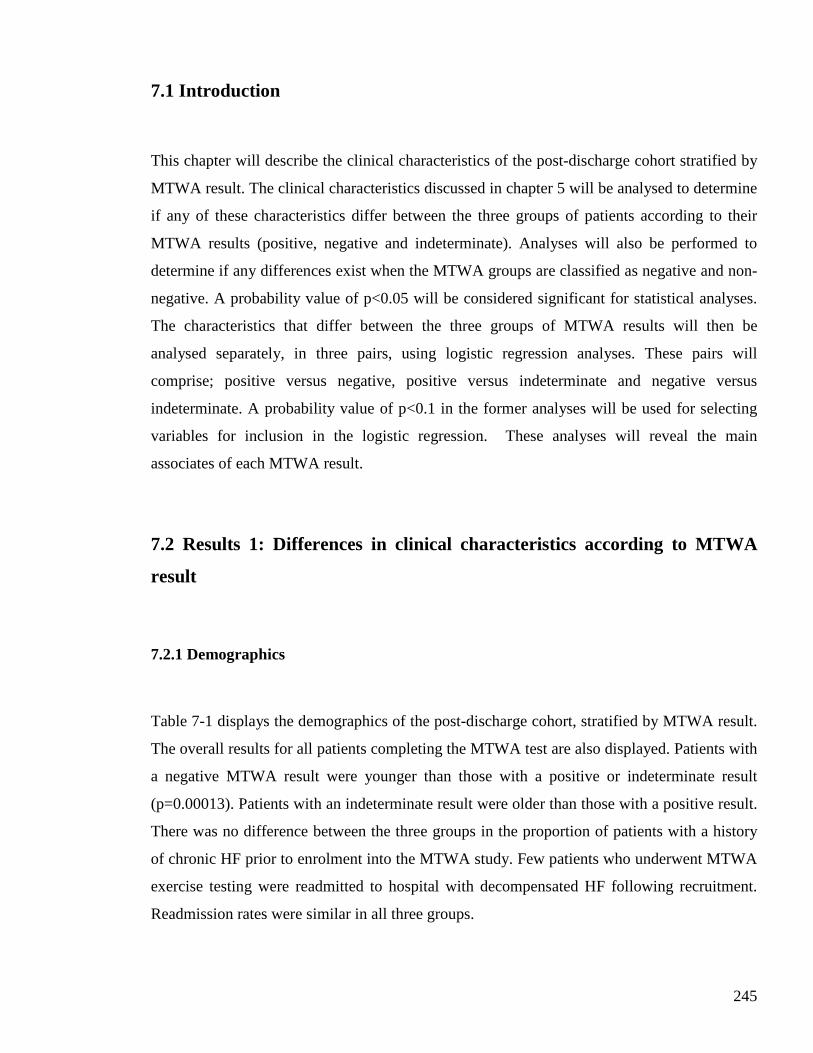
245
7.1 Introduction
This chapter will describe the clinical characteristics of the post-discharge cohort stratified by
MTWA result. The clinical characteristics discussed in chapter 5 will be analysed to determine
if any of these characteristics differ between the three groups of patients according to their
MTWA results (positive, negative and indeterminate). Analyses will also be performed to
determine if any differences exist when the MTWA groups are classified as negative and non-
negative. A probability value of p<0.05 will be considered significant for statistical analyses.
The characteristics that differ between the three groups of MTWA results will then be
analysed separately, in three pairs, using logistic regression analyses. These pairs will
comprise; positive versus negative, positive versus indeterminate and negative versus
indeterminate. A probability value of p<0.1 in the former analyses will be used for selecting
variables for inclusion in the logistic regression. These analyses will reveal the main
associates of each MTWA result.
7.2 Results 1: Differences in clinical characteristics according to MTWA
result
7.2.1 Demographics
Table 7-1 displays the demographics of the post-discharge cohort, stratified by MTWA result.
The overall results for all patients completing the MTWA test are also displayed. Patients with
a negative MTWA result were younger than those with a positive or indeterminate result
(p=0.00013). Patients with an indeterminate result were older than those with a positive result.
There was no difference between the three groups in the proportion of patients with a history
of chronic HF prior to enrolment into the MTWA study. Few patients who underwent MTWA
exercise testing were readmitted to hospital with decompensated HF following recruitment.
Readmission rates were similar in all three groups.
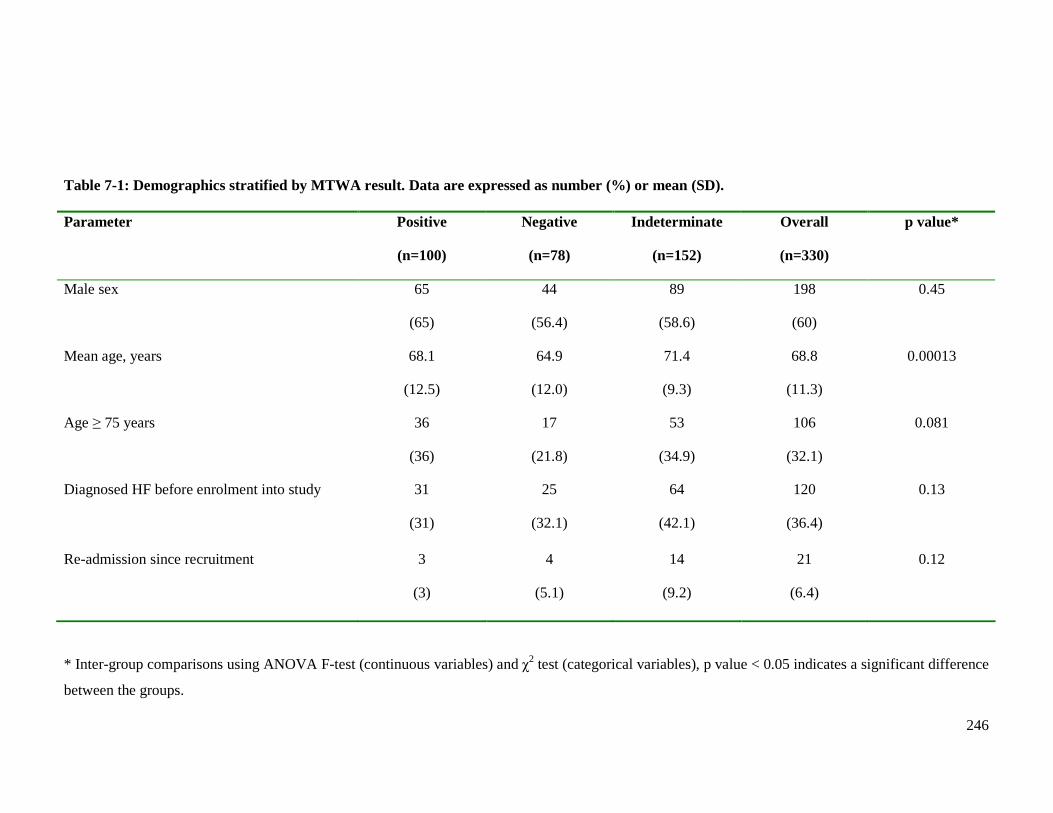
246
Table 7-1: Demographics stratified by MTWA result. Data are expressed as number (%) or mean (SD). Parameter Positive
(n=100)
Negative
(n=78)
Indeterminate
(n=152)
Overall
(n=330)
p value*
Male sex 65
(65)
44
(56.4)
89
(58.6)
198
(60)
0.45
Mean age, years 68.1
(12.5)
64.9
(12.0)
71.4
(9.3)
68.8
(11.3)
0.00013
Age ≥ 75 years 36
(36)
17
(21.8)
53
(34.9)
106
(32.1)
0.081
Diagnosed HF before enrolment into study 31
(31)
25
(32.1)
64
(42.1)
120
(36.4)
0.13
Re-admission since recruitment 3
(3)
4
(5.1)
14
(9.2)
21
(6.4)
0.12
* Inter-group comparisons using ANOVA F-test (continuous variables) and χ2 test (categorical variables), p value < 0.05 indicates a significant difference
between the groups.
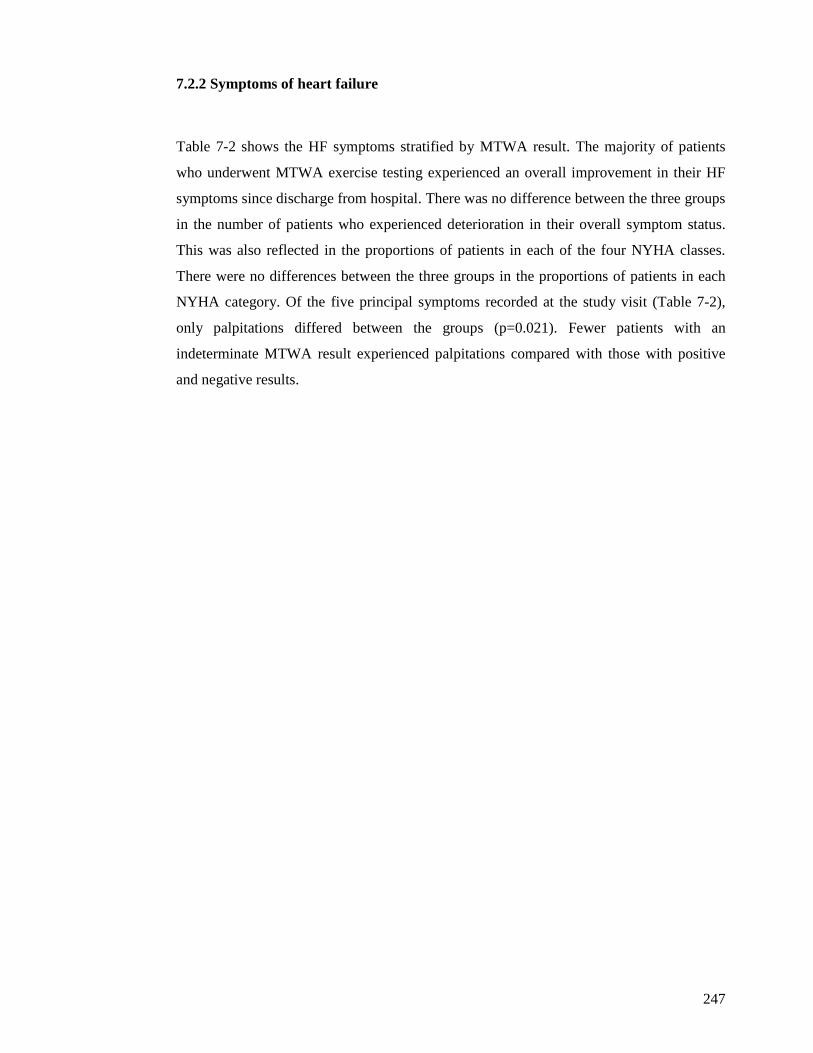
247
7.2.2 Symptoms of heart failure
Table 7-2 shows the HF symptoms stratified by MTWA result. The majority of patients
who underwent MTWA exercise testing experienced an overall improvement in their HF
symptoms since discharge from hospital. There was no difference between the three groups
in the number of patients who experienced deterioration in their overall symptom status.
This was also reflected in the proportions of patients in each of the four NYHA classes.
There were no differences between the three groups in the proportions of patients in each
NYHA category. Of the five principal symptoms recorded at the study visit (Table 7-2),
only palpitations differed between the groups (p=0.021). Fewer patients with an
indeterminate MTWA result experienced palpitations compared with those with positive
and negative results.
248
Table 7-2: Current heart failure symptoms stratified by MTWA result. Data are expressed as number (%). Symptom Positive
(n=100)
Negative
(n=78)
Indeterminate
(n=152)
Overall
(n=330)
p value*
Deterioration in HF symptoms
since discharge
10 (10) 5 (6.4) 17 (11.2) 32 (9.7) 0.51
NYHA Class I
II
III
IV
3 (3)
66 (66)
31 (31)
0 (0)
7 (9.0)
56 (71.8)
15 (19.2)
0 (0)
6 (3.9)
99 (65.1)
46 (30.3)
1 (0.7)
16 (4.9)
221 (66.9)
92 (27.9)
1 (0.3)
0.24
Paroxysmal nocturnal dyspnoea 13 (13) 13 (16.7) 16 (10.5) 42 (12.7) 0.41
Orthopnoea 27 (27) 12 (15.4) 38 (25) 77 (23.3) 0.15
Ankle swelling 23 (23) 13 (16.7) 37 (24.3) 73 (22.1) 0.4
Palpitations 29 (29) 22 (28.2) 24 (15.8) 75 (22.7) 0.021
Wheeze 18 (18) 21 (26.9) 33 (21.7) 72 (21.8) 0.36
* Inter-group comparisons using χ2 test, p value < 0.05 indicates a significant difference between the groups.
249
7.2.3 Common medical comorbidity
The common medical comorbidities, stratified by MTWA result, are shown in Table 7-3.
The prevalences of most comorbidities were similar in all three groups. The exceptions to
this were MI and AF.
Patients with an indeterminate or positive MTWA result were more likely to have had a
previous MI than those with a negative test, those in the indeterminate group having the
highest prevalence of this condition (p=0.016). The prevalences of angina, PCI and CABG
were also lowest amongst those with a negative result, although these were not statistically
significant.
Sinus rhythm is mandatory for the spectral method of MTWA exercise testing used in this
study. Thus all patients who underwent MTWA testing were in sinus rhythm at the time of
the study visit. A history of AF for these patients meant either past AF, paroxysmal AF or
permanent AF at the time of enrolment into the study. All patients with permanent AF
during hospitalisation, and subsequently eligible for MTWA testing, would have
spontaneously cardioverted to sinus rhythm by the study visit. A history of AF was more
common amongst those with an indeterminate result than the other two groups (p=0.015).
Anaemia was more common amongst patients with an indeterminate result than the other
two groups, although this difference only showed a trend towards being statistically
significant (p=0.08).
The prevalences of hypertension, cerebrovascular disease, diabetes mellitus, cancer,
peripheral arterial disease and osteoarthritis were all greatest amongst patients with an
indeterminate MTWA result, although the differences were not statistically significant.
COPD was more common amongst patients with a negative result, although the difference
between the three groups was not statistically significant.
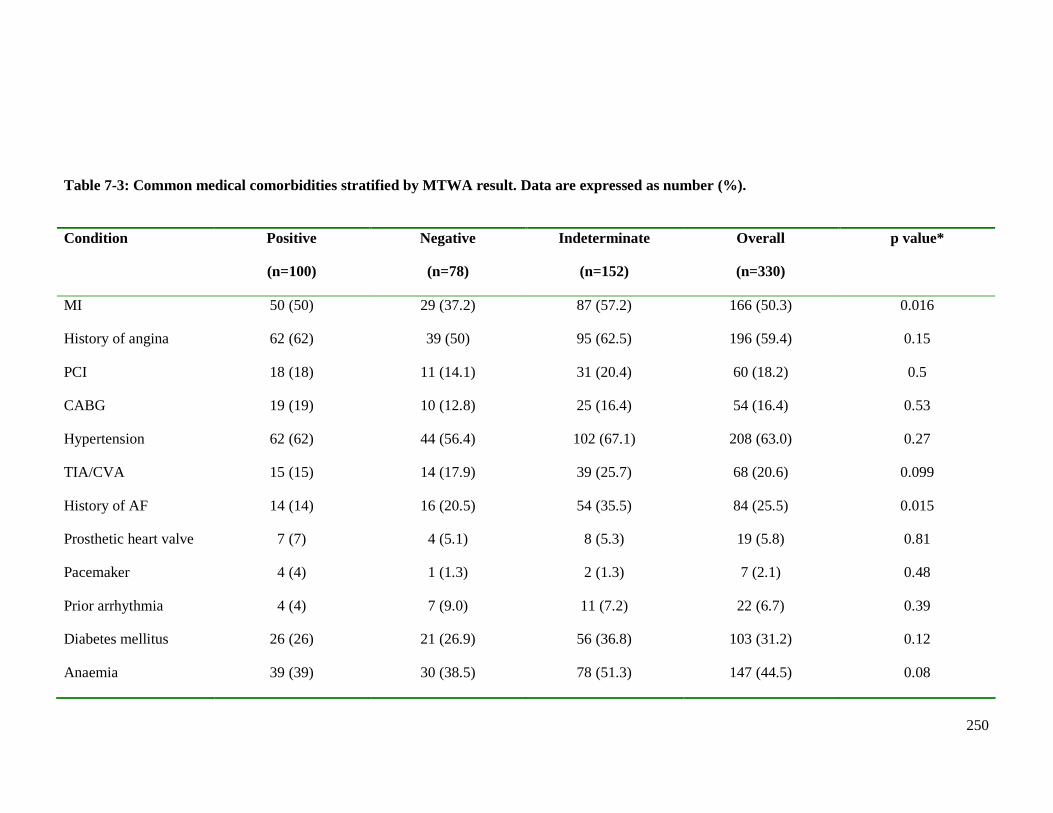
250
Table 7-3: Common medical comorbidities stratified by MTWA result. Data are expressed as number (%).
Condition Positive
(n=100)
Negative
(n=78)
Indeterminate
(n=152)
Overall
(n=330)
p value*
MI 50 (50) 29 (37.2) 87 (57.2) 166 (50.3) 0.016
History of angina 62 (62) 39 (50) 95 (62.5) 196 (59.4) 0.15
PCI 18 (18) 11 (14.1) 31 (20.4) 60 (18.2) 0.5
CABG 19 (19) 10 (12.8) 25 (16.4) 54 (16.4) 0.53
Hypertension 62 (62) 44 (56.4) 102 (67.1) 208 (63.0) 0.27
TIA/CVA 15 (15) 14 (17.9) 39 (25.7) 68 (20.6) 0.099
History of AF 14 (14) 16 (20.5) 54 (35.5) 84 (25.5) 0.015
Prosthetic heart valve 7 (7) 4 (5.1) 8 (5.3) 19 (5.8) 0.81
Pacemaker 4 (4) 1 (1.3) 2 (1.3) 7 (2.1) 0.48
Prior arrhythmia 4 (4) 7 (9.0) 11 (7.2) 22 (6.7) 0.39
Diabetes mellitus 26 (26) 21 (26.9) 56 (36.8) 103 (31.2) 0.12
Anaemia 39 (39) 30 (38.5) 78 (51.3) 147 (44.5) 0.08
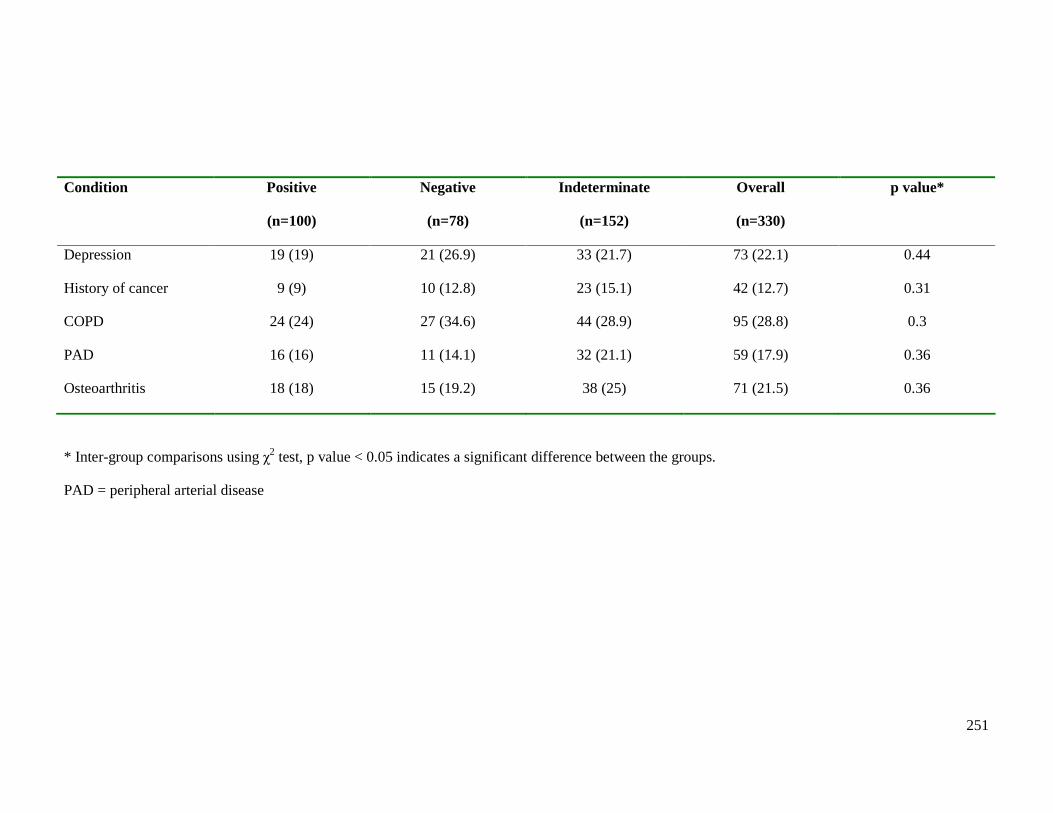
251
Condition Positive
(n=100)
Negative
(n=78)
Indeterminate
(n=152)
Overall
(n=330)
p value*
Depression 19 (19) 21 (26.9) 33 (21.7) 73 (22.1) 0.44
History of cancer 9 (9) 10 (12.8) 23 (15.1) 42 (12.7) 0.31
COPD 24 (24) 27 (34.6) 44 (28.9) 95 (28.8) 0.3
PAD 16 (16) 11 (14.1) 32 (21.1) 59 (17.9) 0.36
Osteoarthritis 18 (18) 15 (19.2) 38 (25) 71 (21.5) 0.36
* Inter-group comparisons using χ2 test, p value < 0.05 indicates a significant difference between the groups.
PAD = peripheral arterial disease
252
7.2.4 Medications
The prescribing of HF medications, stratified by MTWA result, is shown in Table 7-4.
Optimal therapy for patients with HF-REF was as previously defined in Chapter 6 (section
6.2.7). Patients with an indeterminate MTWA test were most likely to be prescribed
optimal therapy, with more than double the proportion of patients on optimal therapy than
either the positive or negative groups (p<0.0001).
Consequently there were significant differences between the three groups in the
proportions of patients prescribed beta-blocker therapy (p<0.0001). As expected, the
pattern was similar to optimal therapy prescribing, those with an indeterminate MTWA test
having the highest prescribing of beta-blocker therapy - almost 80%. Significantly fewer
patients with a positive MTWA test were prescribed beta-blockers with the lowest
prescribing amongst those with a negative test. The proportion of patients prescribed
diuretics showed a trend towards greater prevalence amongst those with a positive or
indeterminate MTWA result, although the difference was not statistically significant
(p=0.059). The proportion of patients prescribed ACE inhibitors showed a trend towards
greater prevalence amongst those with a positive MTWA result (p=0.066). The prescribing
of ARBs, aldosterone antagonists and digoxin was similar in all three groups.
The frequencies of prescribing of common cardiovascular medications, stratified by
MTWA result, are shown in Table 7-5. The only significant difference between the three
groups was the prescribing of statin therapy (p=0.029). Three-quarters of all patients who
underwent MTWA exercise testing were taking statins. Statins were used most commonly
in patients with an indeterminate MTWA result; over 80% were prescribed this therapy.
This finding is consistent with a greater prevalence of coronary heart disease amongst this
group of patients. Statin prescribing was similar in the positive and negative groups. The
frequencies of prescribing of common non-cardiovascular medications, stratified by
MTWA result, are shown in Table 7-6. The prescribing of bronchial inhalers was highest
amongst the negative group, consistent with a greater prevalence of COPD in this group,
although not a statistically significant difference. The proportions of patients prescribed
other non-cardiovascular medications were similar in all three groups.
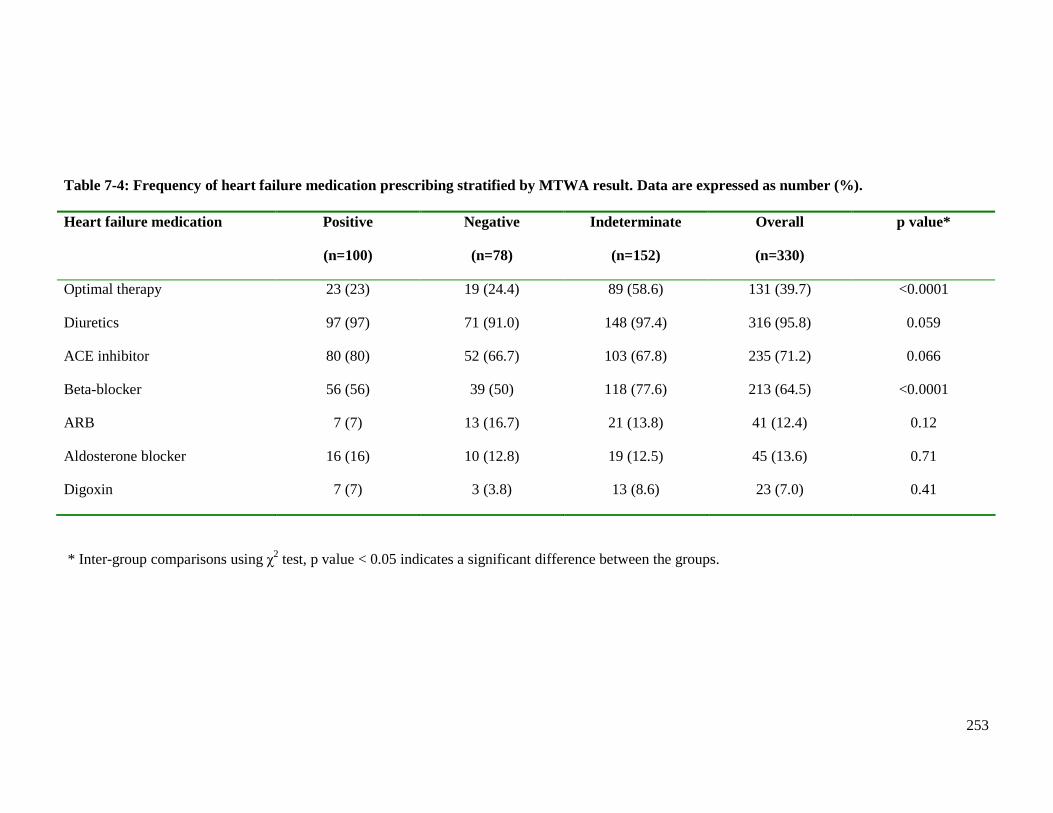
253
Table 7-4: Frequency of heart failure medication prescribing stratified by MTWA result. Data are expressed as number (%). Heart failure medication Positive
(n=100)
Negative
(n=78)
Indeterminate
(n=152)
Overall
(n=330)
p value*
Optimal therapy 23 (23) 19 (24.4) 89 (58.6) 131 (39.7) <0.0001
Diuretics 97 (97) 71 (91.0) 148 (97.4) 316 (95.8) 0.059
ACE inhibitor 80 (80) 52 (66.7) 103 (67.8) 235 (71.2) 0.066
Beta-blocker 56 (56) 39 (50) 118 (77.6) 213 (64.5) <0.0001
ARB 7 (7) 13 (16.7) 21 (13.8) 41 (12.4) 0.12
Aldosterone blocker 16 (16) 10 (12.8) 19 (12.5) 45 (13.6) 0.71
Digoxin 7 (7) 3 (3.8) 13 (8.6) 23 (7.0) 0.41
* Inter-group comparisons using χ2 test, p value < 0.05 indicates a significant difference between the groups.
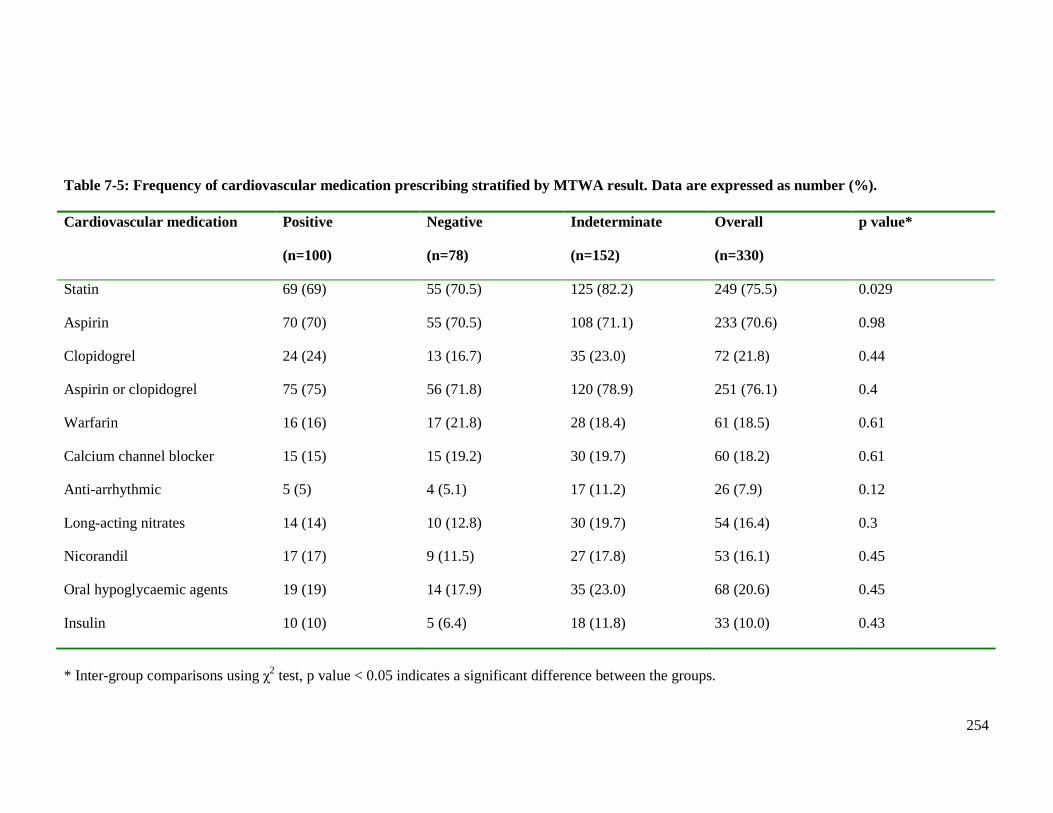
254
Table 7-5: Frequency of cardiovascular medication prescribing stratified by MTWA result. Data are expressed as number (%). Cardiovascular medication Positive
(n=100)
Negative
(n=78)
Indeterminate
(n=152)
Overall
(n=330)
p value*
Statin 69 (69) 55 (70.5) 125 (82.2) 249 (75.5) 0.029
Aspirin 70 (70) 55 (70.5) 108 (71.1) 233 (70.6) 0.98
Clopidogrel 24 (24) 13 (16.7) 35 (23.0) 72 (21.8) 0.44
Aspirin or clopidogrel 75 (75) 56 (71.8) 120 (78.9) 251 (76.1) 0.4
Warfarin 16 (16) 17 (21.8) 28 (18.4) 61 (18.5) 0.61
Calcium channel blocker 15 (15) 15 (19.2) 30 (19.7) 60 (18.2) 0.61
Anti-arrhythmic 5 (5) 4 (5.1) 17 (11.2) 26 (7.9) 0.12
Long-acting nitrates 14 (14) 10 (12.8) 30 (19.7) 54 (16.4) 0.3
Nicorandil 17 (17) 9 (11.5) 27 (17.8) 53 (16.1) 0.45
Oral hypoglycaemic agents 19 (19) 14 (17.9) 35 (23.0) 68 (20.6) 0.45
Insulin 10 (10) 5 (6.4) 18 (11.8) 33 (10.0) 0.43
* Inter-group comparisons using χ2 test, p value < 0.05 indicates a significant difference between the groups.
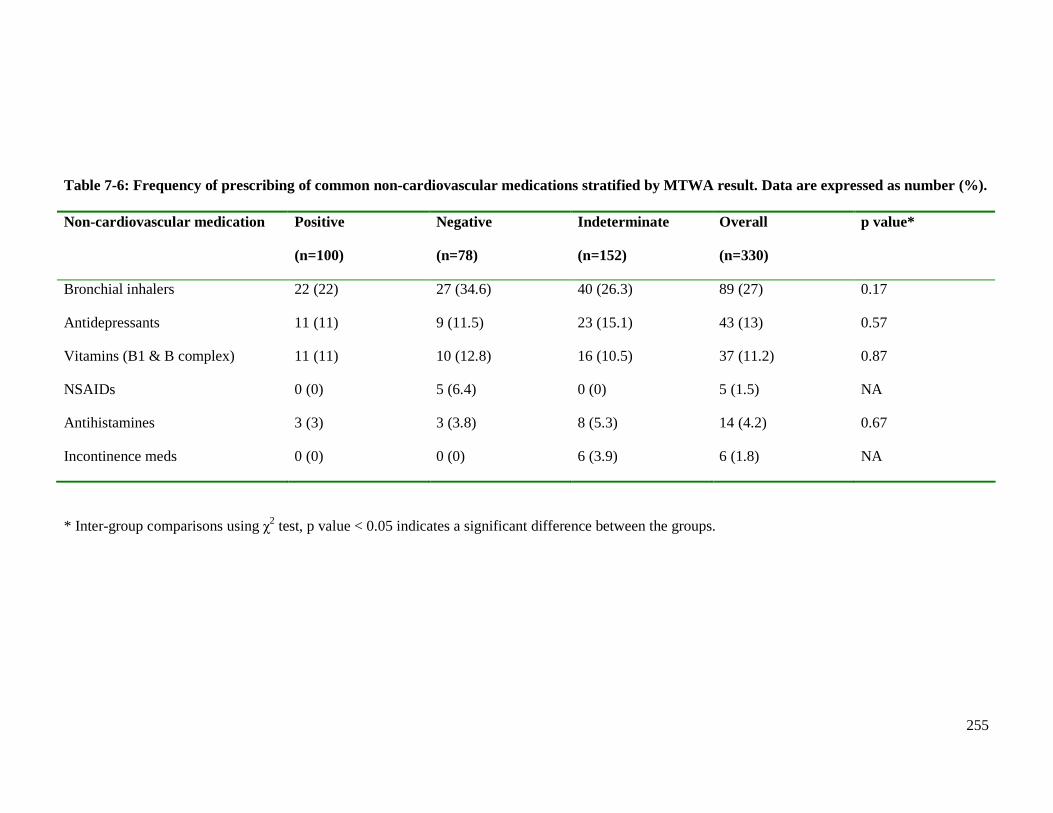
255
Table 7-6: Frequency of prescribing of common non-cardiovascular medications stratified by MTWA result. Data are expressed as number (%). Non-cardiovascular medication Positive
(n=100)
Negative
(n=78)
Indeterminate
(n=152)
Overall
(n=330)
p value*
Bronchial inhalers 22 (22) 27 (34.6) 40 (26.3) 89 (27) 0.17
Antidepressants 11 (11) 9 (11.5) 23 (15.1) 43 (13) 0.57
Vitamins (B1 & B complex) 11 (11) 10 (12.8) 16 (10.5) 37 (11.2) 0.87
NSAIDs 0 (0) 5 (6.4) 0 (0) 5 (1.5) NA
Antihistamines 3 (3) 3 (3.8) 8 (5.3) 14 (4.2) 0.67
Incontinence meds 0 (0) 0 (0) 6 (3.9) 6 (1.8) NA
* Inter-group comparisons using χ2 test, p value < 0.05 indicates a significant difference between the groups.
256
7.2.5 Clinical examination
7.2.5.1 Routine physiological measurements
Table 7-7 displays the routine physiological findings stratified by MTWA result. Patients
with an indeterminate result were more likely to have a lower resting heart rate, consistent
with the higher rate of beta-blocker prescribing (p<0.0001). Those with a negative result
had the highest resting heart rates. Patients with an indeterminate result were also more
likely to have lower diastolic blood pressure than patients in the other two groups
(p<0.0001). Those with a negative result had highest diastolic blood pressure. Although
there was no difference in systolic blood pressure between the three groups, there was a
difference in pulse pressure. Patients with a negative MTWA result were more likely to
have a normal pulse pressure whilst those with a positive or indeterminate MTWA result
were more likely to have an elevated pulse pressure (defined as greater than 60mmHg)
[p=0.016]. Temperature and respiratory rate at rest were similar in all three groups.
7.2.5.2 Body mass index measurements
The BMI measurements stratified by MTWA result are shown in Table 7-8. These
measurements were similar in all three MTWA groups.
7.2.5.3 Cardiovascular examination signs
Table 7-9 shows the frequencies of cardiovascular examination signs, focusing on signs of
HF, stratified by MTWA result. The number of patients with clinical signs of HF was
much less than during hospitalisation. There were no differences between the three groups
in the prevalences of any of these signs.
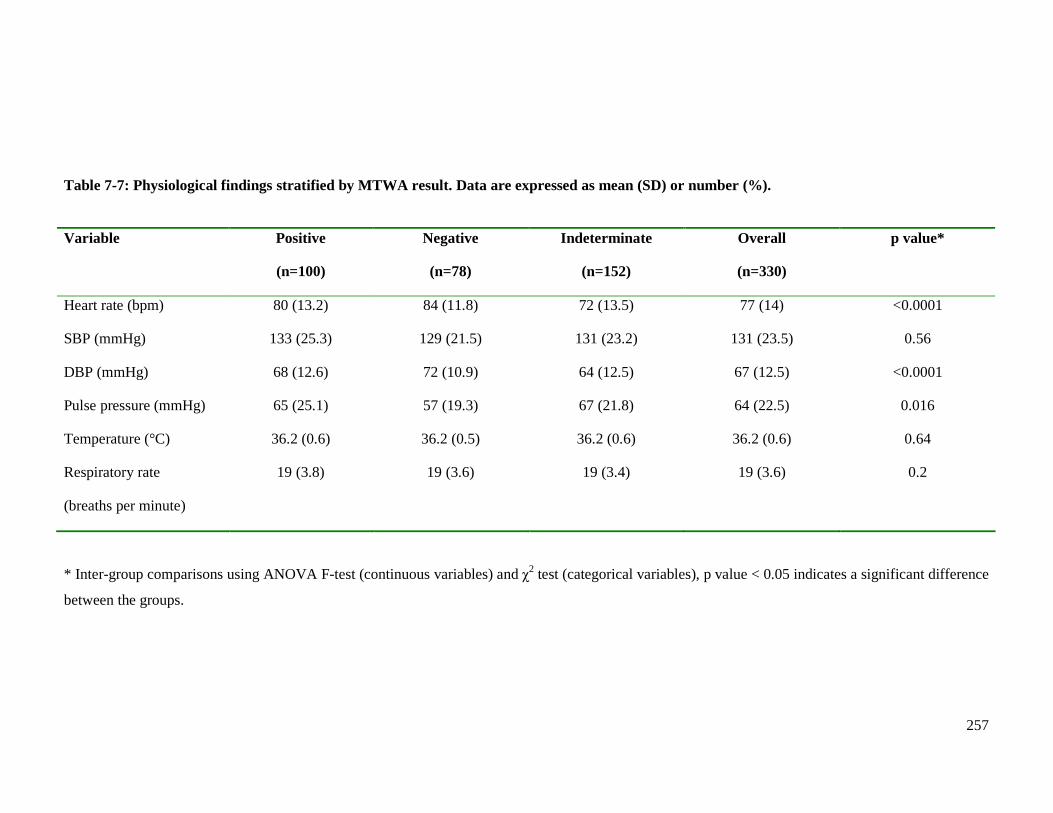
257
Table 7-7: Physiological findings stratified by MTWA result. Data are expressed as mean (SD) or number (%).
Variable Positive
(n=100)
Negative
(n=78)
Indeterminate
(n=152)
Overall
(n=330)
p value*
Heart rate (bpm) 80 (13.2) 84 (11.8) 72 (13.5) 77 (14) <0.0001
SBP (mmHg) 133 (25.3) 129 (21.5) 131 (23.2) 131 (23.5) 0.56
DBP (mmHg) 68 (12.6) 72 (10.9) 64 (12.5) 67 (12.5) <0.0001
Pulse pressure (mmHg) 65 (25.1) 57 (19.3) 67 (21.8) 64 (22.5) 0.016
Temperature (°C) 36.2 (0.6) 36.2 (0.5) 36.2 (0.6) 36.2 (0.6) 0.64
Respiratory rate
(breaths per minute)
19 (3.8) 19 (3.6) 19 (3.4) 19 (3.6) 0.2
* Inter-group comparisons using ANOVA F-test (continuous variables) and χ2 test (categorical variables), p value < 0.05 indicates a significant difference
between the groups.
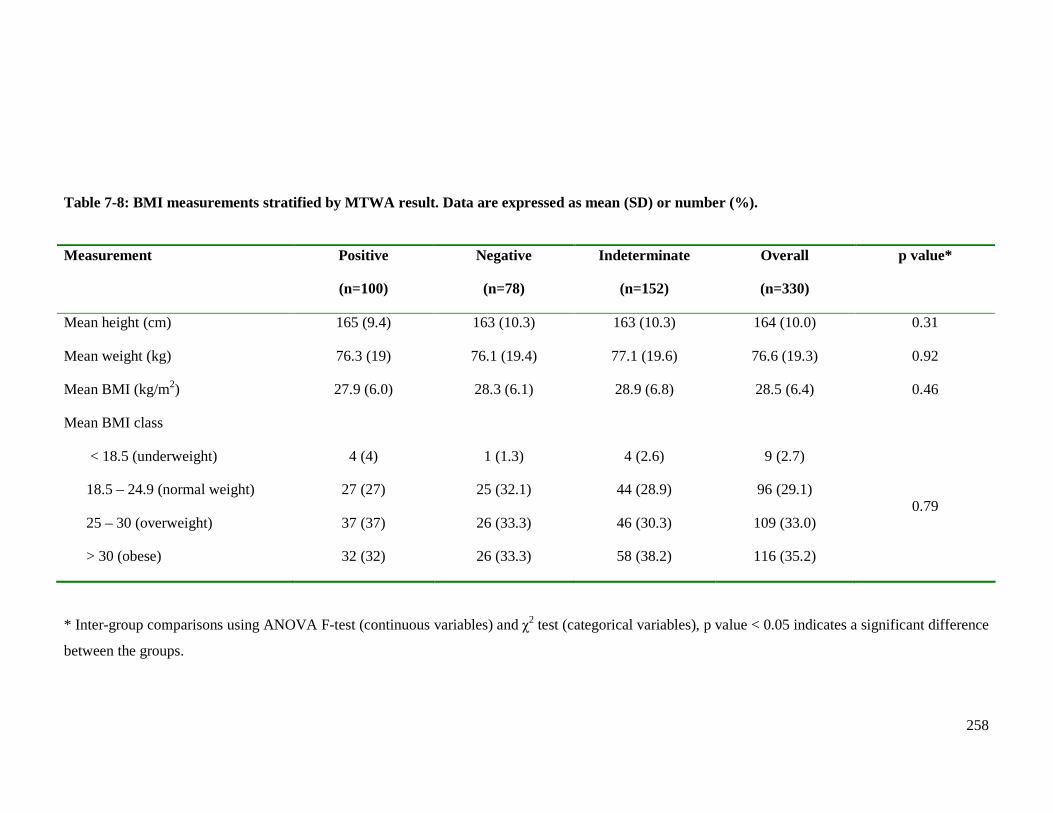
258
Table 7-8: BMI measurements stratified by MTWA result. Data are expressed as mean (SD) or number (%).
Measurement Positive
(n=100)
Negative
(n=78)
Indeterminate
(n=152)
Overall
(n=330)
p value*
Mean height (cm) 165 (9.4) 163 (10.3) 163 (10.3) 164 (10.0) 0.31
Mean weight (kg) 76.3 (19) 76.1 (19.4) 77.1 (19.6) 76.6 (19.3) 0.92
Mean BMI (kg/m2) 27.9 (6.0) 28.3 (6.1) 28.9 (6.8) 28.5 (6.4) 0.46
Mean BMI class
< 18.5 (underweight)
18.5 – 24.9 (normal weight)
25 – 30 (overweight)
> 30 (obese)
4 (4)
27 (27)
37 (37)
32 (32)
1 (1.3)
25 (32.1)
26 (33.3)
26 (33.3)
4 (2.6)
44 (28.9)
46 (30.3)
58 (38.2)
9 (2.7)
96 (29.1)
109 (33.0)
116 (35.2)
0.79
* Inter-group comparisons using ANOVA F-test (continuous variables) and χ2 test (categorical variables), p value < 0.05 indicates a significant difference
between the groups.
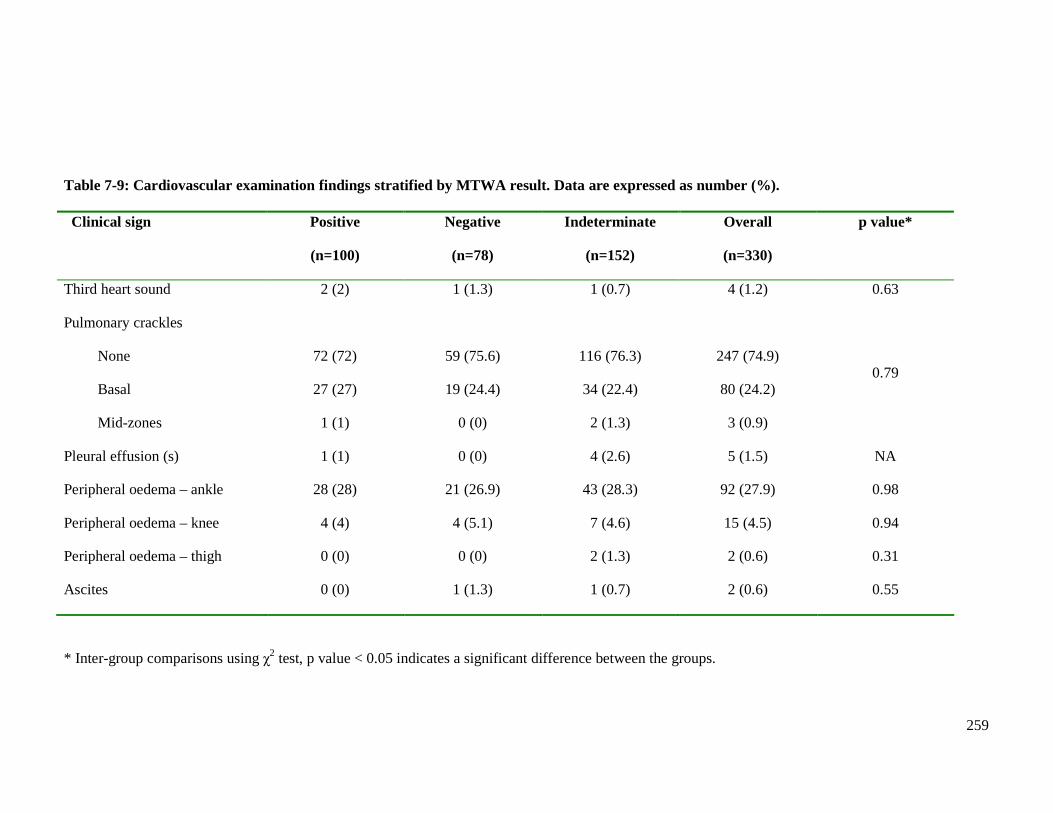
259
Table 7-9: Cardiovascular examination findings stratified by MTWA result. Data are expressed as number (%). Clinical sign Positive
(n=100)
Negative
(n=78)
Indeterminate
(n=152)
Overall
(n=330)
p value*
Third heart sound 2 (2) 1 (1.3) 1 (0.7) 4 (1.2) 0.63
Pulmonary crackles
None
Basal
Mid-zones
72 (72)
27 (27)
1 (1)
59 (75.6)
19 (24.4)
0 (0)
116 (76.3)
34 (22.4)
2 (1.3)
247 (74.9)
80 (24.2)
3 (0.9)
0.79
Pleural effusion (s) 1 (1) 0 (0) 4 (2.6) 5 (1.5) NA
Peripheral oedema – ankle 28 (28) 21 (26.9) 43 (28.3) 92 (27.9) 0.98
Peripheral oedema – knee 4 (4) 4 (5.1) 7 (4.6) 15 (4.5) 0.94
Peripheral oedema – thigh 0 (0) 0 (0) 2 (1.3) 2 (0.6) 0.31
Ascites 0 (0) 1 (1.3) 1 (0.7) 2 (0.6) 0.55
* Inter-group comparisons using χ2 test, p value < 0.05 indicates a significant difference between the groups.
260
7.2.6 Electrocardiography
The frequencies of resting electrocardiograph (ECG) findings, stratified by MTWA result,
are shown in Table 7-10. The proportion of patients with LVH showed a trend towards
greater prevalence amongst those with a positive result (p=0.07). Patients with an
indeterminate result were more likely to have a longer QTc interval than patients in the
other two groups (p=0.0035). Patients with a negative result were more likely to have
shorter QTc intervals than patients with a positive result. There were no differences
between the three MTWA groups in the prevalence of other recorded ECG parameters.
7.2.7 Exercise parameters
The frequencies of exercise parameters recorded during the MTWA test, stratified by
MTWA result, are shown in Table 7-11. Patients with positive and negative MTWA results
were more likely to achieve higher predicted heart rates than those with indeterminate
results (p<0.0001). Maximum ST depression was recorded during the MTWA test. Those
with a positive result were more likely to have deeper ST depression than the other two
groups (p=0.02). Those with an indeterminate result had the least ST depression. These
findings are consistent with the trend for the percentage predicted heart rate for the three
groups.
There was no difference between the three groups in the duration of exercise, although
patients with an indeterminate result had the shortest time. Maximum exercise expended
was similar in all three groups.
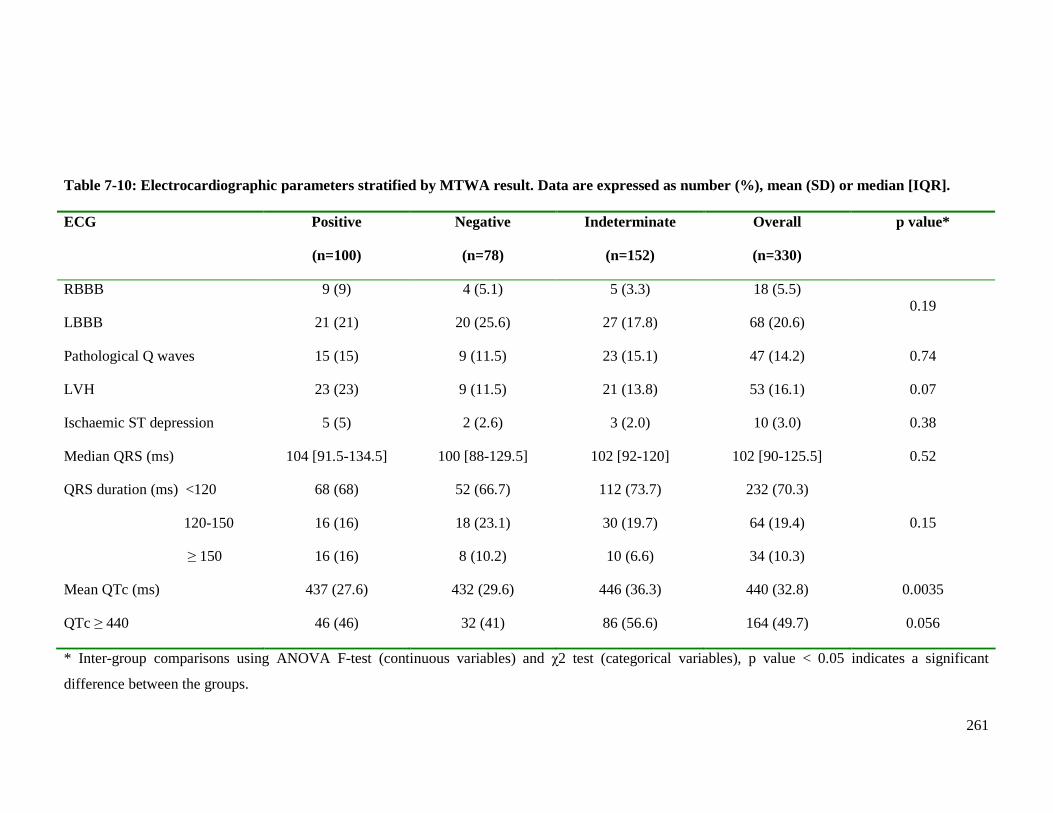
261
Table 7-10: Electrocardiographic parameters stratified by MTWA result. Data are expressed as number (%), mean (SD) or median [IQR]. ECG Positive
(n=100)
Negative
(n=78)
Indeterminate
(n=152)
Overall
(n=330)
p value*
RBBB
LBBB
9 (9)
21 (21)
4 (5.1)
20 (25.6)
5 (3.3)
27 (17.8)
18 (5.5)
68 (20.6) 0.19
Pathological Q waves 15 (15) 9 (11.5) 23 (15.1) 47 (14.2) 0.74
LVH 23 (23) 9 (11.5) 21 (13.8) 53 (16.1) 0.07
Ischaemic ST depression 5 (5) 2 (2.6) 3 (2.0) 10 (3.0) 0.38
Median QRS (ms) 104 [91.5-134.5] 100 [88-129.5] 102 [92-120] 102 [90-125.5] 0.52
QRS duration (ms) <120
120-150
≥ 150
68 (68)
16 (16)
16 (16)
52 (66.7)
18 (23.1)
8 (10.2)
112 (73.7)
30 (19.7)
10 (6.6)
232 (70.3)
64 (19.4)
34 (10.3)
0.15
Mean QTc (ms) 437 (27.6) 432 (29.6) 446 (36.3) 440 (32.8) 0.0035
QTc ≥ 440 46 (46) 32 (41) 86 (56.6) 164 (49.7) 0.056
* Inter-group comparisons using ANOVA F-test (continuous variables) and χ2 test (categorical variables), p value < 0.05 indicates a significant
difference between the groups.
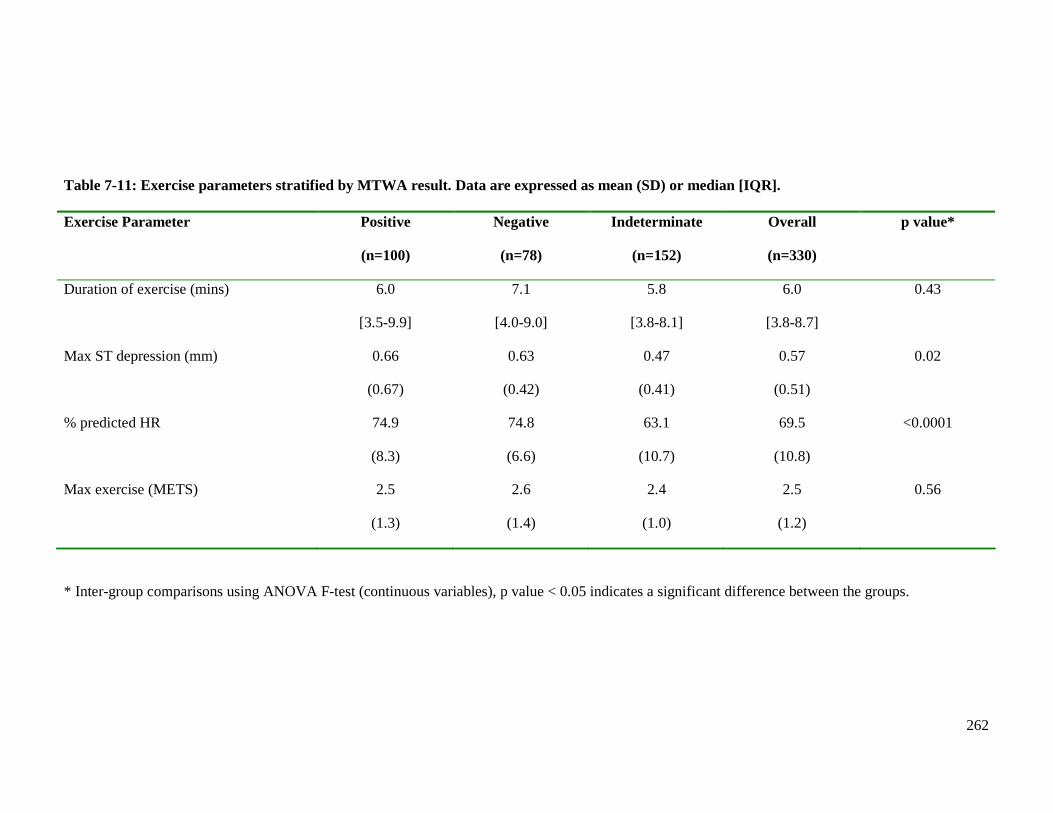
262
Table 7-11: Exercise parameters stratified by MTWA result. Data are expressed as mean (SD) or median [IQR]. Exercise Parameter Positive
(n=100)
Negative
(n=78)
Indeterminate
(n=152)
Overall
(n=330)
p value*
Duration of exercise (mins) 6.0
[3.5-9.9]
7.1
[4.0-9.0]
5.8
[3.8-8.1]
6.0
[3.8-8.7]
0.43
Max ST depression (mm) 0.66
(0.67)
0.63
(0.42)
0.47
(0.41)
0.57
(0.51)
0.02
% predicted HR 74.9
(8.3)
74.8
(6.6)
63.1
(10.7)
69.5
(10.8)
<0.0001
Max exercise (METS) 2.5
(1.3)
2.6
(1.4)
2.4
(1.0)
2.5
(1.2)
0.56
* Inter-group comparisons using ANOVA F-test (continuous variables), p value < 0.05 indicates a significant difference between the groups.
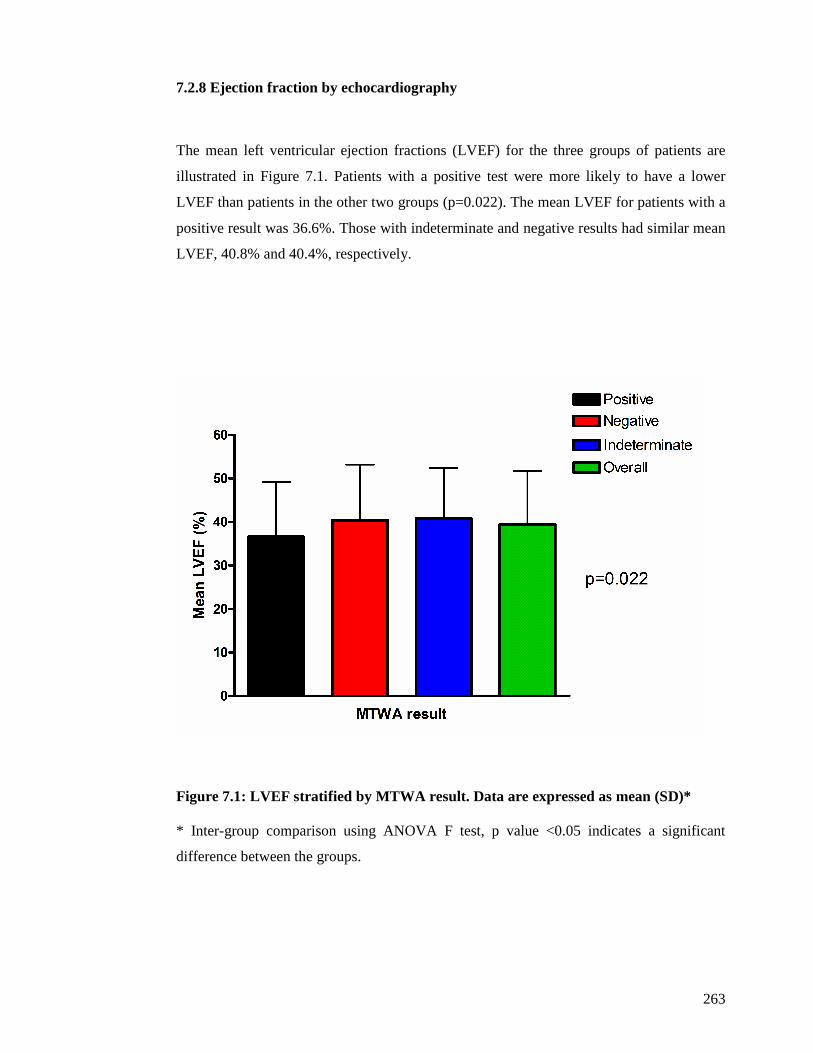
263
7.2.8 Ejection fraction by echocardiography
The mean left ventricular ejection fractions (LVEF) for the three groups of patients are
illustrated in Figure 7.1. Patients with a positive test were more likely to have a lower
LVEF than patients in the other two groups (p=0.022). The mean LVEF for patients with a
positive result was 36.6%. Those with indeterminate and negative results had similar mean
LVEF, 40.8% and 40.4%, respectively.
Figure 7.1: LVEF stratified by MTWA result. Data ar e expressed as mean (SD)* * Inter-group comparison using ANOVA F test, p value <0.05 indicates a significant
difference between the groups.
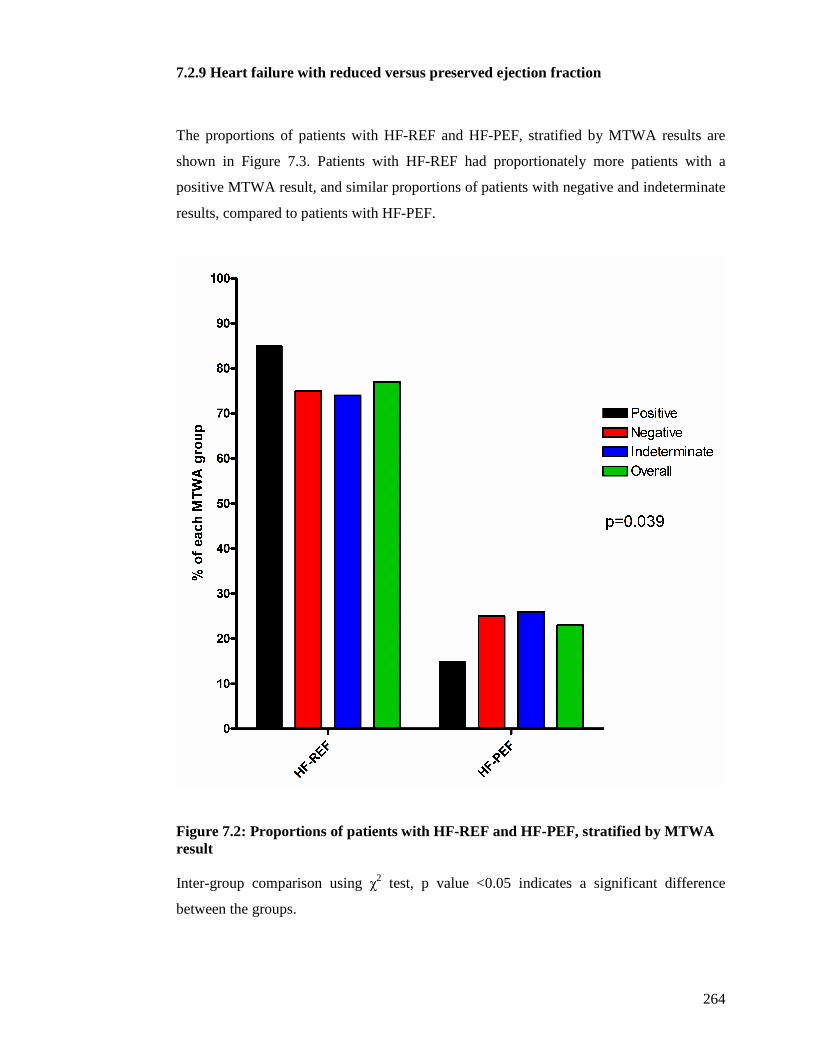
264
7.2.9 Heart failure with reduced versus preserved ejection fraction
The proportions of patients with HF-REF and HF-PEF, stratified by MTWA results are
shown in Figure 7.3. Patients with HF-REF had proportionately more patients with a
positive MTWA result, and similar proportions of patients with negative and indeterminate
results, compared to patients with HF-PEF.
Figure 7.2: Proportions of patients with HF-REF and HF-PEF, stratified by MTWA result Inter-group comparison using χ2 test, p value <0.05 indicates a significant difference
between the groups.
265
7.2.10 Haematology
Table 7-12 shows the full blood count parameters stratified by MTWA result.
Haemoglobin concentration was lower in patients with an indeterminate result than those
with a positive or negative result (p=0.0053). Furthermore patients with an indeterminate
result had the greatest proportion of patients meeting WHO criteria for anaemia (139). Of
152 patients with an indeterminate result, 96 (63.2%) were anaemic, approximately 20%
more than those with positive or negative results (p=0.0009).
Total white blood cell count, red cell distribution width and lymphocyte concentration
were similar in the three groups. However, the proportion of patients who were
lymphopenic (defined as lymphocyte concentration <1x10⁹/l) showed a trend towards a
difference between the three groups (p=0.07). Over 10% of patients with an indeterminate
result were lymphopenic, more than double the proportion of patients with a positive result
and almost three times the proportion of patients with a negative result.
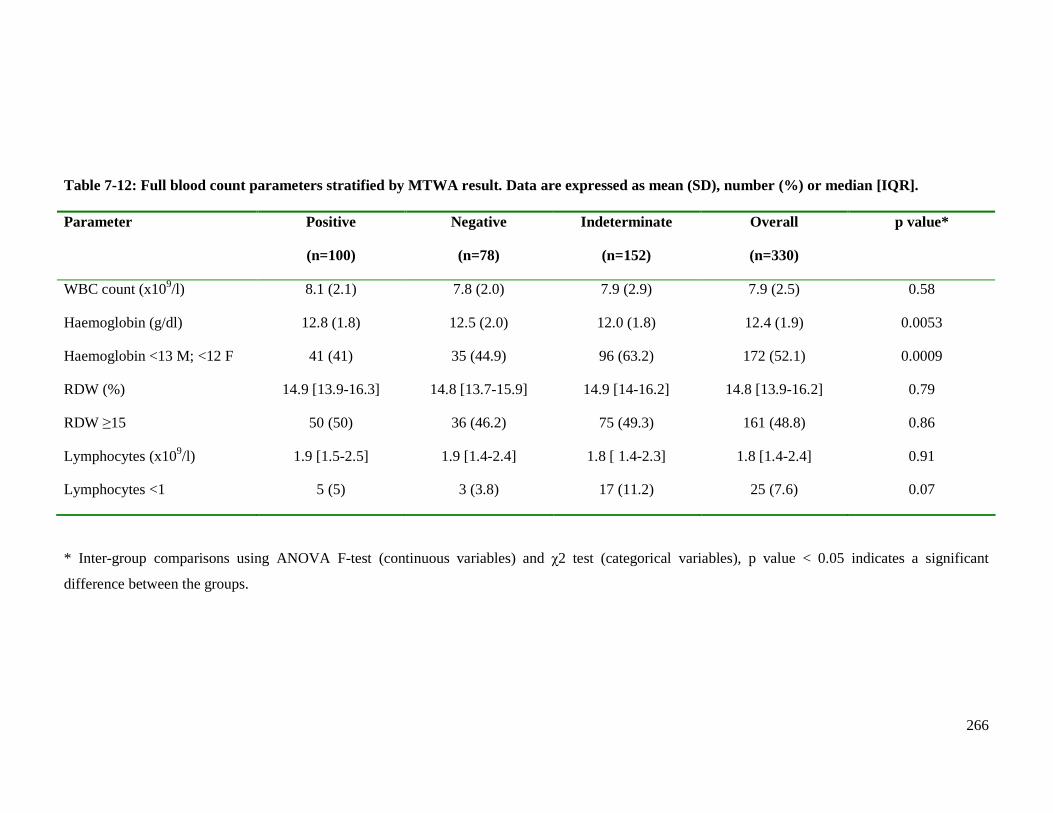
266
Table 7-12: Full blood count parameters stratified by MTWA result. Data are expressed as mean (SD), number (%) or median [IQR]. Parameter Positive
(n=100)
Negative
(n=78)
Indeterminate
(n=152)
Overall
(n=330)
p value*
WBC count (x109/l) 8.1 (2.1) 7.8 (2.0) 7.9 (2.9) 7.9 (2.5) 0.58
Haemoglobin (g/dl) 12.8 (1.8) 12.5 (2.0) 12.0 (1.8) 12.4 (1.9) 0.0053
Haemoglobin <13 M; <12 F 41 (41) 35 (44.9) 96 (63.2) 172 (52.1) 0.0009
RDW (%) 14.9 [13.9-16.3] 14.8 [13.7-15.9] 14.9 [14-16.2] 14.8 [13.9-16.2] 0.79
RDW ≥15 50 (50) 36 (46.2) 75 (49.3) 161 (48.8) 0.86
Lymphocytes (x109/l) 1.9 [1.5-2.5] 1.9 [1.4-2.4] 1.8 [ 1.4-2.3] 1.8 [1.4-2.4] 0.91
Lymphocytes <1 5 (5) 3 (3.8) 17 (11.2) 25 (7.6) 0.07
* Inter-group comparisons using ANOVA F-test (continuous variables) and χ2 test (categorical variables), p value < 0.05 indicates a significant
difference between the groups.
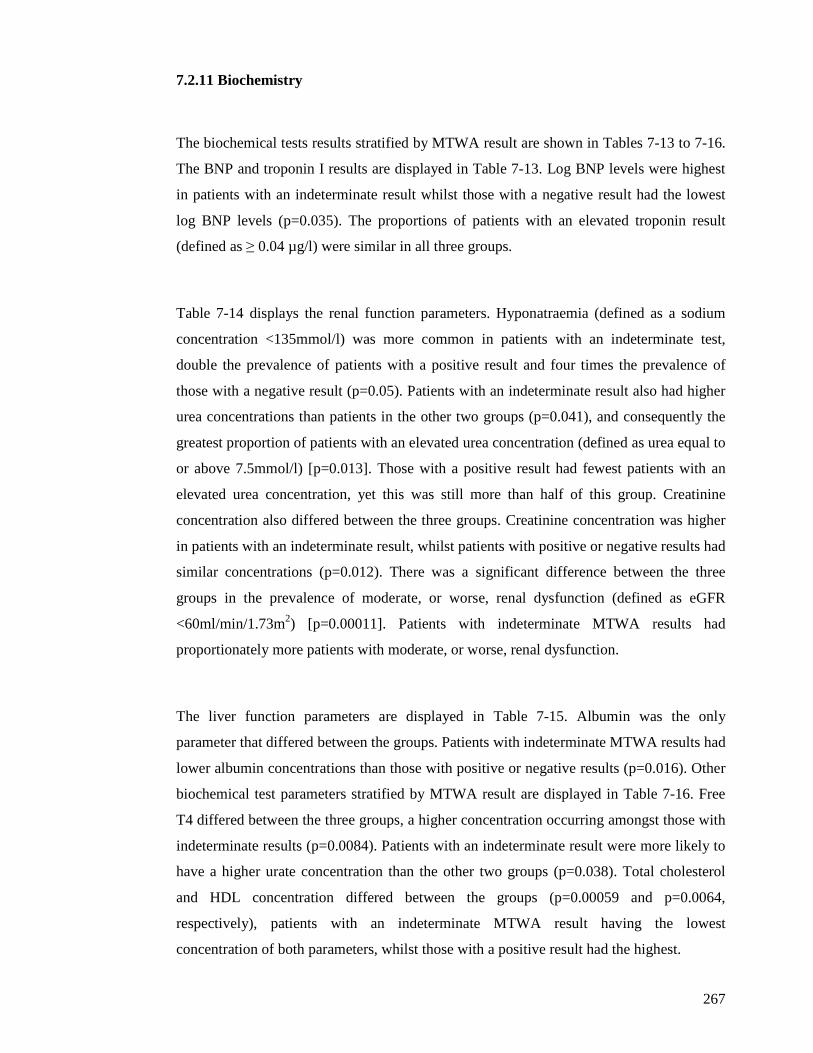
267
7.2.11 Biochemistry
The biochemical tests results stratified by MTWA result are shown in Tables 7-13 to 7-16.
The BNP and troponin I results are displayed in Table 7-13. Log BNP levels were highest
in patients with an indeterminate result whilst those with a negative result had the lowest
log BNP levels (p=0.035). The proportions of patients with an elevated troponin result
(defined as ≥ 0.04 µg/l) were similar in all three groups.
Table 7-14 displays the renal function parameters. Hyponatraemia (defined as a sodium
concentration <135mmol/l) was more common in patients with an indeterminate test,
double the prevalence of patients with a positive result and four times the prevalence of
those with a negative result (p=0.05). Patients with an indeterminate result also had higher
urea concentrations than patients in the other two groups (p=0.041), and consequently the
greatest proportion of patients with an elevated urea concentration (defined as urea equal to
or above 7.5mmol/l) [p=0.013]. Those with a positive result had fewest patients with an
elevated urea concentration, yet this was still more than half of this group. Creatinine
concentration also differed between the three groups. Creatinine concentration was higher
in patients with an indeterminate result, whilst patients with positive or negative results had
similar concentrations (p=0.012). There was a significant difference between the three
groups in the prevalence of moderate, or worse, renal dysfunction (defined as eGFR
<60ml/min/1.73m2) [p=0.00011]. Patients with indeterminate MTWA results had
proportionately more patients with moderate, or worse, renal dysfunction.
The liver function parameters are displayed in Table 7-15. Albumin was the only
parameter that differed between the groups. Patients with indeterminate MTWA results had
lower albumin concentrations than those with positive or negative results (p=0.016). Other
biochemical test parameters stratified by MTWA result are displayed in Table 7-16. Free
T4 differed between the three groups, a higher concentration occurring amongst those with
indeterminate results (p=0.0084). Patients with an indeterminate result were more likely to
have a higher urate concentration than the other two groups (p=0.038). Total cholesterol
and HDL concentration differed between the groups (p=0.00059 and p=0.0064,
respectively), patients with an indeterminate MTWA result having the lowest
concentration of both parameters, whilst those with a positive result had the highest.
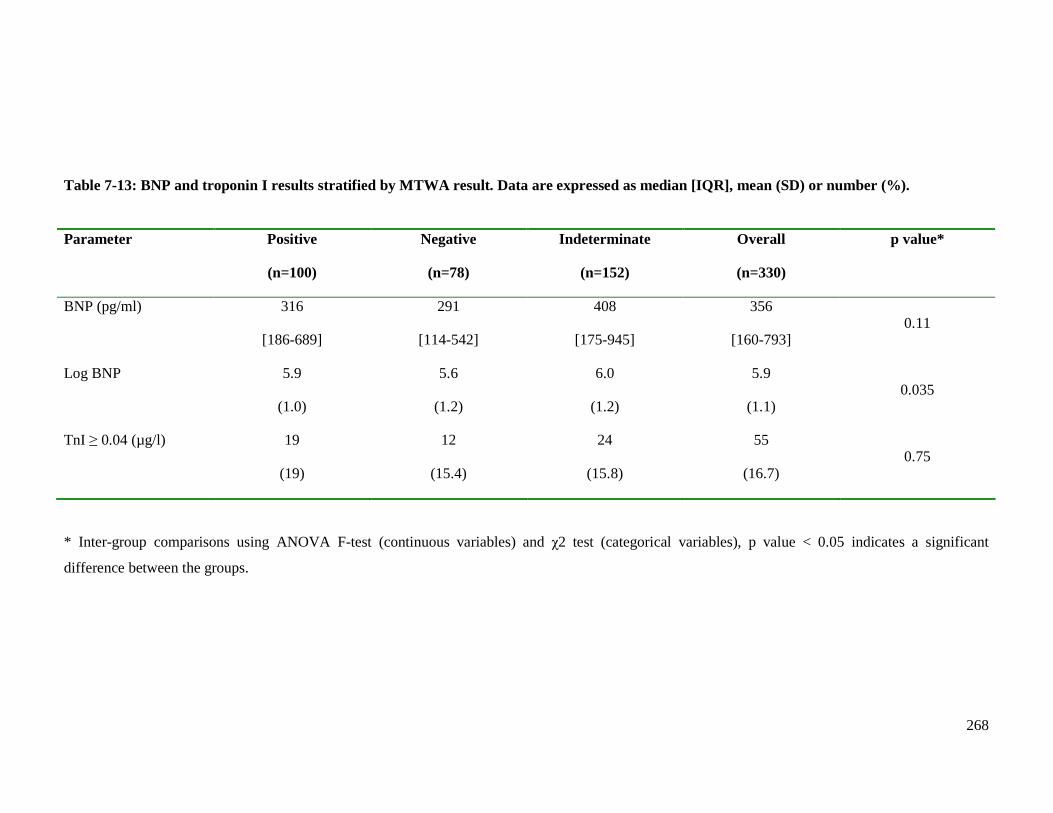
268
Table 7-13: BNP and troponin I results stratified by MTWA result. Data are expressed as median [IQR], mean (SD) or number (%). Parameter Positive
(n=100)
Negative
(n=78)
Indeterminate
(n=152)
Overall
(n=330)
p value*
BNP (pg/ml) 316
[186-689]
291
[114-542]
408
[175-945]
356
[160-793] 0.11
Log BNP 5.9
(1.0)
5.6
(1.2)
6.0
(1.2)
5.9
(1.1) 0.035
TnI ≥ 0.04 (µg/l) 19
(19)
12
(15.4)
24
(15.8)
55
(16.7) 0.75
* Inter-group comparisons using ANOVA F-test (continuous variables) and χ2 test (categorical variables), p value < 0.05 indicates a significant
difference between the groups.
269
Table 7-14: Renal function results stratified by MTWA result. Data are expressed as mean (SD), number (%) or median [IQR]. Parameter Positive
(n=100)
Negative
(n=78)
Indeterminate
(n=152)
Overall
(n=330)
p value*
Sodium (mmol/l) 139.5 (3.0) 139.4 (2.7) 138.7 (3.7) 139.1 (3.3) 0.12
Sodium <135 5 (5) 2 (2.6) 16 (10.5) 23 (7.0) 0.05
Potassium (mmol/l) 4.0 (0.5) 4.1 (0.5) 4.1 (0.5) 4.1 (0.5) 0.14
Urea (mmol/l) 7.6 [5.7-10.3] 8.0 [5.8-11] 9.3 [6.6-12.8] 9.5 [4.8-8.1] 0.041
Log (urea) 2.08 (0.43) 2.09 (0.45) 2.21 (0.49) 2.14 (0.46) 0.052
Urea ≥ 7.5 51 (51) 45 (57.7) 105 (69.1) 201 (60.9) 0.013
Creatinine (µmol/l) 99 [88-120.3] 99 [84.3-118.8] 109.5 [89-142.5] 102.5 [87-131.8] 0.012
Log (creatinine) 4.7 (0.3) 4.6 (0.3) 4.7 (0.4) 4.7 (0.3) 0.011
eGFR (ml/min/1.73m2) 61.8 [49.1-73.5] 63.5 [46.5-76.3] 52.9 [40.8-67.0] 58.3 [43.4-72.0] 0.002
eGFR < 60ml/min/1.73m2 41 (41) 33 (42.3) 99 (65.1) 173 (52.4) 0.00011
* Inter-group comparisons using ANOVA F-test (continuous variables) and χ2 test (categorical variables), p value < 0.05 indicates a significant difference
between the groups.
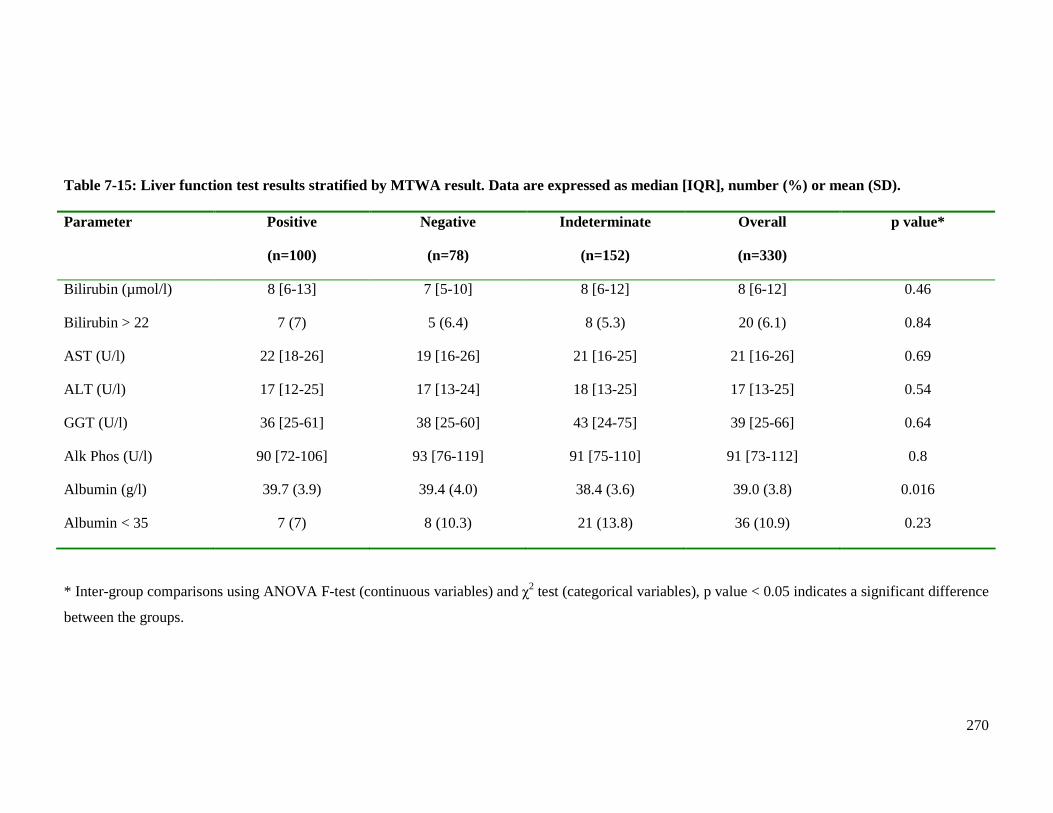
270
Table 7-15: Liver function test results stratified by MTWA result. Data are expressed as median [IQR], number (%) or mean (SD). Parameter Positive
(n=100)
Negative
(n=78)
Indeterminate
(n=152)
Overall
(n=330)
p value*
Bilirubin (µmol/l) 8 [6-13] 7 [5-10] 8 [6-12] 8 [6-12] 0.46
Bilirubin > 22 7 (7) 5 (6.4) 8 (5.3) 20 (6.1) 0.84
AST (U/l) 22 [18-26] 19 [16-26] 21 [16-25] 21 [16-26] 0.69
ALT (U/l) 17 [12-25] 17 [13-24] 18 [13-25] 17 [13-25] 0.54
GGT (U/l) 36 [25-61] 38 [25-60] 43 [24-75] 39 [25-66] 0.64
Alk Phos (U/l) 90 [72-106] 93 [76-119] 91 [75-110] 91 [73-112] 0.8
Albumin (g/l) 39.7 (3.9) 39.4 (4.0) 38.4 (3.6) 39.0 (3.8) 0.016
Albumin < 35 7 (7) 8 (10.3) 21 (13.8) 36 (10.9) 0.23
* Inter-group comparisons using ANOVA F-test (continuous variables) and χ2 test (categorical variables), p value < 0.05 indicates a significant difference
between the groups.
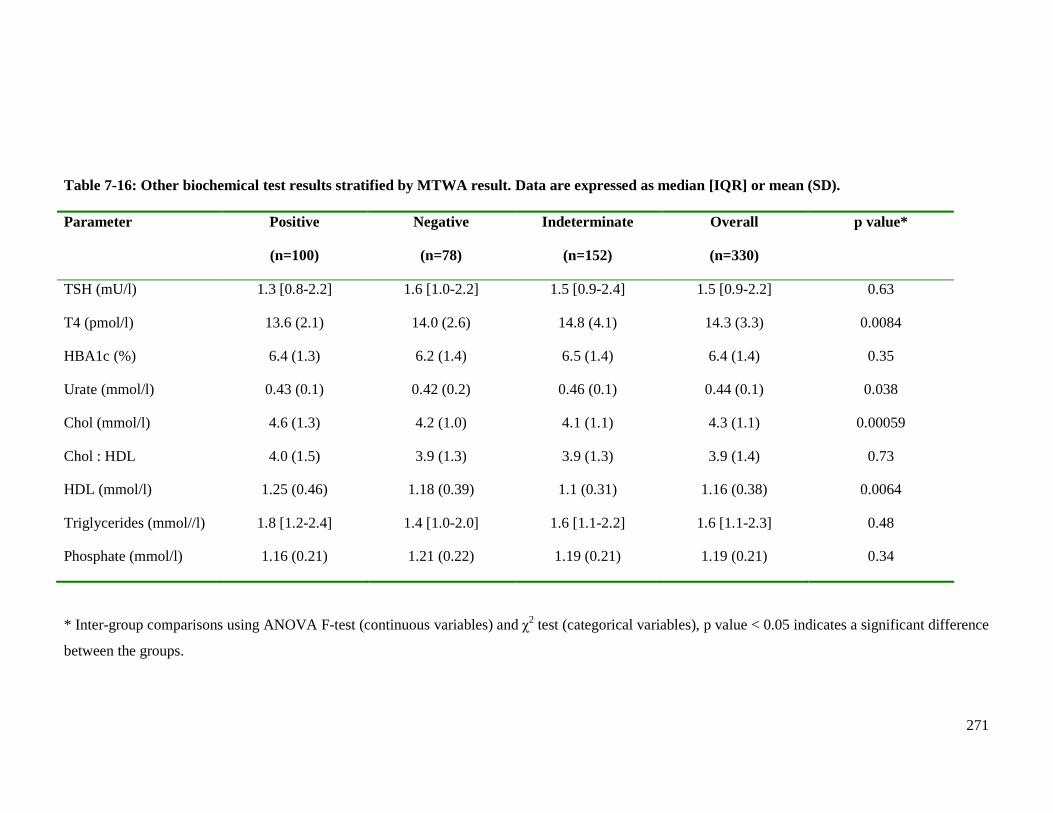
271
Table 7-16: Other biochemical test results stratified by MTWA result. Data are expressed as median [IQR] or mean (SD). Parameter Positive
(n=100)
Negative
(n=78)
Indeterminate
(n=152)
Overall
(n=330)
p value*
TSH (mU/l) 1.3 [0.8-2.2] 1.6 [1.0-2.2] 1.5 [0.9-2.4] 1.5 [0.9-2.2] 0.63
T4 (pmol/l) 13.6 (2.1) 14.0 (2.6) 14.8 (4.1) 14.3 (3.3) 0.0084
HBA1c (%) 6.4 (1.3) 6.2 (1.4) 6.5 (1.4) 6.4 (1.4) 0.35
Urate (mmol/l) 0.43 (0.1) 0.42 (0.2) 0.46 (0.1) 0.44 (0.1) 0.038
Chol (mmol/l) 4.6 (1.3) 4.2 (1.0) 4.1 (1.1) 4.3 (1.1) 0.00059
Chol : HDL 4.0 (1.5) 3.9 (1.3) 3.9 (1.3) 3.9 (1.4) 0.73
HDL (mmol/l) 1.25 (0.46) 1.18 (0.39) 1.1 (0.31) 1.16 (0.38) 0.0064
Triglycerides (mmol//l) 1.8 [1.2-2.4] 1.4 [1.0-2.0] 1.6 [1.1-2.2] 1.6 [1.1-2.3] 0.48
Phosphate (mmol/l) 1.16 (0.21) 1.21 (0.22) 1.19 (0.21) 1.19 (0.21) 0.34
* Inter-group comparisons using ANOVA F-test (continuous variables) and χ2 test (categorical variables), p value < 0.05 indicates a significant difference
between the groups.
272
7.2.12 Aetiology of heart failure
The primary aetiologies of HF (Figure 7.4) differed according to MTWA result (p=0.034).
Patients with an indeterminate or positive MTWA result were more likely to have an
established ischaemic cause of HF than those with a negative result. Patients without a
prior MI or a coronary angiogram performed by the time of the study visit were classed as
‘unknown’ primary aetiology of HF. This applied to approximately one-quarter of all
patients who completed a MTWA exercise test. There were only small proportions of
patients with non-ischaemic causes of HF.
There were no significant differences between the three MTWA groups in contributing
causes of HF, although those with an indeterminate MTWA test had the highest
proportions of hypertension, paroxysmal AF and diabetes mellitus (Table 7-17). Patients
with a positive MTWA test had the highest proportions of both valvular heart disease and
alcohol as contributing causes of HF.
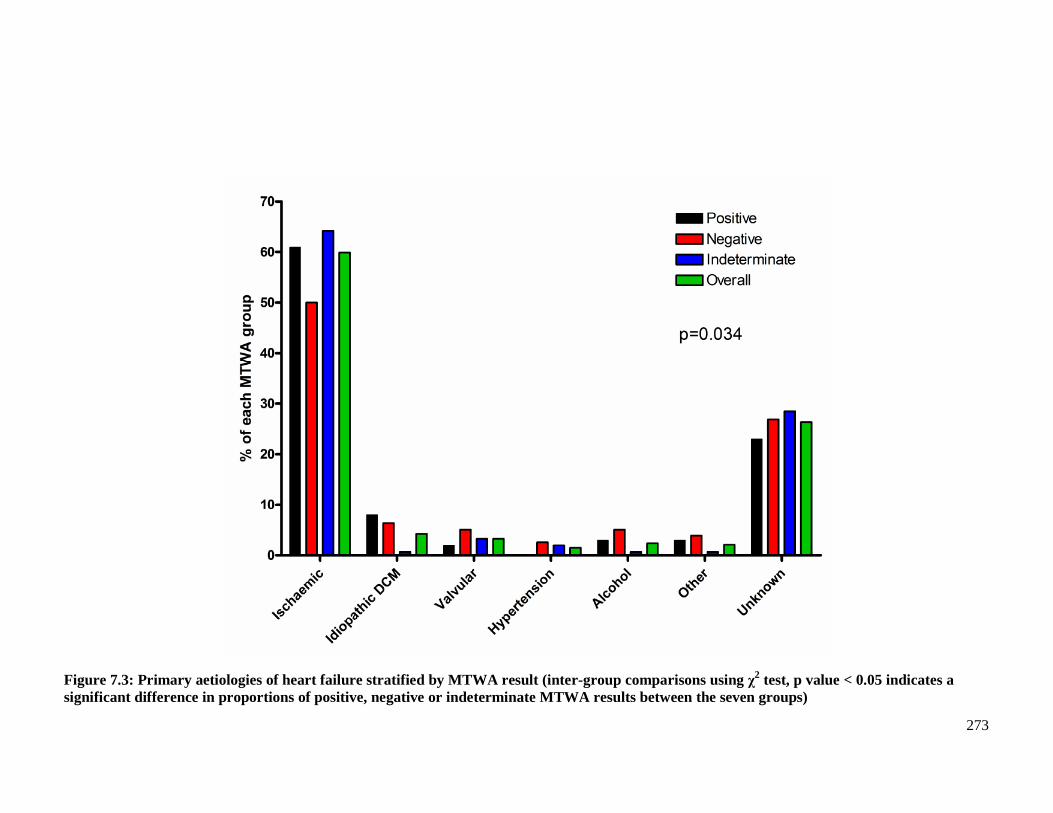
273
Figure 7.3: Primary aetiologies of heart failure stratified by MTWA result (inter-group comparisons using χ2 test, p value < 0.05 indicates a significant difference in proportions of positive, negative or indeterminate MTWA results between the seven groups)
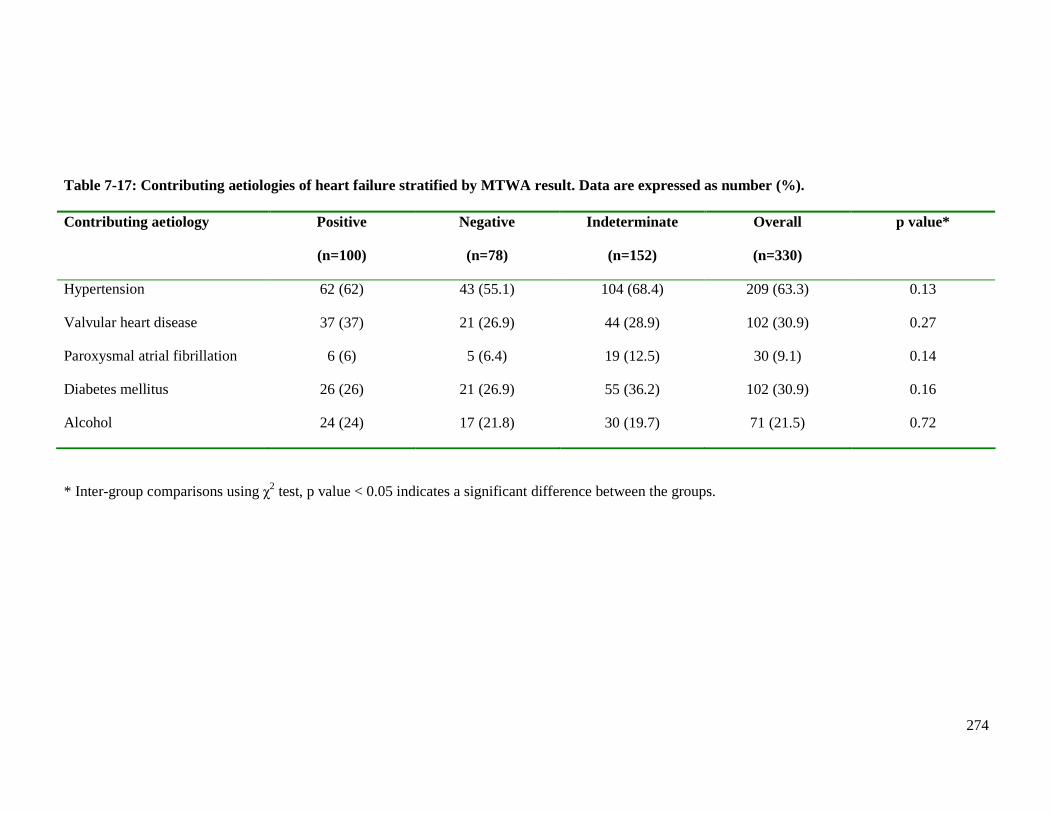
274
Table 7-17: Contributing aetiologies of heart failure stratified by MTWA result. Data are expressed as number (%). Contributing aetiology Positive
(n=100)
Negative
(n=78)
Indeterminate
(n=152)
Overall
(n=330)
p value*
Hypertension 62 (62) 43 (55.1) 104 (68.4) 209 (63.3) 0.13
Valvular heart disease 37 (37) 21 (26.9) 44 (28.9) 102 (30.9) 0.27
Paroxysmal atrial fibrillation 6 (6) 5 (6.4) 19 (12.5) 30 (9.1) 0.14
Diabetes mellitus 26 (26) 21 (26.9) 55 (36.2) 102 (30.9) 0.16
Alcohol 24 (24) 17 (21.8) 30 (19.7) 71 (21.5) 0.72
* Inter-group comparisons using χ2 test, p value < 0.05 indicates a significant difference between the groups.
275
7.3 Results 2: Differences in clinical characteristics - negative and non-
negative MTWA results
Every clinical parameter examined in Section 7.2 was analysed to determine if there were any
differences between the MTWA groups when classified as negative and non-negative. Only
the parameters where a significant difference (p<0.05) existed are displayed in Table 7-18.
Patients with a negative result were approximately 5 years younger than those with a non-
negative result. Consequently, there was a notable difference in the proportion of patients aged
75 years or older, over 35% of those with a non-negative result compared to 21% with a
negative result. More patients with a non-negative MTWA result had a prior MI. No other
medical comorbidities were differed between the two groups.
As mentioned in the previous section, only a quarter of patients with a negative test were on
optimal HF therapy, nearly half the proportion of patients with a non-negative result. This is
likely explained by the significant difference in proportions prescribed beta-blockers, only half
of patients with a negative test compared to almost 70% of patients with a non-negative test.
The difference in beta-blocker prescribing is also a likely explanation for the significant
difference in resting heart rate between the two groups. Patients with a negative test had a
higher resting heart rate than those with a non-negative result. Patients with a non-negative
test had a lower mean DBP and an elevated pulse pressure, compared to patients with a
negative result.
QTc was the only ECG parameter that differed between the two groups, patients with a non-
negative result being more likely to have a longer QTc. There was no difference between the
two groups in the proportion of patients with HF-REF and HF-PEF. Patients with a negative
test achieved a higher percentage of their predicted heart rate during MTWA exercise testing.
Finally, log BNP and moderate, or worse, renal dysfunction (defined as eGFR
<60ml/min/1.73m2) were the only blood parameters that differed significantly between the two
groups. Patients with a non-negative result were more likely to have a higher log BNP and
more patients with moderate, or worse, renal dysfunction.
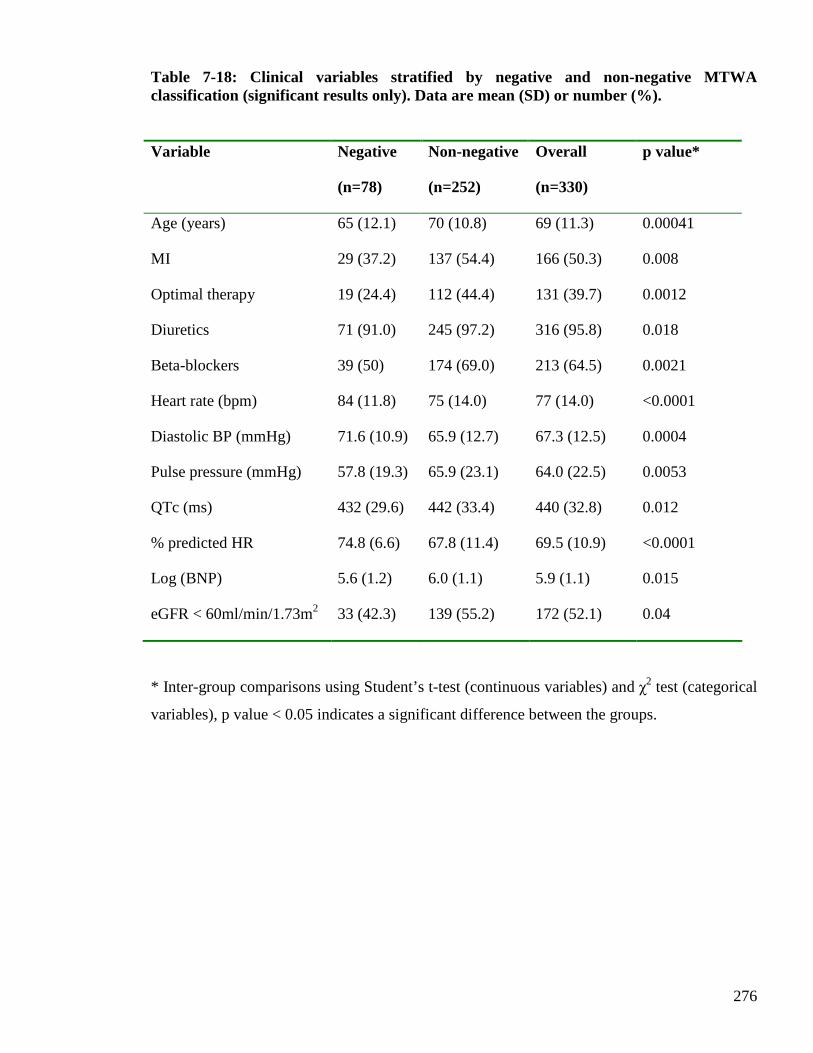
276
Table 7-18: Clinical variables stratified by negative and non-negative MTWA classification (significant results only). Data are mean (SD) or number (%).
Variable Negative
(n=78)
Non-negative
(n=252)
Overall
(n=330)
p value*
Age (years) 65 (12.1) 70 (10.8) 69 (11.3) 0.00041
MI 29 (37.2) 137 (54.4) 166 (50.3) 0.008
Optimal therapy 19 (24.4) 112 (44.4) 131 (39.7) 0.0012
Diuretics 71 (91.0) 245 (97.2) 316 (95.8) 0.018
Beta-blockers 39 (50) 174 (69.0) 213 (64.5) 0.0021
Heart rate (bpm) 84 (11.8) 75 (14.0) 77 (14.0) <0.0001
Diastolic BP (mmHg) 71.6 (10.9) 65.9 (12.7) 67.3 (12.5) 0.0004
Pulse pressure (mmHg) 57.8 (19.3) 65.9 (23.1) 64.0 (22.5) 0.0053
QTc (ms) 432 (29.6) 442 (33.4) 440 (32.8) 0.012
% predicted HR 74.8 (6.6) 67.8 (11.4) 69.5 (10.9) <0.0001
Log (BNP) 5.6 (1.2) 6.0 (1.1) 5.9 (1.1) 0.015
eGFR < 60ml/min/1.73m2 33 (42.3) 139 (55.2) 172 (52.1) 0.04
* Inter-group comparisons using Student’s t-test (continuous variables) and χ2 test (categorical
variables), p value < 0.05 indicates a significant difference between the groups.
277
7.4 Results 3: Differences in clinical characteristics for the three MTWA
pairings
7.4.1 Negative versus positive MTWA
All clinical characteristics where a statistically significant difference existed between the three
MTWA groups were evaluated by logistic regression analysis to determine if certain variables
were associated with a specific MTWA result.
The results for the comparison of negative versus positive MTWA are displayed in Table 7-19.
Overall there were three parameters where a significant difference (p<0.05) existed between
negative and positive MTWA results. Patients with a negative result were less likely to be
treated with an ACE inhibitor and more likely to have a higher LVEF, than patients with a
positive result. These differences were of borderline statistical significance. Those with a
negative test were also more likely to have a lower cholesterol concentration than patients with
a positive result. Fewer patients with a negative result had electrocardiographic evidence of
LVH and a lower pulse pressure was more common amongst those with a negative result,
these differences only showed a trend towards statistical significance.
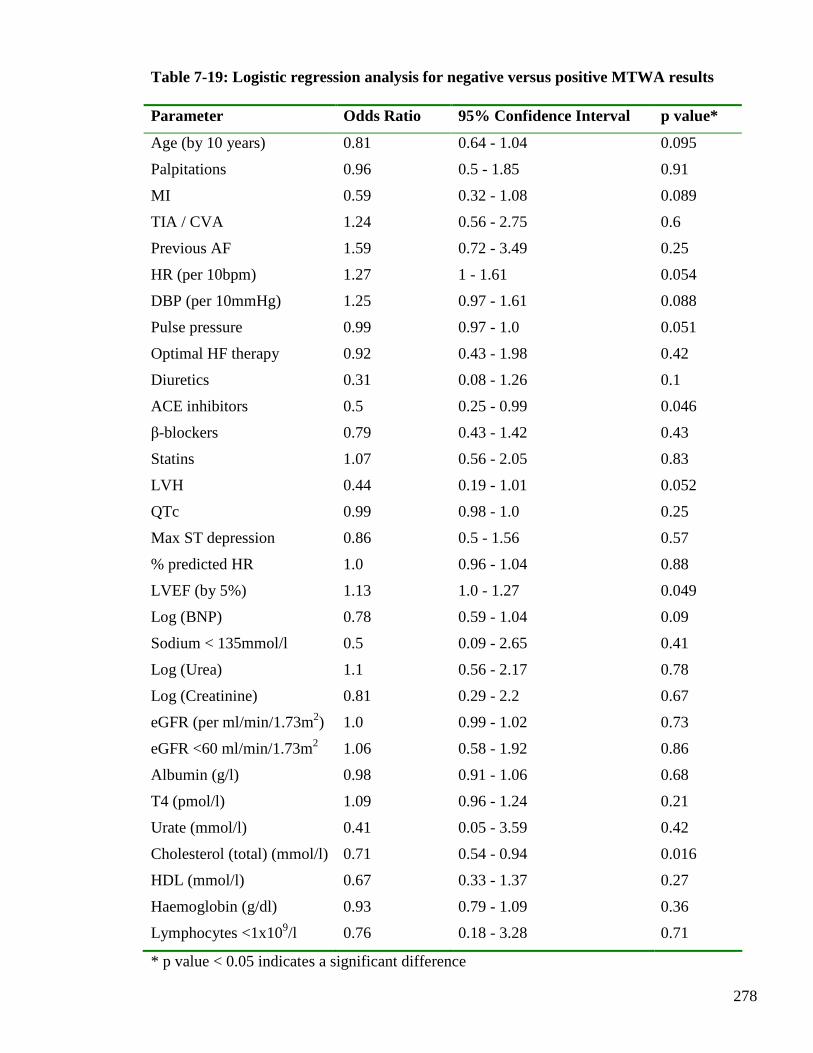
278
Table 7-19: Logistic regression analysis for negative versus positive MTWA results Parameter Odds Ratio 95% Confidence Interval p value*
Age (by 10 years) 0.81 0.64 - 1.04 0.095
Palpitations 0.96 0.5 - 1.85 0.91
MI 0.59 0.32 - 1.08 0.089
TIA / CVA 1.24 0.56 - 2.75 0.6
Previous AF 1.59 0.72 - 3.49 0.25
HR (per 10bpm) 1.27 1 - 1.61 0.054
DBP (per 10mmHg) 1.25 0.97 - 1.61 0.088
Pulse pressure 0.99 0.97 - 1.0 0.051
Optimal HF therapy 0.92 0.43 - 1.98 0.42
Diuretics 0.31 0.08 - 1.26 0.1
ACE inhibitors 0.5 0.25 - 0.99 0.046
β-blockers 0.79 0.43 - 1.42 0.43
Statins 1.07 0.56 - 2.05 0.83
LVH 0.44 0.19 - 1.01 0.052
QTc 0.99 0.98 - 1.0 0.25
Max ST depression 0.86 0.5 - 1.56 0.57
% predicted HR 1.0 0.96 - 1.04 0.88
LVEF (by 5%) 1.13 1.0 - 1.27 0.049
Log (BNP) 0.78 0.59 - 1.04 0.09
Sodium < 135mmol/l 0.5 0.09 - 2.65 0.41
Log (Urea) 1.1 0.56 - 2.17 0.78
Log (Creatinine) 0.81 0.29 - 2.2 0.67
eGFR (per ml/min/1.73m2) 1.0 0.99 - 1.02 0.73
eGFR <60 ml/min/1.73m2 1.06 0.58 - 1.92 0.86
Albumin (g/l) 0.98 0.91 - 1.06 0.68
T4 (pmol/l) 1.09 0.96 - 1.24 0.21
Urate (mmol/l) 0.41 0.05 - 3.59 0.42
Cholesterol (total) (mmol/l) 0.71 0.54 - 0.94 0.016
HDL (mmol/l) 0.67 0.33 - 1.37 0.27
Haemoglobin (g/dl) 0.93 0.79 - 1.09 0.36
Lymphocytes <1x10⁹/l 0.76 0.18 - 3.28 0.71
* p value < 0.05 indicates a significant difference
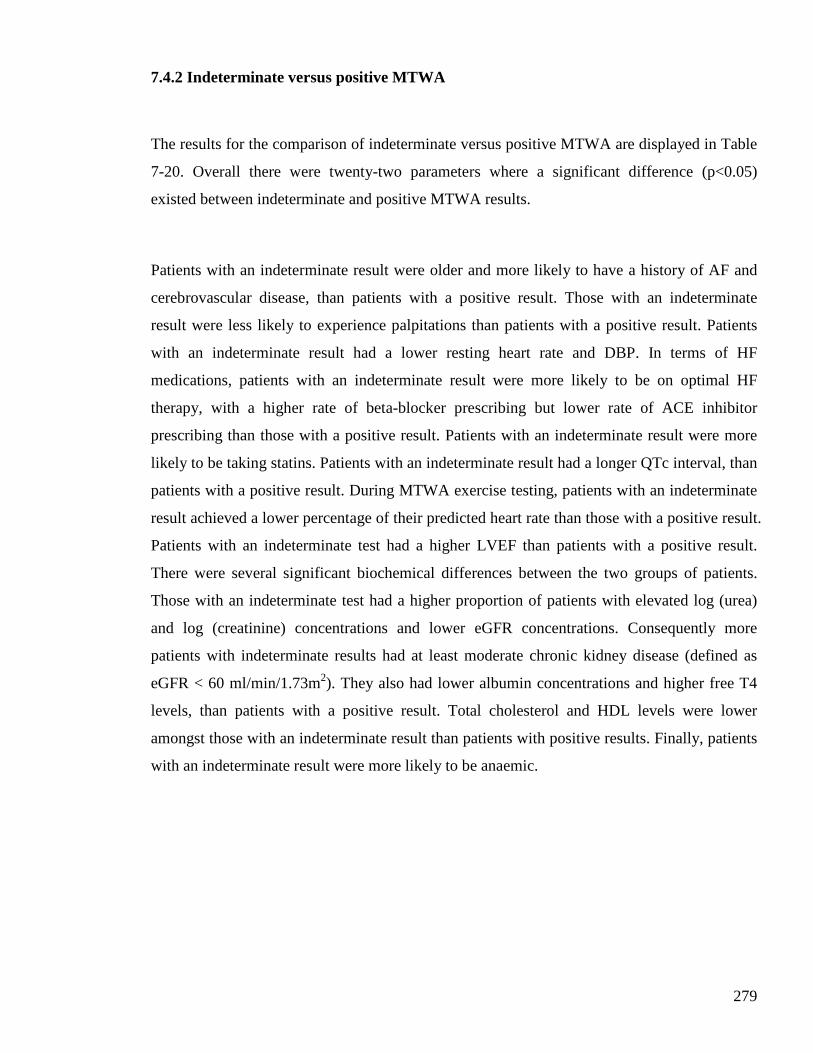
279
7.4.2 Indeterminate versus positive MTWA
The results for the comparison of indeterminate versus positive MTWA are displayed in Table
7-20. Overall there were twenty-two parameters where a significant difference (p<0.05)
existed between indeterminate and positive MTWA results.
Patients with an indeterminate result were older and more likely to have a history of AF and
cerebrovascular disease, than patients with a positive result. Those with an indeterminate
result were less likely to experience palpitations than patients with a positive result. Patients
with an indeterminate result had a lower resting heart rate and DBP. In terms of HF
medications, patients with an indeterminate result were more likely to be on optimal HF
therapy, with a higher rate of beta-blocker prescribing but lower rate of ACE inhibitor
prescribing than those with a positive result. Patients with an indeterminate result were more
likely to be taking statins. Patients with an indeterminate result had a longer QTc interval, than
patients with a positive result. During MTWA exercise testing, patients with an indeterminate
result achieved a lower percentage of their predicted heart rate than those with a positive result.
Patients with an indeterminate test had a higher LVEF than patients with a positive result.
There were several significant biochemical differences between the two groups of patients.
Those with an indeterminate test had a higher proportion of patients with elevated log (urea)
and log (creatinine) concentrations and lower eGFR concentrations. Consequently more
patients with indeterminate results had at least moderate chronic kidney disease (defined as
eGFR < 60 ml/min/1.73m2). They also had lower albumin concentrations and higher free T4
levels, than patients with a positive result. Total cholesterol and HDL levels were lower
amongst those with an indeterminate result than patients with positive results. Finally, patients
with an indeterminate result were more likely to be anaemic.
280
Table 7-20: Logistic regression analysis for indeterminate versus positive MTWA results Parameter Odds Ratio 95% Confidence Interval p value
Age (by 10 years) 1.34 1.05 - 1.7 0.019
Palpitations 0.46 0.25 - 0.85 0.013
MI 1.34 0.81 - 2.22 0.26
TIA / CVA 1.96 1.01 - 3.78 0.046
Previous AF 3.38 1.76 - 6.52 0.00027
HR (per 10bpm) 0.62 0.5 - 0.75 <0.0001
DBP (per 10mmHg) 0.76 0.62 - 0.93 0.0093
Pulse pressure 1.0 0.99 - 1.02 0.49
Optimal HF therapy 6.13 3.08 - 12.17 <0.0001
Diuretics 1.14 0.25 - 5.23 0.86
ACE inhibitors 0.53 0.29 - 0.95 0.035
β-blockers 2.73 1.57 - 4.72 0.00034
Statins 2.08 1.15 - 3.77 0.016
LVH 0.54 0.28 - 1.03 0.063
QTc 1.01 1.0 - 1.02 0.03
Max ST depression 0.62 0.37 - 1.02 0.062
% predicted HR 0.88 0.85 - 0.91 <0.0001
LVEF (by 5%) 1.16 1.04 - 1.29 0.0088
Log (BNP) 1.11 0.88 - 1.4 0.19
Sodium < 135mmol/l 2.24 0.79 - 6.31 0.13
Log (Urea) 1.86 1.06 - 3.26 0.03
Log (Creatinine) 2.68 1.17 - 6.11 0.019
eGFR (per ml/min/1.73m2) 0.98 0.97 - 0.99 0.0046
eGFR < 60ml/min/1.73m2 2.69 1.6 - 4.52 0.00019
Albumin (g/l) 0.91 0.85 - 0.98 0.0085
T4 (pmol/l) 1.19 1.06 - 1.33 0.0026
Urate (mmol/l) 6.22 0.83 - 46.46 0.075
Cholesterol (total) (mmol/l) 0.66 0.53 - 0.83 0.0004
HDL (mmol/l) 0.34 0.17 - 0.68 0.0023
Haemoglobin (g/dl) 0.79 0.69 - 0.92 0.0017
Lymphocytes <1x10⁹/l 2.39 0.85 - 6.71 0.097
* p value < 0.05 indicates a significant difference
281
7.4.3 Indeterminate versus negative MTWA
The results for the comparison of indeterminate versus negative MTWA are displayed in
Table 7-21. Overall there were nineteen parameters where a significant difference (p<0.05)
existed between indeterminate and negative MTWA results.
Patients with an indeterminate result were older and more likely to have had a previous
myocardial infarction and a history of AF, than those with a negative result. They were less
likely to be symptomatic from palpitations than patients with a negative result. Those with an
indeterminate result had a lower resting heart rate and diastolic blood pressure but a higher
pulse pressure than patients with a negative result. In terms of heart failure medications,
patients with an indeterminate result were more likely to be on optimal heart failure therapy.
These patients had significantly more prescribing of both beta-blockers and diuretics than
those with a negative result. Patients with an indeterminate result were also more likely to be
prescribed statins. Patients with an indeterminate result had longer QTc intervals. During
MTWA exercise testing those with an indeterminate result achieved a lower percentage of
their predicted heart rate, than patients with a negative result. LVEF was similar in patients
with indeterminate and negative results. There were several significant biochemical
differences between these two groups. Patients with an indeterminate test had higher log BNP
concentration, higher log (creatinine) concentration and lower eGFR concentration.
Consequently, they were more likely to have at least moderate chronic kidney disease than
patients with a negative result. They were also more likely to be hypoalbuminaemic and have
higher urate levels than patients with a negative result.
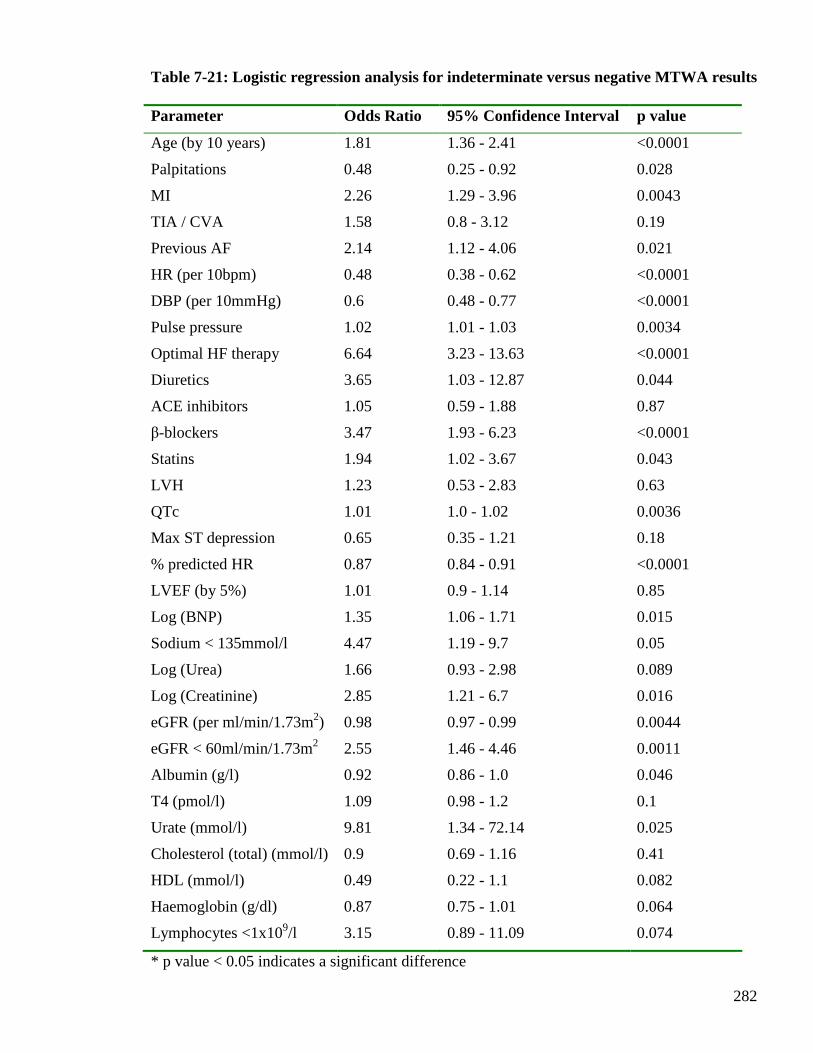
282
Table 7-21: Logistic regression analysis for indeterminate versus negative MTWA results Parameter Odds Ratio 95% Confidence Interval p value
Age (by 10 years) 1.81 1.36 - 2.41 <0.0001
Palpitations 0.48 0.25 - 0.92 0.028
MI 2.26 1.29 - 3.96 0.0043
TIA / CVA 1.58 0.8 - 3.12 0.19
Previous AF 2.14 1.12 - 4.06 0.021
HR (per 10bpm) 0.48 0.38 - 0.62 <0.0001
DBP (per 10mmHg) 0.6 0.48 - 0.77 <0.0001
Pulse pressure 1.02 1.01 - 1.03 0.0034
Optimal HF therapy 6.64 3.23 - 13.63 <0.0001
Diuretics 3.65 1.03 - 12.87 0.044
ACE inhibitors 1.05 0.59 - 1.88 0.87
β-blockers 3.47 1.93 - 6.23 <0.0001
Statins 1.94 1.02 - 3.67 0.043
LVH 1.23 0.53 - 2.83 0.63
QTc 1.01 1.0 - 1.02 0.0036
Max ST depression 0.65 0.35 - 1.21 0.18
% predicted HR 0.87 0.84 - 0.91 <0.0001
LVEF (by 5%) 1.01 0.9 - 1.14 0.85
Log (BNP) 1.35 1.06 - 1.71 0.015
Sodium < 135mmol/l 4.47 1.19 - 9.7 0.05
Log (Urea) 1.66 0.93 - 2.98 0.089
Log (Creatinine) 2.85 1.21 - 6.7 0.016
eGFR (per ml/min/1.73m2) 0.98 0.97 - 0.99 0.0044
eGFR < 60ml/min/1.73m2 2.55 1.46 - 4.46 0.0011
Albumin (g/l) 0.92 0.86 - 1.0 0.046
T4 (pmol/l) 1.09 0.98 - 1.2 0.1
Urate (mmol/l) 9.81 1.34 - 72.14 0.025
Cholesterol (total) (mmol/l) 0.9 0.69 - 1.16 0.41
HDL (mmol/l) 0.49 0.22 - 1.1 0.082
Haemoglobin (g/dl) 0.87 0.75 - 1.01 0.064
Lymphocytes <1x10⁹/l 3.15 0.89 - 11.09 0.074
* p value < 0.05 indicates a significant difference
283
7.5 Discussion
This chapter has described the clinical characteristics associated with specific MTWA results.
When the patients were analysed in three separate groups, according to the MTWA result,
there were 27 clinical characteristics that differed significantly (p<0.05) between the groups of
patients. A large amount of clinical data was included in these analyses and the limitations of
multiple testing are recognised. However, 12 of the 27 characteristics that differed between the
three groups had p values <0.01. When analysis was performed according to the
contemporarily accepted classification of non-negative and negative (85), only 12 clinical
characteristics differed significantly between the two groups (p<0.05), with 8 having p values
<0.01. This novel finding highlights that the patients with non-negative MTWA results are a
heterogeneous group of patients, in terms of clinical characteristics, and may explain the
observation in other studies that patients with an indeterminate test result had a higher all-
cause mortality rate than those with a positive result (84;94;100;102;116). Pair-wise analysis
of MTWA results (negative versus positive; indeterminate versus positive; indeterminate
versus negative) revealed notable differences also. In particular, this analysis exposed major
difference between the indeterminate group and the other two groups of patients (and fewer
differences between those with positive and negative tests). There were 22 clinical
characteristics that significantly differed (p<0.05) between the indeterminate and positive
groups, 14 with p values <0.01. There were almost as many significant differences between
the indeterminate and negative groups, with 11 differences having a p value <0.01.
Interestingly, there were only 3 clinical characteristics with significant differences between the
negative and positive groups and none of these had a p value <0.01.
In summary, this chapter has highlighted that patients with indeterminate MTWA results are a
distinct group of patients with more abnormal clinical characteristics than patients with
positive or negative results. This novel finding argues against the current classification of
patients into two groups, as non-negative and negative, and proposes that MTWA results
should be considered as three separate groups: positive, negative and indeterminate. Whether
or not this translates into a difference prognostically, thereby influencing how MTWA results
should be classified for risk stratification purposes will be the focus of Chapter 8.

284
CHAPTER EIGHT
PROGNOSTIC VALUE
OF MICROVOLT T-WAVE ALTERNANS
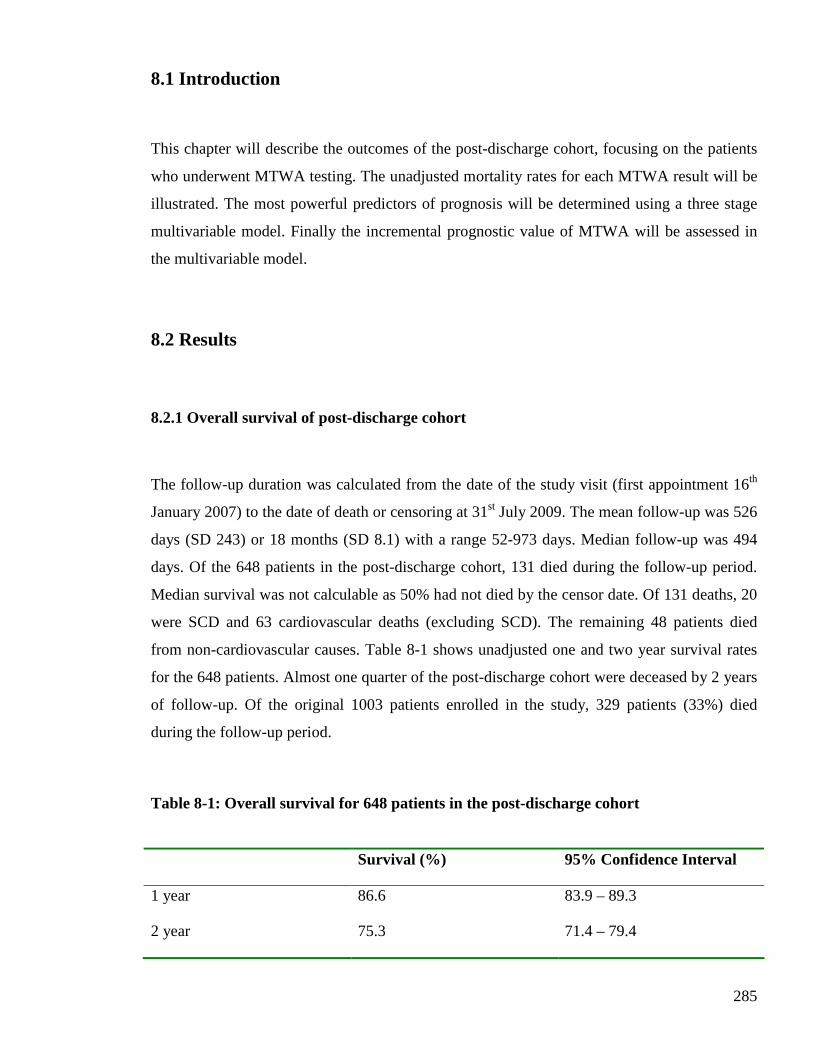
285
8.1 Introduction
This chapter will describe the outcomes of the post-discharge cohort, focusing on the patients
who underwent MTWA testing. The unadjusted mortality rates for each MTWA result will be
illustrated. The most powerful predictors of prognosis will be determined using a three stage
multivariable model. Finally the incremental prognostic value of MTWA will be assessed in
the multivariable model.
8.2 Results
8.2.1 Overall survival of post-discharge cohort
The follow-up duration was calculated from the date of the study visit (first appointment 16th
January 2007) to the date of death or censoring at 31st July 2009. The mean follow-up was 526
days (SD 243) or 18 months (SD 8.1) with a range 52-973 days. Median follow-up was 494
days. Of the 648 patients in the post-discharge cohort, 131 died during the follow-up period.
Median survival was not calculable as 50% had not died by the censor date. Of 131 deaths, 20
were SCD and 63 cardiovascular deaths (excluding SCD). The remaining 48 patients died
from non-cardiovascular causes. Table 8-1 shows unadjusted one and two year survival rates
for the 648 patients. Almost one quarter of the post-discharge cohort were deceased by 2 years
of follow-up. Of the original 1003 patients enrolled in the study, 329 patients (33%) died
during the follow-up period.
Table 8-1: Overall survival for 648 patients in the post-discharge cohort
Survival (%) 95% Confidence Interval
1 year 86.6 83.9 – 89.3
2 year 75.3 71.4 – 79.4
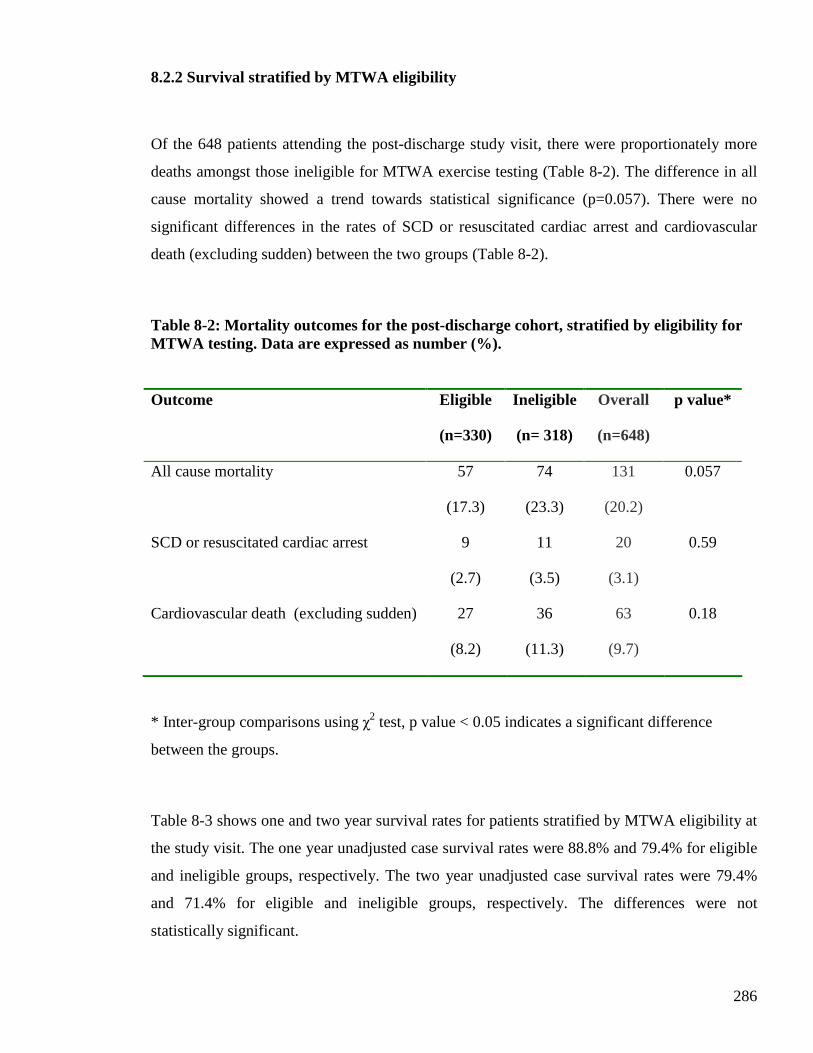
286
8.2.2 Survival stratified by MTWA eligibility
Of the 648 patients attending the post-discharge study visit, there were proportionately more
deaths amongst those ineligible for MTWA exercise testing (Table 8-2). The difference in all
cause mortality showed a trend towards statistical significance (p=0.057). There were no
significant differences in the rates of SCD or resuscitated cardiac arrest and cardiovascular
death (excluding sudden) between the two groups (Table 8-2).
Table 8-2: Mortality outcomes for the post-discharge cohort, stratified by eligibility for MTWA testing. Data are expressed as number (%).
Outcome Eligible
(n=330)
Ineligible
(n= 318)
Overall
(n=648)
p value*
All cause mortality 57
(17.3)
74
(23.3)
131
(20.2)
0.057
SCD or resuscitated cardiac arrest 9
(2.7)
11
(3.5)
20
(3.1)
0.59
Cardiovascular death (excluding sudden) 27
(8.2)
36
(11.3)
63
(9.7)
0.18
* Inter-group comparisons using χ2 test, p value < 0.05 indicates a significant difference
between the groups.
Table 8-3 shows one and two year survival rates for patients stratified by MTWA eligibility at
the study visit. The one year unadjusted case survival rates were 88.8% and 79.4% for eligible
and ineligible groups, respectively. The two year unadjusted case survival rates were 79.4%
and 71.4% for eligible and ineligible groups, respectively. The differences were not
statistically significant.
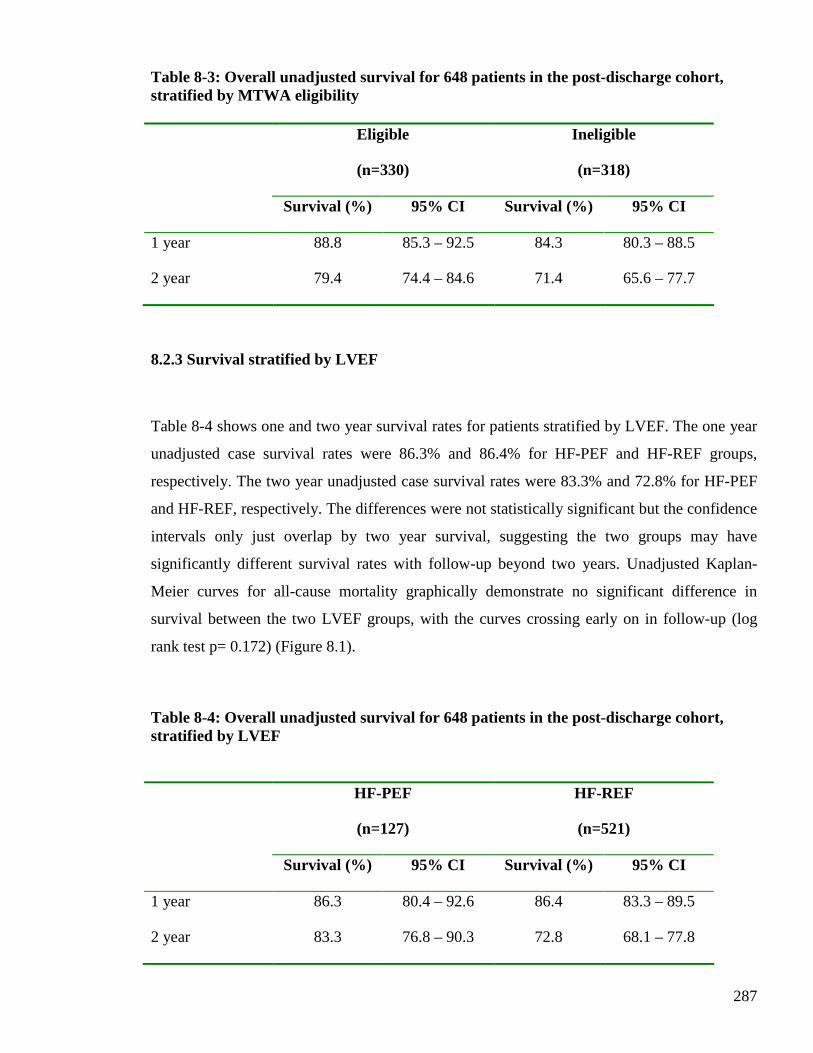
287
Table 8-3: Overall unadjusted survival for 648 patients in the post-discharge cohort, stratified by MTWA eligibility
Eligible
(n=330)
Ineligible
(n=318)
Survival (%) 95% CI Survival (%) 95% CI
1 year 88.8 85.3 – 92.5 84.3 80.3 – 88.5
2 year 79.4 74.4 – 84.6 71.4 65.6 – 77.7
8.2.3 Survival stratified by LVEF
Table 8-4 shows one and two year survival rates for patients stratified by LVEF. The one year
unadjusted case survival rates were 86.3% and 86.4% for HF-PEF and HF-REF groups,
respectively. The two year unadjusted case survival rates were 83.3% and 72.8% for HF-PEF
and HF-REF, respectively. The differences were not statistically significant but the confidence
intervals only just overlap by two year survival, suggesting the two groups may have
significantly different survival rates with follow-up beyond two years. Unadjusted Kaplan-
Meier curves for all-cause mortality graphically demonstrate no significant difference in
survival between the two LVEF groups, with the curves crossing early on in follow-up (log
rank test p= 0.172) (Figure 8.1).
Table 8-4: Overall unadjusted survival for 648 patients in the post-discharge cohort, stratified by LVEF
HF-PEF
(n=127)
HF-REF
(n=521)
Survival (%) 95% CI Survival (%) 95% CI
1 year 86.3 80.4 – 92.6 86.4 83.3 – 89.5
2 year 83.3 76.8 – 90.3 72.8 68.1 – 77.8
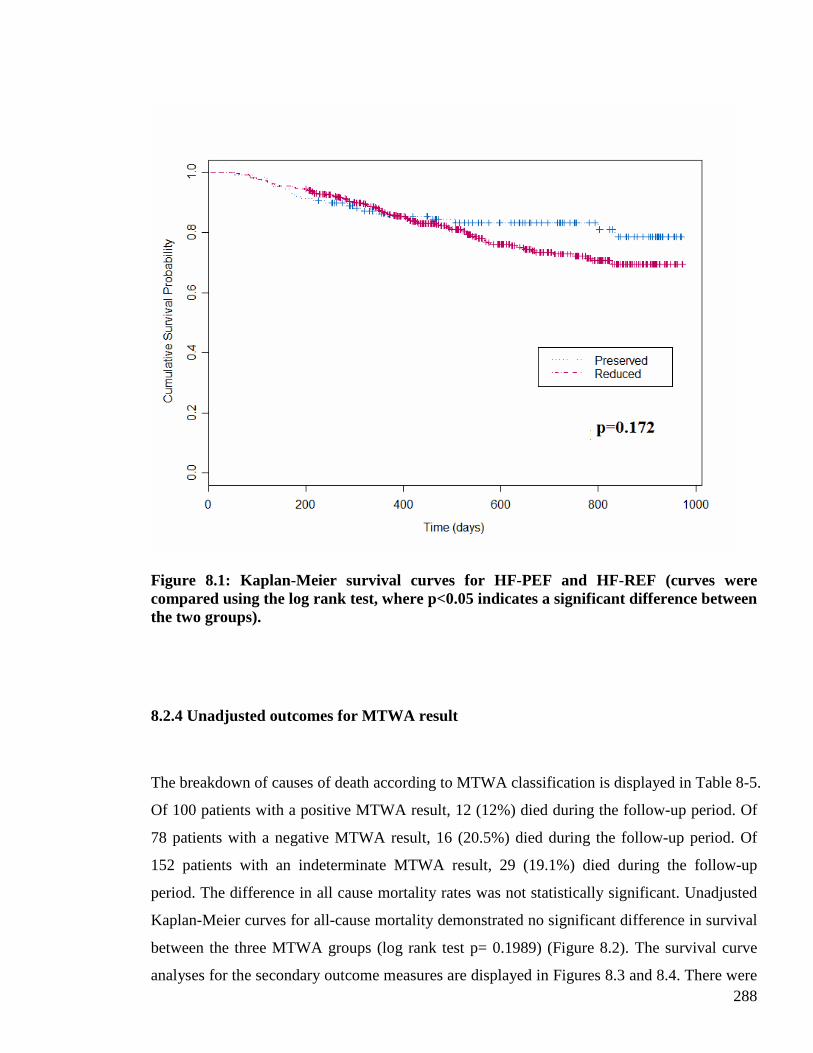
288
Figure 8.1: Kaplan-Meier survival curves for HF-PEF and HF-REF (curves were compared using the log rank test, where p<0.05 indicates a significant difference between the two groups).
8.2.4 Unadjusted outcomes for MTWA result
The breakdown of causes of death according to MTWA classification is displayed in Table 8-5.
Of 100 patients with a positive MTWA result, 12 (12%) died during the follow-up period. Of
78 patients with a negative MTWA result, 16 (20.5%) died during the follow-up period. Of
152 patients with an indeterminate MTWA result, 29 (19.1%) died during the follow-up
period. The difference in all cause mortality rates was not statistically significant. Unadjusted
Kaplan-Meier curves for all-cause mortality demonstrated no significant difference in survival
between the three MTWA groups (log rank test p= 0.1989) (Figure 8.2). The survival curve
analyses for the secondary outcome measures are displayed in Figures 8.3 and 8.4. There were
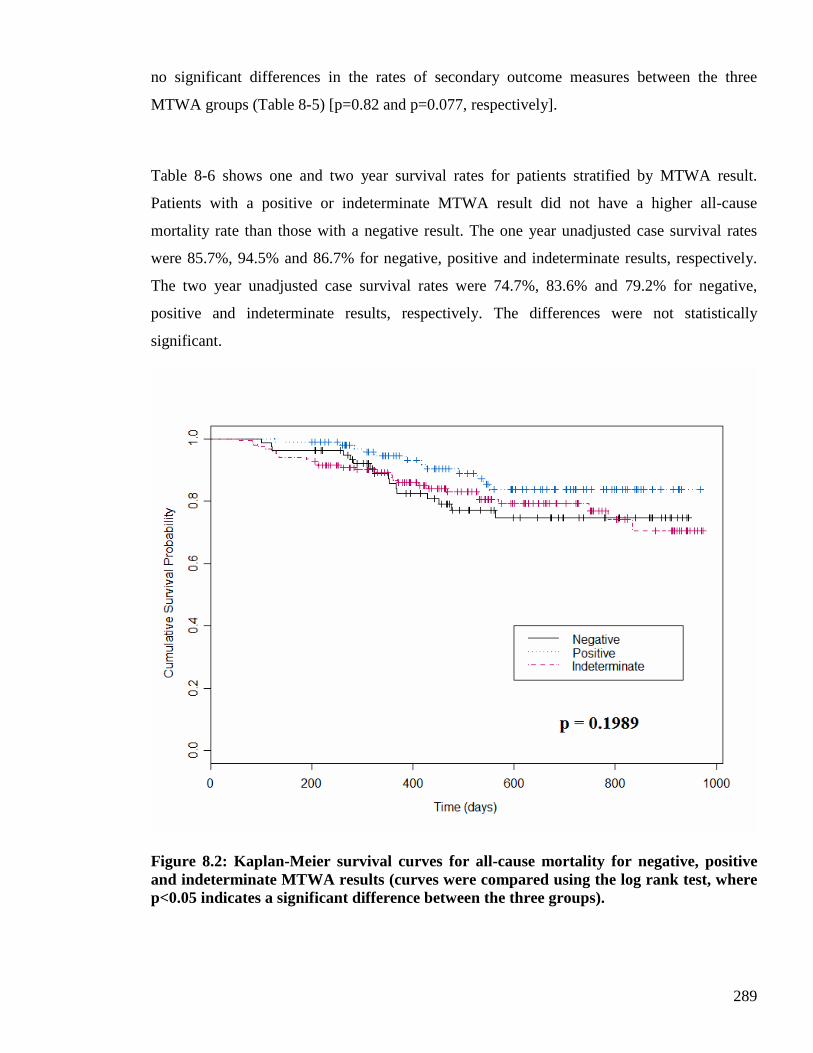
289
no significant differences in the rates of secondary outcome measures between the three
MTWA groups (Table 8-5) [p=0.82 and p=0.077, respectively].
Table 8-6 shows one and two year survival rates for patients stratified by MTWA result.
Patients with a positive or indeterminate MTWA result did not have a higher all-cause
mortality rate than those with a negative result. The one year unadjusted case survival rates
were 85.7%, 94.5% and 86.7% for negative, positive and indeterminate results, respectively.
The two year unadjusted case survival rates were 74.7%, 83.6% and 79.2% for negative,
positive and indeterminate results, respectively. The differences were not statistically
significant.
Figure 8.2: Kaplan-Meier survival curves for all-cause mortality for negative, positive and indeterminate MTWA results (curves were compared using the log rank test, where p<0.05 indicates a significant difference between the three groups).
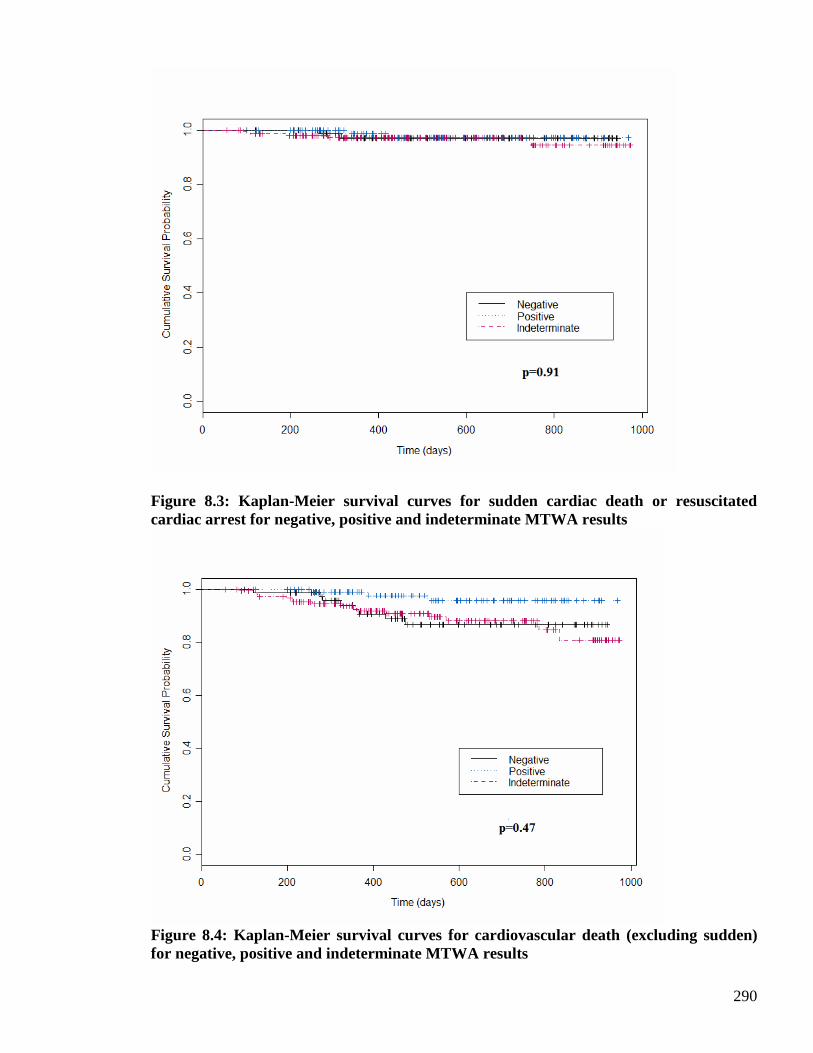
290
Figure 8.3: Kaplan-Meier survival curves for sudden cardiac death or resuscitated cardiac arrest for negative, positive and indeterminate MTWA results
Figure 8.4: Kaplan-Meier survival curves for cardiovascular death (excluding sudden) for negative, positive and indeterminate MTWA results
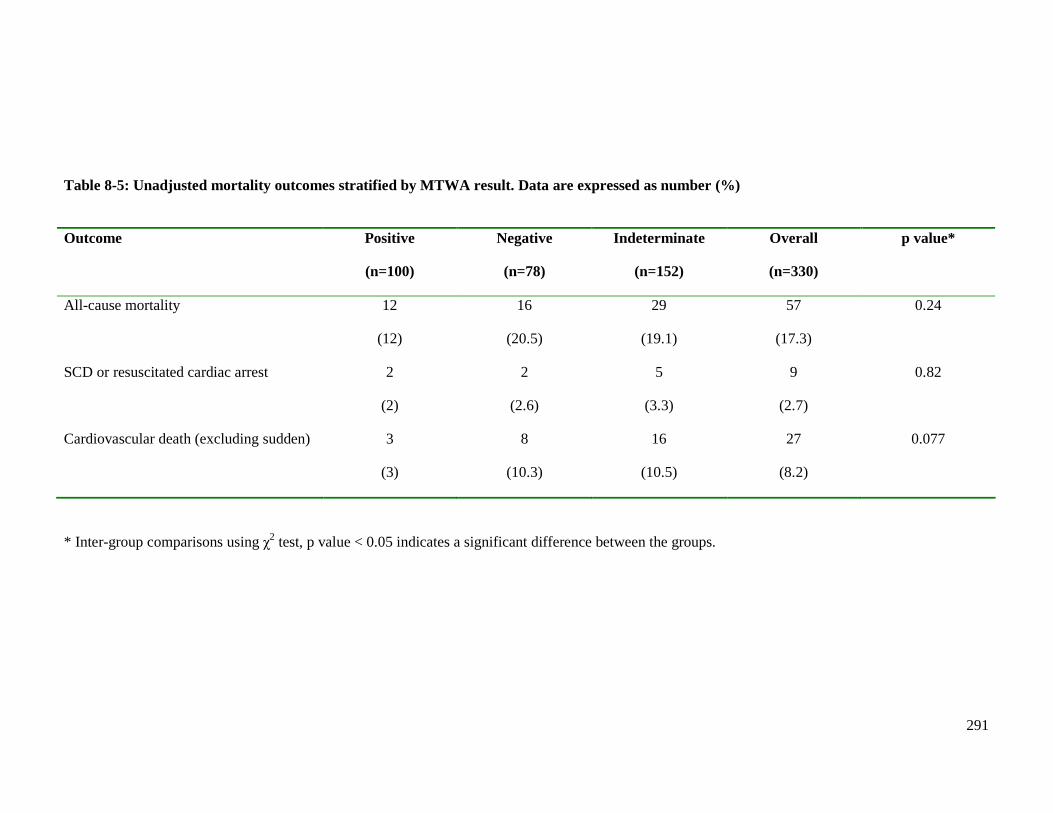
291
Table 8-5: Unadjusted mortality outcomes stratified by MTWA result. Data are expressed as number (%)
Outcome Positive
(n=100)
Negative
(n=78)
Indeterminate
(n=152)
Overall
(n=330)
p value*
All-cause mortality 12
(12)
16
(20.5)
29
(19.1)
57
(17.3)
0.24
SCD or resuscitated cardiac arrest 2
(2)
2
(2.6)
5
(3.3)
9
(2.7)
0.82
Cardiovascular death (excluding sudden) 3
(3)
8
(10.3)
16
(10.5)
27
(8.2)
0.077
* Inter-group comparisons using χ2 test, p value < 0.05 indicates a significant difference between the groups.
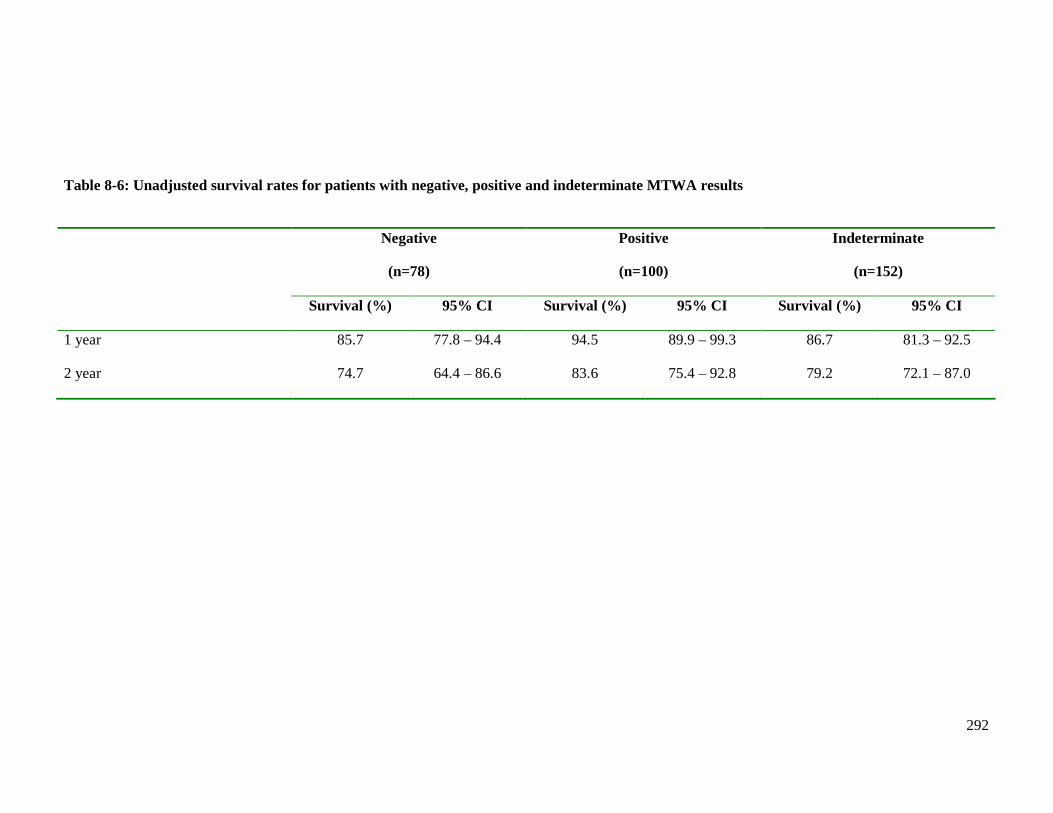
292
Table 8-6: Unadjusted survival rates for patients with negative, positive and indeterminate MTWA results
Negative
(n=78)
Positive
(n=100)
Indeterminate
(n=152)
Survival (%) 95% CI Survival (%) 95% CI Survival (% ) 95% CI
1 year 85.7 77.8 – 94.4 94.5 89.9 – 99.3 86.7 81.3 – 92.5
2 year 74.7 64.4 – 86.6 83.6 75.4 – 92.8 79.2 72.1 – 87.0
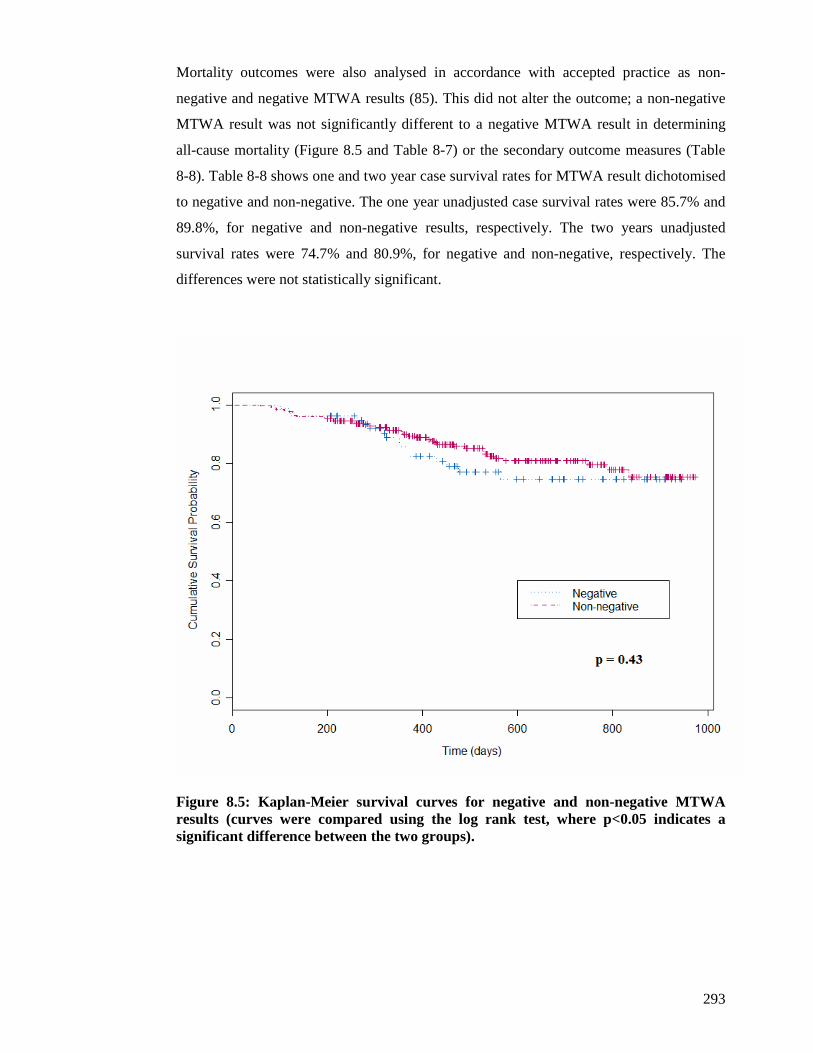
293
Mortality outcomes were also analysed in accordance with accepted practice as non-
negative and negative MTWA results (85). This did not alter the outcome; a non-negative
MTWA result was not significantly different to a negative MTWA result in determining
all-cause mortality (Figure 8.5 and Table 8-7) or the secondary outcome measures (Table
8-8). Table 8-8 shows one and two year case survival rates for MTWA result dichotomised
to negative and non-negative. The one year unadjusted case survival rates were 85.7% and
89.8%, for negative and non-negative results, respectively. The two years unadjusted
survival rates were 74.7% and 80.9%, for negative and non-negative, respectively. The
differences were not statistically significant.
Figure 8.5: Kaplan-Meier survival curves for negative and non-negative MTWA results (curves were compared using the log rank test, where p<0.05 indicates a significant difference between the two groups).
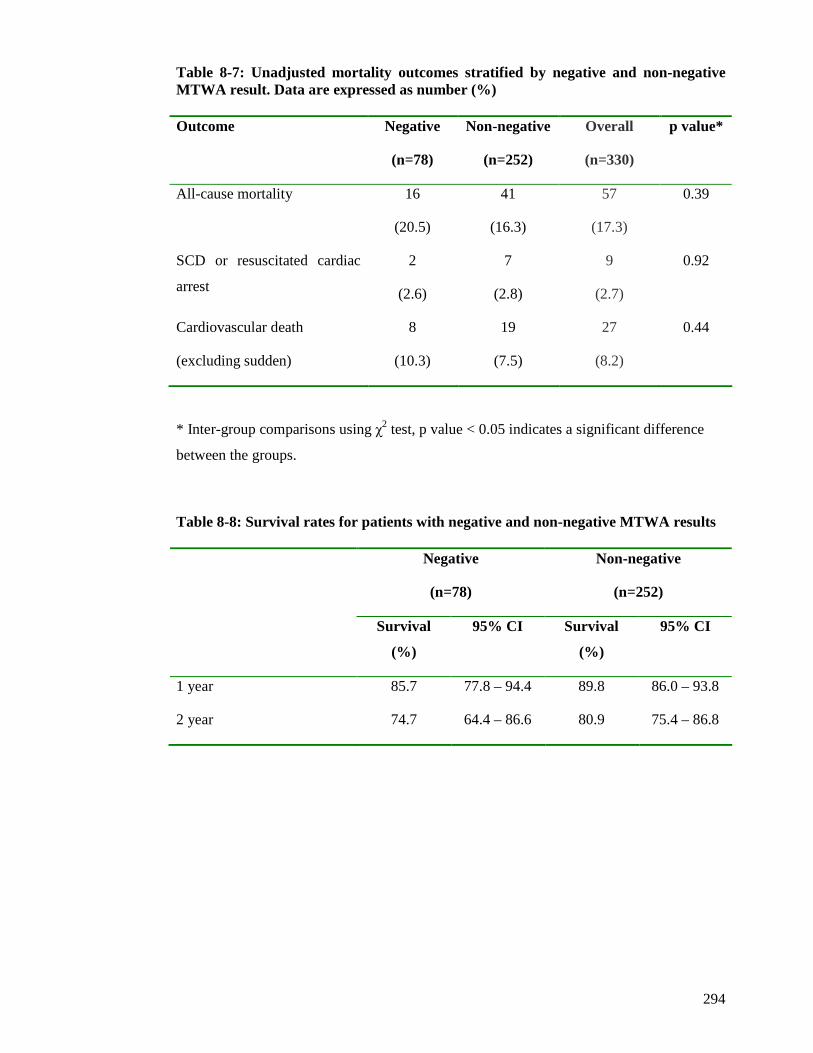
294
Table 8-7: Unadjusted mortality outcomes stratified by negative and non-negative MTWA result. Data are expressed as number (%) Outcome Negative
(n=78)
Non-negative
(n=252)
Overall
(n=330)
p value*
All-cause mortality 16
(20.5)
41
(16.3)
57
(17.3)
0.39
SCD or resuscitated cardiac
arrest
2
(2.6)
7
(2.8)
9
(2.7)
0.92
Cardiovascular death
(excluding sudden)
8
(10.3)
19
(7.5)
27
(8.2)
0.44
* Inter-group comparisons using χ2 test, p value < 0.05 indicates a significant difference
between the groups.
Table 8-8: Survival rates for patients with negative and non-negative MTWA results
Negative
(n=78)
Non-negative
(n=252)
Survival
(%)
95% CI Survival
(%)
95% CI
1 year 85.7 77.8 – 94.4 89.8 86.0 – 93.8
2 year 74.7 64.4 – 86.6 80.9 75.4 – 86.8
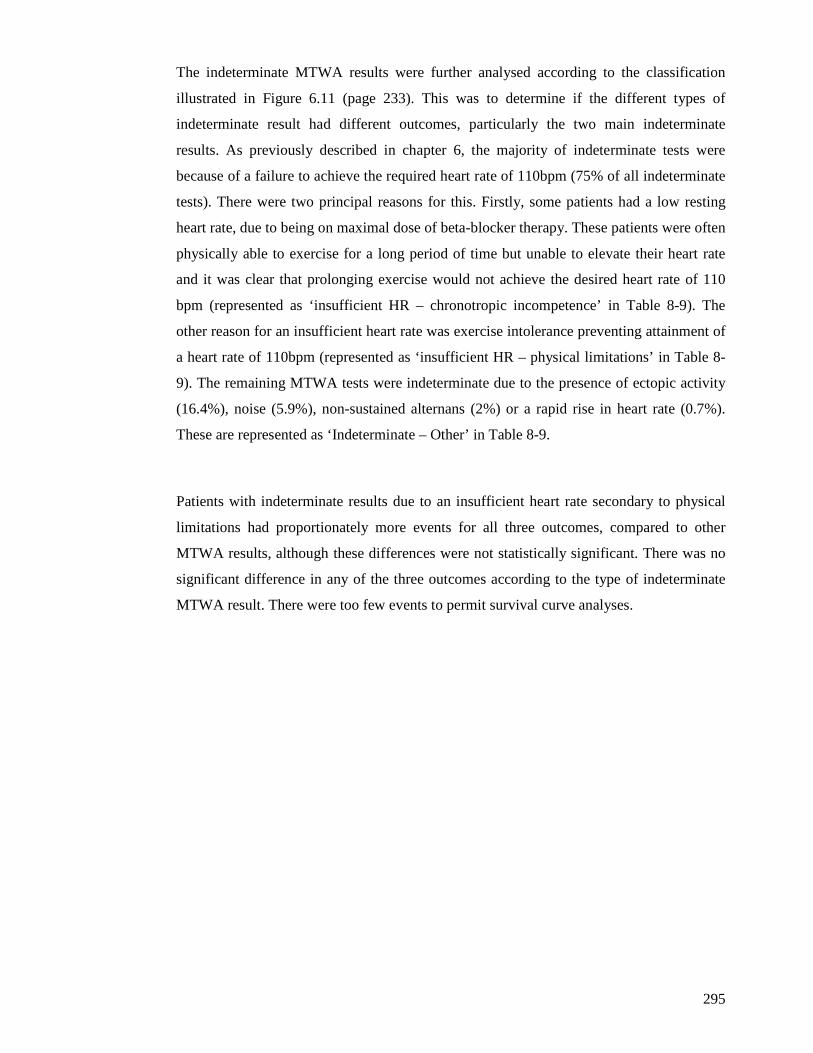
295
The indeterminate MTWA results were further analysed according to the classification
illustrated in Figure 6.11 (page 233). This was to determine if the different types of
indeterminate result had different outcomes, particularly the two main indeterminate
results. As previously described in chapter 6, the majority of indeterminate tests were
because of a failure to achieve the required heart rate of 110bpm (75% of all indeterminate
tests). There were two principal reasons for this. Firstly, some patients had a low resting
heart rate, due to being on maximal dose of beta-blocker therapy. These patients were often
physically able to exercise for a long period of time but unable to elevate their heart rate
and it was clear that prolonging exercise would not achieve the desired heart rate of 110
bpm (represented as ‘insufficient HR – chronotropic incompetence’ in Table 8-9). The
other reason for an insufficient heart rate was exercise intolerance preventing attainment of
a heart rate of 110bpm (represented as ‘insufficient HR – physical limitations’ in Table 8-
9). The remaining MTWA tests were indeterminate due to the presence of ectopic activity
(16.4%), noise (5.9%), non-sustained alternans (2%) or a rapid rise in heart rate (0.7%).
These are represented as ‘Indeterminate – Other’ in Table 8-9.
Patients with indeterminate results due to an insufficient heart rate secondary to physical
limitations had proportionately more events for all three outcomes, compared to other
MTWA results, although these differences were not statistically significant. There was no
significant difference in any of the three outcomes according to the type of indeterminate
MTWA result. There were too few events to permit survival curve analyses.
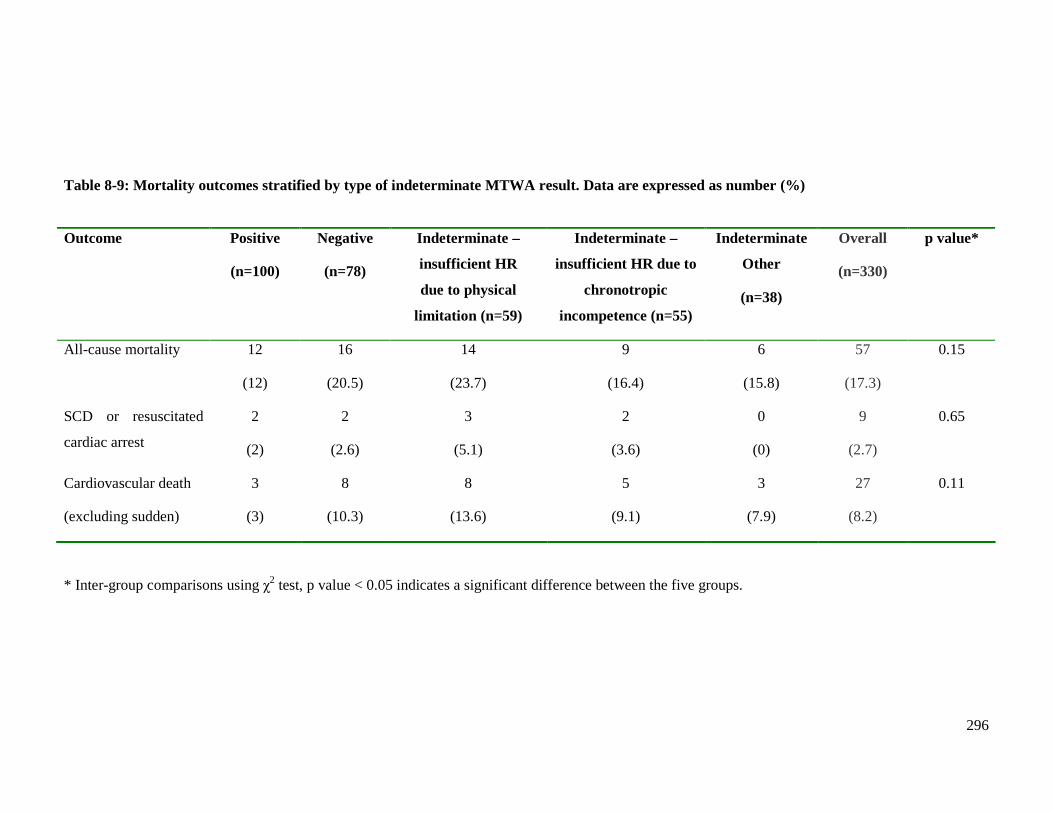
296
Table 8-9: Mortality outcomes stratified by type of indeterminate MTWA result. Data are expressed as number (%)
Outcome Positive
(n=100)
Negative
(n=78)
Indeterminate –
insufficient HR
due to physical
limitation (n=59)
Indeterminate –
insufficient HR due to
chronotropic
incompetence (n=55)
Indeterminate
Other
(n=38)
Overall
(n=330)
p value*
All-cause mortality 12
(12)
16
(20.5)
14
(23.7)
9
(16.4)
6
(15.8)
57
(17.3)
0.15
SCD or resuscitated
cardiac arrest
2
(2)
2
(2.6)
3
(5.1)
2
(3.6)
0
(0)
9
(2.7)
0.65
Cardiovascular death
(excluding sudden)
3
(3)
8
(10.3)
8
(13.6)
5
(9.1)
3
(7.9)
27
(8.2)
0.11
* Inter-group comparisons using χ2 test, p value < 0.05 indicates a significant difference between the five groups.
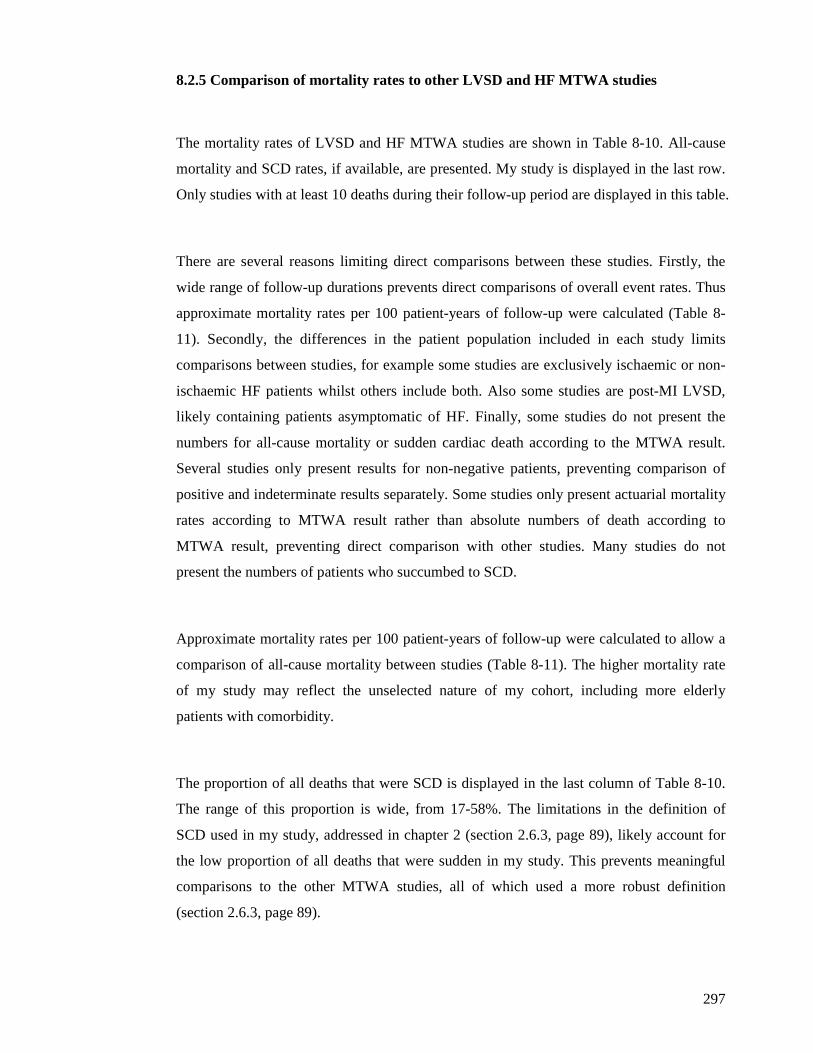
297
8.2.5 Comparison of mortality rates to other LVSD and HF MTWA studies
The mortality rates of LVSD and HF MTWA studies are shown in Table 8-10. All-cause
mortality and SCD rates, if available, are presented. My study is displayed in the last row.
Only studies with at least 10 deaths during their follow-up period are displayed in this table.
There are several reasons limiting direct comparisons between these studies. Firstly, the
wide range of follow-up durations prevents direct comparisons of overall event rates. Thus
approximate mortality rates per 100 patient-years of follow-up were calculated (Table 8-
11). Secondly, the differences in the patient population included in each study limits
comparisons between studies, for example some studies are exclusively ischaemic or non-
ischaemic HF patients whilst others include both. Also some studies are post-MI LVSD,
likely containing patients asymptomatic of HF. Finally, some studies do not present the
numbers for all-cause mortality or sudden cardiac death according to the MTWA result.
Several studies only present results for non-negative patients, preventing comparison of
positive and indeterminate results separately. Some studies only present actuarial mortality
rates according to MTWA result rather than absolute numbers of death according to
MTWA result, preventing direct comparison with other studies. Many studies do not
present the numbers of patients who succumbed to SCD.
Approximate mortality rates per 100 patient-years of follow-up were calculated to allow a
comparison of all-cause mortality between studies (Table 8-11). The higher mortality rate
of my study may reflect the unselected nature of my cohort, including more elderly
patients with comorbidity.
The proportion of all deaths that were SCD is displayed in the last column of Table 8-10.
The range of this proportion is wide, from 17-58%. The limitations in the definition of
SCD used in my study, addressed in chapter 2 (section 2.6.3, page 89), likely account for
the low proportion of all deaths that were sudden in my study. This prevents meaningful
comparisons to the other MTWA studies, all of which used a more robust definition
(section 2.6.3, page 89).
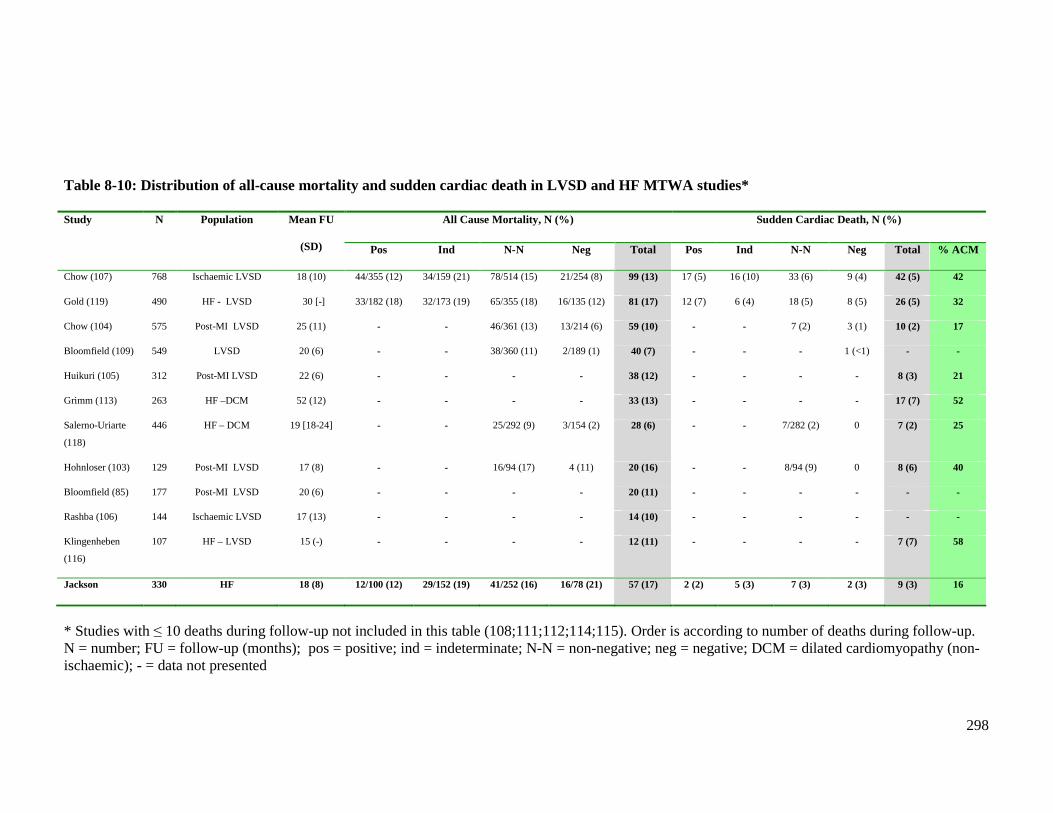
298
Table 8-10: Distribution of all-cause mortality and sudden cardiac death in LVSD and HF MTWA studies*
All Cause Mortality, N (%) Sudden Cardiac Death, N (%) Study N Population Mean FU
(SD) Pos Ind N-N Neg Total Pos Ind N-N Neg Total % ACM
Chow (107) 768 Ischaemic LVSD 18 (10) 44/355 (12) 34/159 (21) 78/514 (15) 21/254 (8) 99 (13) 17 (5) 16 (10) 33 (6) 9 (4) 42 (5) 42
Gold (119) 490 HF - LVSD 30 [-] 33/182 (18) 32/173 (19) 65/355 (18) 16/135 (12) 81 (17) 12 (7) 6 (4) 18 (5) 8 (5) 26 (5) 32
Chow (104) 575 Post-MI LVSD 25 (11) - - 46/361 (13) 13/214 (6) 59 (10) - - 7 (2) 3 (1) 10 (2) 17
Bloomfield (109) 549 LVSD 20 (6) - - 38/360 (11) 2/189 (1) 40 (7) - - - 1 (<1) - -
Huikuri (105) 312 Post-MI LVSD 22 (6) - - - - 38 (12) - - - - 8 (3) 21
Grimm (113) 263 HF –DCM 52 (12) - - - - 33 (13) - - - - 17 (7) 52
Salerno-Uriarte
(118)
446 HF – DCM 19 [18-24] - - 25/292 (9) 3/154 (2) 28 (6) - - 7/282 (2) 0 7 (2) 25
Hohnloser (103) 129 Post-MI LVSD 17 (8) - - 16/94 (17) 4 (11) 20 (16) - - 8/94 (9) 0 8 (6) 40
Bloomfield (85) 177 Post-MI LVSD 20 (6) - - - - 20 (11) - - - - - -
Rashba (106) 144 Ischaemic LVSD 17 (13) - - - - 14 (10) - - - - - -
Klingenheben
(116)
107 HF – LVSD 15 (-) - - - - 12 (11) - - - - 7 (7) 58
Jackson 330 HF 18 (8) 12/100 (12) 29/152 (19) 41/252 (16) 16/78 (21) 57 (17) 2 (2) 5 (3) 7 (3) 2 (3) 9 (3) 16
* Studies with ≤ 10 deaths during follow-up not included in this table (108;111;112;114;115). Order is according to number of deaths during follow-up. N = number; FU = follow-up (months); pos = positive; ind = indeterminate; N-N = non-negative; neg = negative; DCM = dilated cardiomyopathy (non-ischaemic); - = data not presented
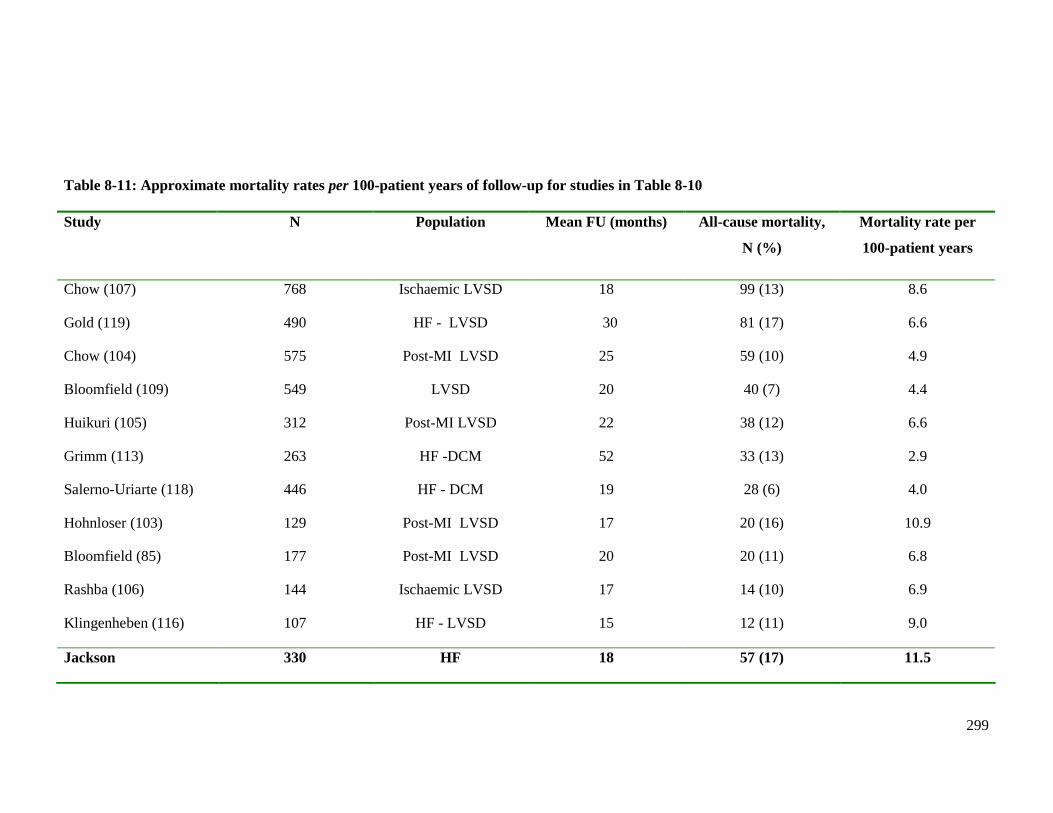
299
Table 8-11: Approximate mortality rates per 100-patient years of follow-up for studies in Table 8-10 Study N Population Mean FU (months)
All- cause mortality,
N (%)
Mortality rate per
100-patient years
Chow (107) 768 Ischaemic LVSD 18 99 (13) 8.6
Gold (119) 490 HF - LVSD 30 81 (17) 6.6
Chow (104) 575 Post-MI LVSD 25 59 (10) 4.9
Bloomfield (109) 549 LVSD 20 40 (7) 4.4
Huikuri (105) 312 Post-MI LVSD 22 38 (12) 6.6
Grimm (113) 263 HF -DCM 52 33 (13) 2.9
Salerno-Uriarte (118) 446 HF - DCM 19 28 (6) 4.0
Hohnloser (103) 129 Post-MI LVSD 17 20 (16) 10.9
Bloomfield (85) 177 Post-MI LVSD 20 20 (11) 6.8
Rashba (106) 144 Ischaemic LVSD 17 14 (10) 6.9
Klingenheben (116) 107 HF - LVSD 15 12 (11) 9.0
Jackson 330 HF 18 57 (17) 11.5
300
8.2.6 Stepwise multivariable models without MTWA
A detailed description of the variables selection and the statistical analyses employed in the
multivariable models is given in chapter 2 (section 2.6, page 86). Multivariable analysis
was carried out using a Cox proportional hazards regression three stage model. The
multivariable models were created using the significant univariate variables at each stage.
These analyses are for all-cause mortality only. There were too few events to allow
analyses for the secondary outcome measures.
The univariate and multivariable analysis for stage one is presented in Table 8-12.
Increasing age, lower LVEF, lower BMI, NYHA class III or IV, a diagnosis of HF for
more than two years and a history of a previous MI were univariate predictors of all-cause
mortality. After adjusting for the variables in the Cox regression model, lower BMI,
NYHA class III or IV and previous MI were found to be independent predictors of all-
cause mortality.
The univariate and multivariable analysis for stage two is presented in Table 8-13. Lower
eGFR, higher RDW, higher bilirubin and lower haemoglobin concentrations were
univariate predictors of all-cause mortality. After adjusting for the variables in the Cox
regression model, lower eGFR, higher bilirubin and lower haemoglobin concentration were
found to be independent predictors of all-cause mortality.
The univariate and multivariable analysis for stage three is presented in Table 8-14. This
showed elevated levels of both novel biomarkers BNP and troponin I to be independent
predictors of all-cause mortality.
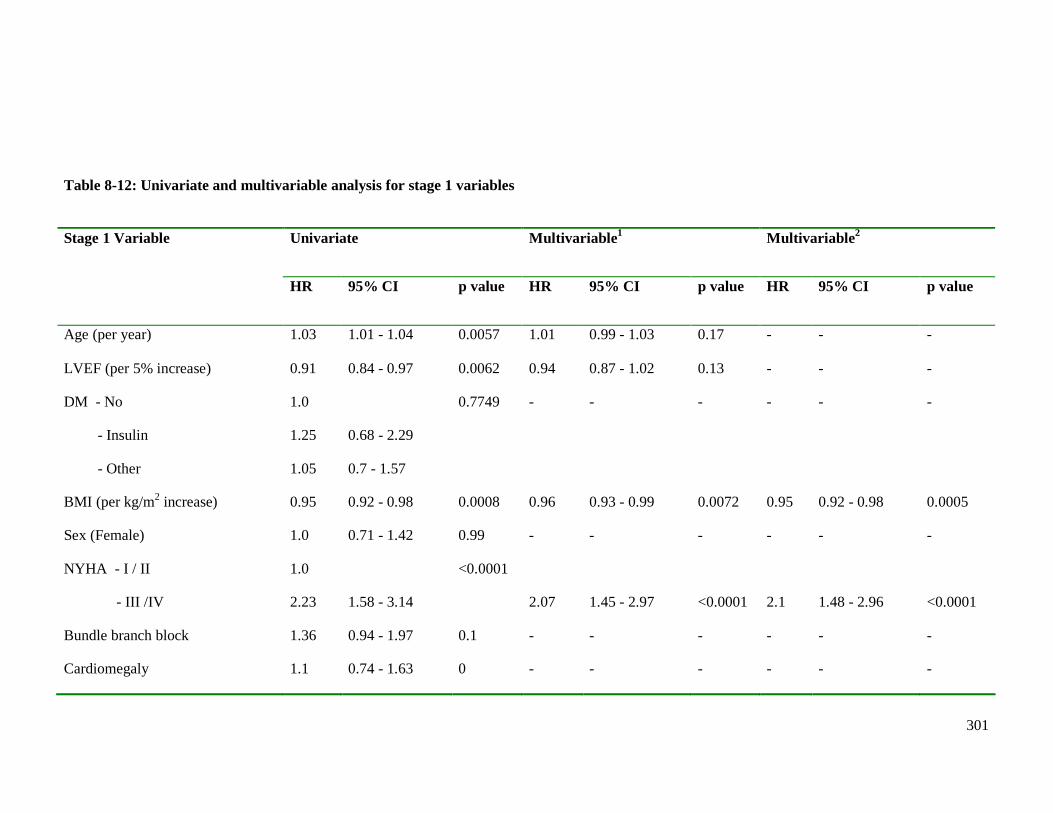
301
Table 8-12: Univariate and multivariable analysis for stage 1 variables
Univariate Multivariable 1 Multivariable 2 Stage 1 Variable
HR 95% CI p value HR 95% CI p value HR 95% CI p value
Age (per year) 1.03 1.01 - 1.04 0.0057 1.01 0.99 - 1.03 0.17 - - -
LVEF (per 5% increase) 0.91 0.84 - 0.97 0.0062 0.94 0.87 - 1.02 0.13 - - -
DM - No
- Insulin
- Other
1.0
1.25
1.05
0.68 - 2.29
0.7 - 1.57
0.7749 - - - - - -
BMI (per kg/m2 increase) 0.95 0.92 - 0.98 0.0008 0.96 0.93 - 0.99 0.0072 0.95 0.92 - 0.98 0.0005
Sex (Female) 1.0 0.71 - 1.42 0.99 - - - - - -
NYHA - I / II
- III /IV
1.0
2.23
1.58 - 3.14
<0.0001
2.07
1.45 - 2.97
<0.0001
2.1
1.48 - 2.96
<0.0001
Bundle branch block 1.36 0.94 - 1.97 0.1 - - - - - -
Cardiomegaly 1.1 0.74 - 1.63 0 - - - - - -
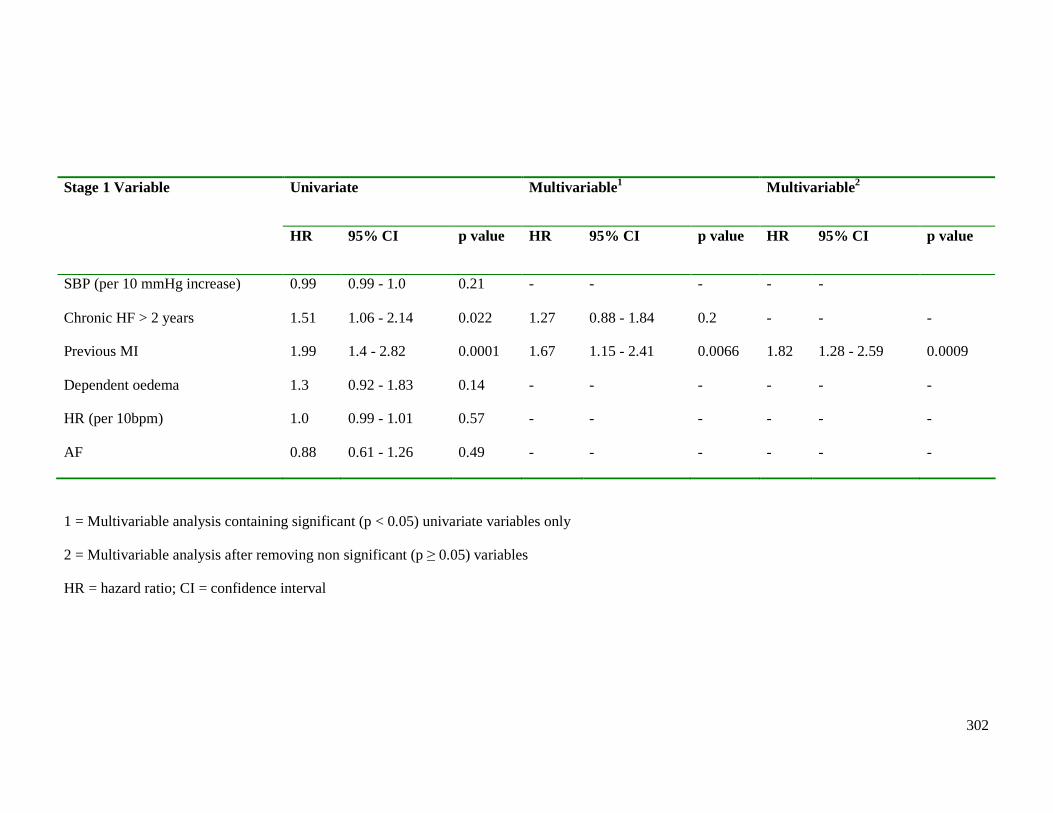
302
Univariate Multivariable 1 Multivariable 2 Stage 1 Variable
HR 95% CI p value HR 95% CI p value HR 95% CI p value
SBP (per 10 mmHg increase) 0.99 0.99 - 1.0 0.21 - - - - -
Chronic HF > 2 years 1.51 1.06 - 2.14 0.022 1.27 0.88 - 1.84 0.2 - - -
Previous MI 1.99 1.4 - 2.82 0.0001 1.67 1.15 - 2.41 0.0066 1.82 1.28 - 2.59 0.0009
Dependent oedema 1.3 0.92 - 1.83 0.14 - - - - - -
HR (per 10bpm) 1.0 0.99 - 1.01 0.57 - - - - - -
AF 0.88 0.61 - 1.26 0.49 - - - - - -
1 = Multivariable analysis containing significant (p < 0.05) univariate variables only
2 = Multivariable analysis after removing non significant (p ≥ 0.05) variables
HR = hazard ratio; CI = confidence interval
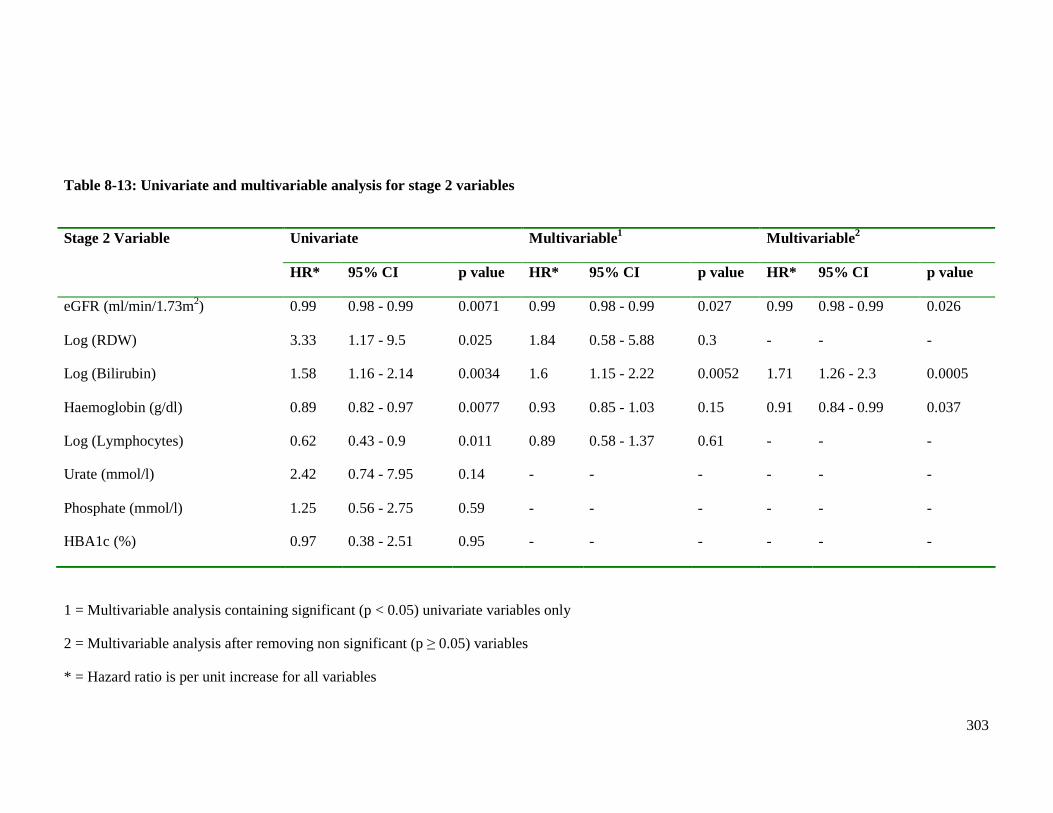
303
Table 8-13: Univariate and multivariable analysis for stage 2 variables
Univariate Multivariable 1 Multivariable 2 Stage 2 Variable
HR* 95% CI p value HR* 95% CI p value HR* 95% CI p value
eGFR (ml/min/1.73m2) 0.99 0.98 - 0.99 0.0071 0.99 0.98 - 0.99 0.027 0.99 0.98 - 0.99 0.026
Log (RDW) 3.33 1.17 - 9.5 0.025 1.84 0.58 - 5.88 0.3 - - -
Log (Bilirubin) 1.58 1.16 - 2.14 0.0034 1.6 1.15 - 2.22 0.0052 1.71 1.26 - 2.3 0.0005
Haemoglobin (g/dl) 0.89 0.82 - 0.97 0.0077 0.93 0.85 - 1.03 0.15 0.91 0.84 - 0.99 0.037
Log (Lymphocytes) 0.62 0.43 - 0.9 0.011 0.89 0.58 - 1.37 0.61 - - -
Urate (mmol/l) 2.42 0.74 - 7.95 0.14 - - - - - -
Phosphate (mmol/l) 1.25 0.56 - 2.75 0.59 - - - - - -
HBA1c (%) 0.97 0.38 - 2.51 0.95 - - - - - -
1 = Multivariable analysis containing significant (p < 0.05) univariate variables only
2 = Multivariable analysis after removing non significant (p ≥ 0.05) variables
* = Hazard ratio is per unit increase for all variables
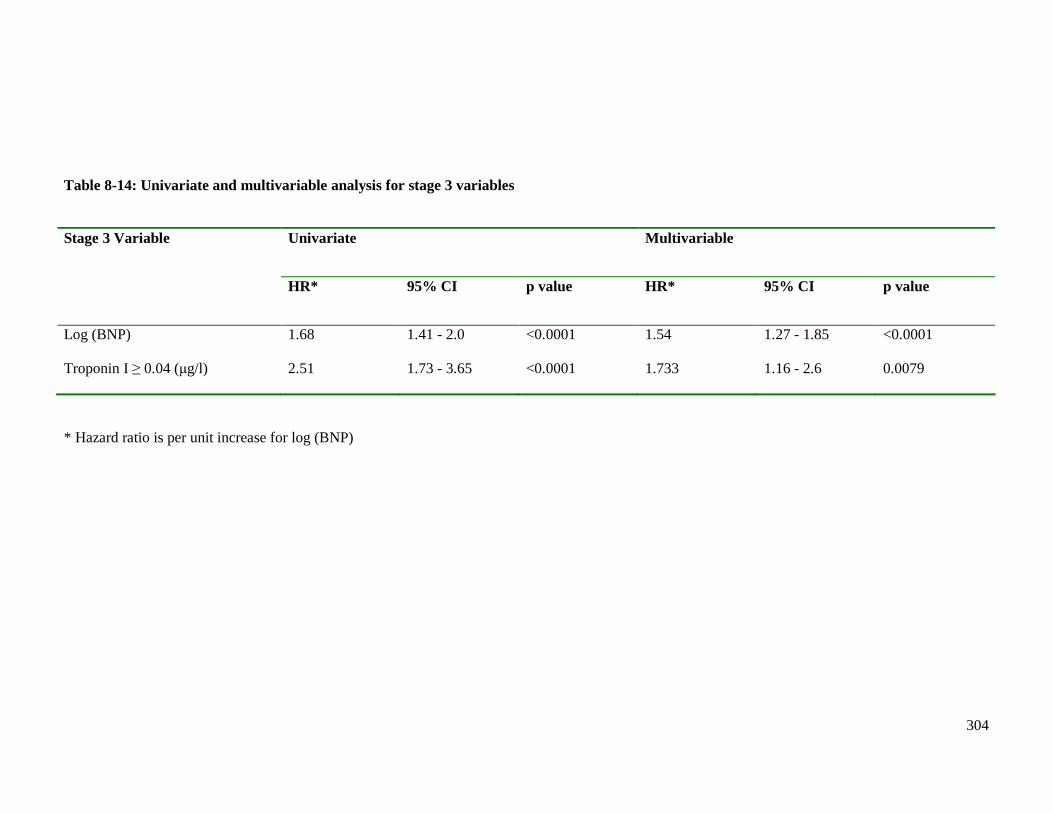
304
Table 8-14: Univariate and multivariable analysis for stage 3 variables
Univariate Multivariable Stage 3 Variable
HR* 95% CI p value HR* 95% CI p value
Log (BNP) 1.68 1.41 - 2.0 <0.0001 1.54 1.27 - 1.85 <0.0001
Troponin I ≥ 0.04 (µg/l) 2.51 1.73 - 3.65 <0.0001 1.733 1.16 - 2.6 0.0079
* Hazard ratio is per unit increase for log (BNP)
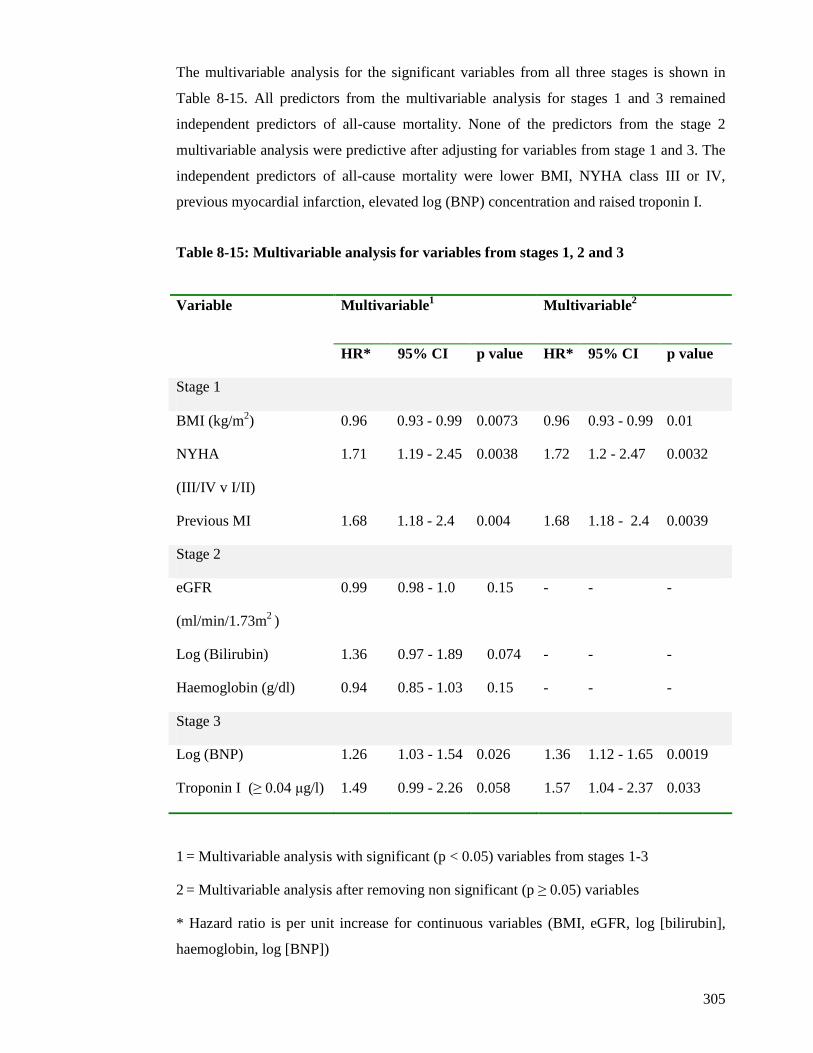
305
The multivariable analysis for the significant variables from all three stages is shown in
Table 8-15. All predictors from the multivariable analysis for stages 1 and 3 remained
independent predictors of all-cause mortality. None of the predictors from the stage 2
multivariable analysis were predictive after adjusting for variables from stage 1 and 3. The
independent predictors of all-cause mortality were lower BMI, NYHA class III or IV,
previous myocardial infarction, elevated log (BNP) concentration and raised troponin I.
Table 8-15: Multivariable analysis for variables from stages 1, 2 and 3
Multivariable 1 Multivariable 2 Variable
HR* 95% CI p value HR* 95% CI p value
Stage 1
BMI (kg/m2) 0.96 0.93 - 0.99 0.0073 0.96 0.93 - 0.99 0.01
NYHA
(III/IV v I/II)
1.71 1.19 - 2.45 0.0038 1.72 1.2 - 2.47 0.0032
Previous MI 1.68 1.18 - 2.4 0.004 1.68 1.18 - 2.4 0.0039
Stage 2
eGFR
(ml/min/1.73m2 )
0.99 0.98 - 1.0 0.15 - - -
Log (Bilirubin) 1.36 0.97 - 1.89 0.074 - - -
Haemoglobin (g/dl) 0.94 0.85 - 1.03 0.15 - - -
Stage 3
Log (BNP) 1.26 1.03 - 1.54 0.026 1.36 1.12 - 1.65 0.0019
Troponin I (≥ 0.04 µg/l) 1.49 0.99 - 2.26 0.058 1.57 1.04 - 2.37 0.033
1 = Multivariable analysis with significant (p < 0.05) variables from stages 1-3
2 = Multivariable analysis after removing non significant (p ≥ 0.05) variables
* Hazard ratio is per unit increase for continuous variables (BMI, eGFR, log [bilirubin],
haemoglobin, log [BNP])
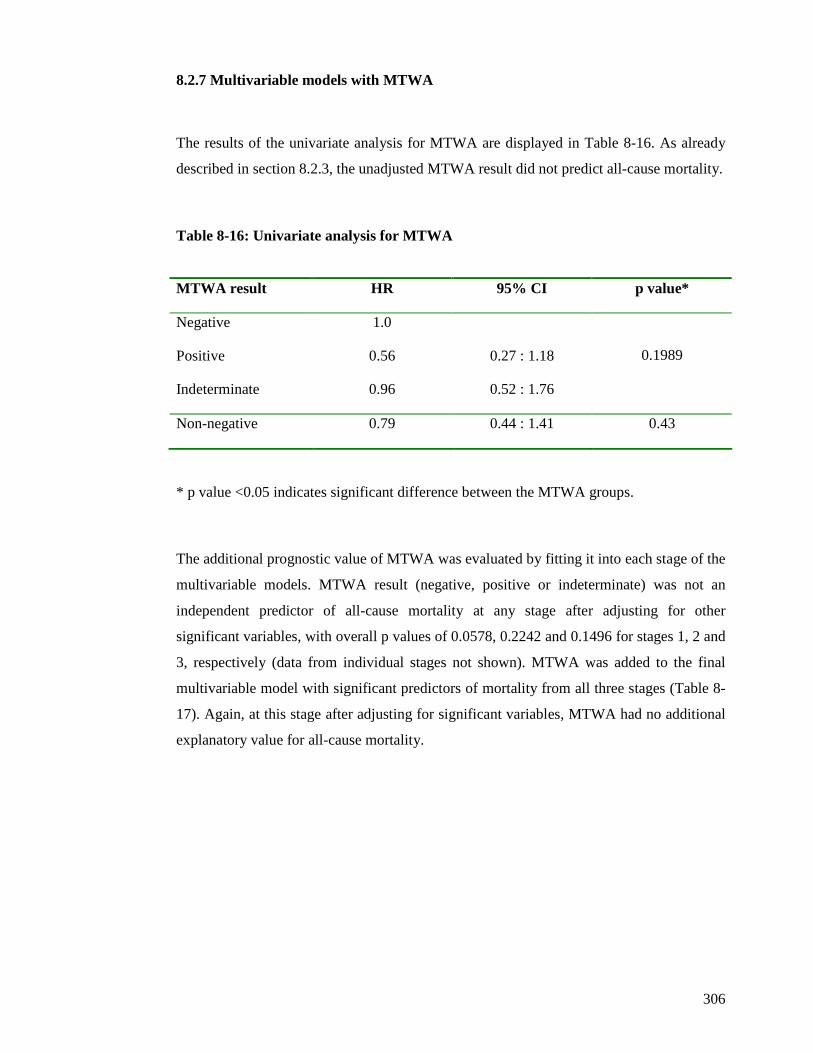
306
8.2.7 Multivariable models with MTWA
The results of the univariate analysis for MTWA are displayed in Table 8-16. As already
described in section 8.2.3, the unadjusted MTWA result did not predict all-cause mortality.
Table 8-16: Univariate analysis for MTWA
MTWA result HR 95% CI p value*
Negative 1.0
Positive 0.56 0.27 : 1.18
Indeterminate 0.96 0.52 : 1.76
0.1989
Non-negative 0.79 0.44 : 1.41 0.43
* p value <0.05 indicates significant difference between the MTWA groups.
The additional prognostic value of MTWA was evaluated by fitting it into each stage of the
multivariable models. MTWA result (negative, positive or indeterminate) was not an
independent predictor of all-cause mortality at any stage after adjusting for other
significant variables, with overall p values of 0.0578, 0.2242 and 0.1496 for stages 1, 2 and
3, respectively (data from individual stages not shown). MTWA was added to the final
multivariable model with significant predictors of mortality from all three stages (Table 8-
17). Again, at this stage after adjusting for significant variables, MTWA had no additional
explanatory value for all-cause mortality.
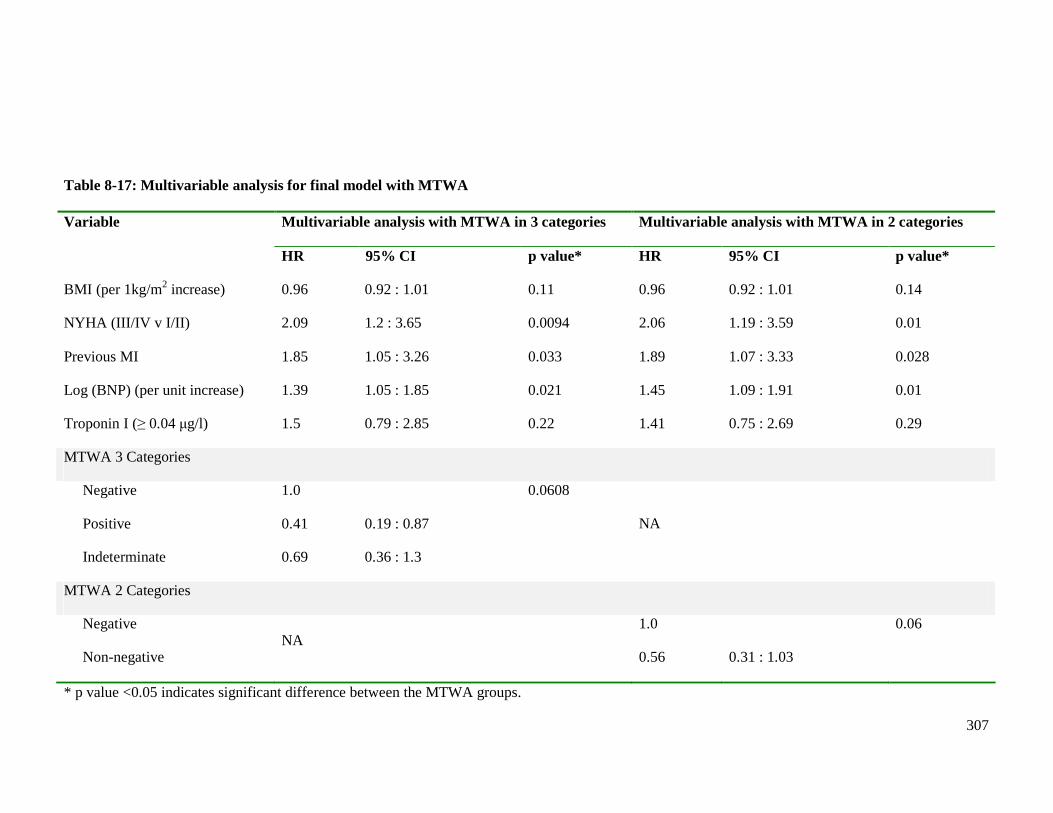
307
Table 8-17: Multivariable analysis for final model with MTWA
Multivariable analysis with MTWA in 3 categories Multivariable analysis with MTWA in 2 categories Variable
HR 95% CI p value* HR 95% CI p value*
BMI (per 1kg/m2 increase) 0.96 0.92 : 1.01 0.11 0.96 0.92 : 1.01 0.14
NYHA (III/IV v I/II) 2.09 1.2 : 3.65 0.0094 2.06 1.19 : 3.59 0.01
Previous MI 1.85 1.05 : 3.26 0.033 1.89 1.07 : 3.33 0.028
Log (BNP) (per unit increase) 1.39 1.05 : 1.85 0.021 1.45 1.09 : 1.91 0.01
Troponin I (≥ 0.04 µg/l) 1.5 0.79 : 2.85 0.22 1.41 0.75 : 2.69 0.29
MTWA 3 Categories
Negative
Positive
Indeterminate
1.0
0.41
0.69
0.19 : 0.87
0.36 : 1.3
0.0608
NA
MTWA 2 Categories
Negative
Non-negative NA
1.0
0.56
0.31 : 1.03
0.06
* p value <0.05 indicates significant difference between the MTWA groups.
308
8.3 Discussion
This chapter has described the outcomes for the 648 patients in the post-discharge cohort.
Mortality rates were high, almost one quarter of all patients were deceased by two years
follow-up. This is an expected finding given all patients had recently been hospitalised with
decompensated HF. The overall mortality for the 1003 enrolled patients was 33%, comparable
with recently published mortality rates for Scottish patients hospitalised for HF (147).
There were proportionately more deaths amongst the patients ineligible for MTWA testing
than those eligible. Many of the reasons for being ineligible for MTWA testing (AF,
pacemakers and medical comorbidities preventing exercise) are also risk factors for adverse
outcomes in HF. This is the first study to describe outcomes in patients ineligible for MTWA
testing and highlights the adverse mortality rates of these patients.
There was no significant difference in mortality rates between patients with HF-REF and HF-
PEF in this study. This finding is consistent with recent studies reporting no significant
difference in survival between the two groups of patients (19;23). However the number of
patients in this study is relatively small, with even fewer deaths and the Kaplan-Meier curves
and two year unadjusted survival figures suggest that differences in survival between those
with HF-REF and HF-PEF may emerge with longer term follow-up.
MTWA did not predict any of the study’s prespecified outcomes. The failure to predict SCD
can be partly explained by the small numbers of patients with this outcome. However, it was
expected that an abnormal MTWA result (positive or indeterminate) may predict all-cause
mortality (99;100;102;104;105;111). In fact patients with a positive result had proportionately
fewest events overall with patients with indeterminate and negative results having
proportionately similar mortality rates, although there was no significant difference in
mortality rates between the three groups. This result was surprising. Indeed, the results from
Chapter 7 had demonstrated that patients with positive and negative results were more similar,
in terms of clinical characteristics, than those with indeterminate results. However, this did not
309
translate prognostically. Also patients with indeterminate results because physical limitations
prevented elevation of their heart rate had proportionately more events than patients with other
indeterminate results, although these differences were not statistically significant. MTWA was
also analysed in the accepted way of non-negative (positive and indeterminate) and negative
(85), but this did not alter the results. Moreover the very different mortality rates for those
patients with positive and indeterminate results challenges the use of this ‘non-negative’
classification. In the original study that classified patients with positive and indeterminate as
‘non-negative’, patients with positive and indeterminate MTWA results had two year actuarial
mortality rates of 14.5% and 20.1%, respectively. The authors of this small (n=177) study of
patients with ischaemic LVSD concluded that these were similar mortality rates and positive
and indeterminate tests should be classified as ‘non-negative’. Many studies since have only
reported ‘non-negative’ mortality rates, preventing an understanding of the exact risk
conferred by a positive or indeterminate test. The findings of my study strongly suggest this
approach is incorrect.
The mortality rate (expressed as an approximate event rate per 100 patient-years of follow-up)
was higher in my study than in prior LVSD and HF MTWA studies (Table 8-11, page 298).
This likely reflects the unselected nature of my cohort, including more elderly patients with
comorbidity. One noticeable difference between my study and the other studies presented in
Table 8-10 (page 297) is the mortality rates for the patients with negative MTWA results. Of
the studies that presented mortality rates according to the MTWA result, all had a lower
mortality rate for patients with a negative MTWA result compared with the overall mortality
rate for each study. By contrast, my study demonstrated the exact opposite; the mortality rate
was 21% for patients with negative MTWA results compared to an overall mortality rate of
17% for all patients undergoing MTWA testing. The exact reason for this unexpected finding
is unclear. This may reflect the different population enrolled, compared with previous studies.
Perhaps the MTWA test does not identify those at greatest risk when used in unselected
cohorts with more elderly patients and patients with more comorbidity. The lower rate of beta-
blocker prescribing amongst patients with negative MTWA results, compared to patients with
indeterminate results, may be a contributory factor to the unexpected higher mortality amongst
patients with negative results. Patients with indeterminate MTWA results were more than
three times more likely to be prescribed a beta-blocker than those with negative results
(OR 3.47, p<0.0001).
310
However this does not explain the higher mortality of patients with negative MTWA results
compared to those with positive results. Although beta-blocker prescribing was less common
amongst those with a negative MTWA result, compared to those with a positive result, this
difference was not significant (OR 0.79, p 0.43). Higher beta-blocker prescribing amongst
patients with an indeterminate result may have been expected to confer a prognostic advantage.
The high mortality of the patients with indeterminate results is likely multifactorial and
explained by the multiple risk factors for poor prognosis present in this group, including
advancing age, diabetes, anaemia and renal dysfunction.
The proportion of all deaths that were SCD was reported by most LVSD and HF MTWA
studies and varied from 17-58%. The limitations in the definition of SCD used in my study
(section 2.6.3, page 89) likely account for the low proportion of all deaths that were sudden in
my study and thus further comparisons to the other studies were not made. The MASTER
study (104) had a noticeably lower proportion of SCD compared to the other studies in Table
8-10. All patients in this study fulfilled MADIT-II criteria and underwent ICD implantation
following MTWA testing. During the follow-up period 9% of negative patients and 12% of
non-negative patients received appropriate ICD therapy, many of which may have resulted in
SCD if an ICD had not been implanted. Furthermore, although the proportions of events for
positive and indeterminate patients are not reported separately in this study, the proportion of
indeterminate results is low in this study (12%). One reason for this may be the use of
pharmacological means of stress or pacing for patients who were unable to exercise. The low
rate of indeterminate results together with a low proportion of SCD highlights a possible
relationship between an indeterminate result and risk of sudden cardiac death. Few studies
have reported the numbers of SCD, thus it is difficult to extrapolate a potential link between
indeterminate results and SCD. I could not explore a potential relationship between
indeterminate results and SCD in my study due to the limitations acknowledged above.
However, in the largest study to date of MTWA in patients with LVSD, patients with an
indeterminate result had the highest proportion of SCD and SCD accounted for 42% of all-
cause mortality in this study (107). Another possible explanation for the MASTER study (104)
having a lower proportion of SCD may be the high rate of beta-blocker prescribing (87%).
Excluding the MASTER study, there is still a wide range in the proportion of all deaths that
were sudden in the other studies presented in Table 8-10 (21-58%), likely reflective of the
inherent difficulties in determining SCD.
311
MTWA had no incremental prognostic value in my study when added to a multivariable
model containing the strongest predictors of mortality in this study. The independent
predictors of all-cause mortality following stepwise multivariable modelling were; lower BMI,
NYHA III/IV, previous MI, elevated log (BNP) concentration and raised troponin (defined as
≥ 0.04 µg/l). The small number of independent predictors may be explained by the relatively
small number of events that occurred during the follow-up period for those who underwent
MTWA testing.
In summary, MTWA had no prognostic value in my cohort of unselected patients with HF.
There was no evidence to suggest that this test is of benefit in the risk stratification of ‘real-
life’ patients with HF. The independent predictors of mortality in this study included BNP and
cardiac troponin, a novel biomarker in HF. Both are simple, cheap biochemical tests to
perform. The other three independent predictors of mortality were clinical variables that are
readily available. This straightforward model containing only five simple variables identified
the patients at most risk in my study.

312
CHAPTER NINE
DISCUSSION
313
9.1 Major findings of the study
HF is a major health concern internationally and associated with considerable morbidity and
mortality. Despite advances in the management of HF in recent decades, the prognosis
remains poor for many patients (147). This emphasises the importance of prognostication in
HF, particularly when several therapies available for the management of this condition are
expensive and require accurate targeting to optimise their use. However the solution to risk
stratification in HF remains elusive. There are many established predictors of mortality in HF,
as outlined in Chapter 1, but few have been shown to predict cause-specific death. This is
particularly important in HF where many deaths may be attributed to SCD caused by VTE,
which may be prevented by appropriate selection of patients for primary prevention ICDs.
MTWA has recently been proposed as a potential tool for assisting in the selection of patients
for primary prevention ICD therapy by identifying those at risk of SCD. As outlined in
Chapter 1, there are many unresolved issues regarding the clinical utility of MTWA testing in
HF.
This study has provided a comprehensive evaluation of the use of MTWA in a real-life, near-
consecutive and well-defined population of patients with HF, accounting for aetiology and
LVEF. The proportion of patients eligible for MTWA testing has been demonstrated. The
prevalence of positive, negative and indeterminate results and the tolerability of the exercise
protocol have been assessed. The clinical characteristics associated with each MTWA result
have been determined. The predictive value of MTWA testing for all-cause mortality has been
evaluated alongside established predictors of outcome, including BNP, and more novel
biomarkers, such as cardiac troponin. This study has achieved its main aim of determining if
MTWA testing has a role in the risk stratification of patients with HF.
Of 2361 patients with suspected decompensated HF screened for inclusion in the study, 1003
were recruited. The majority of the cohort was elderly with multiple medical co-morbidities
and LVSD. Of those recruited, 648 patients (65%) attended the study visit approximately 4
weeks after discharge from hospital. The most common reason for failing to attend the study
visit was refusal to participate (n=167, 17%). A significant proportion of patients died prior to
314
the study visit appointment (n=115, 11%) and many patients were unable to attend because of
deterioration in their health (n=73, 7%). The patient’s clinical characteristics recorded during
hospitalisation were analysed according to whether or not they subsequently completed the
study visit. Patients attending the study visit were similar, in terms of clinical characteristics,
to the group of patients who withdrew from participating in the study visit. The groups who
failed to complete the study visit due to deteriorating health or death had proportionately more
patients with markers of adverse prognosis in HF. The clinical characteristics recorded during
hospitalisation were updated at the study visit. Many of the symptoms, signs and laboratory
values showed an improvement, as expected, compared with the findings recorded during
hospitalisation.
In patients evaluated after discharge, the clinical characteristics of those with HF-REF and
HF-PEF were compared. The majority of these characteristics were similar between the two
groups, consistent with previous reports that patients with HF-PEF cannot readily be
distinguished from those with HF-REF on the basis of symptoms and signs, CXR or ECG
findings (19). However, there were some notable differences between the two groups. Patients
with HF-PEF were older, more likely to be female, more likely to have hypertension and less
likely to have had a MI, in comparison to those with HF-REF. These findings are consistent
with previous studies of HF-PEF (22;24;155). Prescribing of recommended pharmacological
treatments for HF was greater amongst patients with HF-REF, an unsurprising result given the
evidence-base for the use of these medications exists only for patients with HF-REF and no
treatment is of proven benefit in HF-PEF. Prescribing of calcium channel blockers was more
common amongst those with HF-PEF, perhaps reflecting the use of these agents as
antihypertensive treatment. Apart from SBP and pulse pressure, there were no differences in
clinical examination findings between the two groups. There were also no differences in the
proportions in sinus rhythm or AF between the two groups. QRS duration and QTc interval
were longer amongst patients with HF-REF. The majority of biochemical and haematological
test findings were similar in the two LVEF groups. The major exception was BNP and here
the differences in average concentrations between the two groups were striking, both on
admission to hospital and at the post-discharge study visit. Median BNP concentrations in
patients with HF-REF were almost twice those of patients with HF-PEF at both time points.
Previous studies in patients with decompensated HF have demonstrated similar findings (156).
315
Anaemia was more common amongst patients with HF-PEF, consistent with previous reports
(23).
Of 648 patients who completed the study visit, 330 (51%) were eligible for MTWA testing.
Thus, almost half were ineligible for MTWA testing. The clinical value of any test is limited if
nearly half of the patients are ineligible for the test. This is the first prospective observational
study to describe the reasons for ineligibility in a ‘real-life’ HF population. Patients were
ineligible because of conditions commonly associated with HF, such as AF, ventricular pacing
and an inability to exercise. AF accounted for three-quarters of those who were ineligible in
my study i.e. 38% of all patients. This is higher than the ~23% reported in two earlier studies,
although those studies enrolled only patients with HF of non-ischaemic aetiology (113;118).
Although only a small proportion of patients (7% overall) were ineligible because of physical
inability to attempt the sub-maximal treadmill test, this is an underestimate of this problem as
many patients simply did not attend for the test because of poor health. Furthermore, as
discussed later, many of those who did attempt the test could not perform satisfactorily.
Many of the characteristics of the ineligible patients in my study suggested they had a poor
prognosis, including the highest log (BNP) concentration. BNP is also an independent
predictor of sudden cardiac death (53), suggesting that the patients at the highest arrhythmic
risk may in fact not be eligible for MTWA testing. These findings suggest the utility of the
MTWA test as a means of detecting those at highest risk of sudden death is likely to be limited
as many such patients are ineligible for the test. Patients ineligible for MTWA testing were
older than patients eligible for testing and a higher proportion had a history of pre-admission
heart failure. Ineligible patients also had more evidence of persisting or advanced heart failure,
with a higher proportion having NYHA functional class III or IV symptoms and a greater
frequency of peripheral oedema. Those ineligible for MTWA testing also had a greater
prevalence of renal dysfunction, liver enzyme abnormalities, hyperuricaemia and lymphopenia.
There was, however, no difference in LVEF according to MTWA eligibility and the use of HF
medication was similar between the groups.
316
An indeterminate MTWA test was the most common result in this study (46%), with a positive
MTWA test found in only 30% and a negative test in 24%. This is the first prospective study
to demonstrate how common an indeterminate result is in an unselected HF population – the
majority of which were on optimal medical therapy. This is also the first study to characterise
the causes of indeterminate results in detail. The majority of indeterminate test results were
due to failure to elevate the heart rate to 110bpm. This was due to chronotropic incompetence
or physical limitations, with similar proportions of each. Other reasons for an indeterminate
MTWA test included ectopy, noise, nonsustained alternans and a rapid rise in heart rate. Most
cases of chronotropic incompetence were due to beta-blocker therapy. Importantly, this is the
first study to identify two types of insufficient heart rate response. As discussed in Chapter 1,
beta-blocker treatment was discontinued prior to MTWA testing in many previous studies in
order to avoid indeterminate tests occurring due to heart rate limitation
(98;106;107;113;114;119). There is evidence that acute beta-blockade can reduce the
magnitude of MTWA, potentially converting a positive to a negative test (122). Omission of
beta-blockers may increase the number of positive tests as well as reducing the number of
indeterminate tests. However a primary aim of this study was to evaluate the use of MTWA as
a predictor of the residual risk of SCD in patients on optimal therapy, including a beta-blocker
(as beta-blockers reduce the risk of SCD). ICDs are only indicated in patients remaining at
substantial risk of SCD, despite optimal medical therapy. It is hard to see the value of a test
that predicted SCD in patients not optimally treated. Thus the high proportion of indeterminate
results in my study, compared with most prior studies (Figure 6.13, page 239), may, in part,
reflect the high rate of use of beta-blockers in our patients. This further highlights the
potentially limited value of MTWA testing as a generally applicable tool for risk-stratification
in HF.
Beta-blocker use may not be the whole explanation for the high proportion of indeterminate
results in our study. In one other large study in which patients with ischaemic and non-
ischaemic HF were tested off beta-blockers, the prevalence of a positive, negative and
indeterminate result was 37%, 22% and 41% (119), respectively, very similar to the
distribution observed in my study. This suggests that cessation of beta-blockers may not be an
effective means of limiting the number of indeterminate tests in HF patients. This is especially
pertinent given that there is also a potential risk to HF patients in the withdrawal of beta-
blockers. In addition, the value of a test that is positive off-treatment, but negative or
317
indeterminate on-treatment, in targeting ICD therapy is unclear; a test that remains positive on
optimal therapy should be more useful in clinical decision-making.
The high proportion of indeterminate tests in our study may also reflect the patient population
studied and not just discontinuation of beta-blocker therapy, as already discussed. My study
was carried out in an unselected cohort of patients who had recently been hospitalised with
decompensated HF. Many of these patients were elderly with extensive medical comorbidities
and physical frailty. The majority of other MTWA studies have been cohorts of younger
patients with less comorbidity (Table 1-4, page 54).
The functional capacity of the cohort was poor. There was no significant difference in the
duration of exercise or energy expended during exercise (measured in METS) according to
MTWA result. The majority of patients discontinued the MTWA test because of physical
limitations, with only 42% achieving the target heart rate of 110bpm required for completion
of the MTWA test. This is perhaps unsurprising as many of the patients were elderly with
multiple comorbidities. However, this does question the general usefulness of this test in ‘real-
life’ HF patients.
When the patients were analysed according to their MTWA result (positive, negative or
indeterminate), there were 27 clinical characteristics that differed (p<0.05) between the groups
of patients. A large amount of clinical data was included in these analyses and the limitations
of multiple testing are recognised. However, 12 of the 27 characteristics that differed between
the three groups had p values <0.01. Yet when analysis was performed according to the
contemporarily accepted classification of non-negative and negative (85), only 12 clinical
characteristics differed significantly between the two groups (p<0.05), with 8 having p values
<0.01. These results demonstrate that patients with an indeterminate test result are different to
those with a positive test. Patients with an indeterminate result were older and more likely to
have a history of HF, diabetes, AF, anaemia and renal dysfunction (as well as a higher BNP);
characteristics known to be predictive of poor outcome. These findings may explain the
observation in other studies that patients with an indeterminate test result had a higher all-
cause mortality rate than those with a positive result (85;101;107;109;123). My novel findings
318
about patients with non-negative MTWA results highlight how heterogeneous this group is, in
terms of clinical characteristics, and argues against this binary classification of MTWA test
results. Moreover, pair-wise analysis of MTWA results (negative versus positive;
indeterminate versus positive; indeterminate versus negative) revealed notable differences in
clinical characteristics. In particular, this analysis exposed major difference between the
indeterminate group and the other two groups of patients (and, remarkably, fewer differences
between those with positive and negative tests). There were 22 clinical characteristics that
differed (p<0.05) between the indeterminate and positive groups, 14 with p values <0.01.
There were almost as many differences between the indeterminate and negative groups, with
11 differences having a p value <0.01. Interestingly, there were only 3 clinical characteristics
that differed significantly between the negative and positive groups and none of these had a p
value <0.01. Patients with indeterminate MTWA results are a distinct group of patients with
more abnormal clinical characteristics than those with positive or negative results. This novel
finding suggests that patients should not be classified as non-negative and negative. I propose
that MTWA results should only be considered as three separate groups: positive, negative and
indeterminate.
The overall mortality rate by two years of follow-up for the 1003 enrolled patients was 33%,
comparable with recently published mortality rates for Scottish patients hospitalised for HF
(147). The overall mortality for the 648 patients in the post-discharge cohort was also high
with almost one-quarter of patients deceased by two years follow-up.
There were proportionately more deaths amongst the patients ineligible for MTWA testing
than those eligible. Thus, being ineligible for MTWA testing was a better predictor of an
adverse prognosis than the MTWA result itself. Many of the reasons for being ineligible for
MTWA testing (AF, pacemakers and medical comorbidities preventing exercise) are also risk
factors for adverse outcomes in HF. This is the first study to describe outcomes in patients
ineligible for MTWA testing and highlights the adverse mortality rates of these patients.
There was no significant difference in mortality rates between patients with HF-REF and HF-
PEF in this study. This finding is consistent with some recent studies reporting no significant
319
difference in survival between the two groups of patients (19;23). However the number of
patients in this study is relatively small, with even fewer deaths and both the Kaplan-Meier
curves and two year unadjusted survival figures suggest that differences in survival between
those with HF-REF and HF-PEF may emerge with longer term follow-up.
MTWA did not predict any of the study’s prespecified outcomes. The failure to predict SCD
in this study can be partly explained by the small numbers of patients with this outcome.
However, it was expected that an abnormal MTWA result may predict all-cause mortality
(106;107;109;111;111;112;118). Patients with a positive result had proportionately fewest
events overall with patients with indeterminate and negative results having proportionately
similar mortality rates, although there was no statistically significant difference between the
three groups. This result was surprising. Indeed, the results from Chapter 7 had demonstrated
that patients with positive and negative results were more similar, in terms of clinical
characteristics, than those with indeterminate results. However, this did not translate
prognostically. Also patients with indeterminate results because physical limitations prevented
elevation of their heart rate had proportionately more events than patients with other MTWA
results, although this difference was not statistically significant. MTWA was also analysed in
the contemporary way of non-negative (positive and indeterminate) and negative, but this did
not alter the conclusions. Moreover, the very different mortality for those patients with
positive and indeterminate results challenges the use of this ‘non-negative’ classification.
Indeed it is interesting to review the original study that combined positive and indeterminate
results into a single ‘non-negative’ category. Although the authors of that small study (n=177)
of patients with ischaemic LVSD concluded that the mortality rates for patients with positive
and indeterminate tests were similar, the two year actuarial mortality rates were 14.5% and
20.1%, respectively, a trend similar to that apparent in my study. Many studies have since only
reported ‘non-negative’ mortality rates, preventing, I suggest, a proper understanding of the
different risks conferred by positive and indeterminate tests. My findings strongly suggest this
approach is incorrect.
The mortality rate (expressed as an approximate event rate per 100 patient-years of follow-up)
was higher in my study than in prior LVSD and HF MTWA studies (Table 8-11, page 309).
This finding was expected and likely reflects the nature of my patient cohort, consisting of
320
unselected and recently discharged subjects, including more elderly individuals and patients
with comorbidity, compared with prior studies. Unexpectedly, however, I found a higher
mortality rate among patients with a negative MTWA result, compared with the mortality rate
in the overall cohort. Of the studies that reported mortality rates according to the MTWA
result, all described a lower mortality rate in patients with a negative MTWA result, compared
with the rate in the overall cohort or in patients with a ‘non-negative’ MTWA result. By
contrast, I found the exact opposite; the mortality rate was 21% for patients with a negative
MTWA result compared with the overall rate of 17% in all patients undergoing MTWA
testing, although the differences between the groups were not statistically significant. The
exact reason for this unexpected finding is unclear. It may reflect the different population
enrolled, compared with previous studies. Perhaps the MTWA test does not identify those at
greatest risk when used in unselected cohorts with more elderly patients and patients with
more comorbidity. The lower rate of beta-blocker prescribing amongst patients with negative
MTWA results, compared to patients with indeterminate results, may be a contributory factor
to the unexpected higher mortality amongst patients with negative results. Patients with
indeterminate MTWA results were more than three times more likely to be prescribed a beta-
blocker than those with negative results (OR 3.5, p<0.0001). However this does not explain
the higher mortality of patients with negative MTWA results compared to those with positive
results. Although beta-blocker prescribing was less common amongst those with a negative
MTWA result, compared to those with a positive result, this difference was not significant
(OR 0.79, p=0.43). Higher beta-blocker prescribing amongst patients with an indeterminate
result may have been expected to confer a prognostic advantage. The high mortality of the
patients with indeterminate results is likely multifactorial and explained by the multiple risk
factors for poor prognosis present in this group, including advancing age, diabetes, anaemia
and renal dysfunction.
There is wide variation in the proportion of all deaths considered sudden in the LVSD and HF
MTWA studies, although only one prior study reported a proportion as low as in my study (I
discuss this exception, the MASTER study (104), in more detail below). The low proportion
of SCD in my study is likely accounted for by the limitations in the definition I had to use due
to the nature of my dataset (section 2.6.3, page 91) and this really precludes further
comparison with other studies. However, as noted above, among the other studies, the
MASTER study (104) described a notably lower proportion of SCD. All patients in the
321
MASTER study fulfilled MADIT-II criteria and underwent ICD implantation following
MTWA testing. During the follow-up period 9% of negative patients and 12% of non-negative
patients received appropriate ICD therapy, some of which may have resulted in SCD if an ICD
had not been implanted. Furthermore, although the proportions of events for positive and
indeterminate patients are not reported separately in this study, the proportion of indeterminate
results is low in this study (12%). One reason for this may be the use of pharmacological
means of stress or pacing for patients who were unable to exercise. The low rate of
indeterminate results together with a low proportion of SCD highlights a possible relationship
between an indeterminate result and risk of SCD. Few studies have reported the numbers of
SCD, thus it is difficult to extrapolate a potential link between indeterminate results and SCD.
I could not explore a potential relationship between indeterminate results and SCD due to the
limitations acknowledged above. However, in the largest study to date in patients with LVSD,
patients with an indeterminate result had the highest proportion of SCD and SCD accounted
for 42% of all-cause mortality in that study (107). Another possible explanation for the
MASTER study (104) having a lower proportion of SCD may be the high rate of beta-blocker
prescribing (87%). After excluding the MASTER study and my study, there was still a wide
range in the proportion of all deaths that were sudden in the other LVSD and HF studies (21-
58%), likely reflective of the inherent difficulties in determining SCD.
MTWA had no incremental prognostic value when added to a multivariable model containing
the strongest predictors of mortality in my study. The independent predictors of all-cause
mortality following stepwise multivariable modelling were; lower BMI, NYHA III/IV,
previous MI, BNP and troponin. The small number of independent predictors may be
explained by the relatively small number of events that occurred during the follow-up period
for those who underwent MTWA testing.
9.2 Strengths
The major strength of this study is the unselected nature of the patients studied and the
consequent high mortality rate compared with other studies (Table 8-11, page 298). This study
represented a ‘real-life’ cohort of patients, prospectively studied following hospitalisation with
322
decompensated HF. The unselected approach to enrolment meant that patients were recruited
irrespective of age, gender, LV dysfunction and comorbidities. All patients had a validated
diagnosis of HF and all fulfilled ESC criteria for HF. The nature of this cohort allows
extrapolation of these results to ‘real-life’ HF patients and not the minority who may fulfil
clinical trial inclusion criteria. Previous MTWA clinical studies have enrolled highly selective
cohorts.
The second major strength is the extensive phenotyping of all enrolled patients. The patients
enrolled in this cohort are similar in many ways to those included in large epidemiological
studies of HF. Moreover, this extensive phenotyping has allowed multiple detailed
comparisons of the clinical characteristics of the patients. Firstly, those completing the study
visit were compared to those who failed to attend due to death, deteriorating health or
withdrawal from the study. The patients attending the study visit were then stratified according
to eligibility for MTWA testing and the clinical characteristics of the two groups compared.
Finally the characteristics were compared according to MTWA result, identifying the distinct
clinical characteristics relating to positive, negative and indeterminate MTWA results.
All enrolled patients consented to be “flagged” with the Information Services Division of the
Scottish Health Service. This allowed accurate mortality follow-up data to be obtained by
linking the study database to information on deaths, held by the General Register’s Office for
Scotland. Another strength of this study was the creation of an electronic database, held in the
Robertson Centre for Biostatistics at the University of Glasgow. Data were manually entered
into the electronic database and verified by two independent database managers. All data were
subject to manual and prespecified electronic data validation checks. This robust system
ensured quality control of the data processed.
9.3 Limitations
Recruitment at the Royal and Western Infirmaries was not completely consecutive because of
staff holidays. Clinical research nurses recruited patients from the Royal Alexandra Hospital
but staff shortages prevented daily recruitment from this site.
323
Many enrolled patients were unable to return for MTWA testing one month after discharge
from hospital. This, however, is an inevitable consequence of both the effects of HF and
participation in a clinical study. Indeed the rate of follow-up was probably greater than in
‘real-life’ due to the encouragement I gave patients to attend and the fact that transport was
provided for them. MTWA testing during hospitalisation for decompensated HF would have
been impractical and possibly dangerous.
The large number of inter-group tests for differences in the clinical characteristics of the
various groups may have led to chance findings where the p value is not <0.01.
There were limitations in defining events and outcomes. The mortality data provided by ISD
are restricted to information documented on the death certificates. Deaths were not adjudicated
and medical records and information from next of kin were not available to improve the
accuracy of the attributed cause of death. The definition of SCD used in this study may have
been pragmatic but is suboptimal nonetheless. Deaths occurring outside hospital and certified
as due to acute MI were included as SCD but may have been deaths due to MI. This approach
was taken because the majority of SCD occurs outside hospital and is commonly certified as
acute MI and verified acute MI is a relatively uncommon event in patients with HF
(121;157;158). Unfortunately there was no way of distinguishing between the two causes with
the information available. Classifying SCD using only death certificate information is
extremely limited and, one could argue, futile. This secondary analysis was included because
the biomarker of interest was MTWA.
Information regarding appropriate ICD discharges for ventricular tachyarrhythmias was not
available but probably would not have altered the results given the low rate of implantation of
these devices in the cohort I recruited.
324
9.4 Future research analyses
All of the outcome analyses will be repeated with a minimum follow-up of 1 year for every
patient. Extending follow-up will help me determine whether my conclusions about the
usefulness of MTWA testing will alter upon reanalysis using a larger number of deaths. I think
this is unlikely. Instead, I think alternative and more effective investigations are warranted to
identify patients with HF at risk of potentially lethal ventricular arrhythmias.
The multivariable models described in chapter 8 were only created in the 330 patients who
underwent MTWA testing, as the prognostic value of MTWA was the focus of this study. My
next analysis will be to evaluate these models in all 648 patients in the post-discharge cohort
to determine whether or not the same variables are independent predictors of mortality,
regardless of eligibility for MTWA testing. Identification of the independent predictors of
mortality in the entire post-discharge cohort may help create a simple way of risk stratifying
patients recently hospitalised with decompensated HF. Ideally I would then externally validate
this model in an independent cohort of patients recently hospitalised with decompensated HF.
My future research plans also include using the data from the 1003 patients enrolled in this
study to create a simple, prognostic model to help risk stratify in-patients hospitalised with
decompensated HF. Clearly, the use of individual risk markers in isolation has limited
prognostic utility, as the absence or presence of a single risk marker does not necessarily
convey good or bad prognosis. Multiple individual risk markers may be present in any given
patient and combining these to form an accurate, individualised prognosis is the current
challenge. Established prognostic models exist and are used in clinical practice for acute
coronary syndromes, such as the Global Registry of Acute Coronary Events (GRACE) (159)
and the Thrombolysis In Myocardial infarction (TIMI) risk scoring systems (160). These are
practical, simple to use in the clinical setting and have also been validated to prospectively
demonstrate that they accurately predict mortality and the risk of recurrent ischaemic events.
An equivalent risk stratification tool is not currently used in HF clinical practice. Combining
the most powerful markers of risk in the form of a prognostic model may be a strategy to
improve prognostication in HF. Prognostic models predicting mortality risk and risk of
325
rehospitalisation have been developed in patients with acute decompensated HF and chronic
HF, but these have largely remained research tools (76;126;158;161-165). These models have
some common shortfalls. Most have been derived from clinical trial populations, which are
necessarily selective and limit extrapolation to ‘real-life’ HF patients. Some have used
complex formulae to calculate an individual’s risk, reducing the likelihood of use in clinical
practice. Only two models have included patients with HF-PEF (76;126); one was derived
from a clinical trial population (126), whilst the other has not yet been externally validated
(76). Only two models have incorporated BNP into the risk score (76;158). Only one has
included cardiac troponin and this model, derived from patients with chronic HF, has not been
externally validated (76). The Heart Failure Survival Score (HFSS) has been used in the
management of advanced heart failure, particularly for assisting in the selection of appropriate
candidates for cardiac transplantation (166). The shortcomings of the HFSS are, however,
increasingly recognised (167). Furthermore NT-pro-BNP alone has been shown to be a
stronger predictor of death than the HFSS (168).
The ideal prognostic model for assessing prognosis in HF would comprise simple, readily
available variables and involve straightforward calculations. I plan to build a simple
prognostic risk scoring tool using the independent predictors identified in this study. This
model will be validated internally in the original 1003 enrolled patients. If this is a powerful
tool for identifying those at highest risk in my cohort the next step would be to externally
validate the model in an independent cohort of patients with decompensated HF.
9.5 Conclusion
Of the 1003 patients enrolled into this study during hospitalisation with decompensated HF,
648 completed the study visit approximately 4-6 weeks following discharge. Only 330 patients
were eligible for MTWA testing and almost half of all MTWA tests were indeterminate. Many
patients were unable to complete the test due to chronotropic incompetence, secondary to beta-
blocker therapy or physical limitations. These results show that MTWA treadmill testing is not
widely applicable to an unselected real-life HF population.
326
MTWA had no prognostic value in our cohort of unselected patients with HF. There was no
evidence to suggest that this test is of benefit in the risk stratification of ‘real-life’ patients
with HF. The independent predictors of mortality in this study included BNP and cardiac
troponin, a novel biomarker in HF. Both are simple, cheap biochemical tests to perform. The
other three independent predictors of mortality were clinical variables that are readily
available (lower BMI, NYHA class III/IV and previous myocardial infarction). This
straightforward model containing only five simple variables identified the patients at most risk
in our study. At present MTWA cannot be endorsed as a tool for risk stratification for patients
with HF.
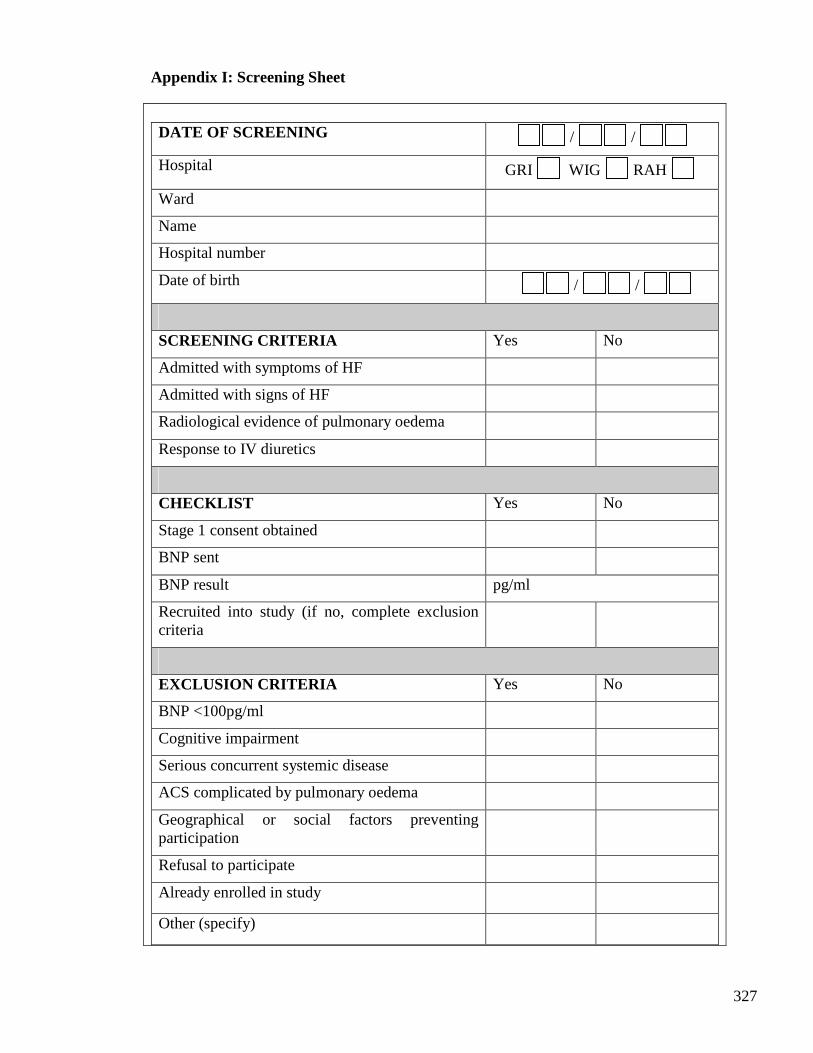
327
Appendix I: Screening Sheet
DATE OF SCREENING / /
Hospital GRI WIG RAH
Ward
Name
Hospital number
Date of birth / /
SCREENING CRITERIA Yes No
Admitted with symptoms of HF
Admitted with signs of HF
Radiological evidence of pulmonary oedema
Response to IV diuretics
CHECKLIST Yes No
Stage 1 consent obtained
BNP sent
BNP result pg/ml
Recruited into study (if no, complete exclusion criteria
EXCLUSION CRITERIA Yes No
BNP <100pg/ml
Cognitive impairment
Serious concurrent systemic disease
ACS complicated by pulmonary oedema
Geographical or social factors preventing participation
Refusal to participate
Already enrolled in study
Other (specify)
328
Appendix II
NHS Greater Glasgow & Clyde Health Board Glasgow Royal Infirmary and Western Infirmary Glasgow Cardiology Departments Enquiries to Dr Colette Jackson Tel: 0141 330 2064 Fax: 0141 330 6955
PATIENT INFORMATION SHEET- STAGE 1 You are being invited to take part in a research study involving a gentle walking test (known as microvolt T-wave alternans). Before you decide whether or not to take part it is important you understand why the research is being done and what it involves. Thank you for reading this. The first part of this study involves having a blood test done and agreeing to the doctors and nurses involved in the study looking at your medical notes and obtaining information about your future progress. This form explains why we want to do this and how it happens. When you read this you will be in hospital and may have been admitted with shortness of breath or swollen legs. These are symptoms which sometimes indicate a condition called heart failure. Heart failure is a condition where the heart is not pumping blood around the body as well as it should be. As a result fluid often accumulates in the lungs or the legs. Possible causes include previous heart attacks, high blood pressure or damage to the heart valves. Patients with heart failure are at risk of dying earlier than those without heart failure. This risk can be reduced in some patients by using a special pacemaker known as a cardiac defibrillator. Doctors are currently trying to work out which patients with heart failure should have these pacemakers implanted. Microvolt T-wave alternans testing is a new investigation that may help identify which patients might benefit from this pacemaker. Our study aims to provide more information about this test by studying a large group of patients, and looking at their progress over the following years. The way that we follow a patient’s progress for a study like this is by entering their details into a national database, which uses hospital notes to record when you come into hospital. This database is run by the Scottish Health Service and is confidential. Any information gathered is only available to the doctors running this study. It does not require any participation from you, and no one will contact you or your family as part of this process. If you agree to take part in the study at this stage, we will enter your details into this database. If you agree to take part, you will have a blood test for B-type natriuretic peptide (BNP), this tests how well the heart is pumping. Approximately 10 mls (two teaspoons) of blood will be taken. Having blood taken is uncomfortable and some people may feel faint. There is a small

329
risk of bleeding, bruising or infection at the puncture site following the blood test. This blood test is exactly the same as other blood tests that you will have had taken before. If the blood test is positive then either a doctor or nurse that is involved in this study will visit you before you are discharged from hospital to discuss whether or not you would like to take part in stage 2 of the research study. Thank you for taking the time to read this patient information leaflet.
330
Appendix III
NHS Greater Glasgow & Clyde Health Board Glasgow Royal Infirmary and Western Infirmary Glasgow Cardiology Departments Enquiries to Dr Colette Jackson Tel: 0141 330 2064 Fax: 0141 330 6955
PATIENT INFORMATION SHEET- STAGE 2
1. Study title
Microvolt T-Wave Alternans in Chronic Heart Failure
A study investigating a walking test in patients with chronic heart failure: Microvolt T-Wave
Alternans (MTWA) test.
2. Invitation to take part You are being invited to take part in a research study involving a gentle walking test. This is called the Microvolt T-Wave Alternans test. Before you decide whether or not to take part it is important you understand why the research is being done and what it involves. Please read the following information carefully and discuss it with others if you wish. Please ask us if anything is not clear or you would like more information. Take time to decide whether or not you wish to take part. You are not obliged to take part. If you decide to participate in the study you will be given a copy of this information sheet and a signed consent form to keep. Thank you for reading this. 3. What is the purpose of the study? Heart failure is a condition where the heart is not pumping blood around the body as well as it should be. As a result fluid often accumulates in the lungs or the legs. Possible causes include previous heart attacks, high blood pressure or damage to the heart valves. Patients with heart failure are at risk of dying earlier than those without heart failure. One of the most common causes of dying is a rapid speeding of the heart rate. These problems with heart rhythm are known as arrhythmias. These arrhythmias can be controlled in some patients by placing a special pacemaker known as a cardiac defibrillator under the skin below the
331
collarbone. Doctors are currently trying to work out which patients with heart failure should have these pacemakers implanted. Microvolt T-wave alternans testing is a new investigation that may help identify patients that are at risk of developing arrhythmias in the future. Our investigation aims to provide more information about this test by studying a large group of patients. The study will involve a total of around 600 patients and is expected to last 3 years. 4. Why have I been chosen? You are being invited to consider taking part in this study as you have been admitted to hospital with heart failure. 5. Do I have to take part? Taking part in this study is entirely voluntary and your decision. If you take part you will receive this information sheet to keep and be asked to sign a consent form. If you take part you are free to withdraw at any time and without giving a reason. A decision to withdraw at any time, or a decision not to take part, will not affect the standard of care you receive. 6. What will happen to me if I take part? When you read this you will be in hospital and may have been admitted with shortness of breath or swollen legs. You will have been asked in stage 1 of the study whether or not you would be willing to have a special blood test. If this blood test shows your heart is not pumping as well as it should be then you will be invited to attend the new British Heart Foundation Glasgow Cardiovascular Research Centre (next to Western Infirmary Glasgow) once approximately four weeks after you get out of hospital. This visit is in addition to your normal hospital and General Practitioner appointments. Your treatment will continue to be supervised by your own hospital doctors and General Practitioner. We will pay your travelling expenses for the visit. Your visit to the research centre will last approximately 90 minutes. This visit will involve :
• Medical history - speaking to a doctor about your symptoms and previous illnesses • Physical examination - you will be examined and your height and weight will be
measured.
• Echocardiogram – this is an ultrasound scan of the heart, it is sometimes just called an ‘echo’. For this test you will be asked to lie on a bed and a probe will be placed gently on to your chest to allow pictures of the heart to be taken.
• Blood test - a blood sample will be taken from a vein in your arm. This blood test is
exactly the same as other blood tests that you will have had taken before. Approximately 20 mls (4 teaspoons) of blood will be taken. Having blood taken is

332
uncomfortable and some people may feel faint. There is a small risk of bleeding, bruising or infection at the puncture site following the blood test. We are checking the blood for a substance called b-type natriuretic peptide (BNP), which tells us how well the heart is pumping. We will also use this blood sample to check your kidneys and liver and your blood cell counts.
• Electrocardiogram (ECG) – this is a recording of the electrical activity of the heart.
You will probably have had this test before. To take the recording, you will be asked to lie on a bed while stickers are placed on to their chest wall. This test does not involve discomfort.
• Microvolt T-Wave Alternans test (MTWA) – this involves walking at a slow pace
on a treadmill for up to 12 minutes while a computer monitors the heart rhythm. This test will not be carried out if you have an irregular pulse or if you already have a type of pacemaker. If you cannot walk well enough we will not ask you to perform this test.
7. What do I have to do? You will be asked to attend for one visit to the research centre as outlined above. Taking part in the study should not interfere with your normal lifestyle. You will continue to
take all your regular medications as directed by your doctors.
8. What is the investigation that is being studied/tested? The investigation being tested is called Microvolt T-wave Alternans (MTWA). This is a test that looks at changes in the heart rhythm whilst you raise your heart rate by walking on a treadmill. This test is new and not routinely used in the United Kingdom. It is currently being used in many countries including the United States of America as a test to decide whether or not patients should have special pacemakers implanted. 9. What are the alternatives for investigation? At present there is no alternative test for assessing who should and who should not have these special pacemakers put in. 10. What are the possible disadvantages and risks of taking part? Having your blood taken is occasionally uncomfortable and some people may feel faint. There is a small risk of bleeding, bruising or infection at the puncture site following the blood test. Exercise testing in general carries an extremely small risk of life-threatening complications (about 1 in 5000). The risks will be even lower for MTWA testing, since only gentle exercise is required for this test. Many patients with heart failure have had these walking tests with no serious problems. An experienced doctor and nurse will be present to ensure that any possible problem is dealt with expertly. 11. What are the possible benefits of taking part?

333
You may not benefit directly from taking part in the study; however the information we get from this study may help us to give better treatment to patients with heart failure in the future. If the research doctor discovers during the study that you have another medical condition of which you were previously unaware you will be referred to the appropriate doctor for treatment of this condition. 12. What if new information becomes available? If any new information becomes available that is relevant to your care we will inform you. 13. What happens when the research study stops? There will be no further participation required. 14. What if something goes wrong? There are no special compensation arrangements if taking part in this research project harms you. If you are harmed due to someone’s negligence, then you may have grounds for legal action but you may have to pay for it. The normal National Health Service complaints mechanisms are available if you wish to complain or have any concerns. 15. Will my taking part in this study be kept confidential? If you consent to take part in the study, the research doctor may inspect your medical records for purposes of analysing the results. Only government regulatory authorities and the research doctor will have access to your medical notes. Your General Practitioner will be informed of your participation in this study. All information collected about you during the course of the research will be kept strictly confidential. Any information about you, which leaves the hospital, will have your name and address removed so that you cannot be recognised from it. Reports or publications resulting from the study will not contain any personal details. 16. What will happen to the results of the research study? The results of the research study will be stored on a computer database and are likely to be published in cardiology journals. Reports or publications resulting from the study will not contain any personal details. The research doctor will provide a copy of the results on request. 17. Who is organising and funding the research? We are seeking funding from the British Heart Foundation. Glasgow University and the Departments of Cardiology in Glasgow Royal Infirmary and the Western Infirmary of Glasgow are performing the study. 18. Who has reviewed the study?
334
This study has been reviewed and approved by West Glasgow Research Ethics Committee,
which is an independent panel.
19. Contact for further information You are encouraged to ask questions at any time during the study. Please contact :- Study Doctor : Dr Colette E Jackson 0141 330 2064
Supervisor : Prof Stuart M Cobbe 0141 211 4722 Independent Doctor : Dr Adrian JB Brady 0141 211 4727 Thank you for taking the time to read this patient information leaflet. Please let Dr Jackson know if you are admitted to hospital for any reason.

335
Appendix IV
CONSENT FORM – Stage 1
Title of Project: Microvolt T-Wave Alternans in Chronic Heart Failure
Name of researcher: Dr C. Jackson
1. I agree to a blood sampling to assess how well my heart is pumping. □
2. I understand that my participation is voluntary and that I am free to withdraw at any time,
without giving any reason, without my medical care or legal rights being affected. □
3. I understand that my medical records may be looked at by the research doctor or medical
staff coordinating the study and this may also involve linkage to a national database. I give
permission for these individuals to have access to my records. □
Name of patient:
Signature:
Date:
Name of person taking consent:
Signature:
Date:
1 copy for patient; 1 copy for researcher; 1 copy for hospital notes

336
CONSENT FORM – Stage 2
Title of Project: Microvolt T-Wave Alternans in Chronic Heart Failure
Name of researcher: Dr C. Jackson
1. I confirm that I have read and understand the information sheet dated 04/01/07 (version 3)
for the above study and have had the opportunity to ask questions. □
2. I understand that my participation is voluntary and that I am free to withdraw at any time,
without giving any reason, without my medical care or legal rights being affected. □
3. I agree to take part in the above study. □
Name of patient:
Signature:
Date:
Name of person taking consent:
Signature:
Date:
1 copy for patient; 1 copy for researcher; 1 copy for hospital notes
337
Appendix V: Case notes sheet
Cardiology Research Study: Microvolt T-Wave Alternans
(MTWA) and Chronic Heart Failure
Patient ID
This patient has kindly agreed to participate in a cardiology research
study. The first stage of this study involves a blood test for B-type
natriuretic peptide (BNP).
A blood sample for BNP was sent on:……………………………..
If the BNP is positive (>100pg/ml) then either a research Doctor or
Nurse will visit the following day to explain the results and discuss
their involvement in the second stage of the study. If the BNP test is
negative then there will be no further contact with the patient but their
BNP result will be available via the hospital biochemistry database, as
for routine samples.
Further information : Dr Colette Jackson 0141 330 2064
Project supervision : Prof S Cobbe, Prof J McMurray, Dr M Petrie
Name DOB Hospital number
338
Appendix VI: Appointment card
MTWA Study in Patients
with Heart Failure
BHF Glasgow Cardiovascular Research Centre
126 University Place
University of Glasgow
G12 8TA

339
Dear
Thank you for agreeing to take part in the Heart Failure study.
An appointment has been made for you at the BHF Glasgow Cardiovascular Research Centre
on
…………………. at ……………….
Transport will be organised by us. If you are arriving with your own transport please see the
map below for directions. When you arrive please report to reception and someone will take
you through to the clinic area. The visit should last no more than 90 minutes. Please bring a
list of your medications and comfortable shoes. For appointment queries or to change the date
or time please contact the research team on 0141 330 2064
Kind regards
Dr Colette Jackson
340
Appendix VII Letter to Patient’s GP and Consultant Dear Dr.
Re : ________________________________________________________________
Your patient has been admitted to Glasgow Royal Infirmary / Western Infirmary / Royal
Alexandra Hospital with heart failure. This has been confirmed by B-type natriuretic peptide
(BNP) testing.
I am currently carrying out a research project in patients admitted to hospital with heart failure.
Your patient has kindly agreed to take part in this study.
This will involve one visit to the British Heart Foundation Glasgow Cardiovascular Research
Centre, adjacent to the Western Infirmary, approximately 4 weeks after discharge from
hospital. Their participation will involve blood sampling, echocardiography and a
submaximal exercise treadmill test called microvolt t-wave alternans testing. The exercise test
only involves gentle walking to raise the heart rate to 110bpm and they will not participate in
this if they have AF, ventricular pacemaker or are physically unable to.
Yours sincerely, Dr C Jackson Cardiology Research Fellow Tel. 0141 330 2064 Project Supervision : Prof S Cobbe, Prof J McMurray and Dr M Petrie

341
Appendix VIII: Hospital visit case record form
Section 1 : Patient Identification & Contact Inform ation
Study Patient ID --
Hospital GRI WIG RAH
Date of recruitment / /
Name
Hospital Number
CHI number
Date of birth (dd/mm/yy) / /
Address
Postcode
Home phone number
Mobile phone number
Work phone number
Holiday home phone number
Next of kin (or friend/carer)
Next of kin phone number
Next of kin (or friend/carer) address
GP name
GP address
GP number
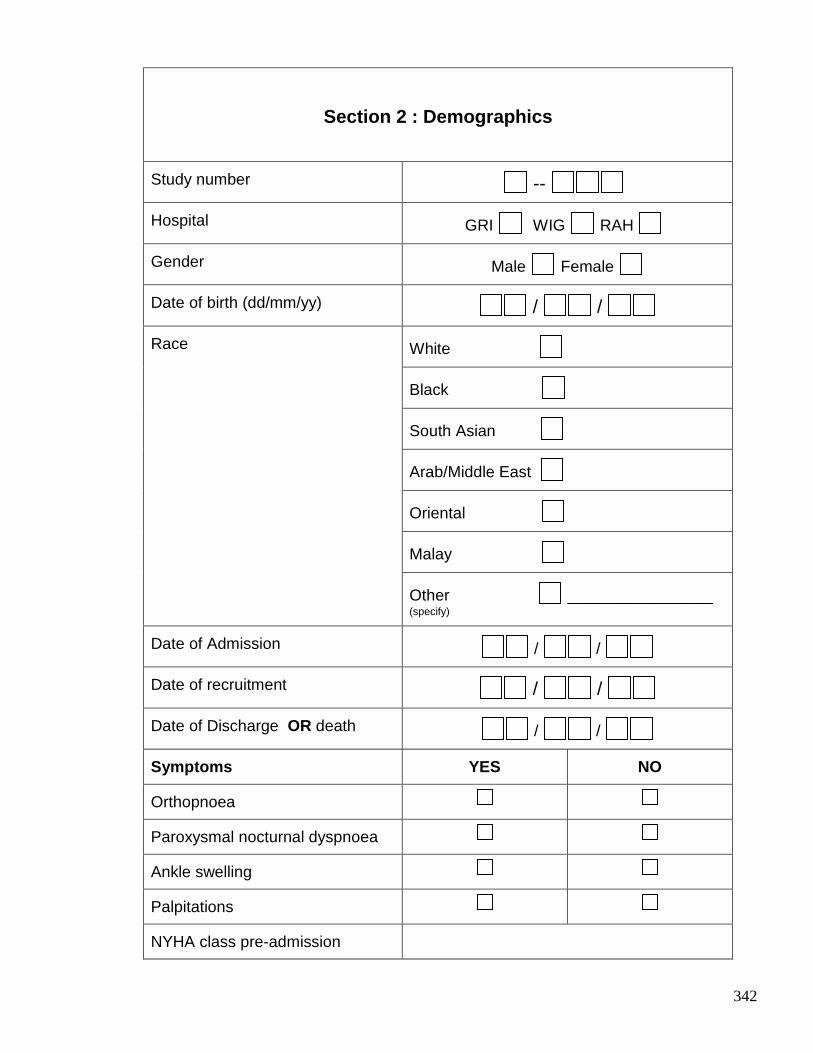
342
Section 2 : Demographics
Study number --
Hospital GRI WIG RAH
Gender Male Female
Date of birth (dd/mm/yy) / /
White
Black
South Asian
Arab/Middle East
Oriental
Malay
Race
Other ______________ (specify)
Date of Admission / /
Date of recruitment / /
Date of Discharge OR death / /
Symptoms YES NO
Orthopnoea
Paroxysmal nocturnal dyspnoea
Ankle swelling
Palpitations
NYHA class pre-admission
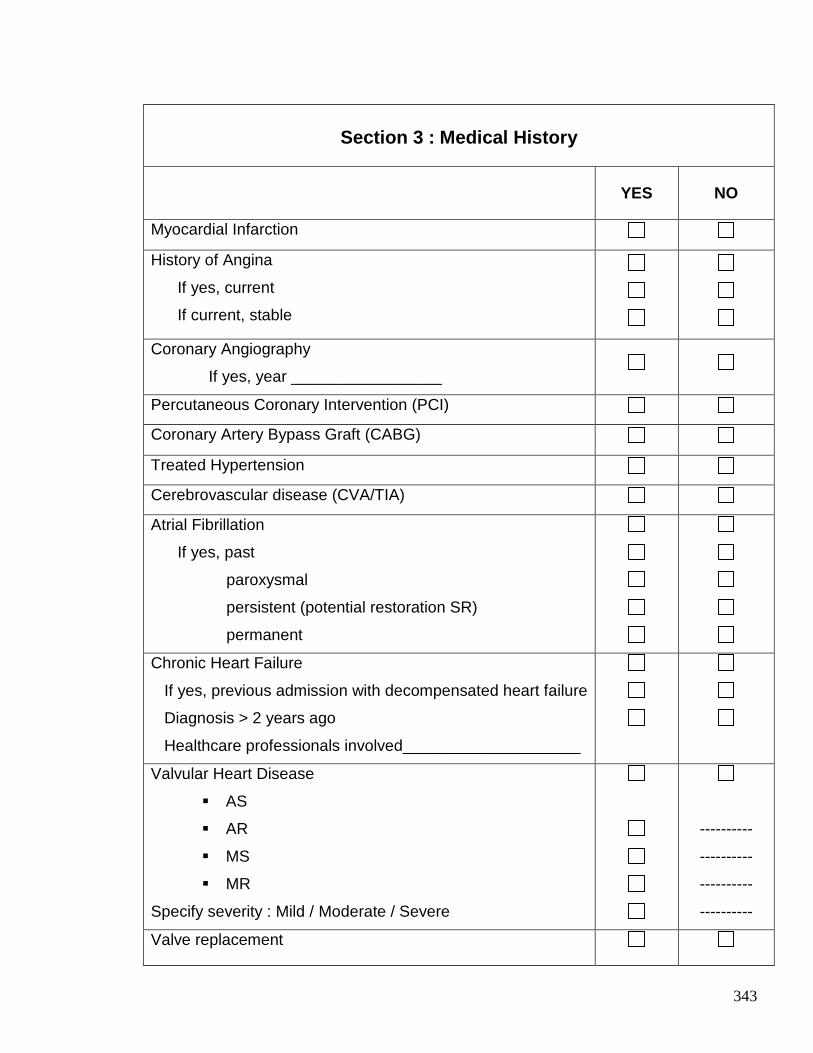
343
Section 3 : Medical History
YES NO
Myocardial Infarction
History of Angina
If yes, current
If current, stable
Coronary Angiography
If yes, year _________________
Percutaneous Coronary Intervention (PCI)
Coronary Artery Bypass Graft (CABG)
Treated Hypertension
Cerebrovascular disease (CVA/TIA)
Atrial Fibrillation
If yes, past
paroxysmal
persistent (potential restoration SR)
permanent
Chronic Heart Failure
If yes, previous admission with decompensated heart failure
Diagnosis > 2 years ago
Healthcare professionals involved____________________
Valvular Heart Disease
� AS
� AR
� MS
� MR
Specify severity : Mild / Moderate / Severe
----------
----------
----------
----------
Valve replacement
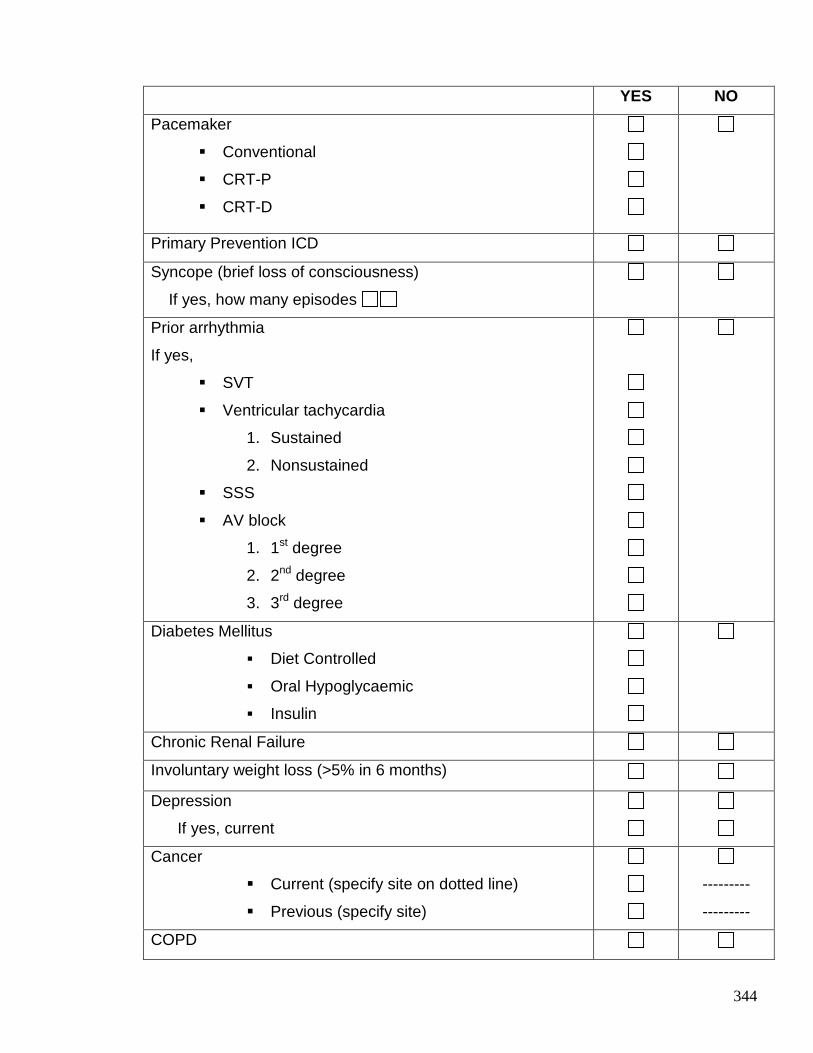
344
YES NO
Pacemaker
� Conventional
� CRT-P
� CRT-D
Primary Prevention ICD
Syncope (brief loss of consciousness)
If yes, how many episodes
Prior arrhythmia
If yes,
� SVT
� Ventricular tachycardia
1. Sustained
2. Nonsustained
� SSS
� AV block
1. 1st degree
2. 2nd degree
3. 3rd degree
Diabetes Mellitus
� Diet Controlled
� Oral Hypoglycaemic
� Insulin
Chronic Renal Failure
Involuntary weight loss (>5% in 6 months)
Depression
If yes, current
Cancer
� Current (specify site on dotted line)
� Previous (specify site)
---------
---------
COPD
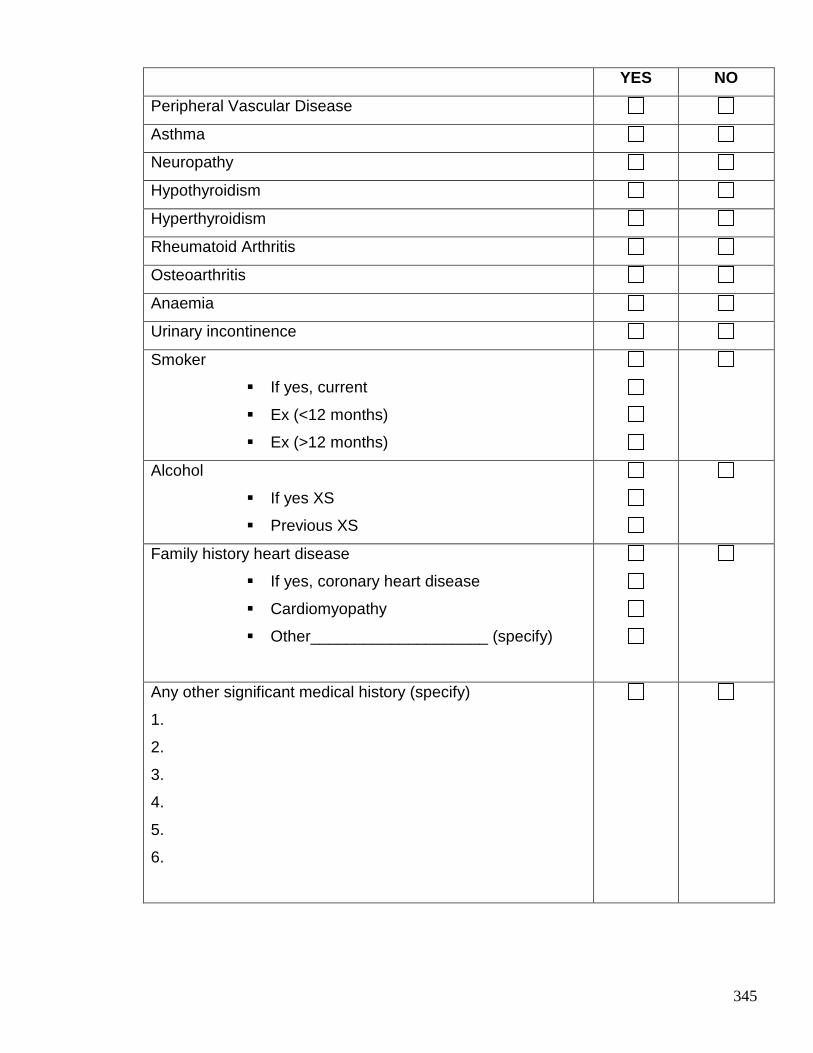
345
YES NO
Peripheral Vascular Disease
Asthma
Neuropathy
Hypothyroidism
Hyperthyroidism
Rheumatoid Arthritis
Osteoarthritis
Anaemia
Urinary incontinence
Smoker
� If yes, current
� Ex (<12 months)
� Ex (>12 months)
Alcohol
� If yes XS
� Previous XS
Family history heart disease
� If yes, coronary heart disease
� Cardiomyopathy
� Other____________________ (specify)
Any other significant medical history (specify)
1.
2.
3.
4.
5.
6.
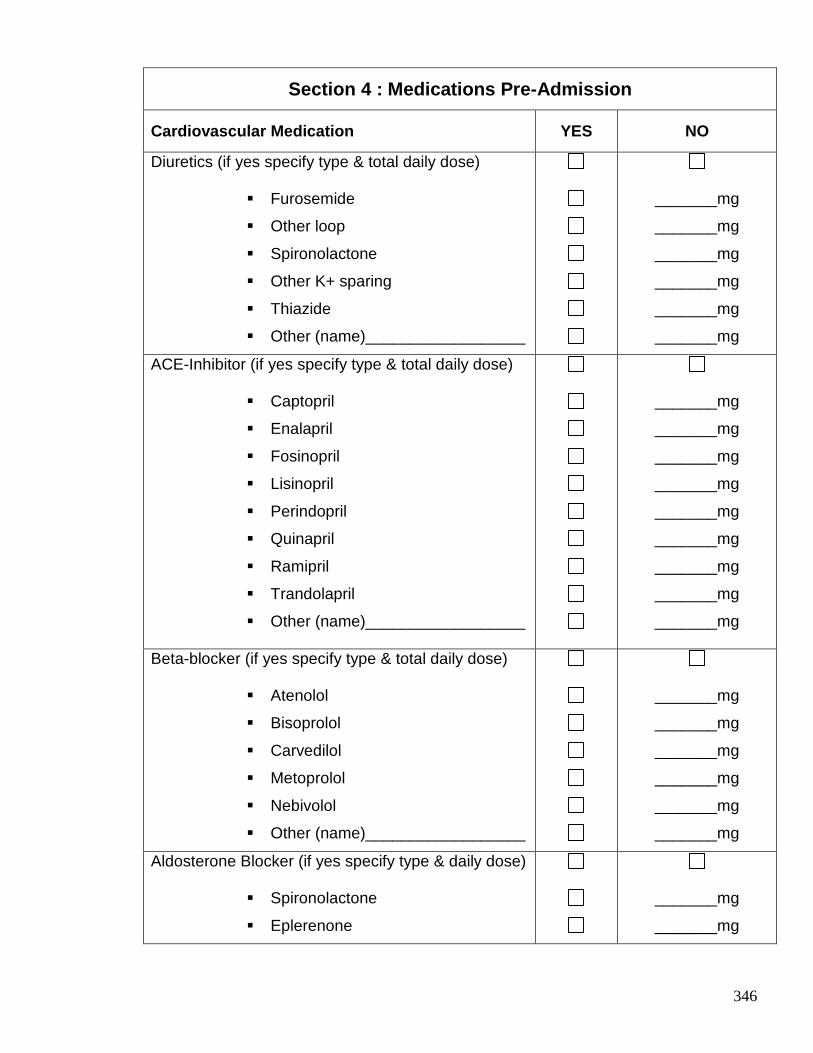
346
Section 4 : Medications Pre-Admission
Cardiovascular Medication YES NO
Diuretics (if yes specify type & total daily dose)
� Furosemide
� Other loop
� Spironolactone
� Other K+ sparing
� Thiazide
� Other (name)__________________
_______mg
_______mg
_______mg
_______mg
_______mg
_______mg
ACE-Inhibitor (if yes specify type & total daily dose)
� Captopril
� Enalapril
� Fosinopril
� Lisinopril
� Perindopril
� Quinapril
� Ramipril
� Trandolapril
� Other (name)__________________
_______mg
_______mg
_______mg
_______mg
_______mg
_______mg
_______mg
_______mg
_______mg
Beta-blocker (if yes specify type & total daily dose)
� Atenolol
� Bisoprolol
� Carvedilol
� Metoprolol
� Nebivolol
� Other (name)__________________
_______mg
_______mg
_______mg
_______mg
_______mg
_______mg
Aldosterone Blocker (if yes specify type & daily dose)
� Spironolactone
� Eplerenone
_______mg
_______mg
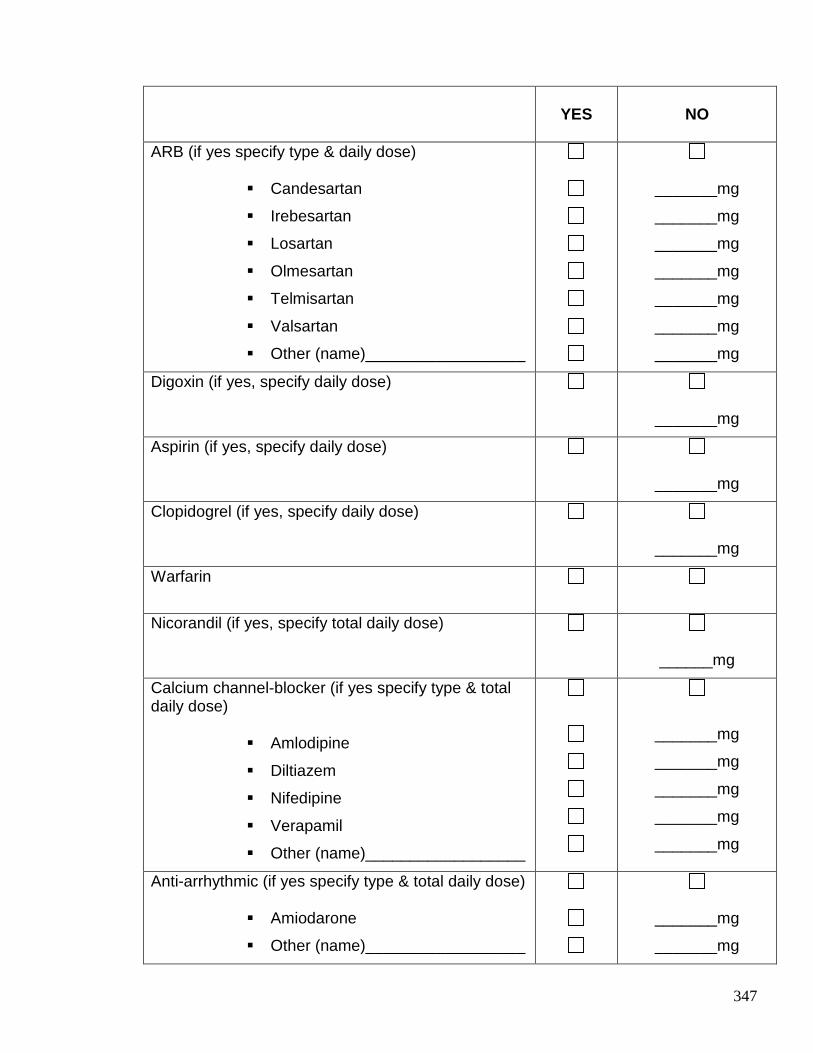
347
YES
NO
ARB (if yes specify type & daily dose)
� Candesartan
� Irebesartan
� Losartan
� Olmesartan
� Telmisartan
� Valsartan
� Other (name)__________________
_______mg
_______mg
_______mg
_______mg
_______mg
_______mg
_______mg
Digoxin (if yes, specify daily dose)
_______mg
Aspirin (if yes, specify daily dose)
_______mg
Clopidogrel (if yes, specify daily dose)
_______mg
Warfarin
Nicorandil (if yes, specify total daily dose)
______mg
Calcium channel-blocker (if yes specify type & total daily dose)
� Amlodipine
� Diltiazem
� Nifedipine
� Verapamil
� Other (name)__________________
_______mg
_______mg
_______mg
_______mg
_______mg
Anti-arrhythmic (if yes specify type & total daily dose)
� Amiodarone
� Other (name)__________________
_______mg
_______mg
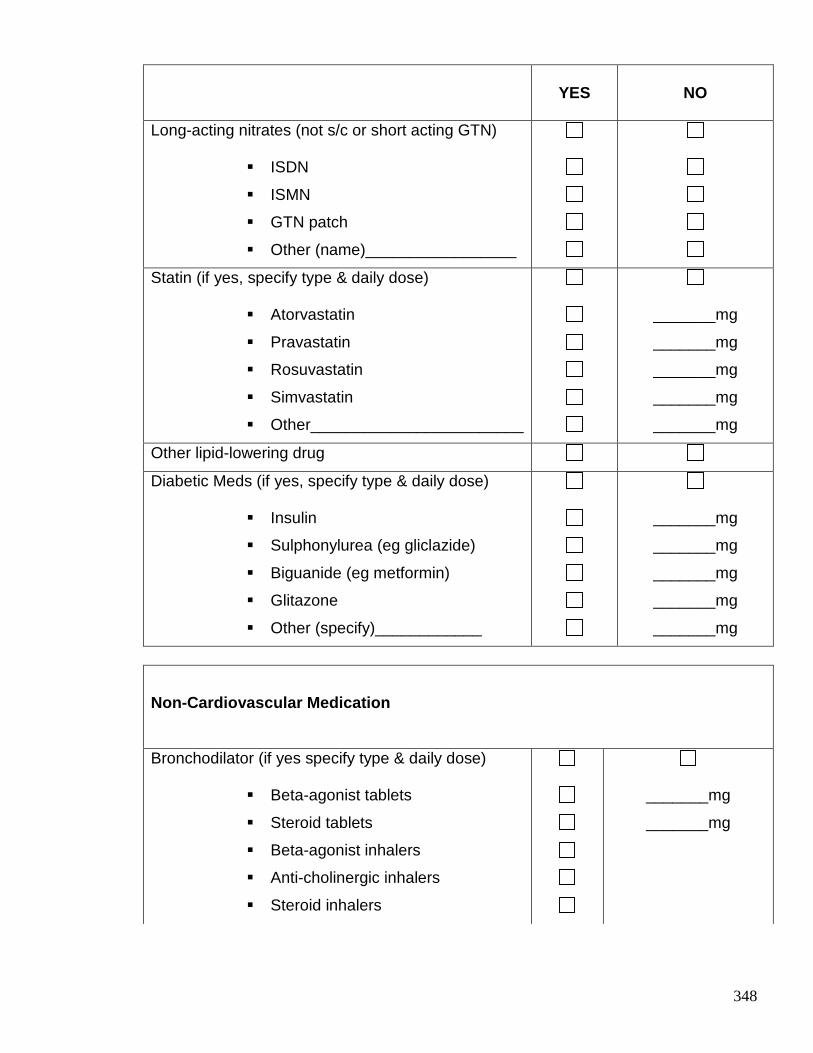
348
Non-Cardiovascular Medication
Bronchodilator (if yes specify type & daily dose)
� Beta-agonist tablets
� Steroid tablets
� Beta-agonist inhalers
� Anti-cholinergic inhalers
� Steroid inhalers
_______mg
_______mg
YES
NO
Long-acting nitrates (not s/c or short acting GTN)
� ISDN
� ISMN
� GTN patch
� Other (name)_________________
Statin (if yes, specify type & daily dose)
� Atorvastatin
� Pravastatin
� Rosuvastatin
� Simvastatin
� Other________________________
_______mg
_______mg
_______mg
_______mg
_______mg
Other lipid-lowering drug
Diabetic Meds (if yes, specify type & daily dose)
� Insulin
� Sulphonylurea (eg gliclazide)
� Biguanide (eg metformin)
� Glitazone
� Other (specify)____________
_______mg
_______mg
_______mg
_______mg
_______mg
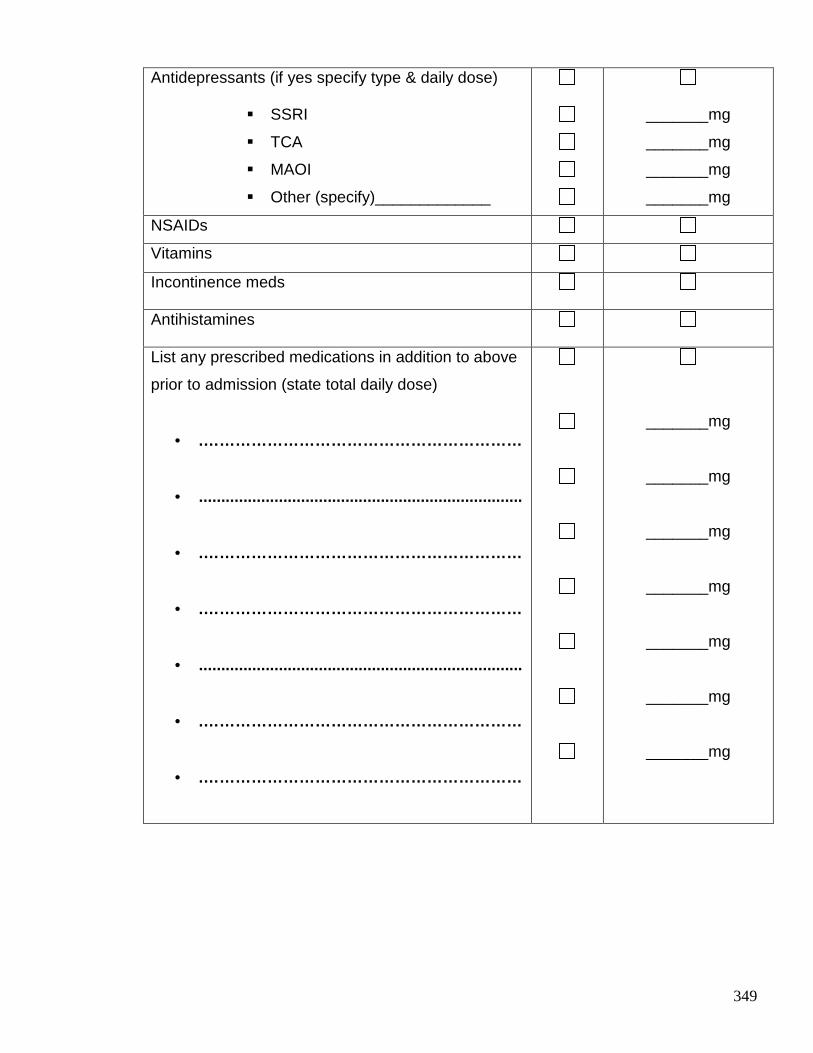
349
Antidepressants (if yes specify type & daily dose)
� SSRI
� TCA
� MAOI
� Other (specify)_____________
_______mg
_______mg
_______mg
_______mg
NSAIDs
Vitamins
Incontinence meds
Antihistamines
List any prescribed medications in addition to above
prior to admission (state total daily dose)
• .……………………………………………………
• .........................................................................
• .……………………………………………………
• .……………………………………………………
• .........................................................................
• .……………………………………………………
• .……………………………………………………
_______mg
_______mg
_______mg
_______mg
_______mg
_______mg
_______mg
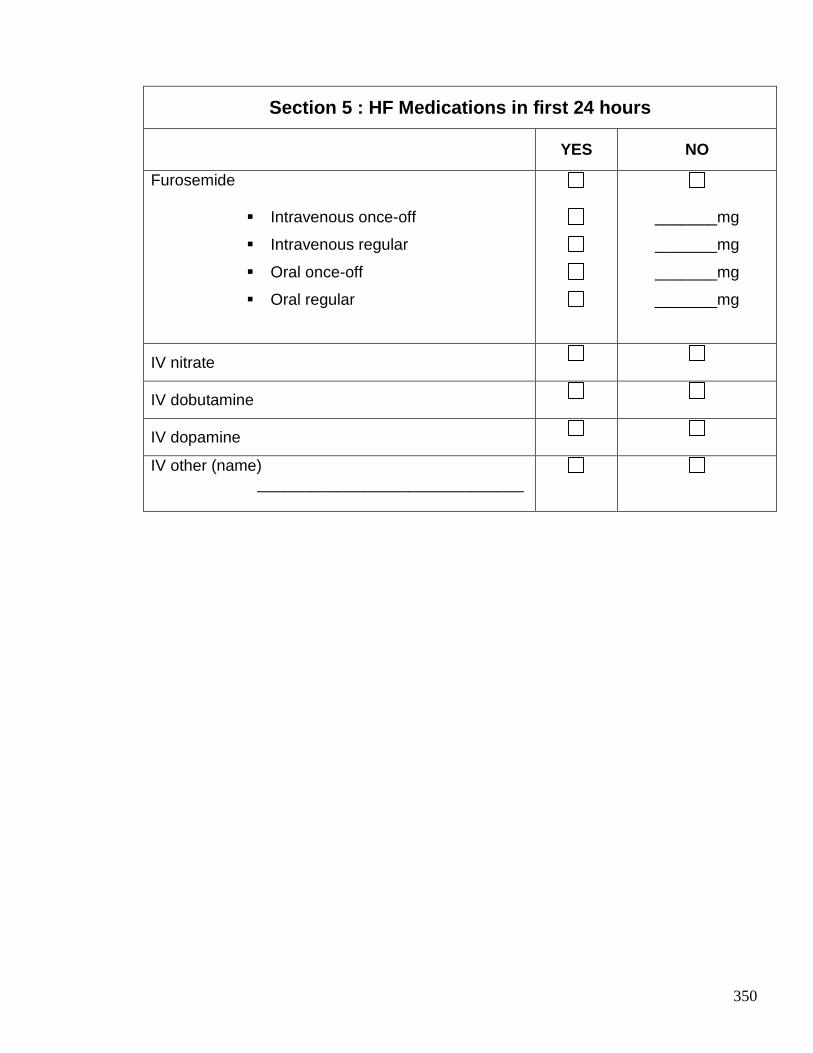
350
Section 5 : HF Medications in first 24 hours
YES NO
Furosemide
� Intravenous once-off
� Intravenous regular
� Oral once-off
� Oral regular
_______mg
_______mg
_______mg
_______mg
IV nitrate
IV dobutamine
IV dopamine
IV other (name) ______________________________
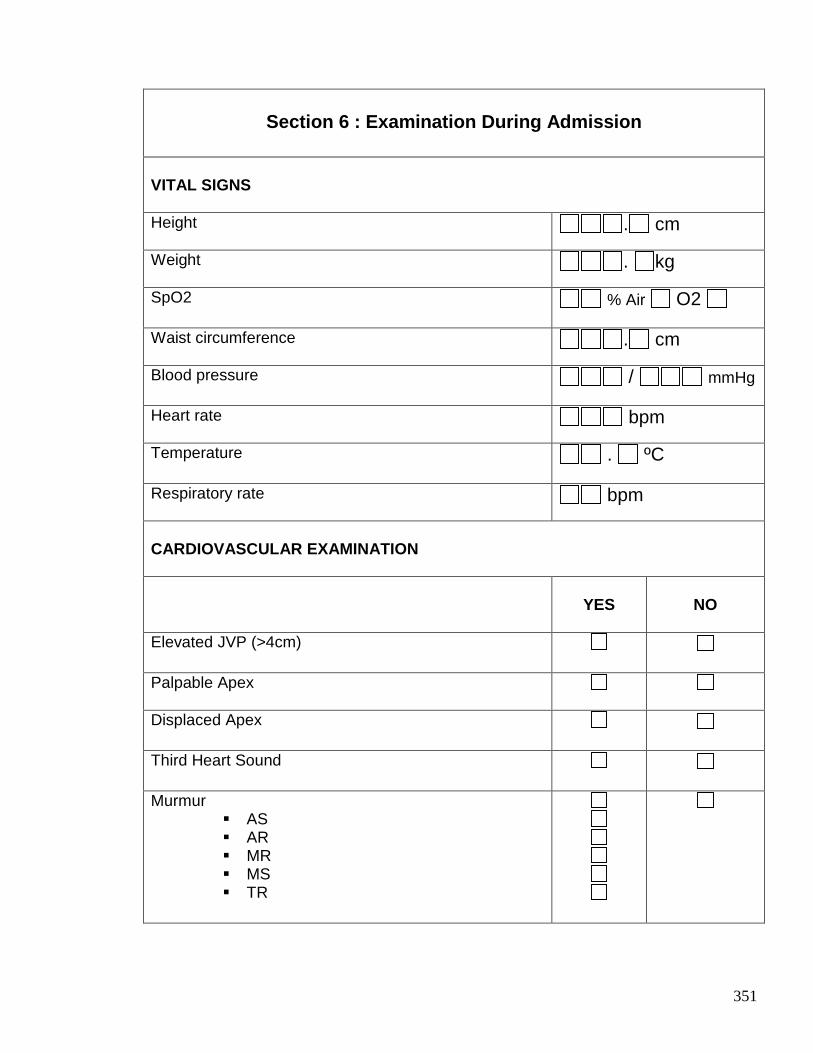
351
Section 6 : Examination During Admission
VITAL SIGNS Height
. cm
Weight
. kg
SpO2 % Air O2
Waist circumference
. cm
Blood pressure / mmHg
Heart rate
bpm
Temperature . ºC
Respiratory rate
bpm
CARDIOVASCULAR EXAMINATION
YES
NO
Elevated JVP (>4cm)
Palpable Apex
Displaced Apex
Third Heart Sound
Murmur � AS � AR � MR � MS � TR
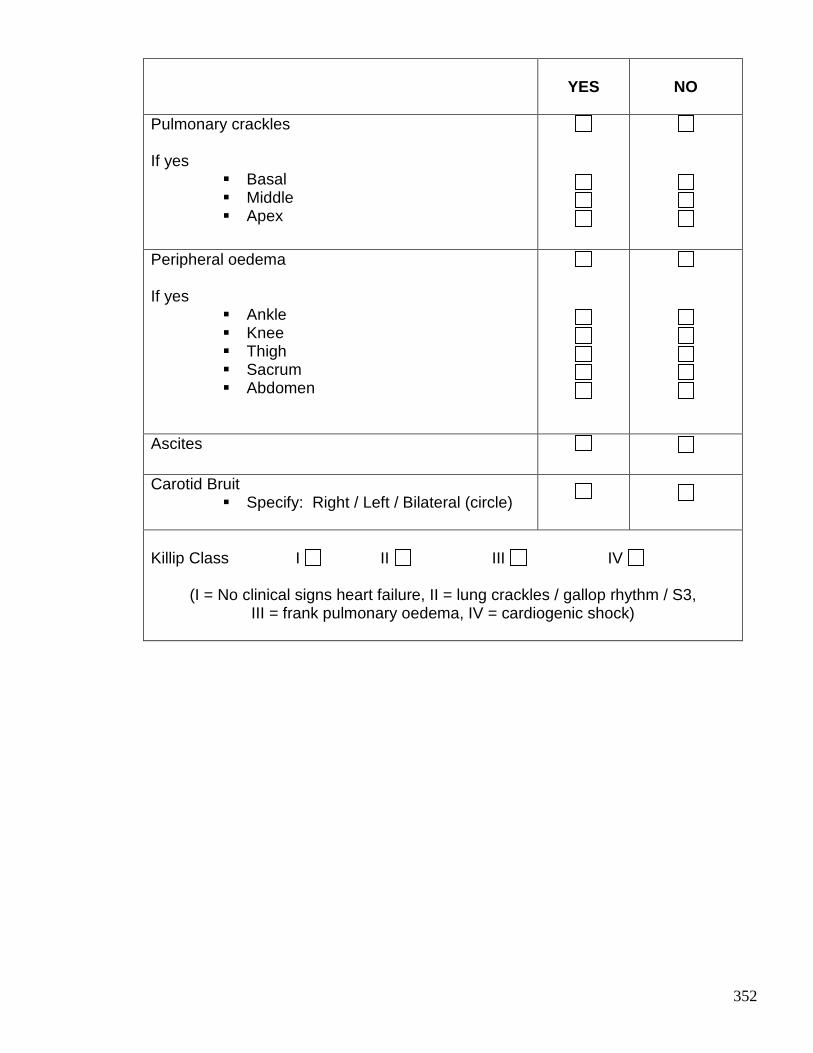
352
YES
NO
Pulmonary crackles If yes
� Basal � Middle � Apex
Peripheral oedema If yes
� Ankle � Knee � Thigh � Sacrum � Abdomen
Ascites
Carotid Bruit � Specify: Right / Left / Bilateral (circle)
Killip Class I II III IV
(I = No clinical signs heart failure, II = lung crackles / gallop rhythm / S3,
III = frank pulmonary oedema, IV = cardiogenic shock)
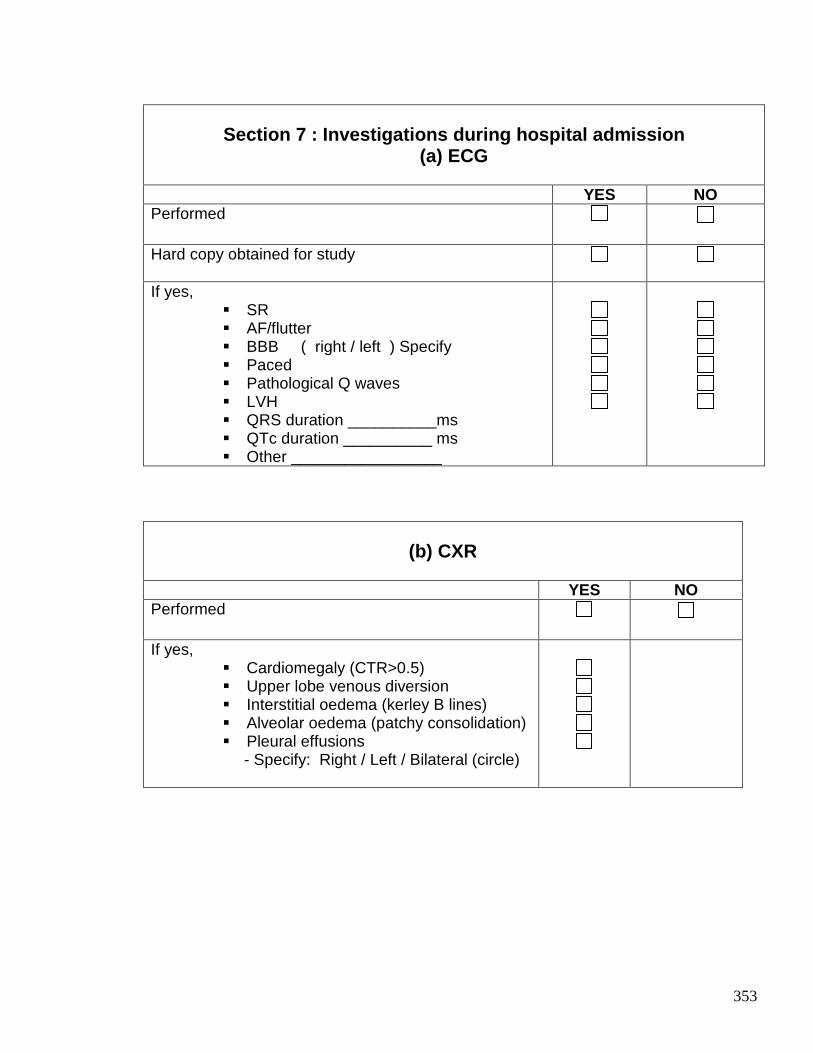
353
Section 7 : Investigations during hospital admissio n
(a) ECG YES NO Performed
Hard copy obtained for study
If yes,
� SR � AF/flutter � BBB ( right / left ) Specify � Paced � Pathological Q waves � LVH � QRS duration __________ms � QTc duration __________ ms � Other _________________
(b) CXR
YES NO Performed
If yes,
� Cardiomegaly (CTR>0.5) � Upper lobe venous diversion � Interstitial oedema (kerley B lines) � Alveolar oedema (patchy consolidation) � Pleural effusions
- Specify: Right / Left / Bilateral (circle)
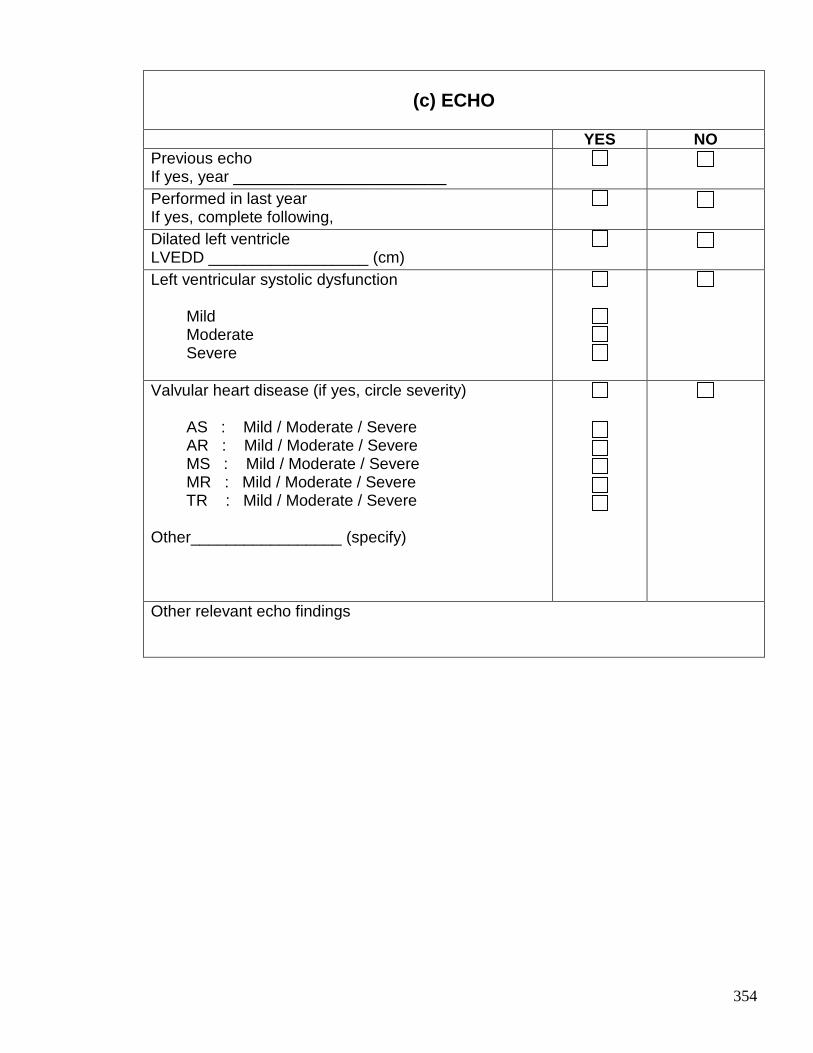
354
(c) ECHO
YES NO Previous echo If yes, year ________________________
Performed in last year If yes, complete following,
Dilated left ventricle LVEDD __________________ (cm)
Left ventricular systolic dysfunction Mild Moderate Severe
Valvular heart disease (if yes, circle severity) AS : Mild / Moderate / Severe AR : Mild / Moderate / Severe MS : Mild / Moderate / Severe MR : Mild / Moderate / Severe TR : Mild / Moderate / Severe Other_________________ (specify)
Other relevant echo findings
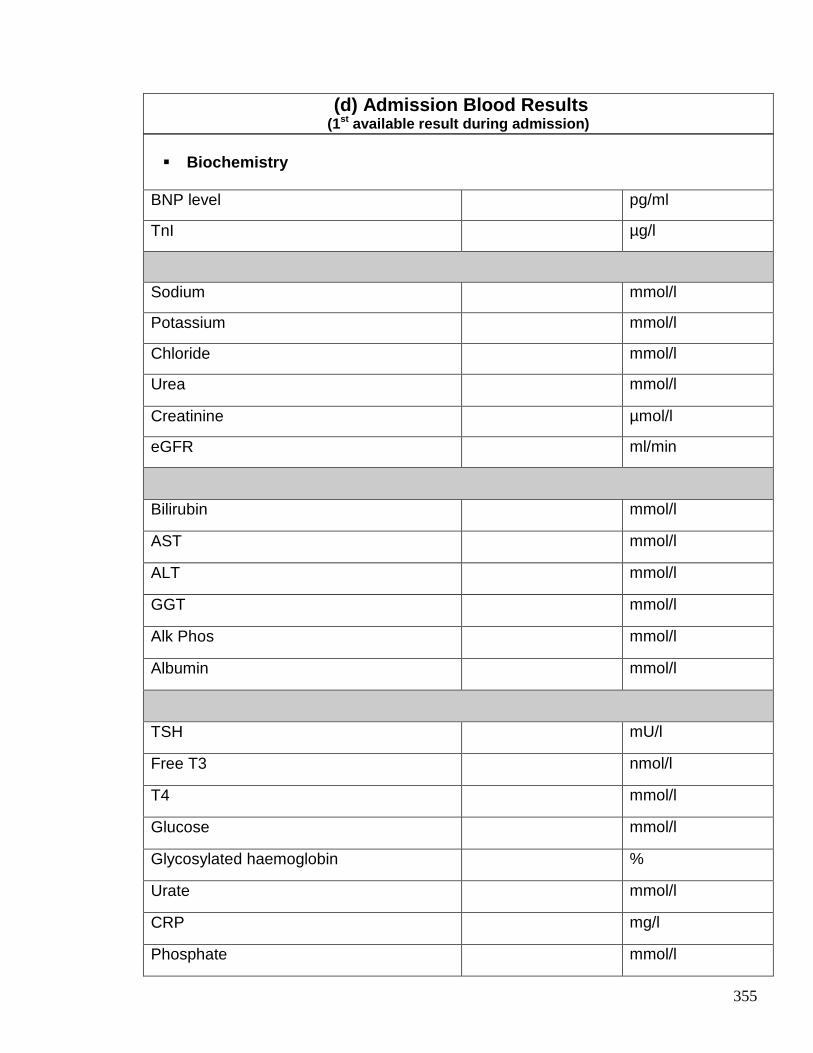
355
� Biochemistry
BNP level pg/ml
TnI µg/l
Sodium mmol/l
Potassium mmol/l
Chloride mmol/l
Urea mmol/l
Creatinine µmol/l
eGFR ml/min
Bilirubin mmol/l
AST mmol/l
ALT mmol/l
GGT mmol/l
Alk Phos mmol/l
Albumin mmol/l
TSH mU/l
Free T3 nmol/l
T4 mmol/l
Glucose mmol/l
Glycosylated haemoglobin %
Urate mmol/l
CRP mg/l
Phosphate mmol/l
(d) Admission Blood Results (1st available result during admission)
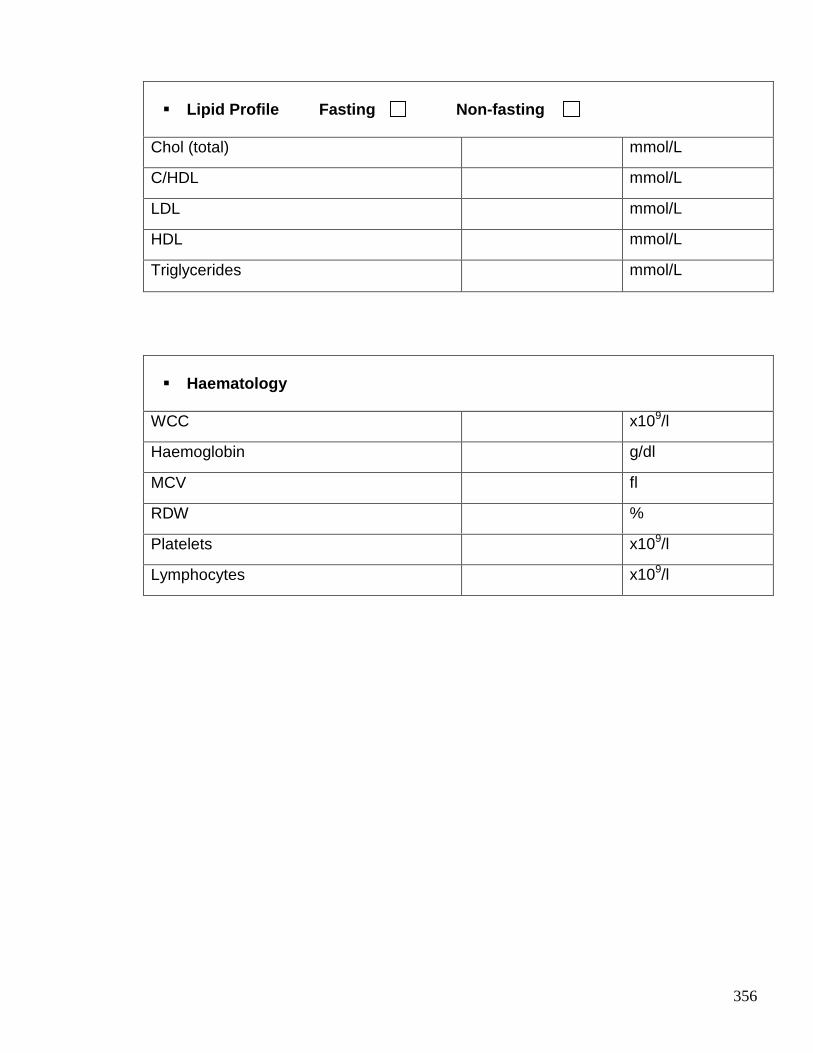
356
� Lipid Profile Fasting Non-fasting
Chol (total) mmol/L
C/HDL mmol/L
LDL mmol/L
HDL mmol/L
Triglycerides mmol/L
� Haematology
WCC x109/l
Haemoglobin g/dl
MCV fl
RDW %
Platelets x109/l
Lymphocytes x109/l
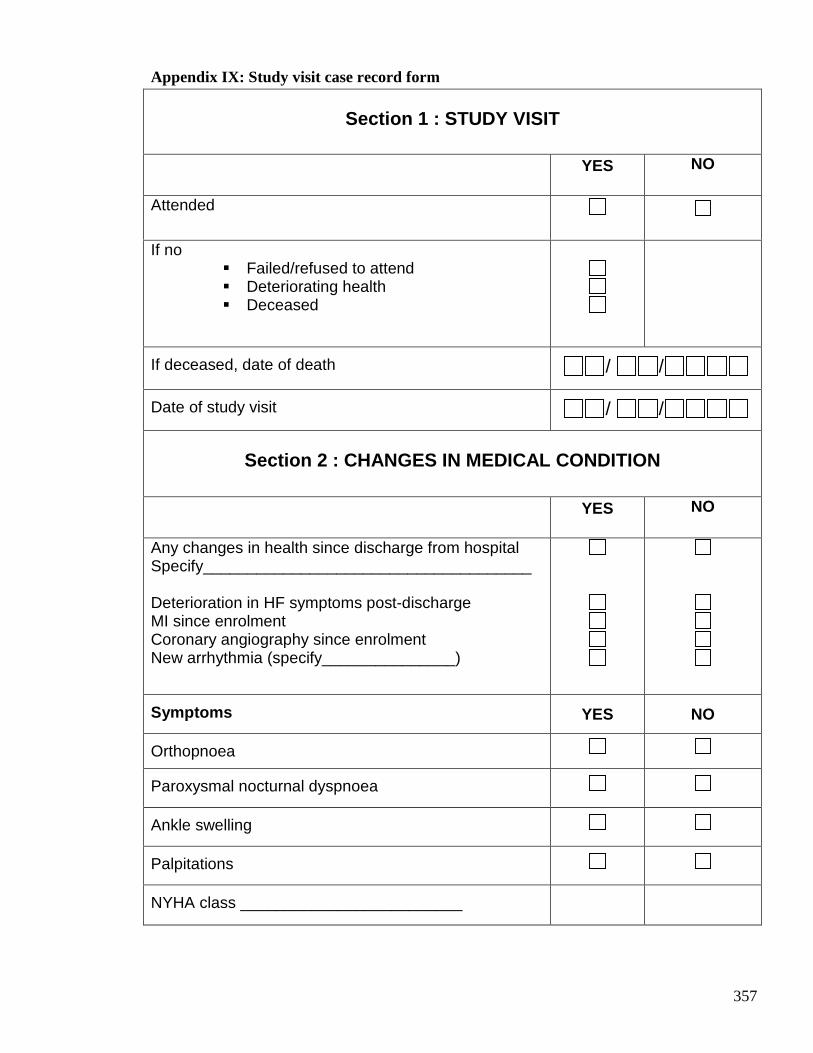
357
Appendix IX: Study visit case record form
Section 1 : STUDY VISIT
YES
NO
Attended
If no � Failed/refused to attend � Deteriorating health � Deceased
If deceased, date of death / /
Date of study visit / /
Section 2 : CHANGES IN MEDICAL CONDITION
YES
NO
Any changes in health since discharge from hospital Specify_____________________________________ Deterioration in HF symptoms post-discharge MI since enrolment Coronary angiography since enrolment New arrhythmia (specify_______________)
Symptoms YES NO
Orthopnoea
Paroxysmal nocturnal dyspnoea
Ankle swelling
Palpitations
NYHA class _________________________
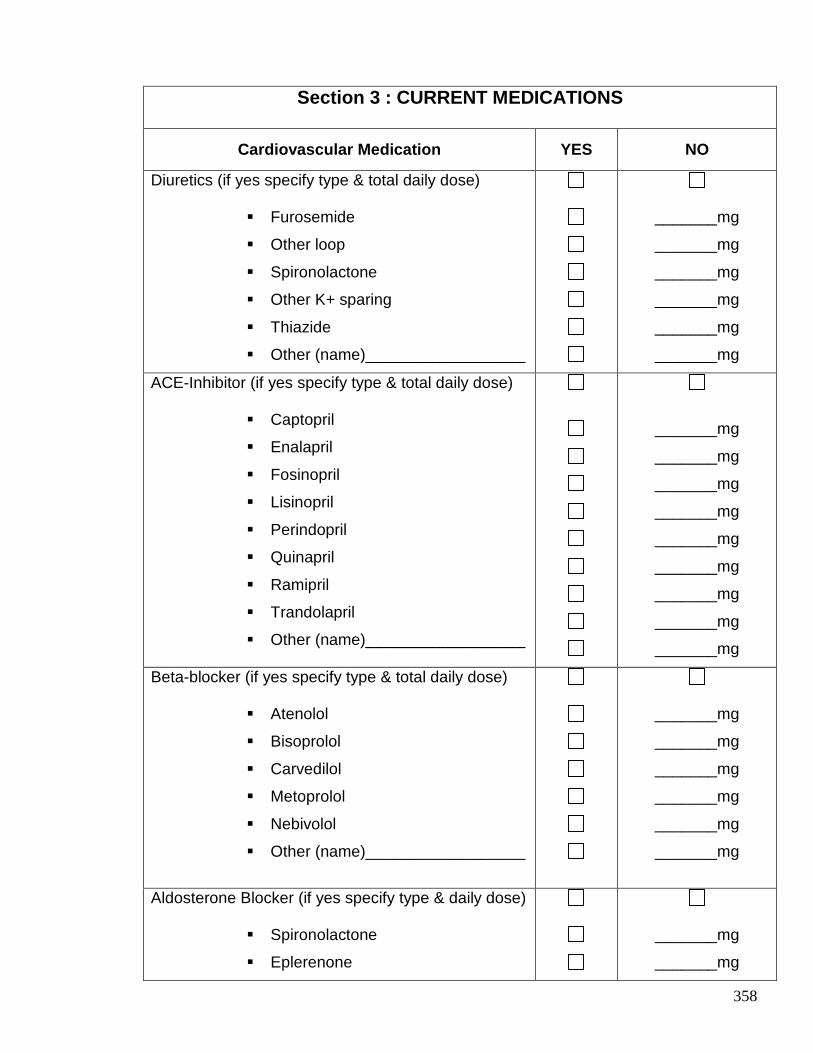
358
Section 3 : CURRENT MEDICATIONS
Cardiovascular Medication YES NO
Diuretics (if yes specify type & total daily dose)
� Furosemide
� Other loop
� Spironolactone
� Other K+ sparing
� Thiazide
� Other (name)__________________
_______mg
_______mg
_______mg
_______mg
_______mg
_______mg
ACE-Inhibitor (if yes specify type & total daily dose)
� Captopril
� Enalapril
� Fosinopril
� Lisinopril
� Perindopril
� Quinapril
� Ramipril
� Trandolapril
� Other (name)__________________
_______mg
_______mg
_______mg
_______mg
_______mg
_______mg
_______mg
_______mg
_______mg
Beta-blocker (if yes specify type & total daily dose)
� Atenolol
� Bisoprolol
� Carvedilol
� Metoprolol
� Nebivolol
� Other (name)__________________
_______mg
_______mg
_______mg
_______mg
_______mg
_______mg
Aldosterone Blocker (if yes specify type & daily dose)
� Spironolactone
� Eplerenone
_______mg
_______mg
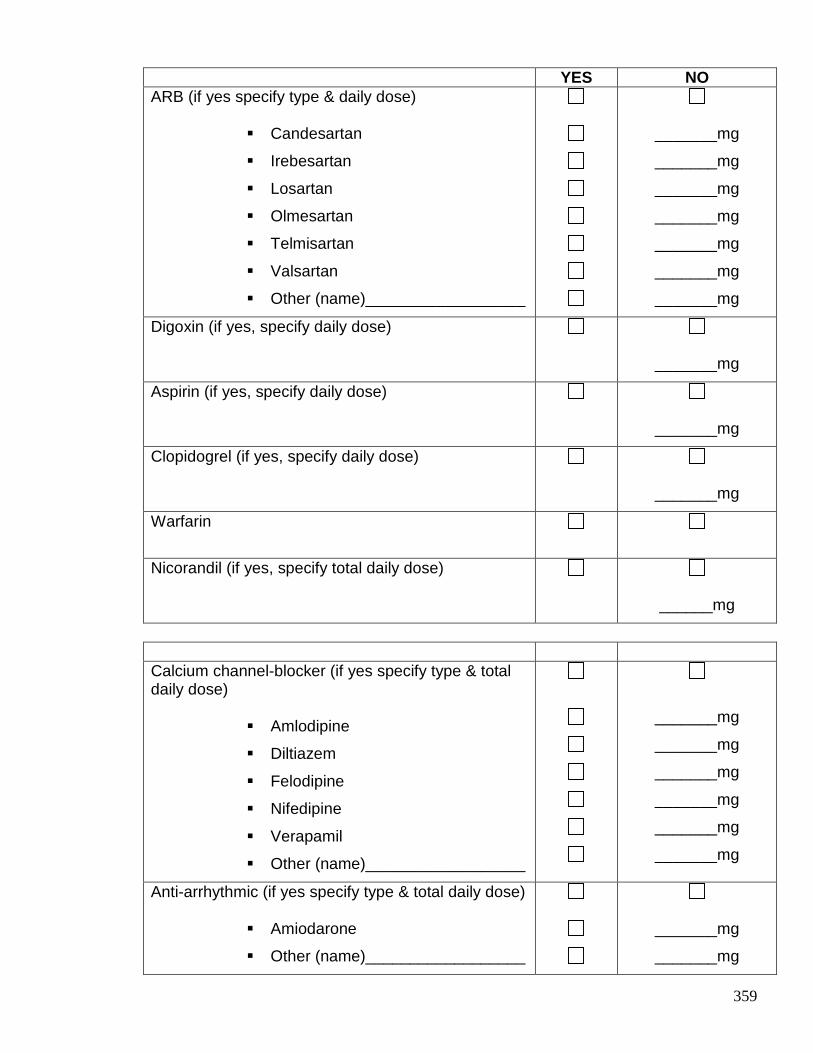
359
YES NO ARB (if yes specify type & daily dose)
� Candesartan
� Irebesartan
� Losartan
� Olmesartan
� Telmisartan
� Valsartan
� Other (name)__________________
_______mg
_______mg
_______mg
_______mg
_______mg
_______mg
_______mg
Digoxin (if yes, specify daily dose)
_______mg
Aspirin (if yes, specify daily dose)
_______mg
Clopidogrel (if yes, specify daily dose)
_______mg
Warfarin
Nicorandil (if yes, specify total daily dose)
______mg
Calcium channel-blocker (if yes specify type & total daily dose)
� Amlodipine
� Diltiazem
� Felodipine
� Nifedipine
� Verapamil
� Other (name)__________________
_______mg
_______mg
_______mg
_______mg
_______mg
_______mg
Anti-arrhythmic (if yes specify type & total daily dose)
� Amiodarone
� Other (name)__________________
_______mg
_______mg
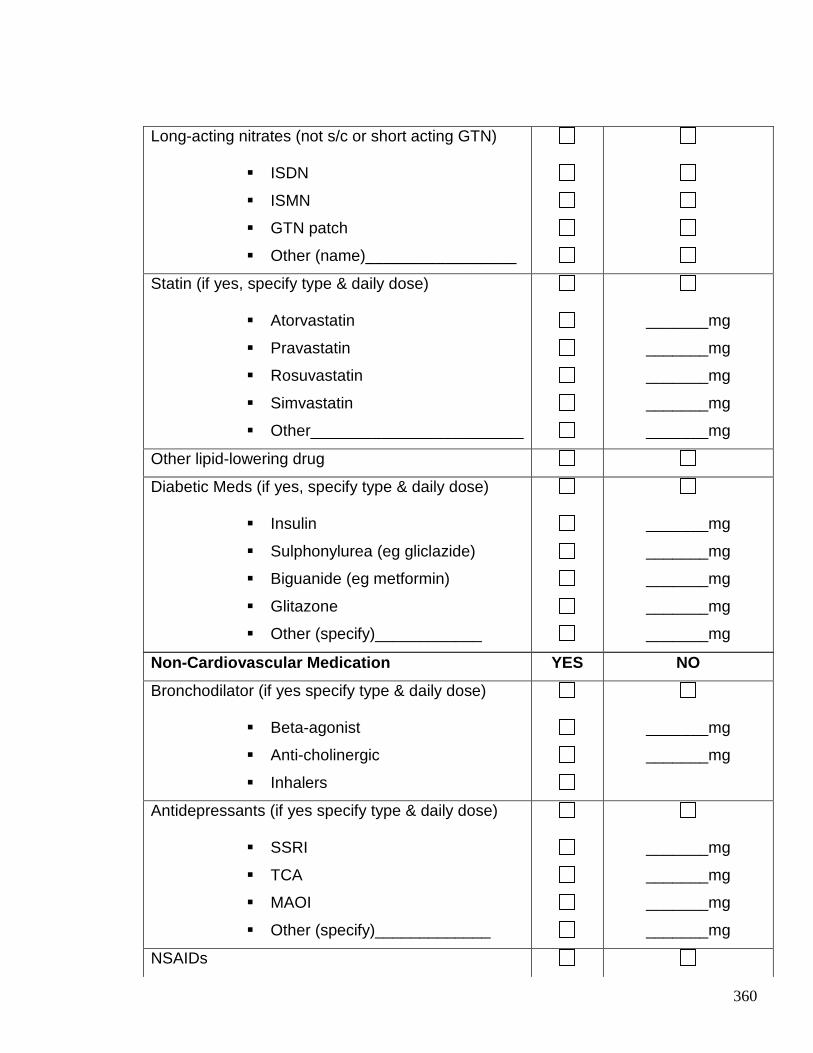
360
Non-Cardiovascular Medication YES NO
Bronchodilator (if yes specify type & daily dose)
� Beta-agonist
� Anti-cholinergic
� Inhalers
_______mg
_______mg
Antidepressants (if yes specify type & daily dose)
� SSRI
� TCA
� MAOI
� Other (specify)_____________
_______mg
_______mg
_______mg
_______mg
NSAIDs
Long-acting nitrates (not s/c or short acting GTN)
� ISDN
� ISMN
� GTN patch
� Other (name)_________________
Statin (if yes, specify type & daily dose)
� Atorvastatin
� Pravastatin
� Rosuvastatin
� Simvastatin
� Other________________________
_______mg
_______mg
_______mg
_______mg
_______mg
Other lipid-lowering drug
Diabetic Meds (if yes, specify type & daily dose)
� Insulin
� Sulphonylurea (eg gliclazide)
� Biguanide (eg metformin)
� Glitazone
� Other (specify)____________
_______mg
_______mg
_______mg
_______mg
_______mg

361
Vitamins
Incontinence meds
Antihistamines
List any prescribed medications in addition to above
(state total daily dose)
• .……………………………………………………
• .........................................................................
• .……………………………………………………
• .……………………………………………………
• .........................................................................
_______mg
_______mg
_______mg
_______mg
_______mg
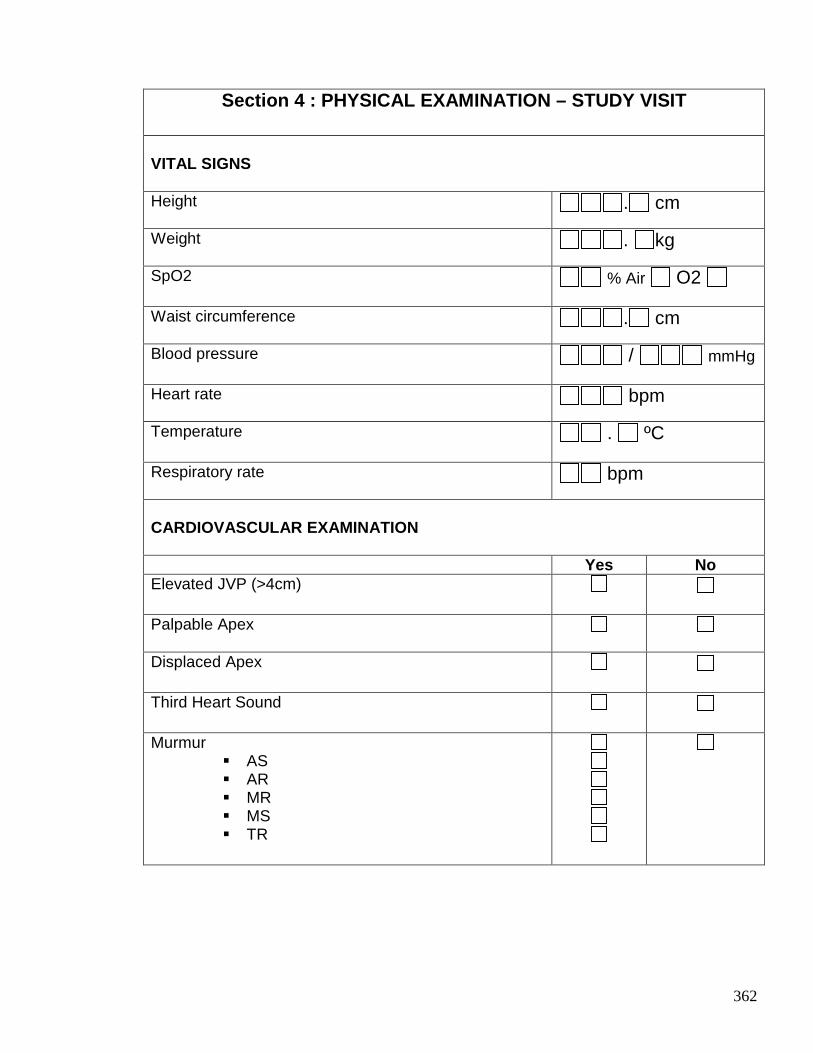
362
Section 4 : PHYSICAL EXAMINATION – STUDY VISIT
VITAL SIGNS Height
. cm
Weight
. kg
SpO2 % Air O2
Waist circumference
. cm
Blood pressure / mmHg
Heart rate
bpm
Temperature . ºC
Respiratory rate
bpm
CARDIOVASCULAR EXAMINATION Yes No Elevated JVP (>4cm)
Palpable Apex
Displaced Apex
Third Heart Sound
Murmur � AS � AR � MR � MS � TR
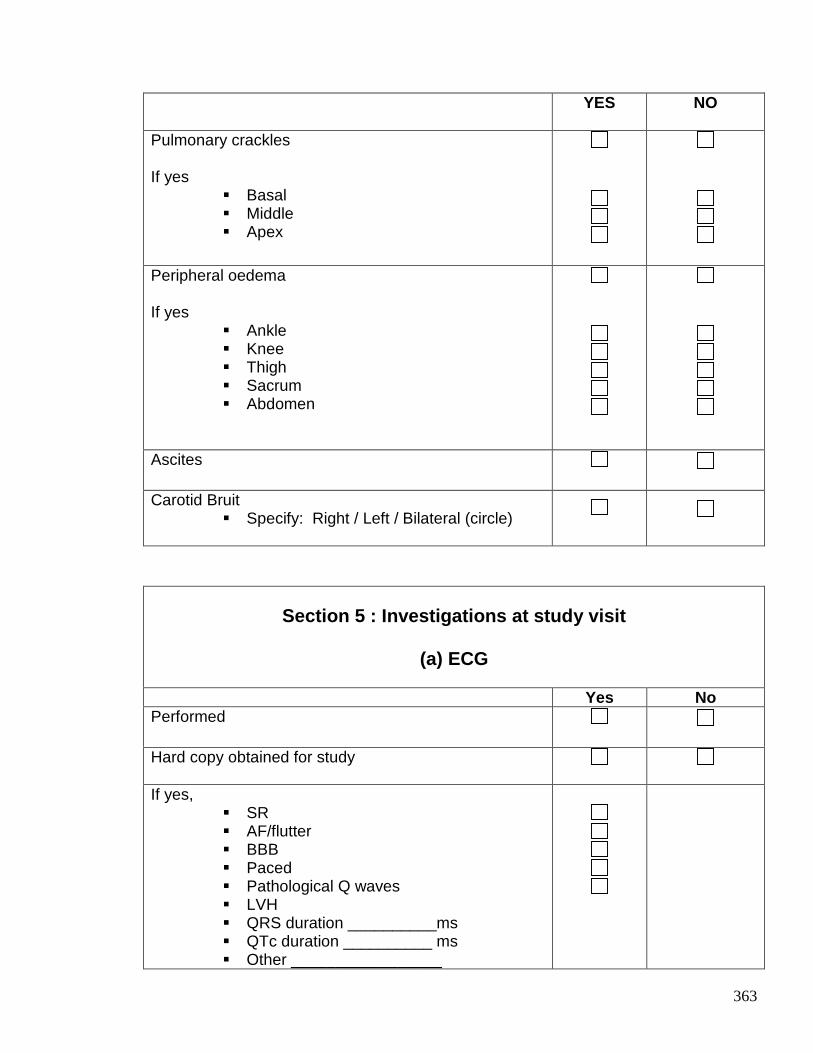
363
YES NO
Pulmonary crackles If yes
� Basal � Middle � Apex
Peripheral oedema If yes
� Ankle � Knee � Thigh � Sacrum � Abdomen
Ascites
Carotid Bruit � Specify: Right / Left / Bilateral (circle)
Section 5 : Investigations at study visit
(a) ECG
Yes No Performed
Hard copy obtained for study
If yes,
� SR � AF/flutter � BBB � Paced � Pathological Q waves � LVH � QRS duration __________ms � QTc duration __________ ms � Other _________________
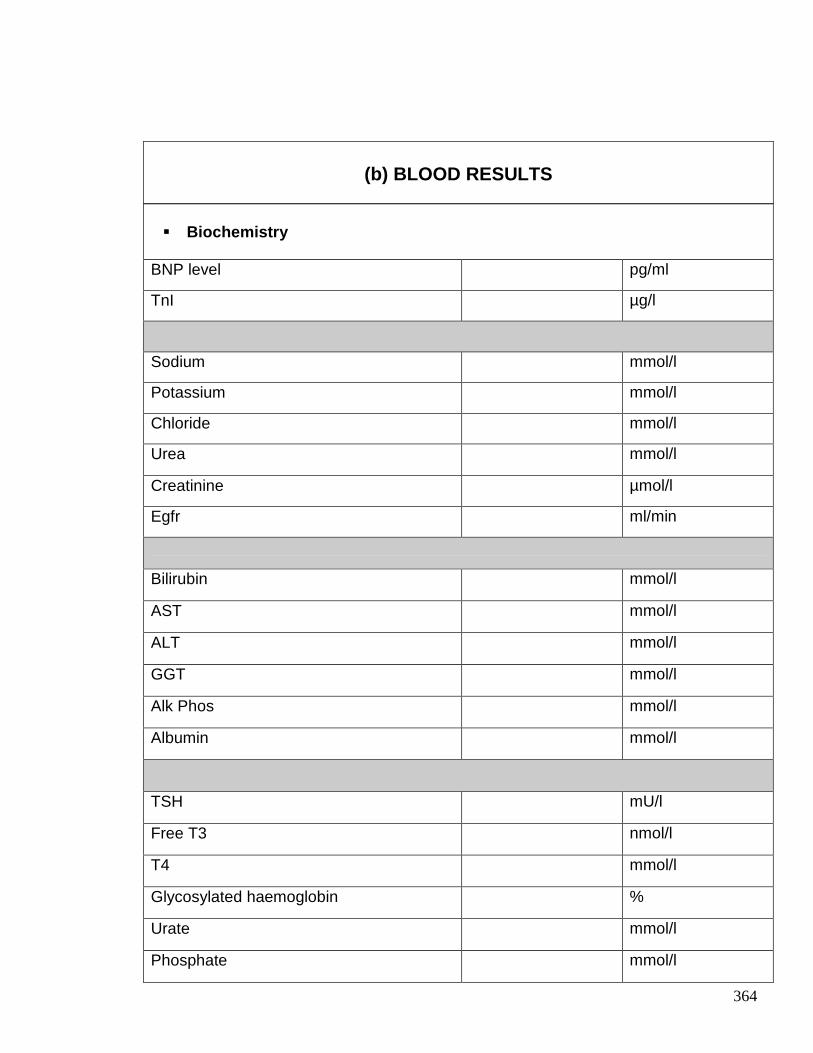
364
� Biochemistry
BNP level pg/ml
TnI µg/l
Sodium mmol/l
Potassium mmol/l
Chloride mmol/l
Urea mmol/l
Creatinine µmol/l
Egfr ml/min
Bilirubin mmol/l
AST mmol/l
ALT mmol/l
GGT mmol/l
Alk Phos mmol/l
Albumin mmol/l
TSH mU/l
Free T3 nmol/l
T4 mmol/l
Glycosylated haemoglobin %
Urate mmol/l
Phosphate mmol/l
(b) BLOOD RESULTS
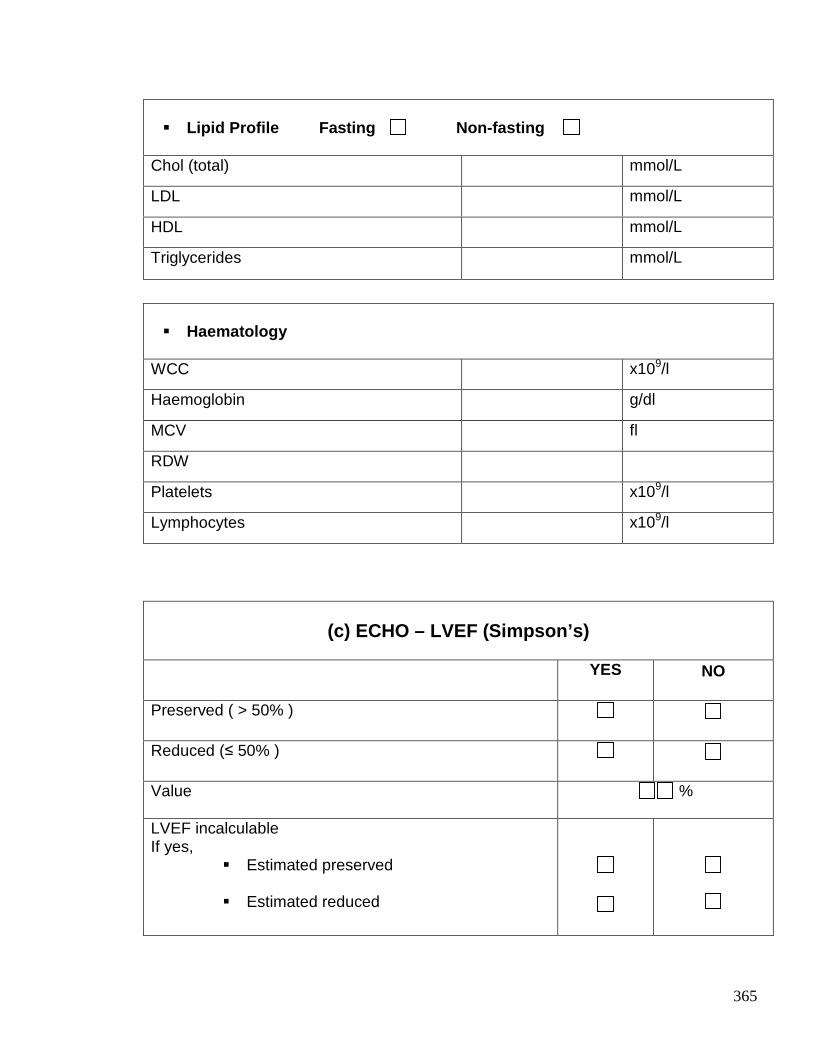
365
� Lipid Profile Fasting Non-fasting
Chol (total) mmol/L
LDL mmol/L
HDL mmol/L
Triglycerides mmol/L
� Haematology
WCC x109/l
Haemoglobin g/dl
MCV fl
RDW
Platelets x109/l
Lymphocytes x109/l
(c) ECHO – LVEF (Simpson’s)
YES
NO
Preserved ( > 50% )
Reduced (≤ 50% )
Value %
LVEF incalculable If yes,
� Estimated preserved
� Estimated reduced
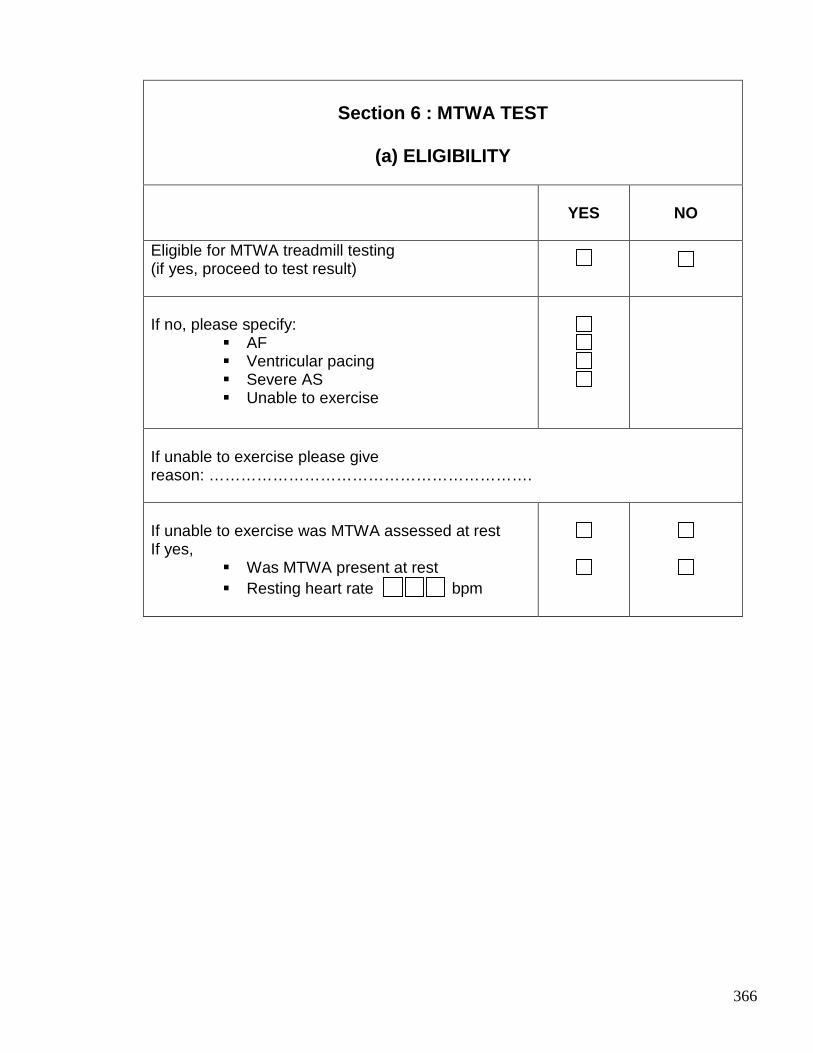
366
Section 6 : MTWA TEST
(a) ELIGIBILITY
YES
NO
Eligible for MTWA treadmill testing (if yes, proceed to test result)
If no, please specify:
� AF � Ventricular pacing � Severe AS � Unable to exercise
If unable to exercise please give reason: ……………………………………………………. If unable to exercise was MTWA assessed at rest If yes,
� Was MTWA present at rest � Resting heart rate bpm
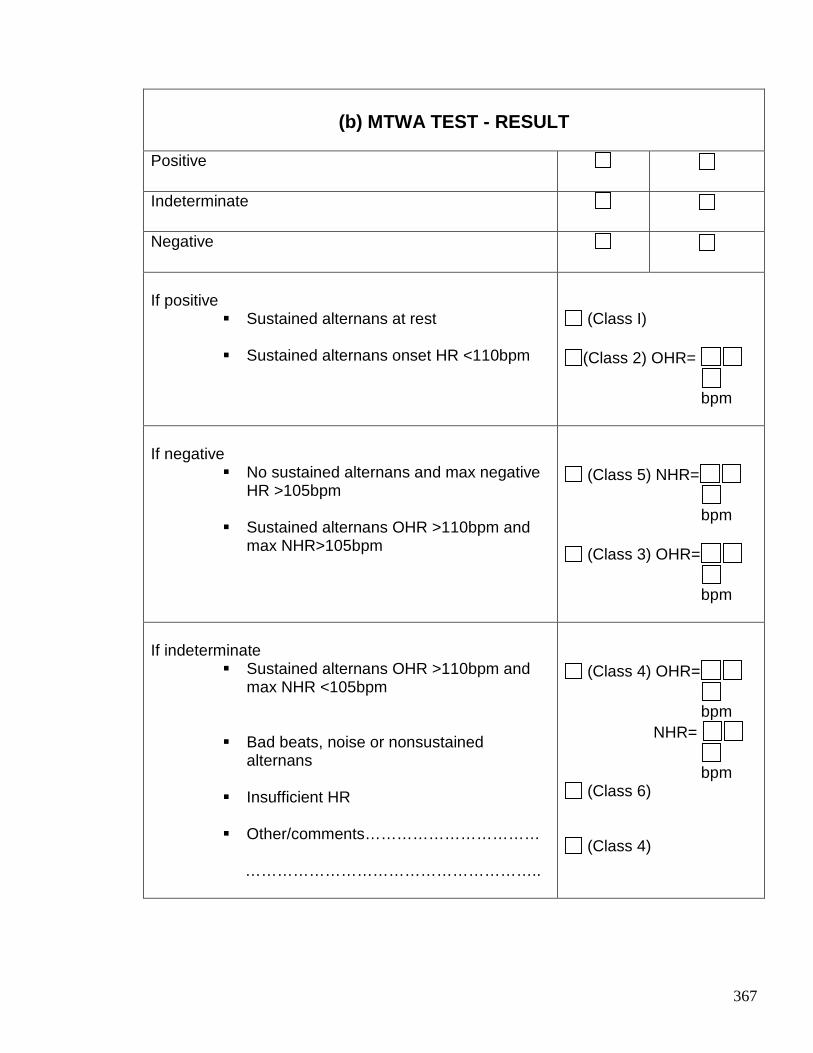
367
(b) MTWA TEST - RESULT
Positive
Indeterminate
Negative
If positive
� Sustained alternans at rest � Sustained alternans onset HR <110bpm
(Class I)
(Class 2) OHR=
bpm
If negative
� No sustained alternans and max negative HR >105bpm
� Sustained alternans OHR >110bpm and
max NHR>105bpm
(Class 5) NHR=
bpm
(Class 3) OHR=
bpm
If indeterminate
� Sustained alternans OHR >110bpm and max NHR <105bpm
� Bad beats, noise or nonsustained
alternans
� Insufficient HR � Other/comments…………………………… ………………………………………………..
(Class 4) OHR=
bpm NHR=
bpm
(Class 6)
(Class 4)
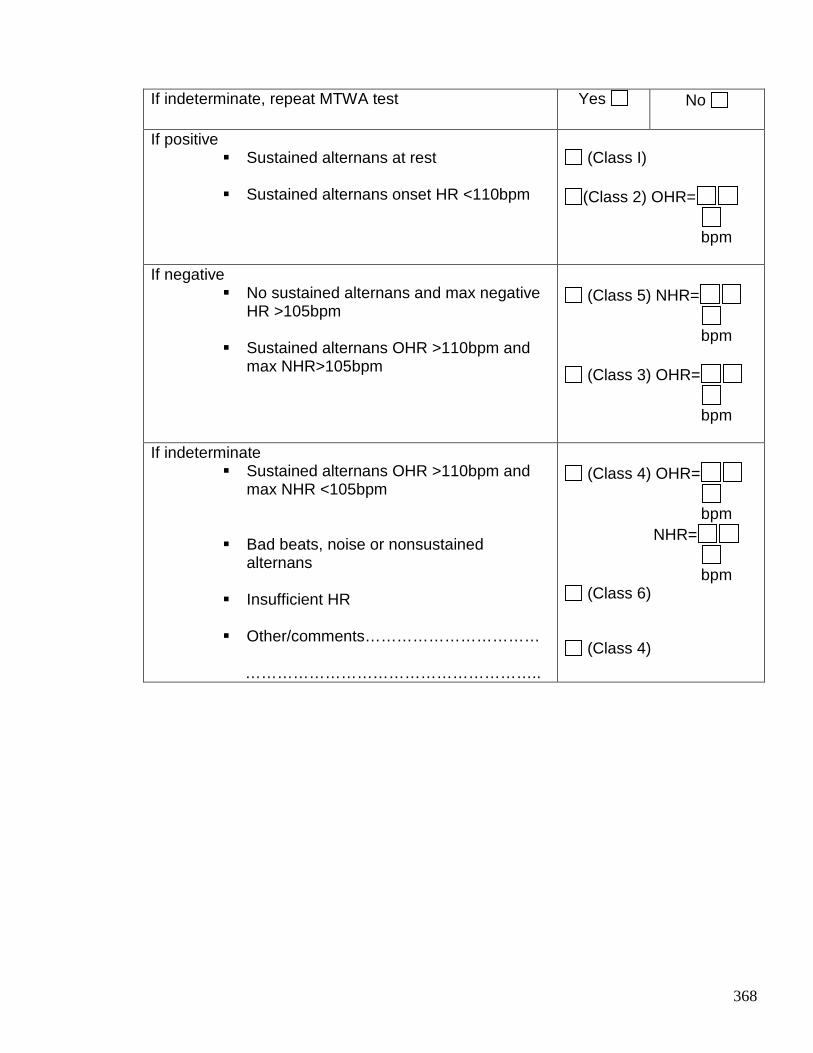
368
If indeterminate, repeat MTWA test Yes
No
If positive � Sustained alternans at rest � Sustained alternans onset HR <110bpm
(Class I)
(Class 2) OHR=
bpm
If negative
� No sustained alternans and max negative HR >105bpm
� Sustained alternans OHR >110bpm and
max NHR>105bpm
(Class 5) NHR=
bpm
(Class 3) OHR=
bpm
If indeterminate
� Sustained alternans OHR >110bpm and max NHR <105bpm
� Bad beats, noise or nonsustained
alternans
� Insufficient HR � Other/comments…………………………… ………………………………………………..
(Class 4) OHR=
bpm
NHR=
bpm (Class 6)
(Class 4)
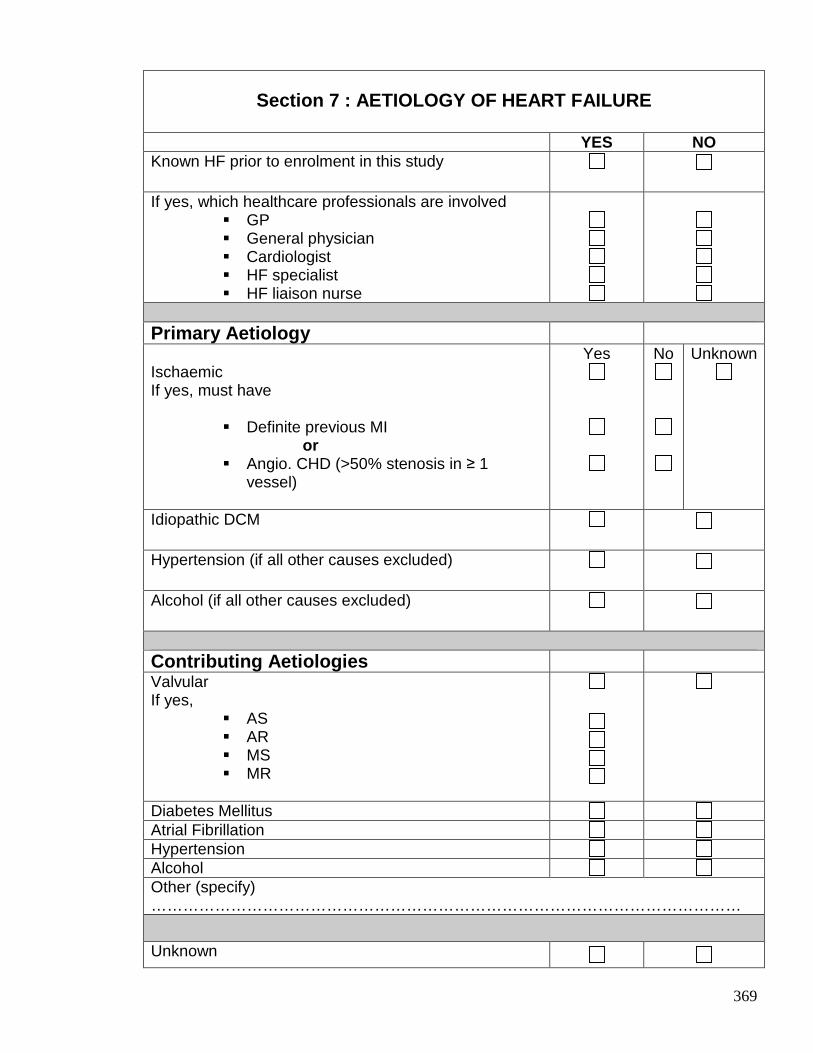
369
Section 7 : AETIOLOGY OF HEART FAILURE
YES NO Known HF prior to enrolment in this study
If yes, which healthcare professionals are involved
� GP � General physician � Cardiologist � HF specialist � HF liaison nurse
Primary Aetiology Ischaemic If yes, must have
� Definite previous MI or � Angio. CHD (>50% stenosis in ≥ 1
vessel)
Yes
No
Unknown
Idiopathic DCM
Hypertension (if all other causes excluded)
Alcohol (if all other causes excluded)
Contributing Aetiologies Valvular If yes,
� AS � AR � MS � MR
Diabetes Mellitus Atrial Fibrillation Hypertension Alcohol Other (specify) …………………………………………………………………………………………………
Unknown
370
Publications containing work undertaken in this thesis
1. Profile of Microvolt T-wave Alternans testing in 1003 patients hospitalised with heart
failure
Jackson CE, Myles RC, Tsorlalis IK, Dalzell JR, Rocchiccioli JP, Spooner RJ, Rodgers JR,
Bezylak V, Greenlaw N, Ford I, Cobbe SM, Petrie MC, McMurray JJV
Submitted to the European Journal of Heart Failure, September 2011
2. Red cell distribution width has incremental prognostic value to B-type natriuretic peptide in
acute heart failure
Jackson CE, Dalzell JR, Bezylak V, Tsorlalis IK, Myles RC, Spooner R, Ford I, Petrie MC,
Cobbe SM, McMurray JJV.
European Journal of Heart Failure 2009; 11 (12): 1152-54
3. Is Microvolt T-Wave Alternans the Answer to Risk Stratification in Heart Failure?
Myles RC, Jackson CE, Tsorlalis I, Petrie MC, McMurray JJV, Cobbe SM.
Circulation 2007; 116: 2984-2991
Presentations to Learned Societies
1. The novel biomarker red cell distribution width (RDW) has prognostic information to B-
type natriuretic peptide (BNP) in patients with acute decompensated heart failure.
Jackson CE, Bezylak V, Dalzell JR, Tsorlalis IK, Myles RC, Spooner R, Ford I, Petrie MC,
Cobbe SM, McMurray JJV.
Oral presentation – European Society of Cardiology Annual Congress, Barcelona, 2009
European Heart Journal 2009; 30:14
371
2. Multimarker laboratory testing in acute decompensated heart failure – how much prognostic
information do novel biomarkers BNP, troponin and CRP provide in addition to routine
laboratory tests?
Jackson CE, Bezylak V, Dalzell JR, Tsorlalis IK, Myles RC, Spooner R, Ford I, Petrie MC,
Cobbe SM, McMurray JJV
European Society of Cardiology Annual Congress, Barcelona, September 2009
European Heart Journal 2009; 30: 711
3. The incremental prognostic value of sub-negative troponin I levels in patients hospitalised
with decompensated heart failure
Jackson CE, Austin D, Dalzell JR, Tsorlalis IK, Myles RC, Rodgers J, Spooner R, Petrie MC,
Cobbe SM, McMurray JJV
British Cardiovascular Society Annual Conference, London, June 2009
Heart 2009; 95 (Supplement I): A53-4
4. Do very low concentrations of troponin I, below the range reported as being negative,
improve risk stratification of patients hospitalised with decompensated heart failure?
Jackson CE, Austin D, Dalzell JR, Tsorlalis IK, Myles RC, Rodgers J, Spooner R, Petrie MC,
Cobbe SM, McMurray JJV
European Society of Cardiology Annual Congress, Munich, September 2008.
European Heart Journal 2008; 29 (Suppl 51): 521
5. Does troponin I provide additional prognostic information to B-type natriuretic peptide in
patients hospitalised with decompensated heart failure?
Jackson CE, Tsorlalis IK, Austin D, Myles RC, Rodgers J, Spooner R, Petrie MC, Cobbe SM,
McMurray JJV
European Society of Cardiology - Heart Failure Congress, Milan, June 2008,
European Journal of Heart Failure 2008; 7 (Supplement I): 4
372
6. Does blood urea concentration predict early mortality in patients hospitalised with
decompensated heart failure better than estimated glomerular filtration rate (eGFR)?
Jackson CE, Austin D, Tsorlalis IK, Dalzell JR, Myles RC, Rodgers J, Spooner R, Petrie MC,
Cobbe SM, McMurray JJV
European Society of Cardiology - Heart Failure Congress, Milan, June 2008
European Journal of Heart Failure 2008; 7 (Supplement I): 103
7. Blood urea concentration as a predictor of early mortality in patients hospitalised with
decompensated heart failure
Jackson CE, Austin D, Tsorlalis IK, Dalzell JR, Myles RC, Rodgers J, Spooner R, Petrie MC,
Cobbe SM, McMurray JJV
British Cardiovascular Society Annual Conference, Manchester, June 2008
Heart 2008; 94 (Supplement II): A107
8. Elevated Troponin I and B-type natriuretic peptide in combination is a powerful predictor of
outcome in patients hospitalised with decompensated heart failure
Jackson CE, Tsorlalis IK, Gardner RS, Austin D, Myles RC, Rodgers J, Stewart N, Spooner
R, Petrie MC, Cobbe SM, McMurray JJV
British Society of Heart Failure, London, November 2007
9. Does Troponin I provide additional prognostic information to B-type natriuretic peptide in
patients hospitalised with decompensated heart failure?
Jackson CE, Tsorlalis IK, Austin D, Myles RC, Rodgers J, Stewart N, Spooner R, Petrie MC,
Cobbe SM, McMurray JJV
Scottish Society for Experimental Medicine, Glasgow, November 2007
373
Reference List
(1) Dickstein K, Cohen-Solal A, Filippatos G, McMurray JJ, Ponikowski P, Poole-Wilson PA et al. ESC guidelines for the diagnosis and treatment of acute and chronic heart failure 2008: the Task Force for the diagnosis and treatment of acute and chronic heart failure 2008 of the European Society of Cardiology. Developed in collaboration with the Heart Failure Association of the ESC (HFA) and endorsed by the European Society of Intensive Care Medicine (ESICM). Eur J Heart Fail 2008; 10(10):933-989.
(2) Mosterd A, Hoes AW. Clinical epidemiology of heart failure. Heart 2007; 93(9):1137-1146.
(3) Cowie MR, Wood DA, Coats AJ, Thompson SG, Poole-Wilson PA, Suresh V et al. Incidence and aetiology of heart failure; a population-based study. Eur Heart J 1999; 20(6):421-428.
(4) Berry C, Murdoch DR, McMurray JJ. Economics of chronic heart failure. Eur J Heart Fail 2001; 3(3):283-291.
(5) Hunt SA, Abraham WT, Chin MH, Feldman AM, Francis GS, Ganiats TG et al. 2009 Focused update incorporated into the ACC/AHA 2005 Guidelines for the Diagnosis and Management of Heart Failure in Adults A Report of the American College of Cardiology Foundation/American Heart Association Task Force on Practice Guidelines Developed in Collaboration With the International Society for Heart and Lung Transplantation. J Am Coll Cardiol 2009; 53(15):e1-e90.
(6) McMurray JJ, Stewart S. Epidemiology, aetiology, and prognosis of heart failure. Heart 2000; 83(5):596-602.
(7) Elliott P, Andersson B, Arbustini E, Bilinska Z, Cecchi F, Charron P et al. Classification of the cardiomyopathies: a position statement from the European Society Of Cardiology Working Group on Myocardial and Pericardial Diseases. Eur Heart J 2008; 29(2):270-276.
(8) Fox KF, Cowie MR, Wood DA, Coats AJ, Gibbs JS, Underwood SR et al. Coronary artery disease as the cause of incident heart failure in the population. Eur Heart J 2001; 22(3):228-236.
(9) Kalinowski L, Dobrucki IT, Malinski T. Race-specific differences in endothelial function: predisposition of African Americans to vascular diseases. Circulation 2004; 109(21):2511-2517.
(10) Cubillos-Garzon LA, Casas JP, Morillo CA, Bautista LE. Congestive heart failure in Latin America: the next epidemic. Am Heart J 2004; 147(3):412-417.
(11) Cowie MR, Mosterd A, Wood DA, Deckers JW, Poole-Wilson PA, Sutton GC et al. The epidemiology of heart failure. Eur Heart J 1997; 18(2):208-225.
374
(12) Kannel WB, Ho K, Thom T. Changing epidemiological features of cardiac failure. Br Heart J 1994; 72(2 Suppl):S3-S9.
(13) Velagaleti RS, Pencina MJ, Murabito JM, Wang TJ, Parikh NI, D'Agostino RB et al. Long-term trends in the incidence of heart failure after myocardial infarction. Circulation 2008; 118(20):2057-2062.
(14) Furberg CD, Yusuf S. Effect of drug therapy on survival in chronic heart failure. Adv Cardiol 1986; 34:124-130.
(15) Yusuf S, Pfeffer MA, Swedberg K, Granger CB, Held P, McMurray JJ et al. Effects of candesartan in patients with chronic heart failure and preserved left-ventricular ejection fraction: the CHARM-Preserved Trial. Lancet 2003; 362(9386):777-781.
(16) Cleland JG, Tendera M, Adamus J, Freemantle N, Polonski L, Taylor J. The perindopril in elderly people with chronic heart failure (PEP-CHF) study. Eur Heart J 2006; 27(19):2338-2345.
(17) Massie BM, Carson PE, McMurray JJ, Komajda M, McKelvie R, Zile MR et al. Irbesartan in patients with heart failure and preserved ejection fraction. N Engl J Med 2008; 359(23):2456-2467.
(18) Paulus WJ, Tschope C, Sanderson JE, Rusconi C, Flachskampf FA, Rademakers FE et al. How to diagnose diastolic heart failure: a consensus statement on the diagnosis of heart failure with normal left ventricular ejection fraction by the Heart Failure and Echocardiography Associations of the European Society of Cardiology. Eur Heart J 2007; 28(20):2539-2550.
(19) Bhatia RS, Tu JV, Lee DS, Austin PC, Fang J, Haouzi A et al. Outcome of heart failure with preserved ejection fraction in a population-based study. N Engl J Med 2006; 355(3):260-269.
(20) Bursi F, Weston SA, Redfield MM, Jacobsen SJ, Pakhomov S, Nkomo VT et al. Systolic and diastolic heart failure in the community. JAMA 2006; 296(18):2209-2216.
(21) Cleland JG, Swedberg K, Follath F, Komajda M, Cohen-Solal A, Aguilar JC et al. The EuroHeart Failure survey programme-- a survey on the quality of care among patients with heart failure in Europe. Part 1: patient characteristics and diagnosis. Eur Heart J 2003; 24(5):442-463.
(22) Hogg K, Swedberg K, McMurray J. Heart failure with preserved left ventricular systolic function; epidemiology, clinical characteristics, and prognosis. J Am Coll Cardiol 2004; 43(3):317-327.
(23) Owan TE, Hodge DO, Herges RM, Jacobsen SJ, Roger VL, Redfield MM. Trends in prevalence and outcome of heart failure with preserved ejection fraction. N Engl J Med 2006; 355(3):251-259.
(24) Masoudi FA, Havranek EP, Smith G, Fish RH, Steiner JF, Ordin DL et al. Gender, age, and heart failure with preserved left ventricular systolic function. J Am Coll Cardiol 2003; 41(2):217-223.
375
(25) KJ Hogg. Clinical characteristics of patients with heart failure and preserved left ventricular systolic function: A descriptive cohort study. University of Glasgow, 2006.
(26) Effects of enalapril on mortality in severe congestive heart failure. Results of the Cooperative North Scandinavian Enalapril Survival Study (CONSENSUS). The CONSENSUS Trial Study Group. N Engl J Med 1987; 316(23):1429-1435.
(27) Effect of enalapril on survival in patients with reduced left ventricular ejection fractions and congestive heart failure. The SOLVD Investigators. N Engl J Med 1991; 325(5):293-302.
(28) Granger CB, McMurray JJ, Yusuf S, Held P, Michelson EL, Olofsson B et al. Effects of candesartan in patients with chronic heart failure and reduced left-ventricular systolic function intolerant to angiotensin-converting-enzyme inhibitors: the CHARM-Alternative trial. Lancet 2003; 362(9386):772-776.
(29) The Cardiac Insufficiency Bisoprolol Study II (CIBIS-II): a randomised trial. Lancet 1999; 353(9146):9-13.
(30) Effect of metoprolol CR/XL in chronic heart failure: Metoprolol CR/XL Randomised Intervention Trial in Congestive Heart Failure (MERIT-HF). Lancet 1999; 353(9169):2001-2007.
(31) Packer M, Fowler MB, Roecker EB, Coats AJ, Katus HA, Krum H et al. Effect of carvedilol on the morbidity of patients with severe chronic heart failure: results of the carvedilol prospective randomized cumulative survival (COPERNICUS) study. Circulation 2002; 106(17):2194-2199.
(32) Pitt B, Zannad F, Remme WJ, Cody R, Castaigne A, Perez A et al. The effect of spironolactone on morbidity and mortality in patients with severe heart failure. Randomized Aldactone Evaluation Study Investigators. N Engl J Med 1999; 341(10):709-717.
(33) Zannad F, McMurray JJ, Krum H, van Veldhuisen DJ, Swedberg K, Shi H et al. Eplerenone in patients with systolic heart failure and mild symptoms. N Engl J Med 2011; 364(1):11-21.
(34) Moss AJ, Hall WJ, Cannom DS, Daubert JP, Higgins SL, Klein H et al. Improved survival with an implanted defibrillator in patients with coronary disease at high risk for ventricular arrhythmia. Multicenter Automatic Defibrillator Implantation Trial Investigators. N Engl J Med 1996; 335(26):1933-1940.
(35) Buxton AE, Lee KL, Fisher JD, Josephson ME, Prystowsky EN, Hafley G. A randomized study of the prevention of sudden death in patients with coronary artery disease. Multicenter Unsustained Tachycardia Trial Investigators. N Engl J Med 1999; 341(25):1882-1890.
(36) Moss AJ, Zareba W, Hall WJ, Klein H, Wilber DJ, Cannom DS et al. Prophylactic implantation of a defibrillator in patients with myocardial infarction and reduced ejection fraction. N Engl J Med 2002; 346(12):877-883.
376
(37) Bardy GH, Lee KL, Mark DB, Poole JE, Packer DL, Boineau R et al. Amiodarone or an implantable cardioverter-defibrillator for congestive heart failure. N Engl J Med 2005; 352(3):225-237.
(38) Cleland JG, Daubert JC, Erdmann E, Freemantle N, Gras D, Kappenberger L et al. The effect of cardiac resynchronization on morbidity and mortality in heart failure. N Engl J Med 2005; 352(15):1539-1549.
(39) Bristow MR, Saxon LA, Boehmer J, Krueger S, Kass DA, De Marco T et al. Cardiac-resynchronization therapy with or without an implantable defibrillator in advanced chronic heart failure. N Engl J Med 2004; 350(21):2140-2150.
(40) Moss AJ, Hall WJ, Cannom DS, Klein H, Brown MW, Daubert JP et al. Cardiac-resynchronization therapy for the prevention of heart-failure events. N Engl J Med 2009; 361(14):1329-1338.
(41) Tang AS, Wells GA, Talajic M, Arnold MO, Sheldon R, Connolly S et al. Cardiac-resynchronization therapy for mild-to-moderate heart failure. N Engl J Med 2010; 363(25):2385-2395.
(42) Velazquez EJ, Lee KL, Deja MA, Jain A, Sopko G, Marchenko A et al. Coronary-artery bypass surgery in patients with left ventricular dysfunction. N Engl J Med 2011; 364(17):1607-1616.
(43) Trial of Aldosterone Antagonist Therapy in Adults With Preserved Ejection Fraction Congestive Heart Failure (TOPCAT) www.clinicaltrials.gov/ct2/show/NCT0094302. 2011.
Ref Type: Internet Communication
(44) Stewart S, MacIntyre K, Hole DJ, Capewell S, McMurray JJ. More 'malignant' than cancer? Five-year survival following a first admission for heart failure. Eur J Heart Fail 2001; 3(3):315-322.
(45) Yamokoski LM, Hasselblad V, Moser DK, Binanay C, Conway GA, Glotzer JM et al. Prediction of rehospitalization and death in severe heart failure by physicians and nurses of the ESCAPE trial. J Card Fail 2007; 13(1):8-13.
(46) Sudoh T, Kangawa K, Minamino N, Matsuo H. A new natriuretic peptide in porcine brain. Nature 1988; 332(6159):78-81.
(47) McDonagh TA, Robb SD, Murdoch DR, Morton JJ, Ford I, Morrison CE et al. Biochemical detection of left-ventricular systolic dysfunction. Lancet 1998; 351(9095):9-13.
(48) Tsutamoto T, Wada A, Maeda K, Hisanaga T, Mabuchi N, Hayashi M et al. Plasma brain natriuretic peptide level as a biochemical marker of morbidity and mortality in patients with asymptomatic or minimally symptomatic left ventricular dysfunction. Comparison with plasma angiotensin II and endothelin-1. Eur Heart J 1999; 20(24):1799-1807.
377
(49) Hulsmann M, Berger R, Sturm B, Bojic A, Woloszczuk W, Bergler-Klein J et al. Prediction of outcome by neurohumoral activation, the six-minute walk test and the Minnesota Living with Heart Failure Questionnaire in an outpatient cohort with congestive heart failure. Eur Heart J 2002; 23(11):886-891.
(50) Koglin J, Pehlivanli S, Schwaiblmair M, Vogeser M, Cremer P, vonScheidt W. Role of brain natriuretic peptide in risk stratification of patients with congestive heart failure. J Am Coll Cardiol 2001; 38(7):1934-1941.
(51) Gardner RS, Ozalp F, Murday AJ, Robb SD, McDonagh TA. N-terminal pro-brain natriuretic peptide. A new gold standard in predicting mortality in patients with advanced heart failure. Eur Heart J 2003; 24(19):1735-1743.
(52) Anand IS, Fisher LD, Chiang YT, Latini R, Masson S, Maggioni AP et al. Changes in brain natriuretic peptide and norepinephrine over time and mortality and morbidity in the Valsartan Heart Failure Trial (Val-HeFT). Circulation 2003; 107(9):1278-1283.
(53) Berger R, Huelsman M, Strecker K, Bojic A, Moser P, Stanek B et al. B-type natriuretic peptide predicts sudden death in patients with chronic heart failure. Circulation 2002; 105(20):2392-2397.
(54) Dao Q, Krishnaswamy P, Kazanegra R, Harrison A, Amirnovin R, Lenert L et al. Utility of B-type natriuretic peptide in the diagnosis of congestive heart failure in an urgent-care setting. J Am Coll Cardiol 2001; 37(2):379-385.
(55) Maisel AS, Krishnaswamy P, Nowak RM, McCord J, Hollander JE, Duc P et al. Rapid measurement of B-type natriuretic peptide in the emergency diagnosis of heart failure. N Engl J Med 2002; 347(3):161-167.
(56) Lainchbury JG, Campbell E, Frampton CM, Yandle TG, Nicholls MG, Richards AM. Brain natriuretic peptide and n-terminal brain natriuretic peptide in the diagnosis of heart failure in patients with acute shortness of breath. J Am Coll Cardiol 2003; 42(4):728-735.
(57) Yu CM, Sanderson JE. Plasma brain natriuretic peptide--an independent predictor of cardiovascular mortality in acute heart failure. Eur J Heart Fail 1999; 1(1):59-65.
(58) Cheng V, Kazanagra R, Garcia A, Lenert L, Krishnaswamy P, Gardetto N et al. A rapid bedside test for B-type peptide predicts treatment outcomes in patients admitted for decompensated heart failure: a pilot study. J Am Coll Cardiol 2001; 37(2):386-391.
(59) Logeart D, Thabut G, Jourdain P, Chavelas C, Beyne P, Beauvais F et al. Predischarge B-type natriuretic peptide assay for identifying patients at high risk of re-admission after decompensated heart failure. J Am Coll Cardiol 2004; 43(4):635-641.
(60) Takeda S, Yamashita A, Maeda K, Maeda Y. Structure of the core domain of human cardiac troponin in the Ca(2+)-saturated form. Nature 2003; 424(6944):35-41.
(61) Thygesen K, Alpert JS, White HD, Jaffe AS, Apple FS, Galvani M et al. Universal definition of myocardial infarction. Circulation 2007; 116(22):2634-2653.
378
(62) Heeschen C, Hamm CW, Goldmann B, Deu A, Langenbrink L, White HD. Troponin concentrations for stratification of patients with acute coronary syndromes in relation to therapeutic efficacy of tirofiban. PRISM Study Investigators. Platelet Receptor Inhibition in Ischemic Syndrome Management. Lancet 1999; 354(9192):1757-1762.
(63) Morrow DA, Antman EM, Tanasijevic M, Rifai N, de Lemos JA, McCabe CH et al. Cardiac troponin I for stratification of early outcomes and the efficacy of enoxaparin in unstable angina: a TIMI-11B substudy. J Am Coll Cardiol 2000; 36(6):1812-1817.
(64) Morrow DA, Cannon CP, Rifai N, Frey MJ, Vicari R, Lakkis N et al. Ability of minor elevations of troponins I and T to predict benefit from an early invasive strategy in patients with unstable angina and non-ST elevation myocardial infarction: results from a randomized trial. JAMA 2001; 286(19):2405-2412.
(65) Capasso JM, Malhotra A, Li P, Zhang X, Scheuer J, Anversa P. Chronic nonocclusive coronary artery constriction impairs ventricular function, myocardial structure, and cardiac contractile protein enzyme activity in rats. Circ Res 1992; 70(1):148-162.
(66) Clarke MS, Caldwell RW, Chiao H, Miyake K, McNeil PL. Contraction-induced cell wounding and release of fibroblast growth factor in heart. Circ Res 1995; 76(6):927-934.
(67) Kaye D, Pimental D, Prasad S, Maki T, Berger HJ, McNeil PL et al. Role of transiently altered sarcolemmal membrane permeability and basic fibroblast growth factor release in the hypertrophic response of adult rat ventricular myocytes to increased mechanical activity in vitro. J Clin Invest 1996; 97(2):281-291.
(68) Page E, Upshaw-Earley J, Goings G. Permeability of rat atrial endocardium, epicardium, and myocardium to large molecules. Stretch-dependent effects. Circ Res 1992; 71(1):159-173.
(69) Perna ER, Macin SM, Cimbaro Canella JP, Alvarenga PM, Pantich RE, Rios NG et al. High levels of troponin T are associated with ventricular remodeling and adverse in-hospital outcome in heart failure. Med Sci Monit 2004; 10(3):CR90-CR95.
(70) Nishio Y, Sato Y, Taniguchi R, Shizuta S, Doi T, Morimoto T et al. Cardiac troponin T vs other biochemical markers in patients with congestive heart failure. Circ J 2007; 71(5):631-635.
(71) Horwich TB, Patel J, MacLellan WR, Fonarow GC. Cardiac troponin I is associated with impaired hemodynamics, progressive left ventricular dysfunction, and increased mortality rates in advanced heart failure. Circulation 2003; 108(7):833-838.
(72) Hudson MP, O'Connor CM, Gattis WA, Tasissa G, Hasselblad V, Holleman CM et al. Implications of elevated cardiac troponin T in ambulatory patients with heart failure: a prospective analysis. Am Heart J 2004; 147(3):546-552.
(73) Latini R, Masson S, Anand IS, Missov E, Carlson M, Vago T et al. Prognostic value of very low plasma concentrations of troponin T in patients with stable chronic heart failure. Circulation 2007; 116(11):1242-1249.
379
(74) Missov E, Calzolari C, Pau B. Circulating cardiac troponin I in severe congestive heart failure. Circulation 1997; 96(9):2953-2958.
(75) Yin WH, Chen JW, Feng AN, Lin SJ, Young S. Multimarker approach to risk stratification among patients with advanced chronic heart failure. Clin Cardiol 2007; 30(8):397-402.
(76) Vazquez R, Bayes-Genis A, Cygankiewicz I, Pascual-Figal D, Grigorian-Shamagian L, Pavon R et al. The MUSIC Risk score: a simple method for predicting mortality in ambulatory patients with chronic heart failure. Eur Heart J 2009; 30(9):1088-1096.
(77) Ishii J, Nomura M, Nakamura Y, Naruse H, Mori Y, Ishikawa T et al. Risk stratification using a combination of cardiac troponin T and brain natriuretic peptide in patients hospitalized for worsening chronic heart failure. Am J Cardiol 2002; 89(6):691-695.
(78) Gheorghiade M, Gattis SW, Adams KF, Jr., Jaffe AS, Hasselblad V, O'Connor CM. The Pilot Randomized Study of Nesiritide Versus Dobutamine in Heart Failure (PRESERVD-HF). Am J Cardiol 2005; 96(6A):18G-25G.
(79) You JJ, Austin PC, Alter DA, Ko DT, Tu JV. Relation between cardiac troponin I and mortality in acute decompensated heart failure. Am Heart J 2007; 153(4):462-470.
(80) Shah MR, Hasselblad V, Tasissa G, Christenson RH, Binanay C, O'Connor CM et al. Rapid assay brain natriuretic peptide and troponin I in patients hospitalized with decompensated heart failure (from the Evaluation Study of Congestive Heart Failure and Pulmonary Artery Catheterization Effectiveness Trial). Am J Cardiol 2007; 100(9):1427-1433.
(81) Metra M, Nodari S, Parrinello G, Specchia C, Brentana L, Rocca P et al. The role of plasma biomarkers in acute heart failure. Serial changes and independent prognostic value of NT-proBNP and cardiac troponin-T. Eur J Heart Fail 2007; 9(8):776-786.
(82) Sakhuja R, Green S, Oestreicher EM, Sluss PM, Lee-Lewandrowski E, Lewandrowski KB et al. Amino-terminal pro-brain natriuretic peptide, brain natriuretic peptide, and troponin T for prediction of mortality in acute heart failure. Clin Chem 2007; 53(3):412-420.
(83) Scottish Intercollegiate Guidelines Network (SIGN). www.sign.ac.uk. 2011. Ref Type: Internet Communication
(84) National Institute for Health and Clinical Excellence (NICE) www.nice.org.uk. 2011. Ref Type: Internet Communication
(85) Bloomfield DM, Steinman RC, Namerow PB, Parides M, Davidenko J, Kaufman ES et al. Microvolt T-wave alternans distinguishes between patients likely and patients not likely to benefit from implanted cardiac defibrillator therapy: a solution to the Multicenter Automatic Defibrillator Implantation Trial (MADIT) II conundrum. Circulation 2004; 110(14):1885-1889.
380
(86) Teerlink JR, Jalaluddin M, Anderson S, Kukin ML, Eichhorn EJ, Francis G et al. Ambulatory ventricular arrhythmias in patients with heart failure do not specifically predict an increased risk of sudden death. PROMISE (Prospective Randomized Milrinone Survival Evaluation) Investigators. Circulation 2000; 101(1):40-46.
(87) Pathak A, Curnier D, Fourcade J, Roncalli J, Stein PK, Hermant P et al. QT dynamicity: a prognostic factor for sudden cardiac death in chronic heart failure. Eur J Heart Fail 2005; 7(2):269-275.
(88) Huikuri HV, Castellanos A, Myerburg RJ. Sudden death due to cardiac arrhythmias. N Engl J Med 2001; 345(20):1473-1482.
(89) Lin YH, Lin C, Lo MT, Lin HJ, Wu YW, Hsu RB et al. The relationship between aminoterminal propeptide of type III procollagen and heart rate variability parameters in heart failure patients: a potential serum marker to evaluate cardiac autonomic control and sudden cardiac death. Clin Chem Lab Med 2010; 48(12):1821-1827.
(90) Boogers MJ, Fukushima K, Bengel FM, Bax JJ. The role of nuclear imaging in the failing heart: myocardial blood flow, sympathetic innervation, and future applications. Heart Fail Rev 2011; 16(4):411-423.
(91) Pastore JM, Girouard SD, Laurita KR, Akar FG, Rosenbaum DS. Mechanism linking T-wave alternans to the genesis of cardiac fibrillation. Circulation 1999; 99(10):1385-1394.
(92) Myles RC, Burton FL, Cobbe SM, Smith GL. The link between repolarisation alternans and ventricular arrhythmia: does the cellular phenomenon extend to the clinical problem? J Mol Cell Cardiol 2008; 45(1):1-10.
(93) Rosenbaum DS, Jackson LE, Smith JM, Garan H, Ruskin JN, Cohen RJ. Electrical alternans and vulnerability to ventricular arrhythmias. N Engl J Med 1994; 330(4):235-241.
(94) Cox V, Patel M, Kim J, Liu T, Sivaraman G, Narayan SM. Predicting arrhythmia-free survival using spectral and modified-moving average analyses of T-wave alternans. Pacing Clin Electrophysiol 2007; 30(3):352-358.
(95) Nieminen T, Lehtimaki T, Viik J, Lehtinen R, Nikus K, Koobi T et al. T-wave alternans predicts mortality in a population undergoing a clinically indicated exercise test. Eur Heart J 2007; 28(19):2332-2337.
(96) Exner DV, Kavanagh KM, Slawnych MP, Mitchell LB, Ramadan D, Aggarwal SG et al. Noninvasive risk assessment early after a myocardial infarction the REFINE study. J Am Coll Cardiol 2007; 50(24):2275-2284.
(97) Verrier RL, Nearing BD, La Rovere MT, Pinna GD, Mittleman MA, Bigger JT, Jr. et al. Ambulatory electrocardiogram-based tracking of T wave alternans in postmyocardial infarction patients to assess risk of cardiac arrest or arrhythmic death. J Cardiovasc Electrophysiol 2003; 14(7):705-711.
381
(98) Gold MR, Bloomfield DM, Anderson KP, El Sherif NE, Wilber DJ, Groh WJ et al. A comparison of T-wave alternans, signal averaged electrocardiography and programmed ventricular stimulation for arrhythmia risk stratification. J Am Coll Cardiol 2000; 36(7):2247-2253.
(99) Ikeda T, Saito H, Tanno K, Shimizu H, Watanabe J, Ohnishi Y et al. T-wave alternans as a predictor for sudden cardiac death after myocardial infarction. Am J Cardiol 2002; 89(1):79-82.
(100) Schwab JO, Weber S, Schmitt H, Steen-Mueller MK, Coch M, Tillmanns H et al. Incidence of T wave alternation after acute myocardial infarction and correlation with other prognostic parameters: results of a prospective study. Pacing Clin Electrophysiol 2001; 24(6):957-961.
(101) Tapanainen JM, Still AM, Airaksinen KE, Huikuri HV. Prognostic significance of risk stratifiers of mortality, including T wave alternans, after acute myocardial infarction: results of a prospective follow-up study. J Cardiovasc Electrophysiol 2001; 12(6):645-652.
(102) Ikeda T, Yoshino H, Sugi K, Tanno K, Shimizu H, Watanabe J et al. Predictive value of microvolt T-wave alternans for sudden cardiac death in patients with preserved cardiac function after acute myocardial infarction: results of a collaborative cohort study. J Am Coll Cardiol 2006; 48(11):2268-2274.
(103) Hohnloser SH, Ikeda T, Bloomfield DM, Dabbous OH, Cohen RJ. T-wave alternans negative coronary patients with low ejection and benefit from defibrillator implantation. Lancet 2003; 362(9378):125-126.
(104) Chow T, Kereiakes DJ, Onufer J, Woelfel A, Gursoy S, Peterson BJ et al. Does microvolt T-wave alternans testing predict ventricular tachyarrhythmias in patients with ischemic cardiomyopathy and prophylactic defibrillators? The MASTER (Microvolt T Wave Alternans Testing for Risk Stratification of Post-Myocardial Infarction Patients) trial. J Am Coll Cardiol 2008; 52(20):1607-1615.
(105) Huikuri HV, Raatikainen MJ, Moerch-Joergensen R, Hartikainen J, Virtanen V, Boland J et al. Prediction of fatal or near-fatal cardiac arrhythmia events in patients with depressed left ventricular function after an acute myocardial infarction. Eur Heart J 2009; 30(6):689-698.
(106) Rashba EJ, Osman AF, Macmurdy K, Kirk MM, Sarang SE, Peters RW et al. Enhanced detection of arrhythmia vulnerability using T wave alternans, left ventricular ejection fraction, and programmed ventricular stimulation: a prospective study in subjects with chronic ischemic heart disease. J Cardiovasc Electrophysiol 2004; 15(2):170-176.
(107) Chow T, Kereiakes DJ, Bartone C, Booth T, Schloss EJ, Waller T et al. Prognostic utility of microvolt T-wave alternans in risk stratification of patients with ischemic cardiomyopathy. J Am Coll Cardiol 2006; 47(9):1820-1827.
(108) Costantini O, Hohnloser SH, Kirk MM, Lerman BB, Baker JH, Sethuraman B et al. The ABCD (Alternans Before Cardioverter Defibrillator) Trial: strategies using T-
382
wave alternans to improve efficiency of sudden cardiac death prevention. J Am Coll Cardiol 2009; 53(6):471-479.
(109) Bloomfield DM, Bigger JT, Steinman RC, Namerow PB, Parides MK, Curtis AB et al. Microvolt T-wave alternans and the risk of death or sustained ventricular arrhythmias in patients with left ventricular dysfunction. J Am Coll Cardiol 2006; 47(2):456-463.
(110) Cantillon DJ, Stein KM, Markowitz SM, Mittal S, Shah BK, Morin DP et al. Predictive value of microvolt T-wave alternans in patients with left ventricular dysfunction. J Am Coll Cardiol 2007; 50(2):166-173.
(111) Kitamura H, Ohnishi Y, Okajima K, Ishida A, Galeano E, Adachi K et al. Onset heart rate of microvolt-level T-wave alternans provides clinical and prognostic value in nonischemic dilated cardiomyopathy. J Am Coll Cardiol 2002; 39(2):295-300.
(112) Hohnloser SH, Klingenheben T, Bloomfield D, Dabbous O, Cohen RJ. Usefulness of microvolt T-wave alternans for prediction of ventricular tachyarrhythmic events in patients with dilated cardiomyopathy: results from a prospective observational study. J Am Coll Cardiol 2003; 41(12):2220-2224.
(113) Grimm W, Christ M, Bach J, Muller HH, Maisch B. Noninvasive arrhythmia risk stratification in idiopathic dilated cardiomyopathy: results of the Marburg Cardiomyopathy Study. Circulation 2003; 108(23):2883-2891.
(114) Baravelli M, Salerno-Uriarte D, Guzzetti D, Rossi MC, Zoli L, Forzani T et al. Predictive significance for sudden death of microvolt-level T wave alternans in New York Heart Association class II congestive heart failure patients A prospective study. Int J Cardiol 2005; 105(1):53-57.
(115) Sarzi BS, Vaninetti R, Laporta A, Picozzi A, Pedretti RF. T wave alternans is a predictor of death in patients with congestive heart failure. Int J Cardiol 2004; 93(1):31-38.
(116) Klingenheben T, Zabel M, D'Agostino RB, Cohen RJ, Hohnloser SH. Predictive value of T-wave alternans for arrhythmic events in patients with congestive heart failure. Lancet 2000; 356(9230):651-652.
(117) MacIntyre K, Capewell S, Stewart S, Chalmers JW, Boyd J, Finlayson A et al. Evidence of improving prognosis in heart failure: trends in case fatality in 66 547 patients hospitalized between 1986 and 1995. Circulation 2000; 102(10):1126-1131.
(118) Salerno-Uriarte JA, De Ferrari GM, Klersy C, Pedretti RF, Tritto M, Sallusti L et al. Prognostic value of T-wave alternans in patients with heart failure due to nonischemic cardiomyopathy: results of the ALPHA Study. J Am Coll Cardiol 2007; 50(19):1896-1904.
(119) Gold MR, Ip JH, Costantini O, Poole JE, McNulty S, Mark DB et al. Role of microvolt T-wave alternans in assessment of arrhythmia vulnerability among patients with heart failure and systolic dysfunction: primary results from the T-wave alternans sudden cardiac death in heart failure trial substudy. Circulation 2008; 118(20):2022-2028.
383
(120) Madias JE. Reproducibility of T-wave alternans in congestive heart failure: a theoretical argument. Pacing Clin Electrophysiol 2006; 29(7):800-802.
(121) Pfeffer MA, Swedberg K, Granger CB, Held P, McMurray JJ, Michelson EL et al. Effects of candesartan on mortality and morbidity in patients with chronic heart failure: the CHARM-Overall programme. Lancet 2003; 362(9386):759-766.
(122) Klingenheben T, Gronefeld G, Li YG, Hohnloser SH. Effect of metoprolol and d,l-sotalol on microvolt-level T-wave alternans. Results of a prospective, double-blind, randomized study. J Am Coll Cardiol 2001; 38(7):2013-2019.
(123) Kaufman ES, Bloomfield DM, Steinman RC, Namerow PB, Costantini O, Cohen RJ et al. "Indeterminate" microvolt T-wave alternans tests predict high risk of death or sustained ventricular arrhythmias in patients with left ventricular dysfunction. J Am Coll Cardiol 2006; 48(7):1399-1404.
(124) Chan PS, Bartone C, Booth T, Kereiakes D, Chow T. Prognostic implication of redefining indeterminate microvolt T-wave alternans studies as abnormal or normal. Am Heart J 2007; 153(4):523-529.
(125) Cohen RJ. Enhancing specificity without sacrificing sensitivity: potential benefits of using microvolt T-wave alternans testing to risk stratify the MADIT-II population. Card Electrophysiol Rev 2003; 7(4):438-442.
(126) Pocock SJ, Wang D, Pfeffer MA, Yusuf S, McMurray JJ, Swedberg KB et al. Predictors of mortality and morbidity in patients with chronic heart failure. Eur Heart J 2006; 27(1):65-75.
(127) Rihal CS, Davis KB, Kennedy JW, Gersh BJ. The utility of clinical, electrocardiographic, and roentgenographic variables in the prediction of left ventricular function. Am J Cardiol 1995; 75(4):220-223.
(128) Davie AP, Love MP, McMurray JJ. Value of ECGs in identifying heart failure due to left ventricular systolic dysfunction. BMJ 1996; 313(7052):300-301.
(129) Baldasseroni S, Opasich C, Gorini M, Lucci D, Marchionni N, Marini M et al. Left bundle-branch block is associated with increased 1-year sudden and total mortality rate in 5517 outpatients with congestive heart failure: a report from the Italian network on congestive heart failure. Am Heart J 2002; 143(3):398-405.
(130) Bazett HC. An analysis of the time-relations of electrocardiograms. Heart 1920; 7(4):353-370.
(131) SOKOLOW M, LYON TP. The ventricular complex in left ventricular hypertrophy as obtained by unipolar precordial and limb leads. Am Heart J 1949; 37(2):161-186.
(132) Kearney MT, Fox KA, Lee AJ, Brooksby WP, Shah AM, Flapan A et al. Predicting sudden death in patients with mild to moderate chronic heart failure. Heart 2004; 90(10):1137-1143.
384
(133) Robb SD. An echocardiographic survey of a random sample of the population of North Glasgow aged 55-74 years. University of Glasgow, 2000.
(134) Levey AS, Coresh J, Balk E, Kausz AT, Levin A, Steffes MW et al. National Kidney Foundation practice guidelines for chronic kidney disease: evaluation, classification, and stratification. Ann Intern Med 2003; 139(2):137-147.
(135) Levey AS, Bosch JP, Lewis JB, Greene T, Rogers N, Roth D. A more accurate method to estimate glomerular filtration rate from serum creatinine: a new prediction equation. Modification of Diet in Renal Disease Study Group. Ann Intern Med 1999; 130(6):461-470.
(136) O'Meara E, Chong KS, Gardner RS, Jardine AG, Neilly JB, McDonagh TA. The Modification of Diet in Renal Disease (MDRD) equations provide valid estimations of glomerular filtration rates in patients with advanced heart failure. Eur J Heart Fail 2006; 8(1):63-67.
(137) K/DOQI clinical practice guidelines for chronic kidney disease: evaluation, classification, and stratification. Am J Kidney Dis 2002; 39(2 Suppl 1):S1-266.
(138) Berry C, Norrie J, Hogg K, Brett M, Stevenson K, McMurray JJ. The prevalence, nature, and importance of hematologic abnormalities in heart failure. Am Heart J 2006; 151(6):1313-1321.
(139) Nutritional anaemias. Report of a WHO scientific group. World Health Organ Tech Rep Ser 1968; 405:5-37.
(140) Felker GM, Allen LA, Pocock SJ, Shaw LK, McMurray JJ, Pfeffer MA et al. Red cell distribution width as a novel prognostic marker in heart failure: data from the CHARM Program and the Duke Databank. J Am Coll Cardiol 2007; 50(1):40-47.
(141) Bloomfield DM, Hohnloser SH, Cohen RJ. Interpretation and classification of microvolt T wave alternans tests. J Cardiovasc Electrophysiol 2002; 13(5):502-512.
(142) Allen LA, Felker GM, Pocock S, McMurray JJ, Pfeffer MA, Swedberg K et al. Liver function abnormalities and outcome in patients with chronic heart failure: data from the Candesartan in Heart Failure: Assessment of Reduction in Mortality and Morbidity (CHARM) program. Eur J Heart Fail 2009; 11(2):170-177.
(143) Packer M. Sudden unexpected death in patients with congestive heart failure: a second frontier. Circulation 1985; 72(4):681-685.
(144) Cleland JG, Massie BM, Packer M. Sudden death in heart failure: vascular or electrical? Eur J Heart Fail 1999; 1(1):41-45.
(145) Hinkle LE, Jr., Thaler HT. Clinical classification of cardiac deaths. Circulation 1982; 65(3):457-464.
(146) Hernandez AF, O'Connor CM, Starling RC, Reist CJ, Armstrong PW, Dickstein K et al. Rationale and design of the Acute Study of Clinical Effectiveness of Nesiritide in Decompensated Heart Failure Trial (ASCEND-HF). Am Heart J 2009; 157(2):271-277.
385
(147) Jhund PS, MacIntyre K, Simpson CR, Lewsey JD, Stewart S, Redpath A et al. Long-term trends in first hospitalization for heart failure and subsequent survival between 1986 and 2003: a population study of 5.1 million people. Circulation 2009; 119(4):515-523.
(148) Gheorghiade M, Pang PS. Acute heart failure syndromes. J Am Coll Cardiol 2009; 53(7):557-573.
(149) Rationale and design of a study assessing treatment strategies of atrial fibrillation in patients with heart failure: the Atrial Fibrillation and Congestive Heart Failure (AF-CHF) trial. Am Heart J 2002; 144(4):597-607.
(150) Olsson LG, Swedberg K, Ducharme A, Granger CB, Michelson EL, McMurray JJ et al. Atrial fibrillation and risk of clinical events in chronic heart failure with and without left ventricular systolic dysfunction: results from the Candesartan in Heart failure-Assessment of Reduction in Mortality and morbidity (CHARM) program. J Am Coll Cardiol 2006; 47(10):1997-2004.
(151) Hawkins NM, Wang D, McMurray JJ, Pfeffer MA, Swedberg K, Granger CB et al. Prevalence and prognostic impact of bundle branch block in patients with heart failure: evidence from the CHARM programme. Eur J Heart Fail 2007; 9(5):510-517.
(152) Hawkins NM, Wang D, McMurray JJ, Pfeffer MA, Swedberg K, Granger CB et al. Prevalence and prognostic implications of electrocardiographic left ventricular hypertrophy in heart failure: evidence from the CHARM programme. Heart 2007; 93(1):59-64.
(153) Del Carlo CH, Pereira-Barretto AC, Cassaro-Strunz C, Latorre MR, Ramires JA. Serial measure of cardiac troponin T levels for prediction of clinical events in decompensated heart failure. J Card Fail 2004; 10(1):43-48.
(154) Miller WL, Hartman KA, Burritt MF, Grill DE, Rodeheffer RJ, Burnett JC, Jr. et al. Serial biomarker measurements in ambulatory patients with chronic heart failure: the importance of change over time. Circulation 2007; 116(3):249-257.
(155) McMurray JJ, Carson PE, Komajda M, McKelvie R, Zile MR, Ptaszynska A et al. Heart failure with preserved ejection fraction: clinical characteristics of 4133 patients enrolled in the I-PRESERVE trial. Eur J Heart Fail 2008; 10(2):149-156.
(156) Maisel AS, McCord J, Nowak RM, Hollander JE, Wu AH, Duc P et al. Bedside B-Type natriuretic peptide in the emergency diagnosis of heart failure with reduced or preserved ejection fraction. Results from the Breathing Not Properly Multinational Study. J Am Coll Cardiol 2003; 41(11):2010-2017.
(157) Hjalmarson A, Goldstein S, Fagerberg B, Wedel H, Waagstein F, Kjekshus J et al. Effects of controlled-release metoprolol on total mortality, hospitalizations, and well-being in patients with heart failure: the Metoprolol CR/XL Randomized Intervention Trial in congestive heart failure (MERIT-HF). MERIT-HF Study Group. JAMA 2000; 283(10):1295-1302.
386
(158) Wedel H, McMurray JJ, Lindberg M, Wikstrand J, Cleland JG, Cornel JH et al. Predictors of fatal and non-fatal outcomes in the Controlled Rosuvastatin Multinational Trial in Heart Failure (CORONA): incremental value of apolipoprotein A-1, high-sensitivity C-reactive peptide and N-terminal pro B-type natriuretic peptide. Eur J Heart Fail 2009; 11(3):281-291.
(159) Eagle KA, Lim MJ, Dabbous OH, Pieper KS, Goldberg RJ, Van de WF et al. A validated prediction model for all forms of acute coronary syndrome: estimating the risk of 6-month postdischarge death in an international registry. JAMA 2004; 291(22):2727-2733.
(160) Morrow DA, Antman EM, Charlesworth A, Cairns R, Murphy SA, de Lemos JA et al. TIMI risk score for ST-elevation myocardial infarction: A convenient, bedside, clinical score for risk assessment at presentation: An intravenous nPA for treatment of infarcting myocardium early II trial substudy. Circulation 2000; 102(17):2031-2037.
(161) Levy WC, Mozaffarian D, Linker DT, Sutradhar SC, Anker SD, Cropp AB et al. The Seattle Heart Failure Model: prediction of survival in heart failure. Circulation 2006; 113(11):1424-1433.
(162) Brophy JM, Dagenais GR, McSherry F, Williford W, Yusuf S. A multivariate model for predicting mortality in patients with heart failure and systolic dysfunction. Am J Med 2004; 116(5):300-304.
(163) Lee DS, Austin PC, Rouleau JL, Liu PP, Naimark D, Tu JV. Predicting mortality among patients hospitalized for heart failure: derivation and validation of a clinical model. JAMA 2003; 290(19):2581-2587.
(164) Felker GM, Leimberger JD, Califf RM, Cuffe MS, Massie BM, Adams KF, Jr. et al. Risk stratification after hospitalization for decompensated heart failure. J Card Fail 2004; 10(6):460-466.
(165) Fonarow GC, Adams KF, Jr., Abraham WT, Yancy CW, Boscardin WJ. Risk stratification for in-hospital mortality in acutely decompensated heart failure: classification and regression tree analysis. JAMA 2005; 293(5):572-580.
(166) Aaronson KD, Schwartz JS, Chen TM, Wong KL, Goin JE, Mancini DM. Development and prospective validation of a clinical index to predict survival in ambulatory patients referred for cardiac transplant evaluation. Circulation 1997; 95(12):2660-2667.
(167) Gardner RS, McDonagh TA, MacDonald M, Dargie HJ, Murday AJ, Petrie MC. Who needs a heart transplant? Eur Heart J 2006; 27(7):770-772.
(168) Rothenburger M, Wichter T, Schmid C, Stypmann J, Tjan TD, Berendes E et al. Aminoterminal pro type B natriuretic peptide as a predictive and prognostic marker in patients with chronic heart failure. J Heart Lung Transplant 2004; 23(10):1189-1197.


![VOL. 15, NO. 1 JACKSON BRIGADE QUARTERLY History …hyde/jackson/0611contents2.pdf · VOL. 15, NO. 1 JACKSON BRIGADE QUARTERLY 4 David J. Jackson.] His second wife was Elizabeth Cozad,](https://img.pdfslide.us/doc/110x75/5a892fee7f8b9a9f1b8ec597/vol-15-no-1-jackson-brigade-quarterly-history-hydejackson0611contents2pdfvol.jpg)
![Chéri; roman [par] Colette (Colette Willy) · 2018-07-10 · loaeaiiion colette chÉri tioman paris ahthÈmt:favaiujk'ïc-,Éditeurs ih20,rijkdusaint-gotharu](https://img.pdfslide.us/doc/110x75/5e5445d984d0055bf466a4b1/chri-roman-par-colette-colette-willy-2018-07-10-loaeaiiion-colette-chri.jpg)