Embed Size (px)
DESCRIPTION
UBS Global Healthcare Services Conference. Jack O. Bovender, Jr.Chairman and CEO Vic CampbellSenior Vice President Mark KimbroughVP, Investor Relations. February 2004. HCA. - PowerPoint PPT Presentation
Citation preview
Jack O. Bovender, Jr. Chairman and CEO
Vic Campbell Senior Vice President
Mark Kimbrough VP, Investor Relations
UBS Global Healthcare Services Conference
February 2004
This press release contains forward-looking statements based on current management expectations. Those forward-looking statements include all statements regarding our estimated results of operations in future periods and all statements other than those made solely with respect to historical fact. Numerous risks, uncertainties and other factors may cause actual results to differ materially from those expressed in any forward-looking statements. These factors include, but are not limited to (i) the highly competitive nature of the health care business, (ii) the efforts of insurers, health care providers and others to contain health care costs, (iii) possible changes in the Medicare and Medicaid programs that may impact reimbursements to health care providers and insurers, (iv) the ability to achieve operating and financial targets and achieve expected levels of patient volumes and control the costs of providing services, (v) increases in the amount and risk of collectibility of uninsured accounts and deductibles and co-pay amounts for insured accounts, (vi) the ability to attract and retain qualified management and personnel, including affiliated physicians, nurses and medical support personnel, (vii) potential liabilities and other claims that may be asserted against the Company, (viii) fluctuations in the market value of the Company’s common stock, (ix) the Company’s ability to complete the share repurchase program, (x) changes in accounting practices, (xi) changes in general economic conditions, (xii) future divestitures which may result in additional charges, (xiii) changes in revenue mix and the ability to enter into and renew managed care provider arrangements on acceptable terms, (xiv) the availability and terms of capital to fund the expansion of the Company’s business, (xv) changes in business strategy or development plans, (xvi) delays in receiving payments for services provided, (xvii) the possible enactment of Federal or state health care reform, (xviii) the outcome of pending and any future tax audits and litigation associated with the Company’s tax positions, (xix) the outcome of the Company’s continuing efforts to monitor, maintain and comply with appropriate laws, regulations, policies and procedures and the Company’s corporate integrity agreement with the government, (xx) changes in Federal, state or local regulations affecting the health care industry, (xxi) the impact of charity care and self-pay discounting policy changes, (xxii) the ability to successfully integrate the operations of Health Midwest, (xxiii) the ability to develop and implement the financial enterprise resource planning information system within the expected time and cost projections and, upon implementation, to realize the expected benefits and efficiencies, (xxiv) the ability to obtain court approval of the settlement of the class action securities lawsuits originally filed against the Company in 1997; (xxv) the ability of the Company to continue to fund a cash dividend in the future at the current rate; and (xxvi) other risk factors detailed from time to time in the Company’s filings with the SEC. Many of the factors that will determine the Company’s future results are beyond the ability of the Company to control or predict. In light of the significant uncertainties inherent in the forward-looking statements contained herein, readers should not place undue reliance on forward-looking statements, which reflect management’s views only as of the date hereof. The Company undertakes no obligation to revise or update any forward-looking statements, or to make any other forward-looking statements, whether as a result of new information, future events or otherwise.
All references to “Company” and “HCA” as used throughout this document refer to HCA Inc. and its affiliates.
2
HCA
3
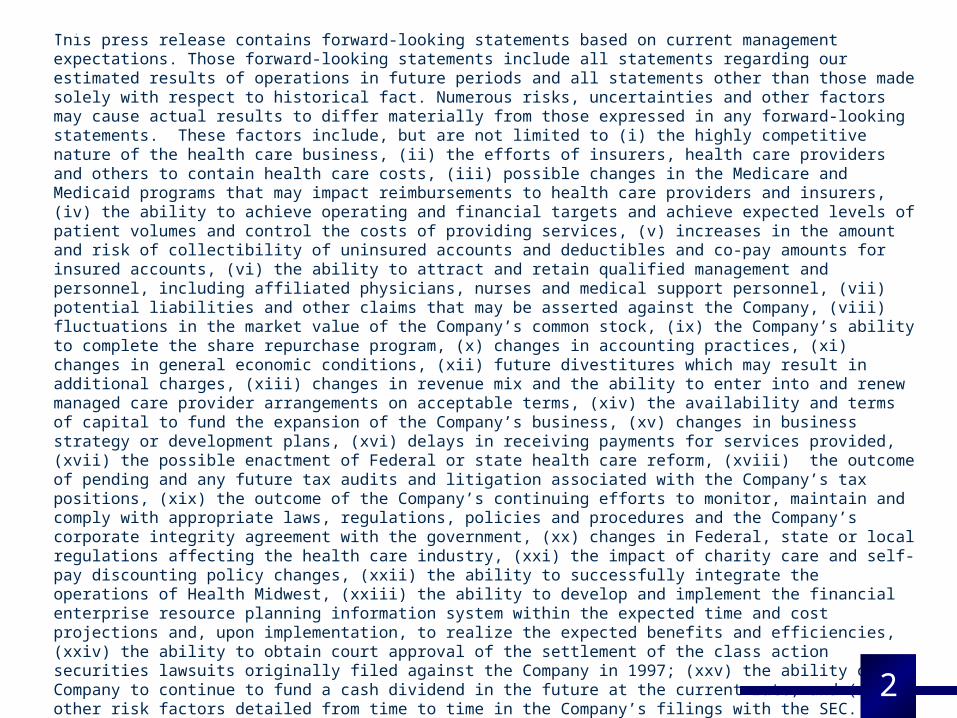
HCA HCA is located in 16 of 20 Fastest Growing HCA is located in 16 of 20 Fastest Growing Large US CitiesLarge US Cities
Switzerland
U.K.
%%
%
%%%
Compared to the National Average of
4.5%
Compared to the National Average of
4.5%
Las Vegas+22%
Las Vegas+22%
Southern California
+9%
Southern California
+9%
Denver+9%
Denver+9%
Dade+8%
Dade+8%
Nashville+8%
Nashville+8%
Panhandle+10%
Panhandle+10%
Tampa Bay+8%
Tampa Bay+8%
Dallas/Ft. Worth+12%
Dallas/Ft. Worth+12%
Austin+18%
Austin+18%
Richmond+8%
Richmond+8%
Palm Beach+11%
Palm Beach+11%
Houston+10%
Houston+10%
Kansas City+5%
Kansas City+5%
Percent Growth in Market Population
2000-2005
Percent Growth in Market Population
2000-2005
Generally 25-40% Market Share40% of facilities in Texas & Florida
4
HCA
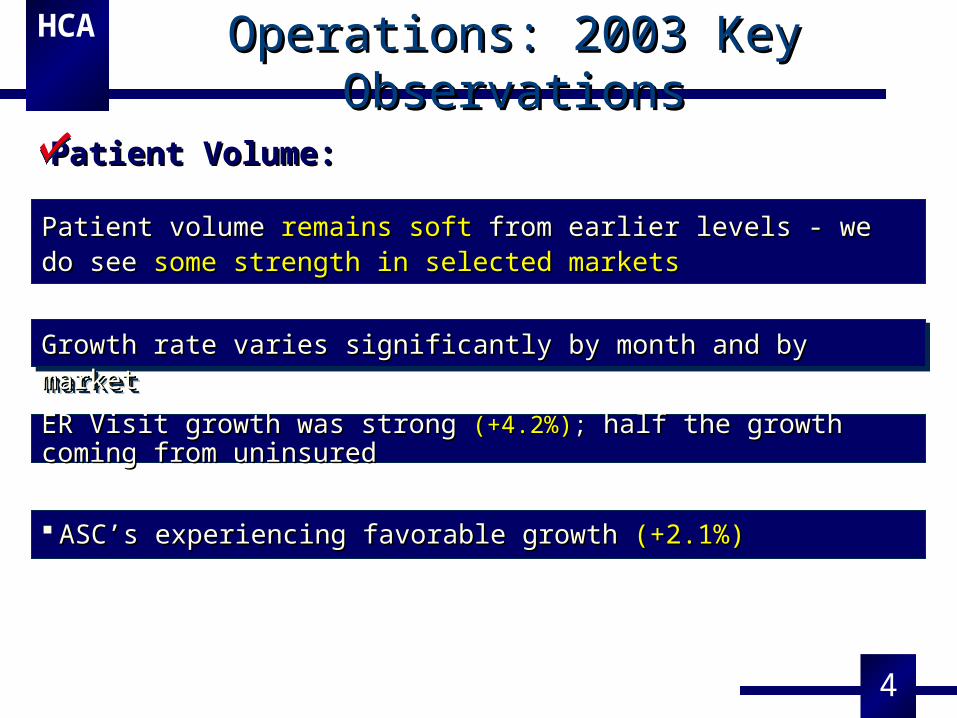
Patient volume Patient volume remains softremains soft from earlier levels - we do see from earlier levels - we do see some strength some strength in selected marketsin selected markets
ASC’s experiencing favorable growth ASC’s experiencing favorable growth (+2.1%)(+2.1%)
ER Visit growth was strong ER Visit growth was strong (+4.2%)(+4.2%);; half the growth coming from uninsuredhalf the growth coming from uninsured
Operations: 2003 Key ObservationsOperations: 2003 Key Observations
Patient Volume:Patient Volume:
Growth rate varies significantly by month and by marketGrowth rate varies significantly by month and by marketGrowth rate varies significantly by month and by marketGrowth rate varies significantly by month and by market
5
HCA
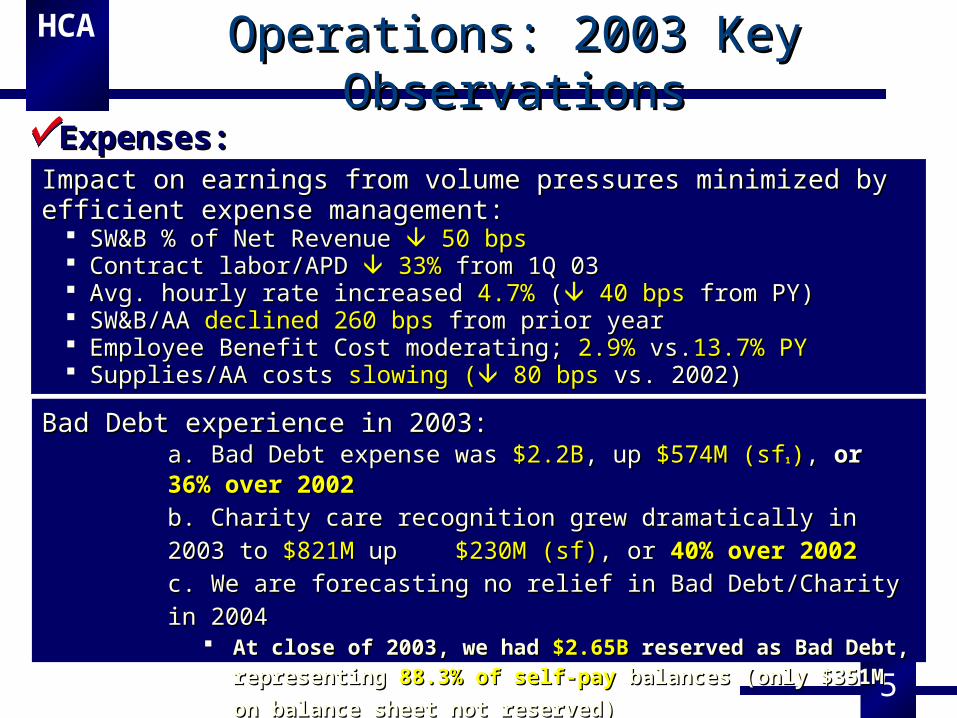
Bad Debt experience in 2003:Bad Debt experience in 2003:a. Bad Debt expense was a. Bad Debt expense was $2.2B$2.2B, up , up $574M (sf$574M (sf11)), , or or 36% over 200236% over 2002
b. Charity care recognition grew dramatically in 2003 to b. Charity care recognition grew dramatically in 2003 to $821M$821M up up
$230M (sf)$230M (sf), or , or 40% over 200240% over 2002
c. We are forecasting no relief in Bad Debt/Charity in 2004c. We are forecasting no relief in Bad Debt/Charity in 2004 At close of 2003, we had At close of 2003, we had $2.65B$2.65B reserved as Bad Debt, representing reserved as Bad Debt, representing
88.3% of self-pay88.3% of self-pay balances (only $351M on balance sheet not balances (only $351M on balance sheet not
reserved)reserved)
Expenses:Expenses:Impact on earnings from volume pressures minimized by efficient Impact on earnings from volume pressures minimized by efficient expense management:expense management:
SW&B % of Net Revenue SW&B % of Net Revenue 50 bps 50 bps Contract labor/APD Contract labor/APD 33% 33% from 1Q 03 from 1Q 03 Avg. hourly rate increased Avg. hourly rate increased 4.7%4.7% ( ( 40 bps 40 bps from PY) from PY) SW&B/AA SW&B/AA declined 260 bpsdeclined 260 bps from prior year from prior year Employee Benefit Cost moderating; Employee Benefit Cost moderating; 2.9%2.9% vs. vs.13.7% PY13.7% PY Supplies/AA costs Supplies/AA costs slowing (slowing ( 80 bps 80 bps vs. 2002) vs. 2002)
Operations: 2003 Key ObservationsOperations: 2003 Key Observations
6
HCA
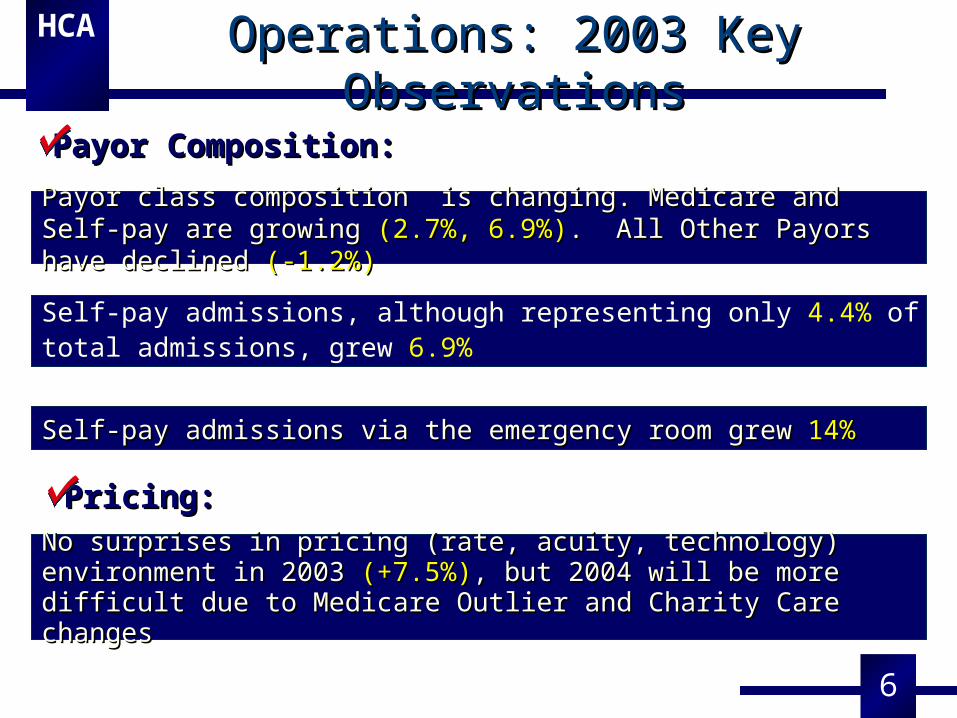
No surprises in pricing (rate, acuity, technology) environment in 2003 No surprises in pricing (rate, acuity, technology) environment in 2003 (+7.5%)(+7.5%), but 2004 will be more difficult due to Medicare Outlier and , but 2004 will be more difficult due to Medicare Outlier and Charity Care changesCharity Care changes
Payor class composition is changing. Medicare and Self-pay are growing Payor class composition is changing. Medicare and Self-pay are growing (2.7%,(2.7%, 6.9%)6.9%). All Other Payors have declined . All Other Payors have declined (-1.2%)(-1.2%)
Self-pay admissions via the emergency room grew Self-pay admissions via the emergency room grew 14%14%
Self-pay admissions, although representing only 4.4% of total admissions, grew 6.9%
Pricing:Pricing:
Payor Composition:Payor Composition:
Operations: 2003 Key ObservationsOperations: 2003 Key Observations
7
HCA
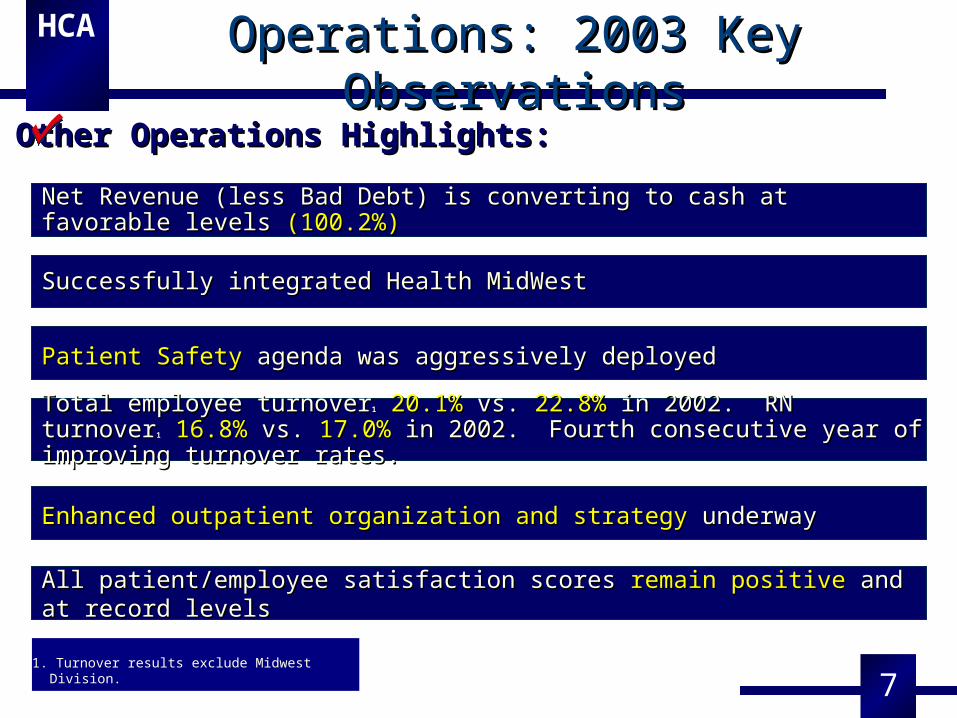
All patient/employee satisfaction scoresAll patient/employee satisfaction scores remain positive remain positive and at record levels and at record levels
Total employee turnoverTotal employee turnover11 20.1%20.1% vs. vs. 22.8%22.8% in 2002. RN turnover in 2002. RN turnover11 16.8%16.8% vs. vs. 17.0%17.0% in 2002. Fourth consecutive year of improving turnover rates.in 2002. Fourth consecutive year of improving turnover rates.
Enhanced outpatient organization and strategyEnhanced outpatient organization and strategy underway underway
Patient SafetyPatient Safety agenda was aggressively deployed agenda was aggressively deployed
Successfully integrated Health MidWestSuccessfully integrated Health MidWest
Net Revenue (less Bad Debt) is converting to cash at favorable levels Net Revenue (less Bad Debt) is converting to cash at favorable levels (100.2%)(100.2%)
1. Turnover results exclude Midwest Division.
Other Operations Highlights:Other Operations Highlights:
Operations: 2003 Key ObservationsOperations: 2003 Key Observations
8
HCA
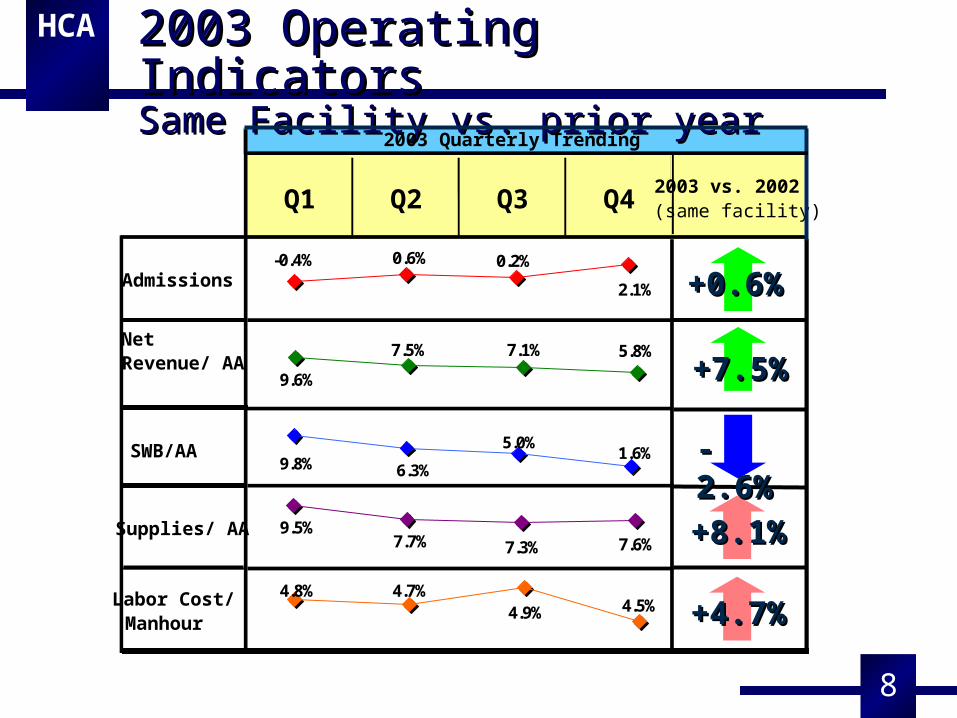
1.6%5.0%
6.3%9.8%
5.8%7.5% 7.1%
9.6%
7.6%7.3%7.7%9.5%
4.5%4.9%4.7%4.8%
2003 Operating Indicators2003 Operating IndicatorsSame Facility vs. prior yearSame Facility vs. prior year
-0.4% 0.2%
2.1%
0.6%
+0.6%+0.6%
+7.5%+7.5%
+8.1%+8.1%
+4.7%+4.7%
Q1 Q2 Q3 Q42003 vs. 2002 (same facility)
2003 Quarterly Trending
Admissions
Net Revenue/ AA
Supplies/ AA
Labor Cost/ Manhour
SWB/AA -2.6%-2.6%
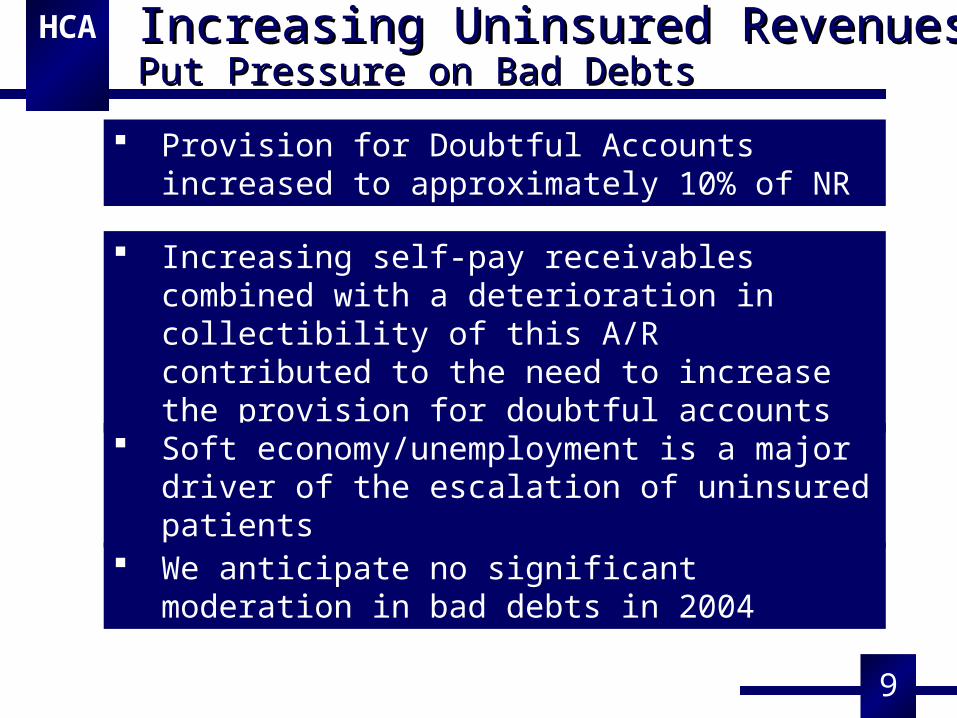
Provision for Doubtful Accounts increased to approximately 10% of NR
Increasing Uninsured RevenuesIncreasing Uninsured RevenuesPut Pressure on Bad DebtsPut Pressure on Bad Debts
9
HCA
Increasing self-pay receivables combined with a deterioration in collectibility of this A/R contributed to the need to increase the provision for doubtful accounts
Soft economy/unemployment is a major driver of the escalation of uninsured patients
We anticipate no significant moderation in bad debts in 2004
10
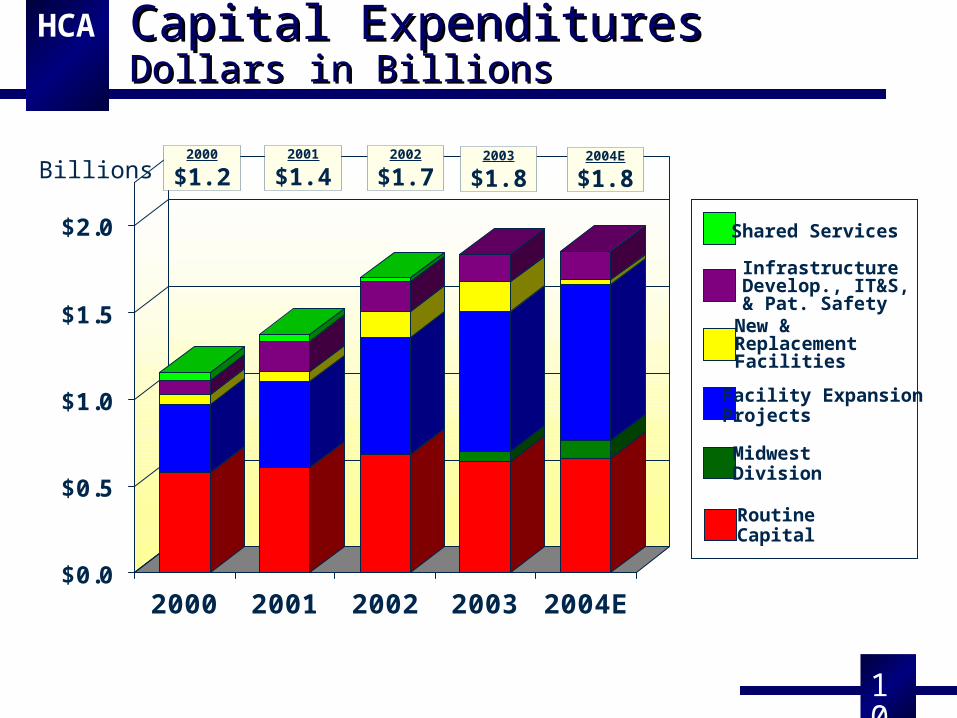
HCA Capital ExpendituresCapital ExpendituresDollars in BillionsDollars in Billions
$0.0
$0.5
$1.0
$1.5
$2.0
2000 2001 2002 2003 2004E
MidwestDivision
Facility ExpansionProjects
New &Replacement Facilities
InfrastructureDevelop., IT&S, & Pat. Safety
Shared Services
RoutineCapital
Billions2000
$1.22001
$1.42002
$1.72003
$1.82004E
$1.8
11
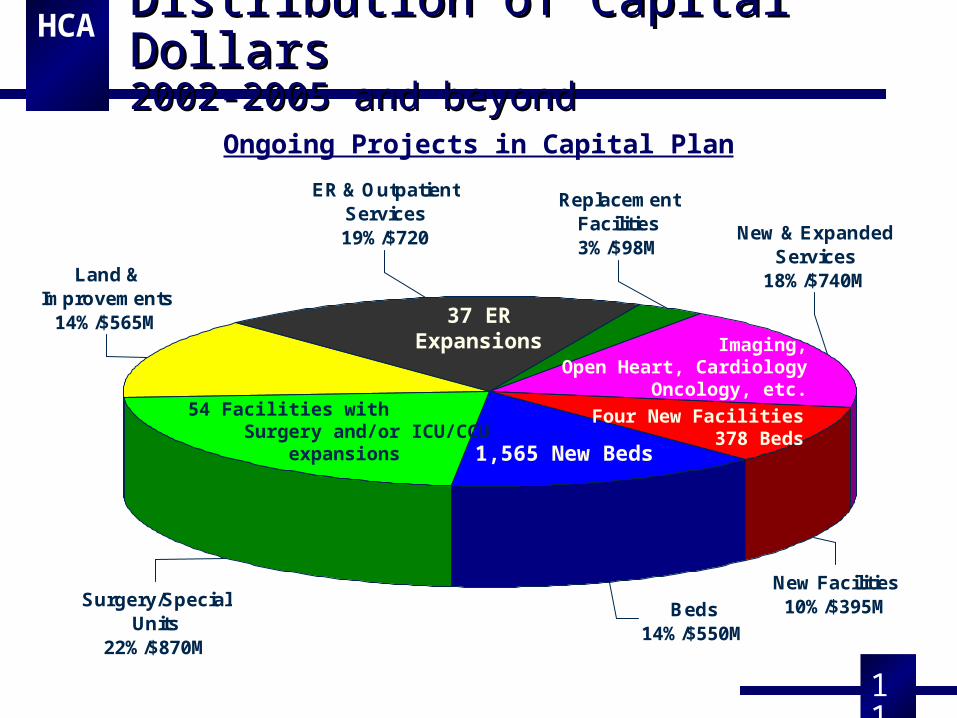
HCA Distribution of Capital DollarsDistribution of Capital Dollars2002-2005 and beyond2002-2005 and beyond
Ongoing Projects in Capital Plan
Land & Improvements
14%/$565M
Surgery/Special Units
22%/$870M
Beds14%/$550M
New Facilities10%/$395M
New & Expanded Services
18%/$740M
Replacement Facilities3%/$98M
ER & Outpatient Services19%/$720
1,565 New Beds
54 Facilities with Surgery and/or ICU/CCU expansions
Four New Facilities 378 Beds
Imaging,Open Heart, Cardiology
Oncology, etc.
37 ERExpansions
37 ERExpansions
12
HCA
(Dollars
in
Million
s)
$0
$200
$400
$600
$800
$1,000
$1,200
$1,400
2000 2001 2002 2003 2004 2005
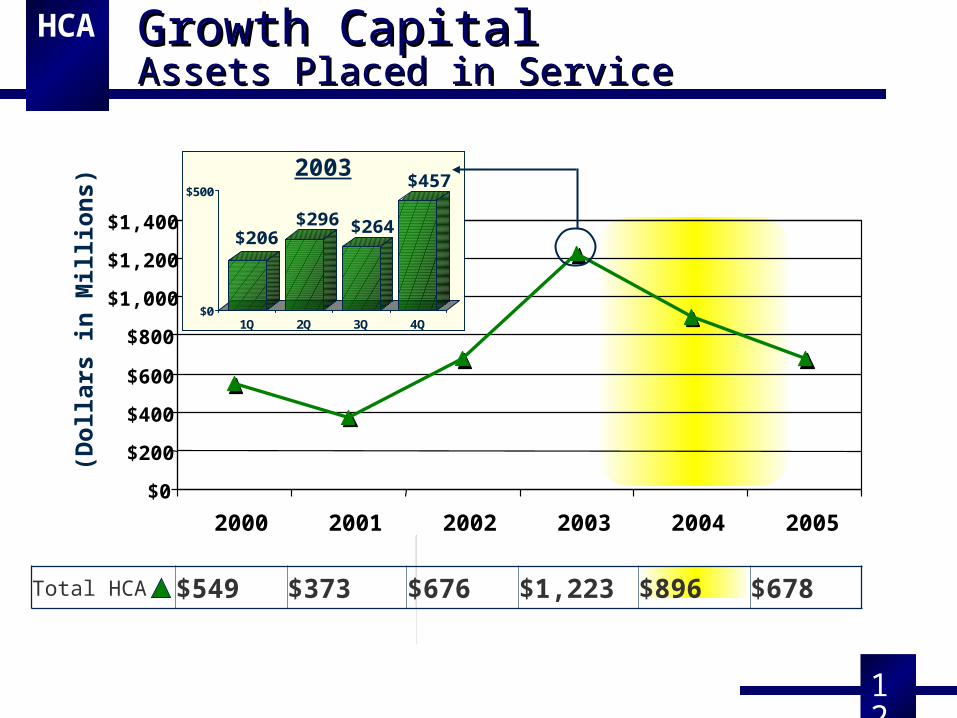
$206$296 $264
$457
$0
$500
1Q 2Q 3Q 4Q
2003
$896
$427$427EasternEastern
$249$249
$678$678$676$676$373$373Total HCATotal HCA
Growth CapitalGrowth CapitalAssets Placed in ServiceAssets Placed in Service
Total HCA $549 $373 $676 $1,223 $896 $678
13
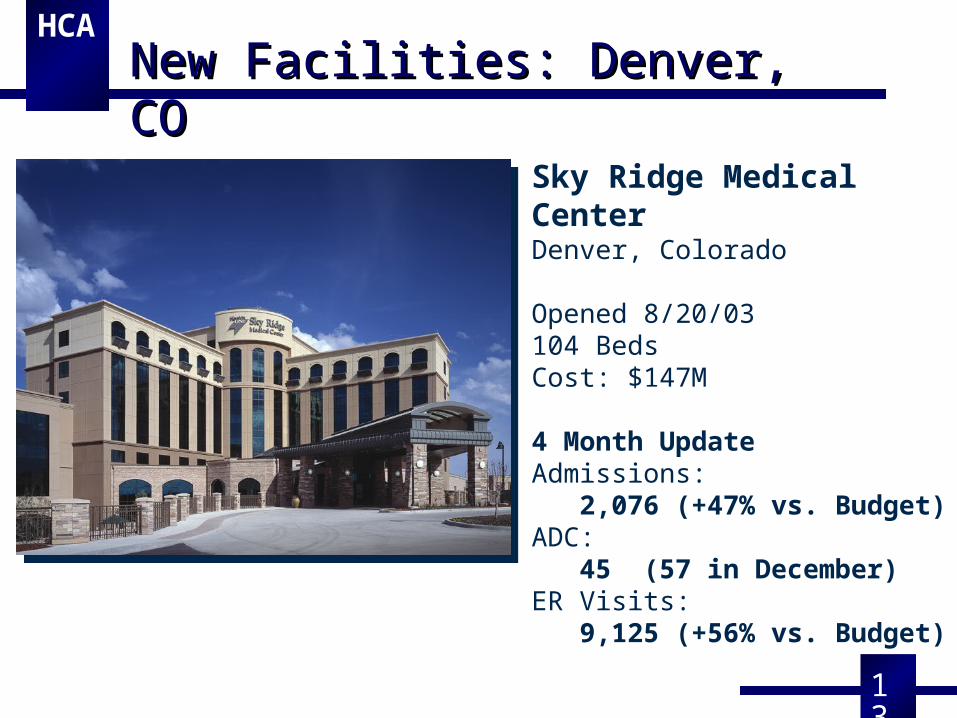
HCANew Facilities: Denver, CONew Facilities: Denver, CO
Sky Ridge Medical CenterDenver, Colorado Opened 8/20/03104 BedsCost: $147M
4 Month UpdateAdmissions:
2,076 (+47% vs. Budget)ADC:
45 (57 in December)ER Visits:
9,125 (+56% vs. Budget)
14
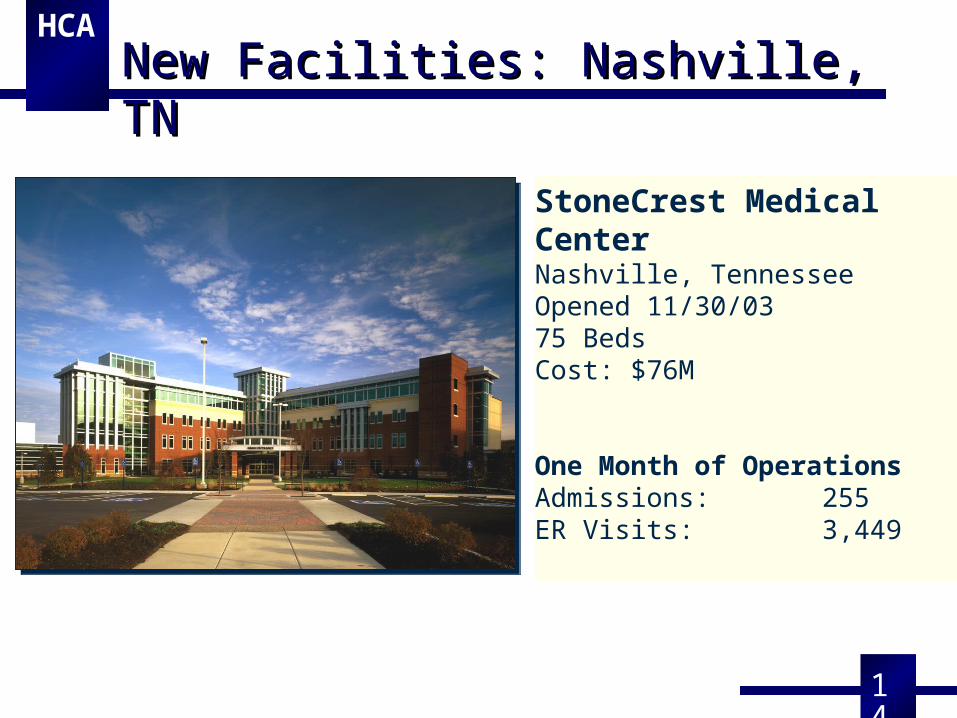
HCANew Facilities: Nashville, TNNew Facilities: Nashville, TN
StoneCrest Medical CenterNashville, TennesseeOpened 11/30/0375 BedsCost: $76M
One Month of OperationsAdmissions: 255ER Visits: 3,449
15
HCA
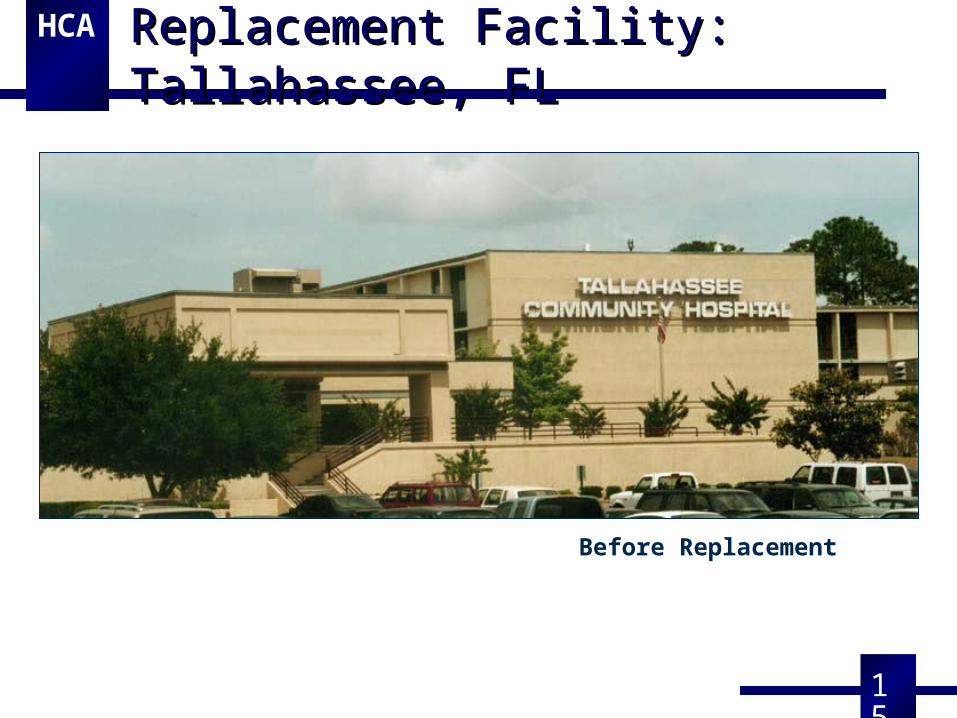
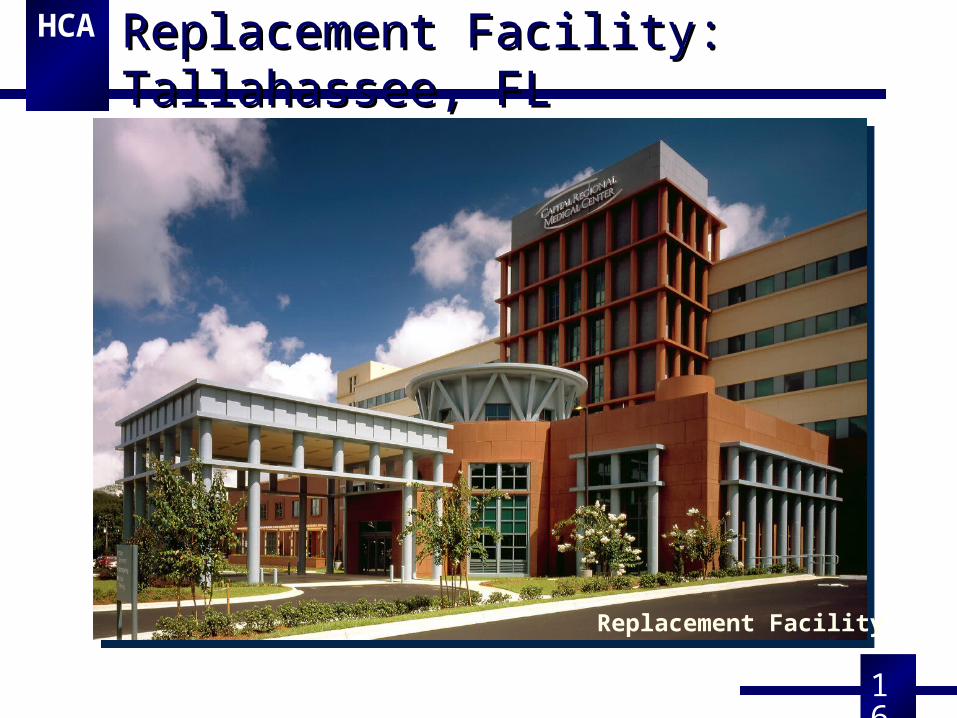
Before Replacement
Replacement Facility:Replacement Facility: Tallahassee, FLTallahassee, FL
16
HCAReplacement Facility: Tallahassee, FLReplacement Facility: Tallahassee, FL
Replacement Facility
17
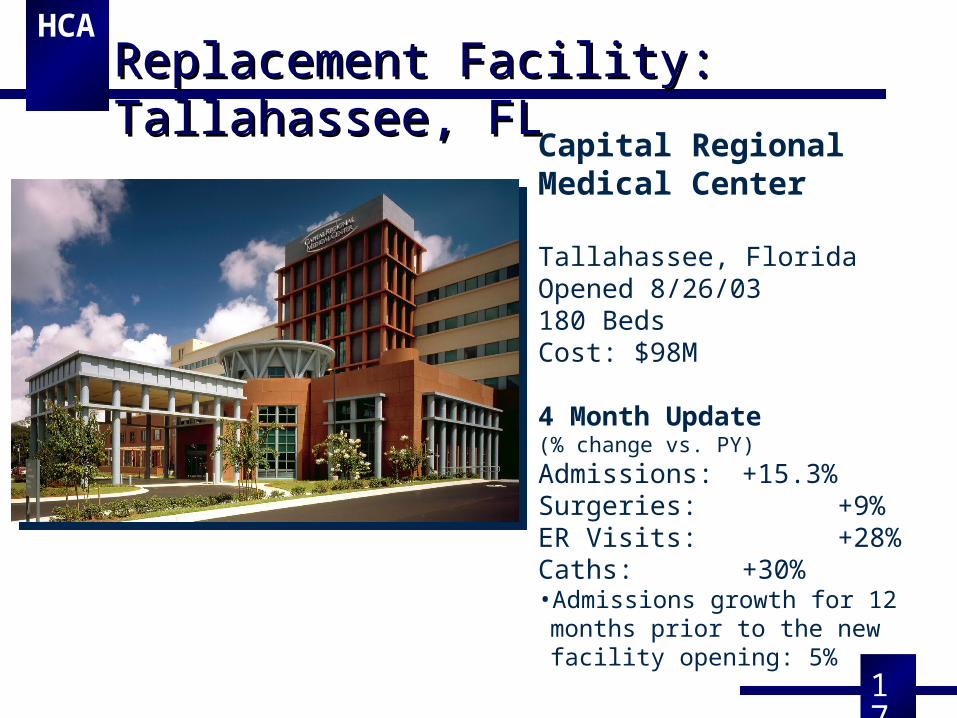
HCAReplacement Facility: Tallahassee, FLReplacement Facility: Tallahassee, FL
Capital Regional Medical Center Tallahassee, FloridaOpened 8/26/03180 BedsCost: $98M
4 Month Update(% change vs. PY)
Admissions: +15.3%Surgeries: +9%ER Visits: +28%Caths: +30%• Admissions growth for 12 months prior to the new facility opening: 5%
18
HCA
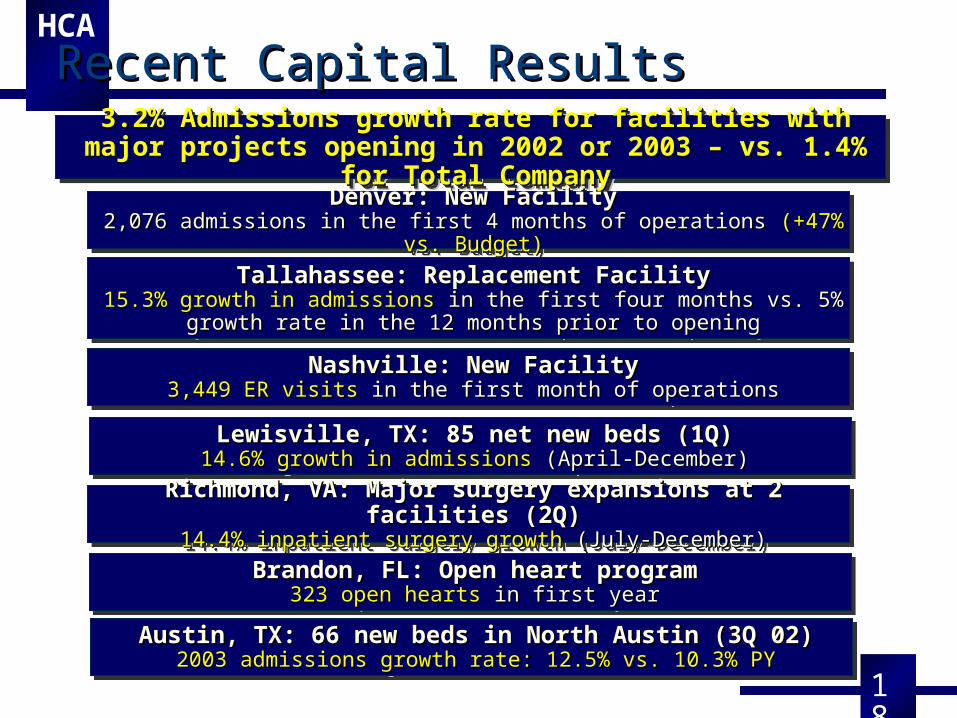
Recent Capital ResultsRecent Capital Results
3.2% Admissions growth rate for facilities with major projects 3.2% Admissions growth rate for facilities with major projects opening in 2002 or 2003 – vs. 1.4% for Total Companyopening in 2002 or 2003 – vs. 1.4% for Total Company
3.2% Admissions growth rate for facilities with major projects 3.2% Admissions growth rate for facilities with major projects opening in 2002 or 2003 – vs. 1.4% for Total Companyopening in 2002 or 2003 – vs. 1.4% for Total Company
Denver: New FacilityDenver: New Facility2,076 admissions in the first 4 months of operations 2,076 admissions in the first 4 months of operations (+47% vs. Budget)(+47% vs. Budget)
Denver: New FacilityDenver: New Facility2,076 admissions in the first 4 months of operations 2,076 admissions in the first 4 months of operations (+47% vs. Budget)(+47% vs. Budget)
Tallahassee: Replacement FacilityTallahassee: Replacement Facility15.3% growth in admissions15.3% growth in admissions in the first four months vs. 5% growth rate in the 12 in the first four months vs. 5% growth rate in the 12
months prior to openingmonths prior to opening
Tallahassee: Replacement FacilityTallahassee: Replacement Facility15.3% growth in admissions15.3% growth in admissions in the first four months vs. 5% growth rate in the 12 in the first four months vs. 5% growth rate in the 12
months prior to openingmonths prior to opening
Nashville: New FacilityNashville: New Facility3,449 ER visits3,449 ER visits in the first month of operations in the first month of operations
Nashville: New FacilityNashville: New Facility3,449 ER visits3,449 ER visits in the first month of operations in the first month of operations
Lewisville, TX: 85 net new beds (1Q)Lewisville, TX: 85 net new beds (1Q)14.6% growth in admissions14.6% growth in admissions (April-December) (April-December)Lewisville, TX: 85 net new beds (1Q)Lewisville, TX: 85 net new beds (1Q)
14.6% growth in admissions14.6% growth in admissions (April-December) (April-December)
Richmond, VA: Major surgery expansions at 2 facilities (2Q)Richmond, VA: Major surgery expansions at 2 facilities (2Q)14.4% inpatient surgery growth14.4% inpatient surgery growth (July-December) (July-December)
Richmond, VA: Major surgery expansions at 2 facilities (2Q)Richmond, VA: Major surgery expansions at 2 facilities (2Q)14.4% inpatient surgery growth14.4% inpatient surgery growth (July-December) (July-December)
Brandon, FL: Open heart programBrandon, FL: Open heart program323 open hearts323 open hearts in first year in first year
Brandon, FL: Open heart programBrandon, FL: Open heart program323 open hearts323 open hearts in first year in first year
Austin, TX: 66 new beds in North Austin (3Q 02)Austin, TX: 66 new beds in North Austin (3Q 02)2003 admissions growth rate: 12.5% vs. 10.3% PY2003 admissions growth rate: 12.5% vs. 10.3% PY
Austin, TX: 66 new beds in North Austin (3Q 02)Austin, TX: 66 new beds in North Austin (3Q 02)2003 admissions growth rate: 12.5% vs. 10.3% PY2003 admissions growth rate: 12.5% vs. 10.3% PY
19
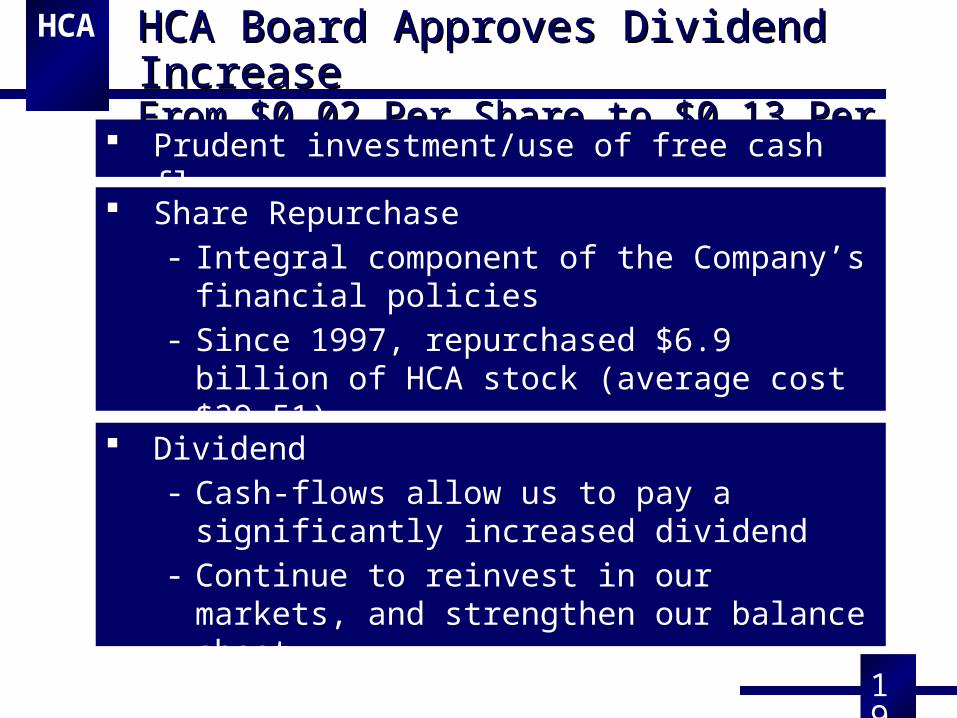
HCA HCA Board Approves Dividend IncreaseHCA Board Approves Dividend IncreaseFrom $0.02 Per Share to $0.13 Per ShareFrom $0.02 Per Share to $0.13 Per Share
HCA
Prudent investment/use of free cash flow
Share Repurchase- Integral component of the Company’s
financial policies- Since 1997, repurchased $6.9 billion of
HCA stock (average cost $29.51)
Dividend- Cash-flows allow us to pay a significantly
increased dividend- Continue to reinvest in our markets, and
strengthen our balance sheet
20
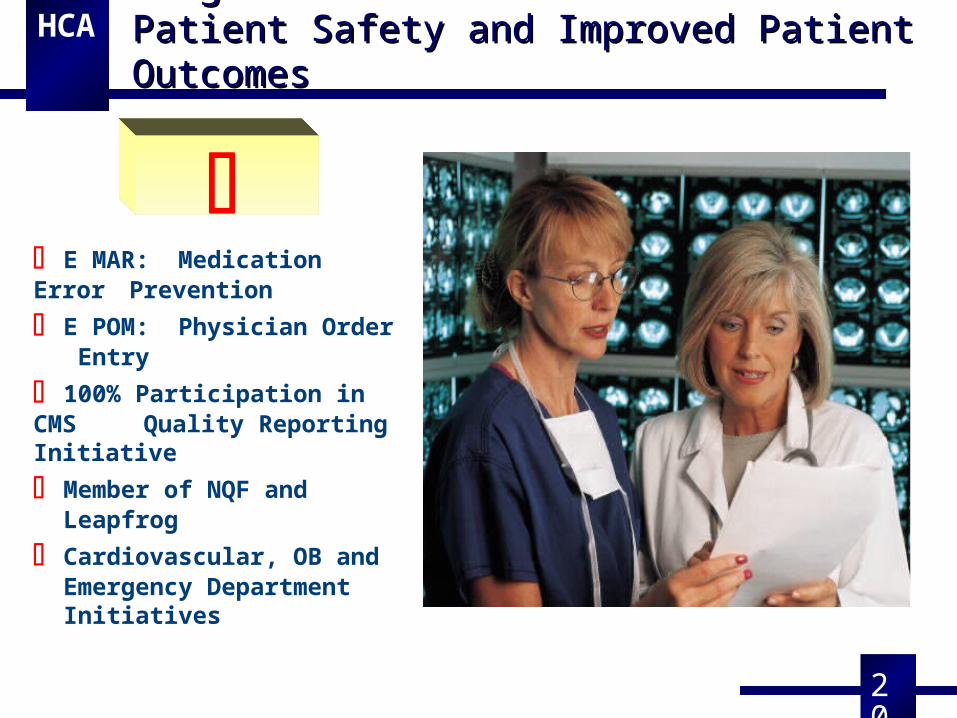
HCA HCA is Investing Significantly in Programs forHCA is Investing Significantly in Programs forPatient Safety and Improved Patient OutcomesPatient Safety and Improved Patient Outcomes
HCA
E MAR: Medication Error Prevention
E POM: Physician Order Entry
100% Participation in CMS Quality Reporting Initiative
Member of NQF and Leapfrog
Cardiovascular, OB and Emergency Department Initiatives
21
HCA
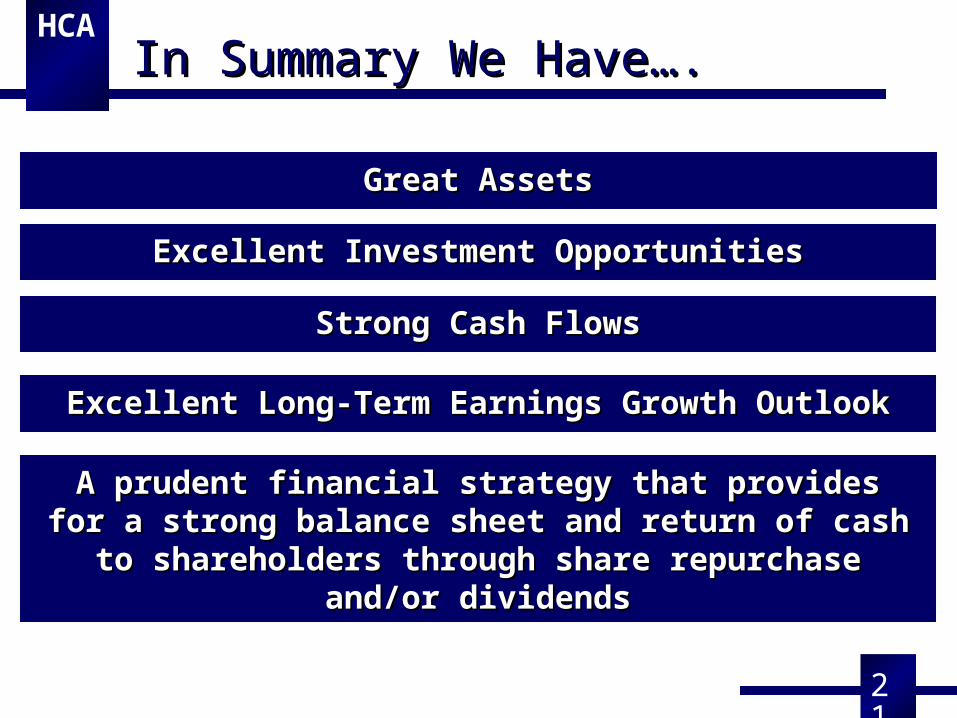
A prudent financial strategy that provides for a strong A prudent financial strategy that provides for a strong balance sheet and return of cash to shareholders through balance sheet and return of cash to shareholders through
share repurchase and/or dividendsshare repurchase and/or dividends
Excellent Investment OpportunitiesExcellent Investment Opportunities
Strong Cash FlowsStrong Cash Flows
Excellent Long-Term Earnings Growth OutlookExcellent Long-Term Earnings Growth Outlook
Great AssetsGreat Assets
In Summary We Have….In Summary We Have….HCA
![About Strata Community Australia (Vic) Inc. [SCA (Vic)]vic.strata.community/documents/Vic Documents/SCA_Vic_Policy... · About Strata Community Australia (Vic) Inc. ... Consistent](https://img.pdfslide.us/doc/110x75/5ad3ecf87f8b9a0d2d8bb371/about-strata-community-australia-vic-inc-sca-vicvic-documentsscavicpolicyabout.jpg)


![A [Drunk] Wolfe at the Door (handling covered combined with uncovered claims) Thomas, Thomas & Hafer, LLP Peter J. Speaker, Esquire Joshua J. Bovender,](https://img.pdfslide.us/doc/110x75/56649ced5503460f949b9de5/a-drunk-wolfe-at-the-door-handling-covered-combined-with-uncovered-claims.jpg)
![About Strata Community Australia (Vic) Inc. [SCA (Vic)]vic.strata.community/documents/Vic Documents/SCA (Vic) Policy... · About Strata Community Australia (Vic) Inc. ... Consistent](https://img.pdfslide.us/doc/110x75/5b597c957f8b9aec628dc8bc/about-strata-community-australia-vic-inc-sca-vicvic-documentssca-vic.jpg)