Embed Size (px)
Citation preview
8/12/2019 Ja 8078972
http://slidepdf.com/reader/full/ja-8078972 1/6
8/12/2019 Ja 8078972
http://slidepdf.com/reader/full/ja-8078972 2/6
based methods are more suitable for inexpensive mass produc-tion. In this article, we describe a simple hydrothermal methodfor growing oriented, single-crystalline rutile TiO2 nanorods onFTO substrates. Rutile TiO2 has been proven to be comparableto anatase TiO2 in DSSCs with additional advantages includingbetter chemical stability and higher refractive index.15,16
Experimental Section
In a typical synthesis, 0-60 mL of deionized water was mixed
with 0-60 mL of concentrated hydrochloric acid (36.5%s38% byweight) to reach a total volume of 60 mL in a Teflon-lined stainlesssteel autoclave (125 mL volume, Parr Instrument Co.). The mixturewas stirred at ambient conditions for 5 min before the addition of 1 mL of titanium butoxide (97% Aldrich). After stirring for another5 min, two pieces of FTO substrates (F:SnO2, Tec 15, 10 Ω / 0,Hartford Glass Company), ultrasonically cleaned for 60 min in amixed solution of deionized water, acetone, and 2-propanol withvolume ratios of 1:1:1, were placed at an angle against the wall of the Teflon-liner with the conducting side facing down. Thehydrothermal synthesis was conducted at 80-220 °C for 1-24 hin an electric oven. After synthesis, the autoclave was cooled toroom temperature under flowing water, which took approximately15 min. The FTO substrate was taken out, rinsed extensively withdeionized water and allowed to dry in ambient air. In some control
experiments, ultrasonically cleaned silicon or glass substrates wereused instead of FTO to study the effect of the substrate. Effects of additional titanium precursors such as titanium isopropoxide ortitanium tetrachloride (TiCl4) as well as effects of adding surfactantsor salts such as ethylenediamine (EDA), ethylenediaminetetraaceticacid (EDTA), sodium dodecyl sulfate (SDS), cetyltrimethylammo-niumbromide (CTAB), polyvinylpyrrolidone (PVP), sodium chlo-ride (NaCl) were also studied.
The crystal structure of the as-prepared film was examined byX-ray diffraction (XRD). The XRD patterns were recorded in aBruker-AXS Microdiffractometer (model D5005) with Cu KR radiation ( λ ) 1.5406 Å) from 20° to 70° at a scanning speed of 2.4° min-1. X-ray tube voltage and current were set at 45 kV and40 mA, repectively. Morphological and lattice structural informationwere examined with field emission scanning electron microscopy(FESEM, JSM-6500F, and JSM-6700F), transmission electronmicroscopy (TEM/HRTEM, FEI Tecnai G2 30), and selected areaelectron diffration (SAED). In a typical FESEM measurement, asmall piece of sample film was adhered onto a copper stub usingdouble-sided carbon tape. The specimens for TEM imaging wereprepared by suspending solid samples in acetone. About 1-2 mgof white sample detached from the FTO substrate was added to 5mL of acetone in a small glass vial, followed by sonication for 30min. A few drops of the sonicated suspension were dropped ontoa carbon-coated 200 mesh copper grid and dried under ambientconditions before imaging.
Dye-sensitized solar cells were assembled using the TiO2
nanorods grown on FTO as the photoanode. Prior to dye adsorption,the as-prepared sample was placed in 100 mL of 0.1 M TiCl4
solution, which was prepared by mixing TiCl4 and ice, at 50 °Cfor 1 h in a beaker covered with parafilm. After rinsing with pureethanol, the TiCl4-treated sample was annealed in air at 450 °C for30 min inside a furnace. The sensitizer used in this work was cis-bis(isothiocyanato)bis(2,2′-bipyrridyl-4-4′-dicarboxylato)-ruthe-nium(II)bis-tetrabutylammonium dye (N-719 as received fromSolaronix); the nanorod samples were immersed in a 0.3 mMethanolic solution of N-719 for 24 h to complete the dye adsorption.A platinum-coated FTO substrate spaced from the TiO2 nanorodphotoanode with 25- µm thick Teflon strips (Pike Technologies) was
used as the counter electrode. The electrolyte containing 0.6 M1-butyl-3-methylimidazolium iodide, 0.03 M I2, 0 . 5 M tert -butylpyridine, and 0.1 M guanidinium thiocyanate in acetonitrile/ valeronitrile 85/15 (v/v) (ES-004 from Iolitec) was injected intothe space between the anode and the cathode through capillaryforces.
The current-voltage characteristics were recorded with a Kei-thley 2400 sourcemeter using a simulated AM1.5 spectrumproduced by a homemade solar simulator described in a previouspublication.17 Briefly, the measurement system consisted of a 100W Xe-arc lamp (Oriel) in conjunction with a 0.125 m monochro-mator (Newport, Cornerstone 130) equipped with a grating and amirror mounted on the same turret. AM1.5 radiation was simulatedusing two filters (Newport 81090 and 81092) placed between themonochromator and the Xe lamp and by selecting the mirror onthe grating turret. The photoaction spectrum, I ( λ) was acquired byselecting and scanning the grating. The lamp irradiance, P( λ), wasrecorded using two independent methods, a calibrated radiometrysystem consisting of a silicon detector and a power meter(International Light SED033 and IL1700) and a Newport radiantpower meter (Newport 70260 and 70268 probe) that agreed witheach other. The lamp power was adjusted such that the measuredintegrated irradiance was approximately 100 mW/cm2. The externalquantum efficiency was calculated using EQE( λ) ) (hc / λ) × [ I ( λ)- I dark]/ P( λ), where I ( λ) and I dark is the short-circuit current recordedunder illumination and in the dark, respectively. No correctionswere made for reflection from the glass substrate, and the solarcell area was defined with a 0.33 cm2 circular aperture.
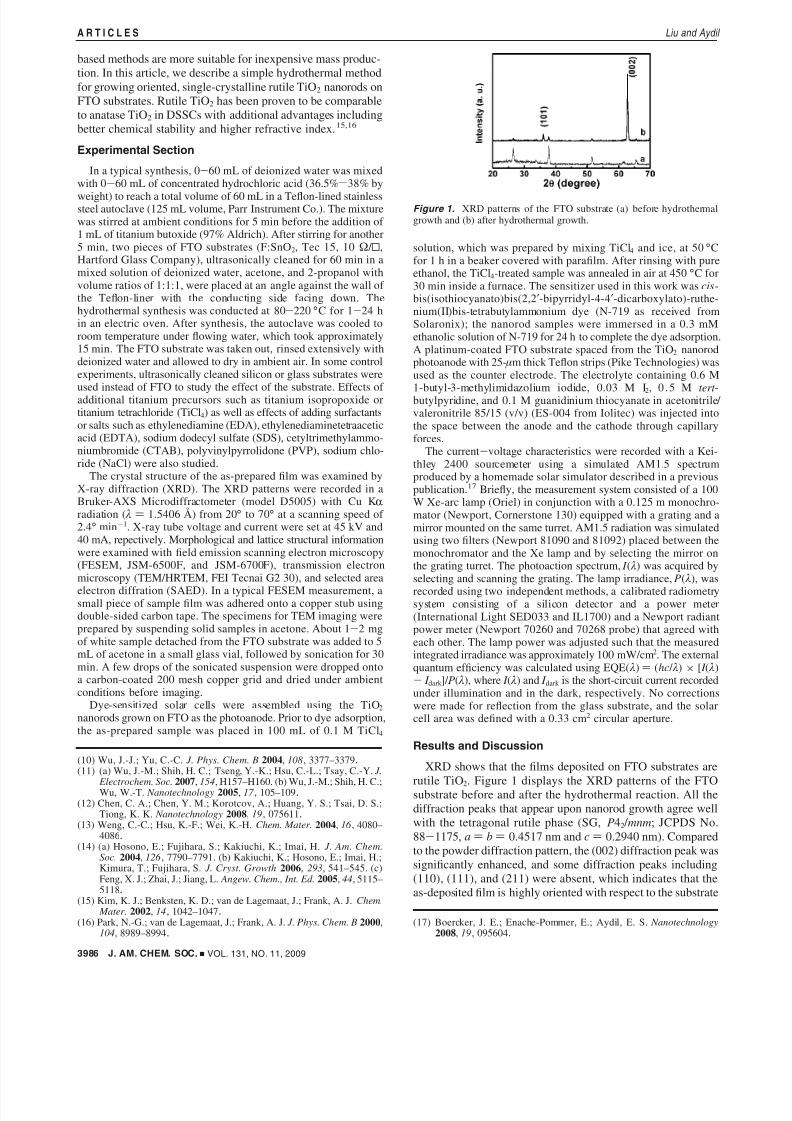
Results and DiscussionXRD shows that the films deposited on FTO substrates are
rutile TiO2. Figure 1 displays the XRD patterns of the FTOsubstrate before and after the hydrothermal reaction. All thediffraction peaks that appear upon nanorod growth agree wellwith the tetragonal rutile phase (SG, P42 / mnm; JCPDS No.88-1175, a ) b ) 0.4517 nm and c ) 0.2940 nm). Comparedto the powder diffraction pattern, the (002) diffraction peak wassignificantly enhanced, and some diffraction peaks including(110), (111), and (211) were absent, which indicates that theas-deposited film is highly oriented with respect to the substrate
(10) Wu, J.-J.; Yu, C.-C. J. Phys. Chem. B 2004, 108, 3377–3379.(11) (a) Wu, J.-M.; Shih, H. C.; Tseng, Y.-K.; Hsu, C.-L.; Tsay, C.-Y. J.
Electrochem. Soc. 2007, 154, H157–H160. (b) Wu, J.-M.; Shih, H. C.;Wu, W.-T. Nanotechnology 2005, 17 , 105–109.
(12) Chen, C. A.; Chen, Y. M.; Korotcov, A.; Huang, Y. S.; Tsai, D. S.;Tiong, K. K. Nanotechnology 2008, 19, 075611.
(13) Weng, C.-C.; Hsu, K.-F.; Wei, K.-H. Chem. Mater. 2004, 16 , 4080–4086.
(14) (a) Hosono, E.; Fujihara, S.; Kakiuchi, K.; Imai, H. J. Am. Chem.Soc. 2004, 126 , 7790–7791. (b) Kakiuchi, K.; Hosono, E.; Imai, H.;Kimura, T.; Fujihara, S. J. Cryst. Growth 2006, 293, 541–545. (c)Feng, X. J.; Zhai, J.; Jiang, L. Angew. Chem., Int. Ed. 2005, 44, 5115–5118.
(15) Kim, K. J.; Benksten, K. D.; van de Lagemaat, J.; Frank, A. J. Chem. Mater. 2002, 14, 1042–1047.
(16) Park, N.-G.; van de Lagemaat, J.; Frank, A. J. J. Phys. Chem. B 2000,
104, 8989–8994.
(17) Boercker, J. E.; Enache-Pommer, E.; Aydil, E. S. Nanotechnology
2008, 19, 095604.
Figure 1. XRD patterns of the FTO substrate (a) before hydrothermalgrowth and (b) after hydrothermal growth.
3986 J. AM. CHEM. SOC. 9 VOL. 131, NO. 11, 2009
A R T I C L E S Liu and Aydil
8/12/2019 Ja 8078972
http://slidepdf.com/reader/full/ja-8078972 3/6
surface and the TiO2 nanorods grow in the [001] direction withthe growth axis parallel to the substrate surface normal. Absenceof diffraction peaks that are normally present in polycrystallineor powder samples is a strong indication that the nanorods arenot only aligned but are also single crystalline throughout theirlength. These conclusions were confirmed by HRTEM andSAED measurements (vide infra).
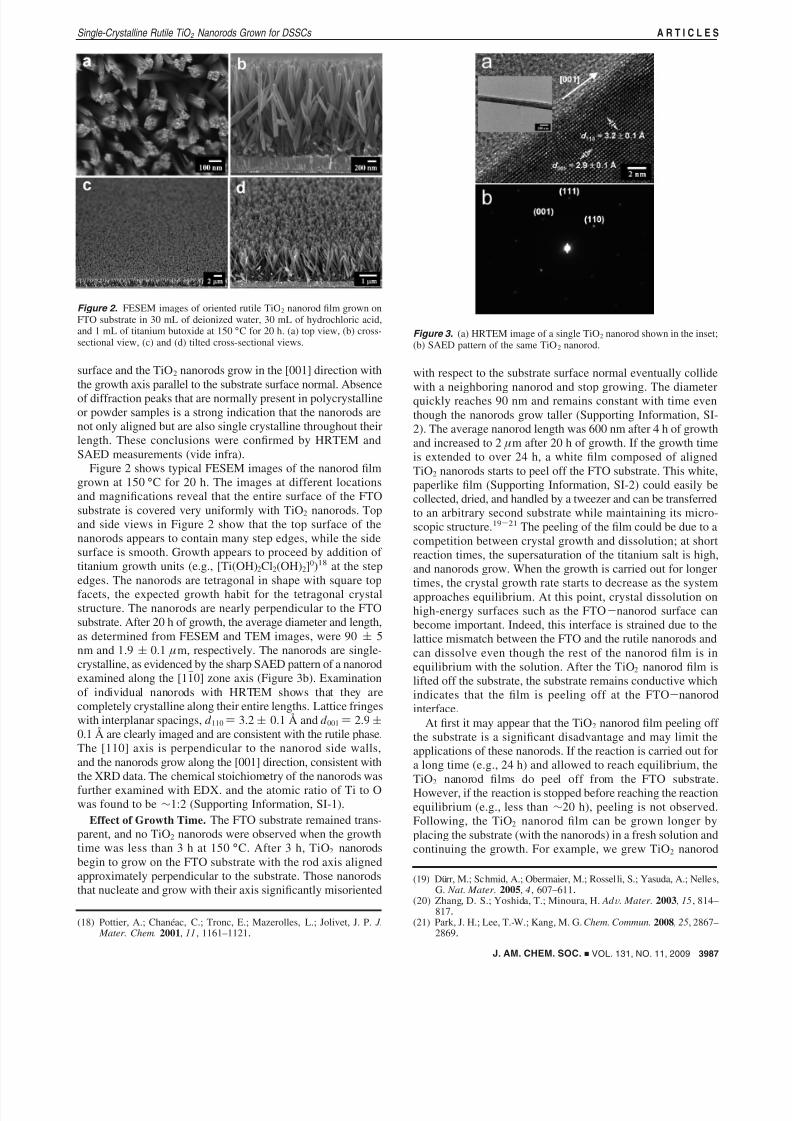
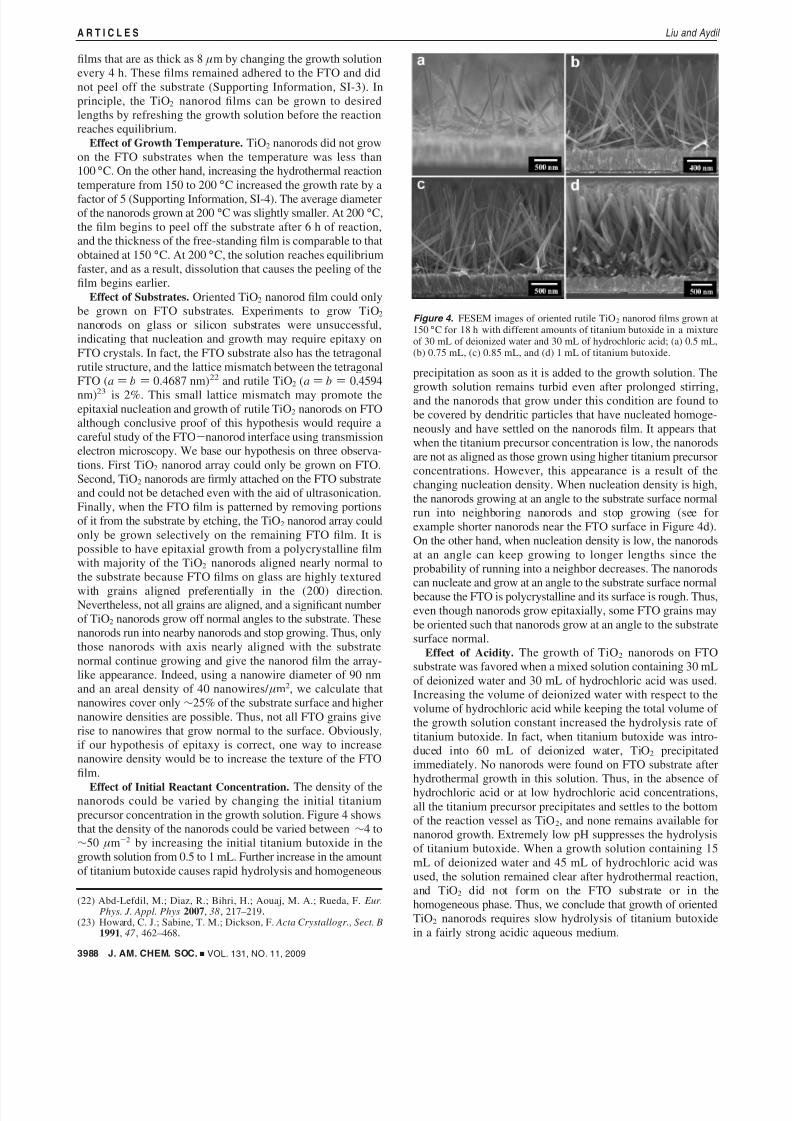
Figure 2 shows typical FESEM images of the nanorod filmgrown at 150 °C for 20 h. The images at different locationsand magnifications reveal that the entire surface of the FTOsubstrate is covered very uniformly with TiO2 nanorods. Topand side views in Figure 2 show that the top surface of thenanorods appears to contain many step edges, while the sidesurface is smooth. Growth appears to proceed by addition of titanium growth units (e.g., [Ti(OH)2Cl2(OH)2]0)18 at the stepedges. The nanorods are tetragonal in shape with square topfacets, the expected growth habit for the tetragonal crystalstructure. The nanorods are nearly perpendicular to the FTOsubstrate. After 20 h of growth, the average diameter and length,as determined from FESEM and TEM images, were 90 ( 5nm and 1.9 ( 0.1 µm, respectively. The nanorods are single-crystalline, as evidenced by the sharp SAED pattern of a nanorodexamined along the [11j0] zone axis (Figure 3b). Examinationof individual nanorods with HRTEM shows that they arecompletely crystalline along their entire lengths. Lattice fringeswith interplanar spacings, d 110 ) 3.2 ( 0.1 Å and d 001 ) 2.9 (0.1 Å are clearly imaged and are consistent with the rutile phase.
The [110] axis is perpendicular to the nanorod side walls,and the nanorods grow along the [001] direction, consistent withthe XRD data. The chemical stoichiometry of the nanorods wasfurther examined with EDX. and the atomic ratio of Ti to Owas found to be ∼1:2 (Supporting Information, SI-1).
Effect of Growth Time. The FTO substrate remained trans-parent, and no TiO2 nanorods were observed when the growthtime was less than 3 h at 150 °C. After 3 h, TiO2 nanorodsbegin to grow on the FTO substrate with the rod axis alignedapproximately perpendicular to the substrate. Those nanorodsthat nucleate and grow with their axis significantly misoriented
with respect to the substrate surface normal eventually collidewith a neighboring nanorod and stop growing. The diameterquickly reaches 90 nm and remains constant with time eventhough the nanorods grow taller (Supporting Information, SI-2). The average nanorod length was 600 nm after 4 h of growthand increased to 2 µm after 20 h of growth. If the growth timeis extended to over 24 h, a white film composed of alignedTiO2 nanorods starts to peel off the FTO substrate. This white,paperlike film (Supporting Information, SI-2) could easily becollected, dried, and handled by a tweezer and can be transferredto an arbitrary second substrate while maintaining its micro-scopic structure.19-21 The peeling of the film could be due to acompetition between crystal growth and dissolution; at short
reaction times, the supersaturation of the titanium salt is high,and nanorods grow. When the growth is carried out for longertimes, the crystal growth rate starts to decrease as the systemapproaches equilibrium. At this point, crystal dissolution onhigh-energy surfaces such as the FTO-nanorod surface canbecome important. Indeed, this interface is strained due to thelattice mismatch between the FTO and the rutile nanorods andcan dissolve even though the rest of the nanorod film is inequilibrium with the solution. After the TiO2 nanorod film islifted off the substrate, the substrate remains conductive whichindicates that the film is peeling off at the FTO-nanorodinterface.
At first it may appear that the TiO2 nanorod film peeling off the substrate is a significant disadvantage and may limit the
applications of these nanorods. If the reaction is carried out fora long time (e.g., 24 h) and allowed to reach equilibrium, theTiO2 nanorod films do peel off from the FTO substrate.However, if the reaction is stopped before reaching the reactionequilibrium (e.g., less than ∼20 h), peeling is not observed.Following, the TiO2 nanorod film can be grown longer byplacing the substrate (with the nanorods) in a fresh solution andcontinuing the growth. For example, we grew TiO2 nanorod
(18) Pottier, A.; Chaneac, C.; Tronc, E.; Mazerolles, L.; Jolivet, J. P. J.
Mater. Chem. 2001, 11, 1161–1121.
(19) Durr, M.; Schmid, A.; Obermaier, M.; Rosselli, S.; Yasuda, A.; Nelles,G. Nat. Mater. 2005, 4, 607–611.
(20) Zhang, D. S.; Yoshida, T.; Minoura, H. Ad V. Mater. 2003, 15, 814–817.
(21) Park, J. H.; Lee, T.-W.; Kang, M. G. Chem. Commun. 2008, 25, 2867–
2869.
Figure 2. FESEM images of oriented rutile TiO2 nanorod film grown onFTO substrate in 30 mL of deionized water, 30 mL of hydrochloric acid,and 1 mL of titanium butoxide at 150 °C for 20 h. (a) top view, (b) cross-sectional view, (c) and (d) tilted cross-sectional views.
Figure 3. (a) HRTEM image of a single TiO2 nanorod shown in the inset;(b) SAED pattern of the same TiO2 nanorod.
J. AM. CHEM. SOC. 9 VOL. 131, NO. 11, 2009 3987
Single-Crystalline Rutile TiO 2 Nanorods Grown for DSSCs A R T I C L E S
8/12/2019 Ja 8078972
http://slidepdf.com/reader/full/ja-8078972 4/6
films that are as thick as 8 µm by changing the growth solutionevery 4 h. These films remained adhered to the FTO and didnot peel off the substrate (Supporting Information, SI-3). Inprinciple, the TiO2 nanorod films can be grown to desiredlengths by refreshing the growth solution before the reactionreaches equilibrium.
Effect of Growth Temperature. TiO2 nanorods did not growon the FTO substrates when the temperature was less than100 °C. On the other hand, increasing the hydrothermal reaction
temperature from 150 to 200 °C increased the growth rate by afactor of 5 (Supporting Information, SI-4). The average diameterof the nanorods grown at 200 °C was slightly smaller. At 200 °C,the film begins to peel off the substrate after 6 h of reaction,and the thickness of the free-standing film is comparable to thatobtained at 150 °C. At 200 °C, the solution reaches equilibriumfaster, and as a result, dissolution that causes the peeling of thefilm begins earlier.
Effect of Substrates. Oriented TiO2 nanorod film could onlybe grown on FTO substrates. Experiments to grow TiO2
nanorods on glass or silicon substrates were unsuccessful,indicating that nucleation and growth may require epitaxy onFTO crystals. In fact, the FTO substrate also has the tetragonalrutile structure, and the lattice mismatch between the tetragonalFTO (a ) b ) 0.4687 nm)22 and rutile TiO2 (a ) b ) 0.4594nm)23 is 2%. This small lattice mismatch may promote theepitaxial nucleation and growth of rutile TiO2 nanorods on FTOalthough conclusive proof of this hypothesis would require acareful study of the FTO-nanorod interface using transmissionelectron microscopy. We base our hypothesis on three observa-tions. First TiO2 nanorod array could only be grown on FTO.Second, TiO2 nanorods are firmly attached on the FTO substrateand could not be detached even with the aid of ultrasonication.Finally, when the FTO film is patterned by removing portionsof it from the substrate by etching, the TiO2 nanorod array couldonly be grown selectively on the remaining FTO film. It ispossible to have epitaxial growth from a polycrystalline film
with majority of the TiO2 nanorods aligned nearly normal tothe substrate because FTO films on glass are highly texturedwith grains aligned preferentially in the (200) direction.Nevertheless, not all grains are aligned, and a significant numberof TiO2 nanorods grow off normal angles to the substrate. Thesenanorods run into nearby nanorods and stop growing. Thus, onlythose nanorods with axis nearly aligned with the substratenormal continue growing and give the nanorod film the array-like appearance. Indeed, using a nanowire diameter of 90 nmand an areal density of 40 nanowires/ µm2, we calculate thatnanowires cover only ∼25% of the substrate surface and highernanowire densities are possible. Thus, not all FTO grains giverise to nanowires that grow normal to the surface. Obviously,
if our hypothesis of epitaxy is correct, one way to increasenanowire density would be to increase the texture of the FTOfilm.
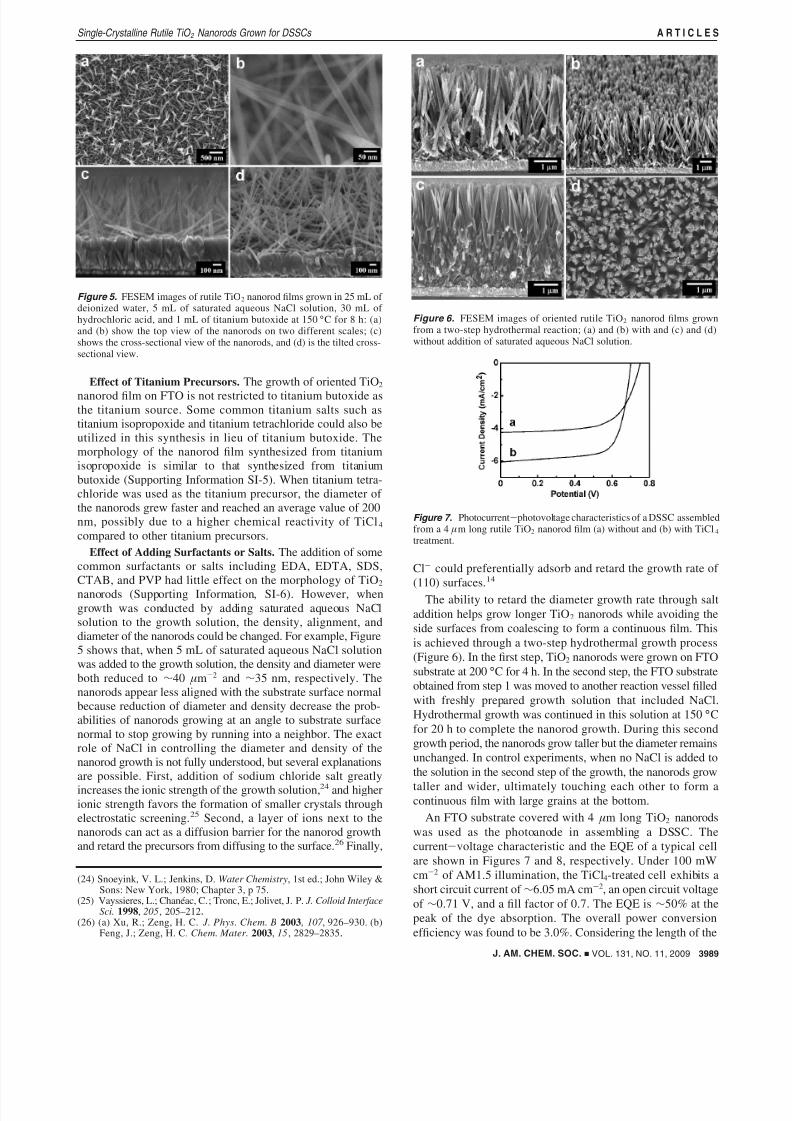
Effect of Initial Reactant Concentration. The density of thenanorods could be varied by changing the initial titaniumprecursor concentration in the growth solution. Figure 4 showsthat the density of the nanorods could be varied between ∼4 to∼50 µm-2 by increasing the initial titanium butoxide in thegrowth solution from 0.5 to 1 mL. Further increase in the amountof titanium butoxide causes rapid hydrolysis and homogeneous
precipitation as soon as it is added to the growth solution. Thegrowth solution remains turbid even after prolonged stirring,and the nanorods that grow under this condition are found tobe covered by dendritic particles that have nucleated homoge-neously and have settled on the nanorods film. It appears thatwhen the titanium precursor concentration is low, the nanorodsare not as aligned as those grown using higher titanium precursorconcentrations. However, this appearance is a result of thechanging nucleation density. When nucleation density is high,the nanorods growing at an angle to the substrate surface normalrun into neighboring nanorods and stop growing (see forexample shorter nanorods near the FTO surface in Figure 4d).On the other hand, when nucleation density is low, the nanorods
at an angle can keep growing to longer lengths since theprobability of running into a neighbor decreases. The nanorodscan nucleate and grow at an angle to the substrate surface normalbecause the FTO is polycrystalline and its surface is rough. Thus,even though nanorods grow epitaxially, some FTO grains maybe oriented such that nanorods grow at an angle to the substratesurface normal.
Effect of Acidity. The growth of TiO2 nanorods on FTOsubstrate was favored when a mixed solution containing 30 mLof deionized water and 30 mL of hydrochloric acid was used.Increasing the volume of deionized water with respect to thevolume of hydrochloric acid while keeping the total volume of the growth solution constant increased the hydrolysis rate of titanium butoxide. In fact, when titanium butoxide was intro-
duced into 60 mL of deionized water, TiO2 precipitatedimmediately. No nanorods were found on FTO substrate afterhydrothermal growth in this solution. Thus, in the absence of hydrochloric acid or at low hydrochloric acid concentrations,all the titanium precursor precipitates and settles to the bottomof the reaction vessel as TiO2, and none remains available fornanorod growth. Extremely low pH suppresses the hydrolysisof titanium butoxide. When a growth solution containing 15mL of deionized water and 45 mL of hydrochloric acid wasused, the solution remained clear after hydrothermal reaction,and TiO2 did not form on the FTO substrate or in thehomogeneous phase. Thus, we conclude that growth of orientedTiO2 nanorods requires slow hydrolysis of titanium butoxide
in a fairly strong acidic aqueous medium.
(22) Abd-Lefdil, M.; Diaz, R.; Bihri, H.; Aouaj, M. A.; Rueda, F. Eur.Phys. J. Appl. Phys 2007, 38, 217–219.
(23) Howard, C. J.; Sabine, T. M.; Dickson, F. Acta Crystallogr., Sect. B
1991, 47 , 462–468.
Figure 4. FESEM images of oriented rutile TiO2 nanorod films grown at150 °C for 18 h with different amounts of titanium butoxide in a mixtureof 30 mL of deionized water and 30 mL of hydrochloric acid; (a) 0.5 mL,(b) 0.75 mL, (c) 0.85 mL, and (d) 1 mL of titanium butoxide.
3988 J. AM. CHEM. SOC. 9 VOL. 131, NO. 11, 2009
A R T I C L E S Liu and Aydil
8/12/2019 Ja 8078972
http://slidepdf.com/reader/full/ja-8078972 5/6
Effect of Titanium Precursors. The growth of oriented TiO2
nanorod film on FTO is not restricted to titanium butoxide asthe titanium source. Some common titanium salts such astitanium isopropoxide and titanium tetrachloride could also beutilized in this synthesis in lieu of titanium butoxide. Themorphology of the nanorod film synthesized from titaniumisopropoxide is similar to that synthesized from titaniumbutoxide (Supporting Information SI-5). When titanium tetra-chloride was used as the titanium precursor, the diameter of the nanorods grew faster and reached an average value of 200nm, possibly due to a higher chemical reactivity of TiCl4
compared to other titanium precursors.Effect of Adding Surfactants or Salts. The addition of some
common surfactants or salts including EDA, EDTA, SDS,CTAB, and PVP had little effect on the morphology of TiO2
nanorods (Supporting Information, SI-6). However, whengrowth was conducted by adding saturated aqueous NaClsolution to the growth solution, the density, alignment, anddiameter of the nanorods could be changed. For example, Figure5 shows that, when 5 mL of saturated aqueous NaCl solutionwas added to the growth solution, the density and diameter wereboth reduced to ∼40 µm-2 and ∼35 nm, respectively. Thenanorods appear less aligned with the substrate surface normalbecause reduction of diameter and density decrease the prob-abilities of nanorods growing at an angle to substrate surfacenormal to stop growing by running into a neighbor. The exact
role of NaCl in controlling the diameter and density of thenanorod growth is not fully understood, but several explanationsare possible. First, addition of sodium chloride salt greatlyincreases the ionic strength of the growth solution,24 and higherionic strength favors the formation of smaller crystals throughelectrostatic screening.25 Second, a layer of ions next to thenanorods can act as a diffusion barrier for the nanorod growthand retard the precursors from diffusing to the surface.26 Finally,
Cl- could preferentially adsorb and retard the growth rate of (110) surfaces.14
The ability to retard the diameter growth rate through saltaddition helps grow longer TiO2 nanorods while avoiding theside surfaces from coalescing to form a continuous film. Thisis achieved through a two-step hydrothermal growth process(Figure 6). In the first step, TiO2 nanorods were grown on FTOsubstrate at 200 °C for 4 h. In the second step, the FTO substrateobtained from step 1 was moved to another reaction vessel filledwith freshly prepared growth solution that included NaCl.Hydrothermal growth was continued in this solution at 150 °Cfor 20 h to complete the nanorod growth. During this second
growth period, the nanorods grow taller but the diameter remainsunchanged. In control experiments, when no NaCl is added tothe solution in the second step of the growth, the nanorods growtaller and wider, ultimately touching each other to form acontinuous film with large grains at the bottom.
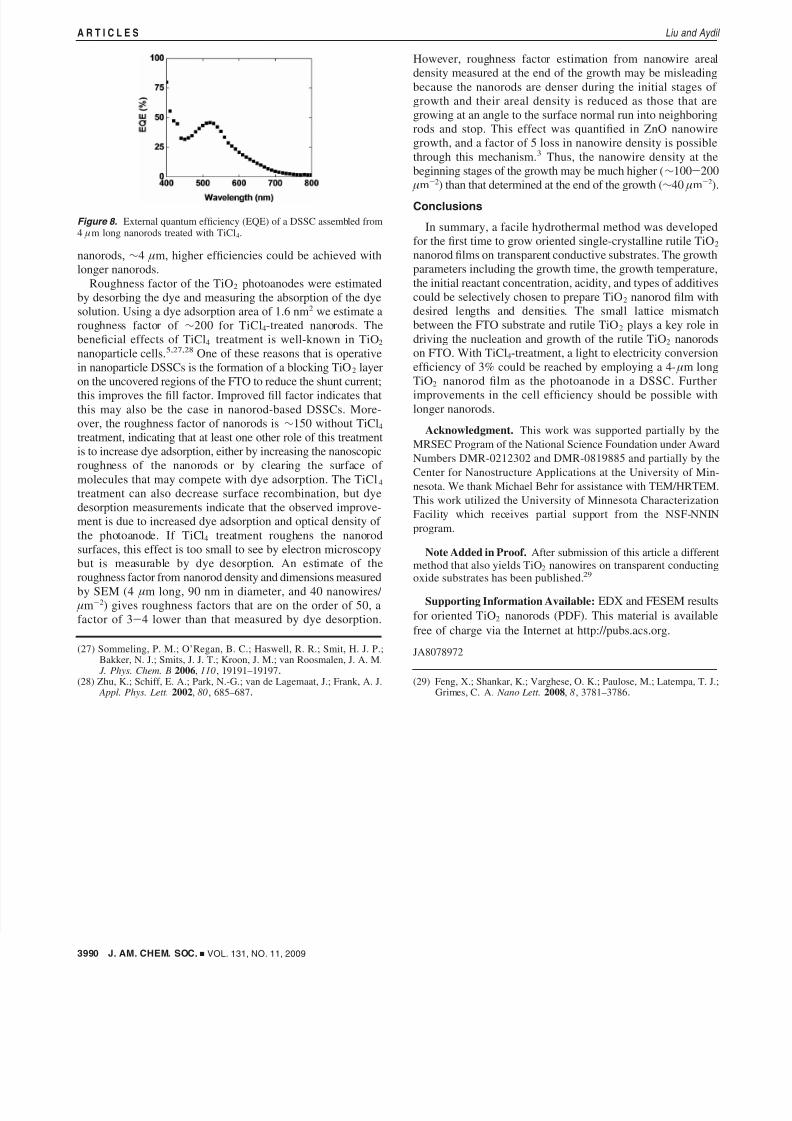
An FTO substrate covered with 4 µm long TiO2 nanorodswas used as the photoanode in assembling a DSSC. Thecurrent-voltage characteristic and the EQE of a typical cellare shown in Figures 7 and 8, respectively. Under 100 mWcm-2 of AM1.5 illumination, the TiCl4-treated cell exhibits ashort circuit current of ∼6.05 mA cm-2, an open circuit voltageof ∼0.71 V, and a fill factor of 0.7. The EQE is ∼50% at thepeak of the dye absorption. The overall power conversion
efficiency was found to be 3.0%. Considering the length of the
(24) Snoeyink, V. L.; Jenkins, D. Water Chemistry, 1st ed.; John Wiley &Sons: New York, 1980; Chapter 3, p 75.
(25) Vayssieres, L.; Chaneac, C.; Tronc, E.; Jolivet, J. P. J. Colloid InterfaceSci. 1998, 205, 205–212.
(26) (a) Xu, R.; Zeng, H. C. J. Phys. Chem. B 2003, 107 , 926–930. (b)
Feng, J.; Zeng, H. C. Chem. Mater. 2003, 15, 2829–2835.
Figure 5. FESEM images of rutile TiO2 nanorod films grown in 25 mL of deionized water, 5 mL of saturated aqueous NaCl solution, 30 mL of hydrochloric acid, and 1 mL of titanium butoxide at 150 °C for 8 h: (a)and (b) show the top view of the nanorods on two different scales; (c)shows the cross-sectional view of the nanorods, and (d) is the tilted cross-sectional view.
Figure 6. FESEM images of oriented rutile TiO2 nanorod films grownfrom a two-step hydrothermal reaction; (a) and (b) with and (c) and (d)without addition of saturated aqueous NaCl solution.
Figure 7. Photocurrent-photovoltage characteristics of a DSSC assembledfrom a 4 µm long rutile TiO2 nanorod film (a) without and (b) with TiCl4
treatment.
J. AM. CHEM. SOC. 9 VOL. 131, NO. 11, 2009 3989
Single-Crystalline Rutile TiO 2 Nanorods Grown for DSSCs A R T I C L E S
8/12/2019 Ja 8078972
http://slidepdf.com/reader/full/ja-8078972 6/6