Embed Size (px)
Citation preview
J7.4 ANALYSES OF KENNEDY SPACE CENTER TROPOSPHERIC DOPPLER RADAR WIND PROFILER DATA FOR SPACE LAUNCH SYSTEM PROGRAM CERTIFICATION
Robert E. Barbré, Jr.*1
With co-authors listed alphabetically by last name:
James Brenton1, Dr. K. Lee Burns1, Nathan Curtis2, Ryan Decker2, Dr. Lisa Huddleston3, Frank Leahy2, John Orcutt1, Barry Roberts2, and Patrick White2
1Jacobs Space Exploration Group 2NASA Marshall Space Flight Center Natural Environments Branch
3NASA Kennedy Space Center Weather
1. INTRODUCTION This paper documents the methodology and results of analyses used to certify the Kennedy Space Center (KSC) Tropospheric Doppler Radar Wind Profiler (TDRWP) as input to launch commit evaluations for the National Aeronautics and Space Administration’s (NASA) Space Launch System Program (SLSP). These analyses, and the requirements that they address, were designed by the Marshall Space Flight Center Natural Environments Branch (MSFC NE) to certify that the TDRWP provides data of sufficient accuracy and resolution for SLSP, and that the instrument provides enough reliability to support Day-of-Launch Initialization Loads Update (DOLILU) operations. On day-of-launch (DOL), space launch vehicle operators have used data from wind profilers to reverse a previous GO call in prelaunch loads and trajectory assessments due to the profiler’s capability to quickly identify changes in the wind profile within a rapidly changing wind environment. Certification of the TDRWP would allow SLSP to use DOL wind data generated by the TDRWP to design the vehicle trajectory and to verify trajectory and load constraints during the countdown for launch commit decision. The TDRWP comprises of a completely new antenna field, beam configuration, and updated computational hardware and software from the previous 50-MHz DRWP. The TDRWP replaces the previous three-beam system made of coaxial cables and a copper wire ground plane with a four-beam system that uses Yagi antennae with enhanced beam steering capability. In addition, the TDRWP contains updated user interface software while maintaining the same general capability as the previous system. The TDRWP continues to use the Median Filter First Guess (MFFG) algorithm
*Corresponding Author Address: Robert E. Barbré, Jr., Jacobs Space Exploration Group. 620 Discovery Dr.; Huntsville, AL; 35806; email: [email protected].
(Schumann, et al., 1999) to generate a wind profile from Doppler spectra at each range gate. The TDRWP upgrade Statement of Work (Team Qinetiq North America, 2012) contains further details on the upgrade. The TDRWP system performance and data generated had to be evaluated through a series of tests prior to the system being certified for use at the Eastern Range (ER) and for launch vehicle operations. Tests were segmented into an Operational Acceptance Test (OAT) and a comprehensive year-long Certification Test. MSFC NE performed two OATs in an effort to approve TDRWP data for situational awareness purposes at the ER during launch operations while, at the same time, collecting data for the year-long certification analyses. The OATs showed that end users can utilize the TDRWP in a similar manner to the previous 50-MHz DRWP during launch operations in the midst of a long-term certification process. Details of the OATs and other activities leading to TDRWP certification are contained in Marshall Space Flight Center Natural Environments (2014), Barbré, et al. (2016), DeTect, Inc. and Radiometrics, Inc. (n.d.), and Barbré (2016). Additionally, Barbré (2018) provides the genesis of this paper and additional details of the TDRWP certification analyses. This paper describes MSFC NE’s analyses to verify the quality and accuracy of the TDRWP’s wind data output for SLSP as compared to the TDRWP certification requirements. Ultimately, each launch vehicle program has the responsibility to certify the system for its use. 2. CERTIFICATION REQUIREMENTS
Table 1 presents the SLSP specific TDRWP certification requirements, as well as their criteria and rationale. The variables of interest consist of validating the specified time interval, vertical data interval, data collection period, wind accuracy, altitude, and effective vertical resolution (EVR). The
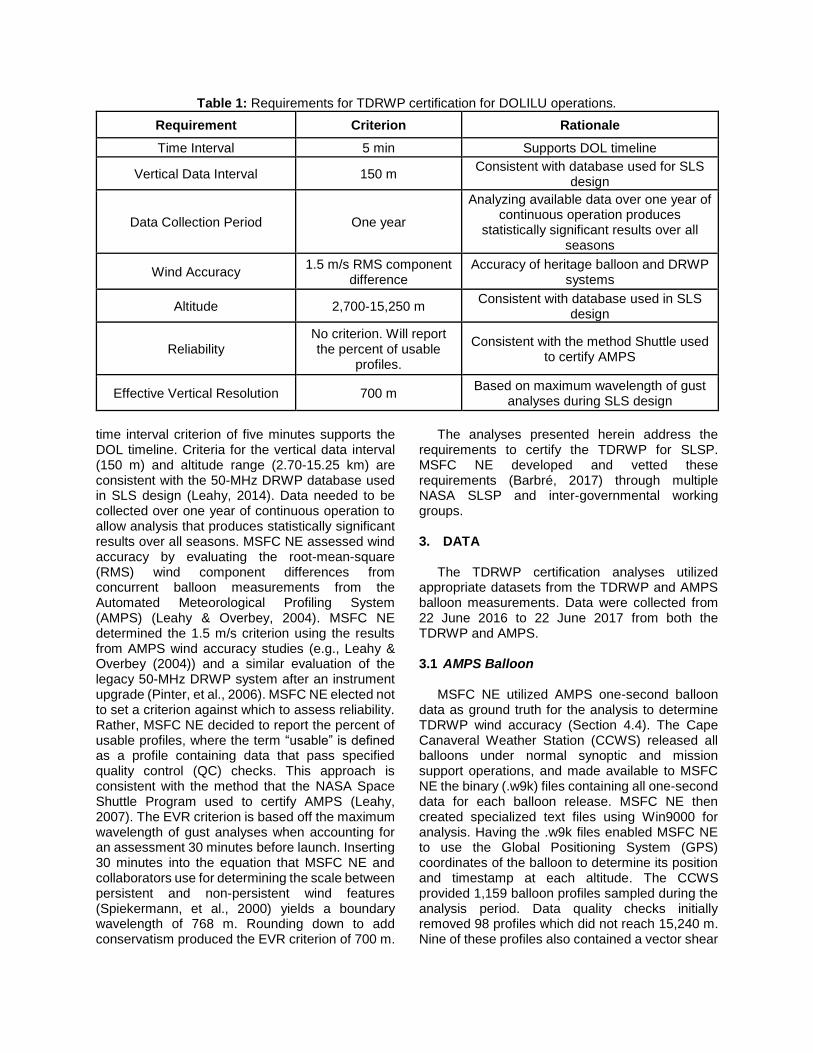
Table 1: Requirements for TDRWP certification for DOLILU operations.
Requirement Criterion Rationale
Time Interval 5 min Supports DOL timeline
Vertical Data Interval 150 m Consistent with database used for SLS
design
Data Collection Period One year
Analyzing available data over one year of continuous operation produces
statistically significant results over all seasons
Wind Accuracy 1.5 m/s RMS component
difference Accuracy of heritage balloon and DRWP
systems
Altitude 2,700-15,250 m Consistent with database used in SLS
design
Reliability No criterion. Will report the percent of usable
profiles.
Consistent with the method Shuttle used to certify AMPS
Effective Vertical Resolution 700 m Based on maximum wavelength of gust
analyses during SLS design
time interval criterion of five minutes supports the DOL timeline. Criteria for the vertical data interval (150 m) and altitude range (2.70-15.25 km) are consistent with the 50-MHz DRWP database used in SLS design (Leahy, 2014). Data needed to be collected over one year of continuous operation to allow analysis that produces statistically significant results over all seasons. MSFC NE assessed wind accuracy by evaluating the root-mean-square (RMS) wind component differences from concurrent balloon measurements from the Automated Meteorological Profiling System (AMPS) (Leahy & Overbey, 2004). MSFC NE determined the 1.5 m/s criterion using the results from AMPS wind accuracy studies (e.g., Leahy & Overbey (2004)) and a similar evaluation of the legacy 50-MHz DRWP system after an instrument upgrade (Pinter, et al., 2006). MSFC NE elected not to set a criterion against which to assess reliability. Rather, MSFC NE decided to report the percent of usable profiles, where the term “usable” is defined as a profile containing data that pass specified quality control (QC) checks. This approach is consistent with the method that the NASA Space Shuttle Program used to certify AMPS (Leahy, 2007). The EVR criterion is based off the maximum wavelength of gust analyses when accounting for an assessment 30 minutes before launch. Inserting 30 minutes into the equation that MSFC NE and collaborators use for determining the scale between persistent and non-persistent wind features (Spiekermann, et al., 2000) yields a boundary wavelength of 768 m. Rounding down to add conservatism produced the EVR criterion of 700 m.
The analyses presented herein address the requirements to certify the TDRWP for SLSP. MSFC NE developed and vetted these requirements (Barbré, 2017) through multiple NASA SLSP and inter-governmental working groups. 3. DATA The TDRWP certification analyses utilized appropriate datasets from the TDRWP and AMPS balloon measurements. Data were collected from 22 June 2016 to 22 June 2017 from both the TDRWP and AMPS. 3.1 AMPS Balloon MSFC NE utilized AMPS one-second balloon data as ground truth for the analysis to determine TDRWP wind accuracy (Section 4.4). The Cape Canaveral Weather Station (CCWS) released all balloons under normal synoptic and mission support operations, and made available to MSFC NE the binary (.w9k) files containing all one-second data for each balloon release. MSFC NE then created specialized text files using Win9000 for analysis. Having the .w9k files enabled MSFC NE to use the Global Positioning System (GPS) coordinates of the balloon to determine its position and timestamp at each altitude. The CCWS provided 1,159 balloon profiles sampled during the analysis period. Data quality checks initially removed 98 profiles which did not reach 15,240 m. Nine of these profiles also contained a vector shear
exceeding 0.15 s-1 over 30.5 m somewhere in the profile. An additional 31 balloons were released less than five minutes after the previous balloon. Implementing these checks left 1,030 profiles available for analysis. 3.2 TDRWP MSFC NE utilized TDRWP data that were transmitted in the Meteorological Data Transfer Format (MDTF) via the Meteorological Interactive Data Display System (MIDDS) for the certification analysis. The MDTF of TDRWP output files contain altitude, wind speed, wind direction, radial shear, vertical velocity, signal power, noise level, number of first guess propagations (FGP), and QC flags for each profile. The number of FGPs represent the number of consecutive instances in which the same first guess velocity (FGV) is used to estimate the wind as part of the MFFG algorithm (Schumann, et al., 1999). The TDRWP is a four-beam system, but the MDTF formatted output file format could not be changed from the previous three-beam system. Therefore, the oblique beam signal, noise, and spectral width fields represent opposing-beam averages and the vertical beam field represents averages over all beams. In addition, the FGP field represents the opposing-beam maximum, and the QC field (DeTect, Inc., 2014) contains indicators that relate to any TDRWP internal data quality checks that were tripped. Approximately five minutes exist between temporally adjacent profiles, and altitude coverage ranges from 1,798-19,430 m, at near 150 m intervals. This analysis utilized data files produced by the MSFC NE meteorological data archive process (Brenton, 2016), which combines all of the TDRWP files from MIDDS into files containing TDRWP data for individual days. This analysis used TDRWP data with and without implementing QC screening techniques. The following subsections describe each dataset. 3.2.1 TDRWP Data Without QC
The TDRWP dataset without QC consists of all data strictly as received through MIDDS. This dataset contains temporal data gaps corresponding to the frequency of data reception, as well as any suspect or erroneous data that were recorded. The analyses used TDRWP data without QC to assess the requirements for time interval, vertical data interval, data collection period, and reliability. 3.2.2 TDRWP Data With QC
The TDRWP dataset with QC consists of applying QC checks to the TDRWP data in a similar manner to generating DRWP climatologies. Using this dataset attempted to mimic the DOL QC process which consists of adjusting the FGV in real-time to ensure good quality of the wind produced by the Doppler return spectra. MSFC NE could not replicate this QC process, as the spectra were not available over the period of record (POR). Thus, automated and manual QC checks were applied in an attempt to remove the suspect and erroneous features that would likely be removed by the DOL QC process from adjusting the FGV. These checks were based largely from Barbré (2012), but some modifications were made for the TDRWP data. The QC’ed TDRWP dataset was used to address requirements for wind accuracy, altitude, reliability, and EVR. The TDRWP data were screened for convection prior to implementing the subsequent checks. Following Barbré (2012), this process first identified periods of convection at each time and altitude using the automated algorithm derived for the previous 50-MHz DRWP. The QC implementation then manually removed parts of profiles that contained extensive vertical regions of flagged data that corresponded to suspect characteristics in the wind field. The automated process applied the checks described in
Table 2 in sequence to all profiles. Temporal data gaps exceeding five minutes were filled with missing data, and the thresholds for unrealistic wind, spectral width, internal shear, vertical velocity, meteorological shear, small median, missing signal, and isolated datum are identical to Barbré (2012). The manual QC process entailed visually examining multiple variables over each day during the analysis period, and removing instances of leftover suspect or erroneous data that the
automated process did not flag. Note that this assessment did not include the vertical beam checks in Barbré (2012) as the TDRWP does not have a vertical beam. This assessment included additional checks for inconsistent data, and did not include a check for excessive FGP. Barbré (2018) contains further details on the analyses performed to derive the inconsistent data check and that generated result for the FGP check.
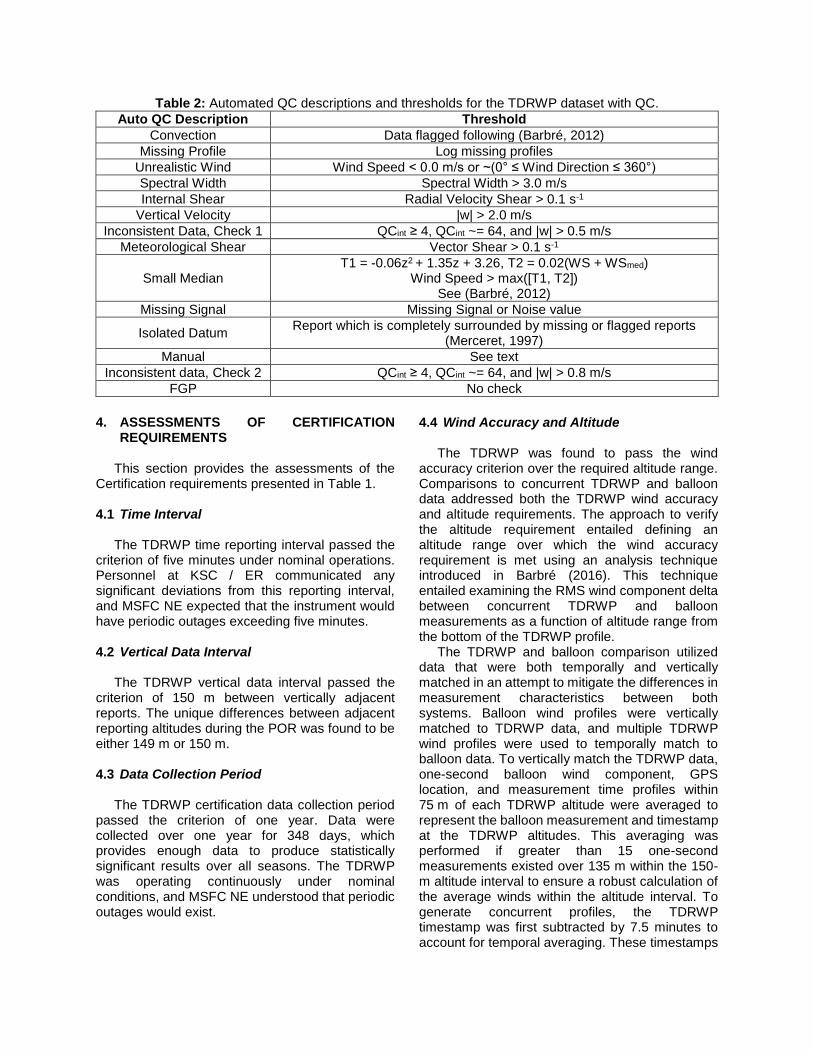
Table 2: Automated QC descriptions and thresholds for the TDRWP dataset with QC.
Auto QC Description Threshold
Convection Data flagged following (Barbré, 2012)
Missing Profile Log missing profiles
Unrealistic Wind Wind Speed < 0.0 m/s or ~(0° ≤ Wind Direction ≤ 360°)
Spectral Width Spectral Width > 3.0 m/s
Internal Shear Radial Velocity Shear > 0.1 s-1
Vertical Velocity |w| > 2.0 m/s
Inconsistent Data, Check 1 QCint ≥ 4, QCint ~= 64, and |w| > 0.5 m/s
Meteorological Shear Vector Shear > 0.1 s-1
Small Median T1 = -0.06z2 + 1.35z + 3.26, T2 = 0.02(WS + WSmed)
Wind Speed > max([T1, T2]) See (Barbré, 2012)
Missing Signal Missing Signal or Noise value
Isolated Datum Report which is completely surrounded by missing or flagged reports
(Merceret, 1997)
Manual See text
Inconsistent data, Check 2 QCint ≥ 4, QCint ~= 64, and |w| > 0.8 m/s
FGP No check
4. ASSESSMENTS OF CERTIFICATION
REQUIREMENTS This section provides the assessments of the Certification requirements presented in Table 1. 4.1 Time Interval The TDRWP time reporting interval passed the criterion of five minutes under nominal operations. Personnel at KSC / ER communicated any significant deviations from this reporting interval, and MSFC NE expected that the instrument would have periodic outages exceeding five minutes.
4.2 Vertical Data Interval The TDRWP vertical data interval passed the criterion of 150 m between vertically adjacent reports. The unique differences between adjacent reporting altitudes during the POR was found to be either 149 m or 150 m. 4.3 Data Collection Period The TDRWP certification data collection period passed the criterion of one year. Data were collected over one year for 348 days, which provides enough data to produce statistically significant results over all seasons. The TDRWP was operating continuously under nominal conditions, and MSFC NE understood that periodic outages would exist.
4.4 Wind Accuracy and Altitude
The TDRWP was found to pass the wind accuracy criterion over the required altitude range. Comparisons to concurrent TDRWP and balloon data addressed both the TDRWP wind accuracy and altitude requirements. The approach to verify the altitude requirement entailed defining an altitude range over which the wind accuracy requirement is met using an analysis technique introduced in Barbré (2016). This technique entailed examining the RMS wind component delta between concurrent TDRWP and balloon measurements as a function of altitude range from the bottom of the TDRWP profile. The TDRWP and balloon comparison utilized data that were both temporally and vertically matched in an attempt to mitigate the differences in measurement characteristics between both systems. Balloon wind profiles were vertically matched to TDRWP data, and multiple TDRWP wind profiles were used to temporally match to balloon data. To vertically match the TDRWP data, one-second balloon wind component, GPS location, and measurement time profiles within 75 m of each TDRWP altitude were averaged to represent the balloon measurement and timestamp at the TDRWP altitudes. This averaging was performed if greater than 15 one-second measurements existed over 135 m within the 150-m altitude interval to ensure a robust calculation of the average winds within the altitude interval. To generate concurrent profiles, the TDRWP timestamp was first subtracted by 7.5 minutes to account for temporal averaging. These timestamps
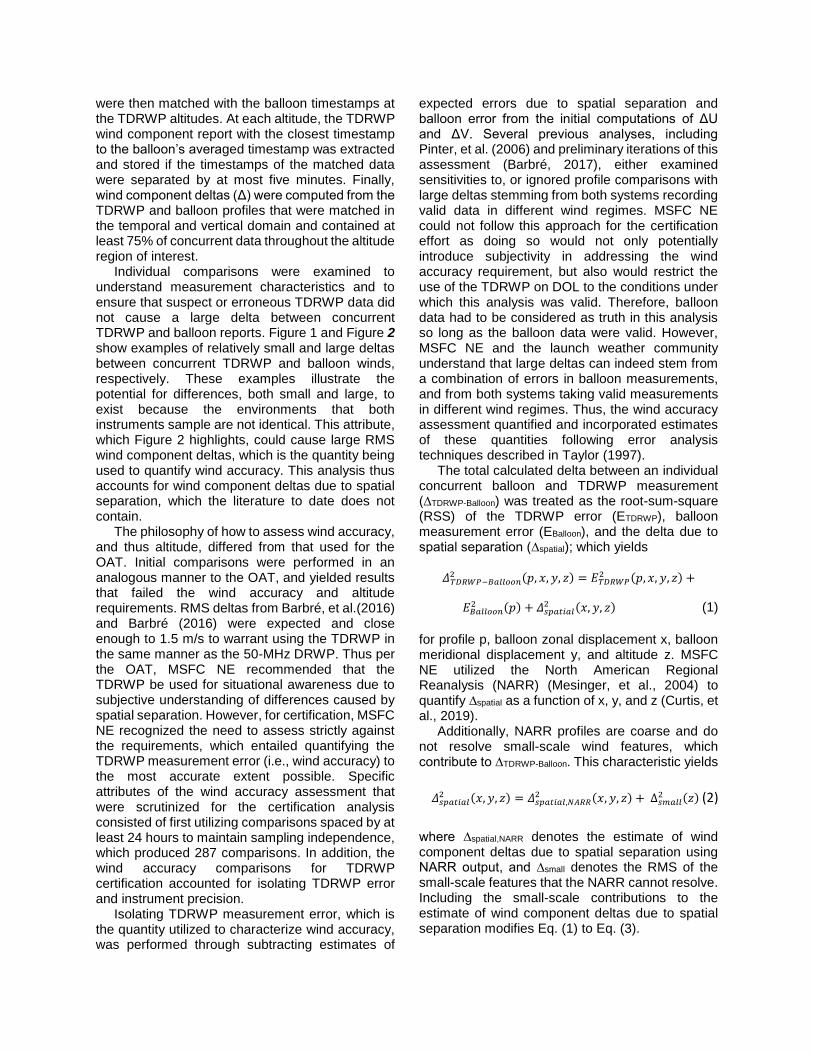
were then matched with the balloon timestamps at the TDRWP altitudes. At each altitude, the TDRWP wind component report with the closest timestamp to the balloon’s averaged timestamp was extracted and stored if the timestamps of the matched data were separated by at most five minutes. Finally, wind component deltas (Δ) were computed from the TDRWP and balloon profiles that were matched in the temporal and vertical domain and contained at least 75% of concurrent data throughout the altitude region of interest. Individual comparisons were examined to understand measurement characteristics and to ensure that suspect or erroneous TDRWP data did not cause a large delta between concurrent TDRWP and balloon reports. Figure 1 and Figure 2 show examples of relatively small and large deltas between concurrent TDRWP and balloon winds, respectively. These examples illustrate the potential for differences, both small and large, to exist because the environments that both instruments sample are not identical. This attribute, which Figure 2 highlights, could cause large RMS wind component deltas, which is the quantity being used to quantify wind accuracy. This analysis thus accounts for wind component deltas due to spatial separation, which the literature to date does not contain. The philosophy of how to assess wind accuracy, and thus altitude, differed from that used for the OAT. Initial comparisons were performed in an analogous manner to the OAT, and yielded results that failed the wind accuracy and altitude requirements. RMS deltas from Barbré, et al.(2016) and Barbré (2016) were expected and close enough to 1.5 m/s to warrant using the TDRWP in the same manner as the 50-MHz DRWP. Thus per the OAT, MSFC NE recommended that the TDRWP be used for situational awareness due to subjective understanding of differences caused by spatial separation. However, for certification, MSFC NE recognized the need to assess strictly against the requirements, which entailed quantifying the TDRWP measurement error (i.e., wind accuracy) to the most accurate extent possible. Specific attributes of the wind accuracy assessment that were scrutinized for the certification analysis consisted of first utilizing comparisons spaced by at least 24 hours to maintain sampling independence, which produced 287 comparisons. In addition, the wind accuracy comparisons for TDRWP certification accounted for isolating TDRWP error and instrument precision. Isolating TDRWP measurement error, which is the quantity utilized to characterize wind accuracy, was performed through subtracting estimates of
expected errors due to spatial separation and balloon error from the initial computations of ΔU and ΔV. Several previous analyses, including Pinter, et al. (2006) and preliminary iterations of this assessment (Barbré, 2017), either examined sensitivities to, or ignored profile comparisons with large deltas stemming from both systems recording valid data in different wind regimes. MSFC NE could not follow this approach for the certification effort as doing so would not only potentially introduce subjectivity in addressing the wind accuracy requirement, but also would restrict the use of the TDRWP on DOL to the conditions under which this analysis was valid. Therefore, balloon data had to be considered as truth in this analysis so long as the balloon data were valid. However, MSFC NE and the launch weather community understand that large deltas can indeed stem from a combination of errors in balloon measurements, and from both systems taking valid measurements in different wind regimes. Thus, the wind accuracy assessment quantified and incorporated estimates of these quantities following error analysis techniques described in Taylor (1997). The total calculated delta between an individual concurrent balloon and TDRWP measurement (∆TDRWP-Balloon) was treated as the root-sum-square (RSS) of the TDRWP error (ETDRWP), balloon measurement error (EBalloon), and the delta due to spatial separation (∆spatial); which yields
𝛥𝑇𝐷𝑅𝑊𝑃−𝐵𝑎𝑙𝑙𝑜𝑜𝑛2 (𝑝, 𝑥, 𝑦, 𝑧) = 𝐸𝑇𝐷𝑅𝑊𝑃
2 (𝑝, 𝑥, 𝑦, 𝑧) +
𝐸𝐵𝑎𝑙𝑙𝑜𝑜𝑛2 (𝑝) + 𝛥𝑠𝑝𝑎𝑡𝑖𝑎𝑙
2 (𝑥, 𝑦, 𝑧) (1)
for profile p, balloon zonal displacement x, balloon meridional displacement y, and altitude z. MSFC NE utilized the North American Regional Reanalysis (NARR) (Mesinger, et al., 2004) to quantify ∆spatial as a function of x, y, and z (Curtis, et al., 2019). Additionally, NARR profiles are coarse and do not resolve small-scale wind features, which contribute to ∆TDRWP-Balloon. This characteristic yields
𝛥𝑠𝑝𝑎𝑡𝑖𝑎𝑙2 (𝑥, 𝑦, 𝑧) = 𝛥𝑠𝑝𝑎𝑡𝑖𝑎𝑙,𝑁𝐴𝑅𝑅
2 (𝑥, 𝑦, 𝑧) + ∆𝑠𝑚𝑎𝑙𝑙2 (𝑧) (2)
where ∆spatial,NARR denotes the estimate of wind component deltas due to spatial separation using NARR output, and ∆small denotes the RMS of the small-scale features that the NARR cannot resolve. Including the small-scale contributions to the estimate of wind component deltas due to spatial separation modifies Eq. (1) to Eq. (3).
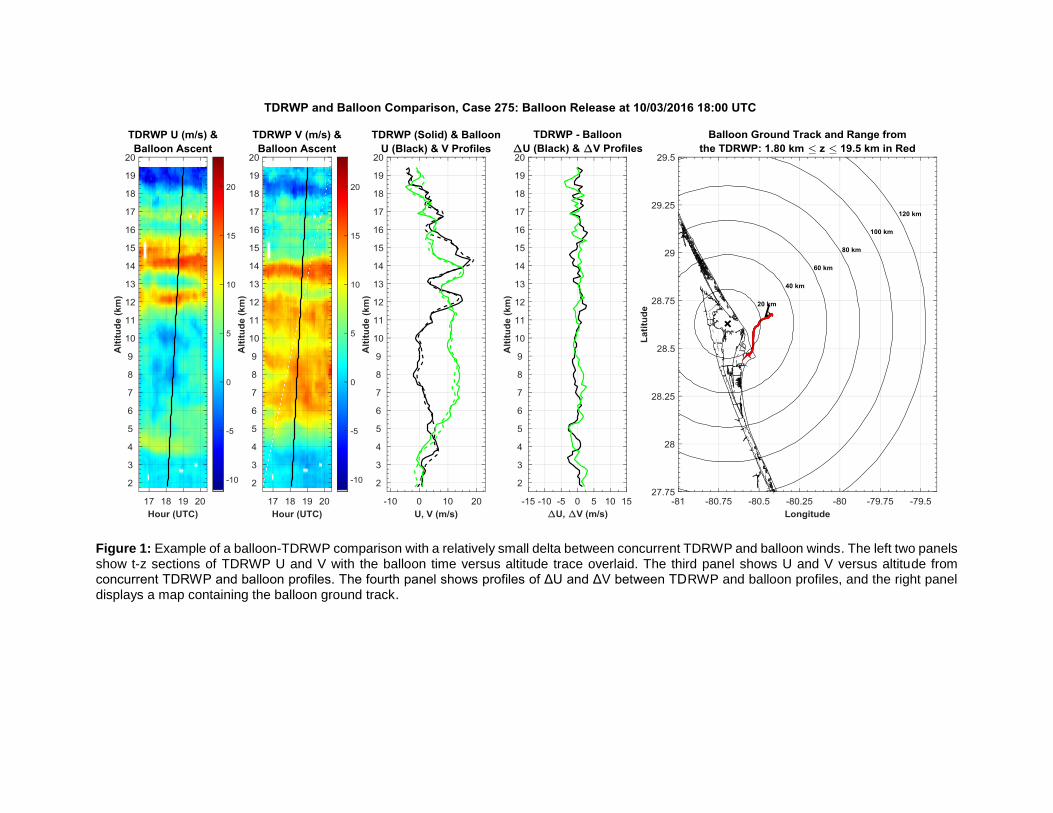
Figure 1: Example of a balloon-TDRWP comparison with a relatively small delta between concurrent TDRWP and balloon winds. The left two panels show t-z sections of TDRWP U and V with the balloon time versus altitude trace overlaid. The third panel shows U and V versus altitude from concurrent TDRWP and balloon profiles. The fourth panel shows profiles of ΔU and ΔV between TDRWP and balloon profiles, and the right panel displays a map containing the balloon ground track.
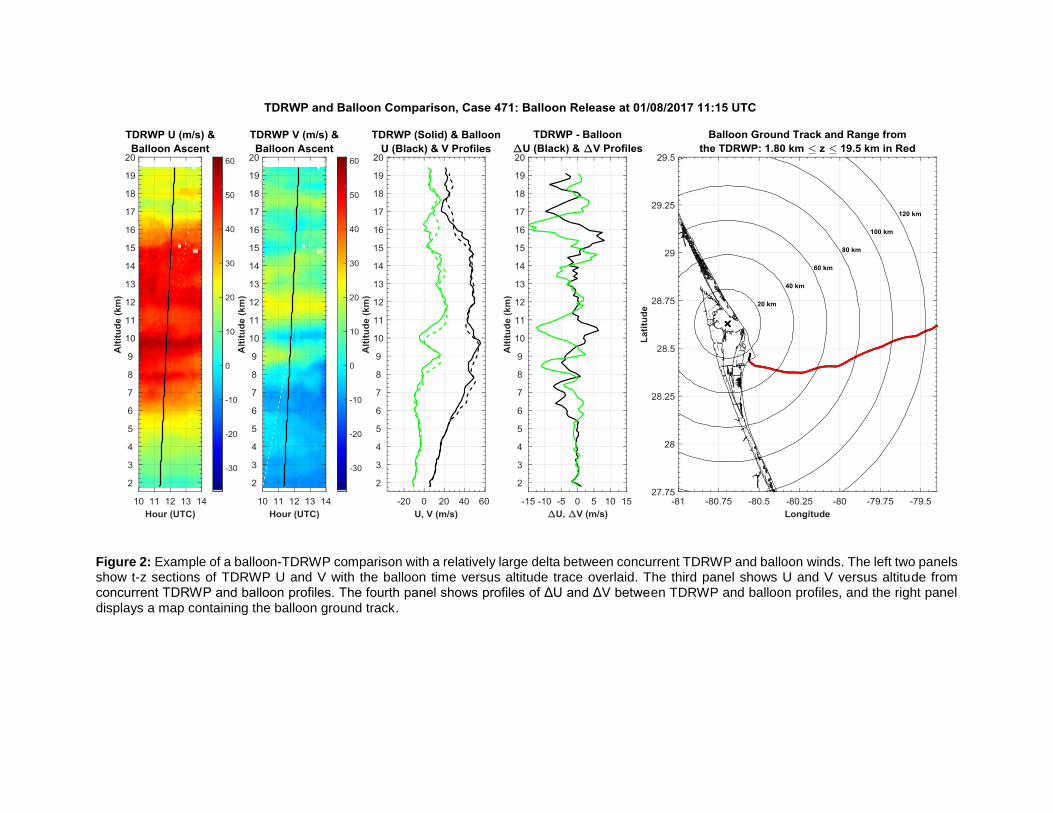
Figure 2: Example of a balloon-TDRWP comparison with a relatively large delta between concurrent TDRWP and balloon winds. The left two panels show t-z sections of TDRWP U and V with the balloon time versus altitude trace overlaid. The third panel shows U and V versus altitude from concurrent TDRWP and balloon profiles. The fourth panel shows profiles of ΔU and ΔV between TDRWP and balloon profiles, and the right panel displays a map containing the balloon ground track.
𝛥𝑇𝐷𝑅𝑊𝑃−𝐵𝑎𝑙𝑙𝑜𝑜𝑛2 (𝑝, 𝑥, 𝑦, 𝑧) =
𝐸𝑇𝐷𝑅𝑊𝑃
2 (𝑝, 𝑥, 𝑦, 𝑧) + 𝐸𝐵𝑎𝑙𝑙𝑜𝑜𝑛2 (𝑝) +
𝛥𝑠𝑝𝑎𝑡𝑖𝑎𝑙,𝑁𝐴𝑅𝑅2 (𝑥, 𝑦, 𝑧) + 𝛥𝑠𝑚𝑎𝑙𝑙
2 (𝑥, 𝑦, 𝑧). (3)
Curtis, et al. (2019) performed an analysis to quantify ∆small by finding the EVR of the NARR through spectral analysis, which entailed implementing a high-pass filter on the block-averaged balloon data using a cutoff wavelength equating to the EVR of the NARR, and computing the RMS of the high-pass wind components at each altitude. The computation of ∆small used balloon data to maintain consistency with treating balloon data as truth. However, the calculated high-pass wind components also contain balloon measurement errors. Therefore, the calculated ∆small, denoted as ∆small,calc, contains contributions from both the actual ∆small and EBalloon, which was previously calculated as a function of p. Thus, the calculated ∆small,calc is expressed as
𝛥𝑠𝑚𝑎𝑙𝑙,𝑐𝑎𝑙𝑐2 (𝑧) = 𝛥𝑠𝑚𝑎𝑙𝑙
2 (𝑧) + 𝐸𝐵𝑎𝑙𝑙𝑜𝑜𝑛2 (𝑝). (4)
Substituting Eq. (4) into Eq. (3) yields 𝛥𝑇𝐷𝑅𝑊𝑃−𝐵𝑎𝑙𝑙𝑜𝑜𝑛
2 (𝑝, 𝑥, 𝑦, 𝑧) = 𝐸𝑇𝐷𝑅𝑊𝑃2 (𝑝, 𝑥, 𝑦, 𝑧) +
𝛥𝑠𝑝𝑎𝑡𝑖𝑎𝑙,𝑁𝐴𝑅𝑅
2 (𝑥, 𝑦, 𝑧) + 𝛥𝑠𝑚𝑎𝑙𝑙,𝑐𝑎𝑙𝑐2 (𝑧). (5)
Solving for ETDRWP, which is the quantity of interest, produces the equation used to obtain TDRWP wind accuracy: 𝐸𝑇𝐷𝑅𝑊𝑃(𝑝, 𝑥, 𝑦, 𝑧) =
[𝛥𝑇𝐷𝑅𝑊𝑃−𝐵𝑎𝑙𝑙𝑜𝑜𝑛2 (𝑝, 𝑥, 𝑦, 𝑧) −
𝛥𝑠𝑝𝑎𝑡𝑖𝑎𝑙,𝑁𝐴𝑅𝑅2 (𝑥, 𝑦, 𝑧) − 𝛥𝑠𝑚𝑎𝑙𝑙,𝑐𝑎𝑙𝑐
2 (𝑧)]0.5 (6)
Barbré (2018) and Curtis, et al. (2019) provide details of the analyses used to quantify the terms used in Eq. (1) through Eq. (6). Additionally, the Appendix contains the application of Curtis, et al.(2019) to derive the latter two terms in Eq. (6). Results of the TDRWP wind accuracy analysis show that the TDRWP passes the criterion from 1,795-19,280 m, which envelopes the required altitude range of 2,700-15,250 m. To obtain results to address the requirement, Eq. (6) was first implemented on each individual delta between concurrent TDRWP and balloon measurements, with common values of ∆spatial,NARR and ∆small,calc applied to comparisons with the appropriate x, y, and z. Next, the RMS of all ETDRWP between the
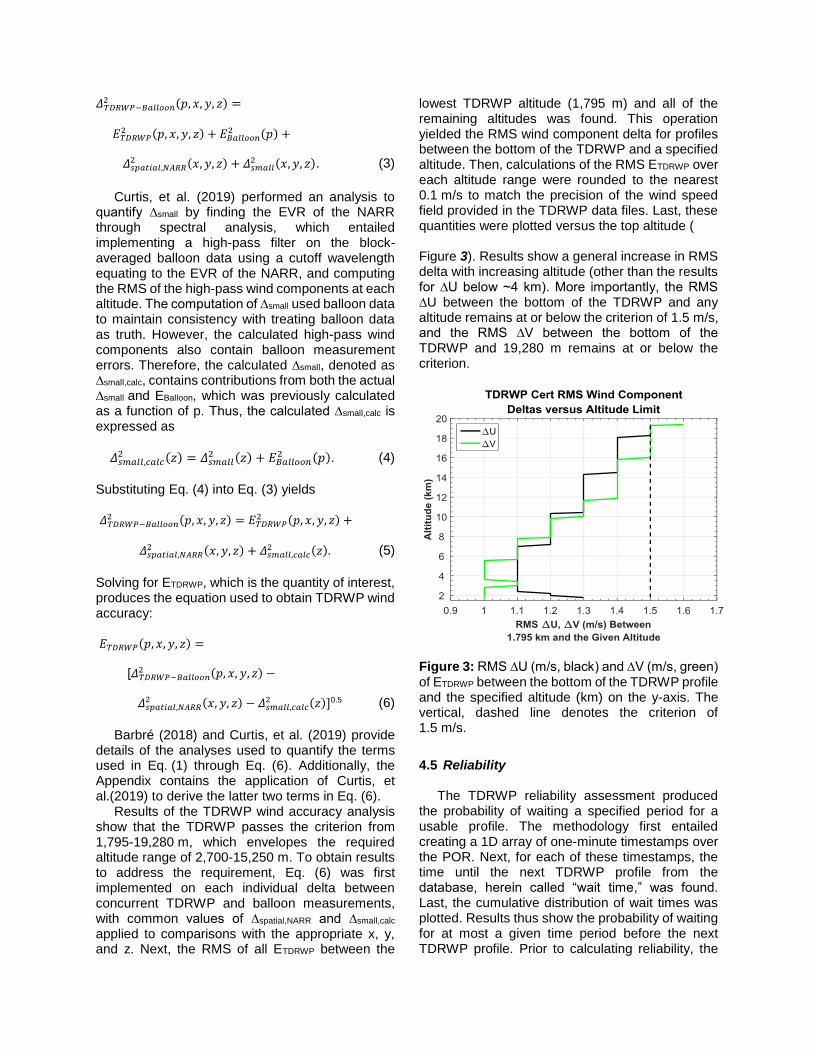
lowest TDRWP altitude (1,795 m) and all of the remaining altitudes was found. This operation yielded the RMS wind component delta for profiles between the bottom of the TDRWP and a specified altitude. Then, calculations of the RMS ETDRWP over each altitude range were rounded to the nearest 0.1 m/s to match the precision of the wind speed field provided in the TDRWP data files. Last, these quantities were plotted versus the top altitude ( Figure 3). Results show a general increase in RMS delta with increasing altitude (other than the results for ∆U below ~4 km). More importantly, the RMS ∆U between the bottom of the TDRWP and any altitude remains at or below the criterion of 1.5 m/s, and the RMS ∆V between the bottom of the TDRWP and 19,280 m remains at or below the criterion.
Figure 3: RMS ∆U (m/s, black) and ∆V (m/s, green) of ETDRWP between the bottom of the TDRWP profile and the specified altitude (km) on the y-axis. The vertical, dashed line denotes the criterion of 1.5 m/s.
4.5 Reliability The TDRWP reliability assessment produced the probability of waiting a specified period for a usable profile. The methodology first entailed creating a 1D array of one-minute timestamps over the POR. Next, for each of these timestamps, the time until the next TDRWP profile from the database, herein called “wait time,” was found. Last, the cumulative distribution of wait times was plotted. Results thus show the probability of waiting for at most a given time period before the next TDRWP profile. Prior to calculating reliability, the
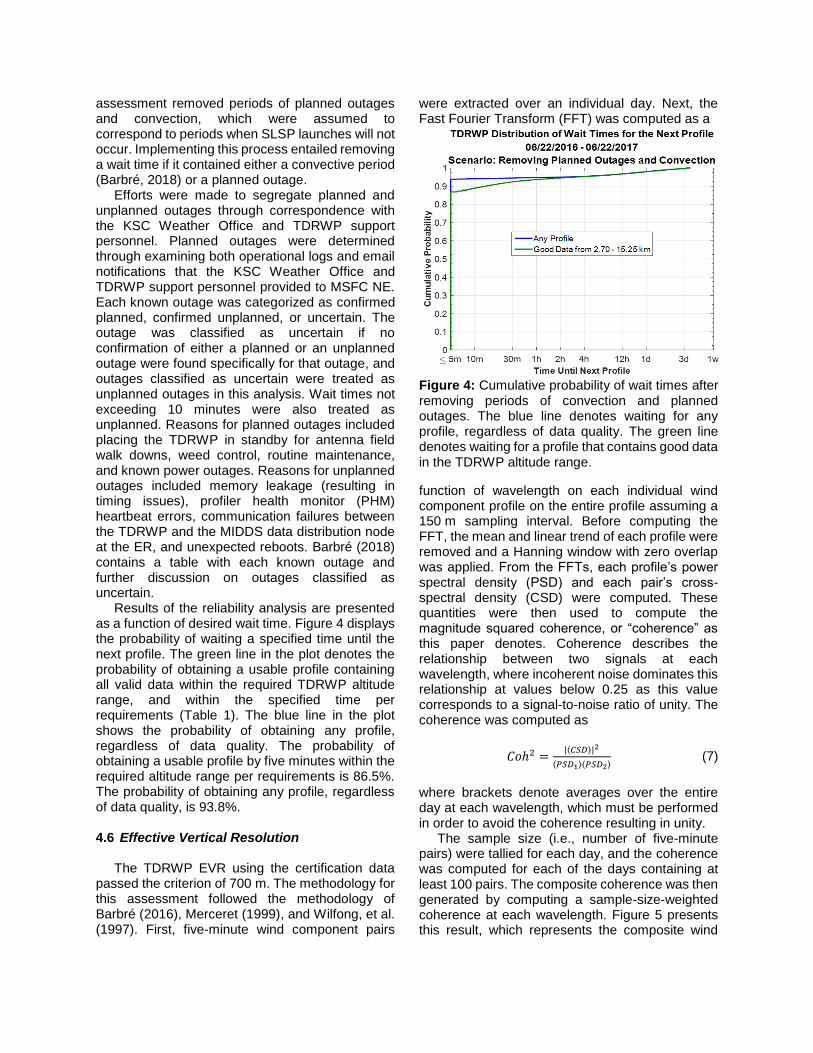
assessment removed periods of planned outages and convection, which were assumed to correspond to periods when SLSP launches will not occur. Implementing this process entailed removing a wait time if it contained either a convective period (Barbré, 2018) or a planned outage. Efforts were made to segregate planned and unplanned outages through correspondence with the KSC Weather Office and TDRWP support personnel. Planned outages were determined through examining both operational logs and email notifications that the KSC Weather Office and TDRWP support personnel provided to MSFC NE. Each known outage was categorized as confirmed planned, confirmed unplanned, or uncertain. The outage was classified as uncertain if no confirmation of either a planned or an unplanned outage were found specifically for that outage, and outages classified as uncertain were treated as unplanned outages in this analysis. Wait times not exceeding 10 minutes were also treated as unplanned. Reasons for planned outages included placing the TDRWP in standby for antenna field walk downs, weed control, routine maintenance, and known power outages. Reasons for unplanned outages included memory leakage (resulting in timing issues), profiler health monitor (PHM) heartbeat errors, communication failures between the TDRWP and the MIDDS data distribution node at the ER, and unexpected reboots. Barbré (2018) contains a table with each known outage and further discussion on outages classified as uncertain. Results of the reliability analysis are presented as a function of desired wait time. Figure 4 displays the probability of waiting a specified time until the next profile. The green line in the plot denotes the probability of obtaining a usable profile containing all valid data within the required TDRWP altitude range, and within the specified time per requirements (Table 1). The blue line in the plot shows the probability of obtaining any profile, regardless of data quality. The probability of obtaining a usable profile by five minutes within the required altitude range per requirements is 86.5%. The probability of obtaining any profile, regardless of data quality, is 93.8%. 4.6 Effective Vertical Resolution The TDRWP EVR using the certification data passed the criterion of 700 m. The methodology for this assessment followed the methodology of Barbré (2016), Merceret (1999), and Wilfong, et al. (1997). First, five-minute wind component pairs
were extracted over an individual day. Next, the Fast Fourier Transform (FFT) was computed as a
Figure 4: Cumulative probability of wait times after removing periods of convection and planned outages. The blue line denotes waiting for any profile, regardless of data quality. The green line denotes waiting for a profile that contains good data in the TDRWP altitude range.
function of wavelength on each individual wind component profile on the entire profile assuming a 150 m sampling interval. Before computing the FFT, the mean and linear trend of each profile were removed and a Hanning window with zero overlap was applied. From the FFTs, each profile’s power spectral density (PSD) and each pair’s cross-spectral density (CSD) were computed. These quantities were then used to compute the magnitude squared coherence, or “coherence” as this paper denotes. Coherence describes the relationship between two signals at each wavelength, where incoherent noise dominates this relationship at values below 0.25 as this value corresponds to a signal-to-noise ratio of unity. The coherence was computed as
𝐶𝑜ℎ2 =|⟨𝐶𝑆𝐷⟩|2
⟨𝑃𝑆𝐷1⟩⟨𝑃𝑆𝐷2⟩ (7)
where brackets denote averages over the entire day at each wavelength, which must be performed in order to avoid the coherence resulting in unity. The sample size (i.e., number of five-minute pairs) were tallied for each day, and the coherence was computed for each of the days containing at least 100 pairs. The composite coherence was then generated by computing a sample-size-weighted coherence at each wavelength. Figure 5 presents this result, which represents the composite wind
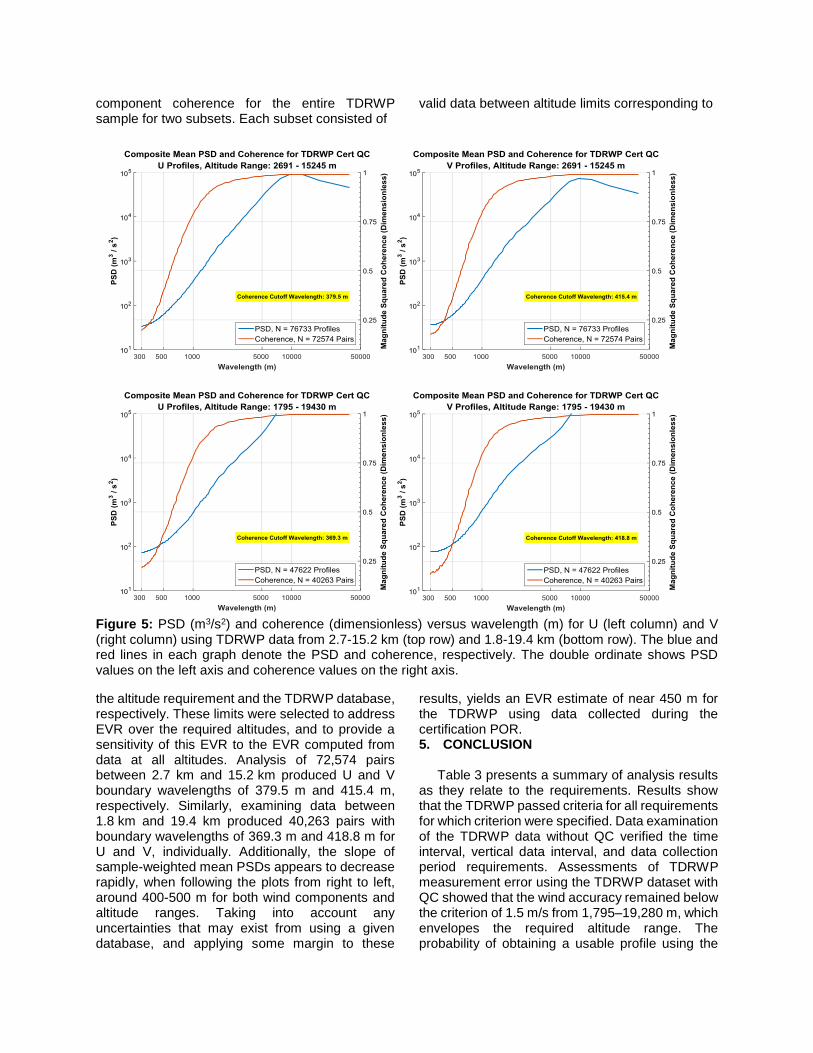
component coherence for the entire TDRWP sample for two subsets. Each subset consisted of
valid data between altitude limits corresponding to
Figure 5: PSD (m3/s2) and coherence (dimensionless) versus wavelength (m) for U (left column) and V (right column) using TDRWP data from 2.7-15.2 km (top row) and 1.8-19.4 km (bottom row). The blue and red lines in each graph denote the PSD and coherence, respectively. The double ordinate shows PSD values on the left axis and coherence values on the right axis.
the altitude requirement and the TDRWP database, respectively. These limits were selected to address EVR over the required altitudes, and to provide a sensitivity of this EVR to the EVR computed from data at all altitudes. Analysis of 72,574 pairs between 2.7 km and 15.2 km produced U and V boundary wavelengths of 379.5 m and 415.4 m, respectively. Similarly, examining data between 1.8 km and 19.4 km produced 40,263 pairs with boundary wavelengths of 369.3 m and 418.8 m for U and V, individually. Additionally, the slope of sample-weighted mean PSDs appears to decrease rapidly, when following the plots from right to left, around 400-500 m for both wind components and altitude ranges. Taking into account any uncertainties that may exist from using a given database, and applying some margin to these
results, yields an EVR estimate of near 450 m for the TDRWP using data collected during the certification POR. 5. CONCLUSION Table 3 presents a summary of analysis results as they relate to the requirements. Results show that the TDRWP passed criteria for all requirements for which criterion were specified. Data examination of the TDRWP data without QC verified the time interval, vertical data interval, and data collection period requirements. Assessments of TDRWP measurement error using the TDRWP dataset with QC showed that the wind accuracy remained below the criterion of 1.5 m/s from 1,795–19,280 m, which envelopes the required altitude range. The probability of obtaining a usable profile using the
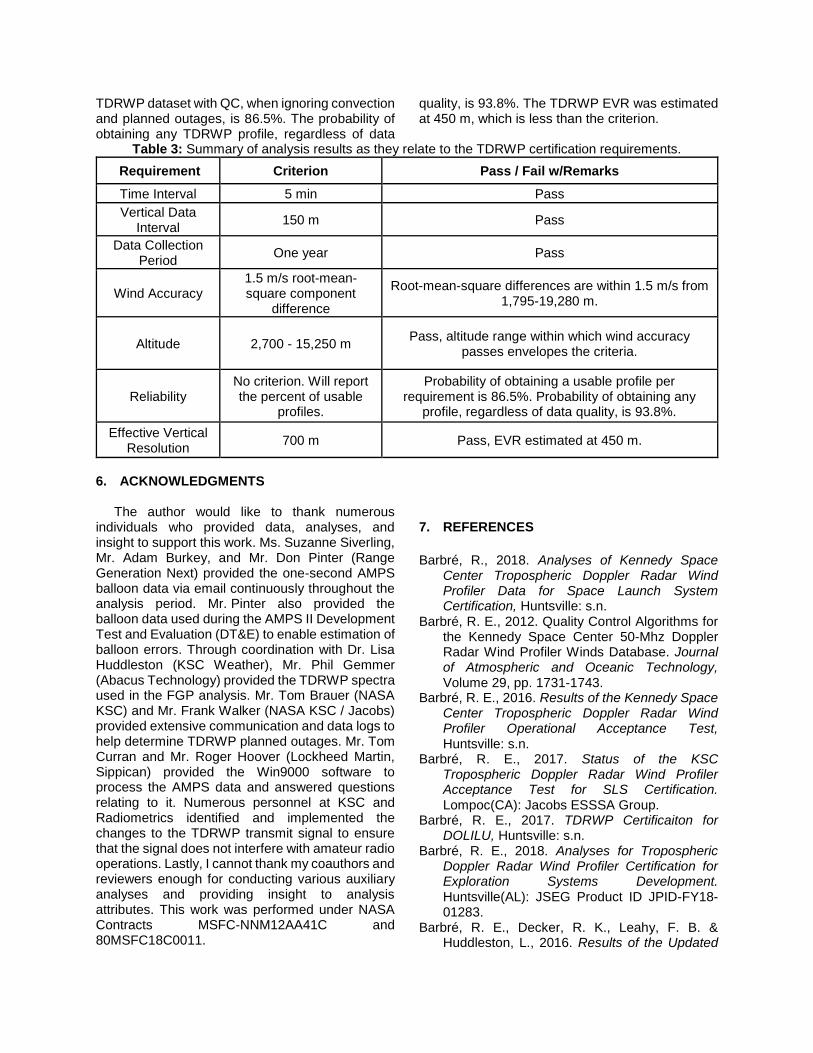
TDRWP dataset with QC, when ignoring convection and planned outages, is 86.5%. The probability of obtaining any TDRWP profile, regardless of data
quality, is 93.8%. The TDRWP EVR was estimated at 450 m, which is less than the criterion.
Table 3: Summary of analysis results as they relate to the TDRWP certification requirements.
Requirement Criterion Pass / Fail w/Remarks
Time Interval 5 min Pass
Vertical Data Interval
150 m Pass
Data Collection Period
One year Pass
Wind Accuracy 1.5 m/s root-mean-square component
difference
Root-mean-square differences are within 1.5 m/s from 1,795-19,280 m.
Altitude 2,700 - 15,250 m Pass, altitude range within which wind accuracy
passes envelopes the criteria.
Reliability No criterion. Will report the percent of usable
profiles.
Probability of obtaining a usable profile per requirement is 86.5%. Probability of obtaining any
profile, regardless of data quality, is 93.8%.
Effective Vertical Resolution
700 m Pass, EVR estimated at 450 m.
6. ACKNOWLEDGMENTS The author would like to thank numerous individuals who provided data, analyses, and insight to support this work. Ms. Suzanne Siverling, Mr. Adam Burkey, and Mr. Don Pinter (Range Generation Next) provided the one-second AMPS balloon data via email continuously throughout the analysis period. Mr. Pinter also provided the balloon data used during the AMPS II Development Test and Evaluation (DT&E) to enable estimation of balloon errors. Through coordination with Dr. Lisa Huddleston (KSC Weather), Mr. Phil Gemmer (Abacus Technology) provided the TDRWP spectra used in the FGP analysis. Mr. Tom Brauer (NASA KSC) and Mr. Frank Walker (NASA KSC / Jacobs) provided extensive communication and data logs to help determine TDRWP planned outages. Mr. Tom Curran and Mr. Roger Hoover (Lockheed Martin, Sippican) provided the Win9000 software to process the AMPS data and answered questions relating to it. Numerous personnel at KSC and Radiometrics identified and implemented the changes to the TDRWP transmit signal to ensure that the signal does not interfere with amateur radio operations. Lastly, I cannot thank my coauthors and reviewers enough for conducting various auxiliary analyses and providing insight to analysis attributes. This work was performed under NASA Contracts MSFC-NNM12AA41C and 80MSFC18C0011.
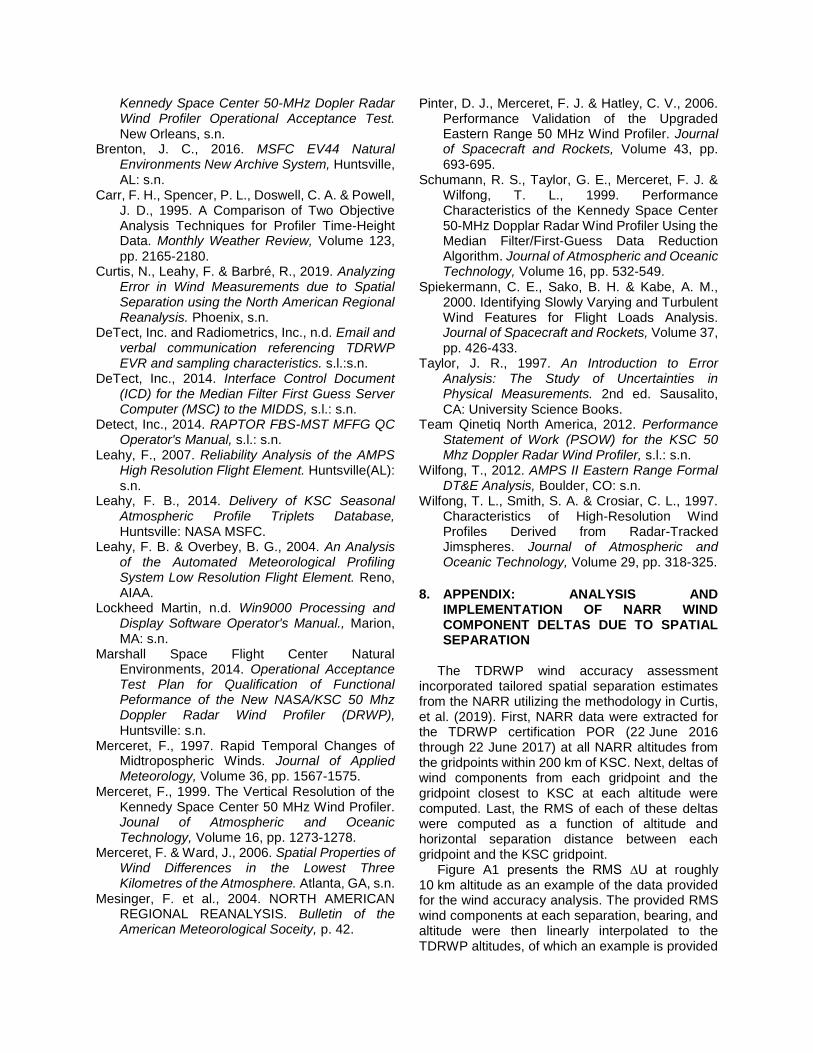
7. REFERENCES
Barbré, R., 2018. Analyses of Kennedy Space
Center Tropospheric Doppler Radar Wind Profiler Data for Space Launch System Certification, Huntsville: s.n.
Barbré, R. E., 2012. Quality Control Algorithms for the Kennedy Space Center 50-Mhz Doppler Radar Wind Profiler Winds Database. Journal of Atmospheric and Oceanic Technology, Volume 29, pp. 1731-1743.
Barbré, R. E., 2016. Results of the Kennedy Space Center Tropospheric Doppler Radar Wind Profiler Operational Acceptance Test, Huntsville: s.n.
Barbré, R. E., 2017. Status of the KSC Tropospheric Doppler Radar Wind Profiler Acceptance Test for SLS Certification.
Lompoc(CA): Jacobs ESSSA Group. Barbré, R. E., 2017. TDRWP Certificaiton for
DOLILU, Huntsville: s.n. Barbré, R. E., 2018. Analyses for Tropospheric
Doppler Radar Wind Profiler Certification for Exploration Systems Development. Huntsville(AL): JSEG Product ID JPID-FY18-01283.
Barbré, R. E., Decker, R. K., Leahy, F. B. & Huddleston, L., 2016. Results of the Updated
Kennedy Space Center 50-MHz Dopler Radar Wind Profiler Operational Acceptance Test. New Orleans, s.n.
Brenton, J. C., 2016. MSFC EV44 Natural Environments New Archive System, Huntsville, AL: s.n.
Carr, F. H., Spencer, P. L., Doswell, C. A. & Powell, J. D., 1995. A Comparison of Two Objective Analysis Techniques for Profiler Time-Height Data. Monthly Weather Review, Volume 123, pp. 2165-2180.
Curtis, N., Leahy, F. & Barbré, R., 2019. Analyzing Error in Wind Measurements due to Spatial Separation using the North American Regional Reanalysis. Phoenix, s.n.
DeTect, Inc. and Radiometrics, Inc., n.d. Email and verbal communication referencing TDRWP EVR and sampling characteristics. s.l.:s.n.
DeTect, Inc., 2014. Interface Control Document (ICD) for the Median Filter First Guess Server Computer (MSC) to the MIDDS, s.l.: s.n.
Detect, Inc., 2014. RAPTOR FBS-MST MFFG QC Operator's Manual, s.l.: s.n.
Leahy, F., 2007. Reliability Analysis of the AMPS High Resolution Flight Element. Huntsville(AL): s.n.
Leahy, F. B., 2014. Delivery of KSC Seasonal Atmospheric Profile Triplets Database, Huntsville: NASA MSFC.
Leahy, F. B. & Overbey, B. G., 2004. An Analysis of the Automated Meteorological Profiling System Low Resolution Flight Element. Reno, AIAA.
Lockheed Martin, n.d. Win9000 Processing and Display Software Operator's Manual., Marion, MA: s.n.
Marshall Space Flight Center Natural Environments, 2014. Operational Acceptance Test Plan for Qualification of Functional Peformance of the New NASA/KSC 50 Mhz Doppler Radar Wind Profiler (DRWP), Huntsville: s.n.
Merceret, F., 1997. Rapid Temporal Changes of Midtropospheric Winds. Journal of Applied Meteorology, Volume 36, pp. 1567-1575.
Merceret, F., 1999. The Vertical Resolution of the Kennedy Space Center 50 MHz Wind Profiler. Jounal of Atmospheric and Oceanic Technology, Volume 16, pp. 1273-1278.
Merceret, F. & Ward, J., 2006. Spatial Properties of Wind Differences in the Lowest Three Kilometres of the Atmosphere. Atlanta, GA, s.n.
Mesinger, F. et al., 2004. NORTH AMERICAN REGIONAL REANALYSIS. Bulletin of the American Meteorological Soceity, p. 42.
Pinter, D. J., Merceret, F. J. & Hatley, C. V., 2006. Performance Validation of the Upgraded Eastern Range 50 MHz Wind Profiler. Journal of Spacecraft and Rockets, Volume 43, pp. 693-695.
Schumann, R. S., Taylor, G. E., Merceret, F. J. & Wilfong, T. L., 1999. Performance Characteristics of the Kennedy Space Center 50-MHz Dopplar Radar Wind Profiler Using the Median Filter/First-Guess Data Reduction Algorithm. Journal of Atmospheric and Oceanic Technology, Volume 16, pp. 532-549.
Spiekermann, C. E., Sako, B. H. & Kabe, A. M., 2000. Identifying Slowly Varying and Turbulent Wind Features for Flight Loads Analysis. Journal of Spacecraft and Rockets, Volume 37, pp. 426-433.
Taylor, J. R., 1997. An Introduction to Error Analysis: The Study of Uncertainties in Physical Measurements. 2nd ed. Sausalito, CA: University Science Books.
Team Qinetiq North America, 2012. Performance Statement of Work (PSOW) for the KSC 50 Mhz Doppler Radar Wind Profiler, s.l.: s.n.
Wilfong, T., 2012. AMPS II Eastern Range Formal DT&E Analysis, Boulder, CO: s.n.
Wilfong, T. L., Smith, S. A. & Crosiar, C. L., 1997. Characteristics of High-Resolution Wind Profiles Derived from Radar-Tracked Jimspheres. Journal of Atmospheric and Oceanic Technology, Volume 29, pp. 318-325.
8. APPENDIX: ANALYSIS AND
IMPLEMENTATION OF NARR WIND COMPONENT DELTAS DUE TO SPATIAL SEPARATION
The TDRWP wind accuracy assessment incorporated tailored spatial separation estimates from the NARR utilizing the methodology in Curtis, et al. (2019). First, NARR data were extracted for the TDRWP certification POR (22 June 2016 through 22 June 2017) at all NARR altitudes from the gridpoints within 200 km of KSC. Next, deltas of wind components from each gridpoint and the gridpoint closest to KSC at each altitude were computed. Last, the RMS of each of these deltas were computed as a function of altitude and horizontal separation distance between each gridpoint and the KSC gridpoint. Figure A1 presents the RMS ∆U at roughly 10 km altitude as an example of the data provided for the wind accuracy analysis. The provided RMS wind components at each separation, bearing, and altitude were then linearly interpolated to the TDRWP altitudes, of which an example is provided
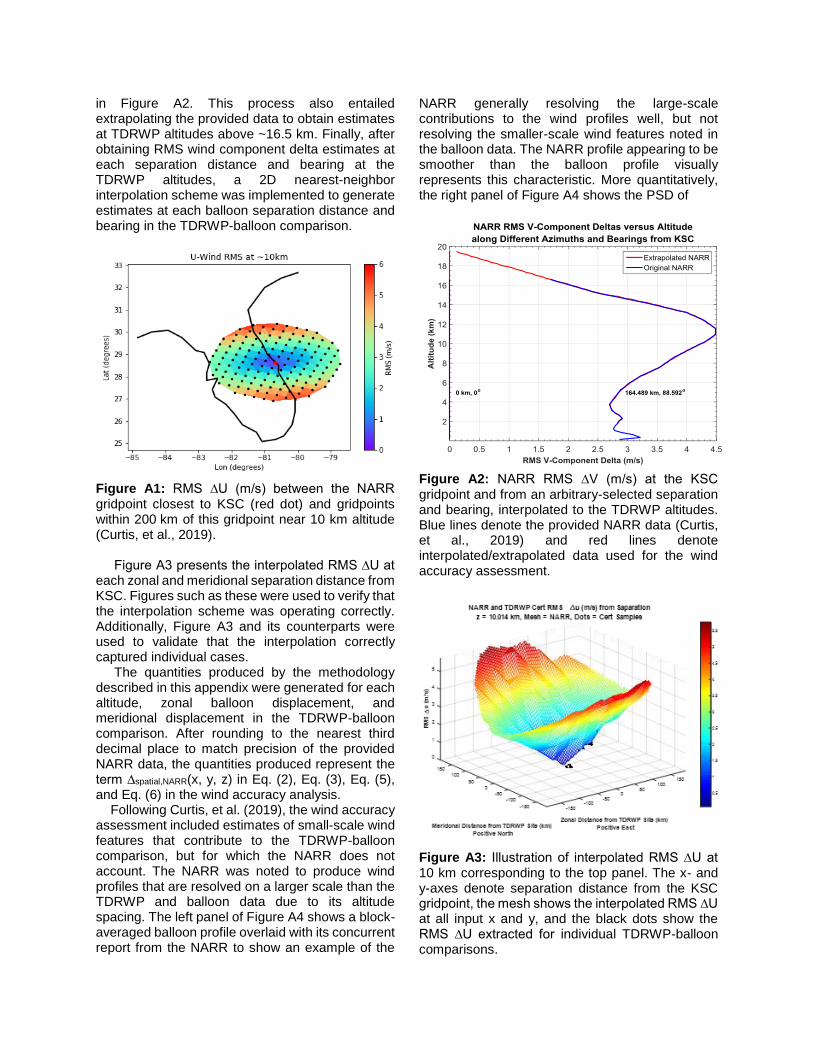
in Figure A2. This process also entailed extrapolating the provided data to obtain estimates at TDRWP altitudes above ~16.5 km. Finally, after obtaining RMS wind component delta estimates at each separation distance and bearing at the TDRWP altitudes, a 2D nearest-neighbor interpolation scheme was implemented to generate estimates at each balloon separation distance and bearing in the TDRWP-balloon comparison.
Figure A1: RMS ∆U (m/s) between the NARR gridpoint closest to KSC (red dot) and gridpoints within 200 km of this gridpoint near 10 km altitude (Curtis, et al., 2019). Figure A3 presents the interpolated RMS ∆U at each zonal and meridional separation distance from KSC. Figures such as these were used to verify that the interpolation scheme was operating correctly. Additionally, Figure A3 and its counterparts were used to validate that the interpolation correctly captured individual cases. The quantities produced by the methodology described in this appendix were generated for each altitude, zonal balloon displacement, and meridional displacement in the TDRWP-balloon comparison. After rounding to the nearest third decimal place to match precision of the provided NARR data, the quantities produced represent the term ∆spatial,NARR(x, y, z) in Eq. (2), Eq. (3), Eq. (5), and Eq. (6) in the wind accuracy analysis. Following Curtis, et al. (2019), the wind accuracy assessment included estimates of small-scale wind features that contribute to the TDRWP-balloon comparison, but for which the NARR does not account. The NARR was noted to produce wind profiles that are resolved on a larger scale than the TDRWP and balloon data due to its altitude spacing. The left panel of Figure A4 shows a block- averaged balloon profile overlaid with its concurrent report from the NARR to show an example of the
NARR generally resolving the large-scale contributions to the wind profiles well, but not resolving the smaller-scale wind features noted in the balloon data. The NARR profile appearing to be smoother than the balloon profile visually represents this characteristic. More quantitatively, the right panel of Figure A4 shows the PSD of
Figure A2: NARR RMS ∆V (m/s) at the KSC gridpoint and from an arbitrary-selected separation and bearing, interpolated to the TDRWP altitudes. Blue lines denote the provided NARR data (Curtis, et al., 2019) and red lines denote interpolated/extrapolated data used for the wind accuracy assessment.
Figure A3: Illustration of interpolated RMS ∆U at 10 km corresponding to the top panel. The x- and y-axes denote separation distance from the KSC gridpoint, the mesh shows the interpolated RMS ∆U at all input x and y, and the black dots show the RMS ∆U extracted for individual TDRWP-balloon comparisons.
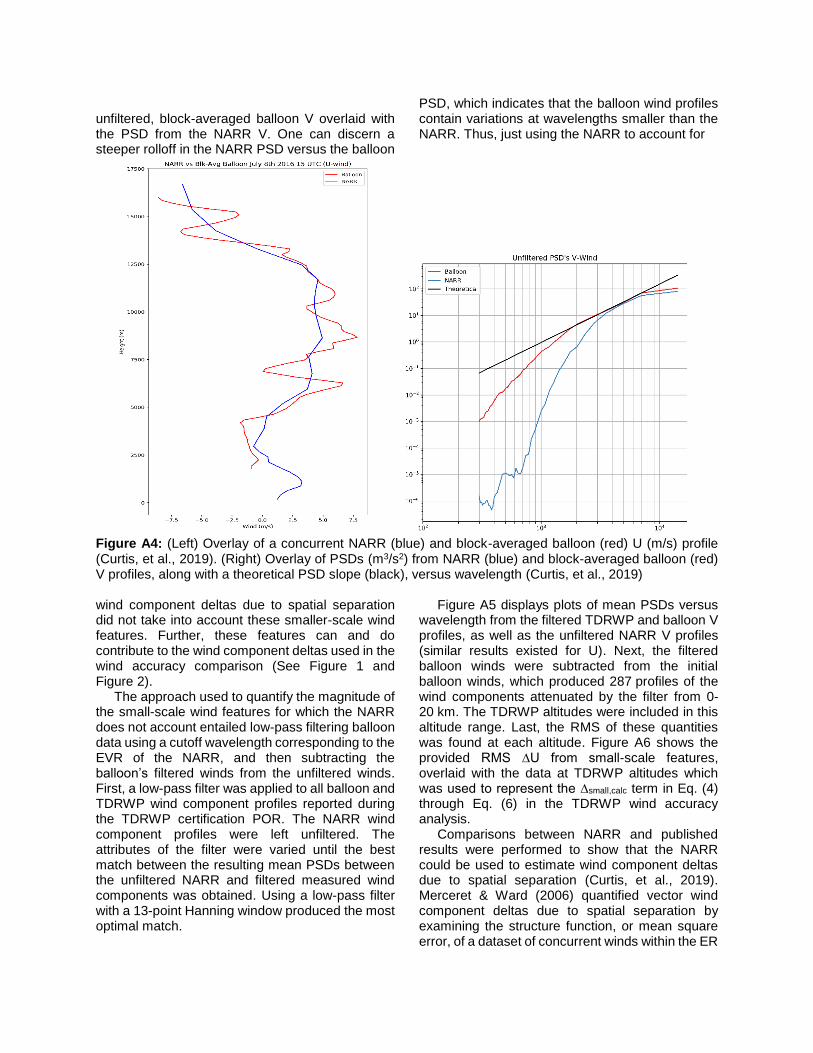
unfiltered, block-averaged balloon V overlaid with the PSD from the NARR V. One can discern a steeper rolloff in the NARR PSD versus the balloon
PSD, which indicates that the balloon wind profiles contain variations at wavelengths smaller than the NARR. Thus, just using the NARR to account for
Figure A4: (Left) Overlay of a concurrent NARR (blue) and block-averaged balloon (red) U (m/s) profile (Curtis, et al., 2019). (Right) Overlay of PSDs (m3/s2) from NARR (blue) and block-averaged balloon (red) V profiles, along with a theoretical PSD slope (black), versus wavelength (Curtis, et al., 2019) wind component deltas due to spatial separation did not take into account these smaller-scale wind features. Further, these features can and do contribute to the wind component deltas used in the wind accuracy comparison (See Figure 1 and Figure 2). The approach used to quantify the magnitude of the small-scale wind features for which the NARR does not account entailed low-pass filtering balloon data using a cutoff wavelength corresponding to the EVR of the NARR, and then subtracting the balloon’s filtered winds from the unfiltered winds. First, a low-pass filter was applied to all balloon and TDRWP wind component profiles reported during the TDRWP certification POR. The NARR wind component profiles were left unfiltered. The attributes of the filter were varied until the best match between the resulting mean PSDs between the unfiltered NARR and filtered measured wind components was obtained. Using a low-pass filter with a 13-point Hanning window produced the most optimal match.
Figure A5 displays plots of mean PSDs versus wavelength from the filtered TDRWP and balloon V profiles, as well as the unfiltered NARR V profiles (similar results existed for U). Next, the filtered balloon winds were subtracted from the initial balloon winds, which produced 287 profiles of the wind components attenuated by the filter from 0-20 km. The TDRWP altitudes were included in this altitude range. Last, the RMS of these quantities was found at each altitude. Figure A6 shows the provided RMS ∆U from small-scale features, overlaid with the data at TDRWP altitudes which was used to represent the ∆small,calc term in Eq. (4) through Eq. (6) in the TDRWP wind accuracy analysis. Comparisons between NARR and published results were performed to show that the NARR could be used to estimate wind component deltas due to spatial separation (Curtis, et al., 2019). Merceret & Ward (2006) quantified vector wind component deltas due to spatial separation by examining the structure function, or mean square error, of a dataset of concurrent winds within the ER
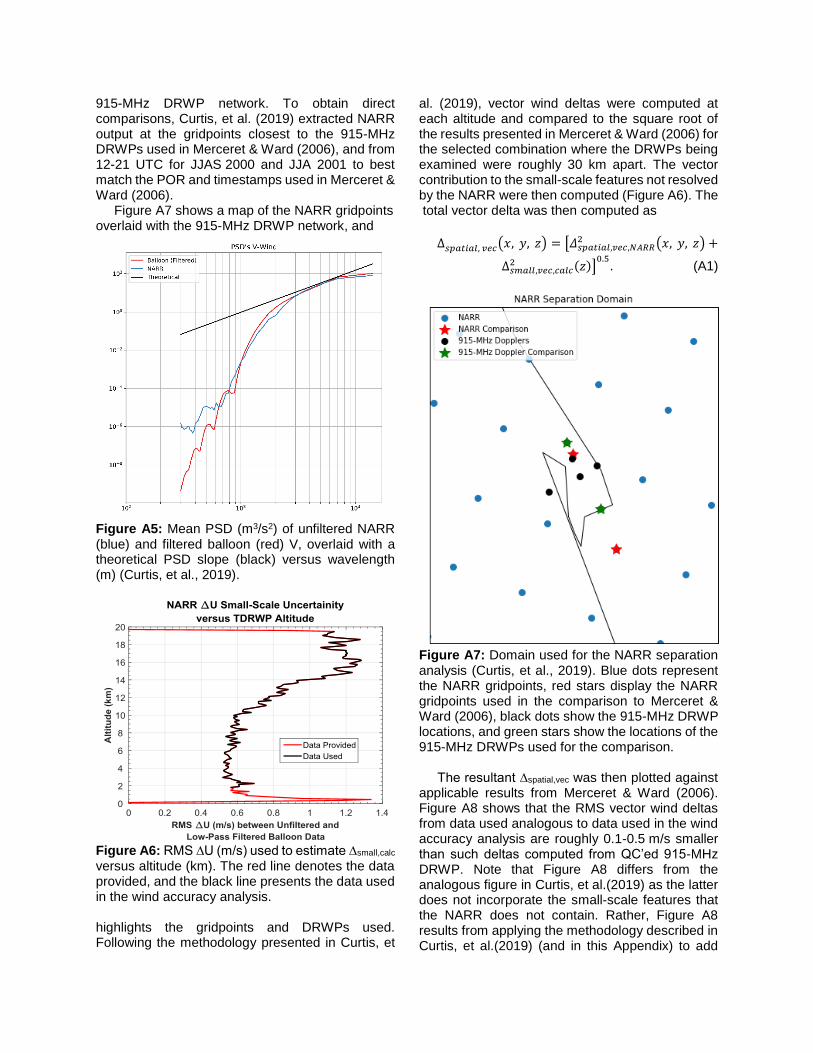
915-MHz DRWP network. To obtain direct comparisons, Curtis, et al. (2019) extracted NARR output at the gridpoints closest to the 915-MHz DRWPs used in Merceret & Ward (2006), and from 12-21 UTC for JJAS 2000 and JJA 2001 to best match the POR and timestamps used in Merceret & Ward (2006). Figure A7 shows a map of the NARR gridpoints overlaid with the 915-MHz DRWP network, and
Figure A5: Mean PSD (m3/s2) of unfiltered NARR (blue) and filtered balloon (red) V, overlaid with a theoretical PSD slope (black) versus wavelength (m) (Curtis, et al., 2019).
Figure A6: RMS ∆U (m/s) used to estimate ∆small,calc versus altitude (km). The red line denotes the data provided, and the black line presents the data used in the wind accuracy analysis.
highlights the gridpoints and DRWPs used. Following the methodology presented in Curtis, et
al. (2019), vector wind deltas were computed at each altitude and compared to the square root of the results presented in Merceret & Ward (2006) for the selected combination where the DRWPs being examined were roughly 30 km apart. The vector contribution to the small-scale features not resolved by the NARR were then computed (Figure A6). The total vector delta was then computed as
∆𝑠𝑝𝑎𝑡𝑖𝑎𝑙, 𝑣𝑒𝑐(𝑥, 𝑦, 𝑧) = [𝛥𝑠𝑝𝑎𝑡𝑖𝑎𝑙,𝑣𝑒𝑐,𝑁𝐴𝑅𝑅2 (𝑥, 𝑦, 𝑧) +
∆𝑠𝑚𝑎𝑙𝑙,𝑣𝑒𝑐,𝑐𝑎𝑙𝑐2 (𝑧)]
0.5. (A1)
Figure A7: Domain used for the NARR separation analysis (Curtis, et al., 2019). Blue dots represent the NARR gridpoints, red stars display the NARR gridpoints used in the comparison to Merceret & Ward (2006), black dots show the 915-MHz DRWP locations, and green stars show the locations of the 915-MHz DRWPs used for the comparison. The resultant ∆spatial,vec was then plotted against applicable results from Merceret & Ward (2006). Figure A8 shows that the RMS vector wind deltas from data used analogous to data used in the wind accuracy analysis are roughly 0.1-0.5 m/s smaller than such deltas computed from QC’ed 915-MHz DRWP. Note that Figure A8 differs from the analogous figure in Curtis, et al.(2019) as the latter does not incorporate the small-scale features that the NARR does not contain. Rather, Figure A8 results from applying the methodology described in Curtis, et al.(2019) (and in this Appendix) to add
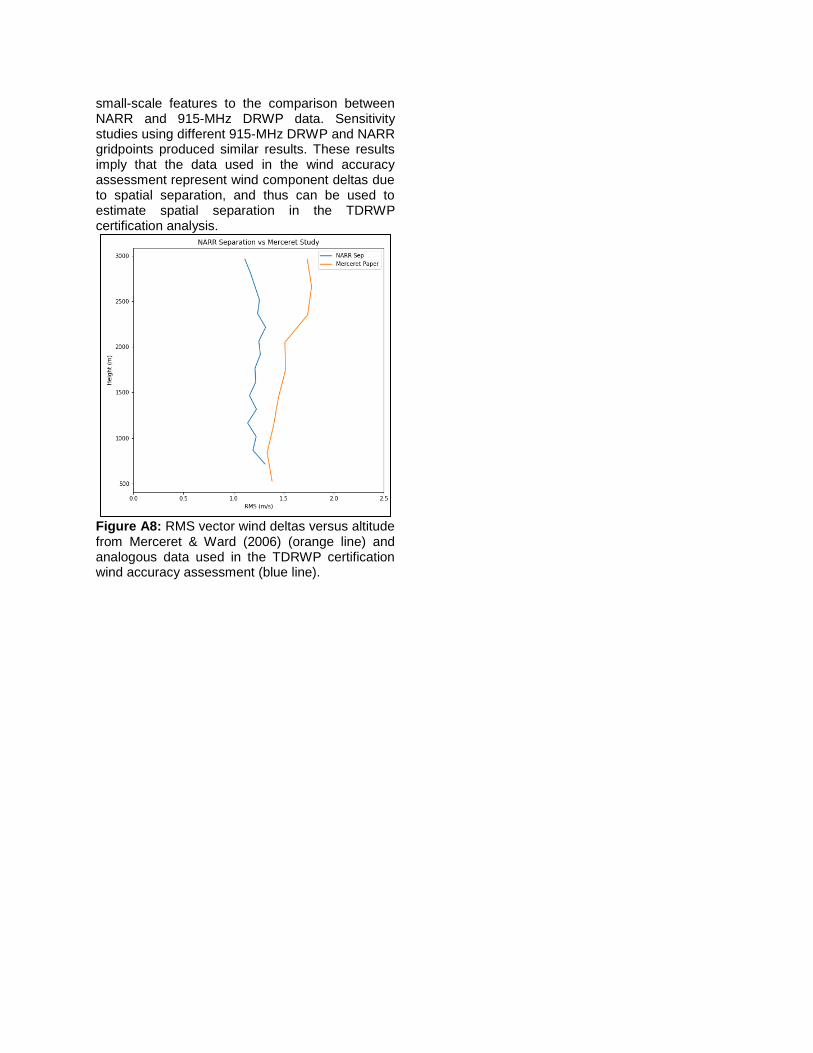
small-scale features to the comparison between NARR and 915-MHz DRWP data. Sensitivity studies using different 915-MHz DRWP and NARR gridpoints produced similar results. These results imply that the data used in the wind accuracy assessment represent wind component deltas due to spatial separation, and thus can be used to estimate spatial separation in the TDRWP certification analysis.
Figure A8: RMS vector wind deltas versus altitude from Merceret & Ward (2006) (orange line) and analogous data used in the TDRWP certification wind accuracy assessment (blue line).