Embed Size (px)
Citation preview
J2EE Performance Tuning
Jayesh Patel
Northern Virginia Java/BEA User Group
January 11th, 2005.
Presenter’s Bio.
� Jayesh Patel currently works on EDS’s TWAI project and responsible for J2EE application integration. He has also worked for BEA Systems for almost 5 years.
� Jayesh has been involved with J2ee/WebLogic technologies for the past 5 years. He has experience in J2ee application development, performance tuning and resolving complex production issues.
Agenda
� Performance Tuning Overview.
� J2EE Tuning Zones.
� Platform (OS) Tuning.
� JVM Tuning.
� WebLogic Core Tuning.
Continue..
Agenda
� WebLogic Sub Systems Tuning.� EJB Container, Servlet Engine, JDBC Pool, JMS.
� Common Performance Problems.� Memory Leak
� Application Hangs
� J2EE Performance Monitoring.
� J2EE Performance Standards & Tools.
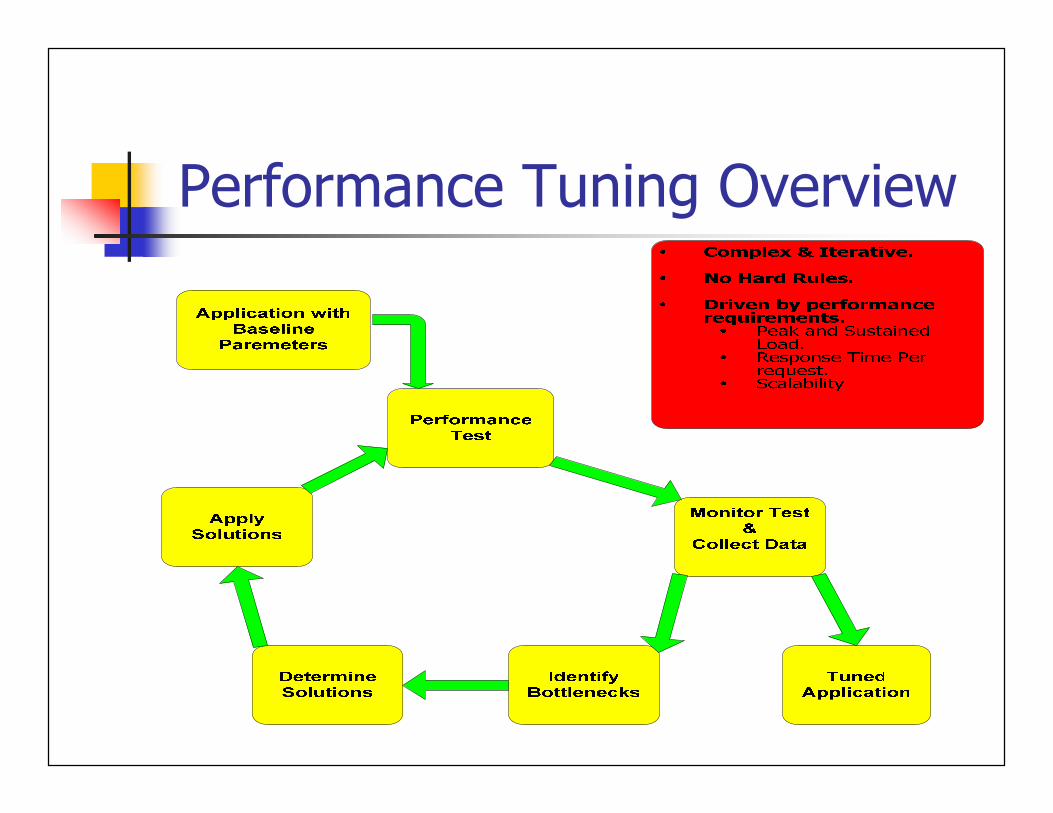
Performance Tuning Overview
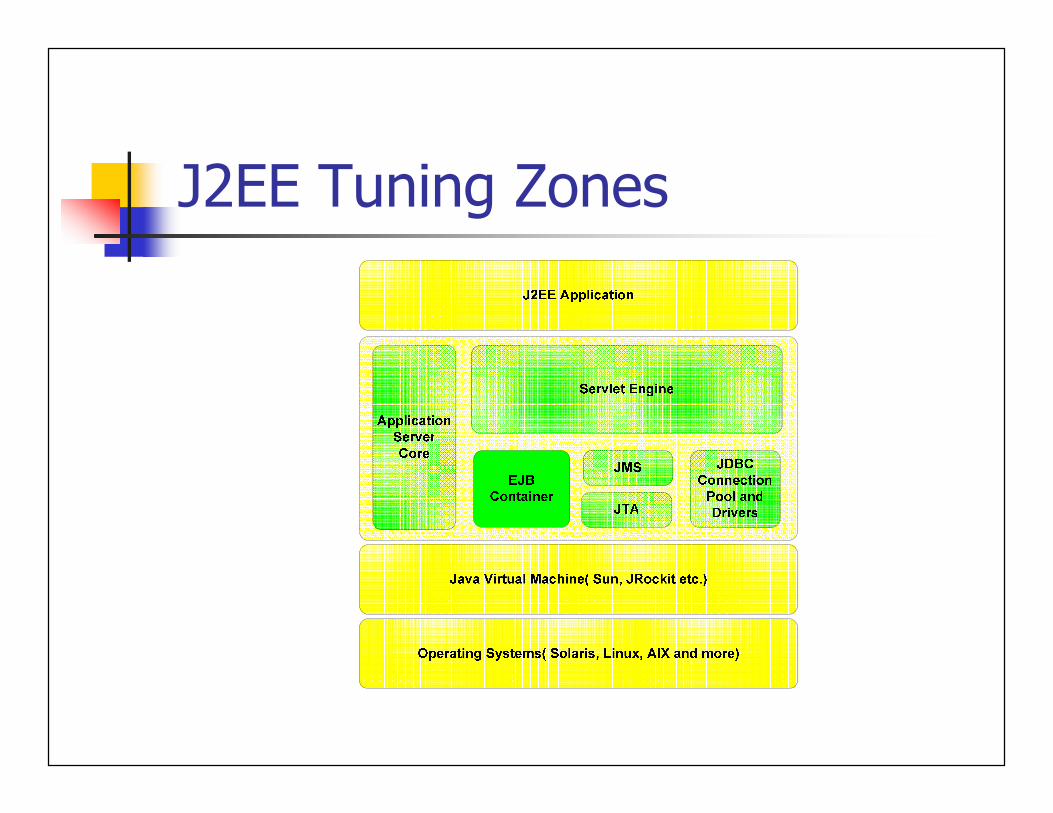
J2EE Tuning Zones
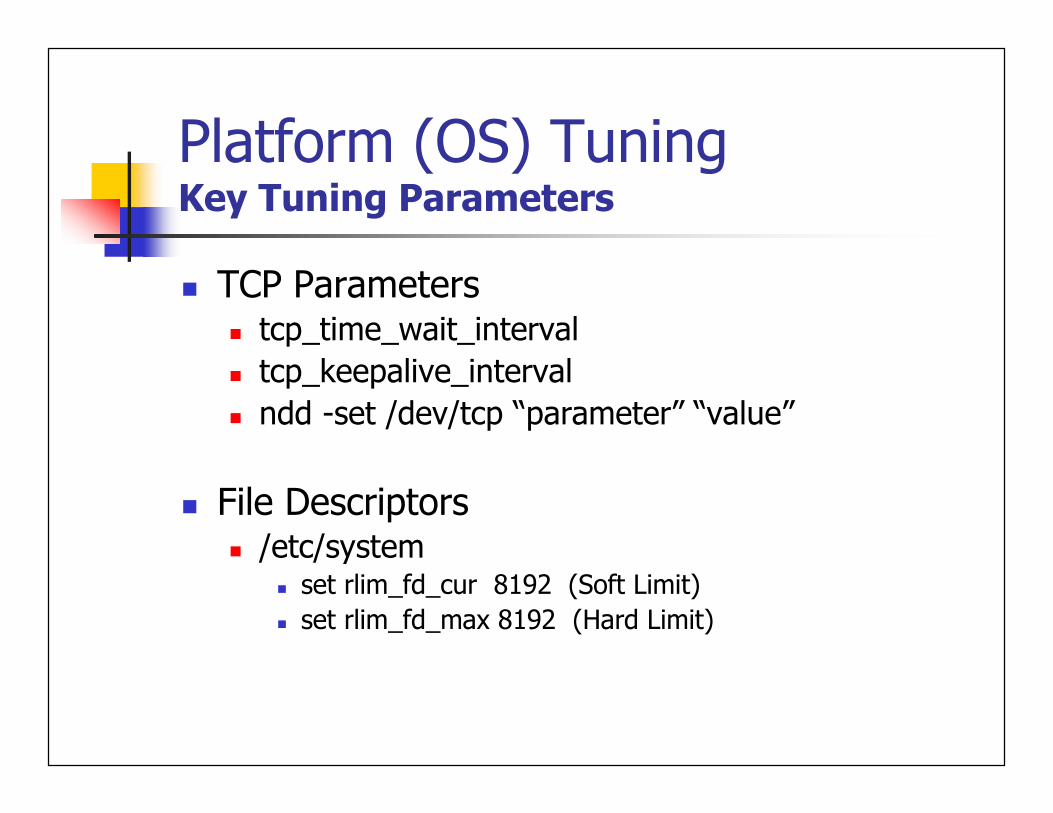
Platform (OS) TuningKey Tuning Parameters
� TCP Parameters� tcp_time_wait_interval
� tcp_keepalive_interval
� ndd -set /dev/tcp “parameter” “value”
� File Descriptors� /etc/system
� set rlim_fd_cur 8192 (Soft Limit)
� set rlim_fd_max 8192 (Hard Limit)
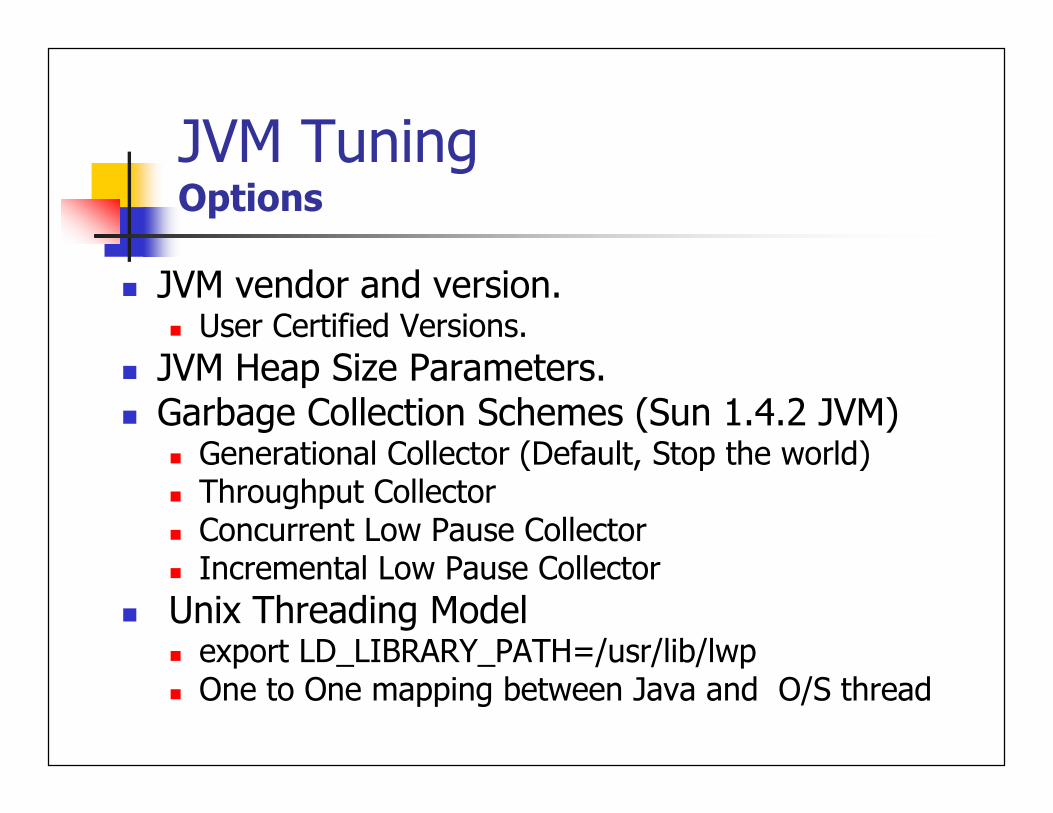
JVM Tuning Options
� JVM vendor and version.� User Certified Versions.
� JVM Heap Size Parameters.� Garbage Collection Schemes (Sun 1.4.2 JVM)
� Generational Collector (Default, Stop the world)� Throughput Collector � Concurrent Low Pause Collector � Incremental Low Pause Collector
� Unix Threading Model � export LD_LIBRARY_PATH=/usr/lib/lwp� One to One mapping between Java and O/S thread
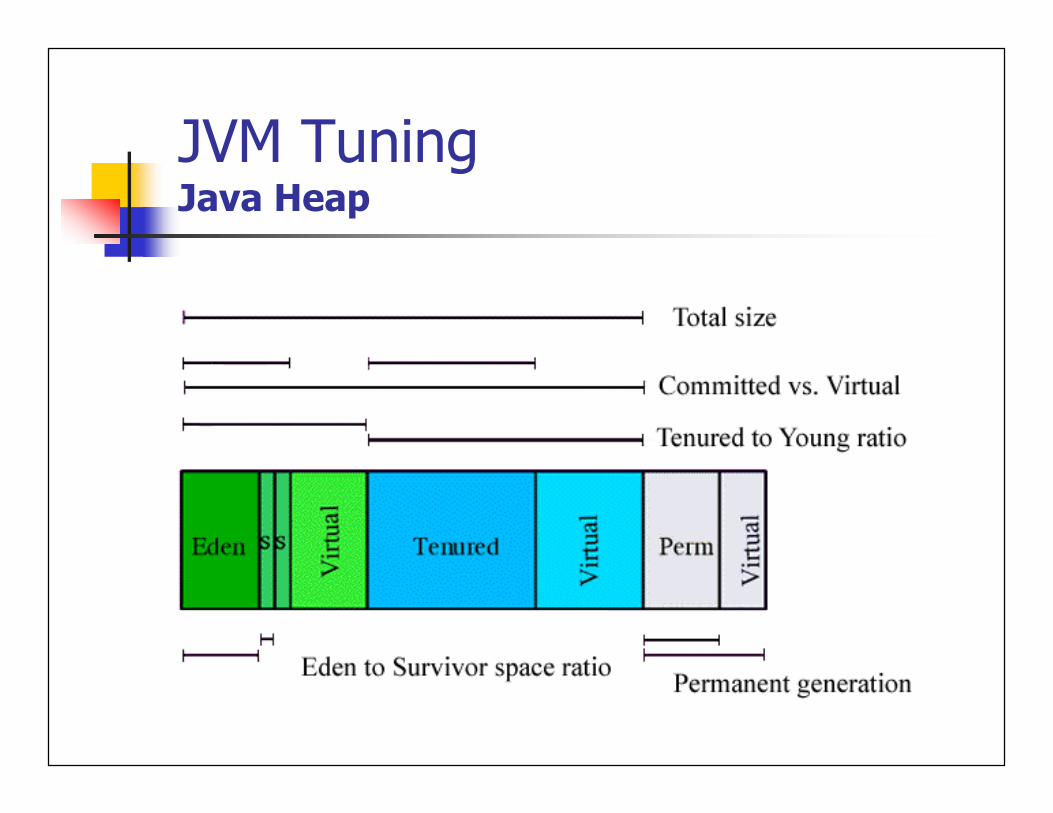
JVM TuningJava Heap
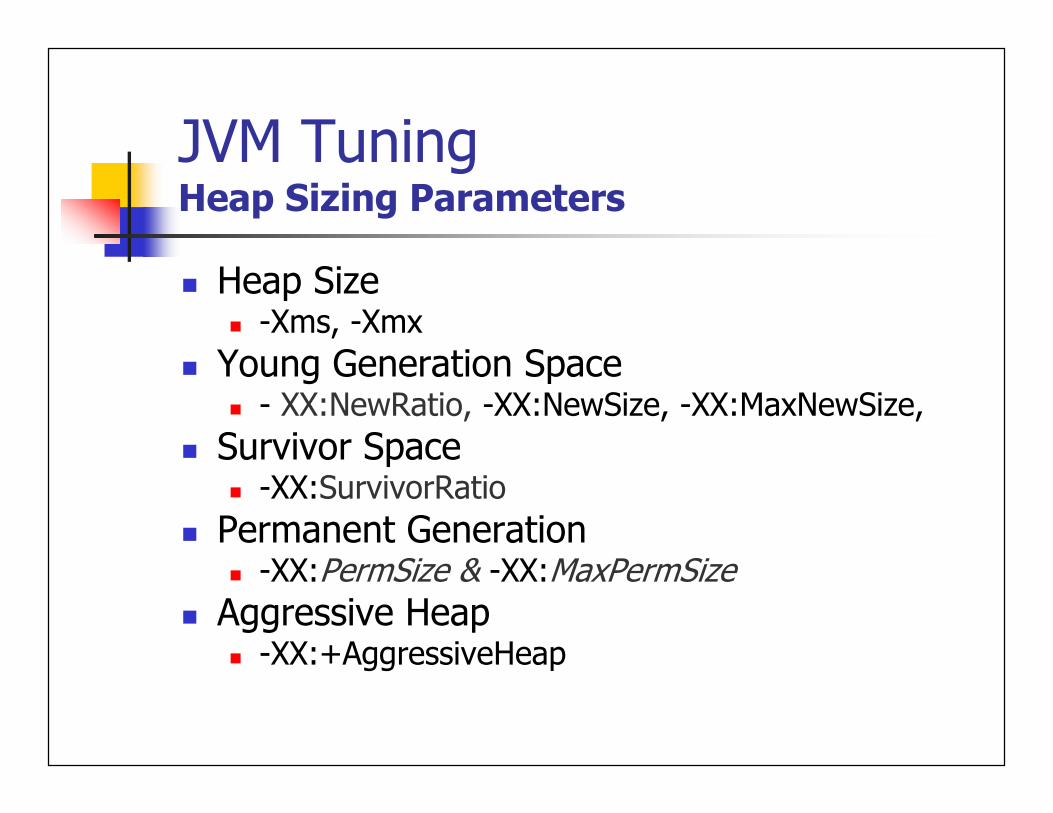
JVM TuningHeap Sizing Parameters
� Heap Size� -Xms, -Xmx
� Young Generation Space� - XX:NewRatio, -XX:NewSize, -XX:MaxNewSize,
� Survivor Space� -XX:SurvivorRatio
� Permanent Generation � -XX:PermSize & -XX:MaxPermSize
� Aggressive Heap� -XX:+AggressiveHeap
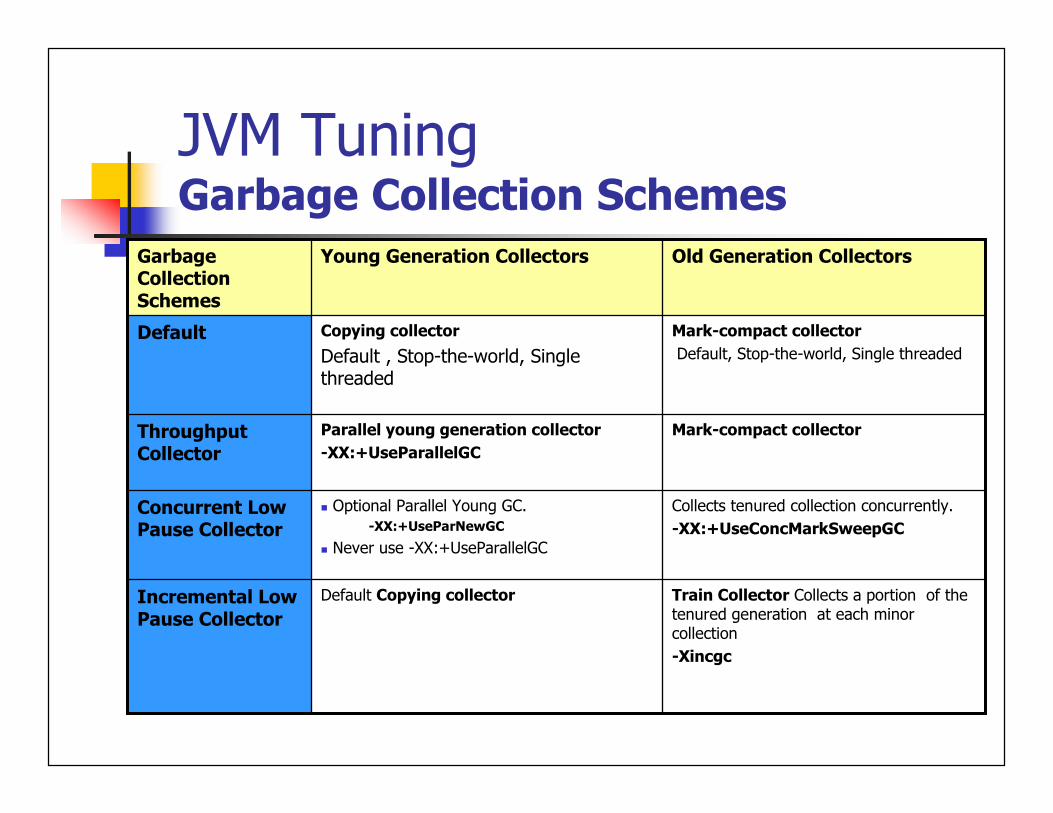
JVM TuningGarbage Collection Schemes
Collects tenured collection concurrently.
-XX:+UseConcMarkSweepGC
� Optional Parallel Young GC.
-XX:+UseParNewGC
� Never use -XX:+UseParallelGC
Concurrent Low Pause Collector
Train Collector Collects a portion of the tenured generation at each minor collection
-Xincgc
Default Copying collectorIncremental Low Pause Collector
Mark-compact collectorParallel young generation collector
-XX:+UseParallelGC
Throughput Collector
Mark-compact collector
Default, Stop-the-world, Single threaded
Copying collector
Default , Stop-the-world, Single threaded
Default
Old Generation CollectorsYoung Generation CollectorsGarbage Collection Schemes
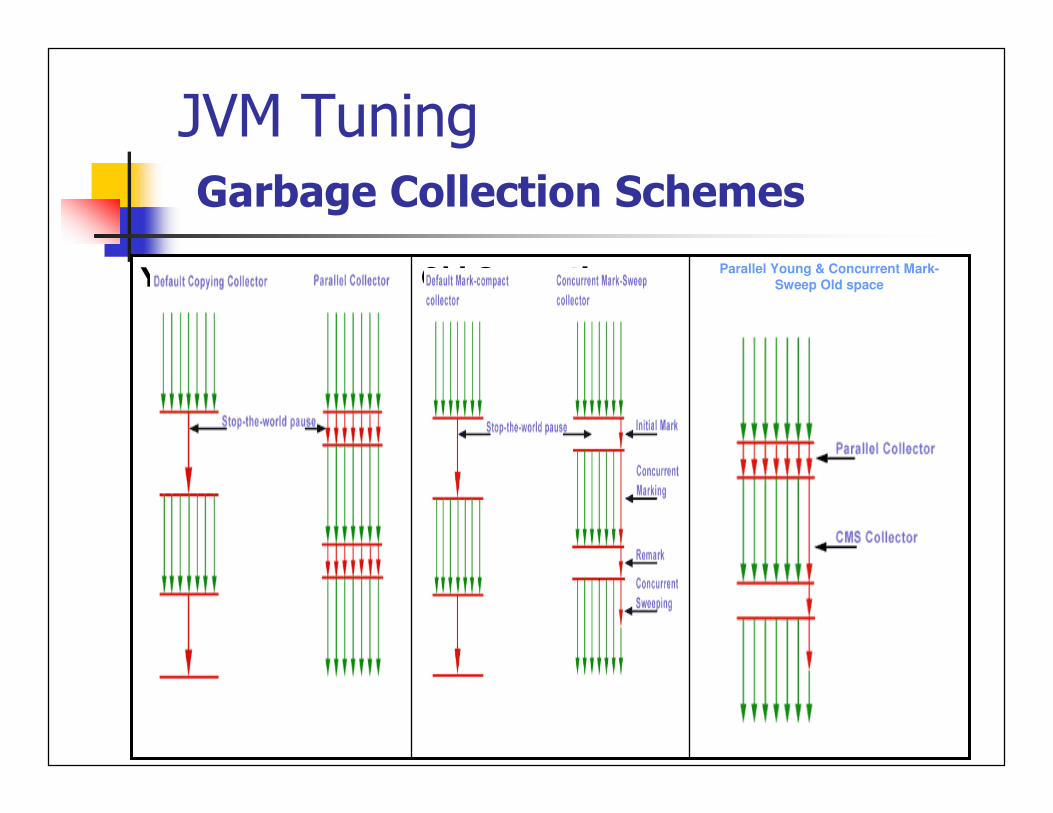
JVM TuningGarbage Collection Schemes
Parallel Young & Concurrent Mark-
Sweep Old spaceOld GenerationYoung Generation
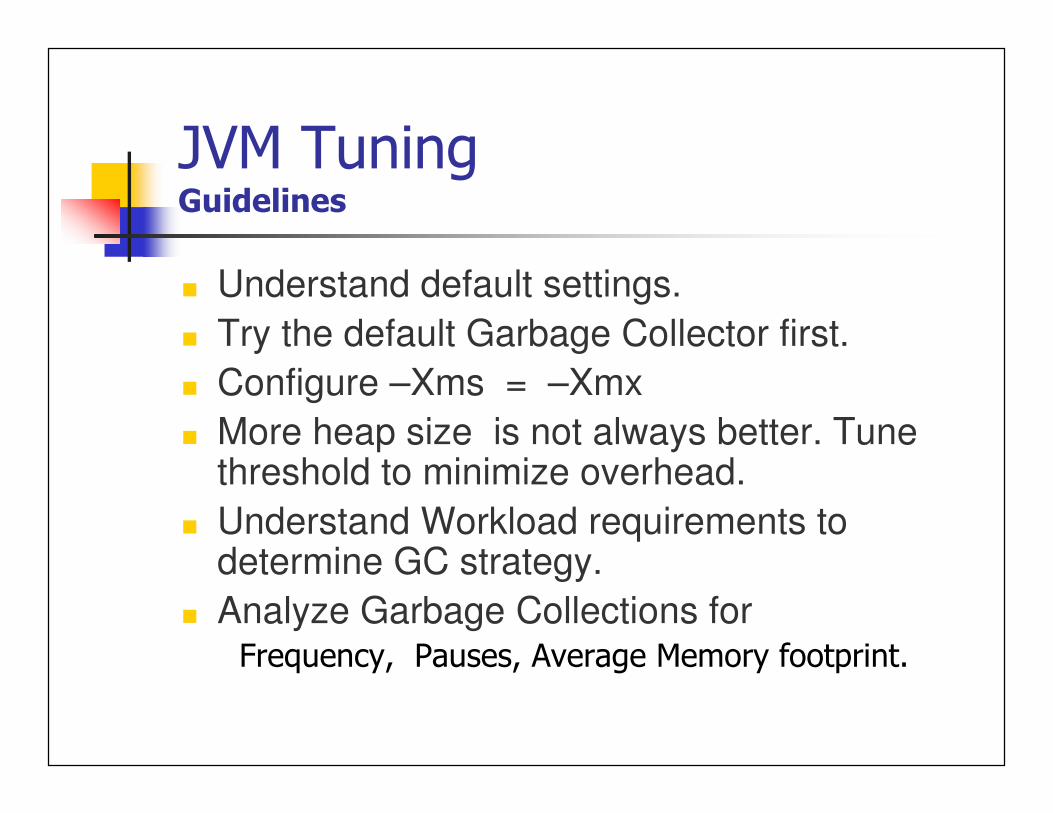
JVM Tuning Guidelines
� Understand default settings.
� Try the default Garbage Collector first.
� Configure –Xms = –Xmx
� More heap size is not always better. Tune threshold to minimize overhead.
� Understand Workload requirements to determine GC strategy.
� Analyze Garbage Collections for Frequency, Pauses, Average Memory footprint.
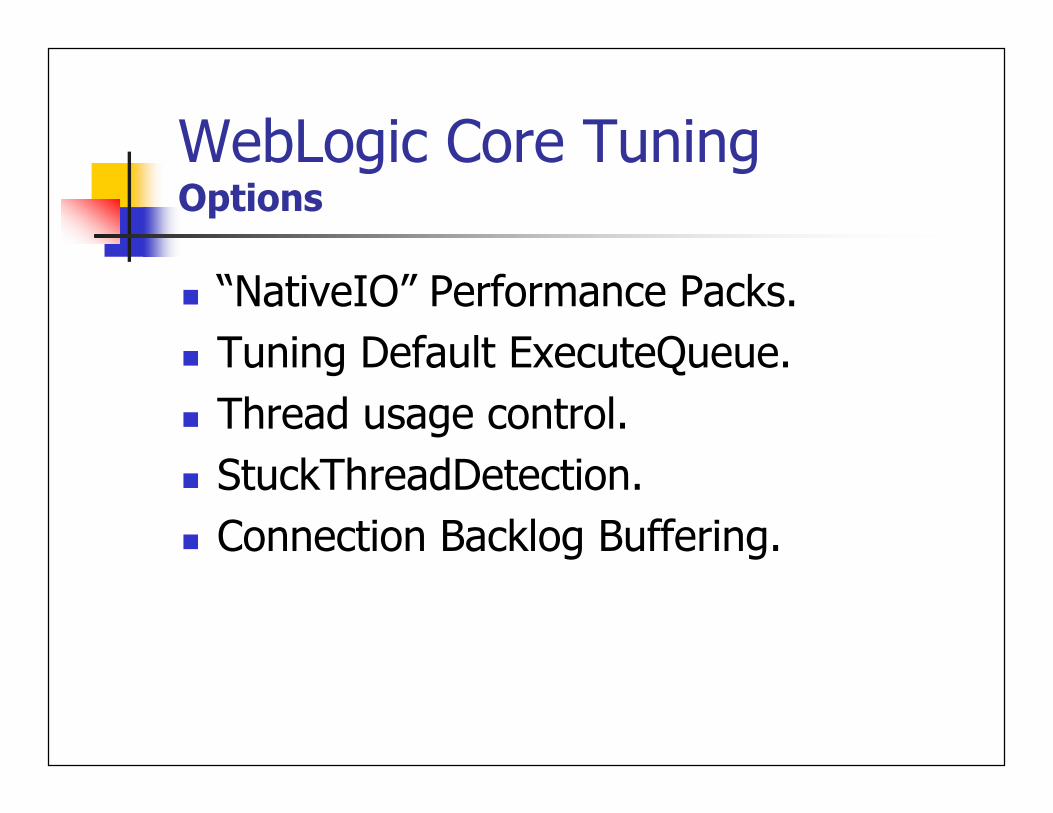
WebLogic Core TuningOptions
� “NativeIO” Performance Packs.
� Tuning Default ExecuteQueue.
� Thread usage control.
� StuckThreadDetection.
� Connection Backlog Buffering.
WebLogic Core TuningPerformance Packs
� Uses a platform-optimized, native socket multiplexor.
� Uses own socket reader threads and frees up weblogic threads.
� Available for most of the Platform � Solaris, Linux, HP-UX, AIX, Win
� Can be configured using WebLogicAdmin Console.
WebLogic Core TuningDefault Execute Thread Tuning
� Number of simultaneous operations that can be performed by applications.� Production Mode Default 25
� Tuning criteria. � Request turn around time.� Number of CPUs
� % Socket Reader Threads (Default 33%).� In 8.1 Execute Queue can be tuned for OverFlow condition� Increases thread count dynamically.
WebLogic Core TuningThread usage Control
� Thread usage can be controlled by creating additional Execute Queues
� Performance Optimization for critical application.
� Throttle the performance
� To protect application from Deadlock
� It can have Negative impact on overall performance
WebLogic Core TuningStuckThreadDetection & Connection Backlog Buffering.
� StuckThread Detection� Detects when execute thread can not complete work or accept new work.
� Warning purpose only, doesn’t change behaviour/state of the thread.
� Stuck Thread Max Time , Stuck Thread Timer Interval
� Connection Backlog Buffering� The number of backlogged TCP connection requests.
WebLogic Core TuningGuidelines
� NativeIO gives better perfromance,� consider Java IO if NativeIO is not stable.
� High number of thread can have negative impact on performance.� More threads does not imply that you can process more work.
� Avoid application designs that require creating new threads.
JDBC Connection Pool TuningOptions
� Connection Pool Sizing and Testing.
� Caching Statements.
� Connection Pool Request Timeouts.
� Recovering Leaked Connection.
� PinnedToThread.
JDBC Connection Pool TuningConnection Pool Sizing and Testing
� Sizing� Initial capacity and Maximum capacity.
� Shrink Frequency.
� Testing� Test Frequency.
� Test Reserved/ Released Connections
� Maximum Connections Made Unavailable
� Test Table Name
JDBC Connection Pool TuningCaching Statements.
� Reuses Callable and Prepared Statements in Cache.
� Reduces CPU usage at Database side and Improve performance.
� Cache Algorithms� LRU (Least Recently Used) � Fixed
� Statement CacheSize� Configured per connection pool.� It cache size for each connection in pool.
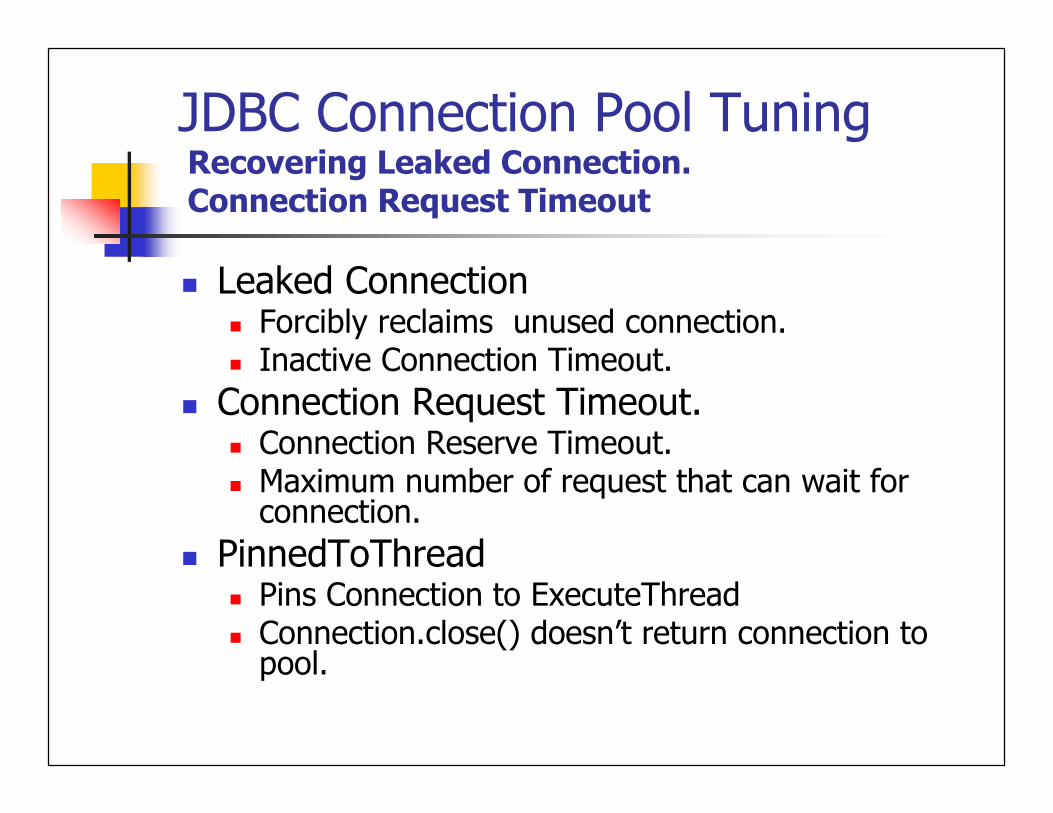
JDBC Connection Pool TuningRecovering Leaked Connection.Connection Request Timeout
� Leaked Connection � Forcibly reclaims unused connection.� Inactive Connection Timeout.
� Connection Request Timeout.� Connection Reserve Timeout.� Maximum number of request that can wait for connection.
� PinnedToThread� Pins Connection to ExecuteThread� Connection.close() doesn’t return connection to pool.
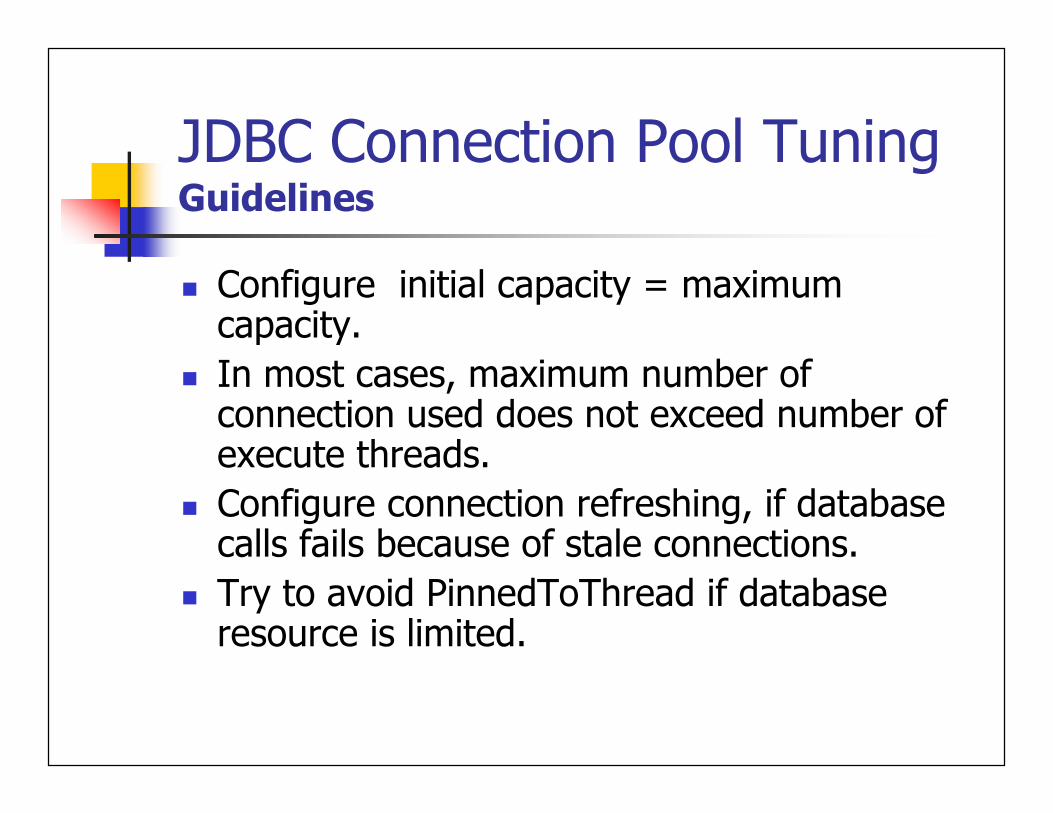
JDBC Connection Pool TuningGuidelines
� Configure initial capacity = maximum capacity.
� In most cases, maximum number of connection used does not exceed number of execute threads.
� Configure connection refreshing, if database calls fails because of stale connections.
� Try to avoid PinnedToThread if database resource is limited.
EJB Tuning
� WebLogic Specific EJB tuning.
� EJB Pool
� EJB Transaction attributes.
� WebLogic CMP Tuning Knobs
� EJB Tuning/Design Guidelines
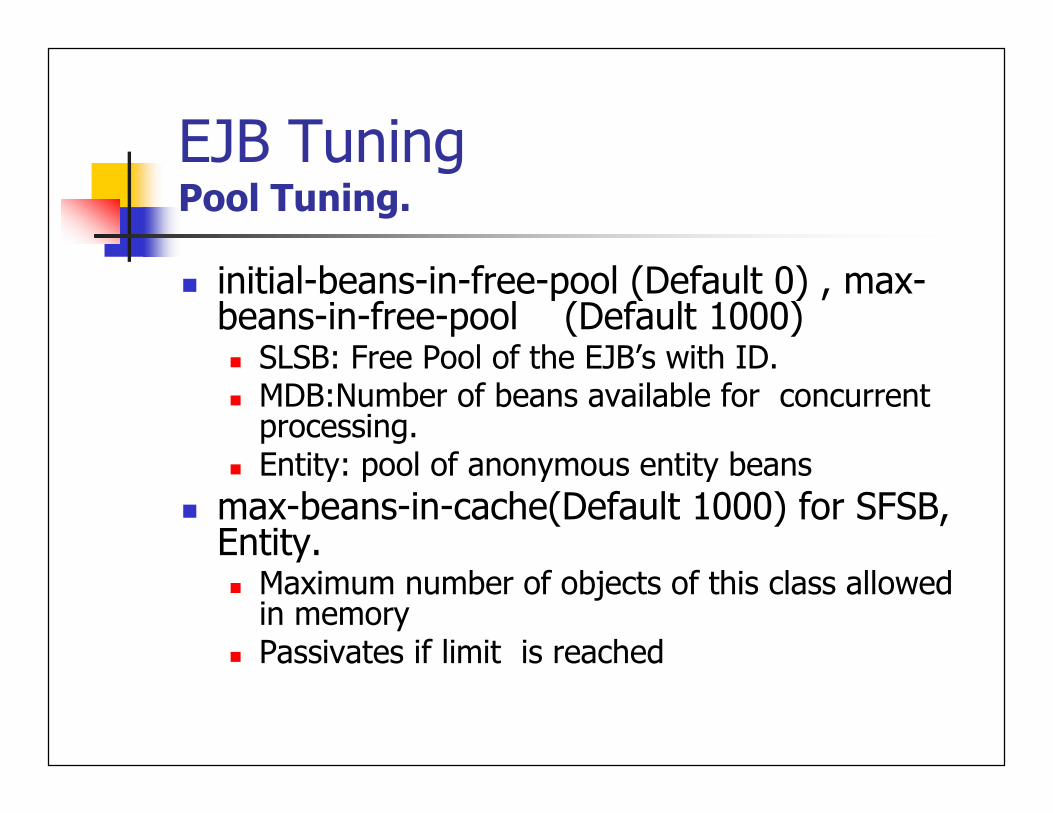
EJB TuningPool Tuning.
� initial-beans-in-free-pool (Default 0) , max-beans-in-free-pool (Default 1000)� SLSB: Free Pool of the EJB’s with ID.� MDB:Number of beans available for concurrent processing.
� Entity: pool of anonymous entity beans
� max-beans-in-cache(Default 1000) for SFSB, Entity.� Maximum number of objects of this class allowed in memory
� Passivates if limit is reached
EJB TuningTransaction AttributesCMP Tuning
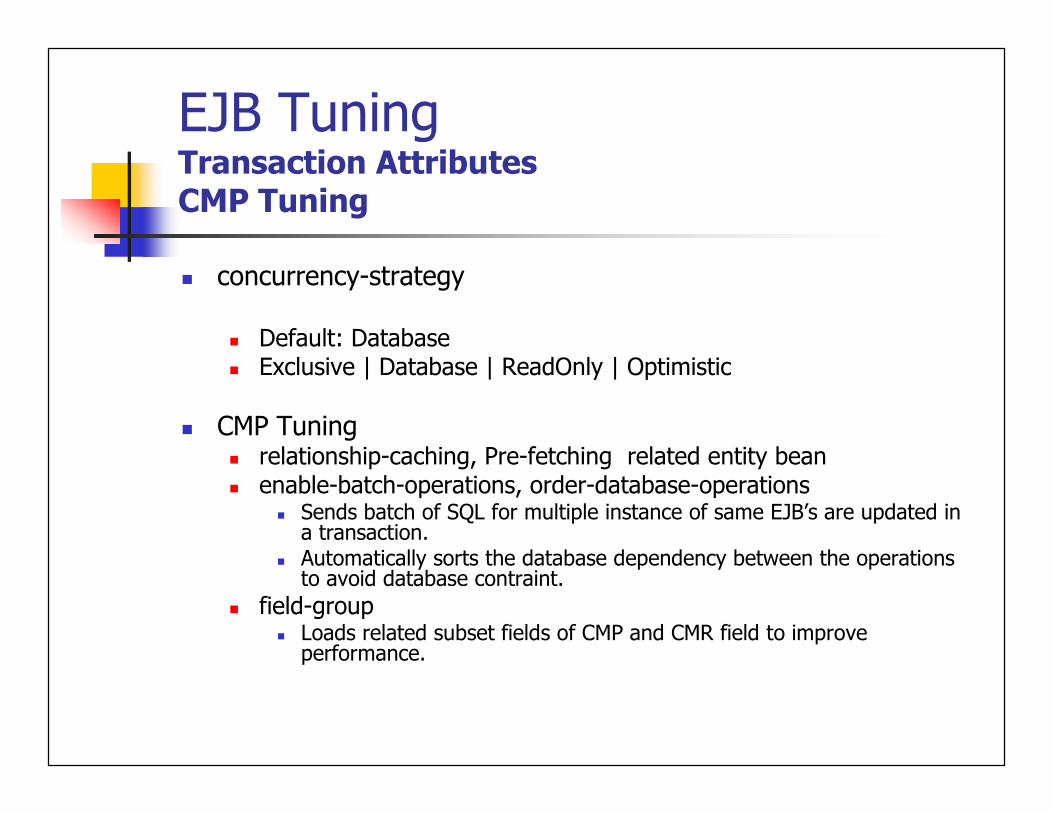
� concurrency-strategy
� Default: Database � Exclusive | Database | ReadOnly | Optimistic
� CMP Tuning� relationship-caching, Pre-fetching related entity bean � enable-batch-operations, order-database-operations
� Sends batch of SQL for multiple instance of same EJB’s are updated in a transaction.
� Automatically sorts the database dependency between the operations to avoid database contraint.
� field-group� Loads related subset fields of CMP and CMR field to improve
performance.
EJB TuningKey Guidelines
� Cache EJB references to avoid JNDI Lookup.
� Start with default cache and pool settings.
� Use Local EJB interface from client within same JVM.
� Try application wide cache for EJB.
JMS Tuning Options
� JMS Persistence Store Tuning. � JMS FileStore� JMS JDBC Store
� Message Paging� Tuning Distributed Destination.
� Message Load Balancing� Server Affinity
� Controlling the Flow of Messages.� Handling Expired Messages.
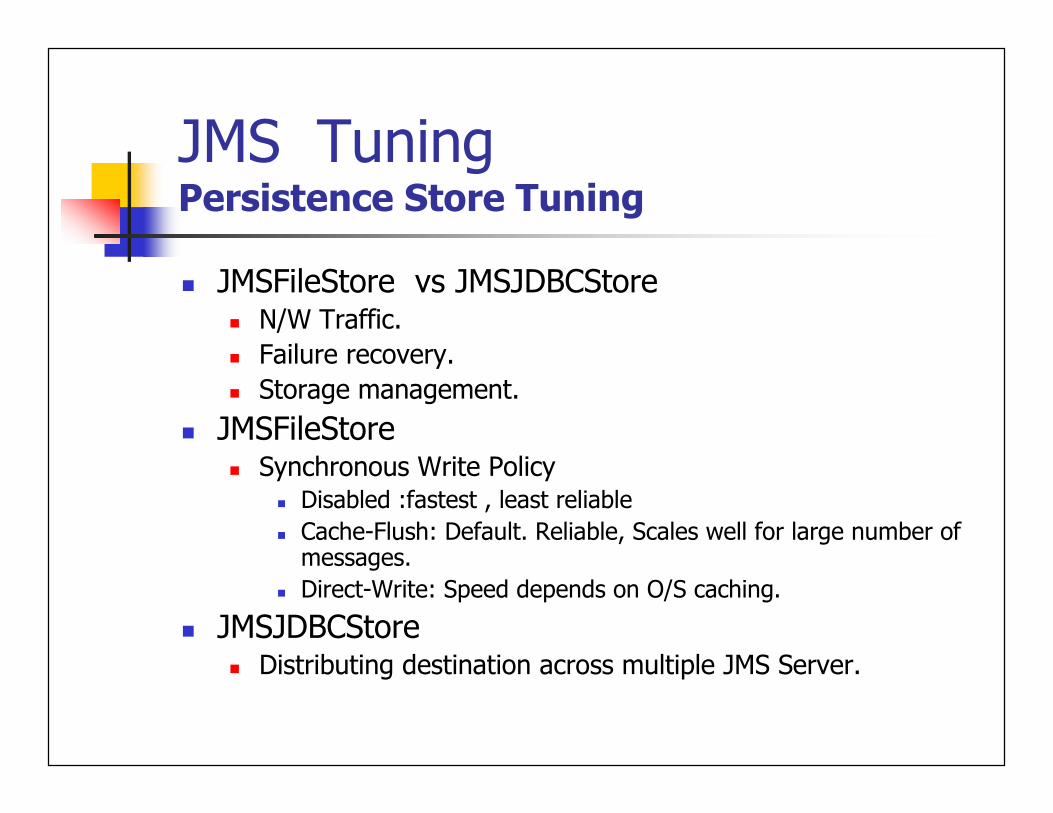
JMS Tuning Persistence Store Tuning
� JMSFileStore vs JMSJDBCStore� N/W Traffic.
� Failure recovery.
� Storage management.
� JMSFileStore� Synchronous Write Policy
� Disabled :fastest , least reliable
� Cache-Flush: Default. Reliable, Scales well for large number of messages.
� Direct-Write: Speed depends on O/S caching.
� JMSJDBCStore� Distributing destination across multiple JMS Server.
JMS Tuning Message PagingTuning Distributed Destination
� Message Paging � Free up virtual memory writing messages to disk.� BytePaging or MessagePaging
� Distributed Destination , is virtual JMS destination with multiple physical destination members.� Load Balancing
� Producer Load balancing. � Message Load balancing.
� Server Affinity, First attempt to load balance across co-located destinations.
JMS TuningControlling the Flow of Messages.Handling Expired Messages.
� Flow Control� Flow control is triggered, When destinations exceeds message threshold.
� Produced will adjust the production rate until destination is unarmed.
� Flow Maximum/Minimum, Flow Interval/Steps� Byte/Message Threshold High/Low
� Handling Expired Messages� Active expiration in 8.1.
� None and Discard, Log, Redirect.� Configurable scan period (Default is 30 seconds).
Servlet/JSP TuningHTTP Session Management.
� Session Manangement criteria.� Concurrent users, How long each session lasts. � Heap size of WebLogic instance, Data need to be stored in
Session.
� Session Persistence.� Memory (single-server, non-replicated) � File system persistence, JDBC persistence � Cookie-based session persistence � In-memory replication (across a cluster)
� Session Attributes.� Session Timeout (Default 3600 seconds).� CacheSize (JDBC and File based persistence)� InvalidationIntervalSecs (Default 60 seconds)
Servlet/JSP TuningGuidelines
� Compile JSP using weblogic.jspc into WEB-INF/classes
� Configure PageCheckSec to -1
� Disable Servlet Reloading
� Put aggregate objects rather than multiple single objects in session.
� Use <%page session=false%> directive to prevent automatic session creation in JSP.
� Invalidate Session no longer needed.
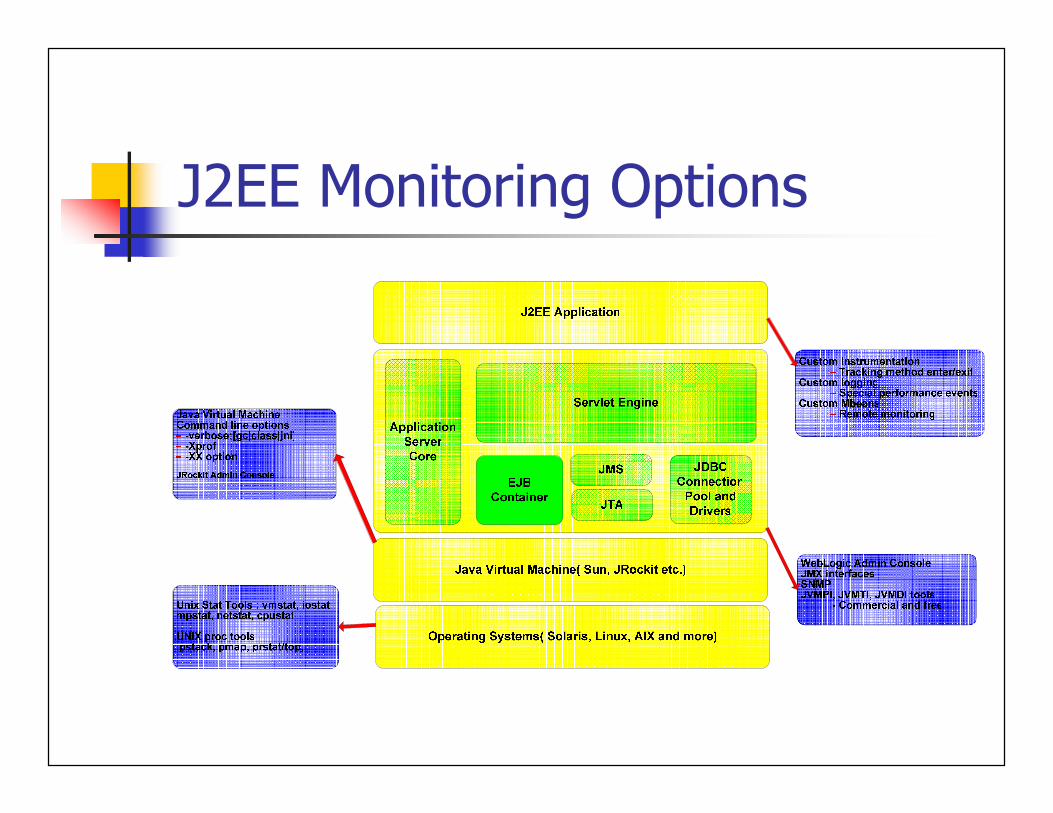
J2EE Monitoring Options
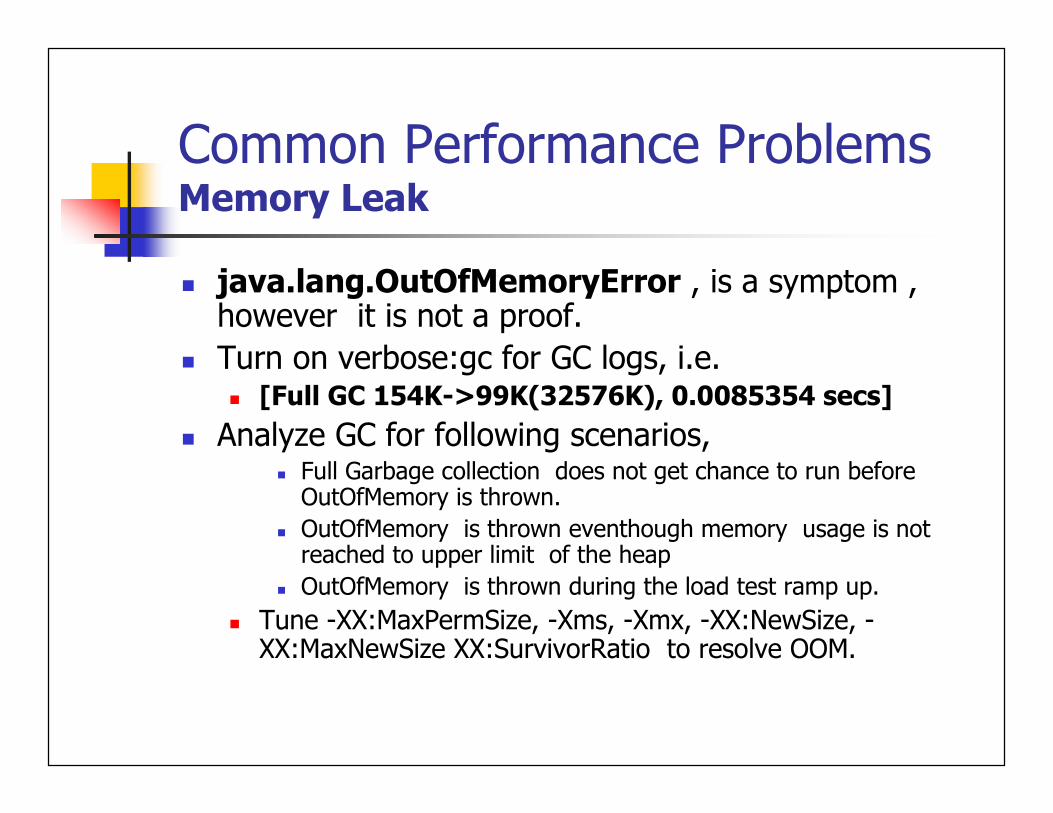
Common Performance ProblemsMemory Leak
� java.lang.OutOfMemoryError , is a symptom , however it is not a proof.
� Turn on verbose:gc for GC logs, i.e.� [Full GC 154K->99K(32576K), 0.0085354 secs]
� Analyze GC for following scenarios, � Full Garbage collection does not get chance to run before OutOfMemory is thrown.
� OutOfMemory is thrown eventhough memory usage is not reached to upper limit of the heap
� OutOfMemory is thrown during the load test ramp up.
� Tune -XX:MaxPermSize, -Xms, -Xmx, -XX:NewSize, -XX:MaxNewSize XX:SurvivorRatio to resolve OOM.
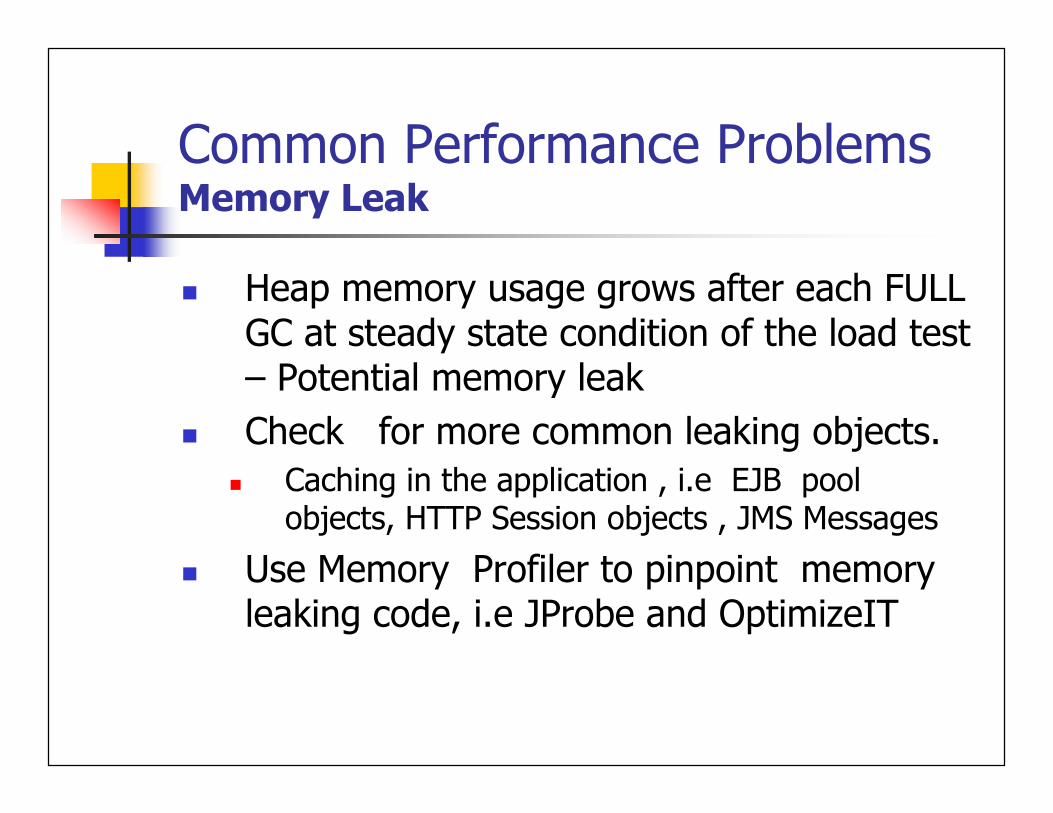
Common Performance ProblemsMemory Leak
� Heap memory usage grows after each FULL GC at steady state condition of the load test – Potential memory leak
� Check for more common leaking objects.
� Caching in the application , i.e EJB pool objects, HTTP Session objects , JMS Messages
� Use Memory Profiler to pinpoint memory leaking code, i.e JProbe and OptimizeIT
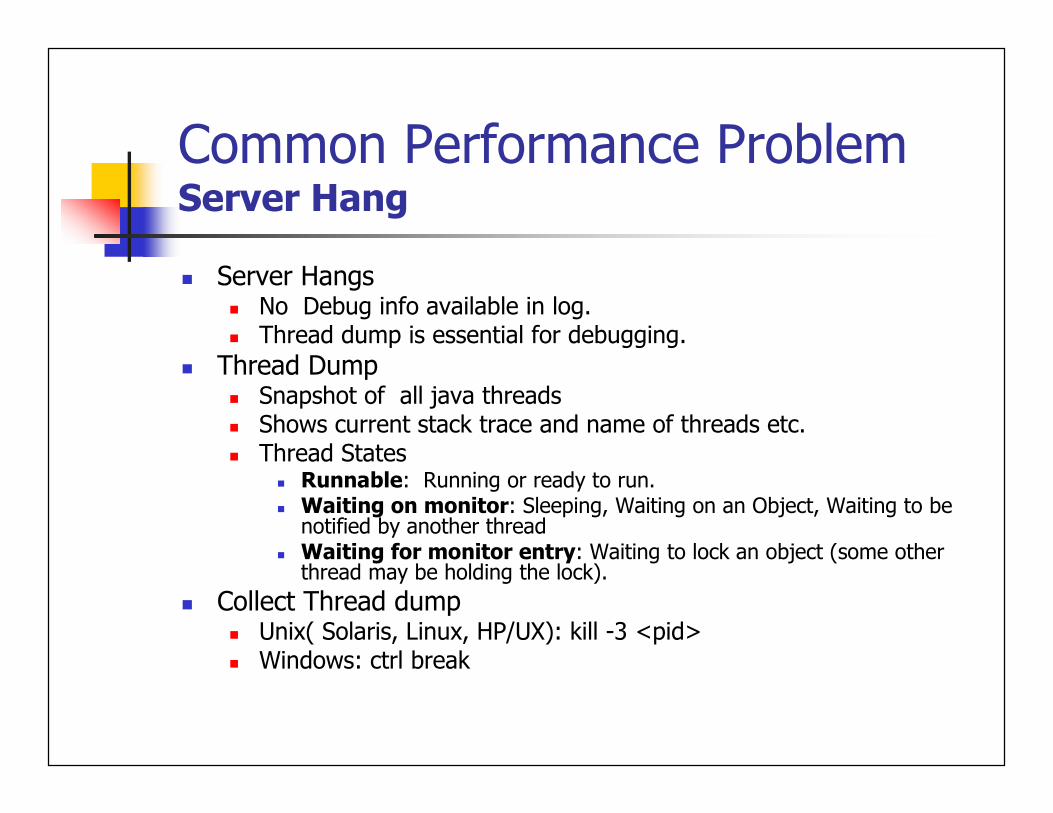
Common Performance Problem Server Hang
� Server Hangs� No Debug info available in log.� Thread dump is essential for debugging.
� Thread Dump� Snapshot of all java threads� Shows current stack trace and name of threads etc.� Thread States
� Runnable: Running or ready to run.� Waiting on monitor: Sleeping, Waiting on an Object, Waiting to be
notified by another thread� Waiting for monitor entry: Waiting to lock an object (some other
thread may be holding the lock).
� Collect Thread dump� Unix( Solaris, Linux, HP/UX): kill -3 <pid>� Windows: ctrl break
Common Performance Problem Server Hang
� Sample Thread Dumps.
� Analyze thread dump for following scenarios.
� Java Deadlock: More than one thread waiting to release the lock.
� Threads blocked during n/w IO: Database or remote process nor responding.
� Infinite Looping in the code.
� Multiple thread dump for with few seconds interval helps to debug slow response time.
Performance Standards and Tools
� Standards� ECPerf
� J2ee Benchmark for Application Servers
� SPECjAppServer2001 � Benchmark to measure Application Server performance
� SPEC JBB2000 � Server side JVM performance benchmark.
� http://www.spec.org/jbb2000/
� Tools� OptimizeIt, JProbe, PerformaSure.
� Mercury LoadRunner, WebLoad, Grinder(OpenSource)


![SHRP 2 Naturalistic Driving Study [Presenter’s Organization] [Presenter’s Name] [Presenter’s Title] Accelerating solutions for highway safety, renewal,](https://img.pdfslide.us/doc/110x75/56649d425503460f94a1e1ae/shrp-2-naturalistic-driving-study-presenters-organization-presenters.jpg)