Embed Size (px)
Citation preview
MALTHUS, MARRIAGE AND MULTIPLICATION
J. W i l l i a m L e a s u r e
This article is a quantitative analysis of the effect on fertility and population growth of postponement of marriage. Malthus advocated a later age at marriage as a check to the growth of population.1 For example, he wrote:
All the immediate checks to population, which have been observed to prevail in the same and different countries, seem to be resolvable into moral restraint, vice and misery; and if our choice be confined to these three, we cannot long hesitate in our decision respecting which it would be most eligible to encourage.2Limitation of births within marriage was regarded by him
as immoral. Hence, moral restraint, by which he meant restraint from an early marriage and complete sexual abstinence prior to marriage, was, to him, the only acceptable method. He classified as vice or misery all other checks to population growth, whether preventive or positive.3
In fact, in spite of his disapproval of sexual relations before marriage, he seemed willing to accept some promiscuity accompanying the postponement of marriage as the lesser of two evils.
419
I should be most extremely sorry to say any thing which could either directly or remotely be construed unfavorably to the cause of virtue: but I certainly cannot think that the vices which relate to the sex, are the only vices which are to be considered in a moral question; or that they are even the greatest and most degrading to the human character. They can rarely or never be committed without producing unhappiness somewhere or other, and therefore ought always to be strongly reprobated; but there are other vices, the effects of which are still more pernicious; and there are other situations, which lead more certainly to moral offences than the refraining from marriage. Powerful as may be the temptations to a breach of chastity, I am inclined to think that they are impotent, in comparison of the temptations arising from continued distress. A large class of women, and many men, I have no doubt, pass a considerable part of their lives in moral restraint; but I believe there will be found very few, who pass through the ordeal of squalid and hopeless poverty, or even of long continued embarrassed circumstances, without a considerable moral degradation of character.4Malthus suggested the ages of 27 or 28 as desirable for mar
riage although he stated that the ideal age depends on the circumstances.5 As a means of achieving this goal, he proposed education:
In an attempt to better the condition of the lower classes of society, our object should be to raise this standard as high as possible, by cultivating a spirit of independence, a decent pride, and a taste for cleanliness and comfort among the poor. These habits would be best inculcated by a system of general education and, when strongly fixed, would be the most powerful means of preventing their marrying with the prospect of being obliged to forfeit such advantages; and would consequently raise them nearer to the middle classes of society.6 The question that arises is the order of magnitude of a
reduction in growth resulting from changes in the pattern of marriage. Such a question is relevant to newly developing economies with high fertility populations. An attempt will be made to answer this subsequently.
420
Method
Later patterns of marriage for females will be analyzed in terms of their estimated effect on the total fertility rate ( TFR), the net reproduction rate (N R R ), the mean length of generation ( T ), and the intrinsic rate of growth ( r) —the rate of growth for a stable population.7
The following conditions are given:1. The population is not practicing birth control.2. A schedule of age-duration-specific-fertility ( ADSF)8
rates which appears reasonable for a non-contraceptive society is used.
3. The ADSF rates are used in conjunction with female marriage patterns for Bolivia in 1950 and Turkey in 1945 for illustrative purposes. These two countries were chosen as examples of a very young marriage pattern (Turkey) and a somewhat older pattern (Bolivia). The marriage rates are changed arbitrarily to conform to the pattern mentioned by Malthus, i.e., an average age at marriage of around 27. The per cent of women still single at age 50 is unchanged for each pattern as the marriage age rises. Thus, only postponement apart from any increase in permanent renunciation of marriage is analyzed for its effect on fertility and growth.
4. The rate of illegitimacy and any change in it resulting from changes in the marriage patterns are not included in the quantitative analysis.
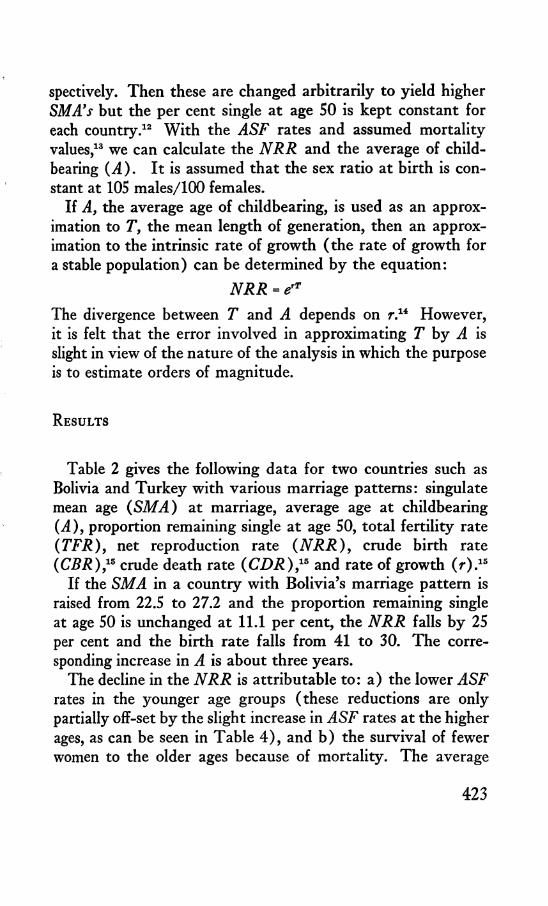
The hypothetical schedule of ADSF rates for five-year age groups and five-year duration groups is presented below. The empirical evidence justifying these rates is given in Appendix I. The postulated rates are partly the result of the analysis of data for Ireland in 1911 and partly the result of the assumption of monotonically decreasing rates by age and duration.
This schedule of fertility gives a total fertility rate of 7.4 with Turkey’s marriage pattern in 1945. The methods by which a TFR is estimated from ADSF rates are the following.
421
As proposed by John Hajnal, the sequence of proportions single recorded in a census is assumed to be the cumulative result of the marital experience by age of a cohort.® Hajnal has called the average at first marriage that he derives from such a schedule the singulate mean age at marriage (See Appendix n ) .
In subsequent analysis, it is further postulated that there is no divorce or widowhood. A linear relationship between age and proportion single is also assumed within each age interval and between each pair of age intervals. Hence, the proportion marrying by age can easily be derived from the proportion single for the adjacent age groups. For example, if 95 per cent are single between the ages of 15 and 19, and 75 per cent are single between the ages of 20 and 24, then 20 per cent marry for the first time at an average age of 20. The central age of the former age group is 17.5 and the latter, 22.5.10
With a schedule of the proportion marrying at each age, it is possible to calculate the age-specific fertility {ASF) rates11 for each five-year age group (See Appendix III for sample calculation). The basis for the calculation is the following equation:
( ADSF) ( ProPorti°n married\' ' \ by duration /
<2 = 0
For a given age group, the ASF rate is the sum of the products of the ADSF rate and proportion married in each duration. The durations range from 0 to the age minus 15, since it is assumed that no one marries under age 15. Hence, assumed marriage patterns can be changed and the corresponding ASF rates and TFR’s can be calculated from a given schedule of ADSF rates and the distribution of women by duration of marriage.
The singulate mean age (SM A) at marriage is used as the index of the marriage pattern. In our case, we start with marriage patterns for Bolivia and Turkey in 1950 and 1945 re
422
spectively. Then these are changed arbitrarily to yield higher SMA’s but the per cent single at age 50 is kept constant for each country.12 With the ASF rates and assumed mortality values,13 we can calculate the NRR and the average of childbearing (.4). It is assumed that the sex ratio at birth is constant at 105 males/100 females.
If A, the average age of childbearing, is used as an approximation to T, the mean length of generation, then an approximation to the intrinsic rate of growth (the rate of growth for a stable population) can be determined by the equation:
NRR = erTThe divergence between T and A depends on r.1* However, it is felt that the error involved in approximating T by A is slight in view of the nature of the analysis in which the purpose is to estimate orders of magnitude.
R e s u l t s
Table 2 gives the following data for two countries such as Bolivia and Turkey with various marriage patterns: singulate mean age (SMA) at marriage, average age at childbearing (A ), proportion remaining single at age 50, total fertility rate ( TFR), net reproduction rate (NRR) , crude birth rate (CBR),15 crude death rate (C D R ),15 and rate of growth (r ) .15
If the SMA in a country with Bolivia’s marriage pattern is raised from 22.5 to 27.2 and the proportion remaining single at age 50 is unchanged at 11.1 per cent, the NRR falls by 25 per cent and the birth rate falls from 41 to 30. The corresponding increase in A is about three years.
The decline in the NRR is attributable to: a) the lower ASF rates in the younger age groups (these reductions are only partially off-set by the slight increase in ASF rates at the higher ages, as can be seen in Table 4 ), and b) the survival of fewer women to the older ages because of mortality. The average
423
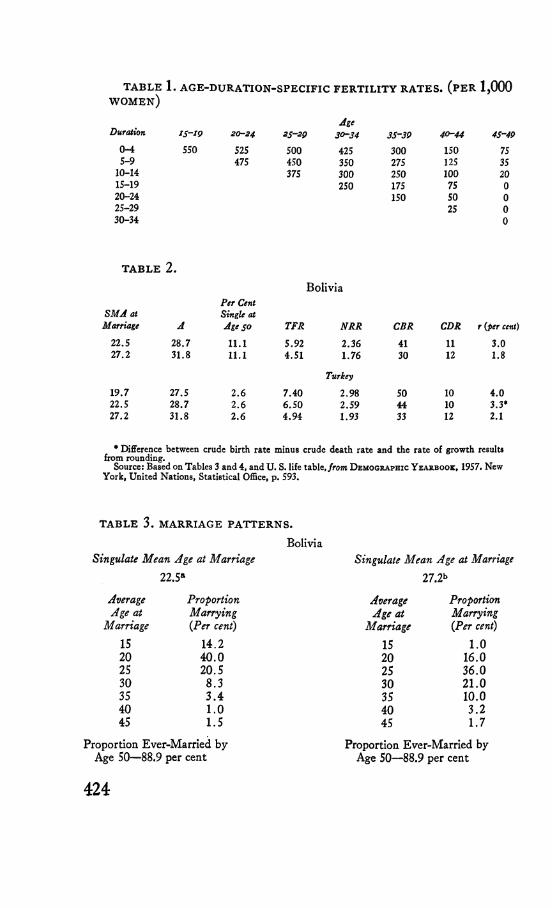
TABLE 1. AGE-DURATION-SPECIFIC FERTILITY RATES. (PER 1,000 w o m e n )
DurationA ge
1 5 -1 9 2 0 -2 4 2 5 -2 9 3 0 -3 4 3 5 -3 9 4 0 -4 4 4 5 -4 9
0 - 4 5 5 0 525 5 0 0 425 3 0 0 1 50 755 - 9 475 4 5 0 3 5 0 275 125 35
1 0 -1 4 375 3 0 0 2 5 0 1 0 0 201 5 -1 9 2 5 0 175 75 02 0 - 2 4 1 50 5 0 02 5 -2 9 25 03 0 - 3 4 0
TABLE 2.Bolivia
S M A at M arriage A
P er Cent Single at A ge 5 0 T F R N R R C B R C D R r Cper cent)
2 2 .5 2 8 .7 1 1 .1 5 .9 2 2 .3 6 41 11 3 .02 7 .2 3 1 .8 1 1 .1 4 .5 1 1 .7 6 3 0 12 1 .8
1 9 .7 2 7 .5 2 .6 7 .4 0
Turkey
2 .9 8 5 0 10 4 .02 2 .5 2 8 .7 2 . 6 6 .5 0 2 .5 9 4 4 10 3 .3 *2 7 .2 3 1 .8 2 .6 4 .9 4 1 .9 3 33 12 2 .1
• Difference between crude birth rate minus crude death rate and the rate of growth results from rounding.
Source: Based on Tables 3 and 4 , and U . S. life table, from D e m o g r a p h ic Y e a r b o o k , 1957. New York, United Nations, Statistical Office, p. 593.
TABLE 3. MARRIAGE PATTERNS.Bolivia
Singulate Mean Age at Marriage
22.5a
Average ProportionAge at Marrying
Marriage {Per cent)IS 14.22 0 40.025 20.530 8.335 3.440 1 . 0
45 1.5
Proportion Ever-Married by Age 50—88.9 per cent
Singulate Mean Age at Marriage
27.2b
Average ProportionAge at Marrying
Marriage {Per cent)
15 1 . 0
2 0 16.025 36.030 2 1 . 0
35 1 0 . 0
40 3.245 1.7
Proportion Ever-Married by Age 50—88.9 per cent
424
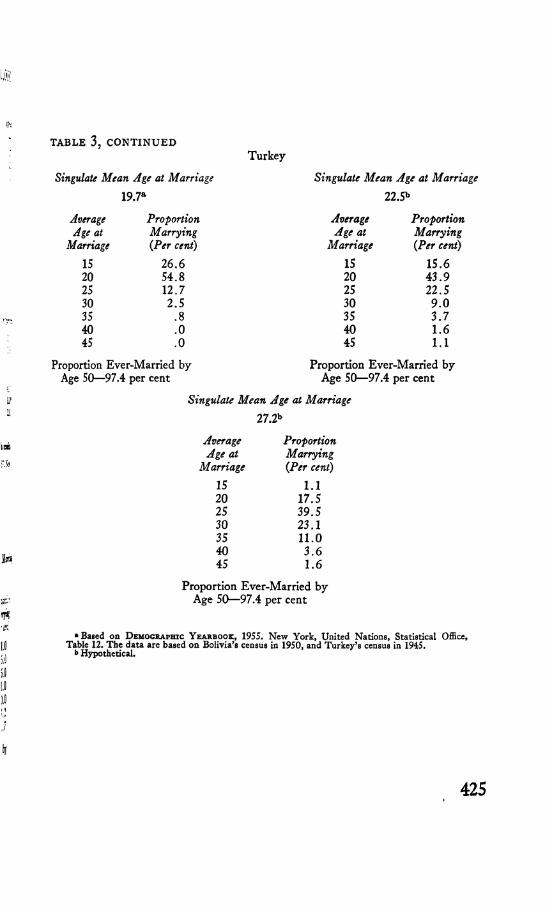
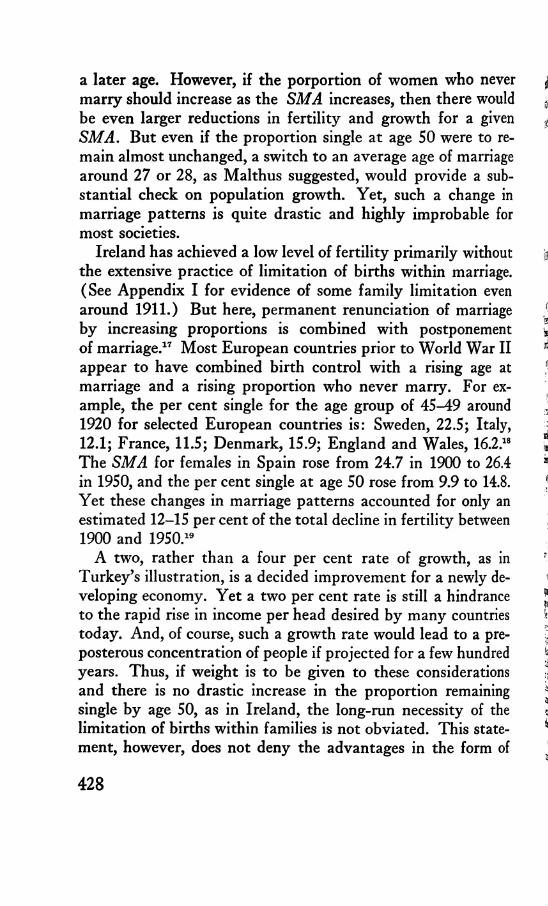
TABLE 3, C O N T IN U E DTurkey
Singulate Mean Age at Marriage Singulate Mean Age at Marriage
19.7a 22.5b
Average ProportionAge at Marrying
Marriage (Per cent)
15 26.620 54.825 12.730 2.535 .840 .045 .0
Proportion Ever-Married by Age 50—97.4 per cent
Average ProportionAge at Marrying
Marriage (Per cent)15 15.620 43.925 22.530 9.035 3.740 1.645 1.1
Proportion Ever-Married by Age 50— 97.4 per cent
Singulate Mean Age at Marriage
27.2b
Average ProportionAge at Marrying
Marriage (Per cent)15 1.120 17.525 39.530 23.135 11.040 3.645 1.6
Proportion Ever-Married by Age 50—97.4 per cent
•Based on D emographic Y earbook , 1955. New York, United Nations, Statistical Office, Table 12. The data are based on Bolivia’s census in 1950, and Turkey’s census in 1945.
b Hypothetical.

age of childbearing is about three years older; hence, fewer women are left to have children. ASF rates are lower at the younger ages because the proportion married in these age groups is substantially reduced. In the older age groups, when the proportion married approaches the former level, the J4S’F rates are higher. This occurs because there has been an increase in the proportion of women in the shorter durations of marriage as a result of the older marriage pattern. Given the age, ADSF rates generally are higher for lower durations.
The decline in r from 3.0 to 1.8 per cent is attributable to the reduction in the NRR and to the increase in T as approximated by A (NRR = e'7). If A had not changed, the r would be 2.0 instead of 1.8 per cent for a SMA of 27.2. As A is increased, the births are dispersed over a longer period. This effect reduces the annual rate of growth even though the NRR should remain the same.16
If Turkey’s SMA changed from 19.7 to 27.2, then the NRR would fall by 35 per cent and the birth rate falls from 50 to 33. The increase in A is about four years. These changes in the NRR and r are quite substantial but we are assuming a very drastic change in marriage patterns here as well as for Bolivia. A more plausible shift in the SMA from 19.7 to 22.5 reduces the NRR by 13 per cent. The absolute change in r is .7 per cent and the birth rate falls from 50 to 44.
Table 3 gives the proportion marrying by age and the SMA at marriage for each marriage pattern used in the above analysis. Table 4 presents the corresponding ASF rates.
C o n c l u s i o n
The results of this analysis indicate large reductions in fertility and growth for a change from an SMA of around 20-22 to an SMA of 27. The reduction in the growth rate would not be so large if illegitimacy rates were included in the analysis and, particularly, if these should increase as women marry at
426

TABLE 4. AGE-SPECIFIC FERTILITY RATES. (PER 1,000 WOMEN)
Bolivia
Singulate Mean Age at Marriage22.5 27.2
Age-Specific Fertility RatesAge
15-19 78 6
20-24 278 8925-29 336 25630-34 263 26635-39 176 20740-44 53 7445-49 2 4
Turkey
Singulate Mean Age at Marriage19.7 22.5 27.2
Age-Specific Fertility RatesAge
15-19 46 8 6 6
20-24 414 305 9725-29 410 369 28030-34 286 288 29235-39 177 192 22840-44 47 59 8145-49 0 2 S
Source: Based on Tables 1 and 3.
42 7
a later age. However, if the porportion of women who never marry should increase as the SMA increases, then there would be even larger reductions in fertility and growth for a given SMA. But even if the proportion single at age 50 were to remain almost unchanged, a switch to an average age of marriage around 27 or 28, as Malthus suggested, would provide a substantial check on population growth. Yet, such a change in marriage patterns is quite drastic and highly improbable for most societies.
Ireland has achieved a low level of fertility primarily without the extensive practice of limitation of births within marriage. (See Appendix I for evidence of some family limitation even around 1911.) But here, permanent renunciation of marriage by increasing proportions is combined with postponement of marriage.17 Most European countries prior to World War II appear to have combined birth control with a rising age at marriage and a rising proportion who never marry. For example, the per cent single for the age group of 45-49 around 1920 for selected European countries is: Sweden, 22.5; Italy, 12.1; France, 11.5; Denmark, 15.9; England and Wales, 16.2.18 The SMA for females in Spain rose from 24.7 in 1900 to 26.4 in 1950, and the per cent single at age 50 rose from 9.9 to 14.8. Yet these changes in marriage patterns accounted for only an estimated 12-15 per cent of the total decline in fertility between 1900 and 1950.19
A two, rather than a four per cent rate of growth, as in Turkey’s illustration, is a decided improvement for a newly developing economy. Yet a two per cent rate is still a hindrance to the rapid rise in income per head desired by many countries today. And, of course, such a growth rate would lead to a preposterous concentration of people if projected for a few hundred years. Thus, if weight is to be given to these considerations and there is no drastic increase in the proportion remaining single by age 50, as in Ireland, the long-run necessity of the limitation of births within families is not obviated. This statement, however, does not deny the advantages in the form of
428
reduced growth accruing from postponement of marriage even when the change in the marriage pattern is more plausible than one resulting in an average age of marriage of 27.
References
1The interpretation of Malthus’ writings varies. See Eversley, D. E. C.: Social Theories of Fertility and the M althusian D ebate. Oxford, Oxford University Press, 1959, Ch. IX ; also Smith, Kenneth: T he M althusian Controversy. London, Routledge & Kegan Paul, 1951, pp. 42, 43, 250, and 251.
2 Malthus, Thomas R .: An E ssay on Population. London, J. M. Dent & Sons, Ltd., 1927 [Everyman’s Library Edition], Vol. II, p. 151.
3 Malthus distinguished between moral and prudential restraint. By prudential restraint he meant postponement of marriage apart from any consequences such as an increase in pre-marital relations. However, it appears that sometimes he used moral restraint to include both ethical or unethical behavior prior to marriage. Also, it seems that Malthus initially may have classified postponement of marriage as misery. (Such a judgment is relative).
4Malthus, Thomas R.: An E ssay on the Principle of Population. London, 1803 (2 nd Edition), p. 512.
5 ------------- : An E ssay on Population. [Everyman’s Library Edition], Vol.II, p. i63.
6 ------------------ ; A n E ssay on the Principle of Population, (2nd Edition), p.557.
7 Total fertility rate ( TFR) is the average number of children bom per woman upon completion of the childbearing years without mortality. It is based on a given age schedule of fertility.Net reproduction rate (NRR ) is the average number of girls born to a cohort of women subject to a given age schedule of mortality and fertility. It gives the number of girls bom to replace a woman from the previous generation.Mean length of generation ( T) is the number of years of growth required for a stable population so that the ratio of the population at time = T to the population at time = 0 is equal to the net reproduction rate, i.e., NRR = erT'.The combination of a fixed schedule of fertility and mortality at each age in a population without migration, if continued, will eventually generate a constant birth rate, death rate, growth rate, and a fixed (stable) age distribution. These rates are referred to as intrinsic rates and the population is regarded as stable.
8 Age-duration-specific fertility rates give the number of annual births per 1 , 0 0 0
married women by age and duration of marriage.
429
9 Hajnal, John: Age at Marriage and Proportions Marrying, Population Studiesf November, 1953, VII, 2: 111-136.If no woman marries before age 15, then a constant schedule of marriage rates for first marriages for a period of 35 years will result in the same schedule of proportions single for censal data up to age 50 as for a cohort as it passes through time.
10 For the earlier years, a linear relationship is not closely approximated by the actual patterns. Also, the proportion married in the age group of 15-19 does not marry at age 15 as the above method indicates. However, the errors in the younger age groups will be somewhat offset by compensatory errors in the higher age groups. These factors are analyzed in detail in Appendix II.
11 Age-specific fertility rates give the number of annual births per 1,000 women by age, regardless of marital status.
12 It should be noted that the marriage patterns the writer has selected in order to get a given SMA are not unique for that SMA. For example, all women who marry before age 50 could marry at age 25 for an SMA of 25. Also, some coud marry earlier and some later in a myriad of patterns and the SMA would remain constant at 25. The patterns chosen are based on the criterion of plausibility.
13 In all the calculations, the life table used is one for the United States, female, white and Negro, 1919-1921. The Iso for this life table is 81,463, a level within the reach of the newly developing countries today. (See D emographic Y earbook, 1957. New York, United Nations Statistical Office. P. 593.)
14 See Coale, Ansley J.: A New Method for Calculating Lotka’s r—The Intrinsic Rate of Growth in a Stable Population. Population Studies, July, 1957, X I, 1. Prof. Coale writes: “ If r is as great as 3 per cent, T and A will differ by about 0.6 years.”
15 These are intrinsic rates, i.e., the constant rates for a stable population. The crude birth and crude death rates refer to females and are similar to rates for males and females combined, i.e., the entire population. Crude rates are based on a population of 1 ,0 0 0 , e.g., 41 annual births per 1 , 0 0 0 families as shown in Table 2 .
16 For an analysis of the effects of a change in T when the GRR remains unchanged in the long-run, see Coale, Ansley J. and Tye, C. Y .: The Significance of Age-Patterns of Fertility in High Fertility Populations, Milbank Memorial Fund Quarterly, October, 1961, X X X IX , 4: 631-646.
17 Per cent single for the age group of 45-49 in Ireland in 1941 was 26 and the SMA was 27.4 (See Hajnal, John: op, cit.) The crude birth rate for 1940-44 was 20.9. See D emographic Y earbook, 1949. New York, United Nations, Statistical Office. Table 9.
1 8 Leasure, J. William: “ Factors Involved in the Decline of Fertility in Spain, 1900-1950.” [Unpublished Ph.D. dissertation, Department of Economics, Princeton University, May 1962.] Appendix I, Table I. 19
19 Ibid,, Chapter I.
430
Appendices
I.The author initially planned to use age-duration-specific fertility
(ADSF) rates derived from censal data for Ireland, in 1911, on the number of children ever born to married women by age and duration of marriage. The data give the past childbearing performance for cohorts of different ages and durations in 1911. It was suspected that contraceptive practices prior to 1911 in Ireland were quite limited. However, upon examination of the data, one cannot justify such an assumption.
The analysis of the data on Ireland and the method used are the following. Under the assumption that fertility had been unchanged for cohorts in Ireland prior to 1911, the data on children ever born by age and duration of marriage could be used to estimate ADSF rates for a non-contraceptive society. The method involves subtraction of the number of children ever born for two consecutive five-year age groups in order to derive the average number of births by age of mother and duration of marriage for five-year groups. It is assumed here that data for various cohorts represent the performance of a single cohort as it passes through life.
For example, the number of children ever born for the age group, 20-24, with durations of 5-9 years is subtracted from the number for age group, 25-29, with durations of 10-14 years. The result, when divided by five, gives the number of births per 1,000 married women between the average ages of 22.5 and 27.5 with average durations of7.5 to 12.5 years. The figures can then be averaged with the corresponding figure for the next higher age and duration group, i.e., ages27.5 to 32.5 with durations of 12.5 to 17.5 years to estimate the rates for the age group, 25-29, with durations of 10-14 years. The latter age and duration groups are useful for purposes of calculation in conjunction with marriage patterns for corresponding five-year age groups.
However, it appears that fertility had not been constant prior to 1911. Older women who had completed their childbearing years had higher fertility than younger women who had also completed their childbearing years. For example, the number of children ever born
431

per woman marrying between the ages of 25 and 29 and aged 45-49 in 1911 is 5.77. For women aged 55-59 who also married in the age group 25-29, the comparable figure is 6.68.1
The ADSF rates derived in the manner described above are given in Table A.
This schedule of fertility, when combined with proportions married by age and duration according to Bolivia’s marriage pattern in 1950, gives an average age of childbearing of 30.6. This figure appears quite high since the singulate mean age at marriage for Bolivia is 22.5. The average age of childbearing tends to be around 29 unless a very late or very early marriage pattern prevails.
In view of the above analysis, these ADSF rates were arbitrarily adjusted, i.e., raised at the lower ages and durations and reduced at the higher ages and durations. Such an adjustment tends to offset the trend noted in reported data for Ireland, 1911, i.e., that restriction of family size, although limited, was being adopted by the women in the years just prior to 1911. The hypothetical rates finally used in this analysis are based on the adjusted Irish data and the assumption that the rates decline monotonically with age and duration.
The hypothetical schedule of fertility gives an average age of childbearing of 28.7 vis-a-vis 30.6, as noted above, when combined with the same marriage pattern. The former figure appears more plausible for a singulate mean age at marriage of 22.5. It is interesting to note that the net reproduction rates for the adjusted and unadjused rates are 2.30 and 2.36 respectively. The distortion appears, however, in estimating the intrinsic rate of growth where the average age of childbearing is used to approximate the mean length of generation ( T) in the equation: NRR = erT.
The highest rate used is 550 for ages 15-19, and durations 0-4 years. In Japan for 1951, the rate of first births for married women of ages 15-49 with durations of 0-4 years is 584.2
In summary, the pattern and range of the postulated rates appears to be justified. II.
II.The SMA at marriage is an index of the average age at marriage
for first marriages. It is derived from a censal schedule of proportions
432
single which is assumed to represent a cohort without mortality. The SMA is derived from the total number of years lived in the single state by the women who marry up to age 50. In the analysis presented here, the data on per cent single are used to derive marriage patterns. The difference in the proportion single for adjacent age groups is the proportion marrying at the border year. Since a linear relationship between per cent single and age is assumed within each age group and between each pair of age groups, the proportion marrying between the age groups of 10-14 and 15-19 marries at an average age of 15: Obviously, this estimate does not approximate reality because the relationship is not linear in the younger ages. In the age group 15-19, for example, probably more women marry after age 17.5 than before that age, and probably very few marry under age 15.
The average age at marriage for first marriages will be identical whether based on the proportions single as in the SMA at marriage, or on the proportions marrying by age as derived from proportions single if the latter operation is done correctly. Hence, if it is more realistic to assume that in the younger age groups referred to previously, women marry on the average at age 18 and not age 15, then in the higher age groups we must make an adjustment in the opposite direction. It can be inferred that at the higher ages the marriage pattern is also not linear. For example, those who marry between the age groups of 35-39 and 40-44 might marry on the average at age 39 and not 40. Adjustments in both tails of the age distribution would be necessary in order to arrive at an SMA based on proportions marrying by age which is the same SMA as the one based on proportions single. Thus, when border years are assumed for all age groups, as is done in this analysis, there will be a tendency for the error at the younger ages to be offset by the error at the higher ages, although the compensatory errors need not be of equal magnitude. III.
III.The ASF rates are calculated from a schedule of ADSF rates and a
distribution of women by duration of marriage for each age group. In the example that follows, the figures outside the parentheses are the ADSF rates, and the figures inside the parentheses are the corresponding proportions married by duration given in per cent. Both are
433
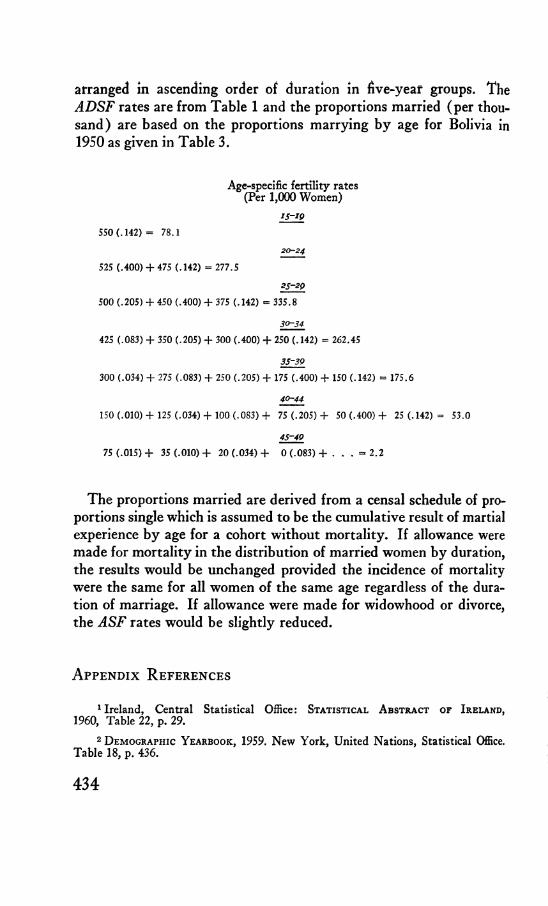
arranged in ascending order of duration in five-yeaf groups. The ADSF rates are from Table 1 and the proportions married (per thousand) are based on the proportions marrying by age for Bolivia in 1950 as given in Table 3.
Age-specific fertility rates (Per 1,000 Women)
15-19
550 (.142)= 78.120-24
525 (.400) + 475 (.142) = 277.5
25-29
500 (.205) + 450 (.400) + 375 (.142) = 335.8
3Q-34
425 (.083) + 350 (.205) + 300 (.400) + 250 (.142) = 262.45
35-39
300 (.034) + 275 (.083) + 250 (.205) + 175 (.400) + 150 (.142) = 175.6
4Q-44
150 (.010)+ 125 (.034)+ 100 (.083 )+ 75 (.205 )+ 50 (.400) + 25 (.142) = 53.0
45-49
75 (.015 )+ 35 (.010)+ 20 (.034 )+ 0 (.083) + . . . = 2.2
The proportions married are derived from a censal schedule of proportions single which is assumed to be the cumulative result of martial experience by age for a cohort without mortality. If allowance were made for mortality in the distribution of married women by duration, the results would be unchanged provided the incidence of mortality were the same for all women of the same age regardless of the duration of marriage. If allowance were made for widowhood or divorce, the ASF rates would be slightly reduced.
A p p e n d i x R e f e r e n c e s
1 Ireland, Central Statistical Office: Statistical A bstract o r Ireland, 1960, Table 22, p. 29.
2 D e m o g r a p h i c Y e a r b o o k , 1959. New York, United Nations, Statistical Office. Table 18, p. 436.
434
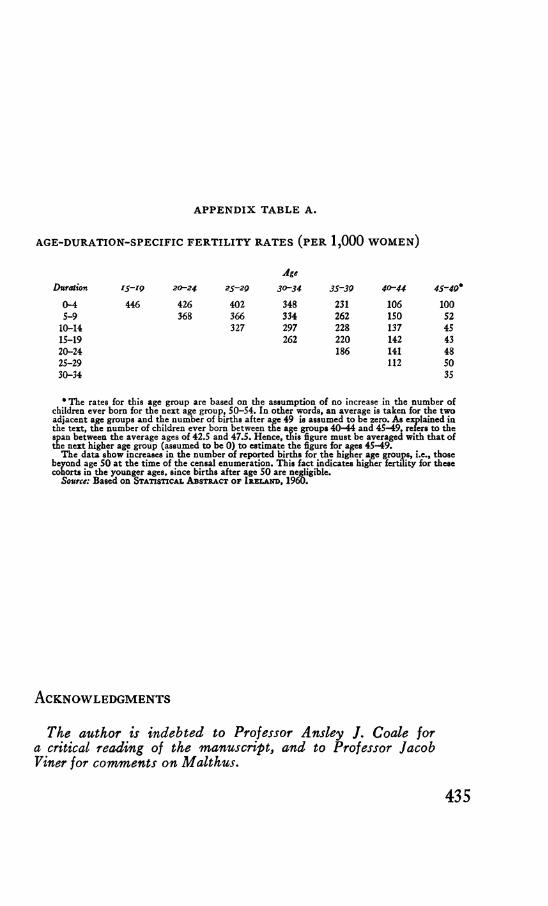
A P P E N D IX T A B L E A .
AGE-DURATION-SPECIFIC FE R T IL IT Y RATES (P E R 1,000 W O M EN )
AgeDuration 15-19 20 -2 4 2 5 -2 9 30-34 35-39 40-44 45-49*
0-4 446 426 402 348 231 106 1 0 05-9 368 366 334 262 150 52
10-14 327 297 228 137 4515-19 262 2 2 0 142 4320-24 186 141 4825-29 1 12 5030-34 35
* The rates for this age group are based on the assumption of no increase in the number of children ever bora for the next age group, 50-54. In other words, an average is taken for the two adjacent age groups and the number of births after age 49 is assumed to be zero. As explained in the text, the number of children ever born between the age groups 40-44 and 45-49, refers to the span between the average ages of 42.5 and 47.5. Hence, this figure must be averaged with that of the next higher age group (assumed to be 0) to estimate the figure for ages 45-49.
The data show increases in the number of reported births for the higher age groups, i.e., those beyond age 50 at the time of the censal enumeration. This fact indicates higher fertility for these cohorts in the younger ages, since births after age 50 are negligible.
Source: Based on Statistical A bstract of Ireland, 1960.
Acknowledgments
The author is indebted to Professor Ansley J. Coale for a critical reading of the manuscript, and to Professor Jacob Viner for comments on Malthus.
435